Article

Quantifying Lodging Percentage and Lodging Severity Using a UAV-Based Canopy Height Model Combined with an Objective Threshold Approach

1
Institute of Bio- and Geosciences, Plant Sciences (IBG-2), Forschungszentrum Jülich GmbH, 52428 Jülich, Germany
2
Department of Geodesy, University of Bonn, 53115 Bonn, Germany
3
JB Hyperspectral Devices UG, 40225 Düsseldorf, Germany
4
Field Lab Campus Klein, Altendorf, University of Bonn, 53359 Rheinbach, Germany
*
Author to whom correspondence should be addressed.
Remote Sens. 2019, 11(5), 515; https://doi.org/10.3390/rs11050515
Submission received: 31 January 2019 / Revised: 26 February 2019 / Accepted: 27 February 2019 / Published: 3 March 2019

Abstract

:
Unmanned aerial vehicles (UAVs) open new opportunities in precision agriculture and phenotyping because of their flexibility and low cost. In this study, the potential of UAV imagery was evaluated to quantify lodging percentage and lodging severity of barley using structure from motion (SfM) techniques. Traditionally, lodging quantification is based on time-consuming manual field observations. Our UAV-based approach makes use of a quantitative threshold to determine lodging percentage in a first step. The derived lodging estimates showed a very high correlation to reference data (R2 = 0.96, root mean square error (RMSE) = 7.66%) when applied to breeding trials, which could also be confirmed under realistic farming conditions. As a second step, an approach was developed that allows the assessment of lodging severity, information that is important to estimate yield impairment, which also takes the intensity of lodging events into account. Both parameters were tested on three ground sample distances. The lowest spatial resolution acquired from the highest flight altitude (100 m) still led to high accuracy, which increases the practicability of the method for large areas. Our new lodging assessment procedure can be used for insurance applications, precision farming, and selecting for genetic lines with greater lodging resistance in breeding research.

Graphical Abstract

1. Introduction

The rapid development of sensor technology and data processing contributes to increasing digitalization in agriculture [1,2]. The use of unmanned aerial vehicles (UAVs) can help to advance and accelerate this process, particularly for field phenotyping and precision agriculture [3,4,5]. Due to the low cost, simple handling, and high flexibility of UAVs [6], UAV technology has been increasingly applied in different areas in recent years [7,8,9,10]. In comparison to satellite and airborne systems, UAVs allow acquisition of image data with high spatial resolution, which is a basic requirement for deriving the three-dimensional (3D) canopy structure of crops using feature matching and structure from motion (SfM) techniques [11,12,13].
To derive the canopy height (CH) from the canopy structure, a nonvegetated ground model is needed. This ground model represents the topsoil surface, which is usually acquired by a UAV overflight shortly after sowing or harvest, when agricultural fields are free of vegetation [14,15]. This kind of information can also be provided by digital terrain models (DTMs) derived from airborne light detection and ranging (LIDAR) data. Different studies have already examined the quality and accuracy of LIDAR DTMs [16,17,18,19]. The potential of this data source as an alternative ground model for CH retrieval, however, has not yet been evaluated.
The UAV CH has been investigated in several studies in recent years [20,21,22]. Noninvasive measurement of CH, multitemporal growth curves [23,24], and biomass development [25,26] at different phenological stages is a major requirement for precision agriculture. Crop vitality, fertilizer status, soil quality, and water availability influence the aforementioned plant traits and are used to optimize agricultural management practices or yield predictions [27,28,29,30,31]. Compared to plant height measured with a ruler in the field at a specific location, the UAV-based approach provides information on the spatial height distribution of a continuous canopy [32,33]. Thus, it contains height information of numerous single plants, while reference measurements in the field only represent height information of single plants covering a very limited area.
Furthermore, CH is very well suited to quantify lodged areas. The term “lodging” is defined as permanent displacement of a plant from the upright position [34,35]. It is a major problem in cereal crops, because it leads to qualitative and quantitative yield losses up to 45% [34,36,37,38]. Yield loss is strongly affected by the lodging severity and the development stage at which it occurs [39,40,41]. Extreme weather conditions (wind, hail, heavy rain) and other environmental factors, such as excessive nitrogen supply, pests, diseases, and high plant density, can cause lodging before harvesting [42]. Thus, breeding programs aim to select for genetic lines of cereal crops with greater lodging resistance [37]. Due to the impacts of climate change, with an increasing number of extreme weather conditions, lodging is still a major limiting factor in yield impairment, resulting in an increasing need for a cost-efficient and accurate approach to quantify lodging. The use of UAVs can replace laborious and subjective ground data collection and enable spatial assessment of lodging by an automated system. Susko et al. [43] tried to assess crop lodging with a field camera track system. Liu et al. [44] used visible and thermal infrared images derived from UAV for rice lodging estimation. Texture information and canopy structure have also been used to assess lodging in rice [45]. Murakami et al. [46] quantified lodging in buckwheat using the 3D canopy structure. In general, the area of lodging can be determined by using a predefined threshold at which CH lodging occurs. However, the thresholds applied in different studies [32,45,47] were defined by subjective inspections rather than by mathematical approaches.
The lodging percentage parameter identified with the single threshold approach only enables to determine the presence or absence of lodging. In recent years, several studies showed that yield impairment is additionally affected by lodging severity [34,39,46,48]. The term “lodging severity” is defined as the angle of the permanent displacement of plants from their upright position [34,48]. Ground data based on visual lodging scores are generally insufficient in accuracy, efficiency, and objectivity [46,49]. So far, only Chu et al. [14] have assessed the lodging severity of corn by quantifying the number of lodge plants. Due to the typical plant structure and plant density of corn, this approach cannot be applied to cereal crops.
The major aims of this study are to use canopy structure derived from red/green/blue (RGB) image data to determine the factors that affect canopy height and to develop new methodologies for the assessment of lodging percentage and severity. The primary objectives are: (i) to compare plant traits derived from UAV- and DTM-based ground models to evaluate whether the DTM can serve as an alternative data source; (ii) to investigate the comparability between ground-measured plant heights in the field with UAV-derived CHs, taking factors like canopy structure and plant density into account; (iii) to develop a mathematical approach for the assessment of lodging percentage, avoiding adjusted thresholds and subjective decisions; and (iv) to assess lodging severity with a novel approach based on canopy height variations.

2. Materials and Methods

2.1. Study Area

The study area is located at the field lab on the Campus Klein-Altendorf of the University of Bonn (50°37′N, 6°59′E), 40 km south of Cologne, Germany. Within the research campus, 2 experimental sites were investigated. The first experimental site was sown on 09 April 2016 and consisted of several small breeder plots, each 2.62 × 3 m in size. This experiment was the test bed for developing a method that allows canopy height and lodging assessment. The layout included three summer barley (Hordeum vulgare) cultivars (HOR 21770, HOR 9707, HOR 3939) and two different sowing densities with six repetitions (Figure 1a). The high density (300 seeds m−2) reflected the common sowing density in Germany. The lower density consisted of 150 seeds m m−2. The selected barley cultivars varied in canopy characteristics (Figure 1).
The second site was a normal production field with a size of 1.5 hectares where winter barley was sown on 28 September 2017. The variety “Lomerit” was sown with a commonly used density of 300 seeds m−2. The lodging assessment approach developed at the first experimental site was applied to test its robustness and usability on this conventionally treated field. The experiments were fertilized with 170 kg nitrogen per hectare and growth inhibitors were applied. The seeds were sown in rows with 10.9 cm row distance.

2.2. Unmanned Aerial Vehicle Platform and Sensor

The Falcon-8 octocopter (Ascending Technologies GmbH, Krailing, Germany) was used in this study, which proved to be a reliable platform for different scientific purposes [50,51,52]. The octocopter was equipped with a Sony Alpha 6000 (Sony Europe Limited, Weybridge, Surrey, UK) RGB wide-angle camera (24 megapixel, 6000 × 4000 pixels). A fixed lens with 30 mm focal length was mounted on the camera, resulting in 0.54 cm ground sample distance (GSD) at a flight altitude of 35 m above ground level (AGL). The RGB camera was mounted and integrated in a gimbal and thus the pitch and roll movements of the UAV could be compensated. Data acquisition was performed in JPEG format with a shutter speed of 1/1000th second according to a planned waypoints pattern with 60% across and 80% along-track overlap. The images did not contain global positioning system (GPS) information. Depending on the battery capacity and weather conditions, the flight duration varied between 10 and 15 min.

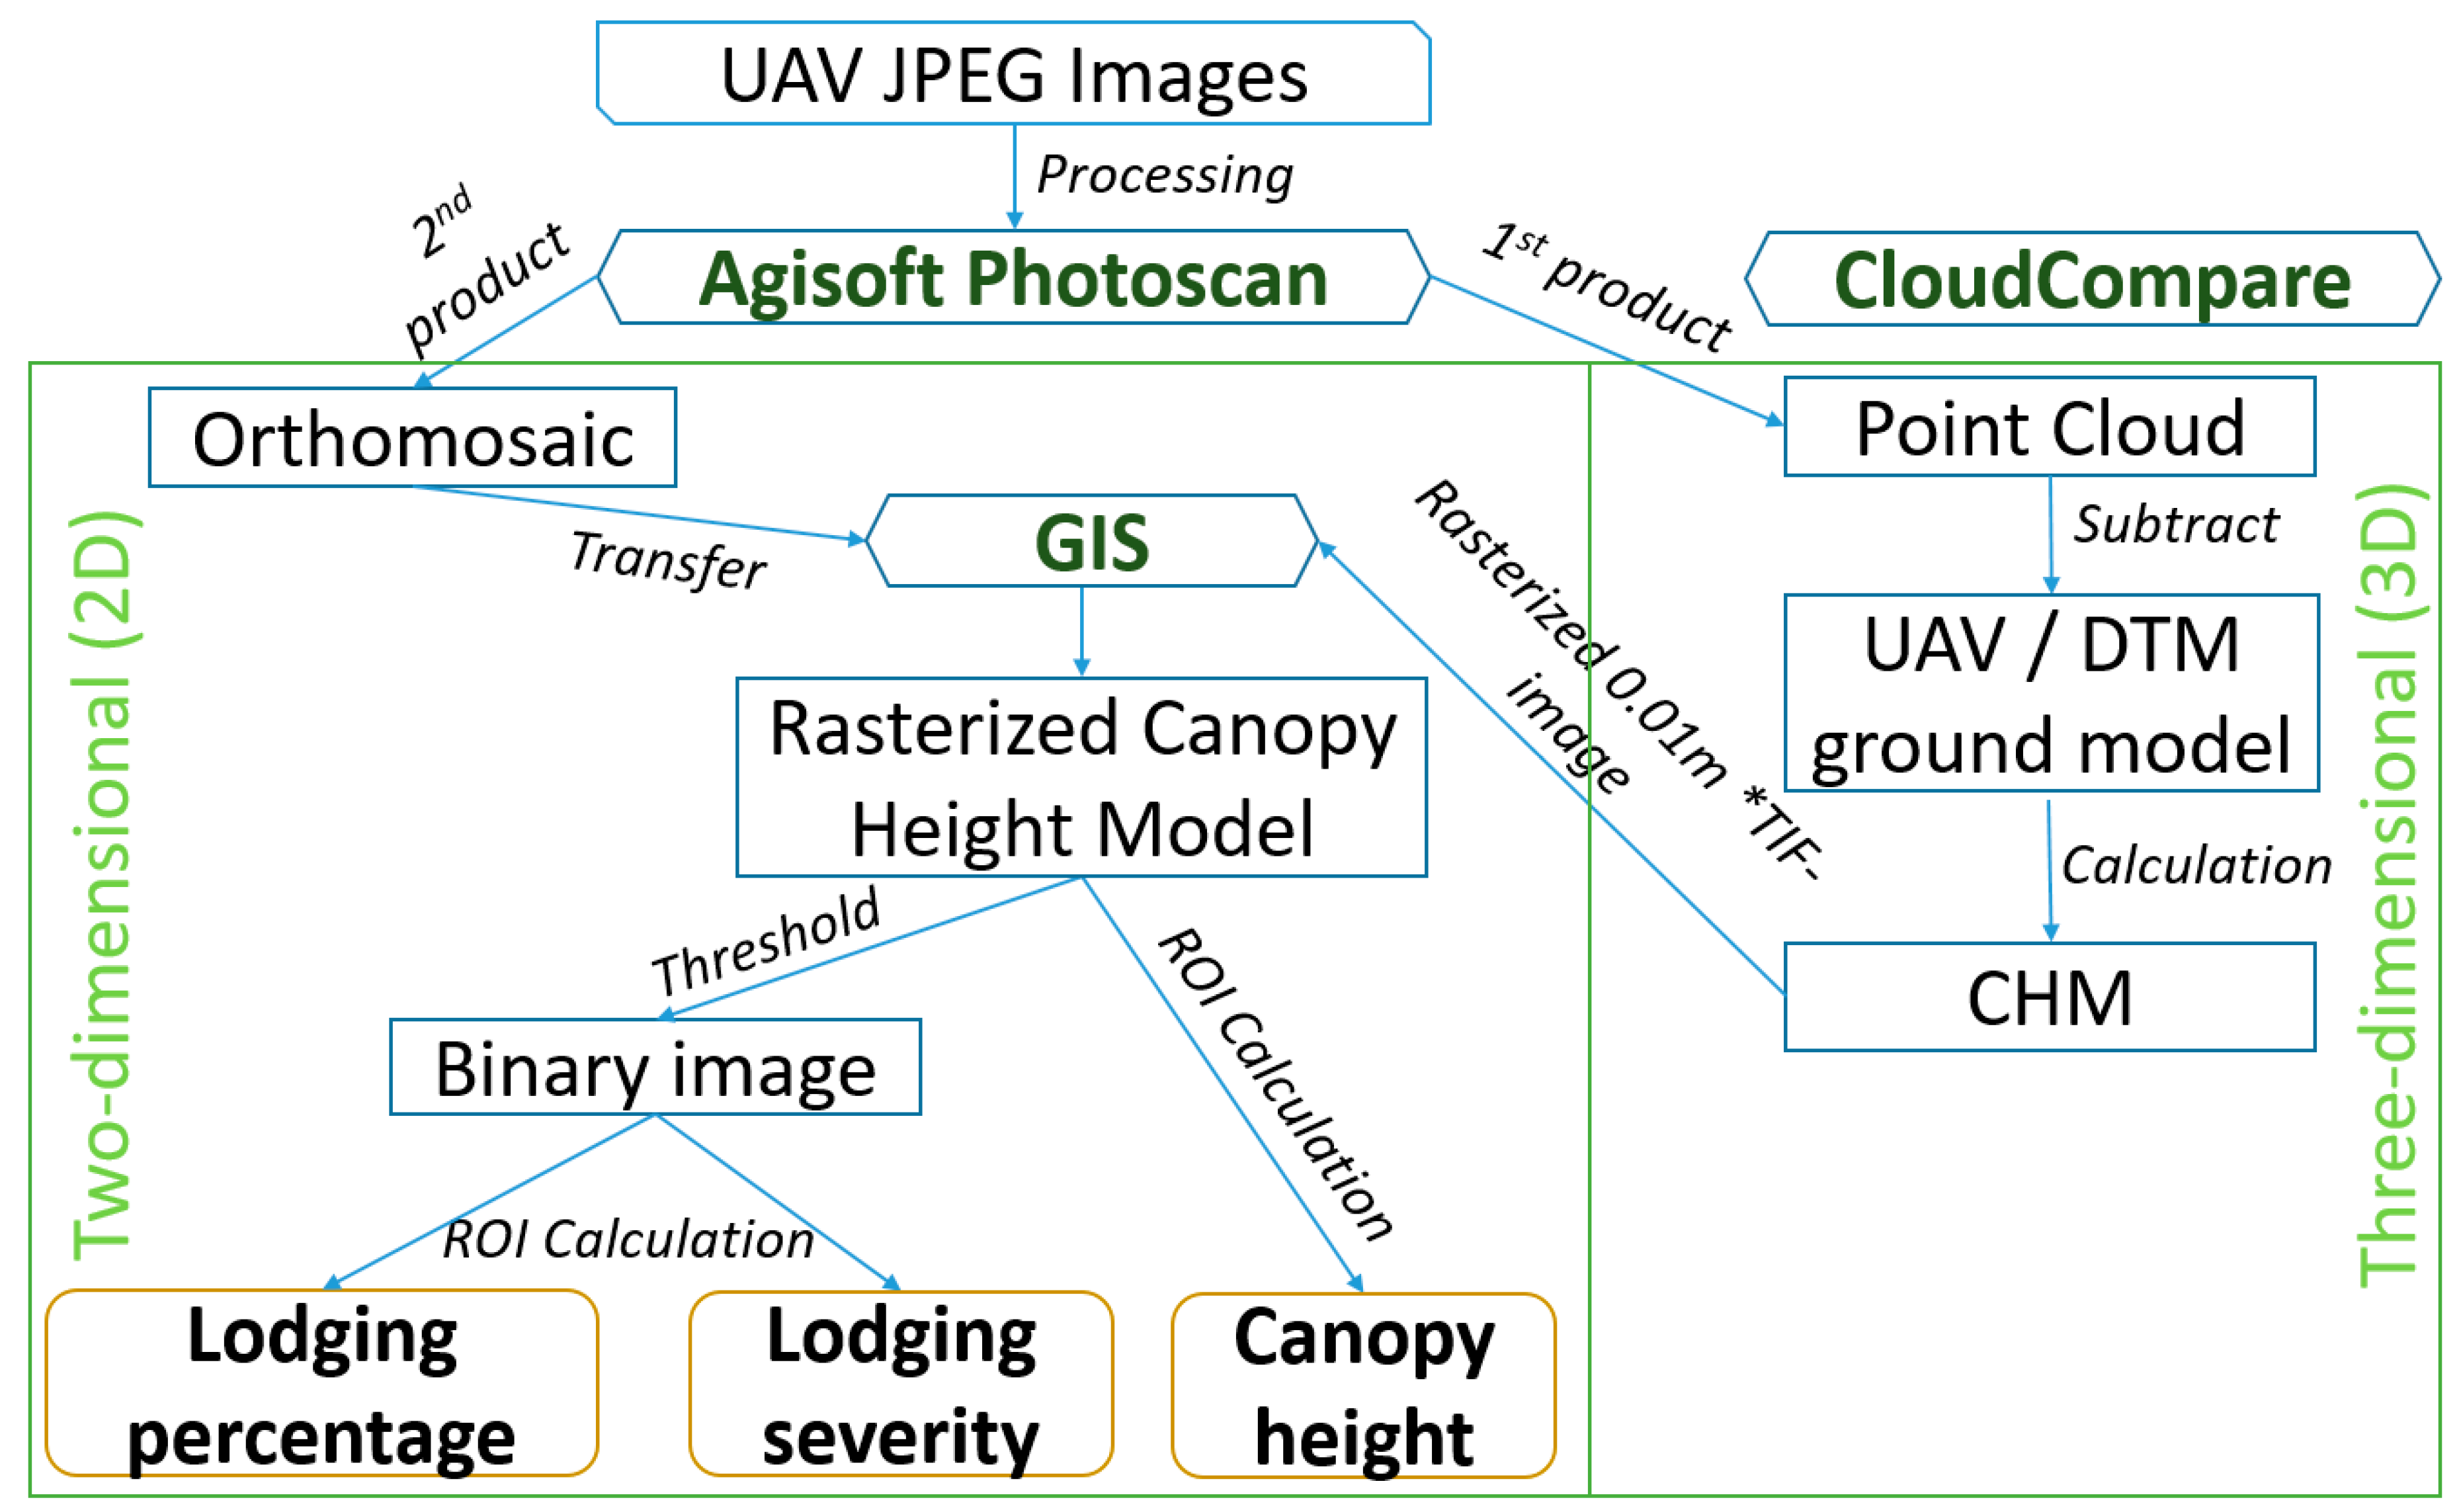
2.3. Data Processing and Canopy Height Model Generation

Agisoft PhotoScan (Agisoft LLC, Saint Petersburg, Russia, version 1.4.1) was used to process the single UAV images based on the structure from motion (SfM) technique using algorithms that identify corresponding images by feature recognition [53]. Details on the SfM algorithms can be found in several publications [53,54,55]. Through a defined number of overlapping images, it recreates their orientation in a spatial three-dimensional (3D) point cloud [56]. In addition to the 3D point cloud as the first product, it provides a two-dimensional orthomosaic [4] as the second product (Figure 2). Further evaluation of the 3D point cloud with the necessary processing settings (align photos: High accuracy; building dense cloud: Quality high) was done in CloudCompare (Version 2.9.1) [57]. Georeferencing (UTM zone 32N) of the point clouds was based on 6 ground control points (GCPs) in Agisoft PhotoScan for each experiment.
The 3D point cloud contains height information above the ellipsoid. To derive the canopy height model (CHM) the 3D point cloud must be subtracted from an underlying ground model (Figure 2). Two methods were investigated in this study to derive the ground model:
  • Ground model determination based on a UAV overflight shortly after sowing or after harvest (UAV-based ground model), and
  • Ground model determination based on a DTM provided by state authorities (DTM-based ground model).
Method 1 requires an additional overflight in the time frame shortly after sowing until seedling emergence with no visible vegetation. By contrast, method 2 is based on the airborne LIDAR dataset that provides the topsoil surface with a GSD of 1 m. In Germany, DTMs are freely accessible and updated at least every 6 years [58]. The DTM for the study was acquired in 2015.
The height difference between the ground and the canopy model finally enables the assessment of CH, as illustrated in Figure 3.
Rasterization of the CHM resulted in a *TIF image with high spatial resolution of 0.01 m (Figure 2), from which the maximal height value for each grid cell was exported and used for further calculation.

2.4. Unmanned Aerial Vehicle Canopy Height Assessment and Validation

The analysis of the rasterized CHM based on images with 0.85 cm GSD was done in QGIS (version 3.2.3) open source GIS software, using layers with different levels (Figure 2). Shape files with a size of 2.4 × 2.8 m were created for each barley plot of the experimental site and used to calculate the median CH. The size of the shape files was chosen to be slightly smaller than the size of the plots to avoid border effects in the further processing.
Plant heights were also determined with a measuring ruler in the field to compare them to the UAV-derived CH of experimental site 1. The median plant height was calculated based on 6 height measurements within each plot, whereby the highest point of the plants was taken. In total, 4 repetitions per sowing density and genotype were recorded 61 days after sowing (DAS).

2.5. Lodging Assessment and Validation

The rasterized CHMs and the shape files (2.4 × 2.8 m) of the plots were also used for the lodging assessment (Figure 2). Two parameters were calculated in this study: (i) Lodging percentage, which represents the area affected by lodging, and (ii) lodging severity, which describes how strongly the canopy is affected by lodging based on the canopy height variation, hereinafter specified in detail.

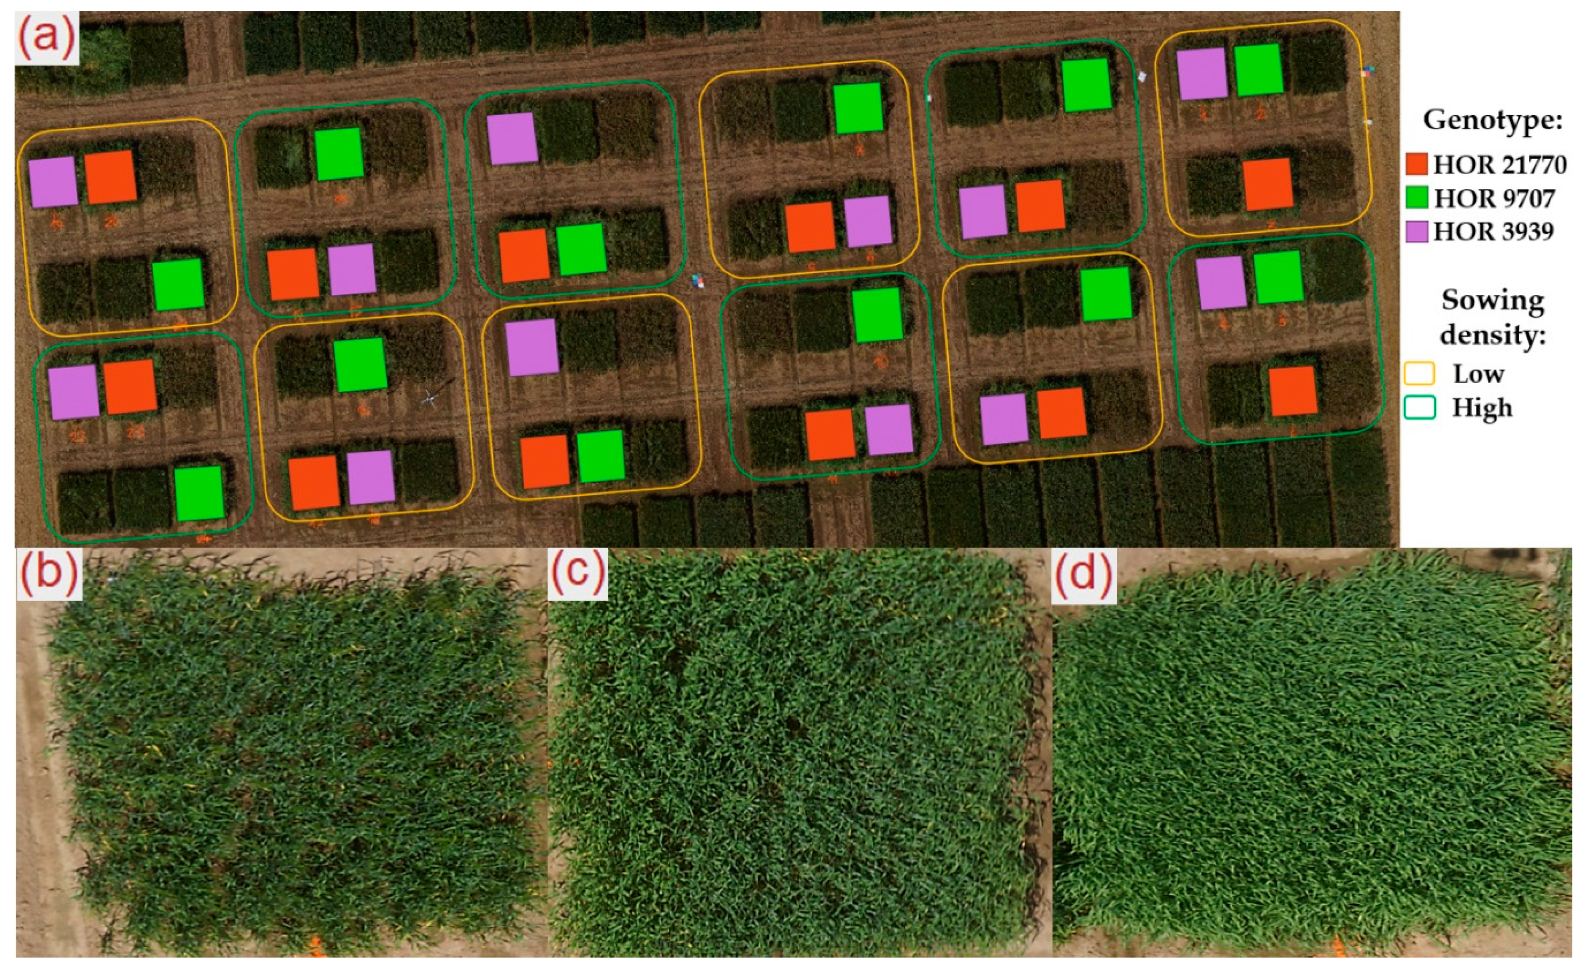
2.5.1. Experimental Site 1: Breeding Trials

The first step in the process of quantifying lodging was to determine an objective threshold. First, the maximum canopy heights (MAXCH) of each genotype were calculated based on images with 0.85 cm GSD. In the second step, the average MAXCH of all repetitions was used to minimize the risk of including outliers as maximum values. To determine the UAV lodging percentage, four lodging percentage thresholds (LPTs) related to the MAXCH were calculated: 80% (80LPT), 70% (70LPT), 60% (60LPT), and 50% (50LPT) of the MAXCH. For example, 70LPT of a MAXCH of 1 m is 0.7 m. Based on the different LPTs, the lodging percentage could be determined by a simple query (rasterized CHM < LPT), resulting in a binary image showing areas affected and not affected by lodging (Figure 4c).
For the lodging severity assessment a mixture of four thresholds (80LPT, 70LPT, 60LPT, 50 LPT) related to the MAXCH was used. Based on these thresholds, first the average lodging severity (ALS) and second the weighted average lodging severity (WALS) were determined according to Equations (1) and (2). In comparison to ALS, the WALS parameter additionally rates areas affected by lodging, differentiated to also consider the yield impairment. The applied weighting factors were chosen based on expertise, adjustments and the expected yield impairment of the LPTs. Sections with CH lower than 50% (50LPT) of the MAXCH were weighted twice as much as those with CH lower than 80% (80LPT) of the MAXCH (Equation (2)). The difference between adjacent LPT factors within the WALS calculation was 0.25, so that the value range for both lodging severity parameters varied between 0 and 100%.
A L S = 80 L P T + 70 L P T + 60 L P T + 50 L P T 4
W A L S = ( 0.625 80 L P T ) + ( 0.875 70 L P T ) +   ( 1.125 60 L P T ) +   ( 1.375 50 L P T ) 4
To validate the accuracy of the UAV lodging percentage, affected areas of each barley plot were manually determined in a high-resolution orthomosaic (GSD = 0.23 cm). Due to the high spatial resolution, the lodged areas could be easily identified, resulting in a precise lodging percentage determination (Figure 4a). These reference data do not consider information on lodging severity and only provide a differentiation between the presence or absence of lodging.

2.5.2. Experimental Site 2: Farmer Field

For the case study, the above described method was applied to a conventional production field. Due to the lack of repetition in a classical farmer field, the 90th percentile of canopy height distribution was used as MAXCH to minimize the risk of including an outlier as a maximum value. To evaluate the influence of the spatial resolution on the assessment of lodging percentage and severity, three datasets with different GSDs were acquired by adjusting flight altitude: 0.54 cm (35 m AGL), 1.09 cm (70 m AGL), and 1.57 cm (100 m AGL). Data acquisition took place 258 DAS. For validation purposes, the orthomosaic with 0.54 cm GSD was used to manually determine areas affected by lodging.

3. Results and Analysis

3.1. Comparison of Plant Traits Derived from Unmanned Aerial Vehicle- and Digital Terrain Model-Based Ground Models

As aforementioned (Section 2.4), the 3D point cloud has to be subtracted from a ground model to derive the CHM. The UAV- and DTM-based ground models were used in the first experiment (breeding trials) to determine the average CH (61 DAS) and lodging percentage parameter (75 DAS) for each barley plot. The CHs derived from both ground models showed a high level of agreement (R2 of 0.99) and provided almost the same results (Figure 5a).
In comparison to CH, the lodging percentage parameter determined for both ground models using 70LPT resulted in a slightly lower R2 of 0.93 (Figure 5b). Small CH differences can influence the determined lodging percentage, especially for plots that are less affected by lodging. By considering the 1:1 line, a higher residual deviation can be observed for lower values (Figure 5b). By contrast, values higher than 50% showed a better fit with the 1:1 line. Although the correlation of the parameter lodging percentage was slightly lower compared to the UAV CH, it still showed a high level of accuracy.
For experimental site 2, both ground models were investigated based on the parameter lodging percentage using 70LPT (Table 1). Only a small difference of 3.25% between both ground models could be observed. Compared to the reference data, the UAV ground model showed a smaller deviation than the DTM ground model. Due to the slightly higher accuracy, the UAV ground model was used in the further course of the study.

3.2. Unmanned Aerial Vehicle Canopy Height Assessment and Validation

Comparing the UAV-derived CHs of the breeder trial with corresponding plant heights measured directly in the field, clear deviations in accuracy could be detected, depending on genotype and sowing density. While genotype HOR 3939, with 0.29 m in low density and 0.18 m in high density, showed greater differences between UAV CH and reference measurements, genotypes HOR 9707 and HOR 21770 showed only slight differences (Table 2).
One reason for the more pronounced deviations observed for genotype HOR 3939 was that the canopy fractional cover was lower than that of the other two cultivars. This resulted in small areas inside the plot without vegetation cover where soil was visible (Figure 1b). Thus, not only was the top layer of the canopy acquired, but lower parts were also included in the computation of CHM. These nonvegetated areas had an influence on the determined median CH and caused underestimation of the UAV-based CH retrieval. By contrast, genotype HOR 21770 showed a dense and closed canopy without any gaps (Figure 1c). Thus, only the top canopy layer was considered in CHM generation, consequently leading to a small deviation of 0.03 m in the low sowing density and 0.01 m in the high sowing density compared to the reference measurements (Table 2).In general, the UAV CH of the high-density plots matched better with the plant heights measured in field with an average difference of 0.07 m in comparison to the lower-density plots with an average difference of 0.13 m. This is also due to the fact that the lower sowing density resulted in a less dense canopy with gaps and consequently influenced the UAV CH assessment.

3.3. Lodging Assessment and Validation

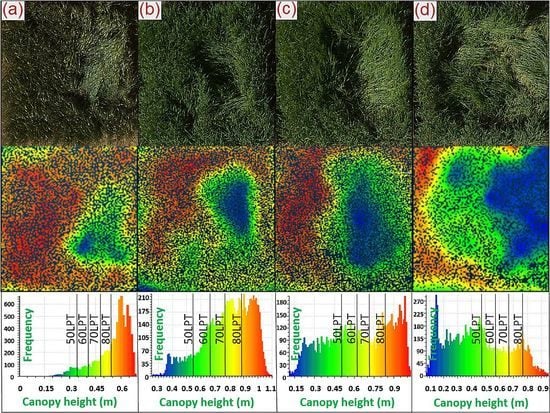
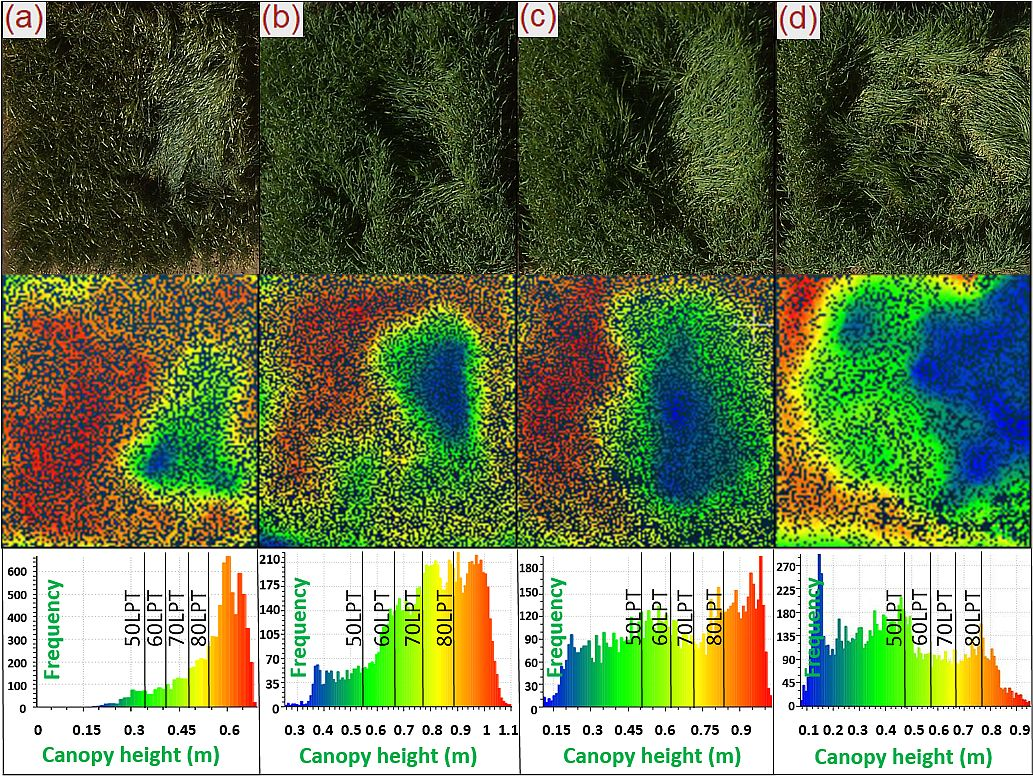
3.3.1. Experimental Site 1: Breeding Trials

Permanent displacement of a plant from the upright position can be affected by different lodging severity, as illustrated in Figure 6. The first example shows a slightly affected canopy where only low-yield loss can be expected (Figure 6a). The same applies for the plot in Figure 6b, where just a few small areas are strongly affected by lodging. Additionally, Figure 6c clearly illustrates the capability of the approach to detect lateral lodging. In contrast to the other examples, the canopy in Figure 6d is heavily affected by lodging, so that parts of the plot lay completely on the ground.
In order to identify the most suitable threshold for lodging percentage assessment, four LPTs (80LPT, 70LPT, 60LPT, 50LPT) were compared to the reference data. The UAV lodging percentage derived from 80LPT has a high root mean square error (RMSE) of 18.78% (Figure 7a). It became clear that the absolute height differences between MAXCH and 80LPT were small and varied between 0.13 m (HOR 3939, high sowing density) and 0.22 m (HOR 21770, low sowing density) (Table 3). The naturally occurring plant height variation was higher than the predefined lodging threshold, resulting in an overestimation of lodging (Figure 7a).
The UAV lodging percentage derived from 70LPT took into account the naturally occurring plant height variation in the field and led to the highest correlation (R2 = 0.96) (Figure 7b) and the lowest RMSE. The low amount of scattering indicated that 70LPT can be applied independently from the amount of lodged plants. No influence of the aforementioned differentiated canopy characteristics and canopy heights was observed. In comparison to the reference data, the UAV lodging percentage derived with 60LPT and 50LPT showed lower correlations (Figure 7c,d). Canopy areas affected by lodging were partly not identified when the lower CH thresholds were applied. Thus, the lodging percentage was underestimated, especially in strongly affected plots, where the CH threshold was more relevant.
In comparison to the single threshold approach normally used, a combination of different thresholds can provide additional information for the lodging percentage assessment. The average of all four thresholds used in the ALS calculation enabled estimation of the lodging percentage on a pixel basis with high accuracy (R2 = 0.94, RMSE = 8.22%) (Figure 7e). The WALS parameter, by contrast, provided slightly lower accuracy (R2 = 0.921, RMSE = 11.53%) (Figure 7f), because of the weighting procedure that was implemented within the parameter calculation (Equation (2)).
The aforementioned lodging severity variation cannot be determined by applying a single threshold approach, because that only represents a binary distinction between lodged and nonlodged areas. Consequently, 70LPT, for example, cannot distinguish between slightly affected areas (Figure 6a,b), where a low-yield impairment can be expected, and heavily affected areas (Figure 6d), which necessarily cause yield loss. As a second step, the WALS parameter took these CH variations into account by its inbuilt weighting procedure and therefore can be used as an indicator for yield impairment.
The reference data displayed in Table 3 clearly show that the lower sowing density with an average of 50% was less affected by lodging compared to plots with the higher sowing density averagely affected by 77%. Moreover, 50LPT applied to the lower-density plots allowed detection of only 35% of lodged area at maximum and 10% at minimum. Contrarily, 70LPT determined a distinctly higher amount of 71% lodge area at maximum and 27% at minimum. The applied weighting procedure within the WALS calculation based on the different thresholds was able to consider this lodging intensity variation and, compared to the lodging percentage derived from 70LPT, led to a difference of 16% at maximum (Table 3). The disparity between the WALS and reference data was influenced by the fact that the determined reference data were only an indicator for the presence or absence of lodging and did not provide information on lodging severity. The plots with high sowing density showed distinctly larger areas heavily affected by lodging, with 69% at maximum and 50% at minimum for 50LPT. This higher lodging severity led to a stronger correlation between the WALS and determined reference data (Table 3). Nevertheless, the variations still present between the different LPTs resulted in a deviation of 15% at maximum between 70LPT and WALS for the plots with high sowing density. The average difference considering all genotypes and sowing densities between both parameters was 12% (SD ± 4.2).
Comparing ALS and WALS clarified that ALS without the weighting procedure slightly overestimated the lodging severity (Table 3). The difference between WALS and ALS was 6% at maximum; the average difference was 4% (SD ± 1.1).

3.3.2. Experimental Site 2: Farmer Field

The results for the developed lodging assessment procedure applied to an entire farmer field for different GSDs are summarized in Table 4. The 70LPT calculated for the highest spatial resolution (0.54 cm) showed the closest match to the reference data. Therefore, 70LPT again seemed to be most suitable to assess the lodging percentage. The results for 70LPT determined for the image data with lower spatial resolutions (1.09 and 1.57 cm) led to slightly higher deviations at around 6% compared to the reference data. However, the measured deviations were quite small. The general trend showed that the lodging percentage of all LPTs increased with decreasing GSDs. Therefore, the results for 60LPT correlated increasingly better with the reference data with lower spatial resolution. This was influenced by the fact that the lodging severity of the entire farmer field was relatively high (Figure 8) and the differences between LPTs were small.
The calculated lodging severity parameters showed exactly the same trend regarding the different spatial resolutions. The WALS parameter only increased by 4% with decreasing GSDs. This underlines that the GSD has only a small impact on the parameter calculation. The WALS calculated for the dataset with the highest GSD (Figure 8) provided a high level of agreement compared to the reference data. The small deviations of only 0.35% for the reference data and 1.2% for 70LPT were almost negligible and again were influenced by the high amount of plants strongly affected by lodging determined for 50LPT (Table 4).
The ALS once more probably slightly overestimated the lodging severity because of the missing weighting procedure. The difference between the two parameters, however, was only 3% at maximum because of the small variations between the different LPTs (Table 4).

4. Discussion

In the presented study, different methods for high-throughput field phenotyping based on UAV image data were developed. In the following, the results achieved for the investigations are discussed in detail: A comparison of UAV-based and DTM-based ground models, comparability between measured plant heights in the field and UAV-derived CHs, and a spatially precise assessment of lodging percentage and severity.
The quality assessment of DTMs derived from airborne LIDAR data was mostly based on statistical methods [16,17,19]. Comparing the LIDAR DTM in this study with a UAV-acquired ground model, the results showed that the LIDAR DTM can be used as an almost equivalent ground model to determine accurate CHMs. A direct comparison of the ground models independent from plant traits was not done, because the average height difference between the two ground models would consider irrelevant information. Agricultural activities such as deeper wheel tracks were more pronounced in the UAV ground model because of the distinctly higher spatial resolution in comparison to the LIDAR DTM. Areas like this were not relevant for the CH and lodging assessment and therefore can be neglected. The results in this study are independent from the year (2016—Experimental site 1, 2017—Experimental site 2) and location of data collection. Without extensive changes caused by human impact or agricultural crop rotation, it can be assumed that the renewed interval every six years provides sufficiently up-to-date information to obtain a precise ground model. However, a larger-scale experiment considering different locations and years needs to be conducted in the future to exploit the potential of DTM-based ground models in more detail. Nevertheless, the DTM has the potential to substitute for the mandatory UAV overflight and thus substantially reduce the effort in data collection. In this way, the time needed for data collection and data processing to determine lodging can be reduced by half. The included height information of the topsoil surface every square meter can be a benefit for large fields or hilly areas.
As already demonstrated in different studies [14,24,26], the UAV-based CH can be highly correlated with manually determined plant heights collected with a measuring ruler in the field. The study additionally shows that the UAV-derived information on the spatial height distribution of the canopy was affected by the canopy structure, the sowing density, and correspondingly also the sowing heterogeneity. By contrast, manual plant height measurements only represent single points in the field associated with subjective decisions, in particular with high plot heterogeneity. For that reason, the UAV-derived CH should be considered as an autonomous trait with a different definition compared to the plant height measurements. A validation of the UAV CH using the plant height measurements was correspondingly only possible to a limited extent. The UAV assessment enabled representative information on plots with high heterogeneity that can be measured manually only with great effort. Especially for breeders, the CH determination enabled simplifying complex crop and plant surfaces on an objective scale to estimate genetic effects. Furthermore, canopy homogeneity can be investigated for entire farmer fields because it carries information on the heterogeneity of the underlying soil and the factors influencing crop growth.
The developed approach for lodging percentage assessment provided very high accuracy in breeding trials (R2 = 0.96, RMSE = 7.66%) and led to a slight overestimation of 2% when applied to a classical farmer field. Compared to other approaches where thresholds are normally chosen based on subjective decisions without a mathematical approach and reference data for validation [32,45,47], 70LPT enabled the precise detection of lodged areas within the canopy and took into account the naturally occuring plant height variations in the field. Furthermore, the implemented method for detection of an objective threshold considered the aforementioned factors influencing the CHM. The results showed that the developed method is well suited for barley genotypes with differentiated canopy structures and therefore has the potential to be applied to other cereal crops, such as wheat.
In the process of determining lodging percentage in rice using structure, texture, and thermal information derived from UAV images, Liu et al. [44] and Yang et al. [45] obtained high R2 values greater than 0.9. The accuracy of the lodging percentage determined from textural information, however, is strongly dependent on a trained support vector machine (SVM) and the dataset used. Changing illumination conditions during the flight, general illuminance, sun angle, shadow effects, plant development stages, and color variance between genotypes and species can influence the method. For that reason, the approach is not transferable without having to adapt the SVM to other datasets. The quantification of lodging from thermal images is also very challenging, because external factors such as small changes in wind speed and cloud cover strongly influence the derived canopy surface temperatures [47,59]. The temperature difference between lodged and nonlodged plants was quite low, which can only be determined from image data recorded by precisely calibrated camera systems combined with accurate processing from raw data to final products.
The lodging assessment based on RGB images to derive the relevant CH presented in this study is almost independent from abiotic and external factors. Just a consumer RGB camera is needed, without the demand for calibration. In general, only large canopy height variations within a field can cause problems. In this extreme case, lower grown plants would be labeled as lodged plants. This issue, however, can be considered in the workflow by applying differentiated MAXCH values in areas with strong CH variations caused, for example, by different soil or nutrition conditions.
An advantage of the newly developed WALS and ALS lodging severity parameters is that they additionally take CH variance into account and enable the quantification of yield impairment caused by lodging. Several studies only considered the presence or absence of lodging, and different lodging severities as illustrated in Figure 6, were treated equally [32,44,45,47]. Already Fischer and Stapper [39] and Berry and Spink [34] showed that the yield potential was influenced by the intensity of the permanent displacement of crops from their upright position. Additionally, Murakami et al. [46] investigated the usability of UAV data to assess lodging and showed that the yield was stronger impaired by higher lodging scores and low average CHs. Taking this into account, the novel WALS parameter was designed to consider the influence of lodging on yield. For the general lodging severity assessment the ALS parameter is adequate. However, to quantify the yield impairment caused by lodging, the LTP has to be weighted (WALS) to improve the prediction accuracy. In future studies, the factors applied to lower LPTs (Equation (2)) should be weighted more strongly and compared to yield data to investigate the potential in more detail.
The average difference of 12% between the lodging percentages derived from 70LPT and WALS of experimental site 1 illustrates the need to differentiate between the lodging percentage and lodging severity. Even though plots with high sowing density were partly strongly influenced by lodging, there was still variation between the different LPTs, resulting in a reasonable deviation between the two parameters (Table 3). This discrepancy between 70LPT and WALS decreased with less divergent LPTs, as ascertained for the farmer field of experimental site 2 (Table 4). The higher the deviation between LPTs was, the higher the difference between 70LPT and WALS. For the lodging severity in general the ALS parameter is more objective without the weighting factors. However, for the yield impairment caused by lodging the LTP has to be weighted to improve the prediction.
The results showed finally, that detection of lodge areas was still possible with the lowest spatial resolution (1.57 cm GSD) from the highest flight altitude (100 m) without a substantial decline in accuracy. Nevertheless, for very high accuracy, it is recommended to use images with higher spatial resolution (0.5 cm GSD), otherwise small patches with differentiated lodging severity will hardly be detected and severity values will increase.
To summarize, the developed lodging assessment approach can be used for insurance applications, precision farming, and breeding research. In addition to selecting for genetic lines with higher lodging resistance, the different lodging severities and consequently yield impairments can be quantified as additional information. The approach additionally enabled determination of the recovery rate of crops. Navabi et al. [60] demonstrated on over 140 different wheat genotypes that the extent of recovery capability varied among genotypes. Similar results were found by Briggs [41] for barley. The pixel-based lodging severity information based on the WALS parameter, illustrated in Figure 6, can be further used in precision farming to generate harvest maps and improve yield quality by avoiding areas in the harvest process that sprout again after heavy lodging events during the early stages of plant development.

5. Conclusions

At present, UAV technology is widely used because the data acquisition is relatively easy, timely, flexible, and cheap. The acquired data can provide timely, detailed information on the current status of plants, which is valuable for breeders, insurance companies, and farmers. Breeding trials are particularly difficult to monitor on a regularly basis within a reasonable time, resulting in an increasing need for faster selection of superior lines. The UAV-based CH assessment provides spatial information on the canopy height distribution and offers much more information compared to the classical plant height measurements of single spots in the field. The UAV-derived CH enables simplification of a complex crop surface with an objective scale to estimate genetic effects. The presented lodging assessment approach based on 3D canopy structure has many advantages over other methods, because it is more independent from external conditions, which increases its practicability. Furthermore, the method makes it possible to estimate yield impairment caused by lodging. Future studies need to be conducted to evaluate the accuracy in more detail. Finally, it was shown that areas affected by lodging could be detected with high accuracy even at the lowest spatial resolution (1.57 cm GSD). The higher the flight altitude is, the shorter the flight time, the smaller the number of recorded images, and the shorter the processing time. Therefore, fixed-wing UAVs, normally operated at higher altitudes to cover large areas, can be used for lodging assessment. This also substantially increases the practicability of the developed method, especially for large agricultural fields. Moreover, first steps were realized in this study to use an airborne LIDAR DTM provided by national authorities as an alternative ground model for CHM generation. The comparison of the DTM with the UAV ground model demonstrated that the DTM information can be used as a ground model and can help to reduce the effort in data collection and processing. Further investigations are needed to evaluate the robustness of ground models derived from LIDAR data under different conditions and in different locations.

Author Contributions

Conceptualization: N.W., B.S., L.K., A.B., O.M., and U.R.; Designed the experiment: T.K., O.M.; Data curation: N.W., B.S., A.B., and S.H.; Formal analysis: N.W., B.S., and A.B.; Funding acquisition: O.M.; Investigation: N.W. and T.K.; Methodology: N.W., B.S., L.K., A.B., and U.R.; Project administration: T.K. and O.M.; Supervision: B.S., L.K., A.B., O.M., and U.R.; Validation: N.W. and S.H.; Visualization: N.W.; Writing—original draft: N.W. and B.S.; Writing—review and editing: N.W., B.S., L.K., T.K., A.v.D., and U.R.

Funding

This study was performed within the German Plant Phenotyping Network (DPPN), which is funded by the German Federal Ministry for Education and Research (BMBF), project identification number BMBF 031A053. The work was additional supported by SPECTORS, which is funded by INTERREG V A-Programm Deutschland-Nederland, project identification number 143081.

Conflicts of Interest

The authors declare no conflict of interest.

References

  1. Atzberger, C. Advances in remote sensing of agriculture: Context description, existing operational monitoring systems and major information needs. Remote Sens. 2013, 5, 949–981. [Google Scholar] [CrossRef]
  2. Siegmann, B.; Jarmer, T. Comparison of different regression models and validation techniques for the assessment of wheat leaf area index from hyperspectral data. Int. J. Remote Sens. 2015, 36, 4519–4534. [Google Scholar] [CrossRef]
  3. Burkart, A.; Hecht, V.L.; Kraska, T.; Rascher, U. Phenological analysis of unmanned aerial vehicle based time series of barley imagery with high temporal resolution. Precis. Agric. 2017, 19, 134–146. [Google Scholar] [CrossRef]
  4. Gómez-Candón, D.; De Castro, A.I.; López-Granados, F. Assessing the accuracy of mosaics from unmanned aerial vehicle (UAV) imagery for precision agriculture purposes in wheat. Precis. Agric. 2014, 15, 44–56. [Google Scholar] [CrossRef]
  5. Zhang, C.; Kovacs, J.M. The application of small unmanned aerial systems for precision agriculture: A review. Precis. Agric. 2012, 13, 693–712. [Google Scholar] [CrossRef]
  6. Candiago, S.; Remondino, F.; Giglio, M.; De Dubbini, M.; Gattelli, M. Evaluating Multispectral Images and Vegetation Indices for Precision Farming Applications from UAV Images. Remote Sens. 2015, 7, 4026–4047. [Google Scholar] [CrossRef] [Green Version]
  7. Grenzdörffer, G.; Engel, A.; Teichert, B. The photogrammetric potential of low-cost UAVs in forestry and agriculture. Int. Arch. Photogramm. Remote Sens. Spat. Inf. Sci. 2008, 1, 1207–1213. [Google Scholar] [CrossRef]
  8. Eling, C.; Wieland, M.; Hess, C.; Klingbeil, L.; Kuhlmann, H. Development and evaluation of a UAV based mapping system for remote sensing and surveying applications. Int. Arch. Photogramm. Remote Sens. Spat. Inf. Sci. ISPRS Arch. 2015, 40, 233–239. [Google Scholar] [CrossRef]
  9. Mancini, F.; Dubbini, M.; Gattelli, M.; Stecchi, F.; Fabbri, S.; Gabbianelli, G. Using unmanned aerial vehicles (UAV) for high-resolution reconstruction of topography: The structure from motion approach on coastal environments. Remote Sens. 2013, 5, 6880–6898. [Google Scholar] [CrossRef]
  10. Hodgson, J.C.; Baylis, S.M.; Mott, R.; Herrod, A.; Clarke, R.H. Precision wildlife monitoring using unmanned aerial vehicles. Sci. Rep. 2016. [Google Scholar] [CrossRef] [PubMed]
  11. Dandois, J.P.; Ellis, E.C. High spatial resolution three-dimensional mapping of vegetation spectral dynamics using computer vision. Remote Sens. Environ. 2013. [Google Scholar] [CrossRef]
  12. Turner, D.; Lucieer, A.; Watson, C. An automated technique for generating georectified mosaics from ultra-high resolution Unmanned Aerial Vehicle (UAV) imagery, based on Structure from Motion (SFM) point clouds. Remote Sens. 2012, 4, 1392–1410. [Google Scholar] [CrossRef]
  13. Colomina, I.; Molina, P. Unmanned aerial systems for photogrammetry and remote sensing: A review. ISPRS J. Photogramm. Remote Sens. 2014, 92, 79–97. [Google Scholar] [CrossRef] [Green Version]
  14. Chu, T.; Starek, M.J.; Brewer, M.J.; Murray, S.C.; Pruter, L.S. Assessing lodging severity over an experimental maize (Zea mays L.) field using UAS images. Remote Sens. 2017, 9, 923. [Google Scholar] [CrossRef]
  15. Bendig, J.; Bolten, A.; Bareth, G. UAV-based Imaging for Multi-Temporal, very high Resolution Crop Surface Models to monitor Crop Growth Variability. Photogramm.-Fernerkund.-Geoinf. 2013, 6, 551–562. [Google Scholar] [CrossRef]
  16. Li, Z. On the measure of digital terrain model accuracy. Photogramm. Rec. 1988. [Google Scholar] [CrossRef]
  17. Podobnikar, T. Methods for visual quality assessment of a digital terrain model. Surv. Perspect. Integrating Environ. Soc. 2009, 1, 1–24. [Google Scholar] [CrossRef]
  18. Hirt, C. Digital Terrain Models; Springer International Publishing: Berlin, Germany, 2014; pp. 1–6. [Google Scholar] [CrossRef]
  19. Kraus, K.; Briese, C.; Attwenger, M.E.; Pfeifer, N. Quality Measures for Digital Terrain Models; The International Archives of the Photogrammetry, Remote Sensing and Spatial Information Sciences: Hannover, Germany, 2004. [Google Scholar]
  20. Anthony, D.; Elbaum, S.; Lorenz, A.; Detweiler, C. On crop height estimation with UAVs. In Proceedings of the 2014 IEEE/RSJ International Conference on Intelligent Robots and Systems, Chicago, IL, USA, 14–18 September 2014. [Google Scholar]
  21. De Souza, C.H.W.; Lamparelli, R.A.C.; Rocha, J.V.; Magalhães, P.S.G. Height estimation of sugarcane using an unmanned aerial system (UAS) based on structure from motion (SfM) point clouds. Int. J. Remote Sens. 2017. [Google Scholar] [CrossRef]
  22. Stanton, C.; Starek, M.J.; Elliott, N.; Brewer, M.; Maeda, M.M.; Chu, T. Unmanned aircraft system-derived crop height and normalized difference vegetation index metrics for sorghum yield and aphid stress assessment. J. Appl. Remote Sens. 2017. [Google Scholar] [CrossRef]
  23. Chu, T.; Starek, M.J.; Brewer, M.J.; Masiane, T.; Murray, S.C. UAS imaging for automated crop lodging detection: A case study over an experimental maize field. SPIE Commer. Sci. Sens. Imaging 2017. [Google Scholar] [CrossRef]
  24. Holman, F.H.; Riche, A.B.; Michalski, A.; Castle, M.; Wooster, M.J.; Hawkesford, M.J. High throughput field phenotyping of wheat plant height and growth rate in field plot trials using UAV based remote sensing. Remote Sens. 2016, 8, 1031. [Google Scholar] [CrossRef]
  25. Bendig, J.; Yu, K.; Aasen, H.; Bolten, A.; Bennertz, S.; Broscheit, J.; Gnyp, M.L.; Bareth, G. Combining UAV-based plant height from crop surface models, visible, and near infrared vegetation indices for biomass monitoring in barley. Int. J. Appl. Earth Obs. Geoinf. 2015, 39, 79–87. [Google Scholar] [CrossRef]
  26. Bendig, J.; Bolten, A.; Bennertz, S.; Broscheit, J.; Eichfuss, S.; Bareth, G. Estimating biomass of barley using crop surface models (CSMs) derived from UAV-based RGB imaging. Remote Sens. 2014, 6, 10395–10412. [Google Scholar] [CrossRef]
  27. Adamchuk, V.I.; Ferguson, R.B.; Hergert, G.W. Soil Heterogeneity and Crop Growth. In Precision Crop Protection-the Challenge and Use of Heterogeneity; Oerke, E.-C., Gerhards, R., Menz, G., Sikora, R.A., Eds.; Springer: Dordrecht, The Netherlands, 2010; pp. 3–16. ISBN 978-90-481-9277-9. [Google Scholar]
  28. Shanahan, J.F.; Schepers, J.S.; Francis, D.D.; Varvel, G.E.; Wilhelm, W.W.; Tringe, J.M.; Schlemmer, M.R.; Major, D.J. Use of remote-sensing imagery to estimate corn grain yield. Agron. J. 2001. [Google Scholar] [CrossRef]
  29. Mulla, D.J. Twenty five years of remote sensing in precision agriculture: Key advances and remaining knowledge gaps. Biosyst. Eng. 2013. [Google Scholar] [CrossRef]
  30. Hansen, P.M.; Schjoerring, J.K. Reflectance measurement of canopy biomass and nitrogen status in wheat crops using normalized difference vegetation indices and partial least squares regression. Remote Sens. Environ. 2003. [Google Scholar] [CrossRef]
  31. Bareth, G.; Aasen, H.; Bendig, J.; Gnyp, M.L.; Bolten, A.; Jung, A.; Michels, R.; Soukkamäki, J. Low-weight and UAV-based Hyperspectral Full-frame Cameras for Monitoring Crops: Spectral Comparison with Portable Spectroradiometer Measurements. Photogramm.-Fernerkund.-Geoinf. 2015. [Google Scholar] [CrossRef]
  32. Bendig, J.V. Unmanned Aerial Vehicles (UAVs) for Multi-Temporal Crop Surface Modelling. Ph.D. Thesis, Universität zu Köln, Cologne, Germany, 2015. [Google Scholar]
  33. Aasen, H.; Burkart, A.; Bolten, A.; Bareth, G. Generating 3D hyperspectral information with lightweight UAV snapshot cameras for vegetation monitoring: From camera calibration to quality assurance. ISPRS J. Photogramm. Remote Sens. 2015. [Google Scholar] [CrossRef]
  34. Berry, P.M.; Spink, J. Predicting yield losses caused by lodging in wheat. Field. Crops Res. 2012, 137, 19–26. [Google Scholar] [CrossRef]
  35. Rajapaksa, S.; Eramian, M.; Duddu, H.; Wang, M.; Shirtliffe, S.; Ryu, S.; Josuttes, A.; Zhang, T.; Vail, S.; Pozniak, C.; et al. Classification of Crop Lodging with Gray Level Co-occurrence Matrix. In Proceedings of the 2018 IEEE Winter Conference on Applications of Computer Vision (WACV) (2018), Lake Tahoe, NV, USA, 12–15 March 2018. [Google Scholar] [CrossRef]
  36. Peng, D.; Chen, X.; Yin, Y.; Lu, K.; Yang, W.; Tang, Y.; Wang, Z. Lodging resistance of winter wheat (Triticum aestivum L.): Lignin accumulation and its related enzymes activities due to the application of paclobutrazol or gibberellin acid. Field. Crop. Res. 2014. [Google Scholar] [CrossRef]
  37. Pinthus, M.J. Lodging in Wheat, Barley, and Oats: The Phenomenon, its Causes, and Preventive Measures. Adv. Agron. 1974. [Google Scholar] [CrossRef]
  38. Weibel, R.O.; Pendleton, J.W. Effect of Artificial Lodging on Winter Wheat Grain Yield and Quality (AJ). Agron. J. 1964, 48, 452–455. [Google Scholar] [CrossRef]
  39. Fischer, R.A.; Stapper, M. Lodging effects on high-yielding crops of irrigated semidwarf wheat. Field. Crop. Res. 1987, 17, 245–258. [Google Scholar] [CrossRef]
  40. Berry, P.M.; Sterling, M.; Spink, J.H.; Baker, C.J.; Sylvester-Bradley, R.; Mooney, S.J.; Tams, A.R.; Ennos, A.R. Understanding and Reducing Lodging in Cereals. Adv. Agron. 2004, 84, 215–269. [Google Scholar]
  41. Briggs, K.G. Several Six-Row Barley Cultivars. AGRIS 1990, 181, 173–181. [Google Scholar] [CrossRef]
  42. Grant, B.L. Types of Plant Lodging: Treating Plants Affected by Lodging. Available online: https://www.gardeningknowhow.com/edible/vegetables/vgen/plants-affected-by-lodging.htm/?print=1&loc=top (accessed on 28 January 2019).
  43. Susko, A.Q.; Gilbertson, F.; Heuschele, D.J.; Smith, K.; Marchetto, P. An automatable, field camera track system for phenotyping crop lodging and crop movement. HardwareX 2018, 4. [Google Scholar] [CrossRef]
  44. Liu, T.; Li, R.; Zhong, X.; Jiang, M.; Jin, X.; Zhou, P.; Liu, S.; Sun, C.; Guo, W. Estimates of rice lodging using indices derived from UAV visible and thermal infrared images. Agric. For. Meteorol. 2018, 252, 144–154. [Google Scholar] [CrossRef]
  45. Yang, M.D.; Huang, K.S.; Kuo, Y.H.; Tsai, H.; Lin, L.M. Spatial and spectral hybrid image classification for rice lodging assessment through UAV imagery. Remote Sens. 2017, 9, 583. [Google Scholar] [CrossRef]
  46. Murakami, T.; Yui, M.; Amaha, K. Canopy height measurement by photogrammetric analysis of aerial images: Application to buckwheat (Fagopyrum esculentum Moench) lodging evaluation. Comput. Electron. Agric. 2012, 89, 70–75. [Google Scholar] [CrossRef]
  47. Chapman, S.; Merz, T.; Chan, A.; Jackway, P.; Hrabar, S.; Dreccer, M.; Holland, E.; Zheng, B.; Ling, T.; Jimenez-Berni, J. Pheno-Copter: A Low-Altitude, Autonomous Remote-Sensing Robotic Helicopter for High-Throughput Field-Based Phenotyping. Agronomy 2014, 4, 279–301. [Google Scholar] [CrossRef] [Green Version]
  48. Michael, P.M. Predicting Lodging in Winter Wheat. Ph.D. Thesis, University of Nottingham, Nottingham, UK, 1998. [Google Scholar]
  49. Simko, I.; Piepho, H.P. Combining phenotypic data from ordinal rating scales in multiple plant experiments. Trends Plant Sci. 2011, 16, 235–237. [Google Scholar] [CrossRef] [PubMed]
  50. Wilke, N.; Siegmann, B.; Burkard, A.; Klingbeil, L.; Rascher, U. Quantifizierung der Ährenanzahl mittels UAV gestützter Bildaufnahmen. Wissenschaftlich-Technische Jahrestagung der DGPF und PFGK18 Tagung in München 2018, 38, 274–284. [Google Scholar]
  51. Burkart, A.; Aasen, H.; Alonso, L.; Menz, G.; Bareth, G.; Rascher, U. Angular dependency of hyperspectral measurements over wheat characterized by a novel UAV based goniometer. Remote Sens. 2015, 7, 725–746. [Google Scholar] [CrossRef]
  52. Bláha, M.; Eisenbeiss, H.; Grimm, D.; Limpach, P. Direct georeferencing of uavs. ISPRS Int. Arch. Photogramm. Remote Sens. Spat. Inf. Sci. 2012. [Google Scholar] [CrossRef]
  53. Agisoft, L.L.C. Agisoft Agisoft PhotoScan User Manual. Available online: http://www. agisoft. ru/pscan/help/en/pscan_pro. pdf (accessed on 3 May 2011).
  54. Lowe, D.G. Distinctive image features from scale-invariant keypoints. Int. J. Comput. Vis. 2004, 60, 91–110. [Google Scholar] [CrossRef]
  55. Kersten, T.P. Auf Knopfdruck–Auswertung und Resultate UAV-gestützter Bildflugdaten. UAV 2016-Vermessung Mit Unbemannten Flugsystemen Schriftenr. Des DVW 2016, 82, 135–158. [Google Scholar]
  56. Westoby, M.J.; Brasington, J.; Glasser, N.F.; Hambrey, M.J.; Reynolds, J.M. ‘Structure- from- Motion’ photogrammetry: A low- cost, effective tool for geoscience applications. Geomorphology 2012, 179, 300–314. [Google Scholar] [CrossRef]
  57. Danielgm.net CloudCompare: 3D Point Cloud and Mesh Processing Software, Open Source Project. Available online: http://www.danielgm.net/cc/ (accessed on 3 December 2018).
  58. Land NRW: Datenlizenz Deutschland - Namensnennung - Version 2.0. Available online: www.govdata.de/dl-de/by-2-0 (accessed on 3 January 2019).
  59. Jackson, R.D.; Hatfield, J.L.; Reginato, R.J.; Idso, S.B.; Pinter, P.J. Estimation of daily evapotranspiration from one time-of-day measurements. Agric. Water Manag. 1983. [Google Scholar] [CrossRef]
  60. Navabi, A.; Iqbal, M.; Strenzke, K.; Spaner, D. The relationship between lodging and plant height in a diverse wheat population. Can. J. Plant Sci. 2006, 86, 723–726. [Google Scholar] [CrossRef] [Green Version]
Figure 1. (a) Experimental site 1, consisting of small breeder plots with three summer barley cultivars and two sowing densities. Representative images of three barley varieties 61 days after sowing (DAS); (b) genotype HOR 3939, characterized by sparser vegetation cover and small soil gaps; (c) HOR 9707, characterized by a closed canopy with fewer gaps; and (d) HOR 21770, characterized by a closed and dense canopy without any gaps.
Remotesensing 11 00515 g001
Figure 2. Overall flowchart of software products used in this study for data processing and evaluation of the spatial assessment of canopy height, lodging percentage, and lodging severity. UAV = unmanned aerial vehicle; GIS = geographic information system; DTM = digital terrain model; CHM = canopy height model; ROI = region of interest.
Remotesensing 11 00515 g002
Figure 3. Visualization of CHM (m) for selected barley plots in side view (left) and nadir top view (right).
Remotesensing 11 00515 g003
Figure 4. (a) High-resolution red/green/blue (RGB) orthomosaic used for manual validation of areas affected by lodging. (b) Calculated CHM (m) in the region of interest. (c) Binary image calculated based on 70% lodging percentage threshold (70LPT) with areas affected (dark red) and not affected (green) by lodging.
Remotesensing 11 00515 g004
Figure 5. Scatter plots of (a) average canopy height 61 days after sowing (DAS) and (b) lodging percentage (70LPT) 75 DAS derived from UAV- and DTM-based ground models of experimental site 1. Black line represents regression line with 95% confidence interval; blue line represents 1:1 line.
Remotesensing 11 00515 g005
Figure 6. RGB images of barley plots showing different types (ad) of lodging (top) and corresponding lodging severity derived from the CHM (middle), as well as canopy height distributions with visualization of different lodging percentage thresholds (LPTs) (bottom).
Remotesensing 11 00515 g006
Figure 7. Scatter plots of manually determined lodging percentage and calculated UAV-based lodging percentage for (a) 80LPT, (b) 70LPT, (c) 60LPT, and (d) 50LPT as well as lodging severity parameters (e) ALS and (f) WALS 75 DAS. Black line represents regression line with 95% confidence interval; blue line represents 1:1 line (n = 36). LPT: lodging percentage threshold; ALS: average lodging severity; WALS: weighted average lodging severity, RMSE: root mean square error.
Remotesensing 11 00515 g007
Figure 8. Experimental site 2: (a) Conventional farmer field 1.5 hectare in size and (b) Result of WALS determination (0.54 cm GSD) 258 D AS.
Remotesensing 11 00515 g008
Table 1. Assessment of UAV lodging percentage (70LPT) derived from UAV- and DTM-based ground models in comparison to reference data for experimental site 2 258 DAS. UAV: Unmanned aerial vehicle; LPT: lodging percentage threshold; DTM: Digital Terrain Model; DAS: Days after sowing.
Lodging Percentage (%)
UAV-Based Ground ModelDTM-Based Ground ModelReference Data
71.8175.0670.27
Table 2. Comparison of UAV CH and reference measurement 61 DAS (n = 24). SD, standard deviation.
GenotypeSowing DensityMedian and SD (m)Discrepancy between Reference Measurements and UAV CH (m)
Reference MeasurementsUAV CH
HOR 3939Low0.96 ± 0.020.67 ± 0.08(−) 0.29
HOR 97071.00 ± 0.040.92 ± 0.05(−) 0.08
HOR 217700.93 ± 0.020.90 ± 0.05(−) 0.03
HOR 3939High0.94 ± 0.050.76 ± 0.06(−) 0.18
HOR 97071.02 ± 0.030.99 ± 0.04(−) 0.03
HOR 217700.93 ± 0.010.92 ± 0.01(−) 0.01
Table 3. Overview of MAXCH, UAV lodging percentage for four LPTs (80%, 70%, 60%, 50%), ALS and WALS, and manually determined lodging percentage reference data for different sowing densities and genotypes 75 DAS (n = 36). MAXCH, maximum canopy height; LPT: lodging percentage threshold; WALS: weighted average lodging severity; ALS: average lodging severity.
GenotypeSowing DensityMAXCH (m)Lodging Percentage (%)Lodging Severity (%)
80 LPT70 LPT60 LPT50 LPTReference DataWALSALS
HOR 3939Low0.7274.7059.9441.7420.7653.9743.6649.29
HOR 97070.7984.9070.5454.3534.4870.5455.8461.07
HOR 217701.1244.5926.8616.219.7724.8120.7624.35
HOR 3939High0.6694.5286.9073.0050.1077.2771.5376.13
HOR 97070.6898.1092.8680.9458.4473.2878.4982.58
HOR 217701.0392.4585.7578.3069.3780.9079.0781.47
Table 4. Comparison of lodging percentage reference data with UAV-based lodging percentage for four LPTs (80%, 70%, 60%, 50%) and UAV lodging severity for image datasets with different spatial resolutions. GSD, ground sample distance.
GSD (cm)Lodging Percentage (%)Lodging Severity (%)Reference Data
80LPT70LPT60LPT50LPTWALSALS
0.5488.8371.8166.6964.7570.6173.0270.27
1.0989.7978.0468.1164.3672.3875.08
1.5787.3578.5173.0568.6074.9576.88

