An Adaptive Denoising and Detection Approach for Underwater Sonar Image


1
College of Computer Science and Technology, Harbin Engineering University, Harbin 150001, China
2
Acoustic science and Technology laboratory, Harbin Engineering University, Harbin 150001, China
3
College of Underwater Acoustic Engineering, Harbin Engineering University, Harbin 150001, China
4
Key Laboratory of Marine Information Acquisition and Security, Harbin Engineering University, Harbin 150001, China
5
Institute of Acoustics, Chinese Academy of Science, Beijing 100190, China
*
Author to whom correspondence should be addressed.
Remote Sens. 2019, 11(4), 396; https://doi.org/10.3390/rs11040396
Submission received: 14 January 2019
/
Revised: 9 February 2019
/
Accepted: 12 February 2019
/
Published: 15 February 2019
(This article belongs to the Special Issue Radar and Sonar Imaging and Processing)
Abstract
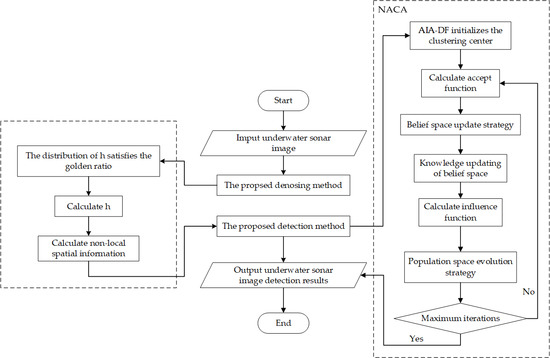
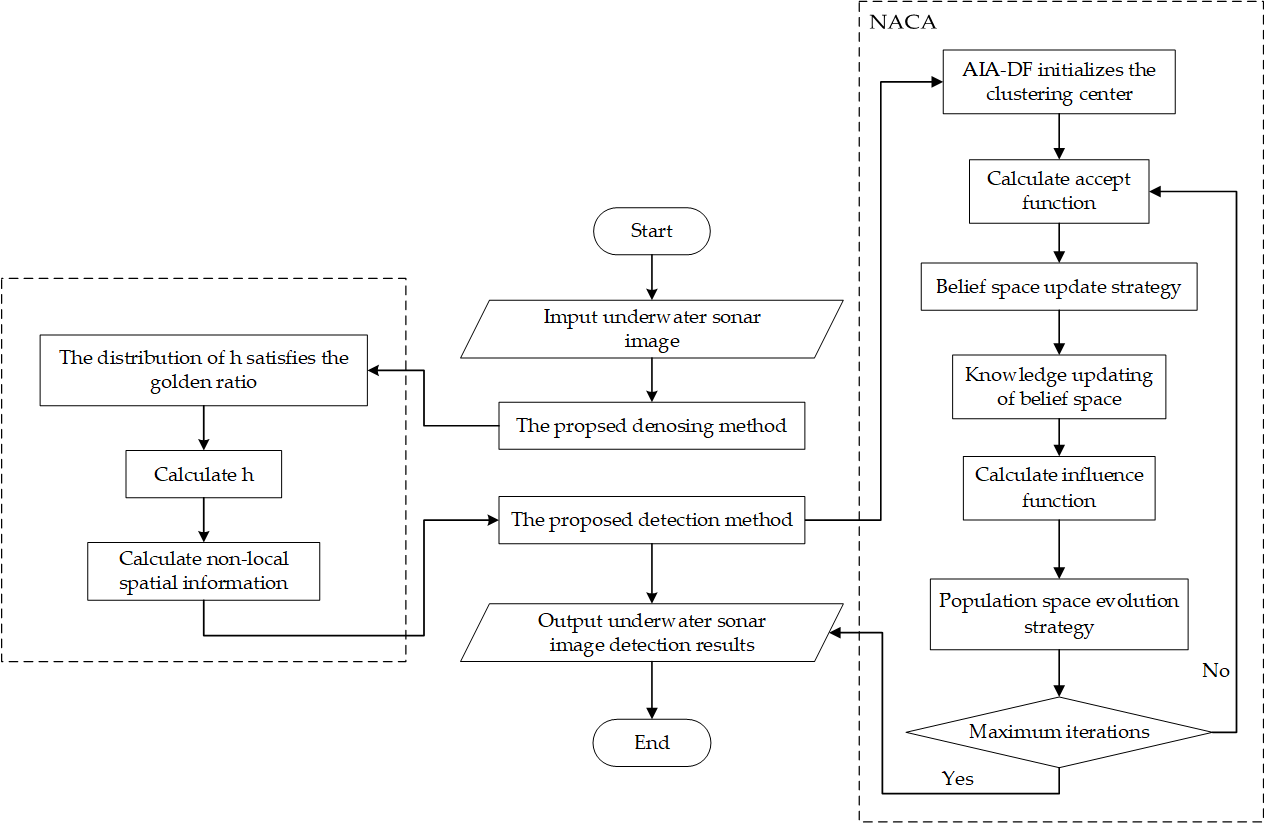
:An adaptive approach is proposed to denoise and detect the underwater sonar image in this paper. Firstly, to improve the denoising performance of non-local spatial information in the underwater sonar image, an adaptive non-local spatial information denoising method based on the golden ratio is proposed. Then, a new adaptive cultural algorithm (NACA) is proposed to accurately and quickly complete the underwater sonar image detection in this paper. Concretely, NACA has two improvements. In the first place, to obtain better initial clustering centres, an adaptive initialization algorithm based on data field (AIA-DF) is proposed in this paper. Secondly, in the belief space of NACA, a new update strategy is adopted to update cultural individuals in terms of the quantum-inspired shuffled frog leaping algorithm (QSFLA). The experimental results show that the proposed denoising method in this paper can effectively remove relatively large and small filtering degree parameters and improve the denoising performance to some extent. Compared with other comparison algorithms, the proposed NACA can converge to the global optimal solution within small epochs and accurately complete the object detection, having better effectiveness and adaptability.
1. Introduction
With the development of sonar imaging technology, the underwater sonar image detection technology has been extensively used in marine exploration, research, and investigation [1]. The underwater sonar image must be detected in different regions including object-highlight, sea-bottom-reverberation, and shadow before the underwater object can be recognized. [2]. With the help of the underwater sonar image detection technology, we can accurately detect the above regions and effectively retain the underwater sonar image details [3]. However, because of the complexity of the underwater environment, the underwater sonar image is easily affected by the reverberation effect, strong speckle noise, fuzzy edge, and weak texture information [4]. Therefore, before the underwater sonar image detection, the denoising algorithm can be adopted to maximize noise removal.
The spatial-based method has been widely used in image processing. For cartoon components in the image fusion method, a proper spatial-based method is presented for morphological structure preservation [5]. To mitigate the boundary seams produced by spatial domain methods, a non-local means filtering is introduced on the final decision maps to generate the fusion weight maps for each of the source images [6]. In the image denoising method, the spatial information mainly includes local spatial information and non-local spatial information. Compared with the disadvantage that local spatial information only uses a single neighborhood information, non-local spatial information can utilize multiple similar neighborhood information in subregions. Therefore, the non-local spatial information makes full use of the image, which is more conducive to image denoising. The filtering degree parameter is a significant parameter. It is intensively related to denoising results [7]. The relatively large filtering degree parameter will cause the loss of some image detail information, especially the image edge information. On the contrary, the relatively small filtering degree parameter will mean that the image noise cannot be effectively eliminated. Therefore, how to select the appropriate filtering degree parameter is a challenging problem. To select the appropriate filtering degree parameter, a selection method based on the image noise level was proposed. In this method, filtering degree parameters were a single value [8]. In order to get over the disadvantage that the single filtering degree parameters are sensitive to the noise, another selection method on the basis of the statistical characteristic in the search window was proposed [9]. However, when the search window is small, the denoising ability of the non-local spatial information will be greatly reduced. Furthermore, the idea of threshold was introduced to remove the abnormal parameters and select the appropriate filtering degree parameters [7]. Nevertheless, the two thresholds are fixed values and only refer to one underwater sonar image. Different underwater sonar images have different filtering parameter distribution characteristics. Therefore, in some cases, the relatively large and small filtering degree parameters cannot be effectively removed.
Various techniques are widely used in the underwater sonar image detection. The Fuzzy clustering algorithm is used for underwater sonar image detection [10]. However, this detection algorithm is susceptible to noise. The Markov algorithm is proposed for underwater sonar image detection [11,12]. Although the detection results were satisfactory, the processing procedure was quite complicated and computationally costly. Later, a promising and multiphase detection framework related to the level set was developed [13], the key idea of which was to minimize the energy with the local mean. However, this framework was not suitable for the detection of underwater sonar images in the presence of speckle noise. To obtain better detection results, a large number of improved algorithms were proposed. Active contours were introduced in the level set method [14,15]. In this case, Markov random field and the level set are combined to extract the features from the underwater sonar image [2]. The morphological top-hat and bottom-hat transformation were used in the level set [16]. It is conducive to the extraction of underwater objects. Subsequently, an adaptive initialization narrowband Chan-Vese model is proposed and applied to underwater sonar image detection [1].
Over the years, as a framework to solve complex problems, cultural algorithm (CA) is attracting more and more attention [17]. Meanwhile, the intelligent optimization algorithm is also widely used in image processing [18,19] and has achieved good results. In order to further enhance the search ability, many intelligent optimization algorithms are used to improve the cultural algorithm. For accurate selection of business partners, a cultural particle swarm optimization algorithm (CPSO) was proposed can get better options [20]. Quantum-behaved particle swarm optimization (QPSO) was introduced into CA to figure out multi-objective optimization problems [21], which has high efficiency. Then, an adaptive cultural algorithm with improved quantum-behaved particle swarm optimization (ACA-IQPSO) was proposed to solve the problem of the underwater sonar image detection [22], which accurately completes underwater object detection by searching clustering centres. However, because the clustering centres are randomly initialized in the solution space, the situation when the clustering centres are very close can occur to some extent. Therefore, the convergence speed of the algorithm is too slow to complete the underwater sonar image detection accurately within small epochs.
A clustering algorithm is proposed to calculate the clustering centres by the potential entropy of the data field [23]. The comparative experiments have shown that this algorithm can get better clustering results. Nevertheless, it does not take the characteristics of underwater sonar images into account when calculating potential entropy, which is not conducive to the initialization of the clustering centres in the underwater sonar images.
In order to reduce the complexity of the algorithm and enhance the search ability in the process of detection, the idea of the shuffled frog leaping algorithm (SFLA) is used as the belief space update strategy in ACA-IQPSO. However, SFLA is easy to get into the local optimal solution. To make the population more diverse and improve the search ability, Quantum computing theory is used to improve SFLA [24]. A quantum-inspired shuffled frog leaping algorithm combining the new search mechanism (QSFLA-NSM) is proposed to the underwater sonar image detection [7]. The experimental results of QSFLA-NSM show that it can further enhance population diversity and search ability.
To overcome the drawback of two thresholds in work [7], in this work we proposed an adaptive non-local spatial information denoising method based on the golden ratio. Two thresholds are set adaptively according to the golden radio. Then, NACA is proposed in this paper to accurately detect underwater sonar image. The improvement of the detection algorithm focuses on two aspects: Firstly, inspired by the idea of data field and entropy [23], the AIA-DF is adopted to more accurately calculate the initialization of the clustering centres in this paper to enhance convergence efficiency. The AIA-DF can automatically extract the optimal value of threshold by using the potential entropy of data field from the underwater sonar images dataset. Subsequently, the threshold from the data field can adaptively initialize the clustering centres. Secondly, in the belief space, to improve the limitations of the update strategy, a new update strategy is used to update the cultural individuals in terms of QSFLA.
2. Non-Local Spatial Information Denoising Method
2.1. Non-Local Spatial Information
The underwater sonar image is represented as , is the total number of pixels. is the th pixel. is the non-local spatial information of and can be expressed as:
where represents the search window, its centre is and the radius is . and can be calculated by:
where is the neighborhood window, its centre is the and the radius is . is the vector and represents all the pixels in . is the filtering degree parameter. is defined as:
where is the th pixel in .
can be presented as:
where , . represents the coordinates of the th dimension in .
2.2. Our Proposed Denoising Method—An Adaptive Non-Local Spatial Information Denoising Algorithm Based on the Golden Ratio
is a significant parameter. Its value can powerfully impact the weight of neighborhood configuration in Equation (2) and Equation (3). Therefore, is closely related to the denoising result in the non-local spatial information denoising method. In the process of denoising, too large will cause missing the image detail information. Meanwhile, too small will reduce the denoising performance of non-local spatial information.
In our previous work [7], to select the appropriate , two thresholds and were set to remove the inappropriate . Experimental results showed that this method can effectively remove noise and had certain adaptability. However, it is found that different underwater sonar images have different h distribution characteristics. The two thresholds and are determined only based on one sonar image. In other words, we use the same thresholds for different underwater sonar images denoising. It obviously has limitations.
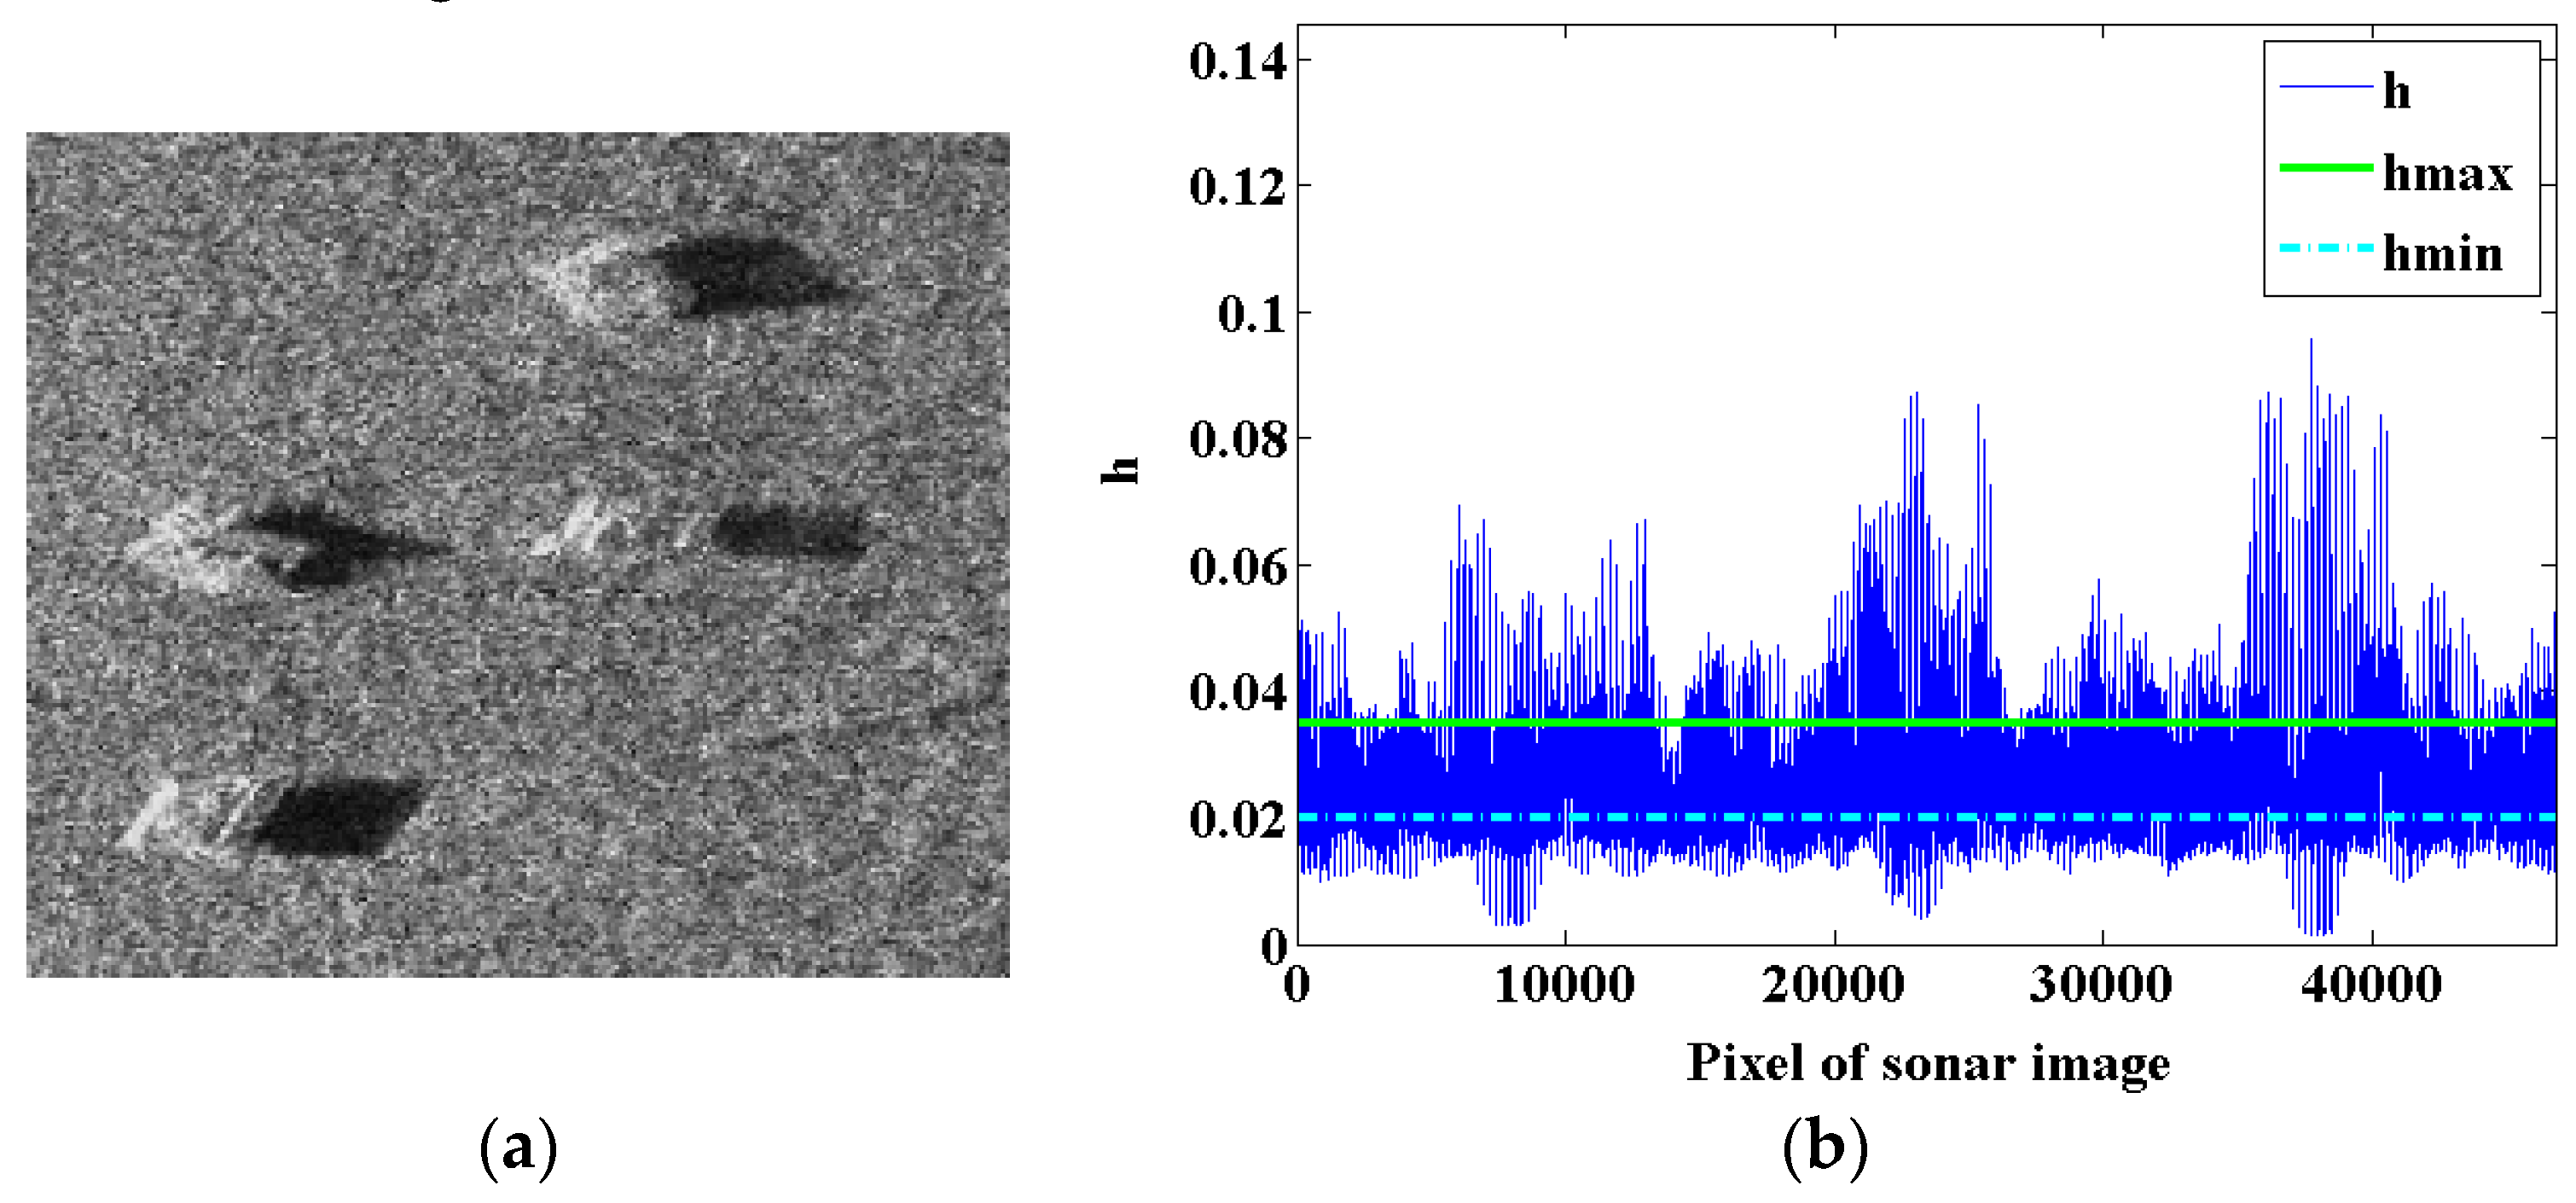
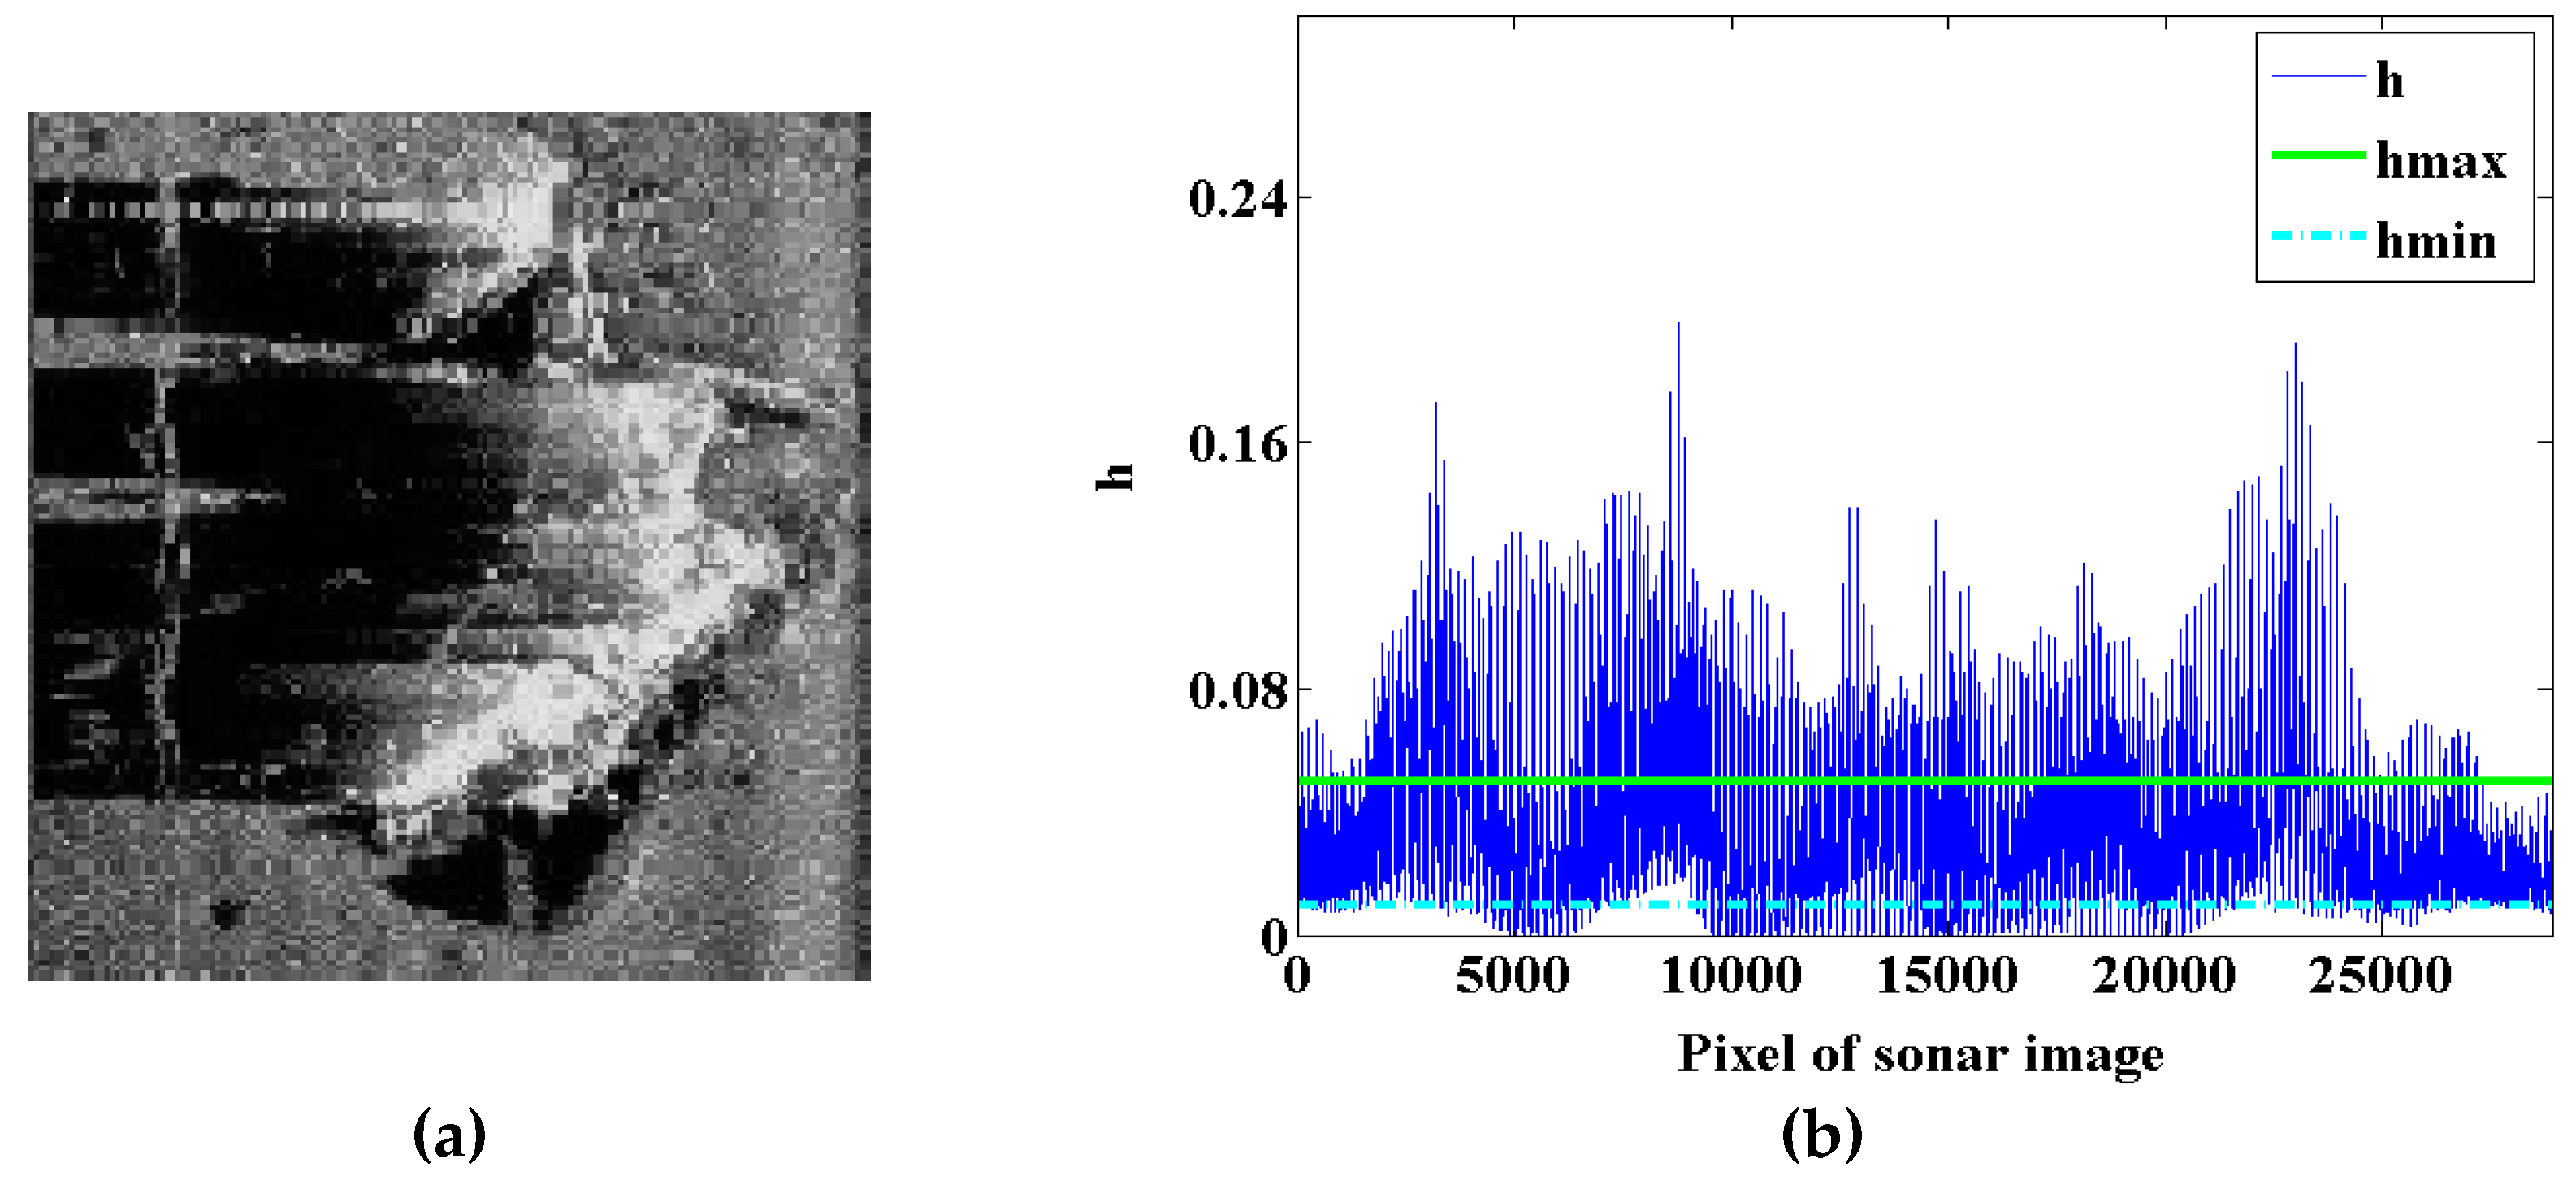
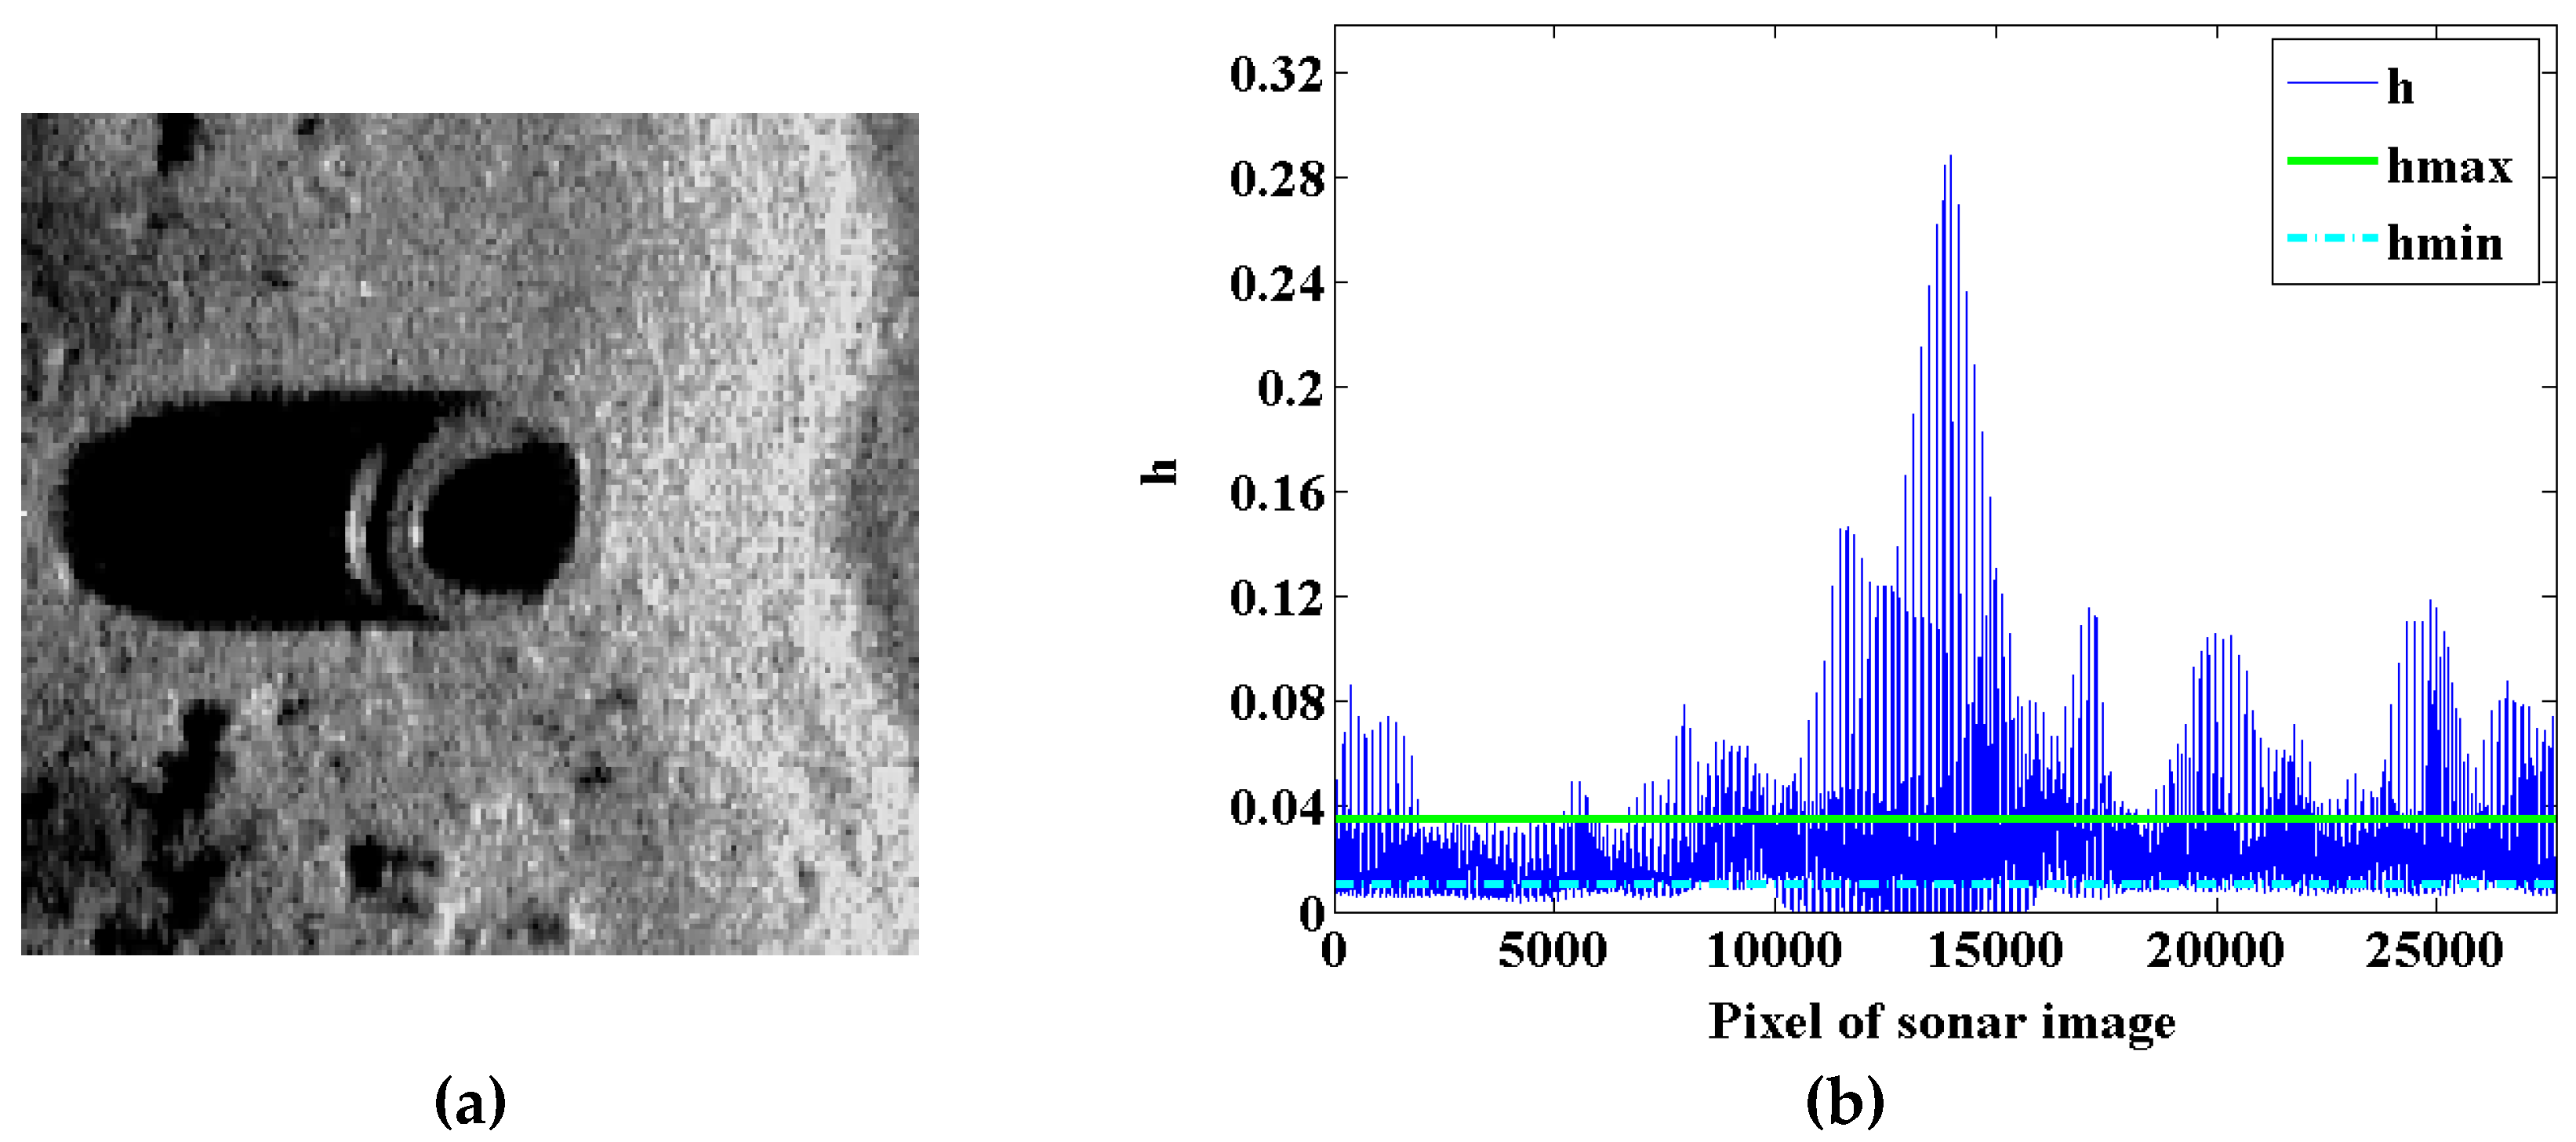
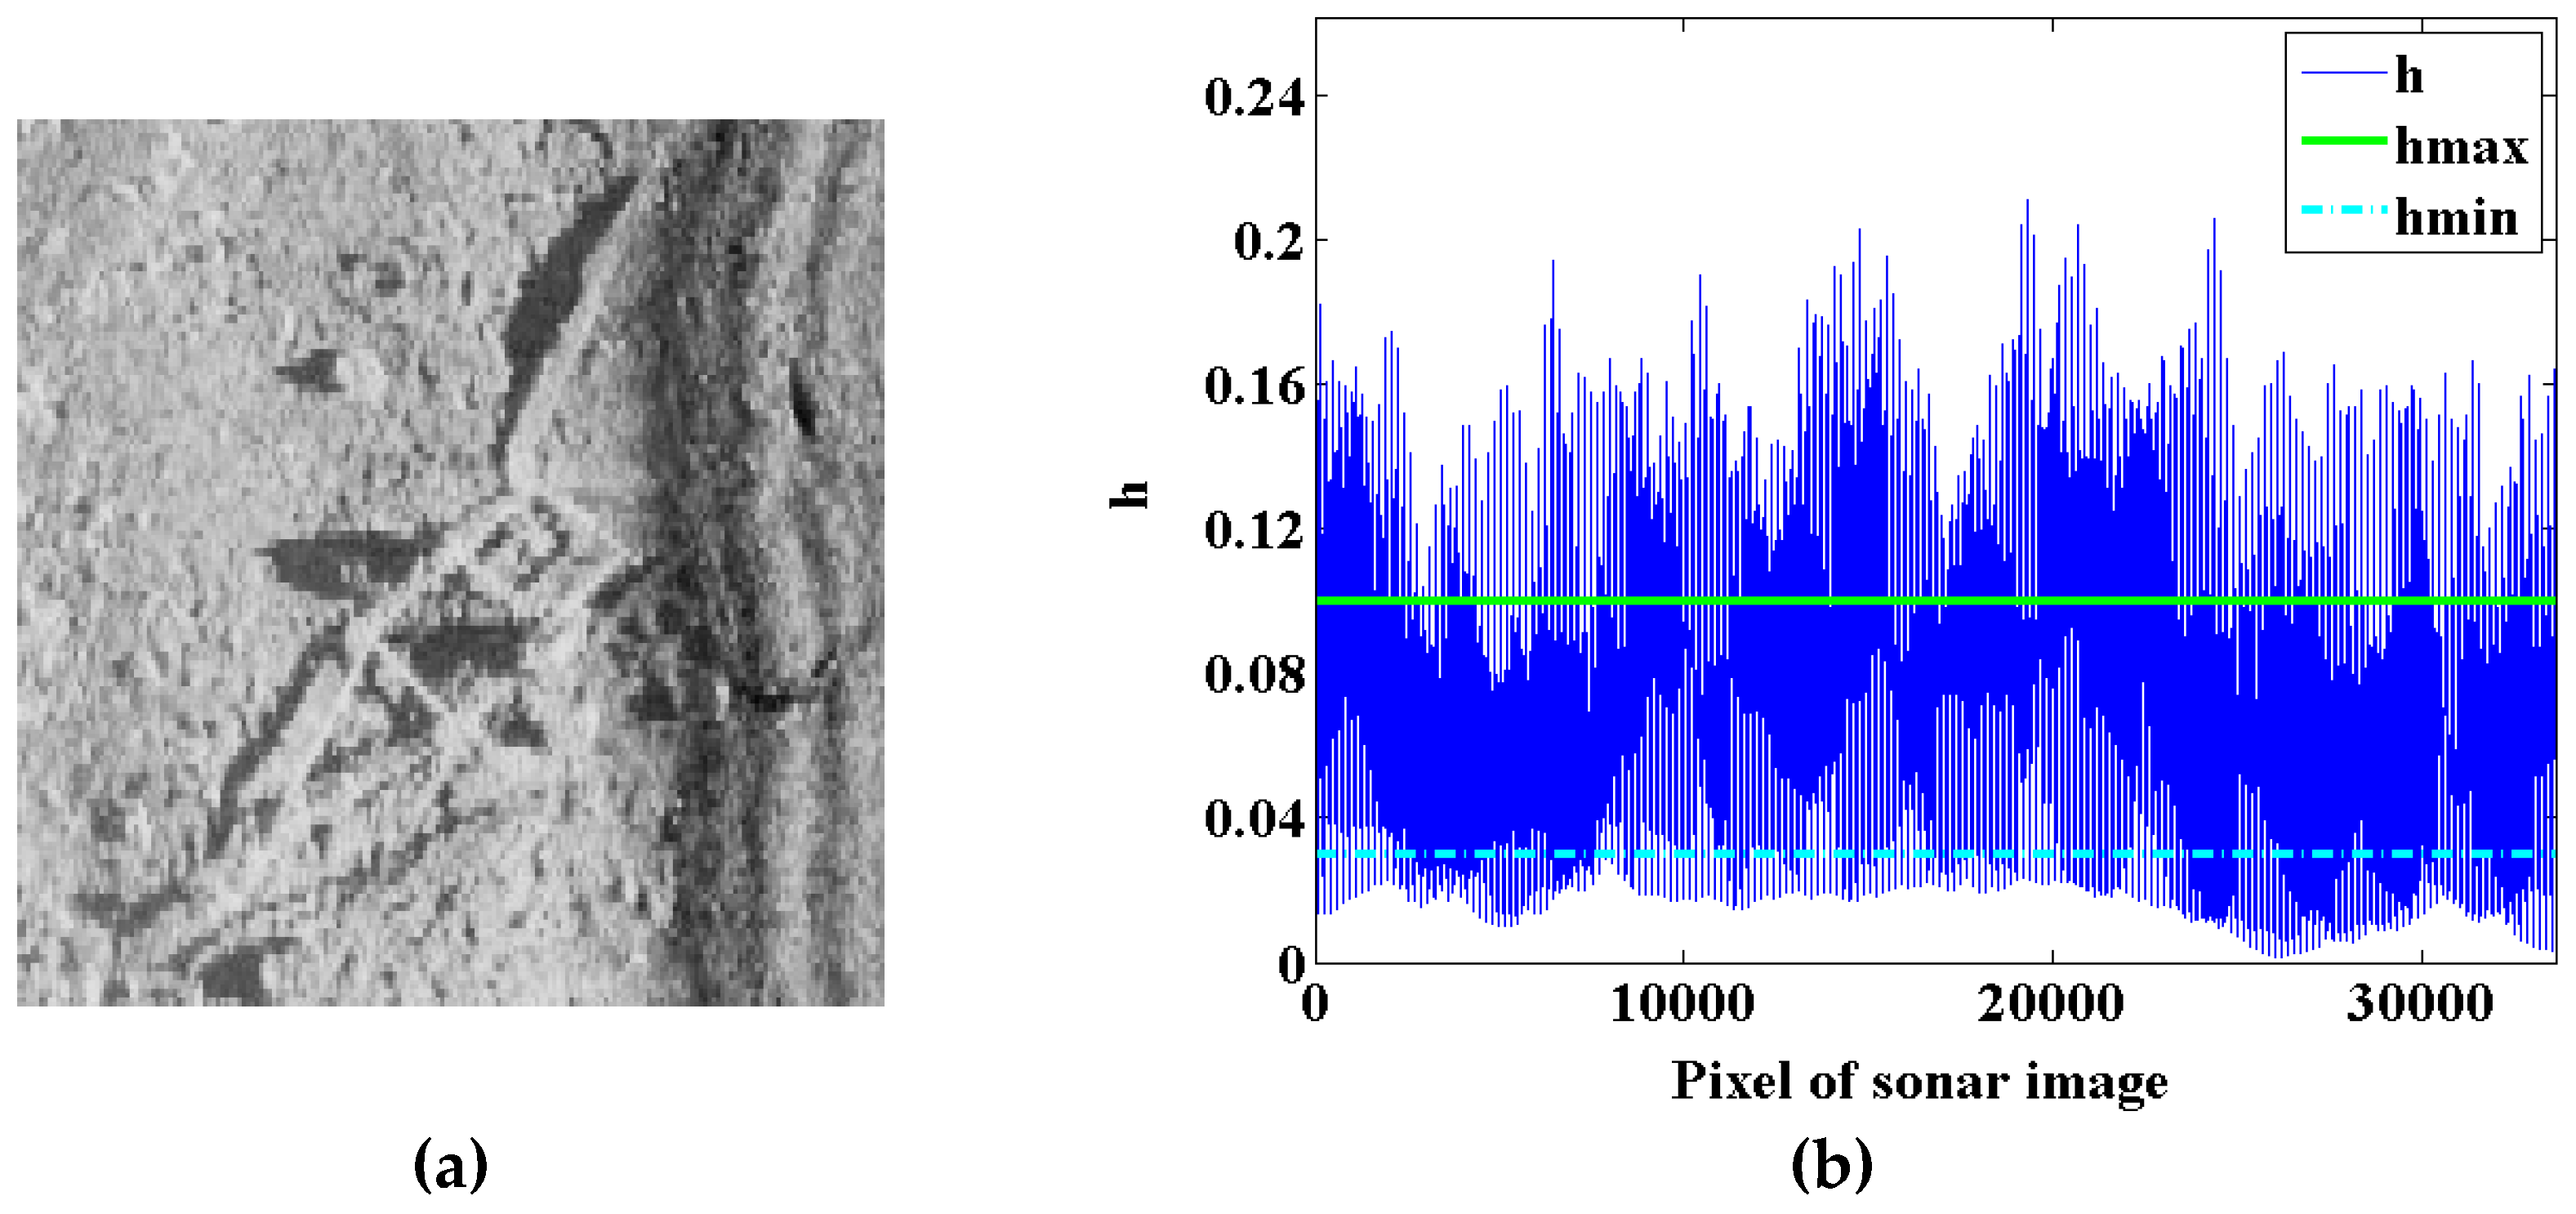
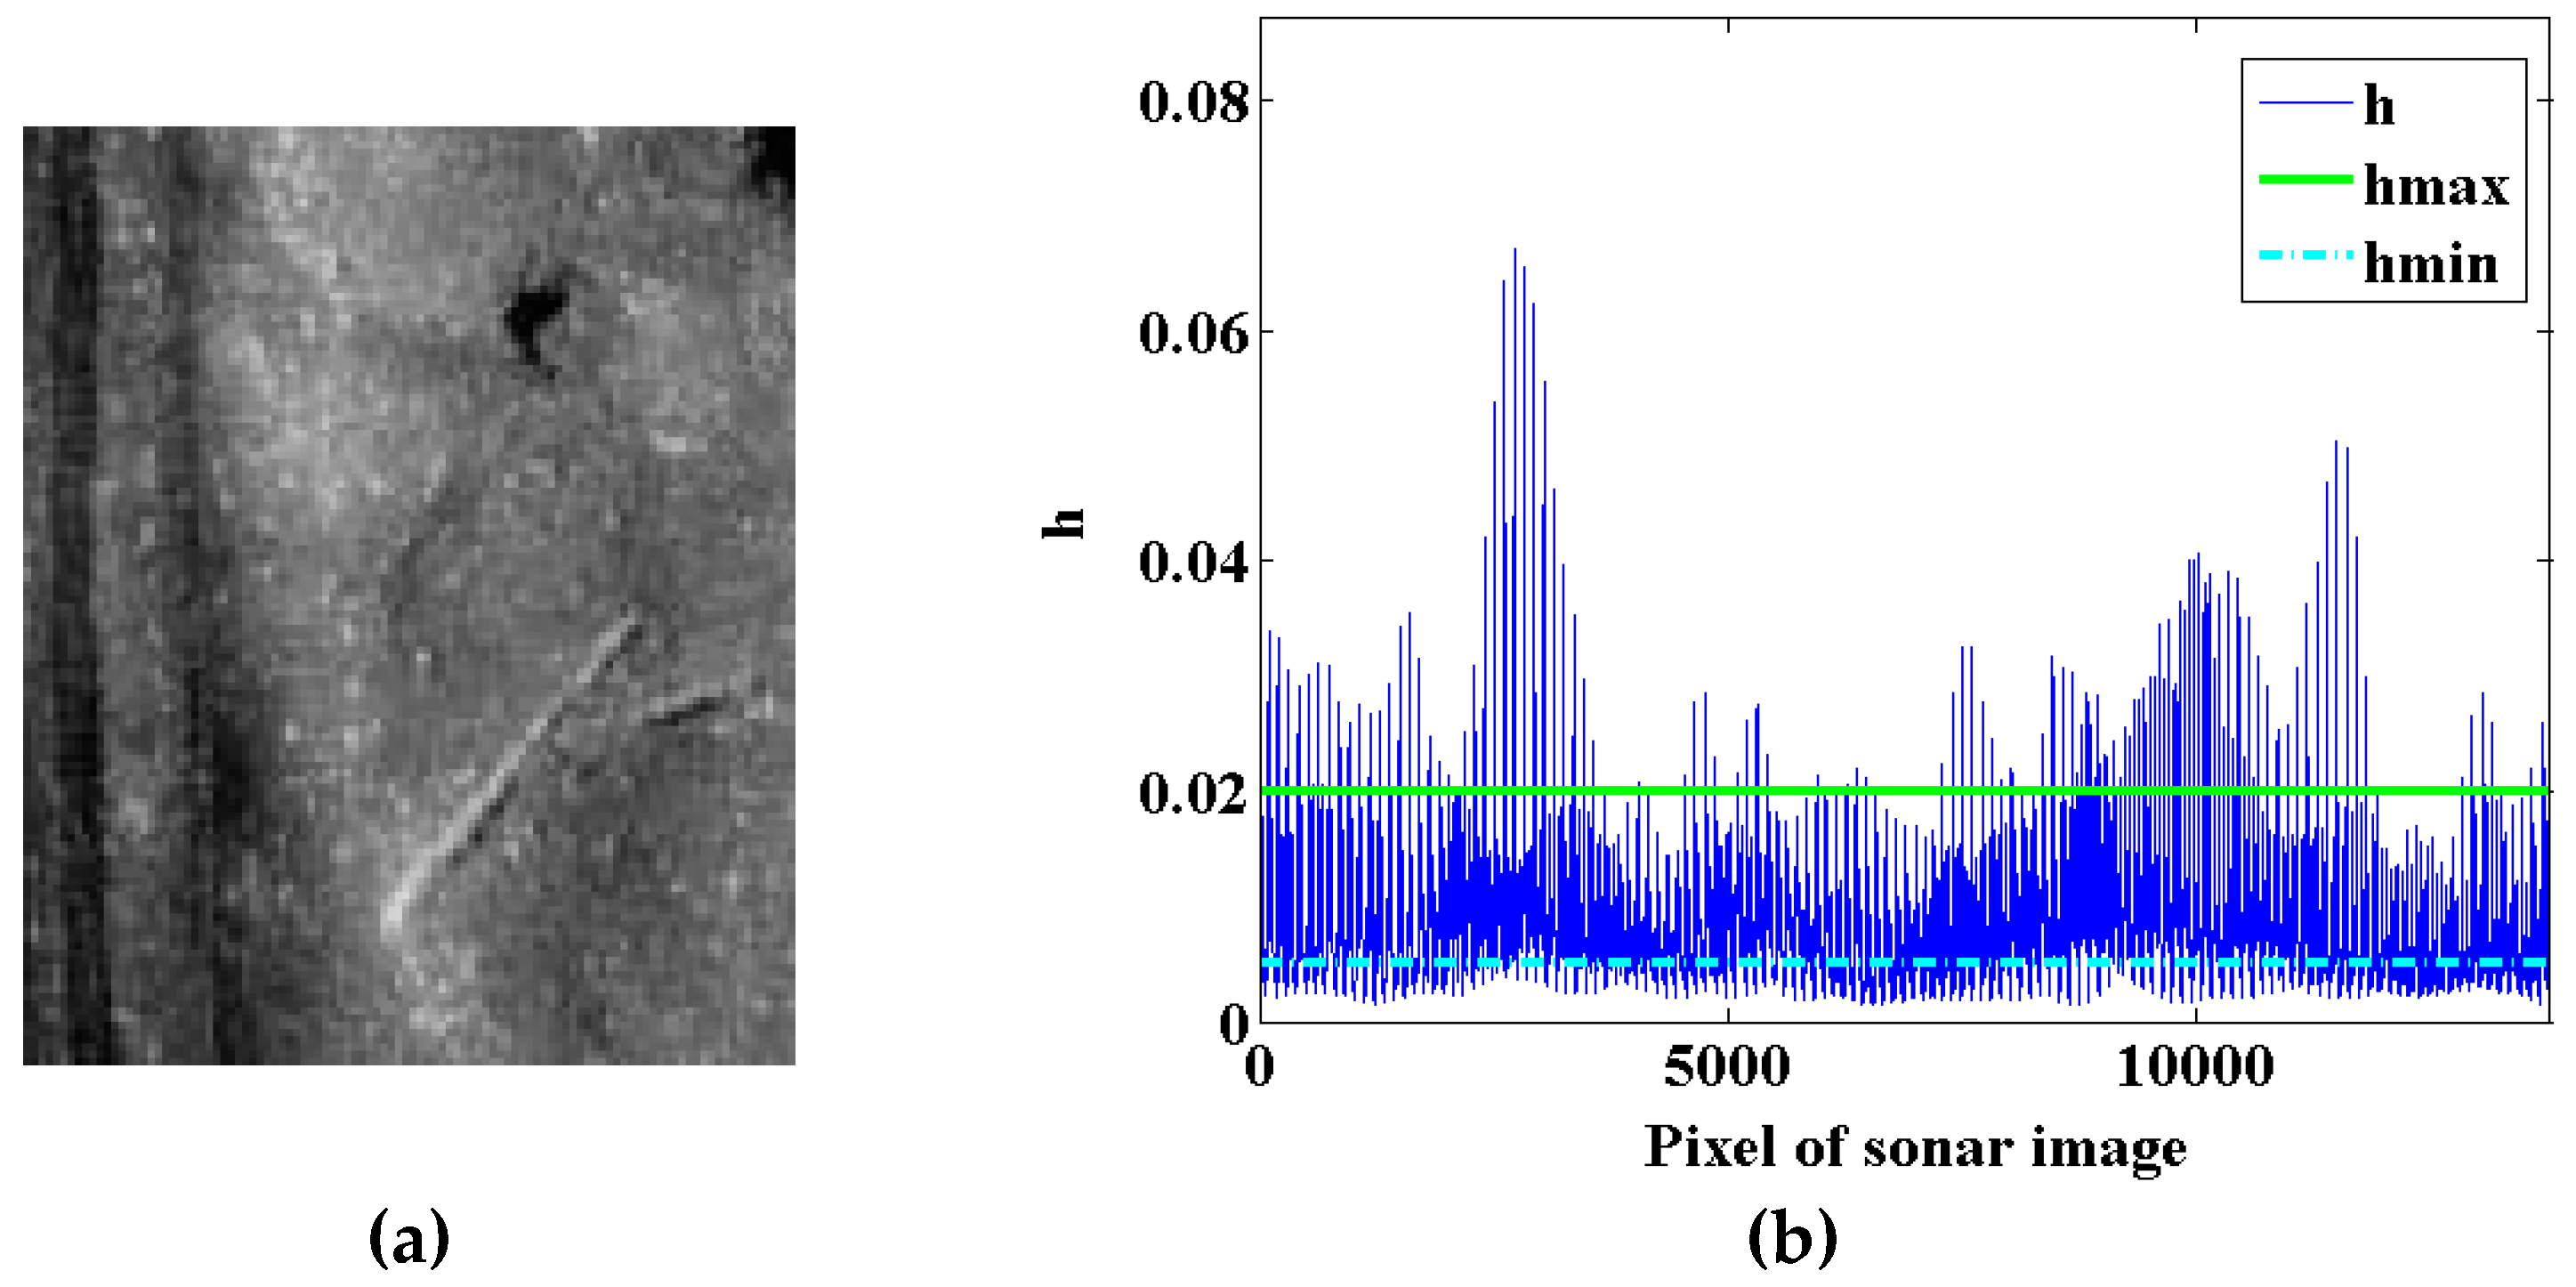
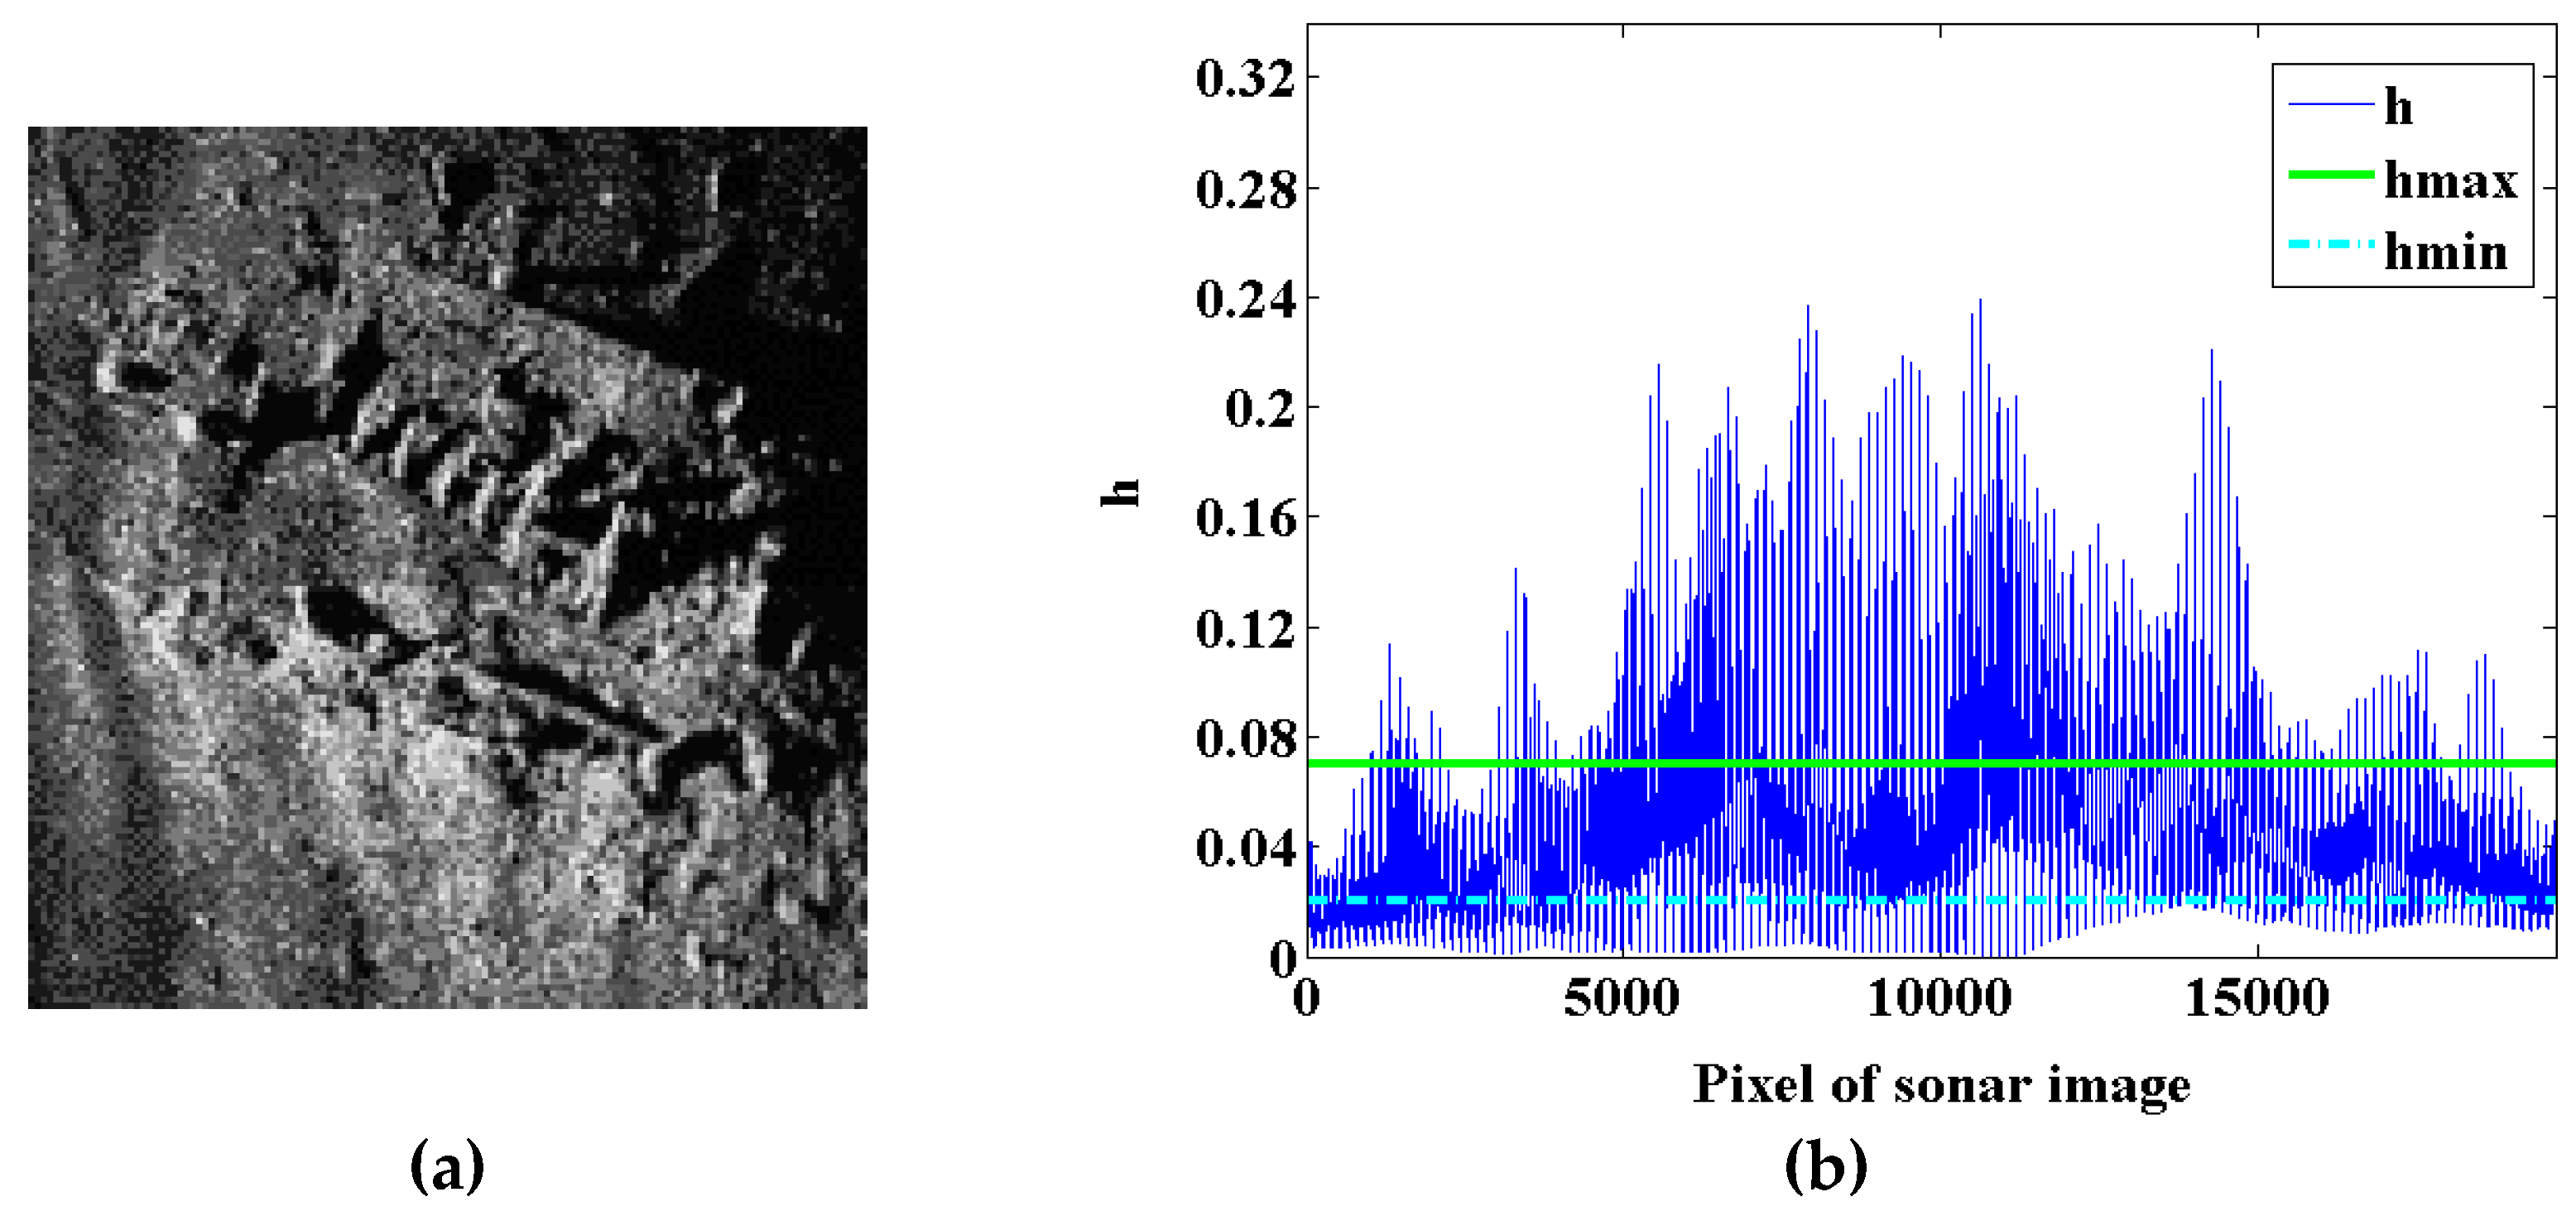
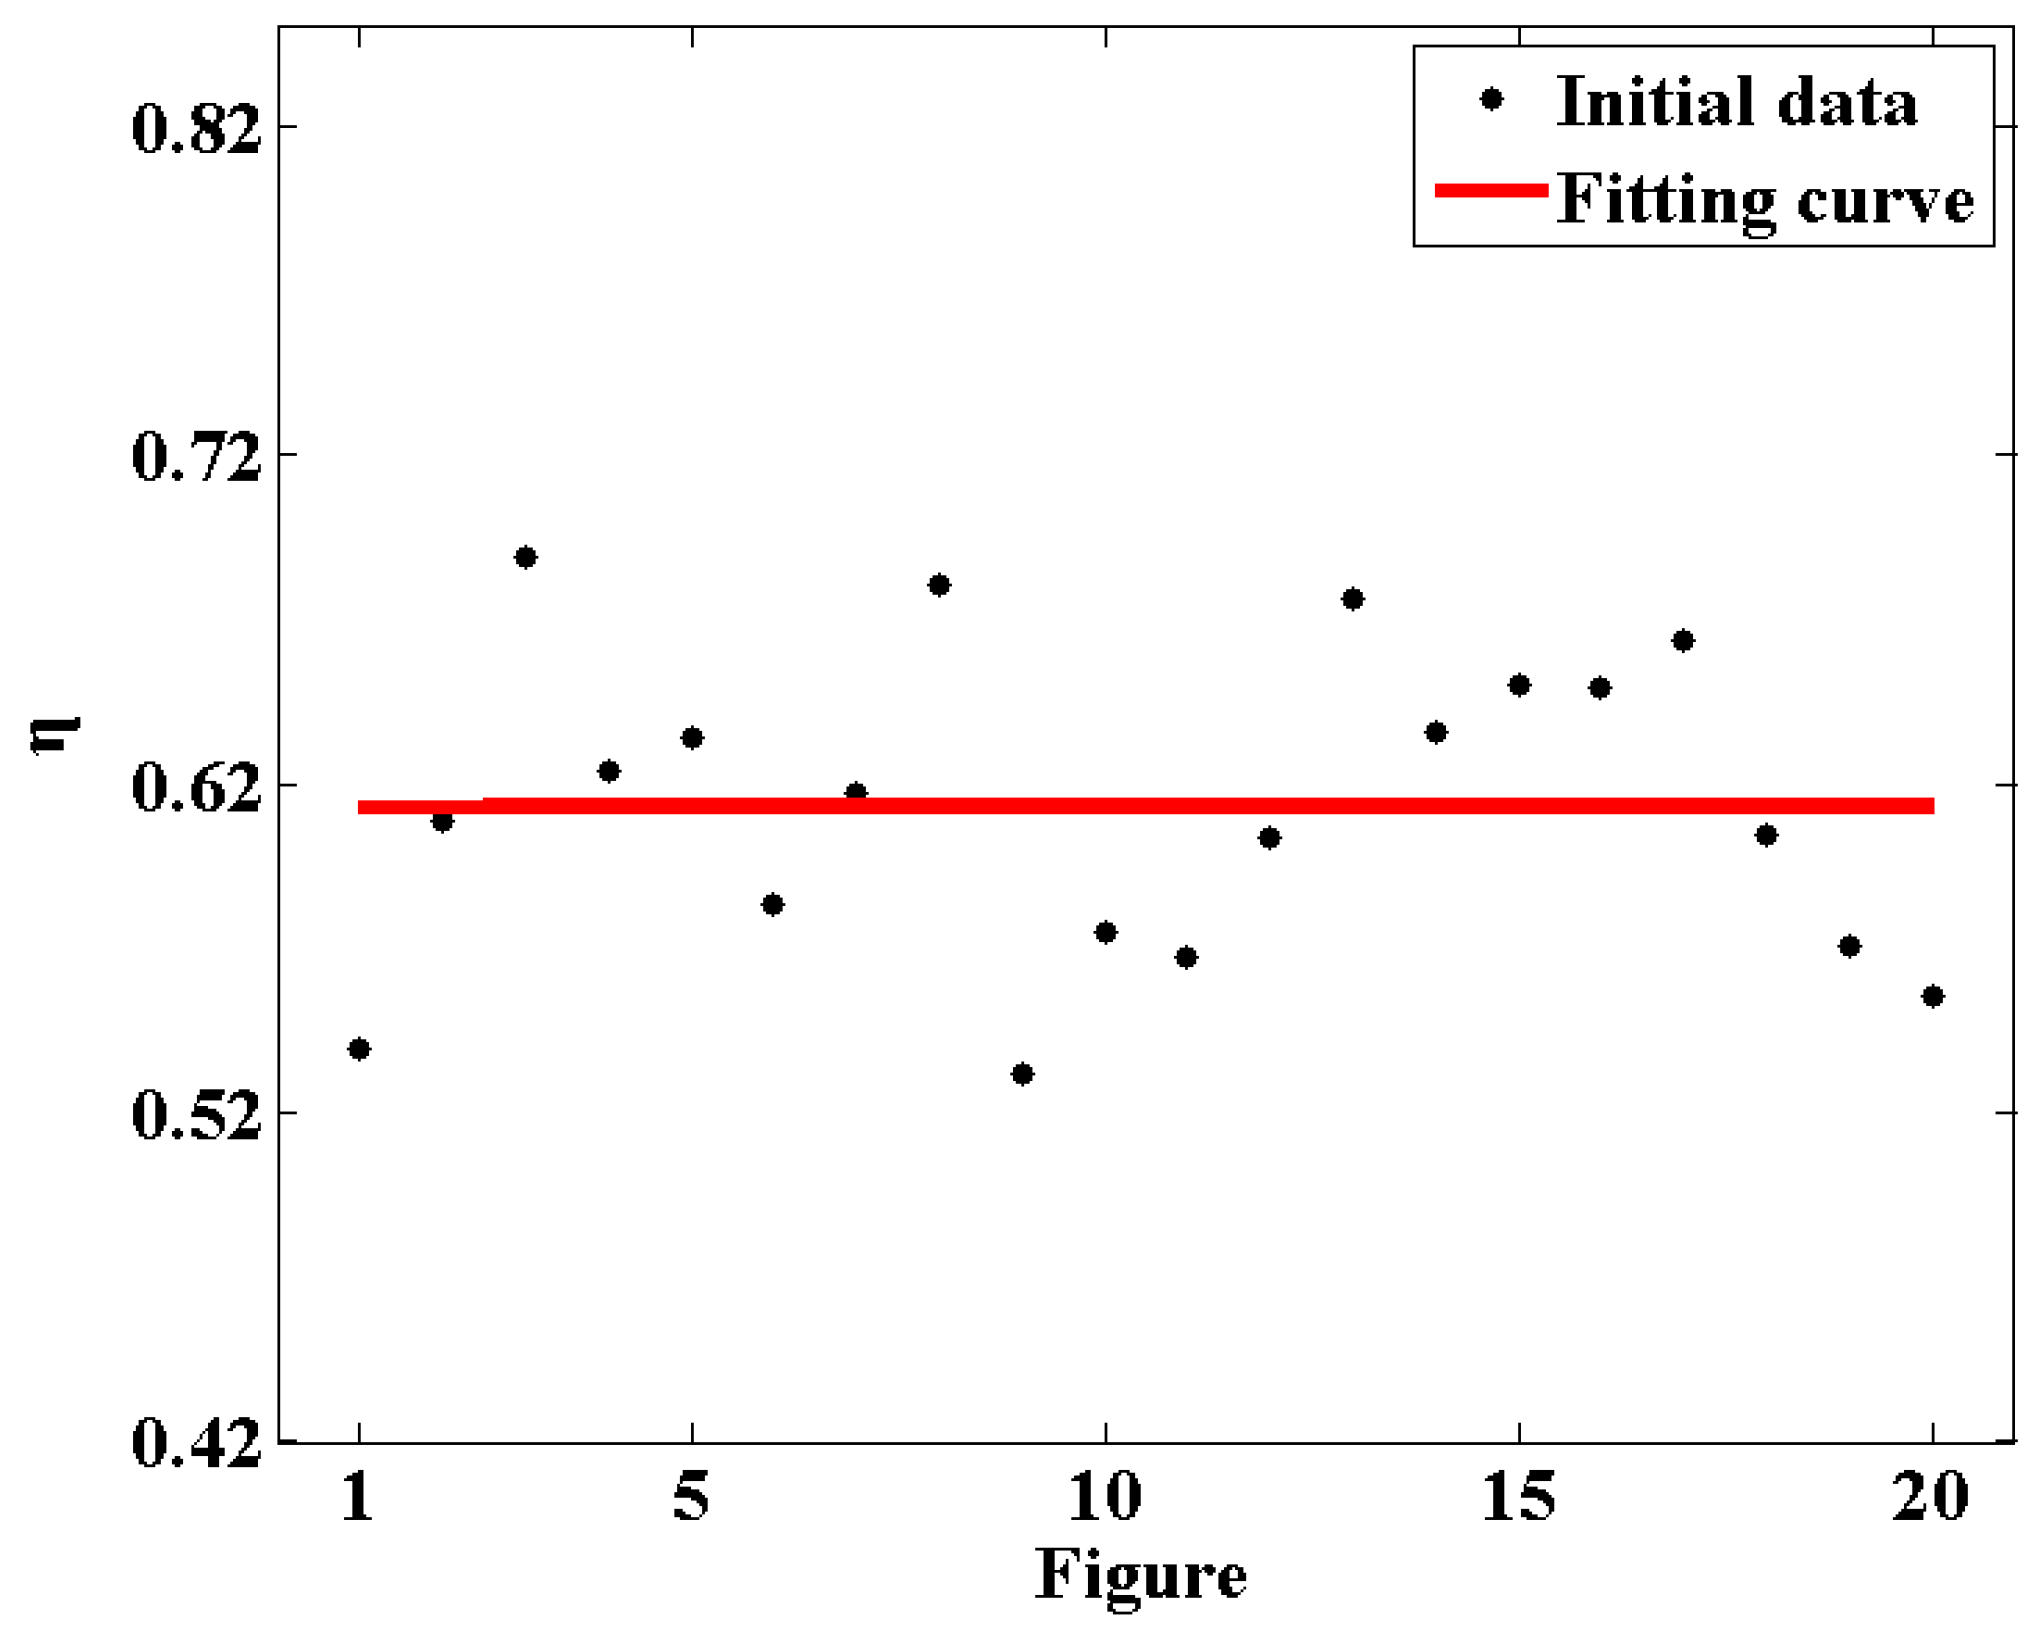
Although the distribution characteristics of h in the different underwater sonar images are different, further experiments show that the proportion of appropriate in the total is approximately the same, which satisfies the golden ratio within a certain error. Based on this discovery, in this paper, we propose an adaptive non-local spatial information denoising method based on the golden ratio which realizes two threshold adaptive settings and removes the underwater sonar image noise more effectively. The statistical law that the proportion satisfies is investigated on 20 different underwater sonar images by calculating the proportion of the within two thresholds in the total . Owing to space constraints, we only show partial results from 20 sonar images. Figure 1, Figure 2, Figure 3, Figure 4, Figure 5 and Figure 6 show the estimated values of the optimal thresholds based on different underwater sonar images.
As seen from Figure 1b, Figure 2b, Figure 3b, Figure 4b, Figure 5b, and Figure 6b, different underwater sonar images have different distribution characteristics of . This means that the estimated optimal thresholds are different. A linear fitting method is used to calculate the proportion satisfies based on different underwater sonar images.
For each underwater sonar image, the set of total is defined as , is the filtering degree parameter corresponding to the th pixel, is the number of the total pixels on the underwater sonar image. The set of within two thresholds is defined as . The ratio of the cardinality of to the cardinality of is defined as:
Table 1 shows the estimated optimal threshold and of 20 different underwater sonar images.
The fitting curve is in Figure 7. It demonstrates that is approximately distributed in the vicinity of 0.613. The statistical law that the proportion satisfies is the golden radio within the range of error permitting. Two thresholds are set adaptively according to the golden ratio to remove too large and small . On this basis, an adaptive non-local spatial information denoising method based on the golden ratio is proposed in this paper to effectively improve the denoising performance.
This is set that less than is defined as and that larger than hmax is defined as . On this basis, the ratio of the cardinality of to the cardinality of is defined as . The ratio of the cardinality of to the cardinality of is defined as . Comparing and with , when the value exceeds the range of error permitting, the two thresholds are constantly updated by the dichotomy. The update process is not finished until the experiment result simultaneously satisfies and . is the range of error permitting. The result of two adaptive thresholds is respectively defined as and .
For the th pixel in the sonar image, is defined as:
The adaptive non-local spatial information denoising method based on the golden ratio is described in Algorithm 1.
| Algorithm 1: the proposed denoising method |
| Input: Original sonar image; |
| Output: Denoising image; |
| Initialization: (the radius of search window), (the radius of neighbourhood window); |
| Procedure: |
| 1: For to do: |
| 2: Calculate using Equation (6); |
| 3: Calculate using Equation (5); |
| 4: For every search window in the input image, do: |
| 5: For any two different neighbourhood windows in the search window, do: |
| 6: Calculate the weighted Euclidean distance using Equation (4); |
| 7: Calculate the filtering degree parameter using Equation (9); |
| 8: Calculate and when the result of Equation (8) satisfies the golden ratio; |
| 9: For every search window in the input image, do: |
| 10: Calculate the filtering degree parameter using Equation (8); |
| 11: Calculate using Equation (3); |
| 12: Calculate using Equation (2); |
| 13: Calculate non-local spatial information using Equation (1). |
3. Culture Algorithm
3.1. Cultural Algorithm Framework
The bilevel evolutionary mechanism in the cultural algorithm mainly includes three elements: the population space, the belief space, and the communication protocol. The communication protocol consists of influence function and accept function. The population space and the belief space are two relatively independent evolutionary and update processes. However, they rely on the influence function and accept function to communicate with each other, manage relevant information, and guide the evolution and update of space. The important feature of the cultural algorithm is the introduction of belief space. The individual evolutionary experience in the population space can be transferred to the belief space by the accept function. The belief space transforms advanced experience into knowledge through certain rules. The knowledge in the belief space guides the evolution of the population space towards a more accurate direction through the influence function. Figure 8 shows the schematic diagram of CA.
3.2. Our Proposed Cultural Algorithm—A New Adaptive Culture Algorithm
In our previous work [22], we proposed an adaptive cultural algorithm with improved quantum-behaved particle swarm optimization (ACA-IQPSO) and applied it to the underwater sonar image detection. In the population space, to enhance the search ability of the ACA-IQPSO, we introduced the IQPSO as the evolution strategy. In the belief space, we adopted a new update strategy based on the idea of SFLA. Situational knowledge, normative knowledge, and domain knowledge were selected to form the knowledge structure. A new communication mechanism was designed to make better use of the information in the population space and belief space. Experimental results show that ACA-IQPSO has better searching ability and convergence efficiency.
However, we found that ACA-IQPSO could not obtain good initial clustering centres, and the update strategy of the belief space easily gets into the local optimal solution. Therefore, the convergence ability of ACA-IQPSO needs to be improved and the efficiency of underwater sonar image detection is reduced.
Therefore, in order to complete the underwater sonar image detection more accurately in shorter iterations, NACA is proposed for the underwater sonar image detection. NACA has two improvements over ACA-IQPSO. To begin with, inspired by the idea of data field and maximum entropy [23], we propose an adaptive initialization algorithm based on data field (AIA-DF) for underwater sonar image detection. AIA-DF is used in the population space to more accurately find the initial clustering centres. Secondly, in our previous work [7], we proposed QSFLA-NSM for the underwater sonar image detection. Experimental results show that compared with SFLA, QSFLA-NSM has stronger search ability. Therefore, we propose a new update strategy in the belief space based on the idea of QSFLA-NSM.
3.2.1. Adaptive Initialization Algorithm Based on Data Field
The dataset is defined as in the data space Ω. The ith data point is defined as Ri = (Ri1, Ri2, ⋯, RiD), N is the size of R. D is the dimension of a data point. Every data point in R interacts with the data points around it. In this way, a data field is formed according to the interaction of different data points. The interaction between different data points is measured by potential functions in the data field. Generally, the closer data points have stronger interaction and greater potential. In contrast, the further data points have weaker interaction and lower potential. The potential function is defined as:
where is the potential of the data point Ri = (Ri1, Ri2) at the threshold , Ri1 is the grey value of the ith pixel in the underwater sonar image. Ri2 is the average of the grey values of pixels in the neighborhood window. The neighborhood window centre is the ith pixel. is the frequency corresponding to the ith pixel in the two-dimensional histogram of the underwater sonar image. is the Euclidean distance and σ is the impact factor.
Furthermore, in the data field, the sum of the potential of all data points at the threshold is defined as:
where N is the number of total pixels in the underwater sonar images.
The influence radius of every data point is in the data field [23]. Therefore, when calculating , the data points at work are in the region O, of which its centre is and the radius is . On this basis, is redefined as
The impact factor σ is a significant parameter. It is closely related to . The relatively large σ means that is relatively close, which makes the initialization algorithm easy to fall into the local optimal solution during the iteration. In contrast, the relatively small σ means that is relatively close to 0, which also affects the subsequent solution of optimal threshold. To accurately calculate the optimal threshold, σ is redesigned.
According to the criterion:
where K is the possible grey levels in the underwater sonar image and . L is grey levels in the underwater sonar image. σ is defined as:
According to the principle of the data field [23], when the uncertainty is the smallest, the potential can perfectly reflect the distribution of data points in Ω. The uncertainty is usually described as the entropy. The optimal threshold is calculated by entropy. The size of the data field is L × L, the scope of is . Data points in the data field are divided into two classes: and . The entropy of A and B are respectively expressed as follows:
where , .
The sum of posterior entropy in the data field is defined as:
When the maximum of is obtained, is the optimal threshold.
AIA-DF is proposed in this paper according to Equations (12)–(17). The initialization algorithm adaptively calculates initial clustering centres in population space on the basis of the characteristics of the underwater sonar images. It improves the disadvantages that the initial cluster centers are randomly generated in the solution space and effectively avoids the prematurity of detection algorithm.
The influence region O of the optimal threshold is limited because of the influence radius. Besides, in the data field, the distribution of potentials has different characteristics in different underwater sonar images. Therefore, the optimal threshold is also different to some extent.
is the initial scope of threshold . When the optimal threshold is obtained, the grey value is randomly selected in region O for initializing the clustering centres. The update formula for U is given as:
where is the number of optimal thresholds currently obtained.
U* is defined as::
When the value of and are less than 0 or larger than L − 1, the update process of U is over. AIA-DF is described in Algorithm 2.
| Algorithm 2: the proposed AIA-DF |
| Input: Denoising image; |
| Output: Initialized image; |
| Initialization: (the radius of the neighbourhood window), (the number of the optimal threshold), (the set of optimal threshold potential solutions); |
| Procedure: |
| 1: For every pixel in the input image, do: |
| 2: Calculate the mean grey of its neighbourhood; |
| 3: Establish the two-dimensional grey histogram of the input image; |
| 4: Establish the data field according to the grey histogram; |
| 5: repeat: |
| 6: Calculate the entropy of using Equation (15); |
| 7: Calculate the entropy of using Equation (16); |
| 8: Calculate the optimal threshold when the maximum of Equation (17) is obtained; |
| 9: Calculate using Equation (19); |
| 10: Update using Equation (18): |
| 11: Update using : |
| 12: Until: the stopping criteria are met. |
3.2.2. New Update Strategy
In the belief space, to complete the update process by using the new update strategy in terms of QSFLA-NSM. In the first place, cultural individuals are divided into the multiple subpopulations and sorted from large to small according to the fitness function value [25]. Each subpopulation executes the local search strategy. In the second place, with the subpopulation complete local search strategy, all subpopulations are mixed for global information exchange. Then, the belief space is divided into subpopulations again. Local search and global information exchange will alternate until the number of iterations is satisfied
Local search completes the update of the worst cultural individual in each subpopulation. The first step of the local search [5] is expressed as:
where t is the current local iterative times, μ1 is a random number in [0,1], P(t) is the local attractor, and β is the contraction–expansion coefficient. is the situational knowledge of the subpopulation on behalf of the local best cultural individual. is the local worst cultural individual.
Comparing the fitness function values of and , if the fitness function value of is larger, is replaced by . Whereas, which represents the global best individual, will replace in Equation (20). is calculated by Equation (20) again. If the fitness function value of is still less than , it will randomly generate an individual from the solution space and replace . When the upper limit of the local iteration number is reached, the local search is over.
4. Experiments and Discussion
4.1. The Characteristics of the Underwater Sonar Images
The underwater sonar images include the object-highlight region, sea-bottom-reverberation region, and shadow region. However, because of the complexity of the underwater environment, the underwater sonar image is easily affected by the reverberation effect, strong speckle noise, fuzzy edge, and weak texture information. This means that the underwater sonar images contain a lot of noise.
4.2. The Effectiveness Verification of the Proposed Denoising Method
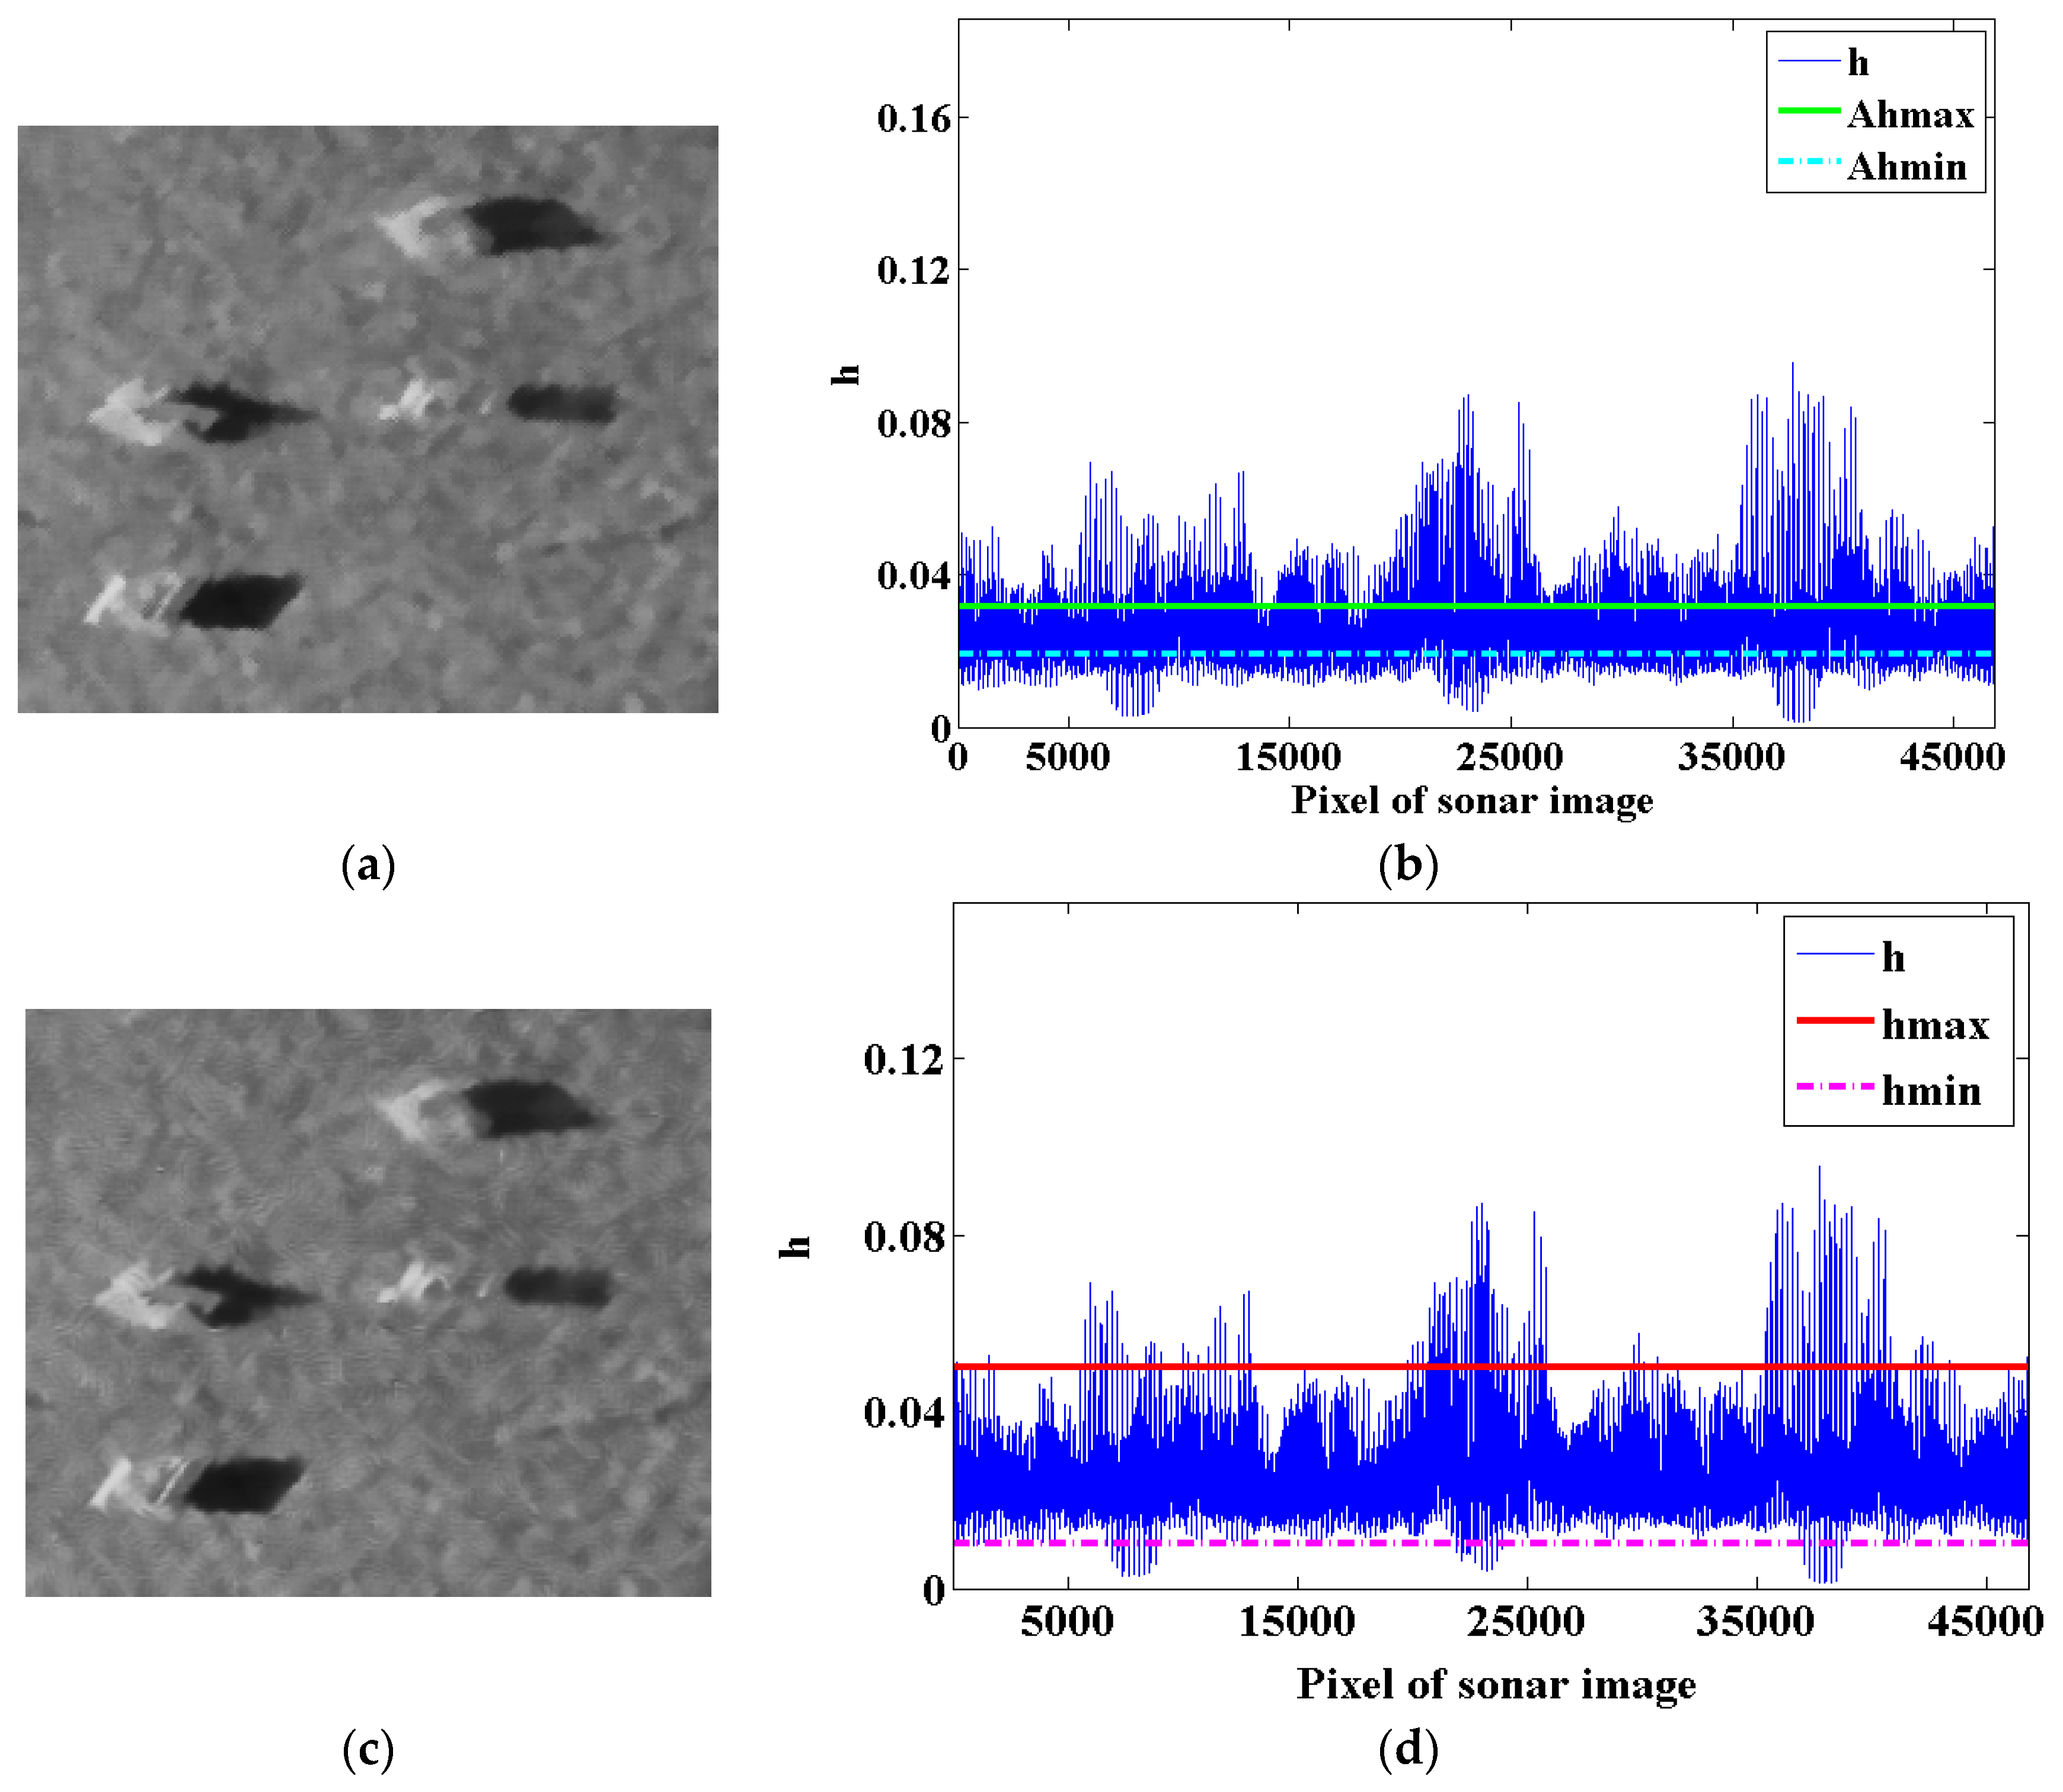
To prove the superiority of the proposed denoising method, Figure 9 shows the denoising results based on Figure 1a of the proposed denoising method and the previous denoising method [7]. The experiment environment is using Matlab R2012b with a 2.7 GHz Core processor and 8 GB of RAM.
As can be seen from Figure 9b,d, compared with the previous thresholds , the adaptive thresholds can remove more fairly small filtering degree parameters and effectively remove image noise points. Meanwhile, the threshold is smaller than which can remove more fairly large filtering degree parameters. It contributes to keeping the underwater sonar image details better when the image noise points are removed.
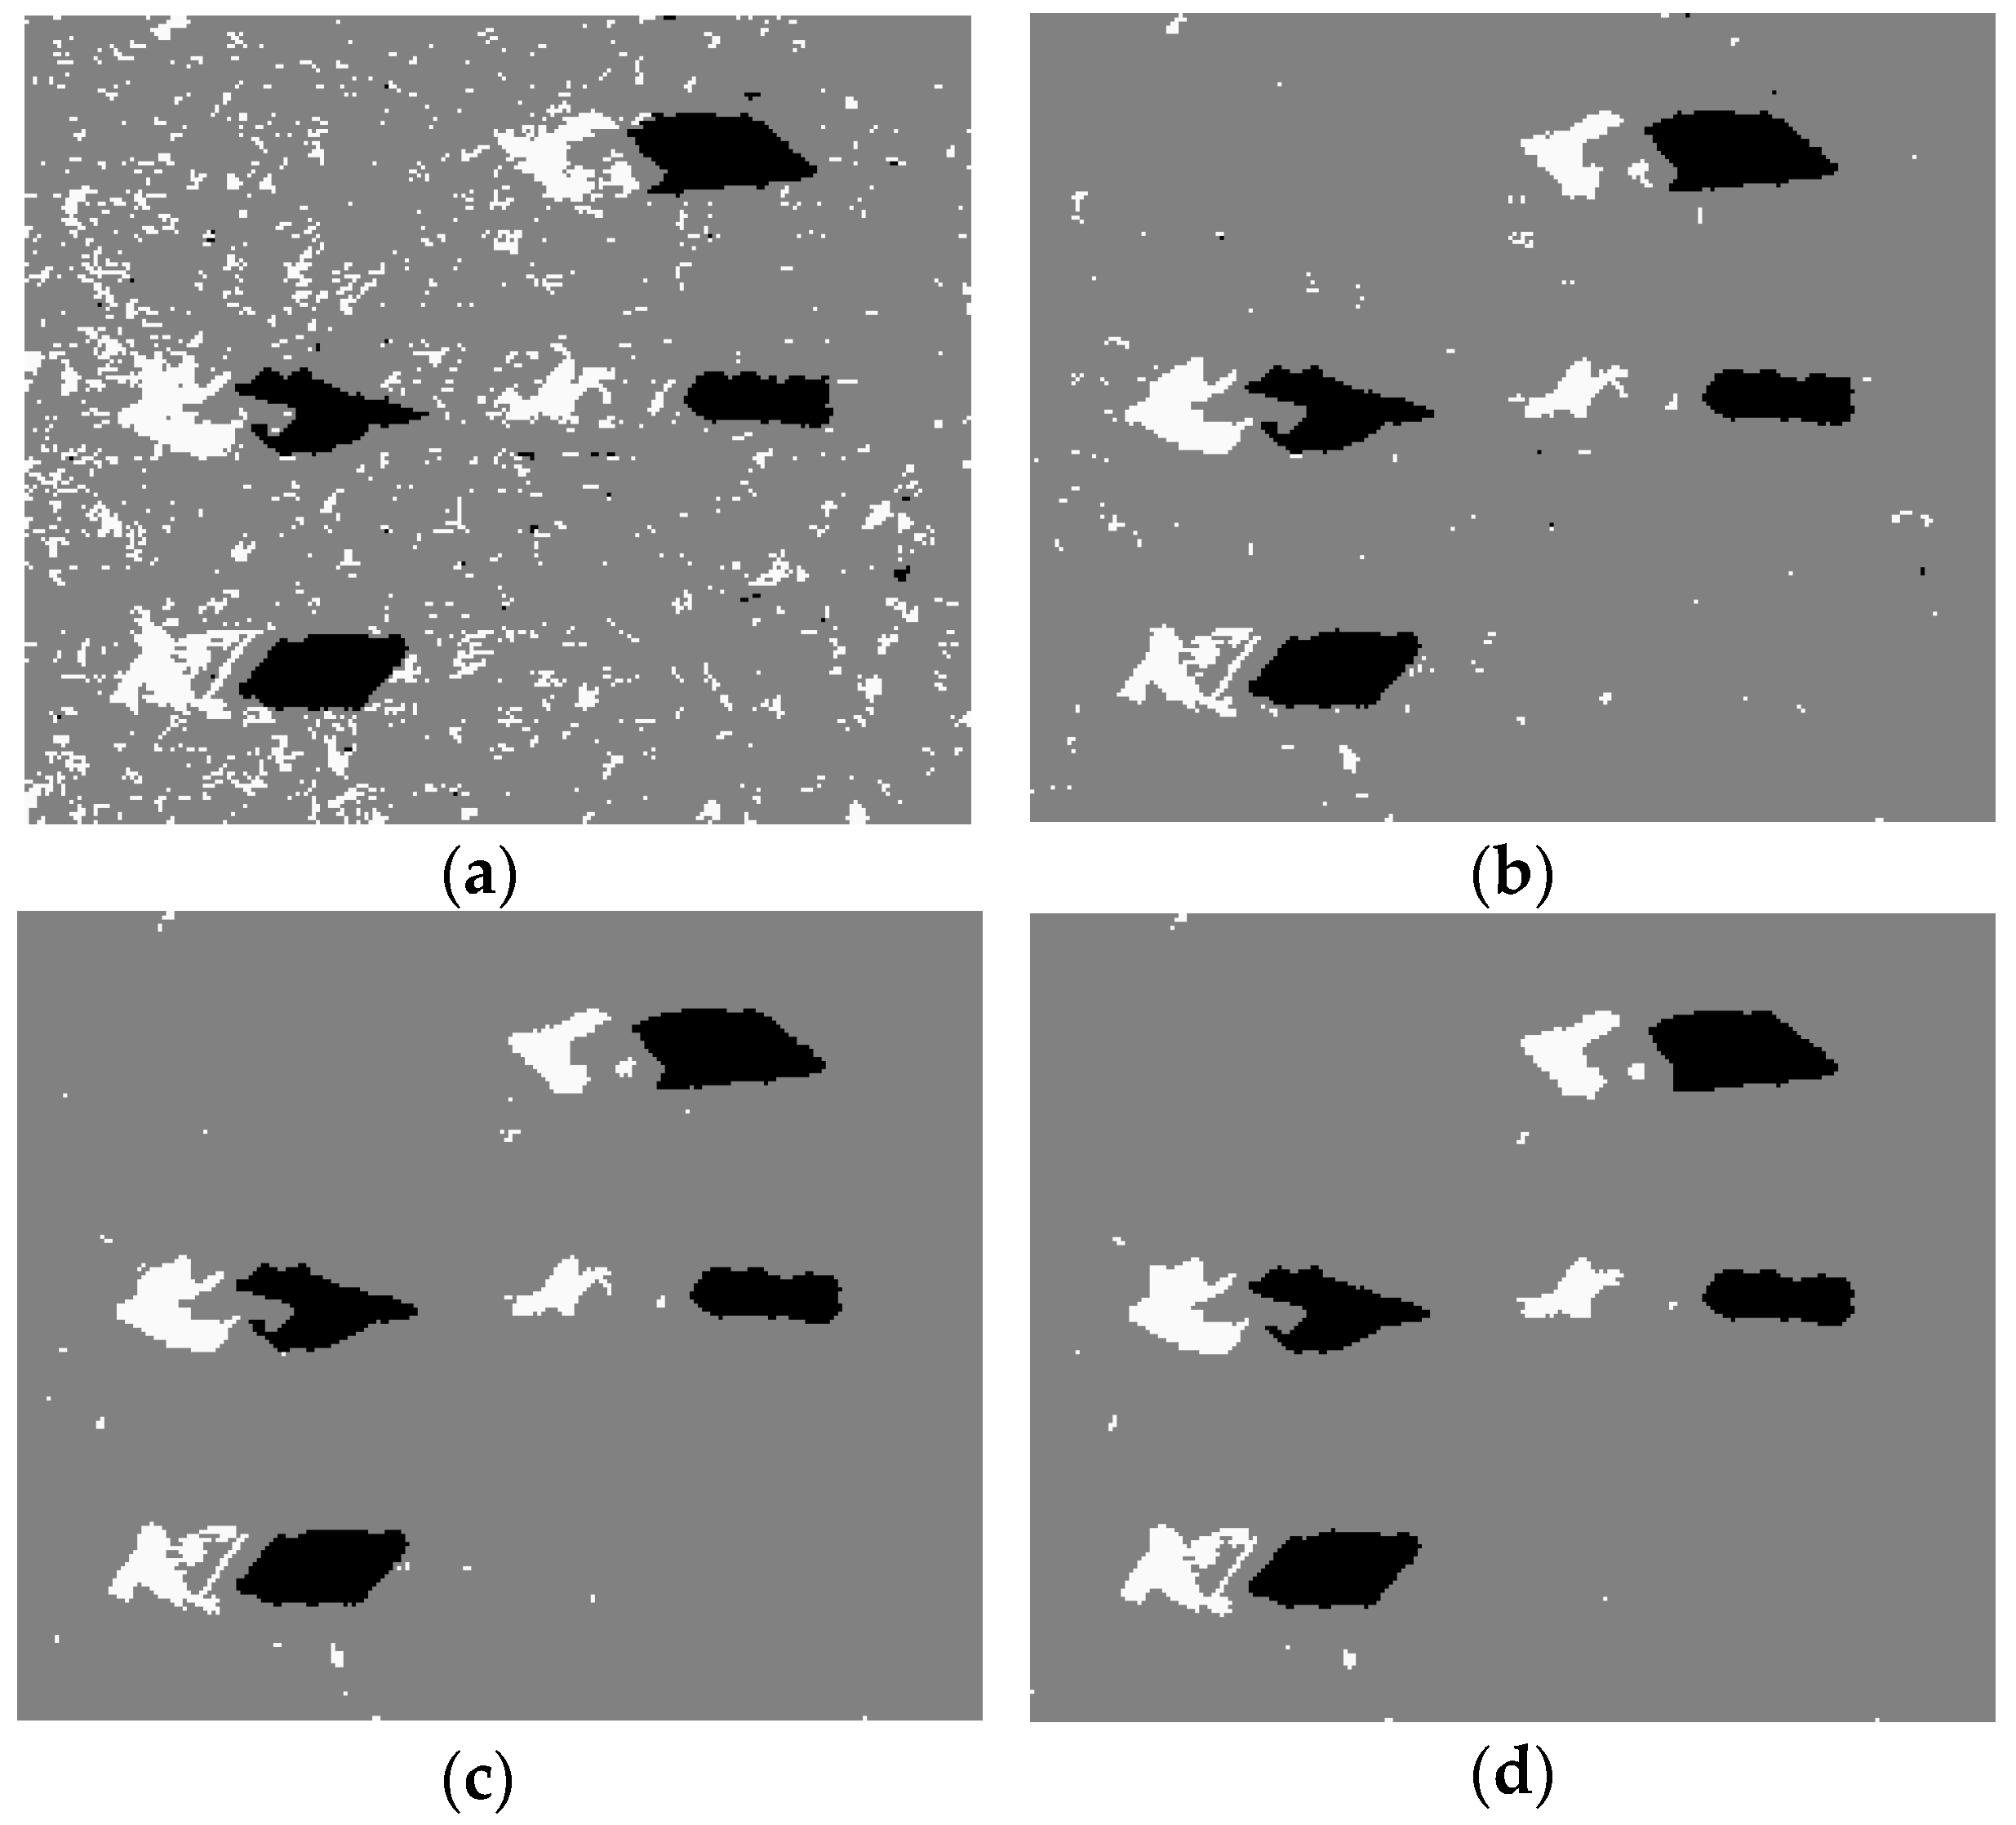
A relatively simple and effective the fuzzy c-means (FCM) [10] is used to further qualitatively verify the effectiveness of the denoising method proposed in this paper. Figure 10 shows the detection results of FCM based on the thresholds in Figure 9b,d.
As can be seen from Figure 10a,b, compared with the previous threshold , removes smaller parameters in a larger range. Therefore, it can effectively improve the performance of sonar images. Meanwhile, as shown in Figure 10c,d, compared with the previous threshold , can more accurately define the boundaries of relatively large , which benefits preserving detail information in sonar images. The noise can be effectively removed on the basis of preserving image details by the proposed denoising method which contributes to the remainder of the image processing.
4.3. The Effectiveness Demonstration of the Proposed Detection Method
To testify the effectiveness of NACA and AIA-DF, the detection experiments based on different underwater sonar images are presented. The proposed non-local spatial information denoising method based on the golden ratio in this paper is used for removing noise in the underwater sonar images. On that basis, the proposed NACA is used for underwater sonar image detection. Meanwhile, the proposed NACA is compared with QSFLA-NSM [7], ACA-IQPSO [22], QSFLA [26,27], CPSO [20], and QPSO [28]. Except that the number of clustering centres is adaptively set according to AIA-DF in NACA, the number of clustering centres is 3 in other intelligent optimization algorithms. The population size is 20, the sub-populations size is 5 in proposed NACA, QSFLA-NSM, and QSFLA, the size of the belief space is 8 in NACA, ACA-IQPSO, and CPSO, the global maximum number of iterations is 10, the local maximum number of iterations is 2 in NACA, QSFLA-NSM, and QSFLA. The experiment environment is using Matlab R2012b with a 2.7 GHz Core processor and 8 GB of RAM.
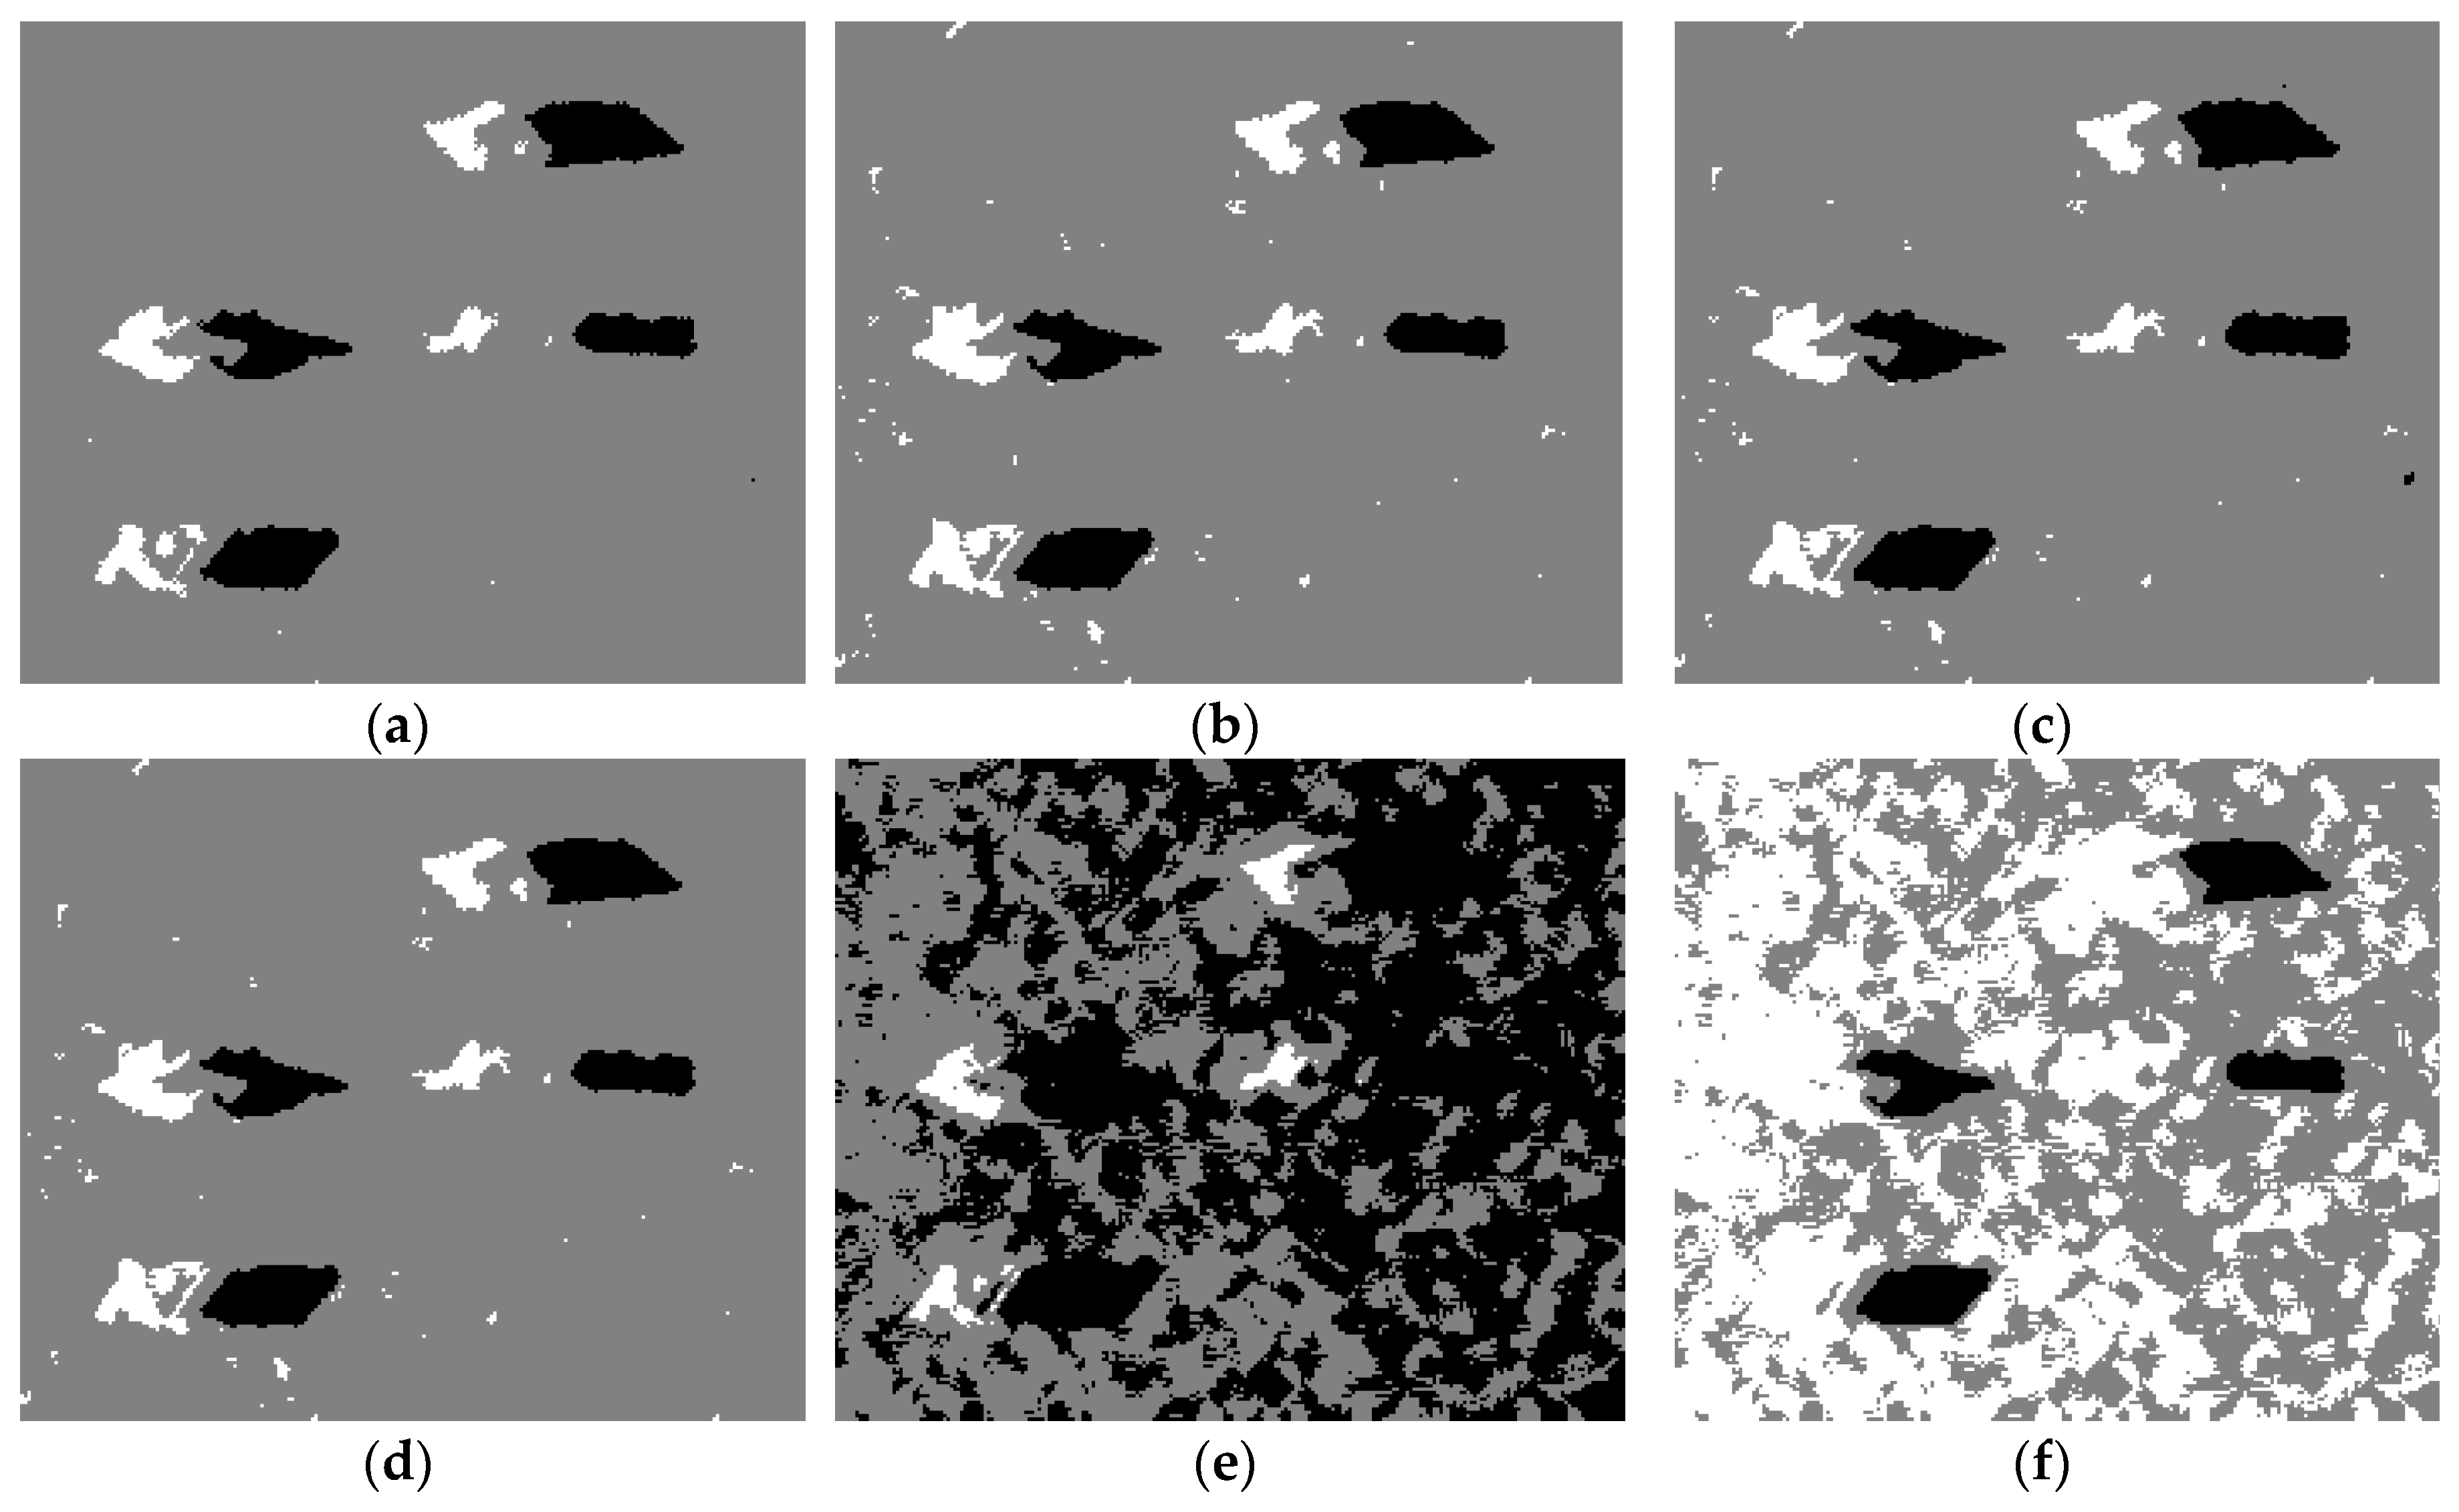
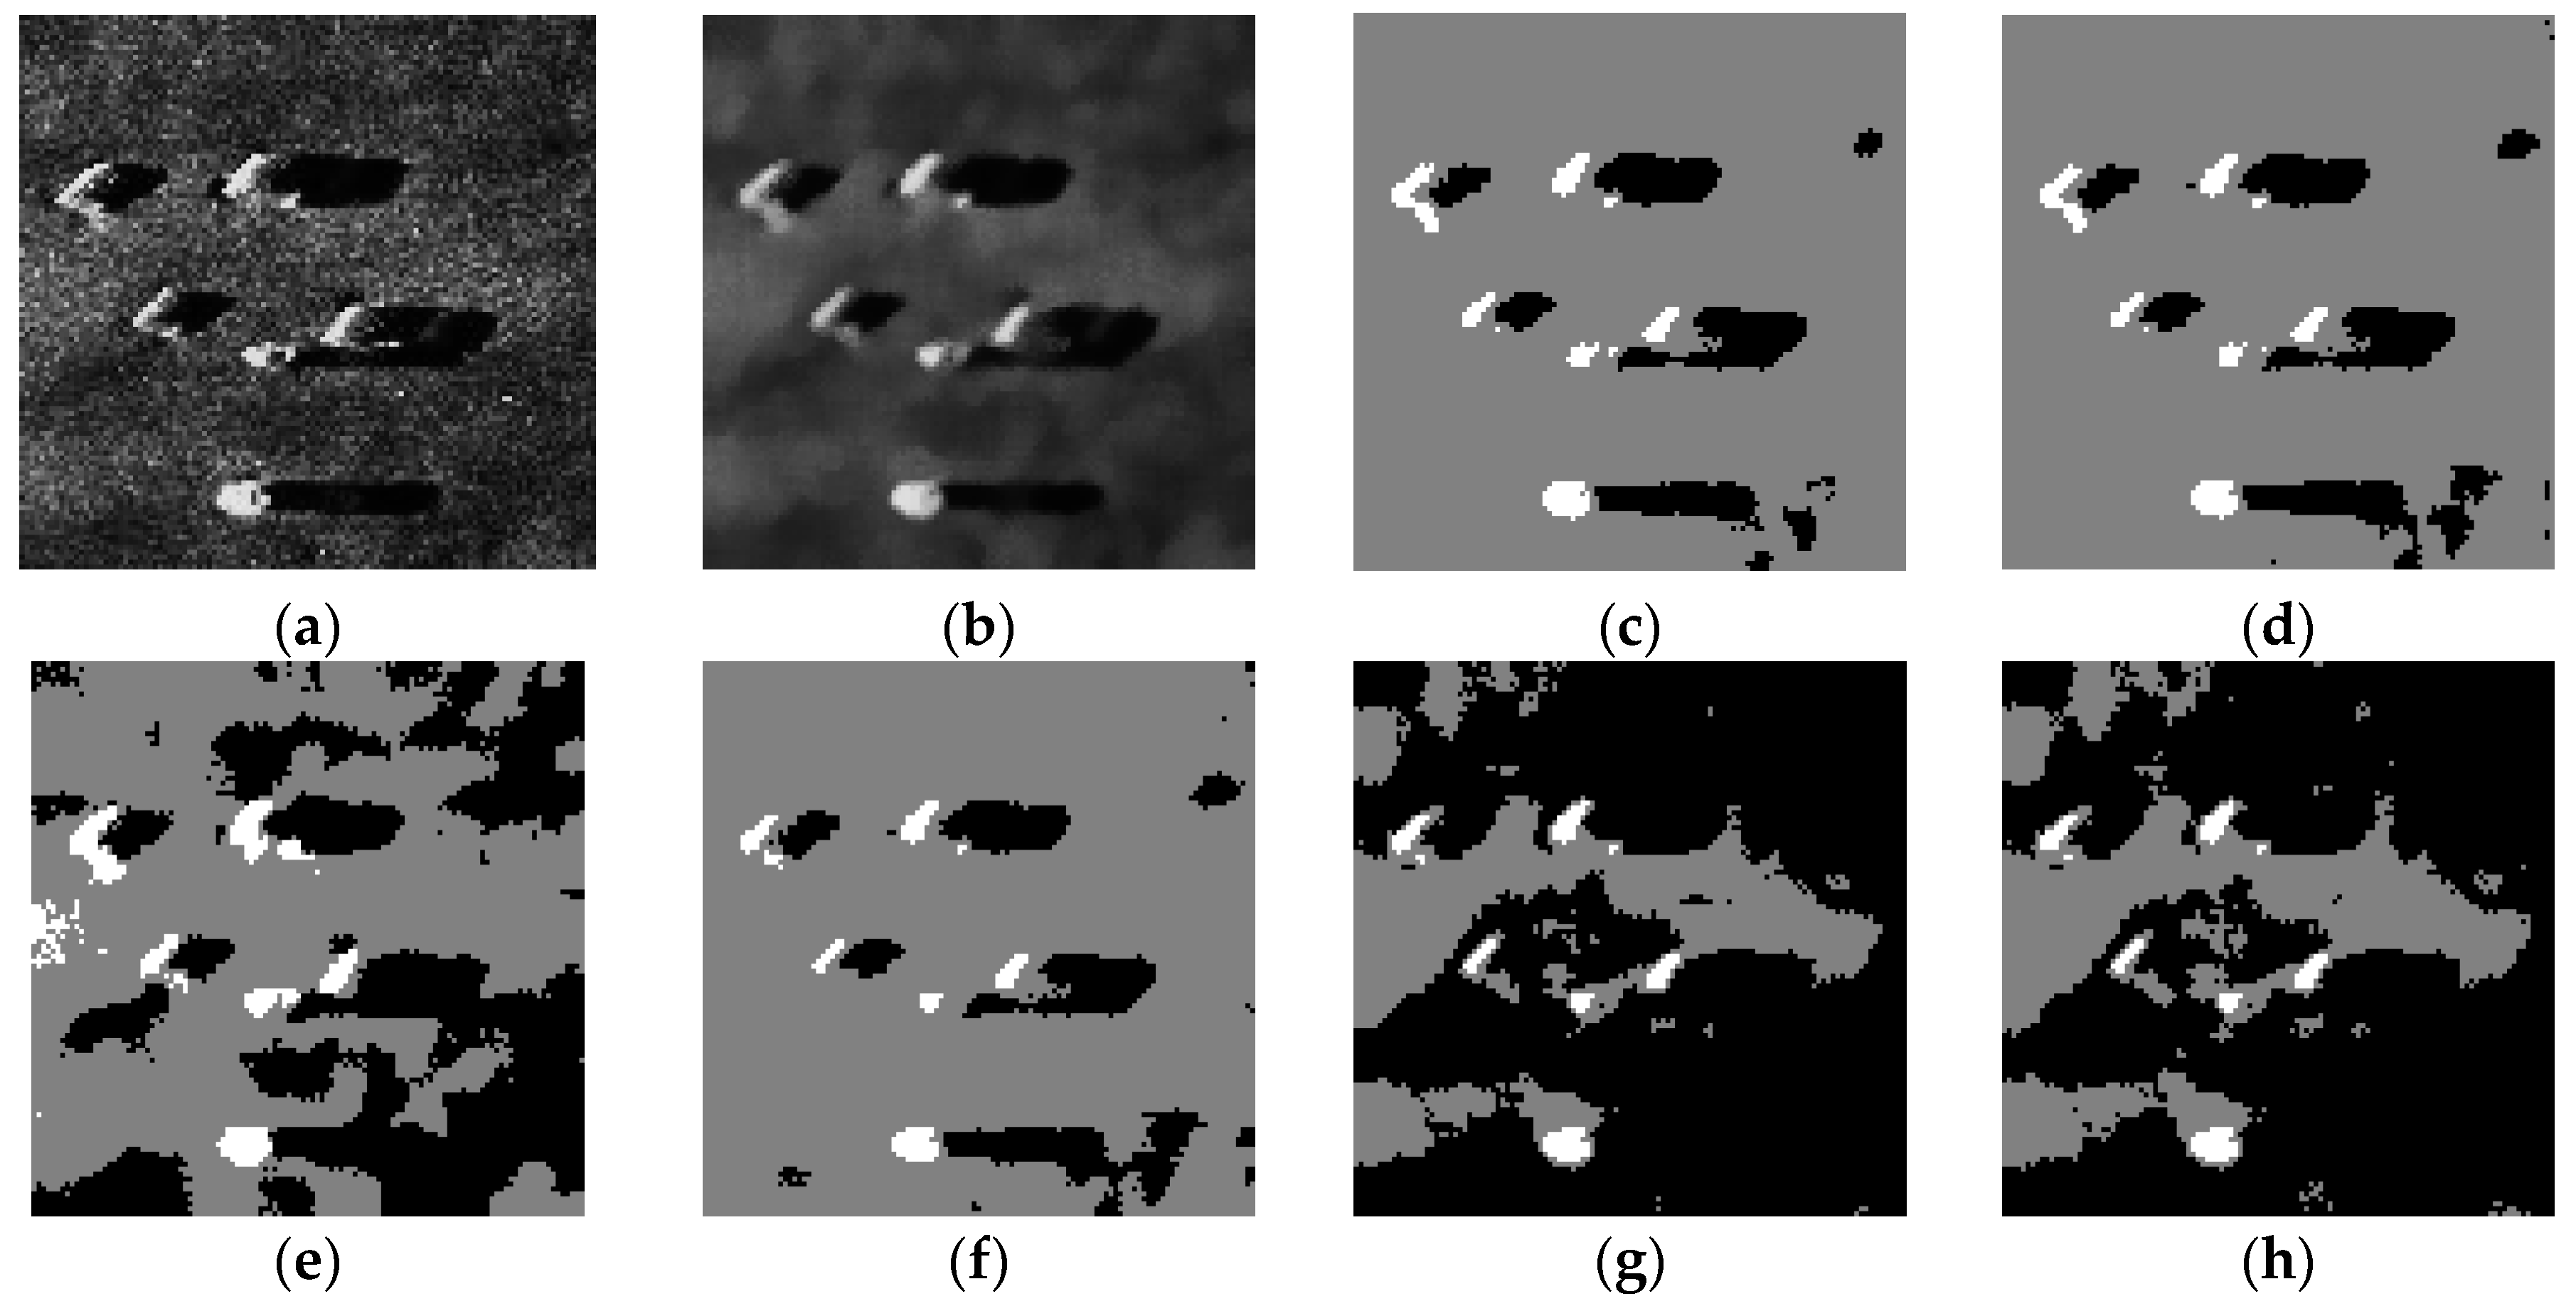
To demonstrate the effectiveness of NACA, Figure 11 shows the detection results of the underwater sonar image shown in Figure 9a.
As is described in Figure 11, the regions of object-highlight and shadow are more accurately detected by NACA in Figure 11a. It is found that many noise points cannot be removed in Figure 11b,d. In Figure 11e,f, the detection results have poor integrity in the regions of object-highlight and shadow, respectively. It will cause serious difficulty to the subsequent underwater sonar image recognition. Therefore, compared with the detection results of QSFLA-NSM, ACA-IQPSO, QSFLA-NSM, QSFLA, CPSO, and QPSO, the proposed NACA can effectively remove the noise and accurately complete underwater sonar image detection.
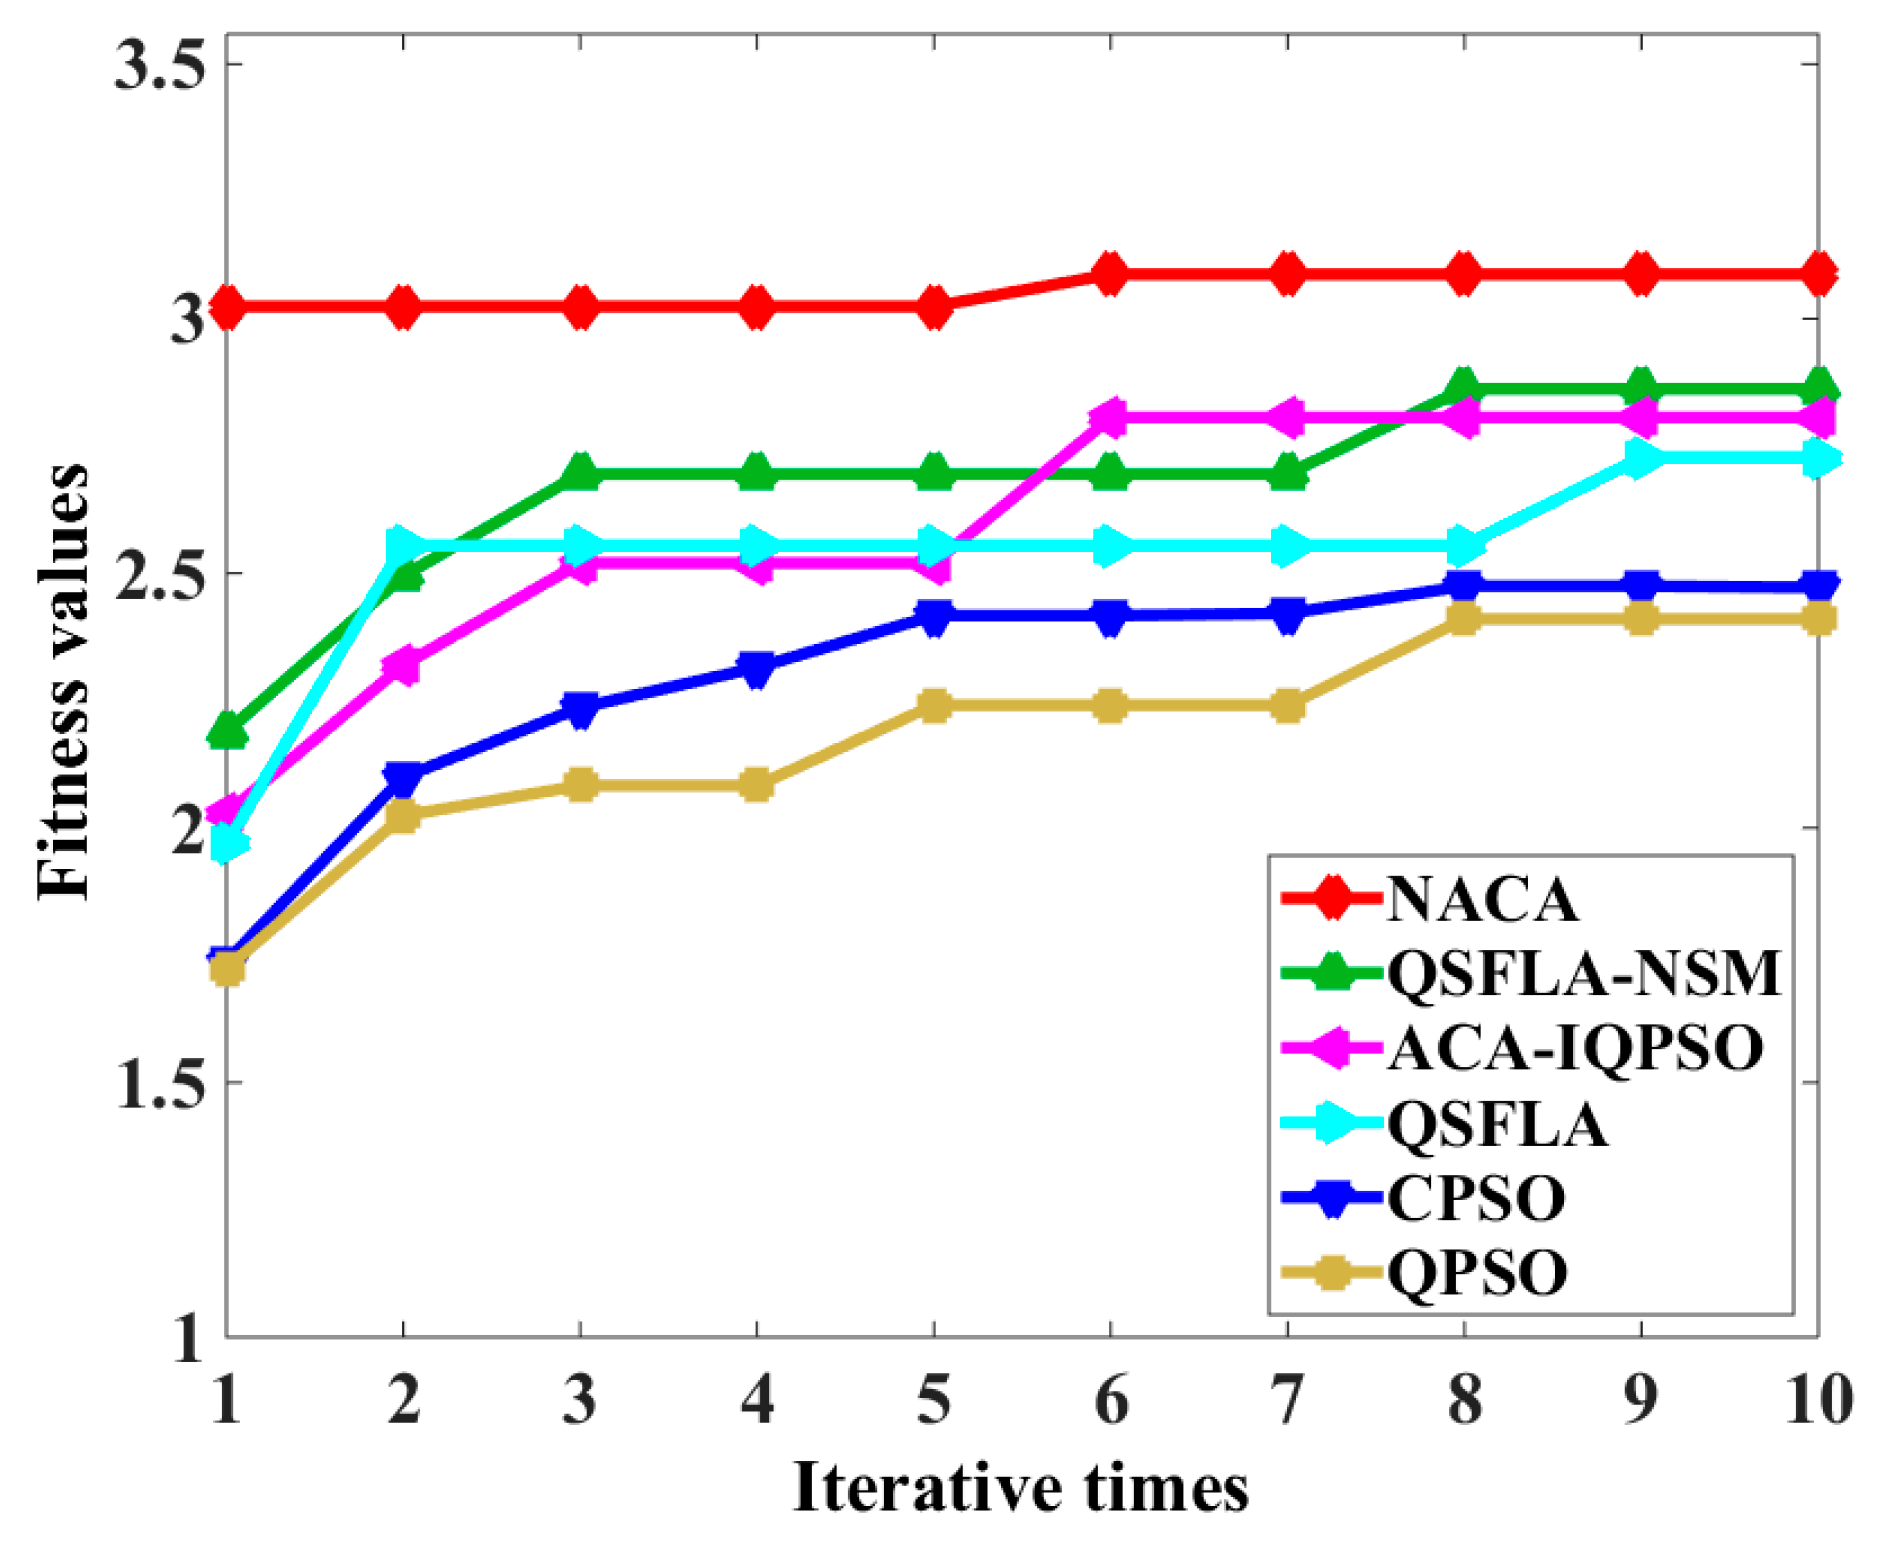
Subsequently, the quantitative analysis of the detection results in Figure 12 is performed. The values of fitness function [25] after each iteration in the detection process of NACA and contrast algorithms is shown in Table 2.
As can be seen from Table 2 and Figure 12, the best fitness values of the proposed NACA is the largest after each iteration. Only NACA converges after four iterations. The results show that the proposed NACA has a better search ability and a faster convergence speed (the speed corresponds to the number of iterations). Meanwhile, the fitness function values after the first iteration are close to the fitness function values after 10 iterations in Figure 12. This means that AIA-DF can obtain better initial clustering centres in the proposed NACA. Through qualitative analysis and quantitative analysis of the underwater sonar detection results, the effectiveness of the proposed NACA is verified.
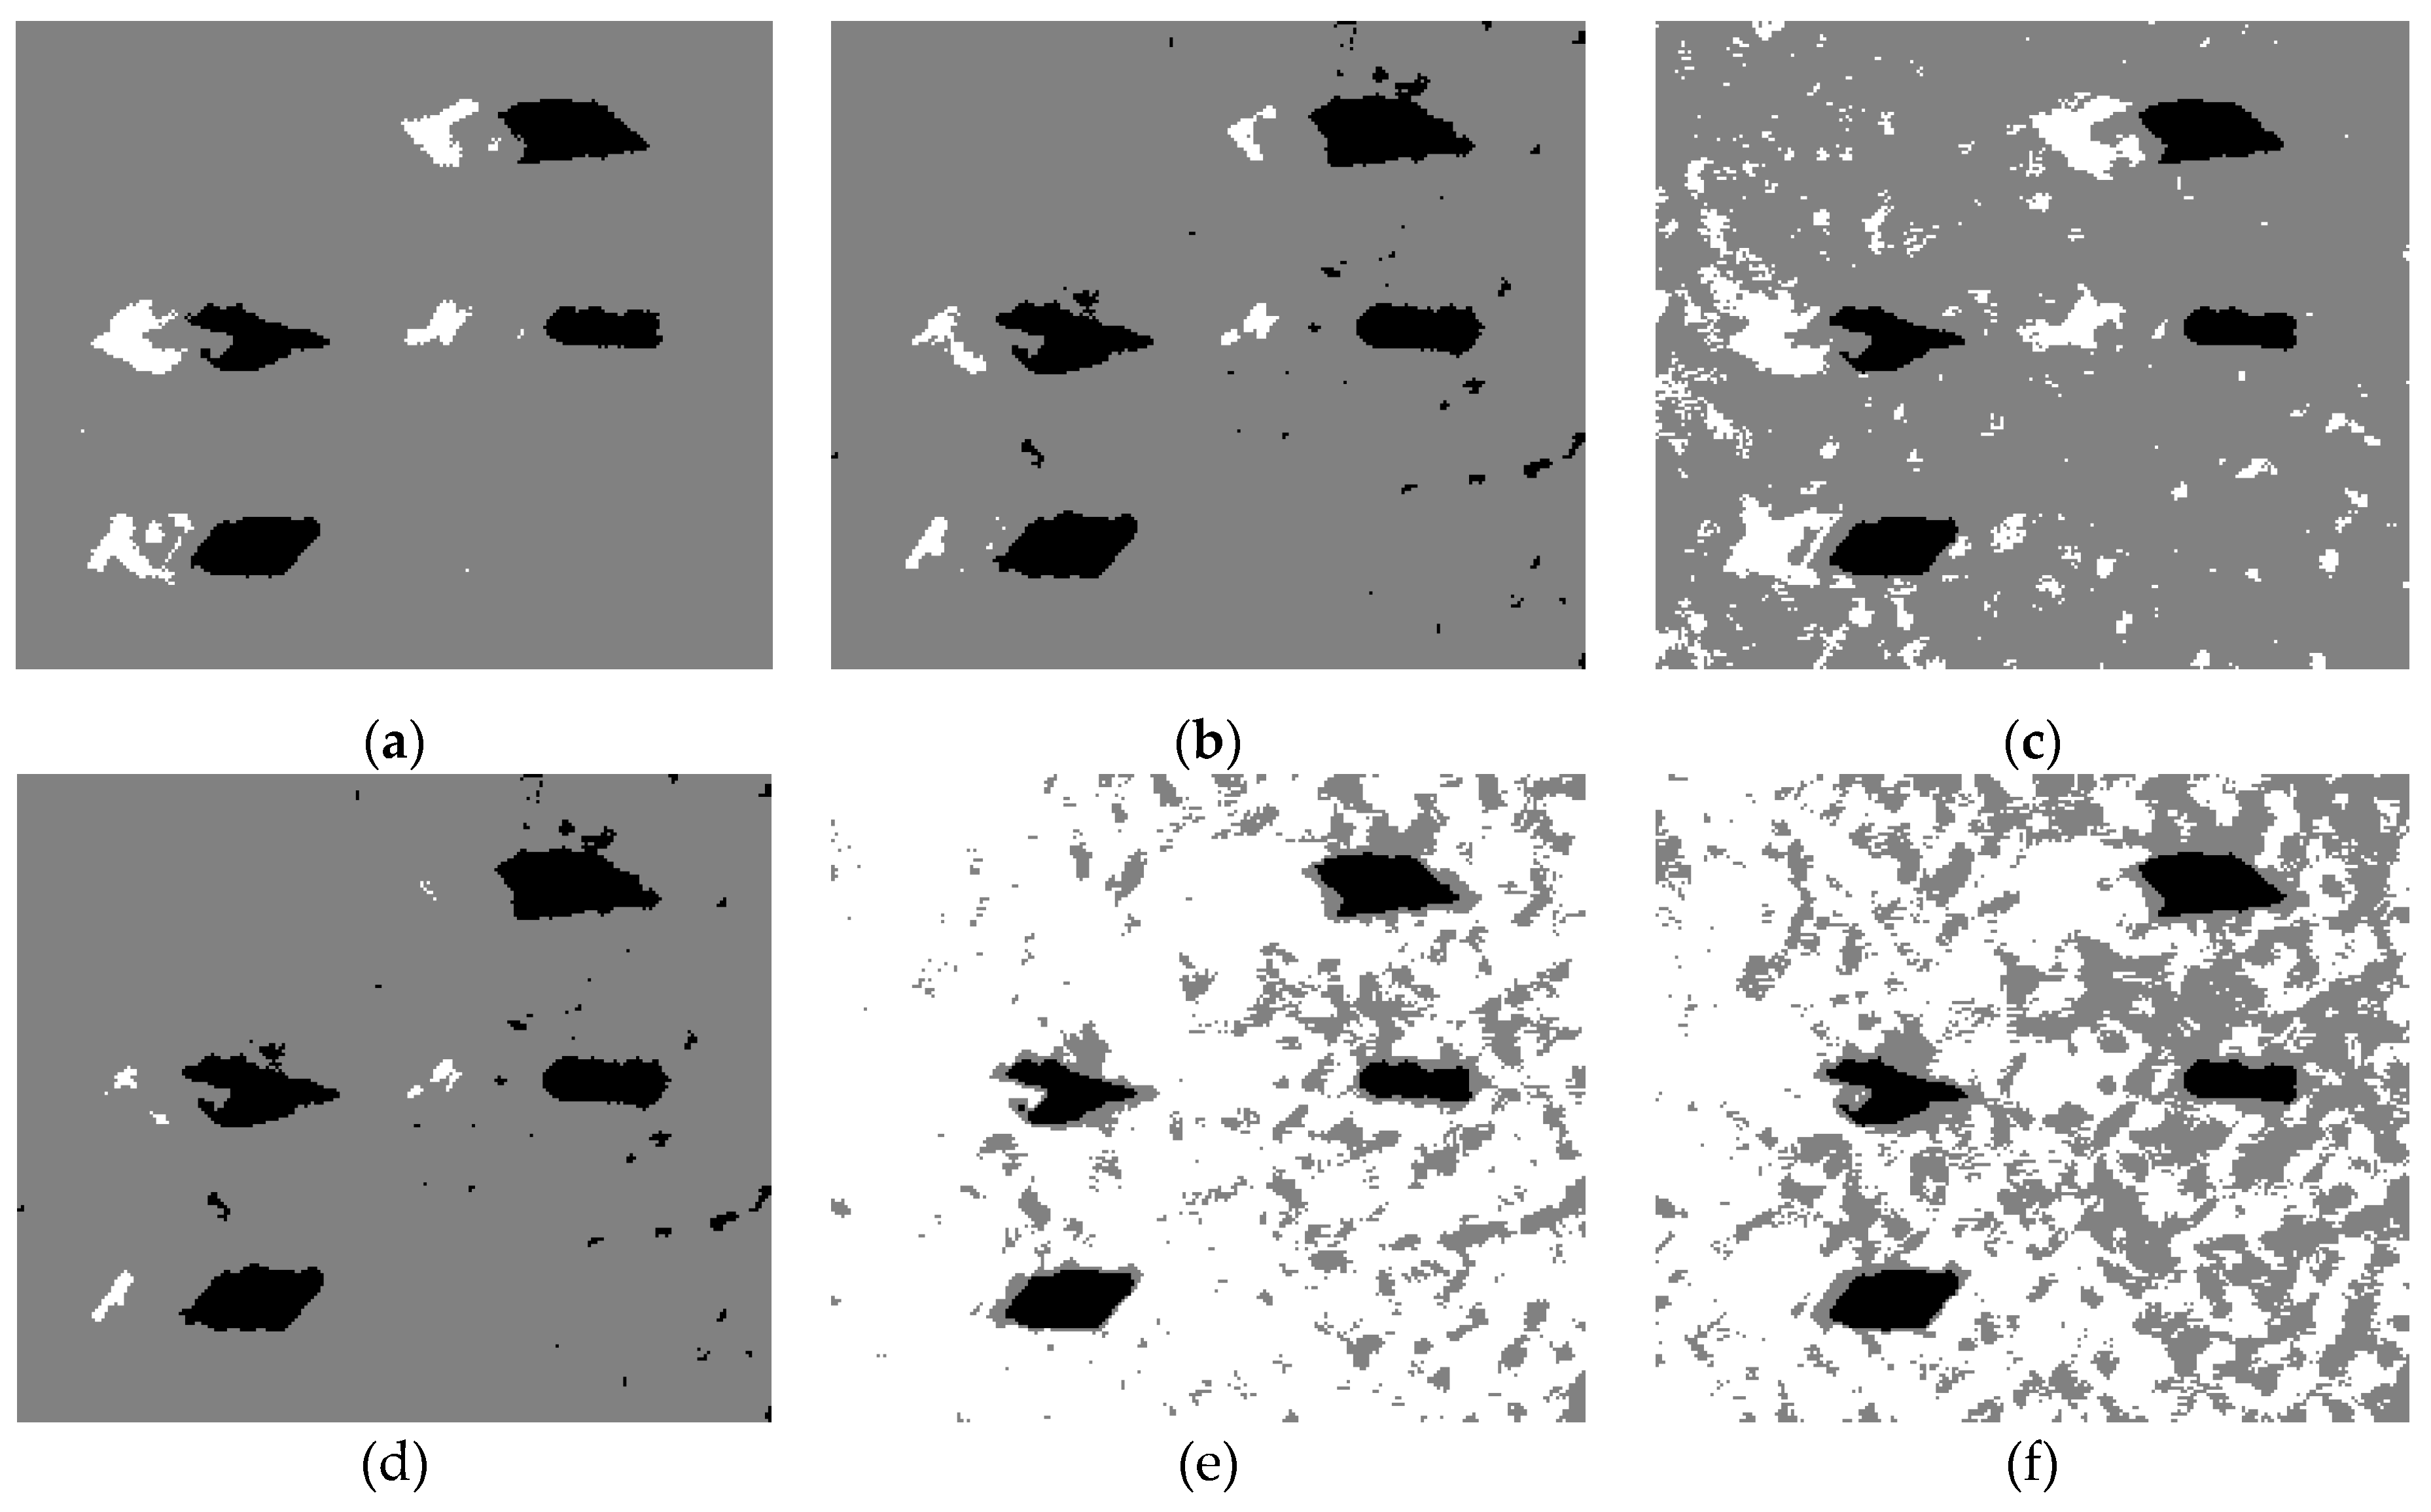
To further verify the effectiveness of the proposed NACA, Figure 13 shows the detection results of the underwater sonar image.
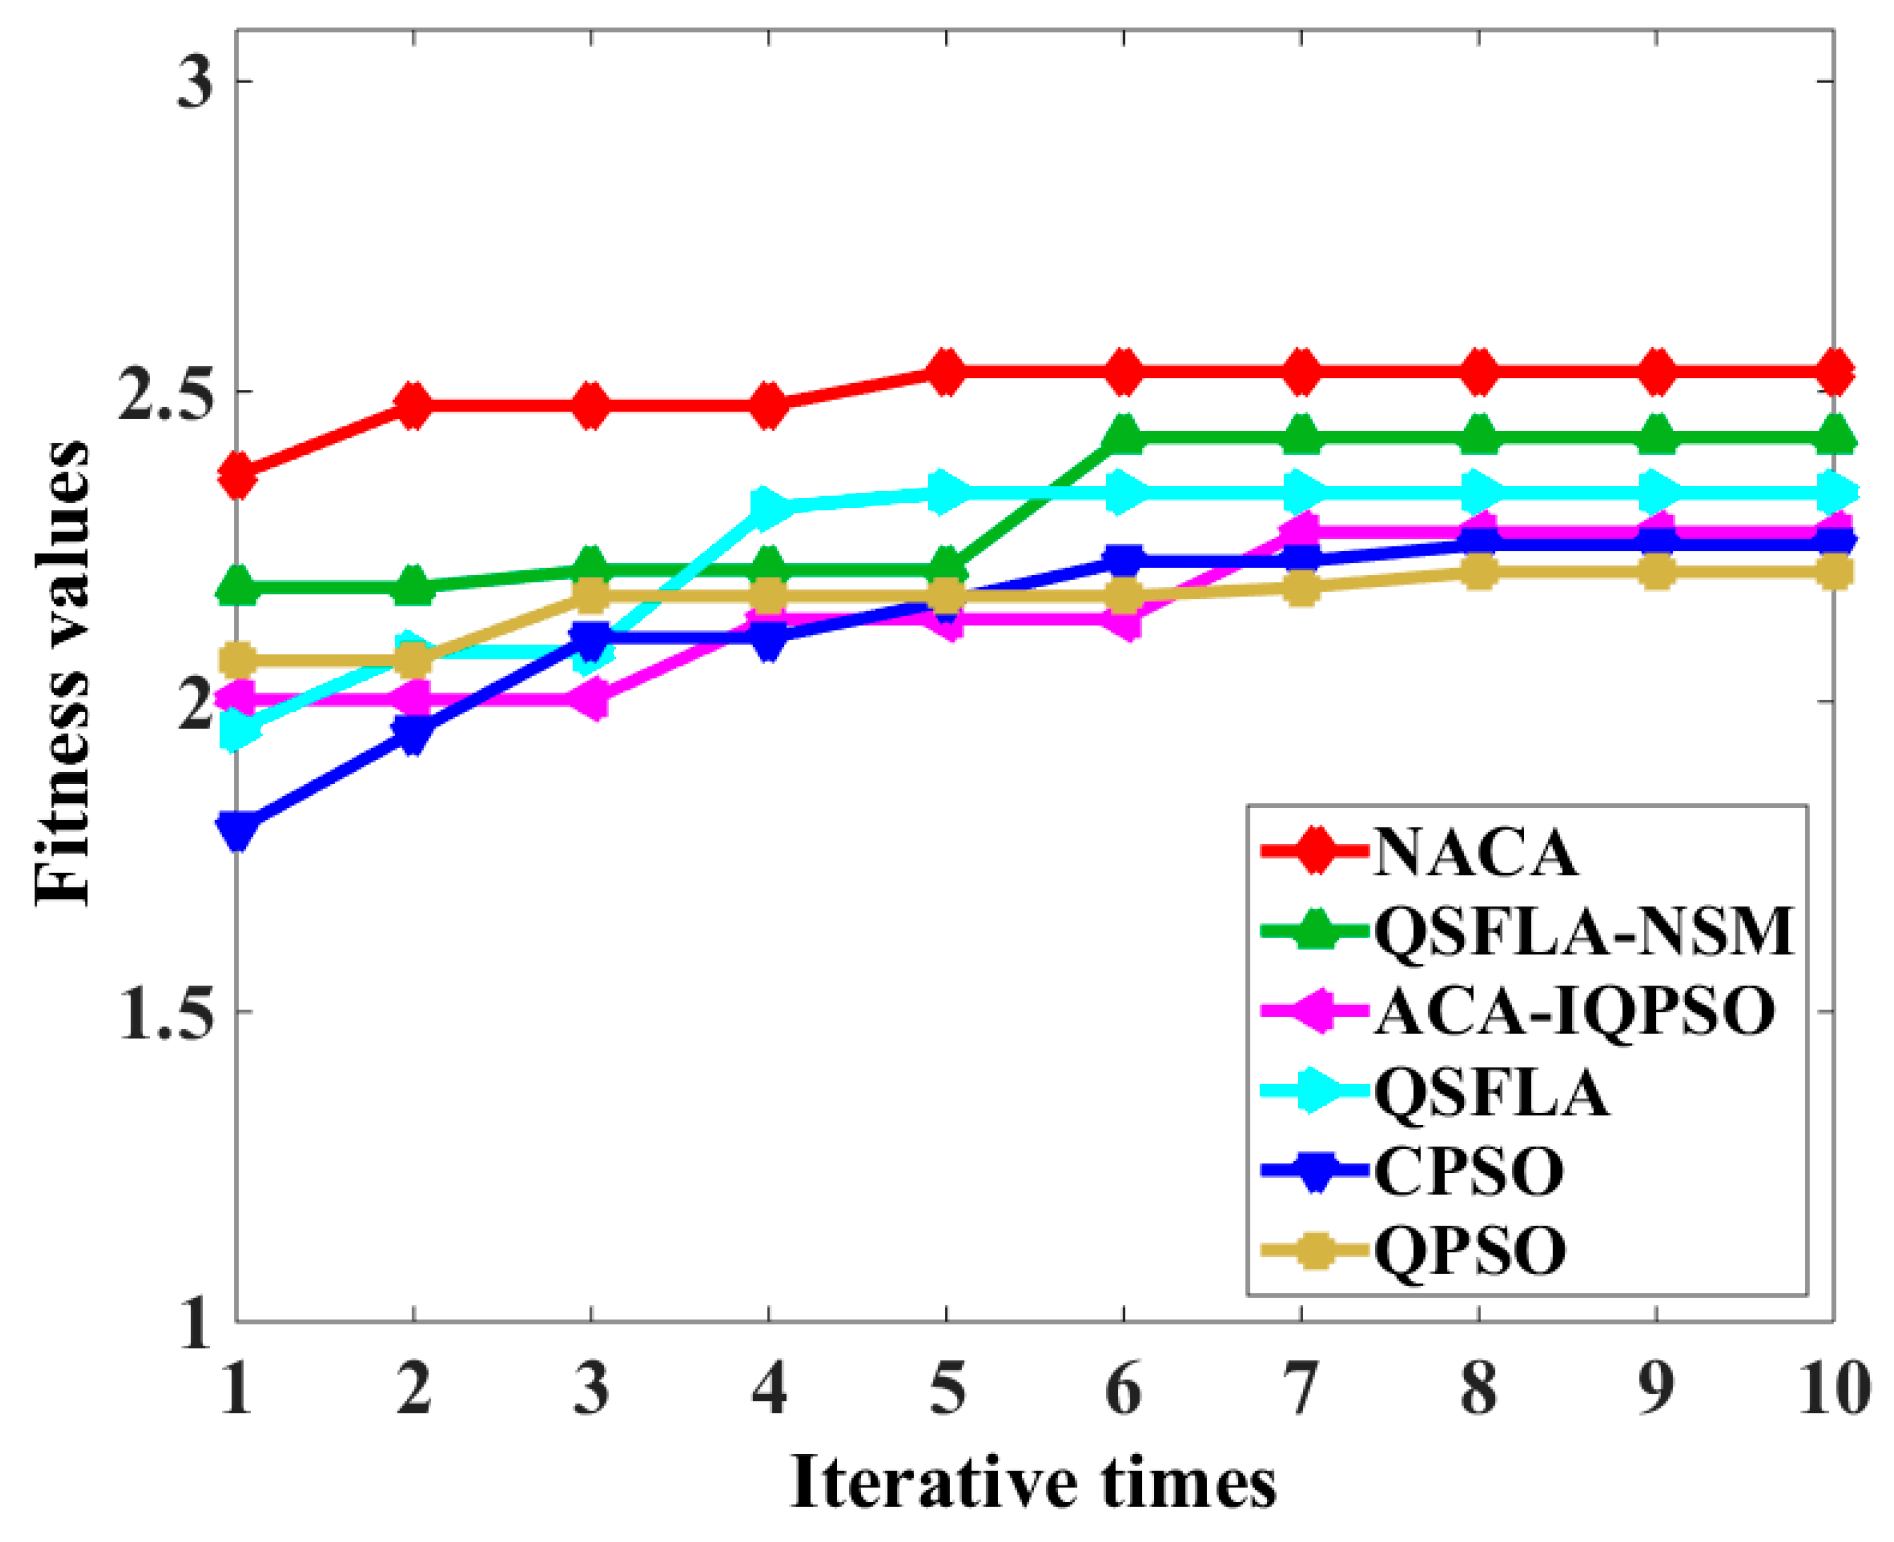
The values of fitness function [25] after each iteration in the detection process of NACA and contrast algorithms are shown Table 3. Figure 14 shows the chart of the best fitness function values in Table 3.
As can be seen in Figure 13, NACA more accurately completes the detection of different regions in Figure 13c. Figure 13d,f show over detection in the shadow region. The detection result fails to effectively remove the noise in Figure 13e,g,h. At the same time, the best fitness values of NACA are also the largest after each iteration in Table 3 and Figure 14. Comparing with other algorithms, the detection results demonstrate that NACA has the better search ability and a faster convergence speed (the speed corresponds to the number of iterations) based on the better initialization results that were obtained by AIA-DF in the paper. Therefore, through qualitative and quantitative analysis, the proposed NACA can effectively remove the noise and better complete the process of underwater sonar image detection.
To demonstrate the effectiveness of AIA-DF, Figure 15 shows the detection result after the first iteration in the detection process of Figure 11. The fitness function value after iteration is shown in the first line of Table 2.
As can be seen in Figure 15, only NACA can accurately detect the region of the object highlight region and shadow. It also effectively removes the noise in the underwater sonar image in Figure 15a. These results show that AIA-DF can find more accurate clustering centres. In addition, it can be seen from Figure 15a and Figure 11a that the detection result after the first iteration is almost identical with the final detection result. The experimental results demonstrate that AIA-DF contributes to improving convergence speed (the speed corresponds to the number of iterations), accuracy, and search ability in the proposed NACA. Through qualitative analysis and quantitative analysis of the underwater sonar image detection results after the first iteration, the effectiveness of AIA-DF is proved.
4.4. The Performance Analysis of the New Update Strategy in NACA
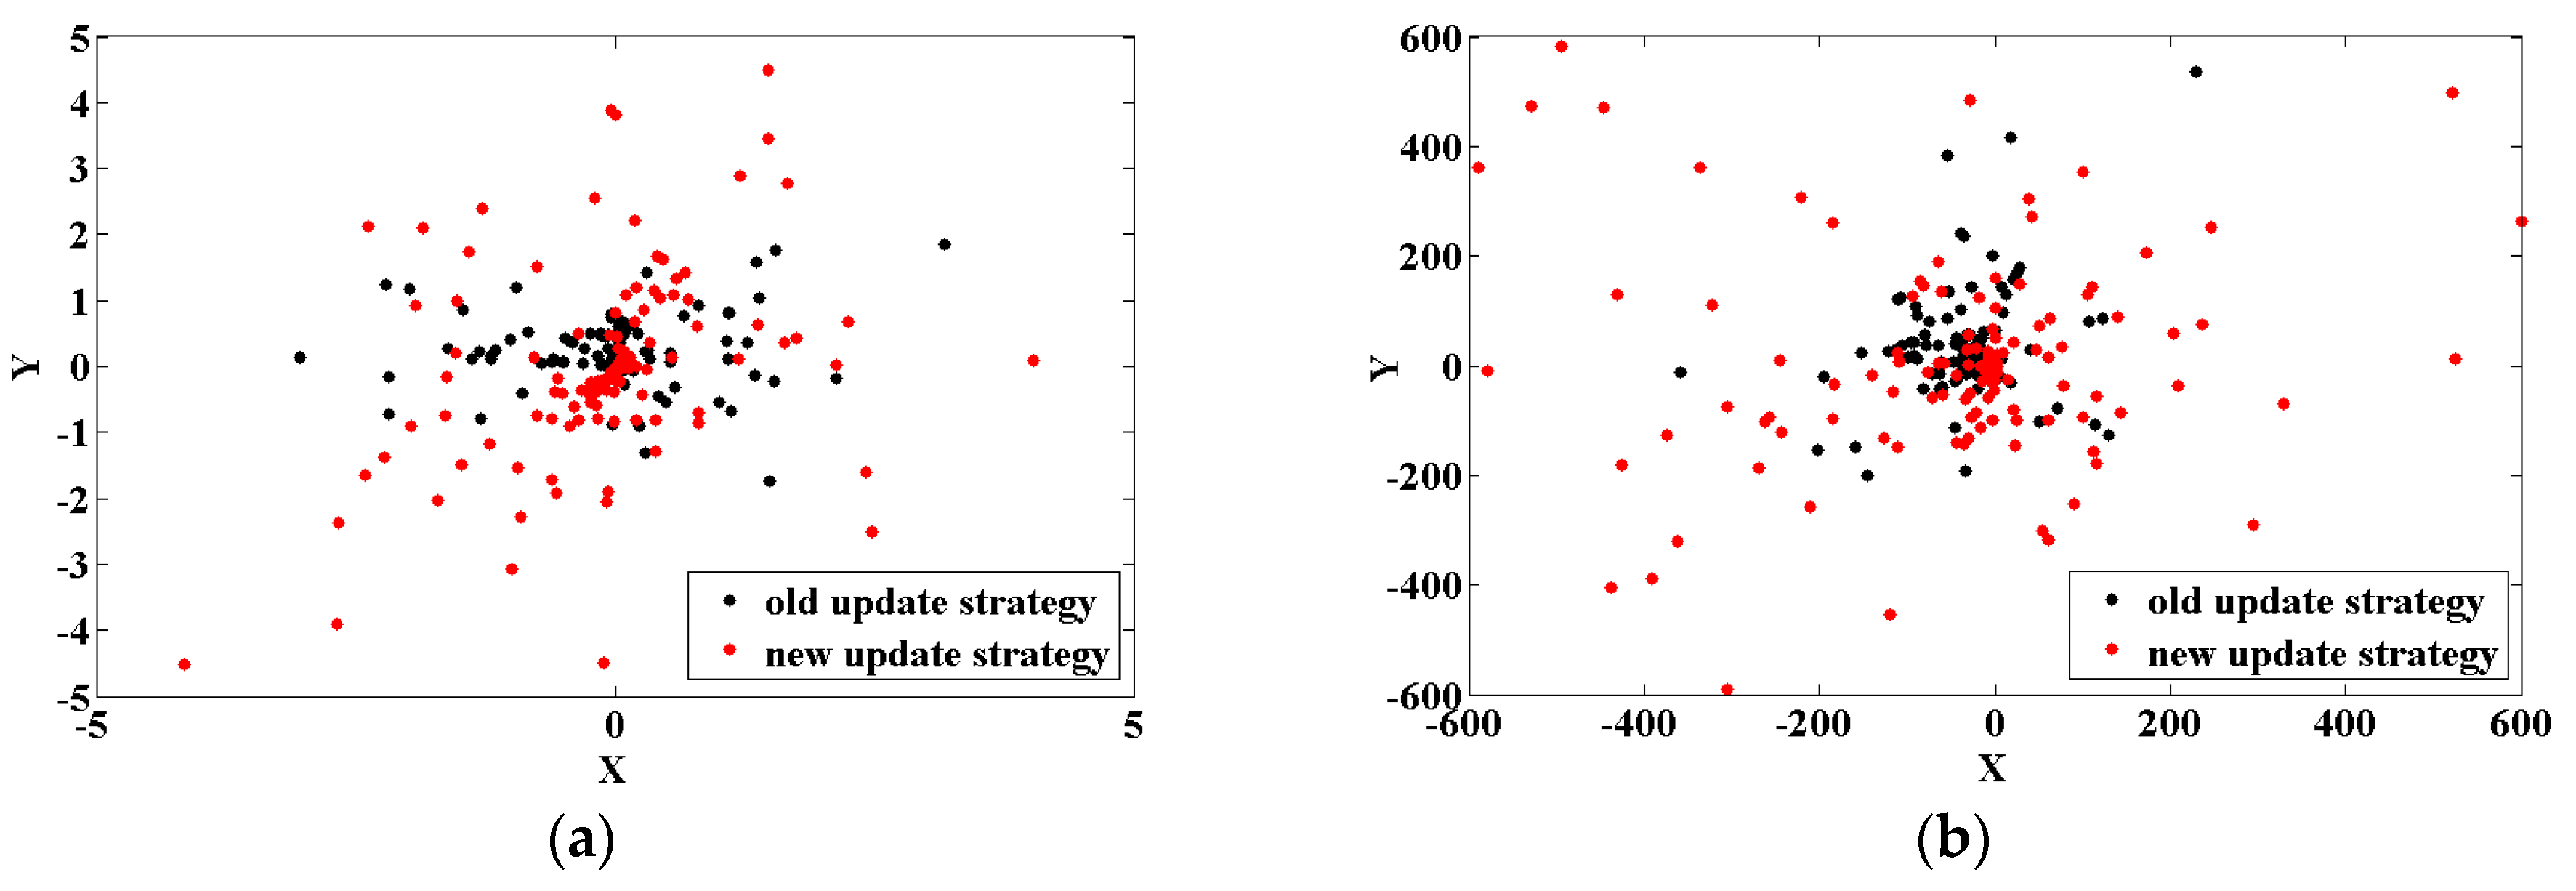
To demonstrate the superiority in the search ability of the new update strategy in NACA, in the benchmark functions, Sphere function and Griewank function are used to test the position distribution of particles in this paper. Sphere function is unimodal and only has one global optimal solution. Griewank function is multimodal and has many local optimal solutions, however only has one global optimal solution. Figure 16 shows the distribution of particle positions in the new update strategy and old update strategy [22]. The relevant parameters are as follows: the dimension of the solution space is 2, the size of the belief space is 30, the size of the subspaces is 5, the global maximum number of iterations is 10, and the local maximum number of iterations is 2.
It can be seen in Figure 16 that compared with the old update strategy, the distribution of particle positions in the new update strategy are more dispersed. The new update strategy is easier to obtain the global optimal solution and has a stronger search ability in this paper.
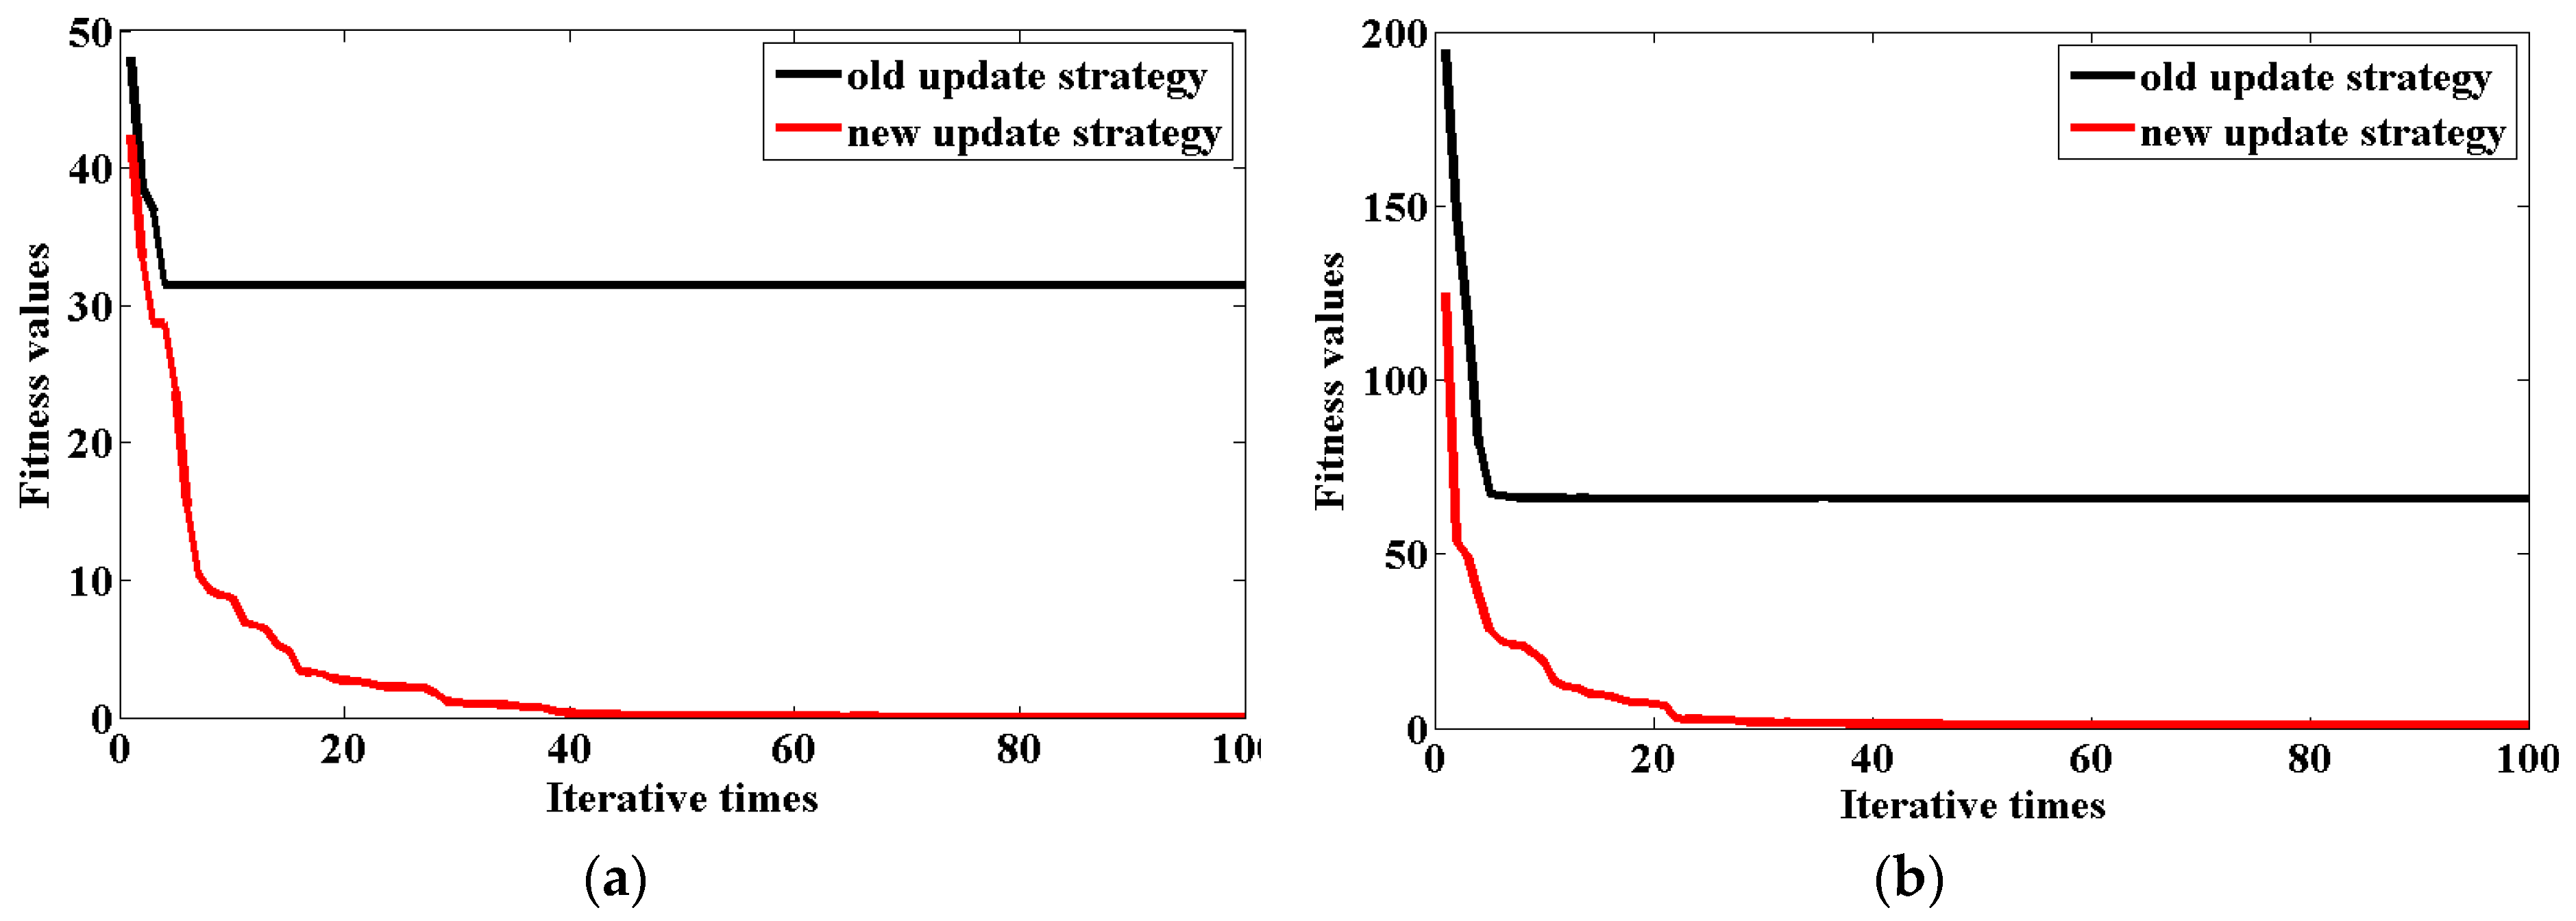
In order to further verify the effectiveness of the new update strategy in its search ability, the fitness function values are calculated by Sphere function and Griewank function in the new update strategy and old update strategy, and the result of the fitness function values are shown in Figure 17. The relevant parameters are as follows: the dimension of the solution space is 30, the size of the belief space is 10, the size of the subspaces is 2, the global maximum number of iterations is 100, and the local maximum number of iterations is 10.
As can be seen in Figure 17, the fitness function values of the old update strategy are always greater than that of the new update strategy in each iteration. Compared with the old update strategy, the new update strategy is more likely to jump out of the local optimization. The experiment results further demonstrate that the search ability of the new update strategy is better than the old update strategy.
4.5. The Adaptability Demonstration of the Proposed Denoising Method and Detection Method
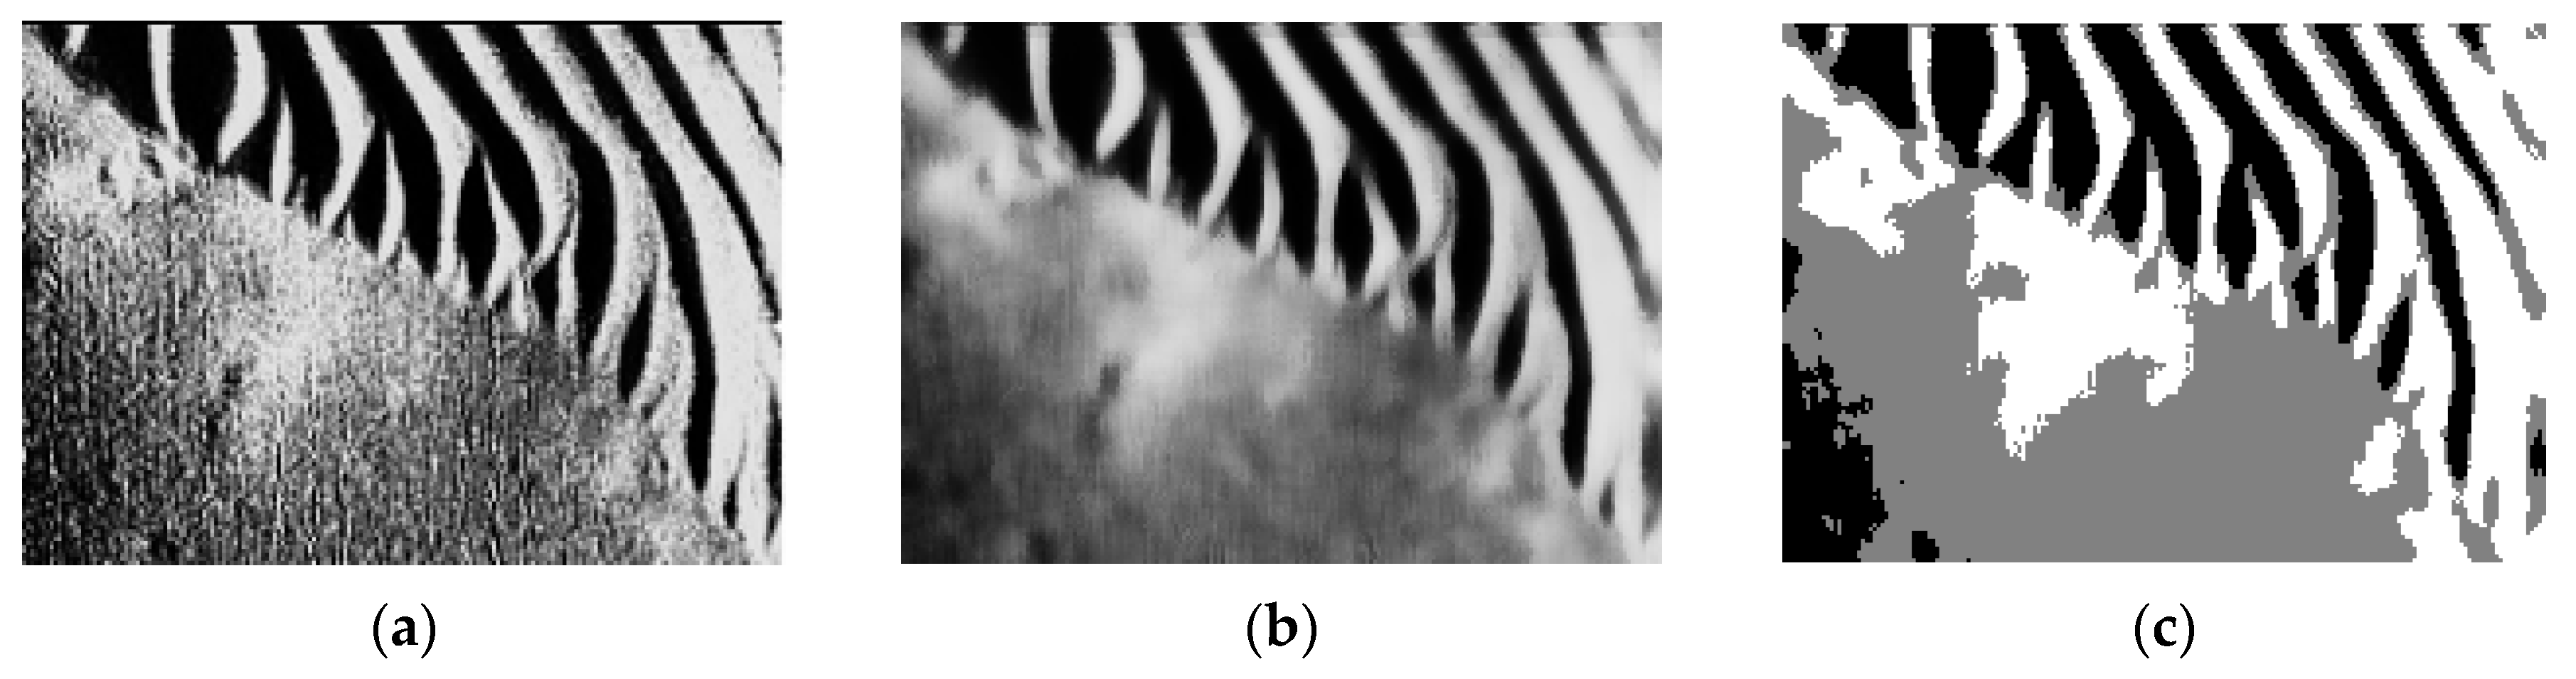
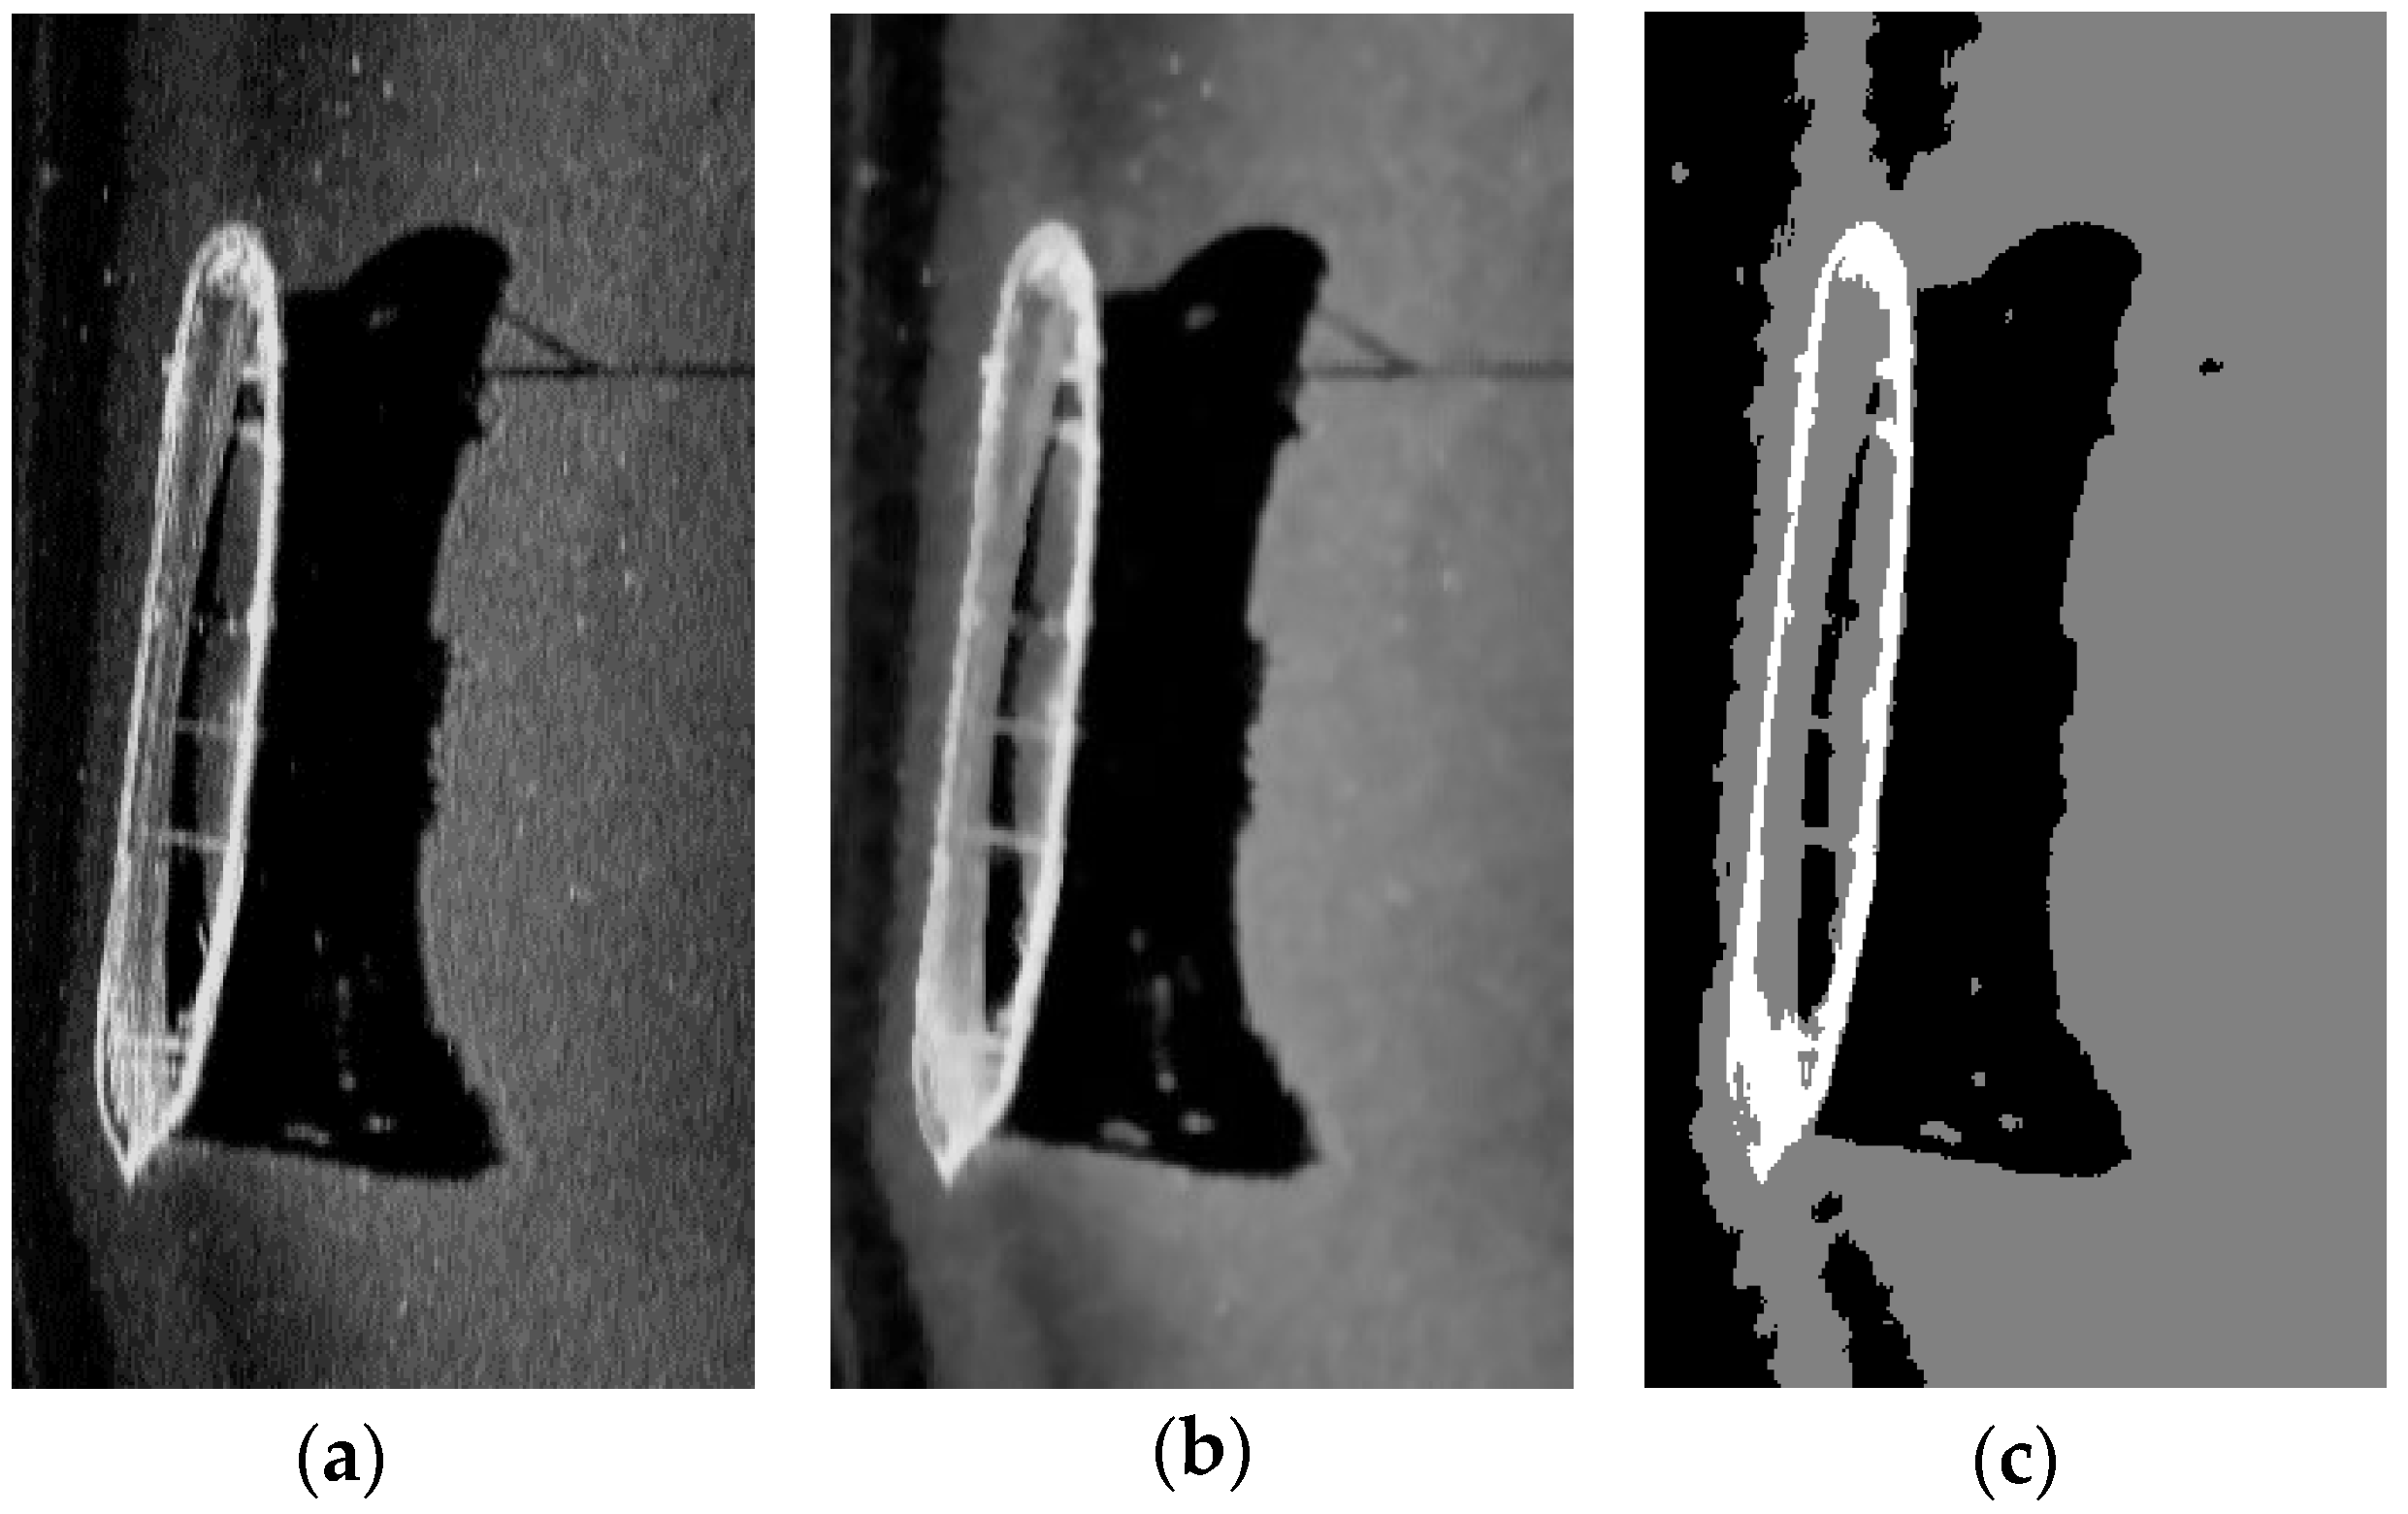
To prove the adaptability of the proposed denoising method and NACA, Figure 18 shows the detection results of the structured seabed which is an object in sand ripples. Figure 19 shows the detection results of the starboard original sonar image with a ship. Figure 20 shows the detection results of a floating object. The experiment environment uses Matlab R2012b with a 2.7 GHz Core processor and 8 GB of RAM.
It can be seen from the detection results in Figure 18b, Figure 19b, and Figure 20b that the proposed denoising method can remove noise effectively in polytype underwater sonar images. The boundary information of the different regions is accurately detected in Figure 18c, Figure 19c, and Figure 20c. Moreover, the iteration times of the algorithm are only two times, which further proves the adaptability of the AIA-DF in this paper. Therefore, the adaptability of the proposed method has been effectively proved.
5. Conclusions
This paper proposed an adaptive approach to denoise and detect the underwater sonar image. The problem of the inappropriate filtering degree parameter means that it seriously affects the denoising performance in underwater sonar images, which is solved by the proposed adaptive non-local spatial information denoising method based on the golden ratio in the paper. NACA is proposed in this paper. Firstly, in the population space, AIA-DF is adopted to obtain good initial clustering centres by calculating the potential entropy of the data field from the underwater sonar images dataset. In the belief space, a new update strategy is adopted to update cultural individuals according to the idea of QSFLA. The new update strategy further improves the search ability of NACA.
We apply the proposed method to the different underwater sonar images. The experimental results demonstrate that the proposed denoising method can effectively remove noise and reduce the difficulty of the following underwater sonar image recognition. Compared to the comparison algorithms, the proposed NACA has more advantages in its search ability and convergence speed (the speed corresponds to the number of iterations). AIA-DF can better locate initial clustering centres and enhance convergence efficiency of NACA which contributes to accurately complete underwater sonar image detection and convergence to the global optimal solution within small epochs. This paper provides an effective and important method for underwater sonar image detection. It has much academic and practical importance.
Author Contributions
Conceptualization, X.W., J.Y., and Q.L.; Methodology, X.H. and W.H.; Software, W.H.; Investigation, X.H. and W.H.; Resources, X.W.; Writing—original draft preparation, Q.L. and W.H.; Writing—review and editing, X.W., Q.L., J.Y., and X.H.; Visualization, X.H.; Supervision, X.W. and J.Y.; Project administration, X.W.; Funding acquisition, X.W.
Funding
This research was supported in part by the National Natural Science Foundation of China grant number 41876110, the Fundamental Research Funds for the Central Universities of China grant number HEUCF180601, the Heilongjiang Province Outstanding Youth Science Fund of China grant number JC2017017, and in part by the Fok Ying-Tong Education Foundation of China grant number 151007.
Conflicts of Interest
The authors declare no conflict of interest.
References
- Wang, X.; Guo, L.; Yin, J.; Liu, Z.; Han, X. Narrowband Chan-Vese model of sonar image segmentation: An adaptive ladder initialization approach. Appl. Acoust. 2016, 113, 238–254. [Google Scholar] [CrossRef]
- Ye, X.; Zhang, Z.; Liu, P.; Guan, H. Sonar image segmentation based on GMRF and Level-set models. Ocean Eng. 2010, 37, 891–901. [Google Scholar] [CrossRef]
- Wang, X.; Liu, S.; Teng, X.; Sun, J.; Jiao, J. SFLA with PSO local search for detection sonar image. In Proceedings of the 2016 35th Chinese Control Conference, Chengdu, China, 27–29 July 2016; pp. 3852–3857. [Google Scholar]
- Wu, J.P.; Guo, H. A method for sonar image segmentation based on combination of MRF and region growing. In Proceedings of the 2015 5th International Conference on Communication Systems and Network Technologies, Gwalior, India, 4–6 April 2015; pp. 457–460. [Google Scholar]
- Zhu, Z.; Yin, H.; Chai, Y.; Li, Y.; Qi, G. A novel multi-modality image fusion method based on image decomposition and sparse representation. Inf. Sci. 2018, 432, 516–529. [Google Scholar] [CrossRef]
- Li, H.; Qiu, H.; Yu, Z.; Li, B. Multifocus image fusion via fixed window technique of multiscale images and non-local means filtering. Signal Process. 2017, 138, 71–85. [Google Scholar] [CrossRef]
- Wang, X.; Liu, S.; Liu, Z. Underwater sonar image detection: A combination of non-local spatial information and quantum-inspired shuffled frog leaping algorithm. PLoS ONE 2017, 12, e0177666. [Google Scholar] [CrossRef]
- Zhao, F.; Jiao, L.; Liu, H.; Gao, X. A novel fuzzy clustering algorithm with non-local adaptive spatial constraint for image segmentation. Signal Process. 2011, 91, 988–999. [Google Scholar] [CrossRef]
- Zhao, F. Fuzzy clustering algorithms with self-tuning non-local spatial information for image segmentation. Neurocomputing 2013, 106, 115–125. [Google Scholar] [CrossRef]
- Wang, L. Segmentation algorithm of fuzzy clustering on side scan sonar image. J. Huazhong Univ. Sci. Technol. 2012, 40, 25–29. [Google Scholar]
- Mignotte, M.; Collect, C.; Perez, P.; Bouthemy, P. Three-class markovian segmentation of high-resolution sonar image. Comput. Vis. Image Underst. 1999, 76, 191–204. [Google Scholar] [CrossRef]
- Mignotte, M.; Collect, C.; Perez, P.; Bouthemy, P. Sonar image segmentation using an unsupervised hierarchical MRF model. IEEE Trans. Signal Process. 2000, 9, 1216–1231. [Google Scholar] [CrossRef]
- Vese, L.; Chan, T. A multiphase level set framework for image segmentation using the mumford and shah model. Int. J. Comput. Vis. 2002, 50, 271–293. [Google Scholar] [CrossRef]
- Lianantonakis, M.; Petillot, Y. Sidescan sonar segmentation using active contours and level set methods. In Proceedings of the Oceans Europe 2005, Brest, France, France, 20–23 June 2005; pp. 719–724. [Google Scholar]
- Lianantonakis, M.; Petillot, Y. Sidescan sonar segmentation using texture descriptors and active contours. IEEE J. Ocean. Eng. 2007, 32, 744–752. [Google Scholar] [CrossRef]
- Liu, G.; Bian, H.; Shi, H. Sonar image segmentation based on an improved level set method. Phys. Procedia 2012, 33, 1168–1175. [Google Scholar] [CrossRef]
- Awad, N.; Ali, M.; Suganthan, P.; Reynolds, R. CADE: A Hybridization of cultural algorithm and differential evolution for numerical optimization. Inf. Sci. 2017, 378, 215–241. [Google Scholar] [CrossRef]
- Khatami, A.; Mirghasemi, S.; Khosravi, A.; Lim, C.P.; Nahavandi, S. A new PSO-based approach to fire flame detection using K-Medoids clustering. Expert Syst. Appl. 2017, 68, 69–80. [Google Scholar] [CrossRef]
- Morra, L.; Coccia, N.; Cerquitelli, T. Optimization of computer aided detection systems: An evolutionary approach. Expert Syst. Appl. 2018, 100, 45–156. [Google Scholar] [CrossRef]
- Wei, Z.; Bu, Y. Cultural particle swarm optimization algorithm and its application. In Proceedings of the 2012 24th Chinese Control and Decision Conference, Taiyuan, China, 23–25 May 2012; pp. 740–744. [Google Scholar]
- Liu, T.; Jiao, L.; Ma, W.; Ma, J.; Shang, R. A new quantum-behaved particle swarm optimization based on cultural evolution mechanism for multiobjective problems. Knowl. Based Syst. 2016, 101, 90–99. [Google Scholar] [CrossRef]
- Wang, X.; Hao, W.; Li, Q. An adaptive cultural algorithm with improved quantum-behaved particle swarm optimization for sonar image detection. Sci. Rep. 2017, 7, 17733. [Google Scholar] [CrossRef]
- Wang, S.; Wang, D.; Li, C.; Li, Y.; Ding, G. Clustering by fast search and find of density peaks with data field. Chin. J. Electron. 2016, 25, 397–402. [Google Scholar] [CrossRef]
- Zhang, Y.; Lu, K.; Gao, Y. Quantum algorithms and quantum-inspired algorithms. Chin. J. Comput. 2013, 36, 1835–1842. [Google Scholar] [CrossRef]
- Wang, X.; Liu, S.; Li, Q.; Liu, Z. Underwater sonar image detection: A novel quantum-inspired shuffled frog leaping algorithm. Chin. J. Electron. 2018, 27, 588–594. [Google Scholar] [CrossRef]
- Ding, W.; Wang, J.; Guan, Z.; Shi, Q. Enhanced minimum attribute reduction based on quantum-inspired shuffled frog leaping algorithm. J. Syst. Eng. Electron. 2013, 24, 426–434. [Google Scholar] [CrossRef]
- Ding, W.; Wang, J.; Guan, Z. A minimum attribute self-adaptive cooperative co-evolutionary reduction algorithm based on quantum elitist frogs. J. Comput. Res. Dev. 2014, 51, 743–753. [Google Scholar]
- Zhang, B.; Qi, H.; Sun, S.; Ruan, L.; Tan, H. Solving inverse problems of radiative heat transfer and phase change in semitransparent medium by using improved quantum particle swarm optimization. Int. J. Heat Mass Transf. 2015, 85, 300–310. [Google Scholar] [CrossRef]
Figure 1.
The estimated values of the optimal threshold (image size: 277 × 325): (a) Original sonar image; (b) The estimated values of the optimal threshold.
Figure 1.
The estimated values of the optimal threshold (image size: 277 × 325): (a) Original sonar image; (b) The estimated values of the optimal threshold.

Figure 2.
The estimated values of the optimal threshold (image size: 173 × 167): (a) Original sonar image; (b) The estimated values of the optimal threshold.
Figure 2.
The estimated values of the optimal threshold (image size: 173 × 167): (a) Original sonar image; (b) The estimated values of the optimal threshold.

Figure 3.
The estimated values of the optimal threshold (image size: 197 × 211): (a) Original sonar image; (b) The estimated values of the optimal threshold.
Figure 3.
The estimated values of the optimal threshold (image size: 197 × 211): (a) Original sonar image; (b) The estimated values of the optimal threshold.

Figure 4.
The estimated values of the optimal threshold (image size: 205 × 201): (a) Original sonar image; (b) The estimated values of the optimal threshold.
Figure 4.
The estimated values of the optimal threshold (image size: 205 × 201): (a) Original sonar image; (b) The estimated values of the optimal threshold.

Figure 5.
The estimated values of the optimal threshold (image size: 130 × 106): (a) Original sonar image; (b) The estimated values of the optimal threshold.
Figure 5.
The estimated values of the optimal threshold (image size: 130 × 106): (a) Original sonar image; (b) The estimated values of the optimal threshold.

Figure 6.
The estimated values of the optimal threshold (image size: 146 × 135): (a) Original sonar image; (b) The estimated values of the optimal threshold.
Figure 6.
The estimated values of the optimal threshold (image size: 146 × 135): (a) Original sonar image; (b) The estimated values of the optimal threshold.

Figure 7.
The result of the linear fitting based on Table 1.
Figure 7.
The result of the linear fitting based on Table 1.

Figure 8.
Schematic diagram of CA (cultural algorithm).

Figure 9.
The denoising results based on Figure 1a of the proposed denoising method in this paper and the previous denoising method: (a) The denoising result of the denoising method proposed in this paper; (b) The result of filtering the degree parameter is selected by two adaptive thresholds in the proposed denoising method; (c) The denoising result of the previous denoising method; (d) The result of the filtering degree parameter is selected by two previous thresholds in the previous denoising method.

Figure 10.
The detection results of the fuzzy c-means (FCM) based on Figure 9b,d: (a) FCM detection result when ; (b) FCM detection result when ; (c) FCM detection result when ; (d) FCM detection result when .
Figure 10.
The detection results of the fuzzy c-means (FCM) based on Figure 9b,d: (a) FCM detection result when ; (b) FCM detection result when ; (c) FCM detection result when ; (d) FCM detection result when .

Figure 11.
Detection results of the image shown in Figure 9a: (a) Detection result of NACA (new adaptive cultural algorithm); (b) Detection result of QSFLA-NSM (quantum-inspired shuffled frog leaping algorithm combining the new search mechanism); (c) Detection result of ACA-IQPSO (adaptive cultural algorithm with improved quantum-behaved particle swarm optimization); (d) Detection result of QSFLA (quantum-inspired shuffled frog leaping algorithm); (e) Detection result of CPSO (cultural particle swarm optimization algorithm); (f) Detection result of QPSO (quantum-behaved particle swarm optimization).

Figure 12.
The chart of the best fitness function values in Table 2.
Figure 12.
The chart of the best fitness function values in Table 2.

Figure 13.
Detection results of the underwater sonar image (image size: 112×117): (a) Original sonar image; (b) The denoising result of the denoising method proposed in this paper; (c) Detection result of NACA; (d) Detection result of QSFLA-NSM; (e) Detection result of ACA-IQPSO; (f) Detection result of QSFLA; (g) Detection result of CPSO; (h) Detection result of QPSO.

Figure 14.
The chart of the best fitness function values in Table 3.
Figure 14.
The chart of the best fitness function values in Table 3.

Figure 15.
Detection result after the first iteration in the detection process of Figure 11: (a) Detection result of NACA; (b) Detection result of QSFLA-NSM; (c) Detection result of ACA-IQPSO; (d) Detection result of QSFLA; (e) Detection result of CPSO; (f) Detection result of QPSO.
Figure 15.
Detection result after the first iteration in the detection process of Figure 11: (a) Detection result of NACA; (b) Detection result of QSFLA-NSM; (c) Detection result of ACA-IQPSO; (d) Detection result of QSFLA; (e) Detection result of CPSO; (f) Detection result of QPSO.

Figure 16.
The distribution of particle positions in the new update strategy and old update strategy: (a) Position distribution of particles on Sphere function; (b) Position distribution of particles on Griewank function.
Figure 16.
The distribution of particle positions in the new update strategy and old update strategy: (a) Position distribution of particles on Sphere function; (b) Position distribution of particles on Griewank function.

Figure 17.
The result of the fitness value calculation in the new update strategy and old update strategy: (a) The optimization results of the Sphere function; (b) The optimization results of the Griewank function.
Figure 17.
The result of the fitness value calculation in the new update strategy and old update strategy: (a) The optimization results of the Sphere function; (b) The optimization results of the Griewank function.

Figure 18.
Detection results of the underwater sonar image (image size: 259×368): (a) Original sonar image; (b) The denoising result of the denoising method proposed in this paper; (c) Detection result of NACA.
Figure 18.
Detection results of the underwater sonar image (image size: 259×368): (a) Original sonar image; (b) The denoising result of the denoising method proposed in this paper; (c) Detection result of NACA.

Figure 19.
Detection results of the underwater sonar image (image size: 259×368): (a) Original sonar image; (b) The denoising result of the denoising method proposed in this paper; (c) Detection result of NACA.
Figure 19.
Detection results of the underwater sonar image (image size: 259×368): (a) Original sonar image; (b) The denoising result of the denoising method proposed in this paper; (c) Detection result of NACA.

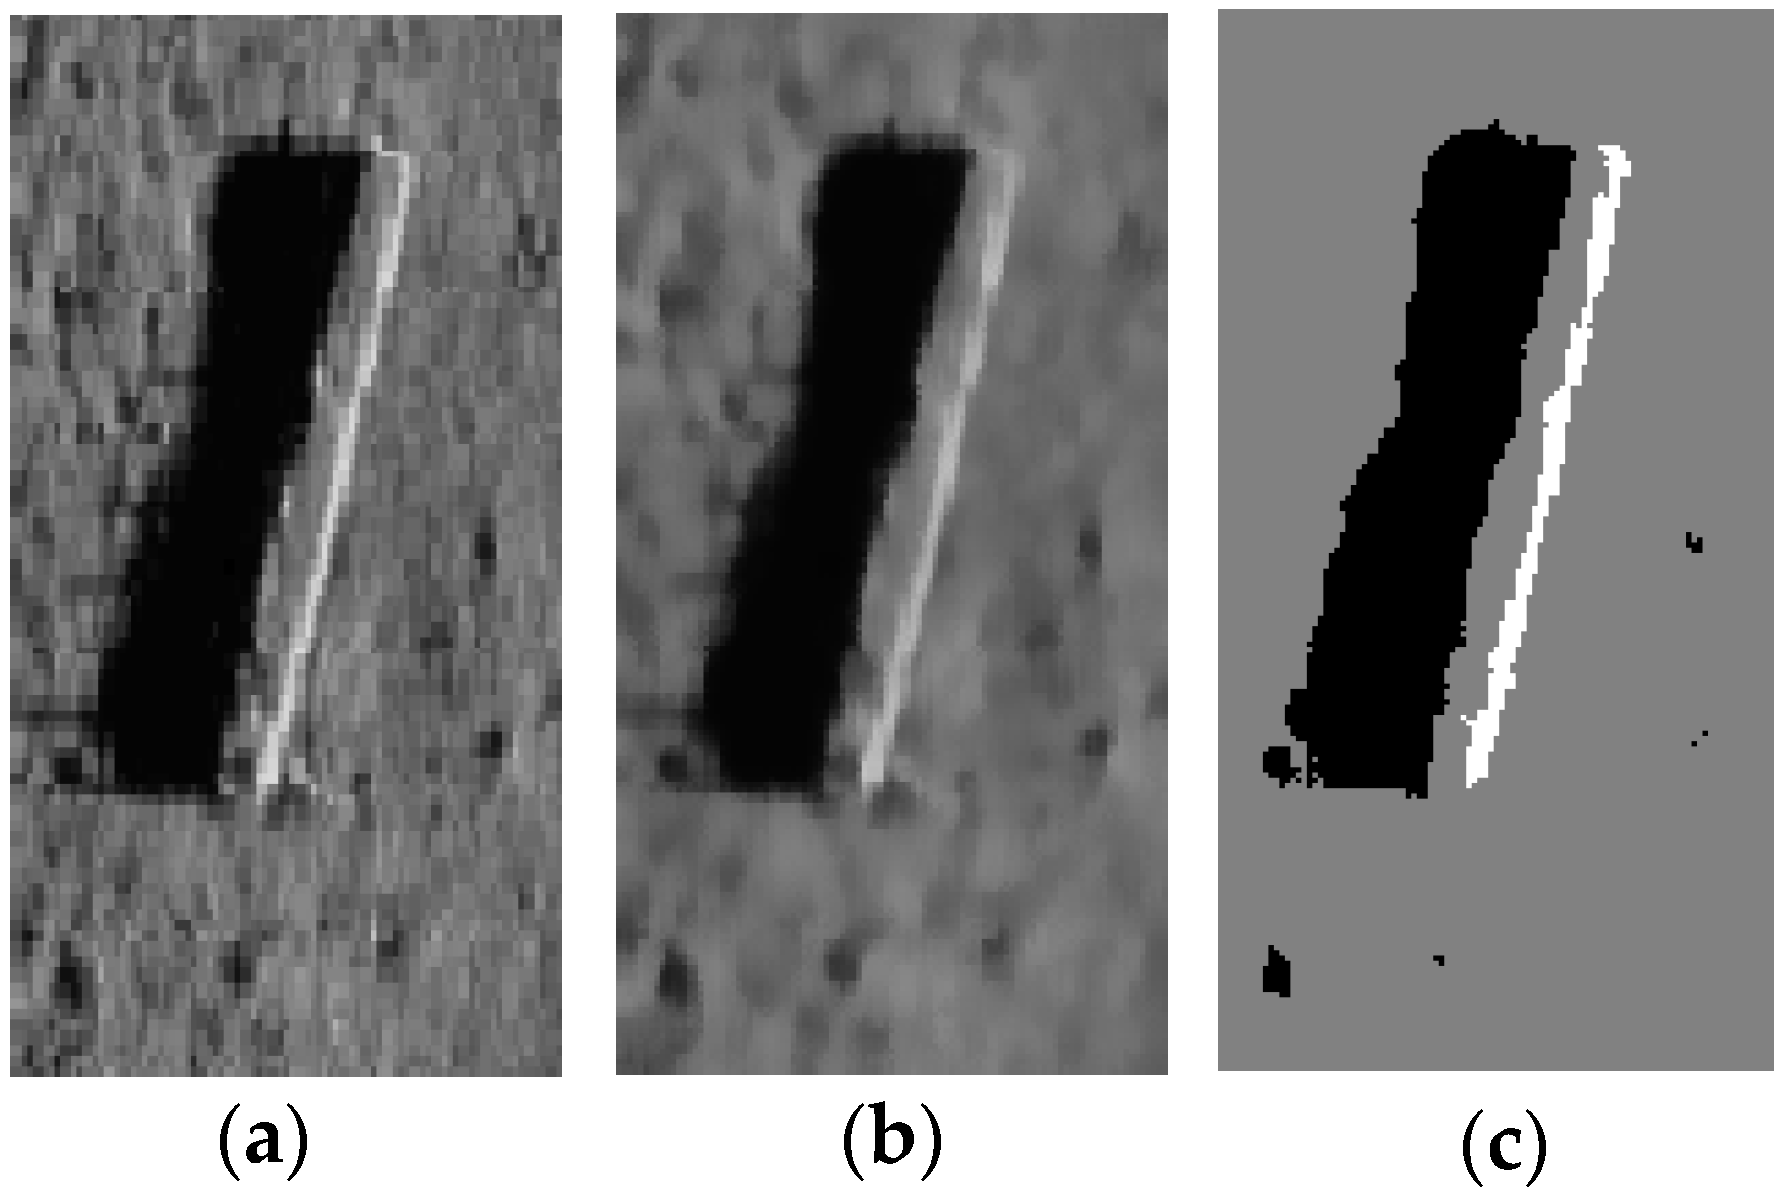
Figure 20.
Detection results of the underwater sonar image (image size: 203×101): (a) Original sonar image; (b) The denoising result of the denoising method proposed in this paper; (c) Detection result of NACA.
Figure 20.
Detection results of the underwater sonar image (image size: 203×101): (a) Original sonar image; (b) The denoising result of the denoising method proposed in this paper; (c) Detection result of NACA.


Table 1.
The estimated optimal threshold and of 20 different underwater sonar images.
| - | |||
|---|---|---|---|
| 1 | 0.030 | 0.050 | 0.539 |
| 2 | 0.040 | 0.200 | 0.609 |
| 3 | 0.015 | 0.030 | 0.689 |
| 4 | 0.020 | 0.035 | 0.624 |
| 5 | 0.010 | 0.050 | 0.634 |
| 6 | 0.010 | 0.040 | 0.584 |
| 7 | 0.005 | 0.040 | 0.617 |
| 8 | 0.010 | 0.035 | 0.681 |
| 9 | 0.005 | 0.030 | 0.532 |
| 10 | 0.010 | 0.040 | 0.575 |
| 11 | 0.002 | 0.005 | 0.567 |
| 12 | 0.030 | 0.100 | 0.604 |
| 13 | 0.005 | 0.040 | 0.676 |
| 14 | 0.010 | 0.060 | 0.636 |
| 15 | 0.005 | 0.015 | 0.650 |
| 16 | 0.005 | 0.020 | 0.649 |
| 17 | 0.010 | 0.025 | 0.605 |
| 18 | 0.020 | 0.035 | 0.571 |
| 19 | 0.005 | 0.070 | 0.556 |
| 20 | 0.030 | 0.050 | 0.539 |
Table 2.
The values of fitness function after each iteration in the detection process.
| Iterative Times | NACA | QSFLA-NSM | ACA-IQPSO | QSFLA | CPSO | QPSO |
|---|---|---|---|---|---|---|
| 1 | 3.024 | 2.188 | 2.028 | 1.969 | 1.737 | 1.724 |
| 2 | 3.024 | 2.495 | 2.320 | 2.554 | 2.100 | 2.024 |
| 3 | 3.024 | 2.695 | 2.520 | 2.554 | 2.236 | 2.083 |
| 4 | 3.024 | 2.695 | 2.520 | 2.554 | 2.315 | 2.083 |
| 5 | 3.024 | 2.695 | 2.520 | 2.554 | 2.417 | 2.241 |
| 6 | 3.087 | 2.695 | 2.806 | 2.554 | 2.417 | 2.241 |
| 7 | 3.087 | 2.695 | 2.806 | 2.554 | 2.421 | 2.241 |
| 8 | 3.087 | 2.862 | 2.806 | 2.727 | 2.475 | 2.410 |
| 9 | 3.087 | 2.862 | 2.806 | 2.727 | 2.475 | 2.410 |
| 10 | 3.087 | 2.862 | 2.806 | 2.727 | 2.475 | 2.410 |
Table 3.
The values of fitness function after each iteration in the detection process.
| Iterative Times | NACA | QSFLA-NSM | ACA-IQPSO | QSFLA | CPSO | QPSO |
|---|---|---|---|---|---|---|
| 1 | 2.365 | 2.184 | 2.003 | 1.956 | 1.794 | 2.066 |
| 2 | 2.477 | 2.184 | 2.003 | 2.080 | 1.951 | 2.066 |
| 3 | 2.477 | 2.212 | 2.003 | 2.080 | 2.103 | 2.170 |
| 4 | 2.477 | 2.212 | 2.133 | 2.312 | 2.103 | 2.170 |
| 5 | 2.532 | 2.212 | 2.133 | 2.337 | 2.162 | 2.170 |
| 6 | 2.532 | 2.426 | 2.133 | 2.337 | 2.226 | 2.170 |
| 7 | 2.532 | 2.426 | 2.273 | 2.337 | 2.226 | 2.184 |
| 8 | 2.532 | 2.426 | 2.273 | 2.337 | 2.253 | 2.209 |
| 9 | 2.532 | 2.426 | 2.273 | 2.337 | 2.253 | 2.209 |
| 10 | 2.532 | 2.426 | 2.273 | 2.337 | 2.253 | 2.209 |
© 2019 by the authors. Licensee MDPI, Basel, Switzerland. This article is an open access article distributed under the terms and conditions of the Creative Commons Attribution (CC BY) license (http://creativecommons.org/licenses/by/4.0/).
Share and Cite
MDPI and ACS Style
Wang, X.; Li, Q.; Yin, J.; Han, X.; Hao, W. An Adaptive Denoising and Detection Approach for Underwater Sonar Image. Remote Sens. 2019, 11, 396. https://doi.org/10.3390/rs11040396
AMA Style
Wang X, Li Q, Yin J, Han X, Hao W. An Adaptive Denoising and Detection Approach for Underwater Sonar Image. Remote Sensing. 2019; 11(4):396. https://doi.org/10.3390/rs11040396
Chicago/Turabian StyleWang, Xingmei, Qiming Li, Jingwei Yin, Xiao Han, and Wenqian Hao. 2019. "An Adaptive Denoising and Detection Approach for Underwater Sonar Image" Remote Sensing 11, no. 4: 396. https://doi.org/10.3390/rs11040396
Note that from the first issue of 2016, this journal uses article numbers instead of page numbers. See further details here.