Article

Satellite-Based Assessment of Grassland Conversion and Related Fire Disturbance in the Kenai Peninsula, Alaska

1
NASA DEVELOP National Program, NASA Langley Research Center MS 307, Hampton, VA 23681, USA
2
Department of Geographical Sciences, University of Maryland, College Park, MD 20742, USA
3
NOAA-Crest Center, The City University of New York, Bronx, NY 10453, USA
4
Department of Mechanical Engineering, University of California, Riverside, CA 92521, USA
5
Department of Geography, University of South Carolina, Columbia, SC 29208, USA
6
Science Systems and Applications, Inc., 10210 Greenbelt Rd, Lanham, MD 20706, USA
7
Kenai National Wildlife Refuge, U.S. Fish and Wildlife Service, Soldotna, AK 99669, USA
8
Hydrological Sciences Laboratory, NASA Goddard Space Flight Center, Mail Code 617.0, Greenbelt, MD 20771, USA
9
School of Informatics, Computing, and Cyber Systems, Northern Arizona University, 1295 Knoles Dr., Flagstaff, AZ 86011, USA
10
Science Systems and Applications, Inc., Consultant, 88384 Diamondhead Drive East, Diamondhead, MS 39525, USA
*
Authors to whom correspondence should be addressed.
Remote Sens. 2019, 11(3), 283; https://doi.org/10.3390/rs11030283
Submission received: 24 November 2018 / Revised: 4 January 2019 / Accepted: 5 January 2019 / Published: 1 February 2019
(This article belongs to the Special Issue Remote Sensing of Wildfire)

Abstract

:
Spruce beetle-induced (Dendroctonus rufipennis (Kirby)) mortality on the Kenai Peninsula has been hypothesized by local ecologists to result in the conversion of forest to grassland and subsequent increased fire danger. This hypothesis stands in contrast to empirical studies in the continental US which suggested that beetle mortality has only a negligible effect on fire danger. In response, we conducted a study using Landsat data and modeling techniques to map land cover change in the Kenai Peninsula and to integrate change maps with other geospatial data to predictively map fire danger for the same region. We collected Landsat imagery to map land cover change at roughly five-year intervals following a severe, mid-1990s beetle infestation to the present. Land cover classification was performed at each time step and used to quantify grassland encroachment patterns over time. The maps of land cover change along with digital elevation models (DEMs), temperature, and historical fire data were used to map and assess wildfire danger across the study area. Results indicate the highest wildfire danger tended to occur in herbaceous and black spruce land cover types, suggesting that the relationship between spruce beetle damage and wildfire danger in costal Alaskan forested ecosystems differs from the relationship between the two in the forests of the coterminous United States. These change detection analyses and fire danger predictions provide the Kenai National Wildlife Refuge (KENWR) ecologists and other forest managers a better understanding of the extent and magnitude of grassland conversion and subsequent change in fire danger following the 1990s spruce beetle outbreak.

Graphical Abstract

1. Introduction

In the mid-1990s, North America’s largest recorded outbreak of spruce beetles (Dendroctonus rufipennis Kirby) killed nearly 5 million acres of forest on and around south-central Alaska’s Kenai Peninsula [1]. Stands of White and Lutz spruce (Picea glauca; Picea x lutzii) were particularly vulnerable, with the boreal forest ecosystem on the peninsula’s western lowlands suffering mature tree mortalities as high as 87% in some areas [2]. Kenai’s boreal spruce stands typically exhibit high tree densities with individuals between 15–30 m in height and up to 60–90 cm diameter at breast height (DBH) [3], making these forests more susceptible to the spread of spruce beetle infestation [4,5,6,7]. Spruce beetle-induced mortality results in foliar desiccation (“red phase”) before an eventual needledrop (“gray phase”), thus opening the canopy and often permitting ecological succession towards more grass-dominant types [8]. Such infestations, in addition to causing habitat loss, also harm the timber economy, detract from regional tourism, increase risk of property damage due to treefall, and cause potential shifts in the fire regime [9] (pp. 195–197). Beetle-specific mortality desiccates trees and has been observed to cause greater likelihoods of uprooting or mid-tree breakage during fire than other causes of mortality, making beetle-affected areas more dangerous for firefighters [8]. Decaying trees at any stage may exhibit loose or weakened bark, cones, or branch materials that can easily be carried aloft during fires and create increased risk of spotting [10]. Both beetle outbreaks and fires are of serious concern to wildlife, vegetation, and other natural and urban resource managers in the region. Because the Kenai Peninsula is one of Alaska’s most densely populated boroughs and is a cornerstone of the state’s tourism economy, the ability to forecast and mitigate these disturbances is of high value to a variety of local stakeholders.
Southern Alaska has been witnessing another rapid surge in spruce beetle populations since 2014 [1], and local climatic conditions are becoming increasingly favorable for both spruce beetles and wildfire. The peninsula has become drier and warmer, experiencing a 1–2 °C temperature increase over the last half-century [11]. Previous studies have not only suggested that increasing temperatures correlate with fire danger, but also that multi-year spans of above-average summer temperatures may positively correlate with risk of beetle infestation (providing enough suitable, mature trees) [2,12]. Warmer, drier conditions increase the rate at which spruce beetles reach maturity, remove climatic barriers to the spread of infestations, and weaken spruce trees’ natural defenses against tree-killing bark beetles, such as the production of resin [13] (pp. 604–606). The beetle outbreak of the mid-1990s differed notably from previous infestations in the region. Specifically, it was not preceded by a clearly identifiable disturbance, such as a fire or windfall, which would have elevated beetle populations and jeopardized the defense mechanisms of spruce populations [12] (p. 220). Previous studies in both Alaska and the continental United States have suggested that droughts or consecutive years of above-average temperatures can make spruce forests more vulnerable to regional beetle outbreaks [12,14]. However, these studies were based on a relatively small sample of recorded outbreaks.
Although some studies of the continental United States [15,16] have observed that wildfire frequency and size are not significantly increased by beetle-induced damages, others suggest that the opposite may be true in Alaskan boreal forests where canopy loss often lends itself to grassland conversion [17,18]. Increased grass cover, paired with the accumulation of dried foliage after beetle outbreaks, creates conditions conducive to the surface fuel ignition typical of boreal forests [18]. A shifting fire regime is of particular concern in the Kenai region, as the peninsula’s white spruce vegetation types are characterized by fire return intervals (FRIs) of approximately 400–600 years [17]. Even where grass encroachment is high, Kenai’s spruce forests have historically exhibited sufficient density to quickly recover after beetle outbreaks [19]. In recent years, Kenai National Wildlife Refuge (KENWR) ecologists have observed this rate to have sharply decreased (D. Magness, pers. comm.). It is unclear how the compounding threats of rising temperatures, increased wildfire frequency, and beetle outbreaks will shape long-term ecological succession of vegetation on the Kenai Peninsula. However, we hypothesize that areas that have converted to grassland subsequent to spruce beetle-induced forest mortality, as well as forest adjacent to these converted areas, will exhibit greater wildfire danger.
Shifts in the fire regime may be addressed through fire risk modeling. Previous works have shown correlations between vegetation, or fuel, properties and increased fire risk through the use of remote sensing. Many have used such methodologies to assess fire conditions at national or global scales as well as for particular study areas. Others have focused on fire conditions and fire drivers during specific historical fires. In a national-level assessment of fire danger, Burgan et al. proposed the use of simplified set of fuel models to derive a so-called Fire Potential Index (FPI) [20]. A similar study by Chuvieco et al. proposed the use of a Fire Danger Index (FDI) derived from a weather danger index, a human risk index and a fuel hazard component [21]. Their fuel hazards component approach follows others in characterizing fuel properties through fuel models. Moreover, Stavros et al. [22] used remote sensing to derive fuel maps, which they denote as categorical fuel classifications (CFCs). The resulting CFCs were used to relate fuel conditions to fire behavior during the 2014 California King Fire. Saglam et al. [23], used remote sensing data to determine fire risk and fire danger indices for the Kourag forest in northwestern Turkey. Their resulting fire danger potential index integrated fuel characteristics including species composition, stand crown closure and stages of stand development as well as slope and insolation as representatives of terrain conditions. In a similar fire danger assessment, Bisquert et al., investigated the use of various vegetation indices to assess fire danger for the Galician and Asturian regions of Spain [24]. In this study we aim to incorporate relevant studies such as the ones previously mentioned to correlate vegetation change to increased fire susceptibility in the Kenai Peninsula through fire danger mapping. It is worth noting that although fire risk and fire danger are often used interchangeably, some authors have advocated for distinctions between the two. For instance, fire risk modeling approaches have been related to those which integrate ignition source considerations whereas fire danger modeling approaches may be related to those assessing vegetation status [25]. Hence in this study in order to capture correlations between vegetation, fuel, characteristics and fire conditions we adopt what will hereby be called a fire danger modeling technique.
Our research aimed to develop a proof-of-concept for a fire danger modeling methodology to quantify fire danger on the Peninsula and assess whether the relationship between spruce beetle infestation and fire danger observed in the continental US holds true in coastal Alaska. We conducted research to explore the potential utility of satellite imagery in characterizing the relationship, if one exists, between grassland conversion and emergent wildfire danger in Alaskan boreal forests. The project objectives were to: (1) build an optimized land cover classification system tailored to detecting forest-to-grassland conversion on this peninsula, (2) use this system to map grassland conversion and detect land cover changes from 1995 (at the apex of the 1990s beetle outbreak) to the present, and (3) develop a model for quantifying and mapping emergent wildfire danger resulting from this conversion. The KENWR, administered by the U.S. Fish and Wildlife Service (USFWS), provided in situ data and consultation for this research with the intent of better understanding ecological trajectories in a shifting disturbance regime. Our research was conducted to support the KENWR’s decision-making process to improve planning for fire control and ecosystem restoration efforts. This research was performed to help land resource managers better predict changes in forest structure and fire regime, not only protecting adjacent stakeholders in Kenai from the socioeconomic damages of forest loss, but also yielding lessons that can be transferable to both Interior Alaska and Canada’s Yukon Territory where large expanses of similar spruce-dominated boreal forest are present.

Study Area

The United States Geological Survey’s Geographic Names Information System (GNIS) [26] defines the Kenai Peninsula as being located between 59° and 61°N latitudes and 152° and 147°W longitudes in south-central Alaska (Figure 1a). Containing the Kenai Mountains along its eastern half, the peninsula ranges in elevation from sea level to around 2100 m. Our study area (Figure 1b) was situated on the flatter interior coast along the Cook Inlet (59°35′ to 61°3′N latitude, 149°58′ to 151°53′W longitude). These spruce forest lowlands contain most of the peninsula’s urban areas and have witnessed all of the peninsula’s recorded fires greater than 1000 acres in size since 1940 [27]. The decision to exclude the Kenai Mountains was intended to streamline our classification process by minimizing non-vegetated land cover. The study area is divided roughly in half by Tustumena Lake. The northern half contains most of the KENWR and consists largely of terrain that is low-lying, marshy, and characterized by the dominance of the more beetle-resistant, but fire prone, black spruce (Picea mariana) [17] (p. 282). The southern half, including the Caribou Hills region, is more topographically varied and dominated by white and Lutz spruces which can be particularly vulnerable to beetle damage [3,17].
As mentioned in the above section, White and Lutz spruce-dominant forests on the Peninsula have historically exhibited FRIs of around 400–600 years [17,28], while areas of the Kenai Peninsula dominated by black spruce have historically witnessed shorter FRIs of around 90 years [29]. Dominance of either spruce type is characteristic of late successional stages [3,28,29,30,31], with post fire succession progressing through moss, shrub/saplings, hardwoods, and finally spruce dominance [3,30,31]. However, while black spruce dominance in Alaska has been observed to take about 90 years [31], an analogous stage in Alaskan white spruce forests may take 150–300 years [30,32].

2. Materials and Methods

2.1. Data Acquisition—Classification & Vegetation Transition

We used the United States Geological Survey’s EarthExplorer data portal (https://earthexplorer.usgs.gov/) to access NASA’s Landsat Collection 1 Level-2 (on demand) atmospherically corrected surface reflectance imagery (Path 069, Rows 017–019). In selecting suitable Landsat scenes, a threshold of 20% for cloud cover was used to identify scenes with low cloud cover for use in the project. Scenes surpassing this threshold were queried out to minimize the amount of data lost due to eventual pixel masking. The included imagery dates were selected to constitute a complete, yet concise, timeline of Kenai’s ecological succession in the wake of the 1990s spruce beetle infestation. We chose scenes from 20 August 1995, 9 June 2001, 27 May 2008, 12 May 2011, and 4 May 2014. Landsat 5 Thematic Mapper (TM), Landsat 7 Enhanced Thematic Mapper Plus (ETM+), and Landsat 8 Operational Land Imager (OLI) scenes captured grassland conversion from the apex of the 1990s infestation to the present. As a means of eventual validation for our land cover classification process, we also acquired and used supplemental high-resolution (30 cm) imagery from DigitalGlobe’s WorldView-3 (WV-3) satellite sensor, via the NextView Licensing agreement with the National Geospatial-Intelligence Agency.
Partners at the KENWR provided ancillary vector data that include fire history data from 1989 to the present and a series of points delineating 2015 land cover ground-truthed from sample plots. These points were spread across the peninsula and identified land cover type at each site as herbaceous, shrubland, black spruce forest, white spruce forest, peatland or wetland. KENWR ecologists also provided a provisional 2017 vegetation type classification of the peninsula that is currently being validated on the ground. This map had data for the entire peninsula, and gave the dominant tree species in forested areas or categorized the land cover as shrubland, herbaceous, developed, barren, water, wetland or peatland. For simplicity in our classification, we consolidated many of the categories given in the 2017 map. In addition to the WV-3 imagery, these layers informed the development and validation of our land cover classification system and served as a reference for our wildfire danger model.

2.2. Data Acquisition—Fire Danger Analysis

The preliminary steps for fire model derivation involved identification of appropriate time and length scale and the selection of input variables. In establishing an appropriate time scale, we follow prescriptions by Chuvieco et al. in considering our study as long term as it involves decadal vegetation change and long term increased fire danger which require assessments of static risk factors [33]. Further, because we are particularly interested in the effects of vegetation changes on increased fire susceptibility in the Kenai Peninsula region, here we used, as described before, a fire danger modeling approach. In order to derive a fire danger model which closely represents potential correlations between fuel changes and fire trends, we followed recommendations by Andrews et al. [34] in choosing input variables suitable for ‘fire environment’ type modeling. In this type of modeling, pre-fire conditions related to fuels, weather and terrain are addressed in the modeling approach. By defining our fire modeling approach in this way we were able to select input variables appropriate to our application: aspect, slope, elevation, temperature, and vegetation.
Historical fires obtained from the Alaska FIREHouse database prepared by the Alaska Fire Service for 2001, 2008, 2010, 2012 and 2014 together with 2014 MODIS fire pixels were selected as representative fire-events for algorithm training. A 10 m resolution Digital Elevation Model (DEM) from the United States Geological Survey’s (USGS) 3D Elevation Program (3DEP) was used to produce elevation, slope, and aspect information. Classifications of land cover type derived from Landsat imagery, as explained in Section 2.2.1, were used as the vegetation component, and monthly average temperature data, at 1 km resolution, was acquired from the National Scenarios Network for Alaska and Arctic Planning (SNAP) Database. As a comparison for both our classification and fire danger systems, we incorporated data from the USGS LANDFIRE Reference Database (LFRDB), containing classifications of vegetation type, structure, disturbance patterns, and fire regime.

2.2.1. Data Processing—Classification

Landsat spectral bands for three adjacent scenes were merged into a composite mosaic before being clipped down to remove the peninsula’s Eastern mountains. To expedite the process of land cover classification, we created a mask from the pixel Quality Assessment (‘pixel_QA’) bands in the Landsat download package to exclude cloud cover, cloud shadows, snow/ice, and significant water bodies. The removal of these pixels reduced raster processing times and streamlined classification by minimizing the interference of unwanted spectral signatures. In addition to the original Landsat bands, we also calculated the Normalized Difference Vegetation Index (NDVI) to better differentiate between grassland and forest cover. This additional layer, derived from the original bands, supplemented the distinction of different vegetation types by providing an indication of foliar greenness and productivity. While NDVI values cannot be used to directly determine what is grassland and what is forest, different land cover types have different productivity and foliar greenness, so we included the NDVI bands to improve classification accuracy in differentiating between land cover types.
We stacked the original surface reflectance bands (Figure 2a) with the NDVI band, and then used unsupervised segmentation to group neighboring pixels with similar spectral signatures into objects for easier classification (Figure 2b). For images from Landsat 5 (1995 and 2011) and Landsat 7 (2001), the surface reflectance bands included were blue, green, red, near infrared, short wave infrared, thermal infrared, short-wave infrared, and for Landsat 7 only, panchromatic. The surface reflectance bands used for Landsat 8 images (2014) were coastal aerosol, blue, green, red, near infrared, short-wave infrared 1 and 2, panchromatic, and thermal infrared bands. Utilizing the high resolution WV-3 imagery, 2015 ground-truthed land cover points and the draft vegetation type map from ecologists at the KENWR, we then created a set of training samples for the 2014 image. The training samples, along with the segmentation image and the stacked 2014 surface reflectance and NDVI bands, were put through a vector-supervised machine classification using ArcGIS Pro software package. The resulting image (Figure 2c) shows the locations of developed, barren, black spruce forest, mixed forest, shrubland, herbaceous, and wetland land cover.

2.2.2. Data Processing—Vegetation Transition

The vegetation transition between 1995 and 2014 was computed using two measurements: land cover classification and NDVI. For the classification transition detection, we used classified images from 1995 and 2014 that we created using the methodology in Section 2.2.1. Each pixel in these images has a value between 0–6 based on their classified land cover type (0—Developed, 1—Barren, 2—Black Spruce, 3—Mixed Forest, 4—Shrubland, 5—Herbaceous, 6—Wetland). The 2014 values were multiplied by 100 and the 1995 values were subsequently subtracted. We took the resulting image and symbolized it with unique values, then kept only the values 397 (which indicates a pixel that has transitioned from mixed forest to shrubland), 398 (black spruce forest to shrubland), 497 (mixed forest to herbaceous), and 498 (black spruce forest to herbaceous). The resulting map shows pixels that have transitioned from forest to grassland (Figure 3).
NDVI change with respect to time was calculated using the following Equation (1). The resulting map showed the percent change in NDVI from 1995 to 2014.
NDVI Change = NDVI Current NDVI Historic NDVI Historic

2.2.3. Data Processing—Fire Danger Probability Model

In this study, we define fire danger as the probability that fire occurs in the study area by considering predisposing factors that are only related to the intrinsic characteristic of the region. We apply a stochastic approach in the form of a logistic regression that combines independent factors in a random process. The logistic regression approach helps determine the influence of each factor on the probability that fire occurs. Logistic regression is particularly suitable for our analysis because we do not incorporate the complex and nonlinear relationships of anthropogenic and biophysical factors. As it has previously been established by Gou et al., these relationships maybe, in some instances, too complex to be modeled linearly.
Nonetheless, various studies [35,36,37,38] have successfully applied the logistic regression approach to evaluate the relationship between factors and fire events. The analysis results in a binary outcome of a fire-event or a non-fire-event. An algorithm of this kind requires sample data from actual fire-event and non-fire-event conditions so it can learn to distinguish between the two. For this study, random non-fire points were generated for each corresponding fire season. To overcome spatial heterogeneity and correlation associated with a large study area, random points creation is limited to each vegetation class. For a given number of actual fire-events in one vegetation class, matching numbers of random points are created within the extent of that class. This approach reduces the area to that of the class extent, and also assures that random points are created with at least 10 m of distance from the actual event and from each other. Table 1 shows the fire and non-fire events used to train the algorithm.
The final input dataset was divided using the Hold-Out method, in which data is divided into a “training” and a “validation” set. In this work, fire-events and non fire-events were divided into approximately 70% training and 30% validation data. Once all data is defined, a Python subroutine is used to calculate the Z factor coefficients for the logistic equation. The algorithm is then translated into a band math equation where the final danger map for the area is configured.

3. Results

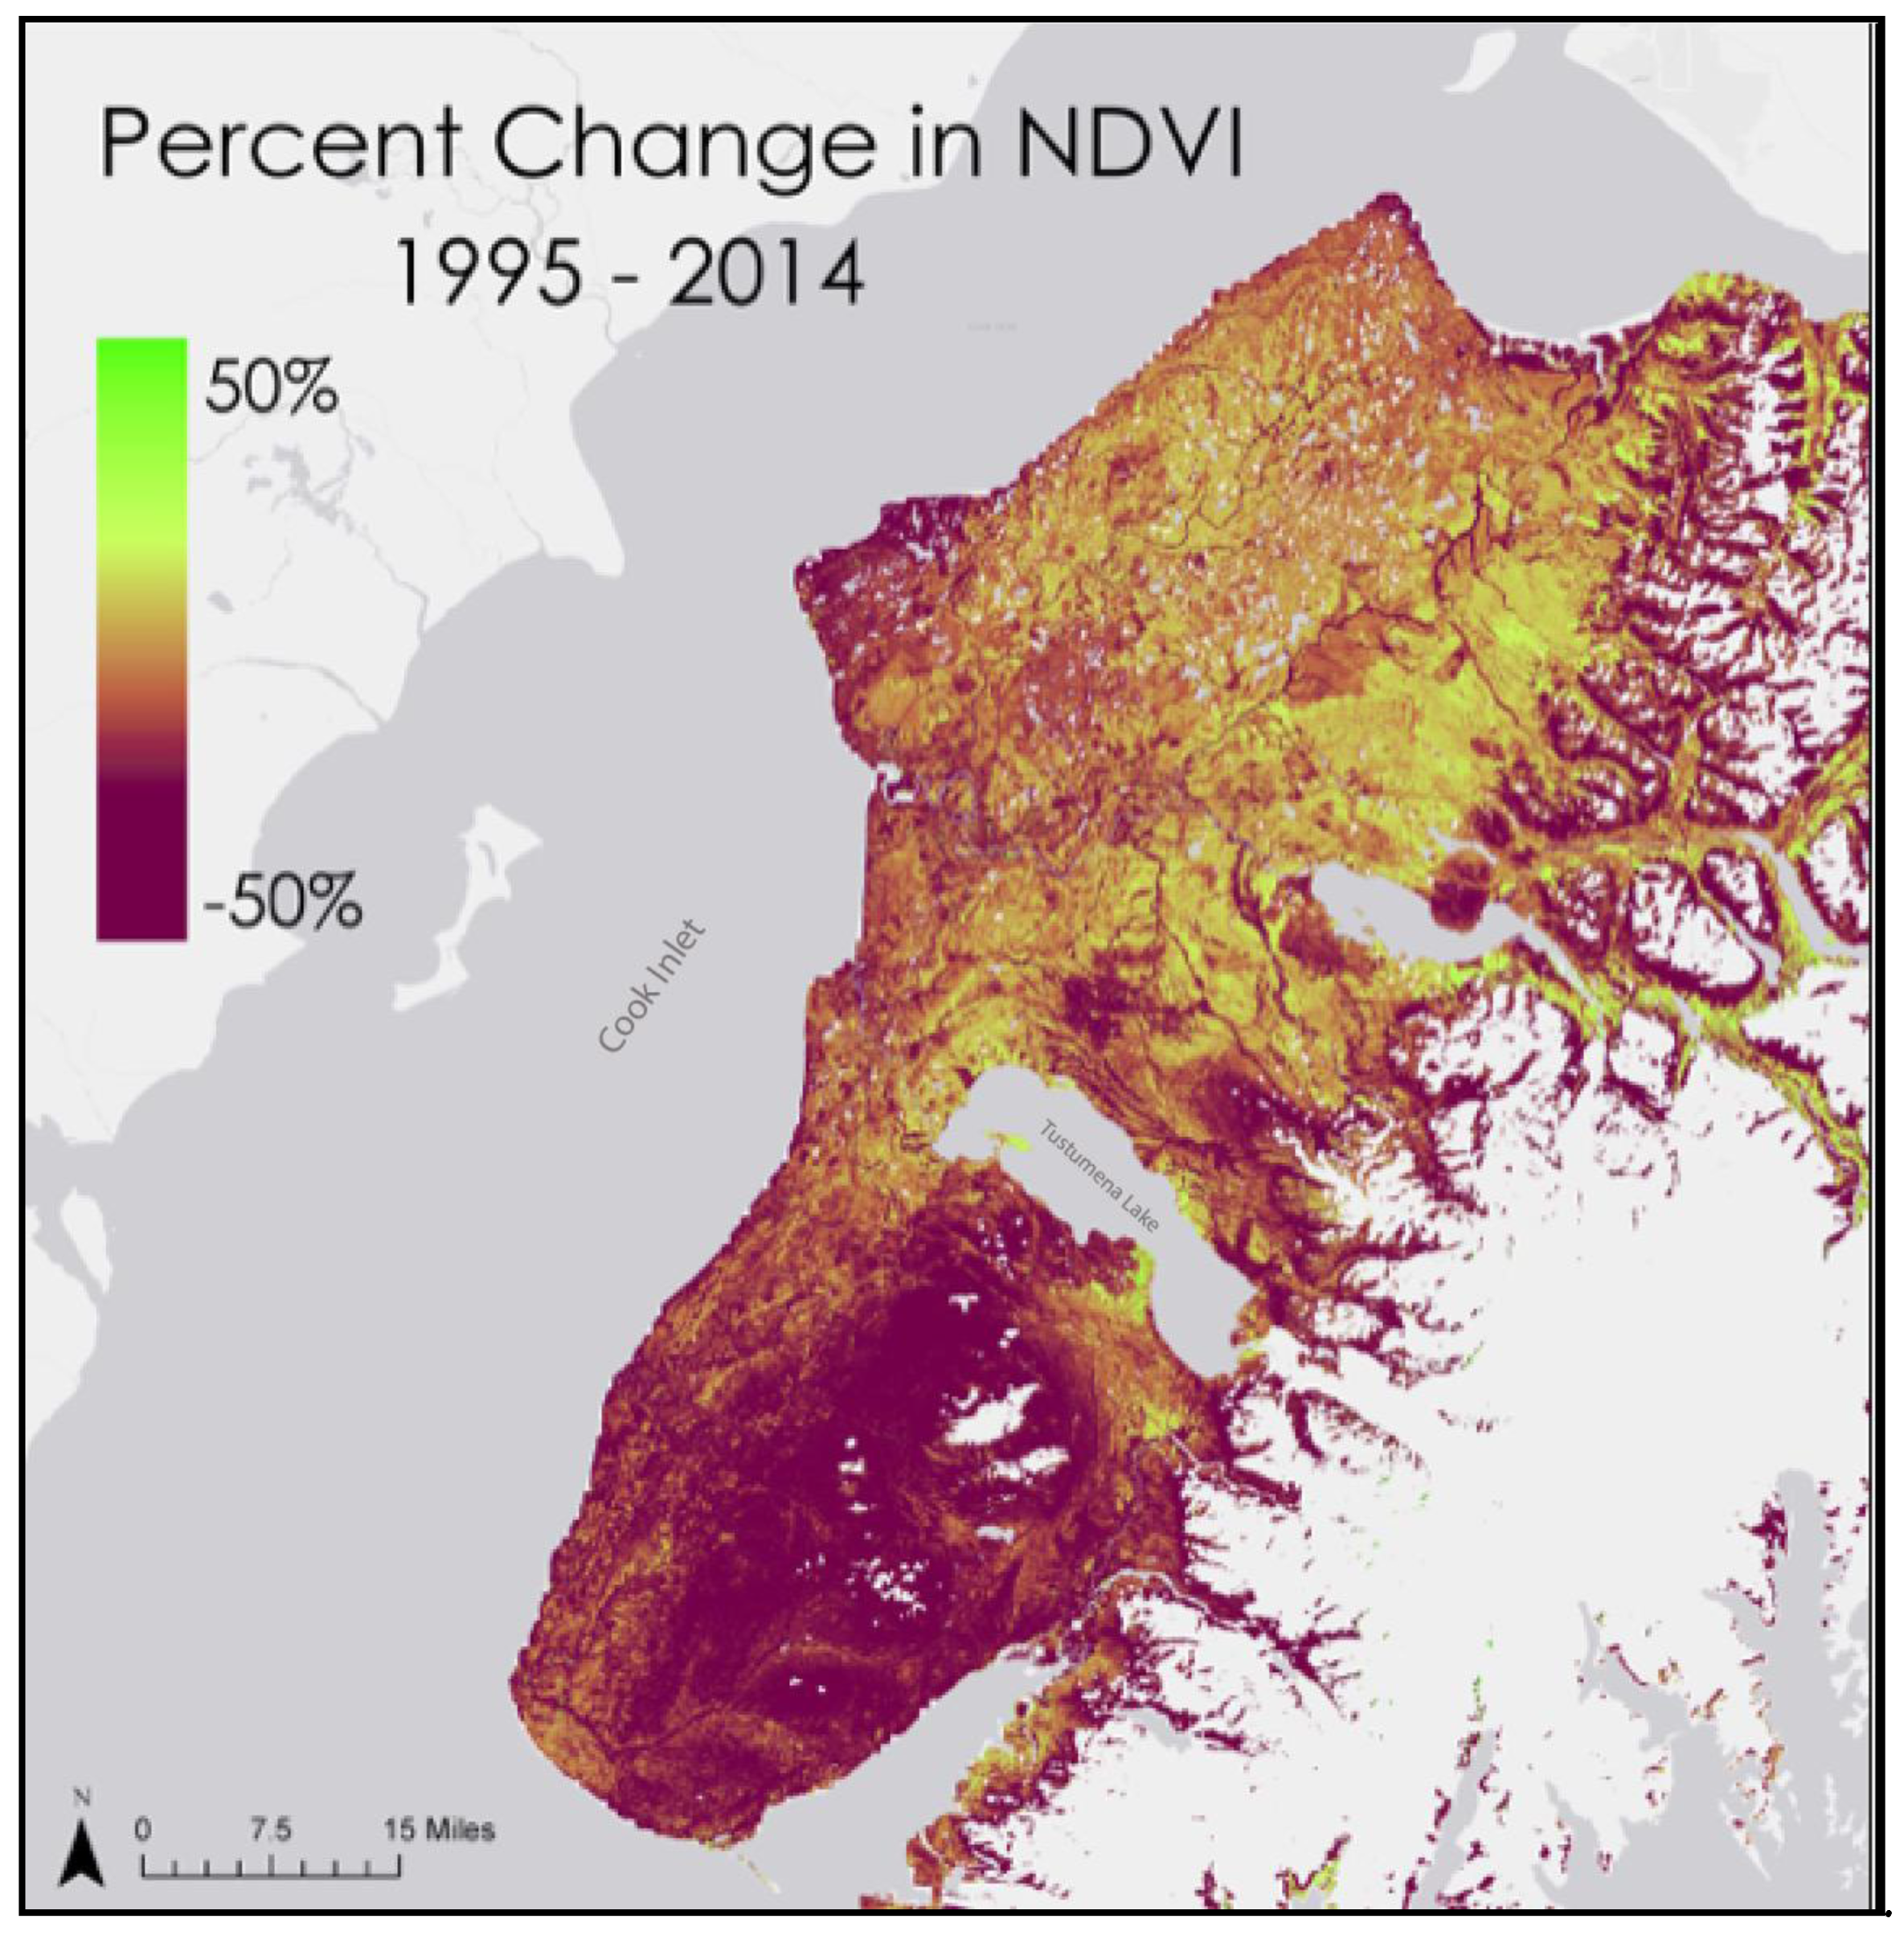
3.1. Vegetation Transition

The classification transition assessment focused on pixels that were classified as mixed or black spruce forest in 1995, and were then classified as shrubland or herbaceous in 2014. The resulting map (Figure 3) shows the change is clustered in the southern area of the peninsula where the worst of the spruce beetle damage occurred around 1995–1996. While our analysis focuses on the transition from forest to shrubland and herbaceous land cover types, forest growth also occurred over the course of the study period (Figure 4). In addition to showing areas that have converted from other land cover types to forest, Figure 4 shows areas that were classified as forested both in 1995 and 2014, although this does not necessarily mean they remained forested for the entire time period.
It was found that NDVI change between 1995 and 2014 aligned with the results from the classification change detection, showing the most change south of Tustumena Lake where the worst of the beetle damage occurred (Figure 5).

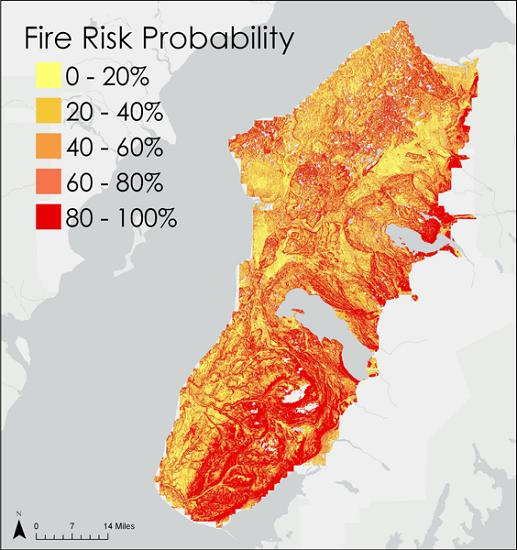
3.2. Fire Danger Probability Model

The logistic equation, indicated in Equation (2), estimates the coefficients related to each factor representing the change in “log-odds” with a binary variable.
Probability   ( Fire = 1 ) = 1 1 + e z
The coefficients are estimated via the Maximum Likelihood Estimate (MLE) method, which identifies the coefficients that make the log of likelihood as large as possible or as small as possible. Therefore the Z factor for the logistic regression of the fire danger model becomes:
Z = −((Aspect × −0.0117) + (Slope × 0.6532) + (Elevation × 0.0011) + (Temperature × −0.1626) + (Vegetation × 0.2177) + 3.7711)
In Equation (2), P tends to 1, as Z in Equation (3) increases. Mathematically, the probability of a fire-event tends towards 1 (fire), as Z increases, and towards 0 (no-fire) as Z decreases. Hence any variable directly proportional to a fire-event has a positive coefficient in Equation (2) and vice versa.
Vegetation in this case is a categorical variable; this means that numerical values are assigned to represent each class. Increasing values are assigned based on the number of actual historical fires in each category. For example, in a dummy scale ranging from 1–7, Barren class is assigned a 1 and mixed forest is assigned a 7. Table 2 shows each variable corresponding coefficient and its corresponding significance.
Using the ArcGIS Pro raster calculator, all raster variables were multiplied by their appropriate weight and plugged into the logistic regression equation, resulting in the fire danger probability map shown in Figure 6.
As described above, the Hold-Out method was used for validation. The data were divided randomly into a 70–30% ratio for subsets as “model training” and “model validation” respectively. A confusion matrix is a table setting used to describe the performance of a classification model as compared to reality. Using cut-off probability values, the threshold is selected at 0.5.
Table 3 below shows the class predictions obtained by the model with this cut-off value versus actual values. If the model prediction and the actual value are concurrent, in our case a fire event, the outcome is considered True Positive; if instead the prediction is not concurrent with an actual event, it is considered a False Negative. Inversely, if the model prediction is positive but the actual event is negative, it is considered False Positive; if instead the prediction is negative and so is the event, the outcome is considered True Negative. Over all, the matrix illustrates that the model predicts cases correctly at a 90% agreement.
The Nagelkerke R2 statistic in logistic regression is considered analogous to the coefficient of determination R2. The pseudo R2 (range 0–1) describes the goodness of fit of the model, in this case 75%, which indicates a reasonable relationship between the predictors and the prediction. Furthermore, the Receiver Operating Characteristics (ROC) curve constructed by plotting the true positive rate (sensitivity) versus the false positive rate (1-specificity) reveals a suitable accuracy as the curve follows the left axis and the top border of the ROC space.
Considering the ROC behavior, the Area under the Curve (AUC) is a measure of how the model performs by presenting the trade-off between true and false positive proportions measuring the accuracy of the analysis. An area of 1 represents a perfect test, while an area of 0.5 is considered a failed model. The resulting AUC value for the training set is 0.944 and 0.928 for the validation set, this shows that the distribution for both classes, fire and non-fire, is much better than if left to chance alone. Figure 7 below shows the ROC curve and corresponding AUC values for the datasets.

4. Discussion

4.1. Spruce Beetle Impact

Our change detection analyses of NDVI composites and land cover classifications tend to support KENWR landscape ecologists’ observations that spruce beetle-induced mortality commonly results in forest-to-grassland conversion through retrogressive succession. Areas that were severely impacted by the spruce beetle infestation of the 1990s, such as the Caribou Hills region south of Tustumena Lake, exhibited widespread conversion of forest cover to either herbaceous or shrubland land cover types from 1995 and 2014.

4.2. Fire Danger Probability Model

In our model, slope represents direct proportionality to a fire-event with the highest coefficient value. Slope has previously been deemed as one of the most important topographic factors as fires tend to travel more rapidly up slopes than down slopes [39]. It is worth pointing out that a major portion of fires in our study area happened on steep hills.
Additionally, the model resulted in a negative coefficient for our temperature variable. In a logistic regression setting, a negative coefficient represents that the factor in question is inversely proportional to the likelihood of fire. This may be due to a couple of reasons. First, as stated by other authors [40,41,42], some variables can be proxies of each other. Slope for example, is a proxy measure of elevation change, which in turn, regulates rainfall and temperature, and hence vegetation. Second, the temporal resolution of surface temperature used to build this model was based on monthly averages due to its availability. This average temperature may not be the adequate value as the monthly average temperature may smooth the real temperature value on the day of the fire. Additionally, the SNAP temperature data was only available at the 1 km scale, which limited the spatial resolution of our resulting fire danger map. Hence, it is recommended that for future analysis, temperature be considered on a daily basis or be excluded from the model. Furthermore, future models could incorporate the actual temperature during the fire, which is a known factor.

4.3. Limitations

The size of our study area and limited access to ground-truthed sample data necessitated a dependence on existing literature to justify the inclusion and weighting of individual input variables for our algorithm. Under ideal circumstances, in situ validations of the data would be used to maximize our confidence levels in the relationships between each respective input variable and the resulting danger of wildfire. Varying availability of certain climatic data inhibited our capacity to address dynamic parameters. Acknowledging the likely benefit that soil moisture data would contribute to the algorithm, it was not factored into our research due to the lack of a single continuous data source across the span of our study period. A relative dearth of consistent, ground-based measurements precluded our inclusion of certain weather parameters, such as local precipitation.
Lastly, given the wet maritime climate of the Kenai Peninsula, our selection of Landsat imagery was particularly limited by frequent, dense cloud cover. Even though the typical fire season extends from May to August, the abundance of cloud cover often precluded entire fire seasons and necessitated an analysis at multi-year intervals. This multi-year approach limited our overall number of data points and our capacity to assess environmental conditions immediately prior to certain wildfire events. Interannual phase shifts in grassland phenology were mitigated through normalization of our change detection rasters by historical values.

4.4. Future Directions

While our research used a proof-of-concept approach to modeling fire danger modeling on the Kenai Peninsula, more advanced and comprehensive approaches for operational use would benefit from incorporating an expanded input parameter set into the methodology for generating needed products. One such potential Earth observation variable to add to the model is soil moisture, which was identified by the KENWR as an important driver of fire behavior but was excluded, as stated in Section 4.2. Incorporating soil moisture would require an assessment of the comparability of measurements between the Soil Moisture Active Passive (SMAP) satellite (launched in 2015) and its precursor satellites. Another consideration for potentially improving the accuracy of the fire danger model would be to account for the impact that urban environments and human settlements have on the risk of ignition. Because our research was conducted in partnership with the KENWR, our area of analysis prioritized broader extents and large tracts of wilderness, rather than the interface of wilderness and urban land cover. Including the factors of soil moisture and urban adjacency, as well as any number of additional weather variables, could greatly enhance future iterations of the model. The structure of our fire danger model is conducive to the eventual inclusion of additional, dynamic variables.
Factors that would benefit from refinement in continued research include temperature and land cover type. First, when aggregated as the monthly mean, surface temperature did not exhibit a positive correlation with the occurrence of wildfire in our study area. This is likely explained by high intra-month variability and would likely be remedied by the substitution of daily mean temperatures. Alternatively, the negative relationship between temperature and fire danger in the model may be due to the consistent occurrence of fires at high elevations in our training data, which are inherently cooler than low elevations. Second, forest structure and vegetation type were not addressed in detail in our method of land cover classification. Given the spatial resolution of our satellite imagery and the limitations of our ground-truthed data, our classification relied heavily on generalization of vegetation types. For example, we classified the highly flammable black spruce forest as a unique land cover type, but all other tree species were combined in the mixed forest class. With additional time and resources, a greater level of detail as to the density, homogeneity, and constituent fuel species would yield valuable information about wildfire behavior and susceptibility for the region.

5. Conclusions

Our project generated Landsat NDVI change maps and Landsat multispectral data classified into land cover maps to help corroborate in situ observations made by landscape ecologists at the Kenai National Wildlife Refuge. Project findings indicate that, for the conditions considered here, spruce beetle-induced disturbance in the Kenai Peninsula’s boreal forests often results in a transition to herbaceous or shrubland ecosystems. In addressing how the change in vegetation may lead to increased fire activity, we derived a fire danger model by using a logistic regression algorithm. The algorithm was trained with historical fire data and variables representing land cover classifications, topographical parameters and temperature. This model found the highest wildfire danger to be connected to herbaceous and black spruce land cover types, aligning with the observations of the KENWR’s ecologists and existing literature.
Although previous research conducted in the contiguous United States (specifically in the Rocky Mountains) has suggested that bark beetle-induced tree mortality has only a negligible impact on emergent (i.e., ignition related) wildfire danger, our study has reinforced hypotheses that such patterns may not be as prevalent in the fire ecology of south-central Alaska. Effects of bark beetle infestations in the Rockies were outweighed by weather variables during the burn season. Under hot, windy, and/or dry enough conditions, even healthy stands previously unscathed by beetles could burn easily. Thus, red or gray phases of bark beetle-inflicted forest mortality would have little to no difference with regards to fire danger. The Kenai Peninsula, however, is both a coastal environment and is situated at a much higher latitude. This results in a comparatively shorter fire season with greater precipitation and cooler mean temperatures than those found in continental case studies. As such, the disturbance regime in coastal Alaskan forests is generally typified by fires that are both less frequent (usually only occurring every few centuries) and predominantly limited to underburning (as opposed to igniting the canopy). It is plausible that beetle-induced tree mortality and emergent wildfire danger may correlate more strongly as FRIs increase. Fire ecology as a discipline would benefit greatly from further investigation into any relationship that may exist between bark beetle outbreak disturbances and fire disturbances, specifically within the context of rising temperatures and decreasing FRIs. Our study demonstrates the need for these advancements to be driven by localized case studies that take geographic and ecological nuances into account.
A better understanding of both ecological (i.e., vegetative succession) trajectories and disturbance regimes on the Kenai Peninsula could help the surrounding communities in working to address bark beetle and fire damage and risk, especially given the recent sharp increase in local spruce beetle populations since 2014. In addition to concerns of biodiversity and habitat loss, the region’s inhabitants are highly concerned about environmental change impacts to Alaska’s tourism industry and cultural identity. These factors, coupled with the mounting potential for another severe beetle infestation in the region’s spruce forests, could increase the potential for severe socio-economic damages. The capacity to more accurately map ignition risk would be widely valuable to the region’s inhabitants and land resource managers, not only contributing to a streamlined decision-making on the part of wildlife management bodies, but also potentially providing key knowledge to state and municipal governments, regional planners, the logging industry, real estate developers, and other local organizations.

Author Contributions

Conceptualization, V.L. and D.R.M.; Data curation, K.A.H., C.C., J.C.-I., J.S.R. and D.R.M.; Formal analysis, K.A.H., C.C., J.C.-I. and J.S.R.; Investigation, Katherine Hess, C.C., J.C.-I. and J.S.R.; Methodology, K.A.H., C.C., J.C.-I. and J.S.R.; Project administration, K.A.H. and V.L.; Software, C.C. and J.C.-I.; Supervision, V.L., J.D.B., A.C.F. and J.S.; Validation, D.R.M.; Visualization, K.A.H., C.C., J.C.-I. and J.S.R.; Writing—original draft, K.A.H., C.C., J.C.-I. and J.S.R.; Writing—review & editing, V.L., D.R.M., J.D.B., A.C.F. and J.S.

Funding

This material is based upon work supported by NASA through contract NNL16AA05C and cooperative agreement NNX14AB60A. Science, Systems, and Applications, Inc. provided funding through this contract in support of NASA’s DEVELOP National Program.

Acknowledgments

The authors wish to extend their gratitude to the Communications and Project Coordination Fellows at the NASA DEVELOP National Program Office for their support and guidance during this research. Any opinions, findings, and conclusions or recommendations expressed in this material are those of the author(s) and do not necessarily reflect the views of the National Aeronautics and Space Administration.

Conflicts of Interest

The authors declare no conflict of interest.

Abbreviations

DBHDiameter at breast height; a metric describing the dimensions of a tree
Earth observationsSatellites and sensors that collect information about the Earth’s physical, chemical, and biological systems over space and time
EcotoneA transitional or “buffer” area between two ecosystems, such as those existing at the boundaries of forests and grasslands
ETM+Landsat 7 Enhanced Thematic Mapper Plus
Fire regimeThe type, frequency, patterns, and seasonality of wildfire as it typically occurs in a particular environment, often used to characterize different types of forest biomes
FRIFire Return Interval; the average number of years between significant wildfire events in a given site
Gray phaseThe stage of spruce beetle-induced mortality in which the dried needles fall from the tree, accumulating as dry fuel on the forest floor, leaving the deceased trunk standing and defoliated. This is preceded by the “red phase”
KENWRKenai National Wildlife Refuge
LFRDBLANDFIRE Reference Database
MLEMaximum Likelihood Estimate
NDVINormalized Difference Vegetation Index. The ratio of visible red light to near-infrared light reflected from a surface, this metric is commonly used proxy for vegetation health and productivity
OLILandsat 8 Operational Land Imager
Red phaseThe stage of spruce beetle-induced tree mortality in which dry (red) needles remain on the tree; this is followed by the “gray phase”
SNAPScenarios Network for Alaska and Arctic Planning
Surface fireWildfire that spreads predominantly through a forest’s under understory vegetation. This is characteristic of fire regimes in boreal forests. This is opposed to a crown fire, which spreads between treetops
TMLandsat 5 Thematic Mapper
UnderburningForest fire that spreads at ground level but does not spread to the canopy
USFWSUnited States Fish and Wildlife Service
USGSUnited States Geological Survey
WV-3WorldView-3 Satellite Sensor (DigitalGlobe, Inc.)

References

  1. United States Forest Service. Spruce Beetle Surges in Southcentral Alaska after a Long Slumber. Briefing Paper. Available online: https://www.adn.com/opinions/2017/08/30/spruce-beetle-devastation-returns-to-southcentral-alaska-and-moves-north/ (accessed on 27 June 2018).
  2. Boucher, T.V.; Mead, B.R. Vegetation change and forest regeneration on the Kenai Peninsula, Alaska following a spruce beetle outbreak, 1987-2000. For. Ecol. Manag. 2006, 227, 233–246. [Google Scholar] [CrossRef]
  3. Viereck, L.A.; Dyrness, C.T.; Batten, A.R.; Wenzlick, K.J. The Alaska Vegetation Classification; Technical Report; United States Department of Agriculture: Portland, OR, USA, 1992. [Google Scholar]
  4. United States Forest Service (USFS). Spruce Beetle. Available online: https://www.fs.usda.gov/Internet/FSE_DOCUMENTS/stelprdb5303039.pdf (accessed on 20 December 2018).
  5. Alaska Division of Forestry. What’s Bugging Alaska’s Forests? Spruce Beetle Facts and Figures. Available online: http://forestry.alaska.gov/insects/sprucebeetle (accessed on 20 December 2018).
  6. Colorado State Forest Service. Spruce Beetle. Quick Guide Series FM 2014-01. 2014. Available online: https://csfs.colostate.edu/media/sites/22/2014/02/Spruce-Beetle-QuickGuide-FM2014-1.pdf (accessed on 20 December 2018).
  7. Zolubas, P.; Negron, J.; Munson, S.A. Modelling spruce bark beetle infestation probability. Balt. For. 2009, 15, 23–27. [Google Scholar]
  8. Jenkins, M.J.; Page, W.G.; Hebertson, E.G.; Alexander, M.E. Fuels and fire behavior dynamics in bark beetle-attacked forests in Western North America and implications for fire management. For. Ecol. Manag. 2012, 275, 23–34. [Google Scholar] [CrossRef]
  9. Werner, R.A.; Holsten, E.H.; Matsuoka, S.M.; Burnside, R.E. Spruce beetles and forest ecosystems in south-central Alaska: A review of 30 years of research. For. Ecol. Manag. 2006, 227, 195–206. [Google Scholar] [CrossRef]
  10. Rothermel, R.C. Some fire behavior modeling concepts for fire management systems. In Proceedings of the 12th Conference on Fire and Forest Meterology, Jekyll Island, GA, USA, 26–28 October 1994; Society of American Foresters: Bethesda, MD, USA, 1994; pp. 164–171. [Google Scholar]
  11. Klein, E.; Berg, E.E.; Dial, R. Wetland drying and succession across the Kenai Peninsula Lowlands, south-central Alaska. Can. J. For. Res. 2005, 35, 1931–1941. [Google Scholar] [CrossRef] [Green Version]
  12. Berg, E.E.; Henry, J.D.; Fastie, C.L.; De Volder, A.D.; Matsuoka, S.M. Spruce beetle outbreaks on the Kenai Peninsula, Alaska, and Kluane National Park and Reserve, Yukon Territory: Relationship to summer temperatures and regional differences in disturbance regimes. For. Ecol. Manag. 2006, 227, 219–232. [Google Scholar] [CrossRef]
  13. Bentz, R.A.; Régnière, J.; Fettig, C.J.; Hansen, M.; Hayes, J.L.; Hicke, J.A.; Kelsey, R.G.; Negrón, J.F.; Seybold, S.J. Climate change and bark beetles of the western United States and Canada: Direct and indirect effects. BioScience 2010, 60, 602–613. [Google Scholar] [CrossRef]
  14. Jenkins, M.J.; Hebertson, E.G.; Munson, A.S. Spruce beetle biology, ecology and management in the Rocky Mountains: An addendum to spruce beetle in the Rockies. Forests 2014, 5, 21–71. [Google Scholar] [CrossRef]
  15. Hicke, J.A.; Johnson, M.C.; Hayes, J.L.; Preisler, H.K. Effects of bark beetle-caused tree mortality on wildfire. For. Ecol. Manag. 2012, 271, 1–67. [Google Scholar] [CrossRef]
  16. Andrus, R.A.; Veblen, T.T.; Harvey, B.J.; Hart, S.J. Fire severity unaffected by spruce beetle outbreak in spruce-fir forests in southwestern Colorado. Ecol. Appl. 2016, 26, 700–711. [Google Scholar] [CrossRef]
  17. Berg, E.E.; Anderson, R.S. Fire history of white and Lutz spruce forests on the Kenai Peninsula, Alaska, over the last two millennia as determined from soil charcoal. For. Ecol. Manag. 2006, 227, 275–283. [Google Scholar] [CrossRef]
  18. Hansen, W.D.; Chapin, W.; Naughton, H.T.; Rupp, T.S.; Verbyla, D. Forest-landscape structure mediates effects of a spruce bark beetle (Dendroctonus rufipennis) outbreak on subsequent likelihood of burning in Alaskan boreal forest. For. Ecol. Manag. 2016, 369, 38–46. [Google Scholar] [CrossRef]
  19. Boggs, K.; Sturdy, M.; Rinella, D.J.; Rinella, M.J. White spruce regeneration following a major spruce beetle outbreak in forests on the Kenai Peninsula, Alaska. For. Ecol. Manag. 2008, 255, 3571–3579. [Google Scholar] [CrossRef]
  20. Burgan, R.E.; Klaver, R.W.; Klaver, J.M. Fuel Models and Fire Potential from Satellite and Surface Observations. Int. J. Wildland Fire 1998, 8, 159–170. [Google Scholar] [CrossRef]
  21. Chuvieco, E.; Salas, J. Mapping the spatial distribution of forest fire danger using GIS. Int. J. Geogr. Inf. Sci. 1996, 10, 333–345. [Google Scholar] [CrossRef]
  22. Stavros, E.N.; Coen, J.; Peterson, B.; Singh, H.; Kennedy, K.; Ramirez, C.; Schimel, D. Use of imaging spectroscopy and LIDAR to characterize fuels for fire behavior prediction. Remote Sens. Appl. Soc. Environ. 2018, 11, 41–50. [Google Scholar] [CrossRef]
  23. Saglam, B.; Bilgili, E.; Dincdurmaz, B.; Kadiogulari, A.I.; Küçük, Ö. Spatio-temporal analysis of forest fire risk and danger using LANDSAT imagery. Sensors 2008, 8, 3970–3987. [Google Scholar] [CrossRef] [PubMed]
  24. Bisquert, M.; Sánchez, J.M.; Caselles, V. Modeling fire danger in Galicia and Asturias (Spain) from MODIS images. Remote Sens. 2014, 6, 540–554. [Google Scholar] [CrossRef]
  25. Chuvieco, E.; Martin, M.P. Global fire mapping and fire danger estimation using AVHRR images. Photogramm. Eng. Remote Sens. 1994, 60, 563–570. [Google Scholar]
  26. United States Board on Geographic Names. Feature Detail Report for: Kenai Peninsula; United States Geological Survey Geographic Names Information System; 2000. Available online: http://geonames.usgs.gov/apex/f?p=gnispq:3:::NO::P3_FID:1404582 (accessed on 20 December 2018).
  27. Bureau of Land Management. Alaska Wildland Fire History, 1940–2017. Available online: https://fire.ak.blm.gov/content/maps/ (accessed on 20 December 2018).
  28. Fryer, J.L. Fire Regimes of Alaskan Black Spruce Communities. In Fire Effects Information System; U.S. Department of Agriculture, Forest Service, Rocky Mountain Research Station, Fire Sciences Laboratory (Producer), 2014; Available online: https://www.fs.fed.us/database/feis/fire_regimes/AK_black_spruce/all.html (accessed on 20 December 2018).
  29. Abrahamson, I. Picea glauca, White Spruce. In Fire Effects Information System; U.S. Department of Agriculture, Forest Service, Rocky Mountain Research Station, Fire Sciences Laboratory (Producer), 2015; Available online: https://www.fs.fed.us/database/feis/plants/tree/picgla/all.html (accessed on 20 December 2018).
  30. Fryer, J.L. Picea mariana. In Fire Effects Information System; U.S. Department of Agriculture, Forest Service, Rocky Mountain Research Station, Fire Sciences Laboratory (Producer), 2014; Available online: https://www.fs.fed.us/database/feis/plants/tree/picmar/all.html (accessed on 20 December 2018).
  31. Abrahamson, I.L. Fire Regimes of Alaskan White Spruce Communities. In Fire Effects Information System; U.S. Department of Agriculture, Forest Service, Rocky Mountain Research Station, Fire Sciences Laboratory (Producer), 2014; Available online: https://www.fs.fed.us/database/feis/fire_regimes/AK_white_spruce/all.html (accessed on 20 December 2018).
  32. Oldemeyer, J.L.; Regelin, W.L. Forest Succession, Habitat Management, and Moose on the Kenai National Wildlife Refuge; Swedish Wildlife Research: Stockholm, Sweden, 1987; pp. 163–179. [Google Scholar]
  33. Chuvieco, E.; Salas, J.; Vega, C. Remote Sensing and GIS for Long-Term Fire Risk Mapping; Mega Fires Project, A Review of Remote Sensing Methods for the Study of Large Wildland Fires; Universidad de Alcalá: Madrid, Spain, 1997; pp. 91–108. [Google Scholar]
  34. Andrews, P.L.; Queen, L.P. Fire modeling and information system technology. Int. J. Wildland Fire 2001, 10, 343–352. [Google Scholar] [CrossRef]
  35. Rodrigues, M.; de la Riva, J.; Fotheringham, S. Modeling the spatial variation of the explanatory factors of human-caused wildfires in Spain using geographically weighted logistic regression. Appl. Geogr. 2014, 48, 52–63. [Google Scholar] [CrossRef]
  36. Stojanova, D.; Panov, P.; Kobler, A.; Dzeroski, S.; Taskova, K. Learning to predict forest fires with different data mining techniques. In Proceedings of the 9th International multi conference Information Society IS 2006, Ljubljana, Slovenia, 9–14 October 2006; Jozef Stefan Institute: Ljubljana, Slovenia, 2006. [Google Scholar]
  37. Guo, F.; Zhang, L.; Jin, S.; Tigabu, M.; Su, Z.; Wang, W. Modeling anthropogenic fire occurrence in the boreal forest of China using logistic regression and random forests. Forests 2016, 7, 250. [Google Scholar] [CrossRef]
  38. Pan, J.; Wang, W.; Li, J. Building probabilistic models of fire occurrence and fire risk zoning using logistic regression in Shanxi Province, China. Nat. Hazards 2016, 81, 1879–1899. [Google Scholar] [CrossRef]
  39. Jaiswal, R.K.; Mukherjee, S.; Raju, K.D.; Saxena, R. Forest fire risk zone mapping from satellite imagery and GIS. Int. J. Appl. Earth Obs. Geoinf. 2002, 4, 1–10. [Google Scholar] [CrossRef]
  40. Leuenberger, M.; Parente, J.; Tonini, M.; Pereira, M.G.; Kanevski, M. Wildfire susceptibility mapping: Deterministic vs. stochastic approaches. Environ. Model. Softw. 2018, 101, 194–203. [Google Scholar] [CrossRef]
  41. Tonini, M.; Pereira, M.G.; Parente, J.; Vega Orozco, C. Evolution of forest fires in Portugal: From spatio-temporal point events to smoothed density maps. Nat. Hazards 2017, 85, 1489–1510. [Google Scholar] [CrossRef]
  42. Chowdhury, E.H.; Hassan, Q.K. Operational perspective of remote sensing-based forest fire danger forecasting systems. ISPRS J. Photogramm. Remote Sens. 2015, 104, 224–236. [Google Scholar] [CrossRef]
Figure 1. (a) Location of the study area and the Kenai Peninsula within Alaska; (b) Location of the study area and the Kenai National Wildlife Refuge within the peninsula.
Remotesensing 11 00283 g001
Figure 2. The land cover classification process for 2014 imagery. (a) True color composite from 4 May 2014; (b) The result of running image (a) through a Segment Mean Shift tool, which groups pixels into segments based on their spectral signatures; (c) The result of a vector-supervised machine classification, showing seven land cover classes.
Remotesensing 11 00283 g002
Figure 3. Pixels that changed from forest to herbaceous or shrubland land cover based on classifications of Landsat imagery from 1995 and 2014.
Remotesensing 11 00283 g003
Figure 4. Pixels that changed from other land cover types to forest or remained forested based on classifications of Landsat imagery from 1995 and 2014.
Remotesensing 11 00283 g004
Figure 5. NDVI change between 1995 and 2014.
Remotesensing 11 00283 g005
Figure 6. Fire Danger Map.
Remotesensing 11 00283 g006
Figure 7. AUC 0.5 cut-off value. (a) Test sample performance. (b) Validation sample performance.
Remotesensing 11 00283 g007
Table 1. Vegetation class and corresponding number of fire-events and random points created.
Vegetation ClassFire-EventsNon-Fires
Developed240240
Barren66
Black Spruce218218
Mixed Forest320320
Shrublands104104
Herbaceous9090
Wetlands192192
Table 2. Factor coefficients and their statistical significance.
FactorCoefficientp > |z|
Aspect−0.01170.000
Slope0.65320.000
Elevation0.00110.094
Temperature−0.16260.000
Vegetation−0.2180.000
Table 3. Model Confusion Matrix Probability of Detection (POD) and False Alarm Ratio (FAR) 1.
PredictedNot Predicted% Correct
Fire500 True Positive74 False Positive93.4
No Fire698 False Negative49 True Negative86.7
Percentage 90.6
1 The cut-off value is 500.

