Mapping Impervious Surfaces in Town–Rural Transition Belts Using China’s GF-2 Imagery and Object-Based Deep CNNs

 ,
,
Abstract
:
1. Introduction
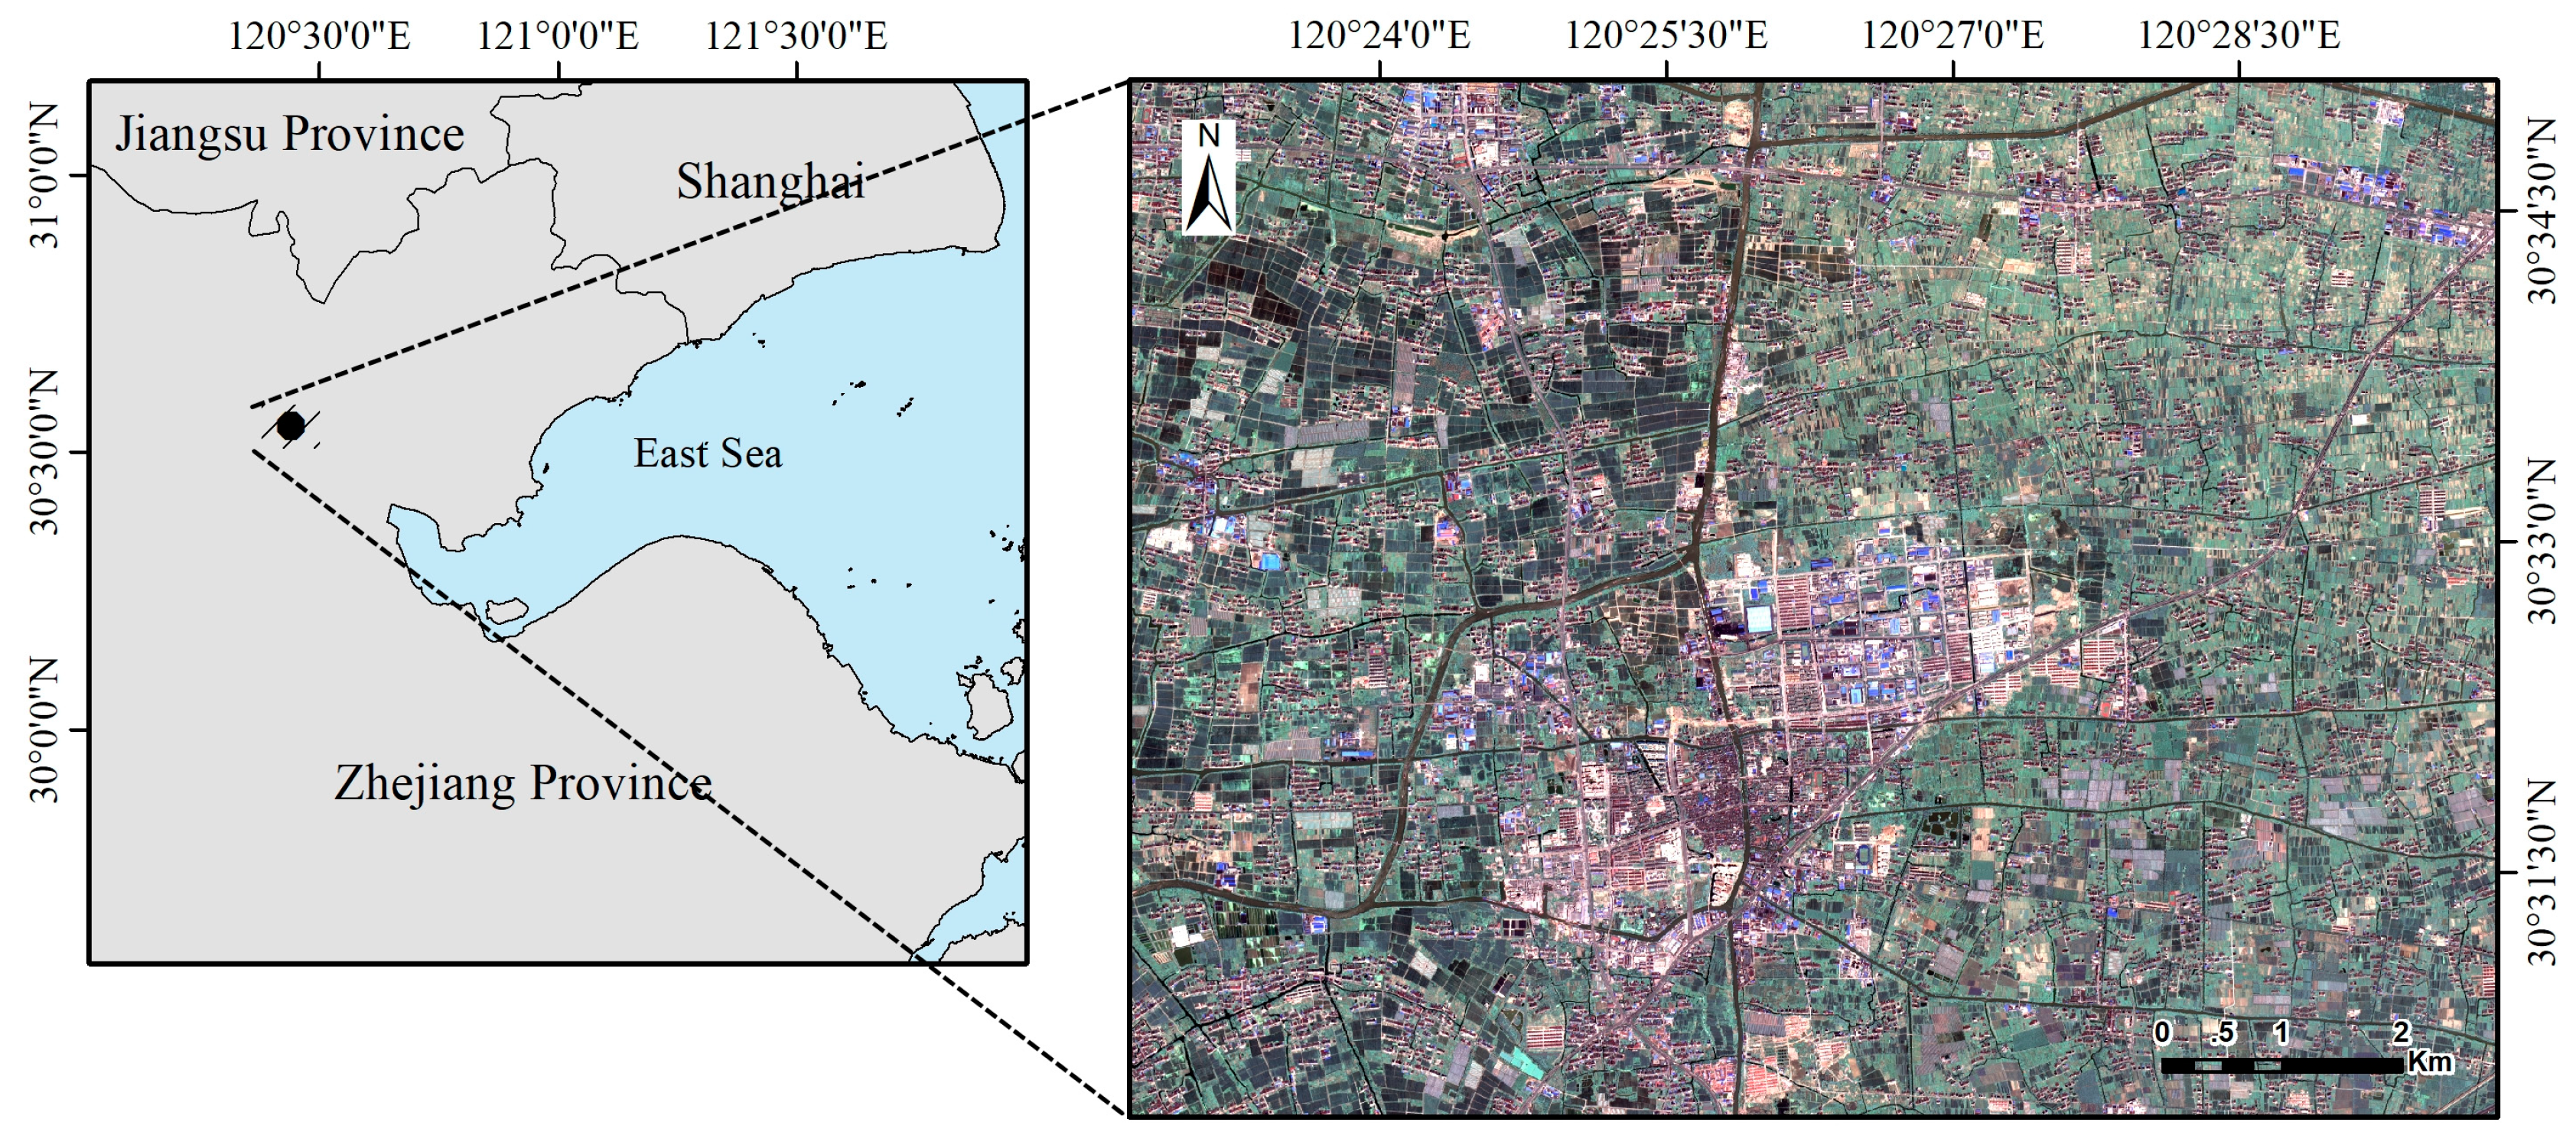
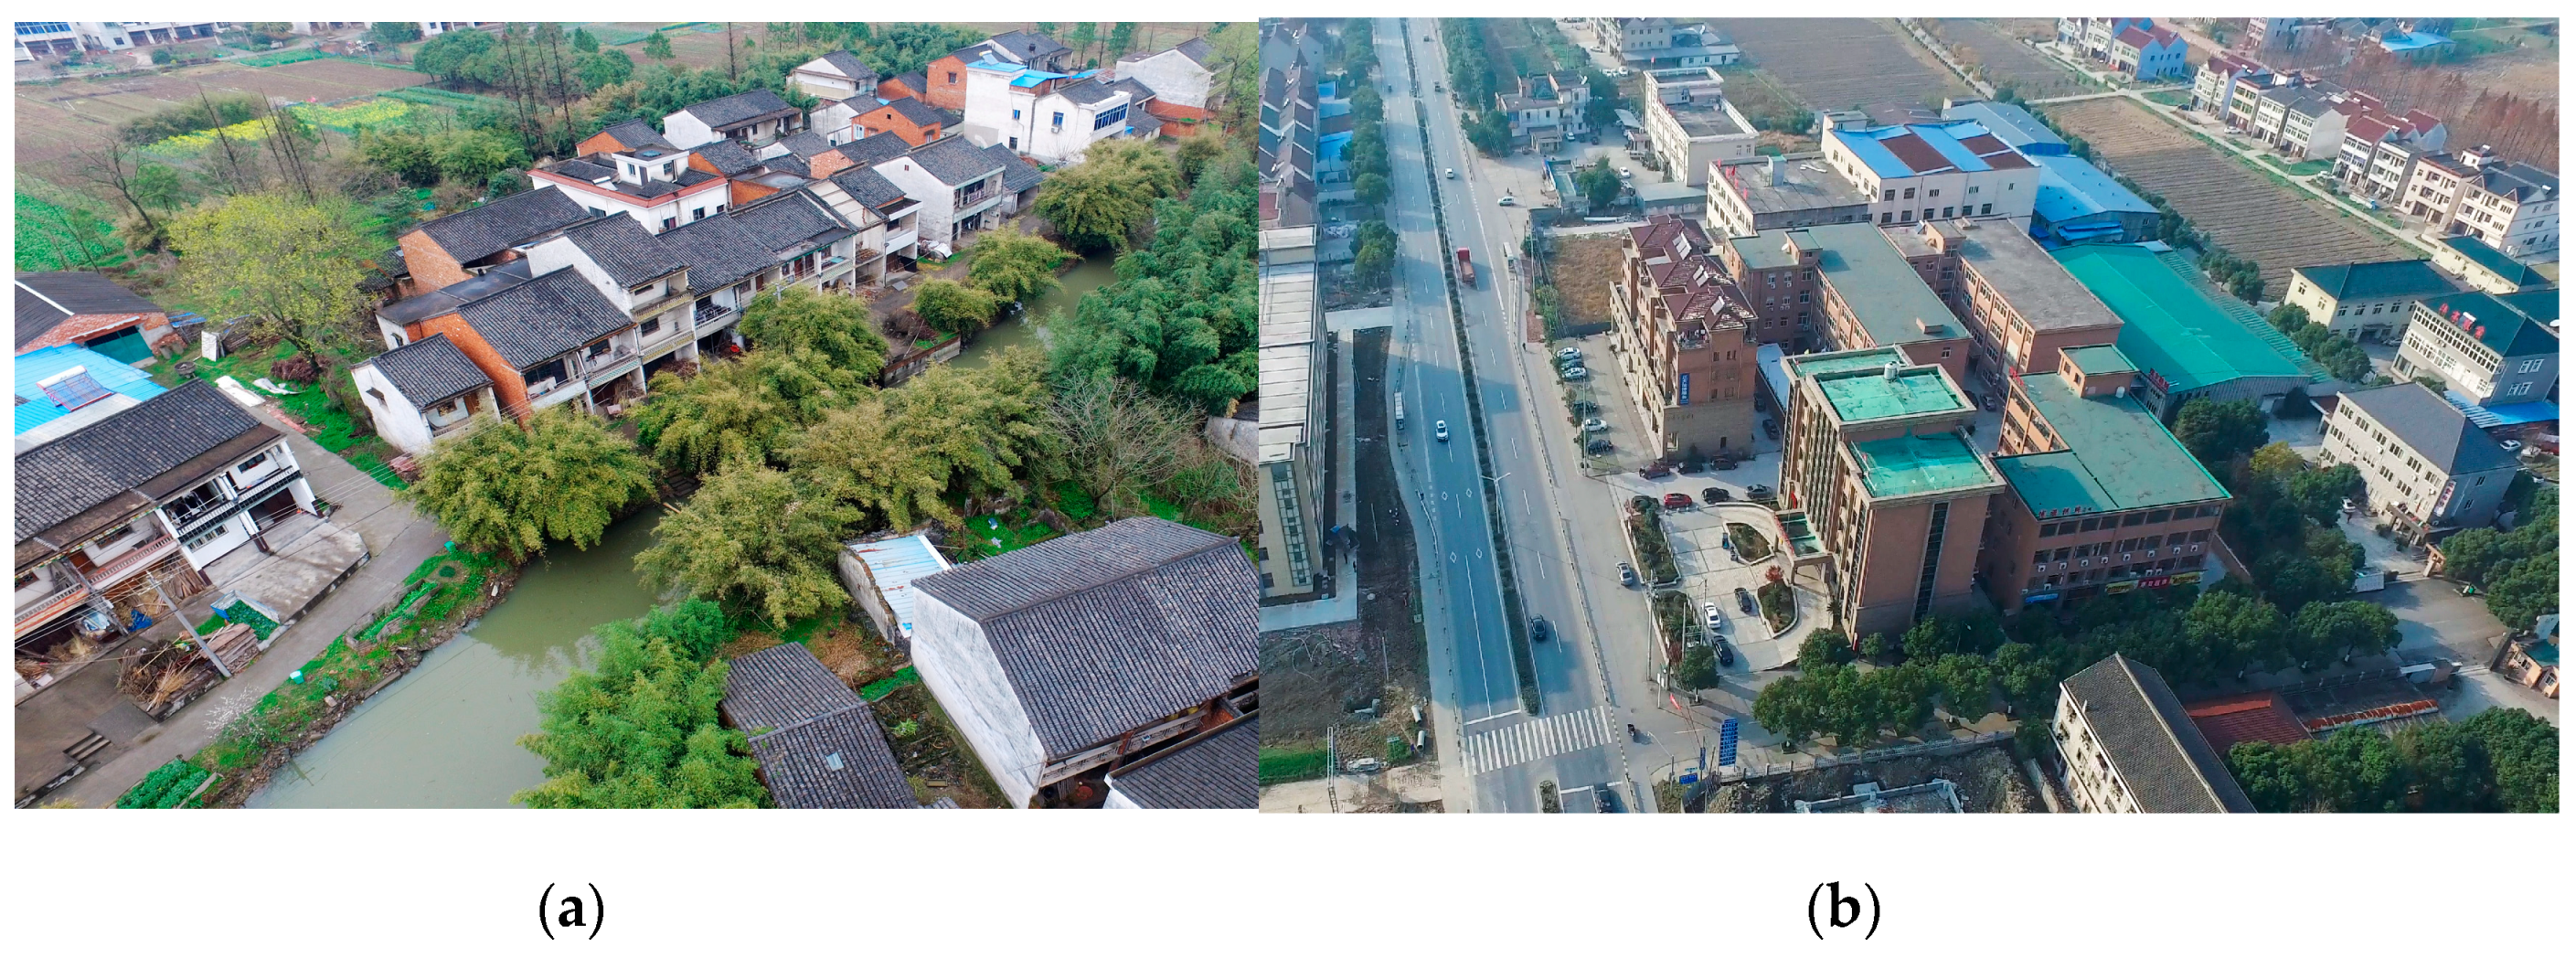
2. Study Area
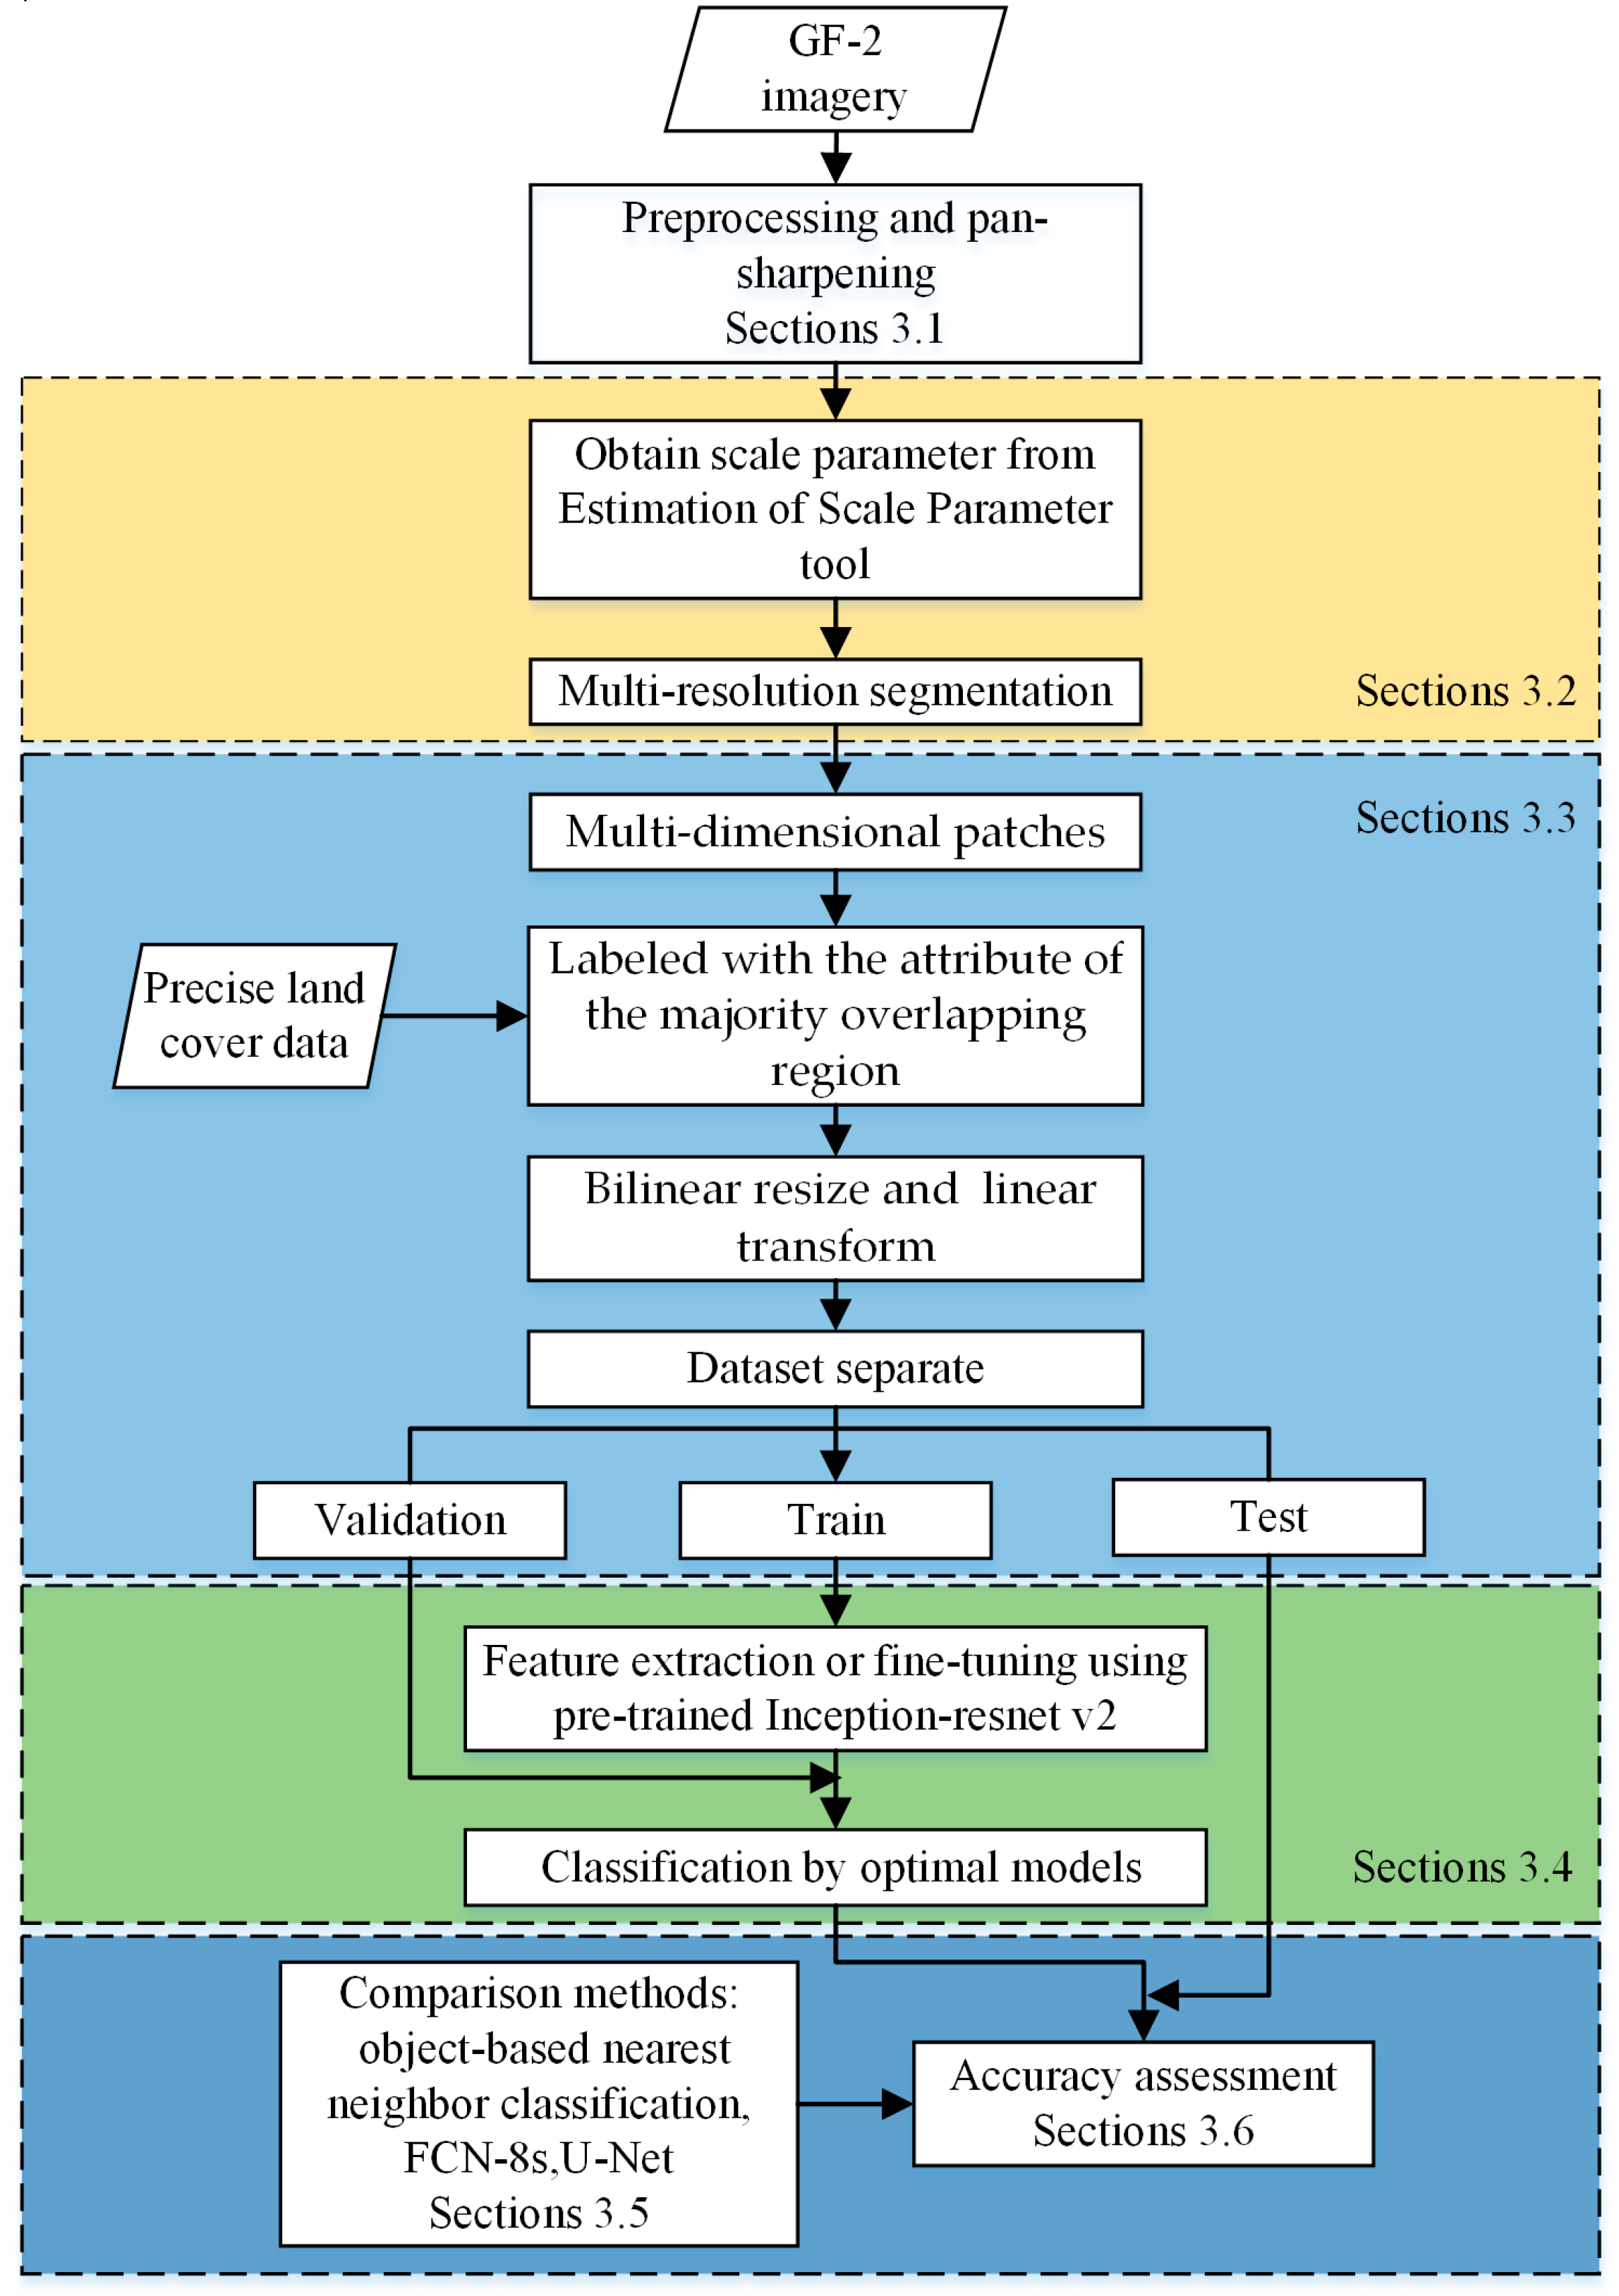
3. Materials and Methods.
3.1. Datasets and Preprocessing
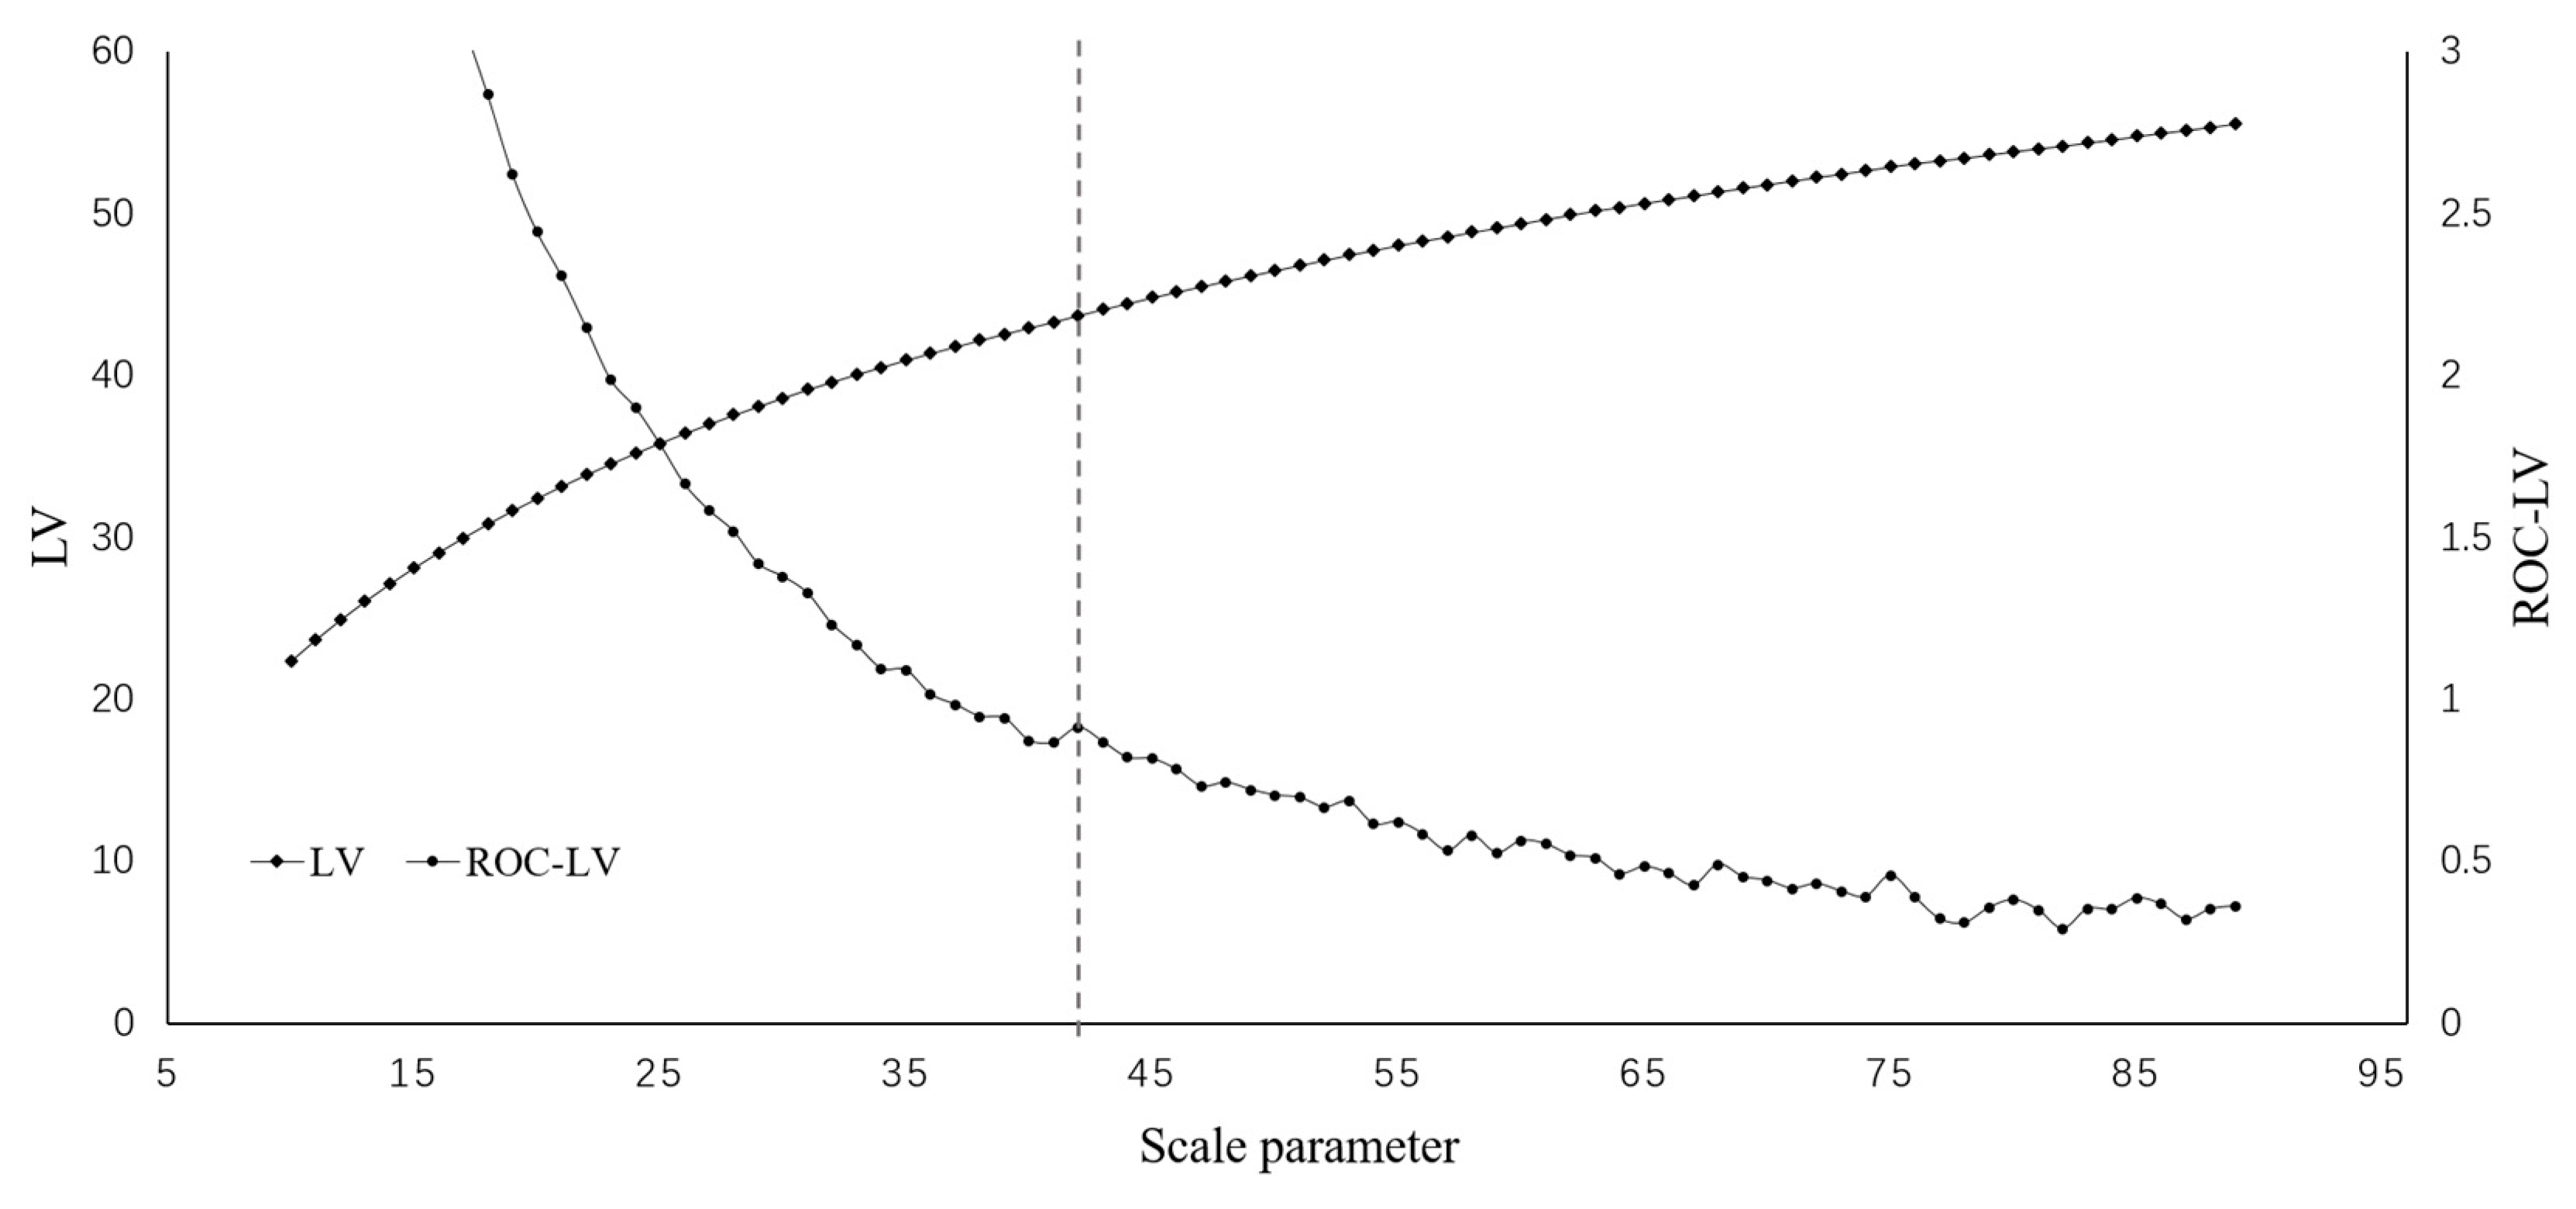
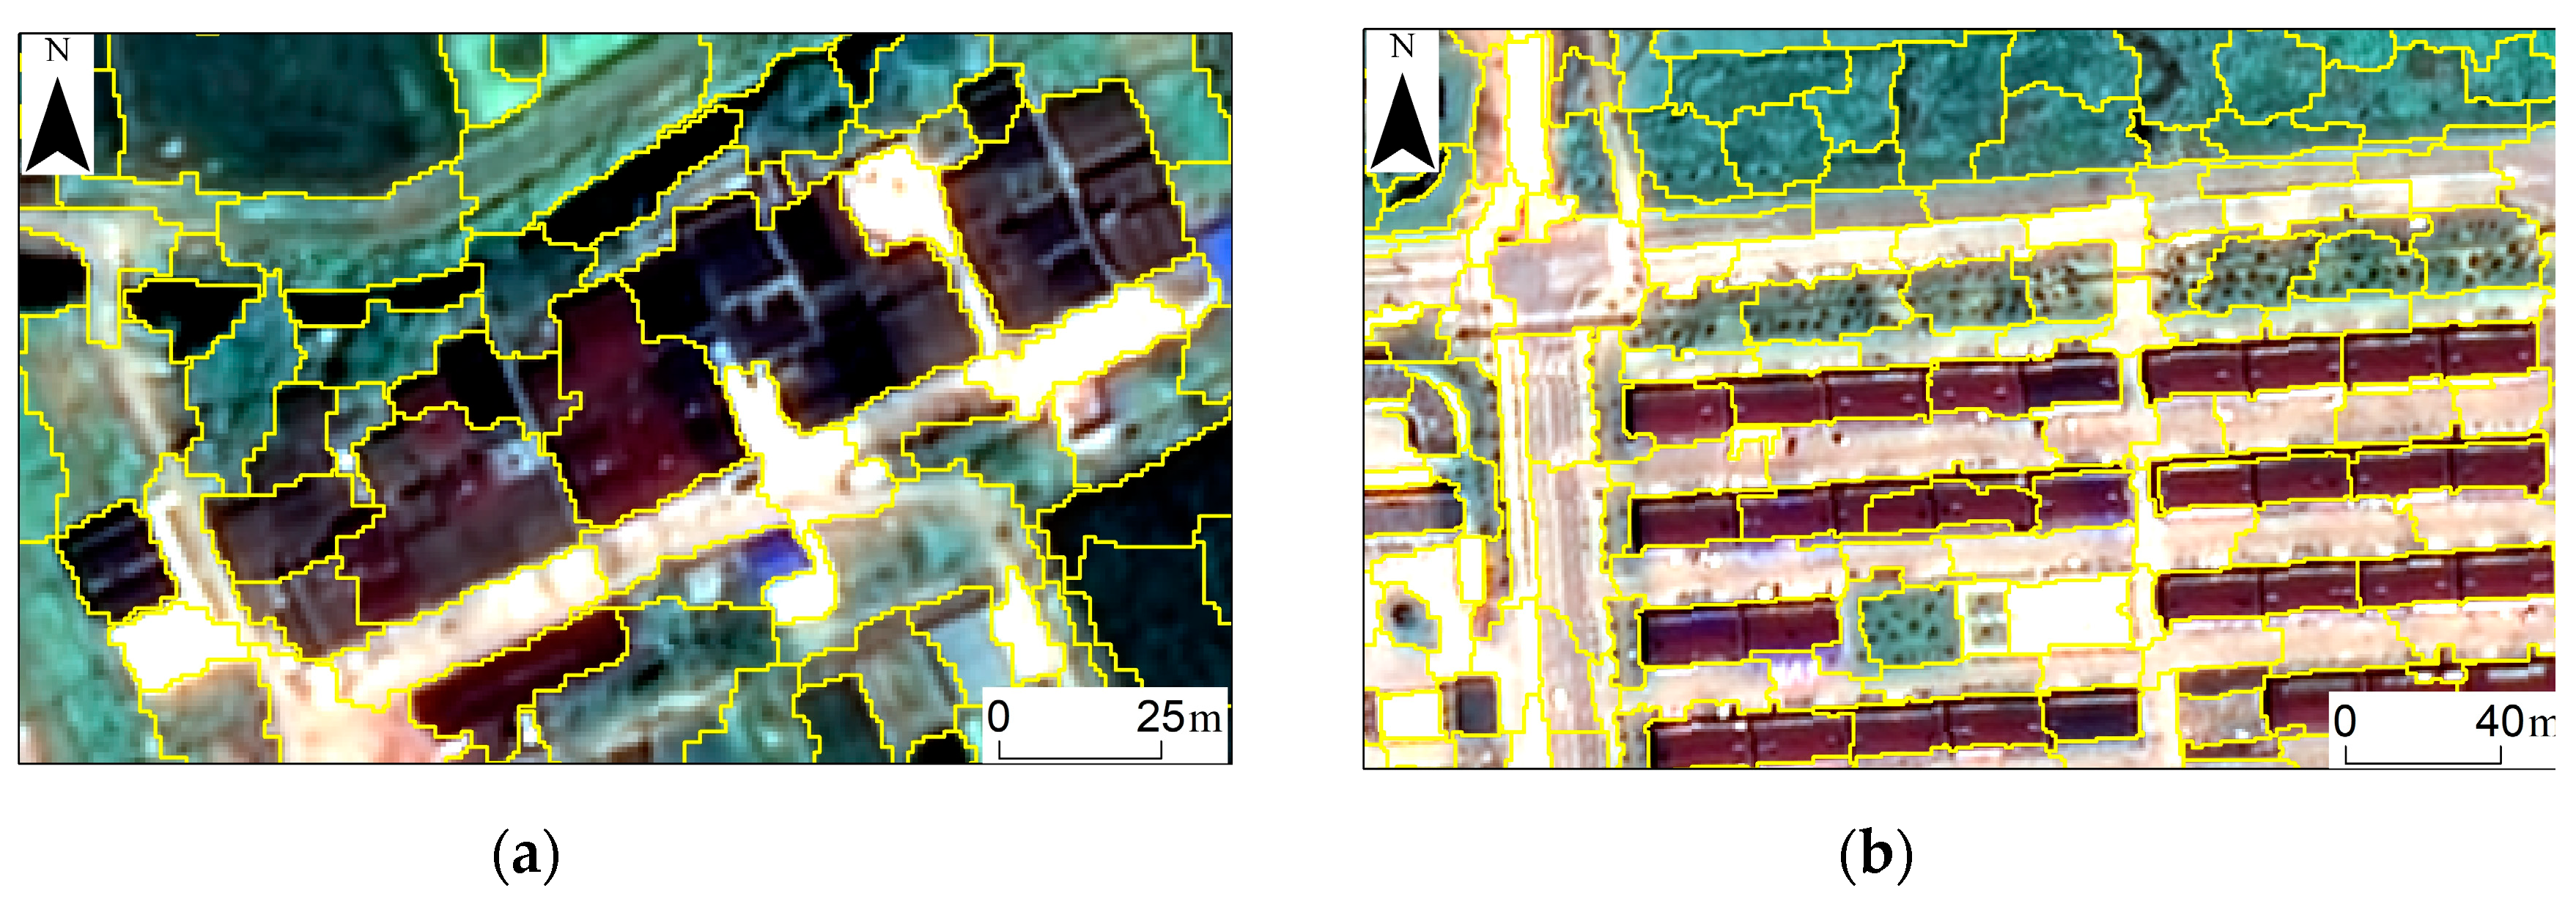
3.2. Multi-Resolution Segmentation
3.3. Standardization and Normalization
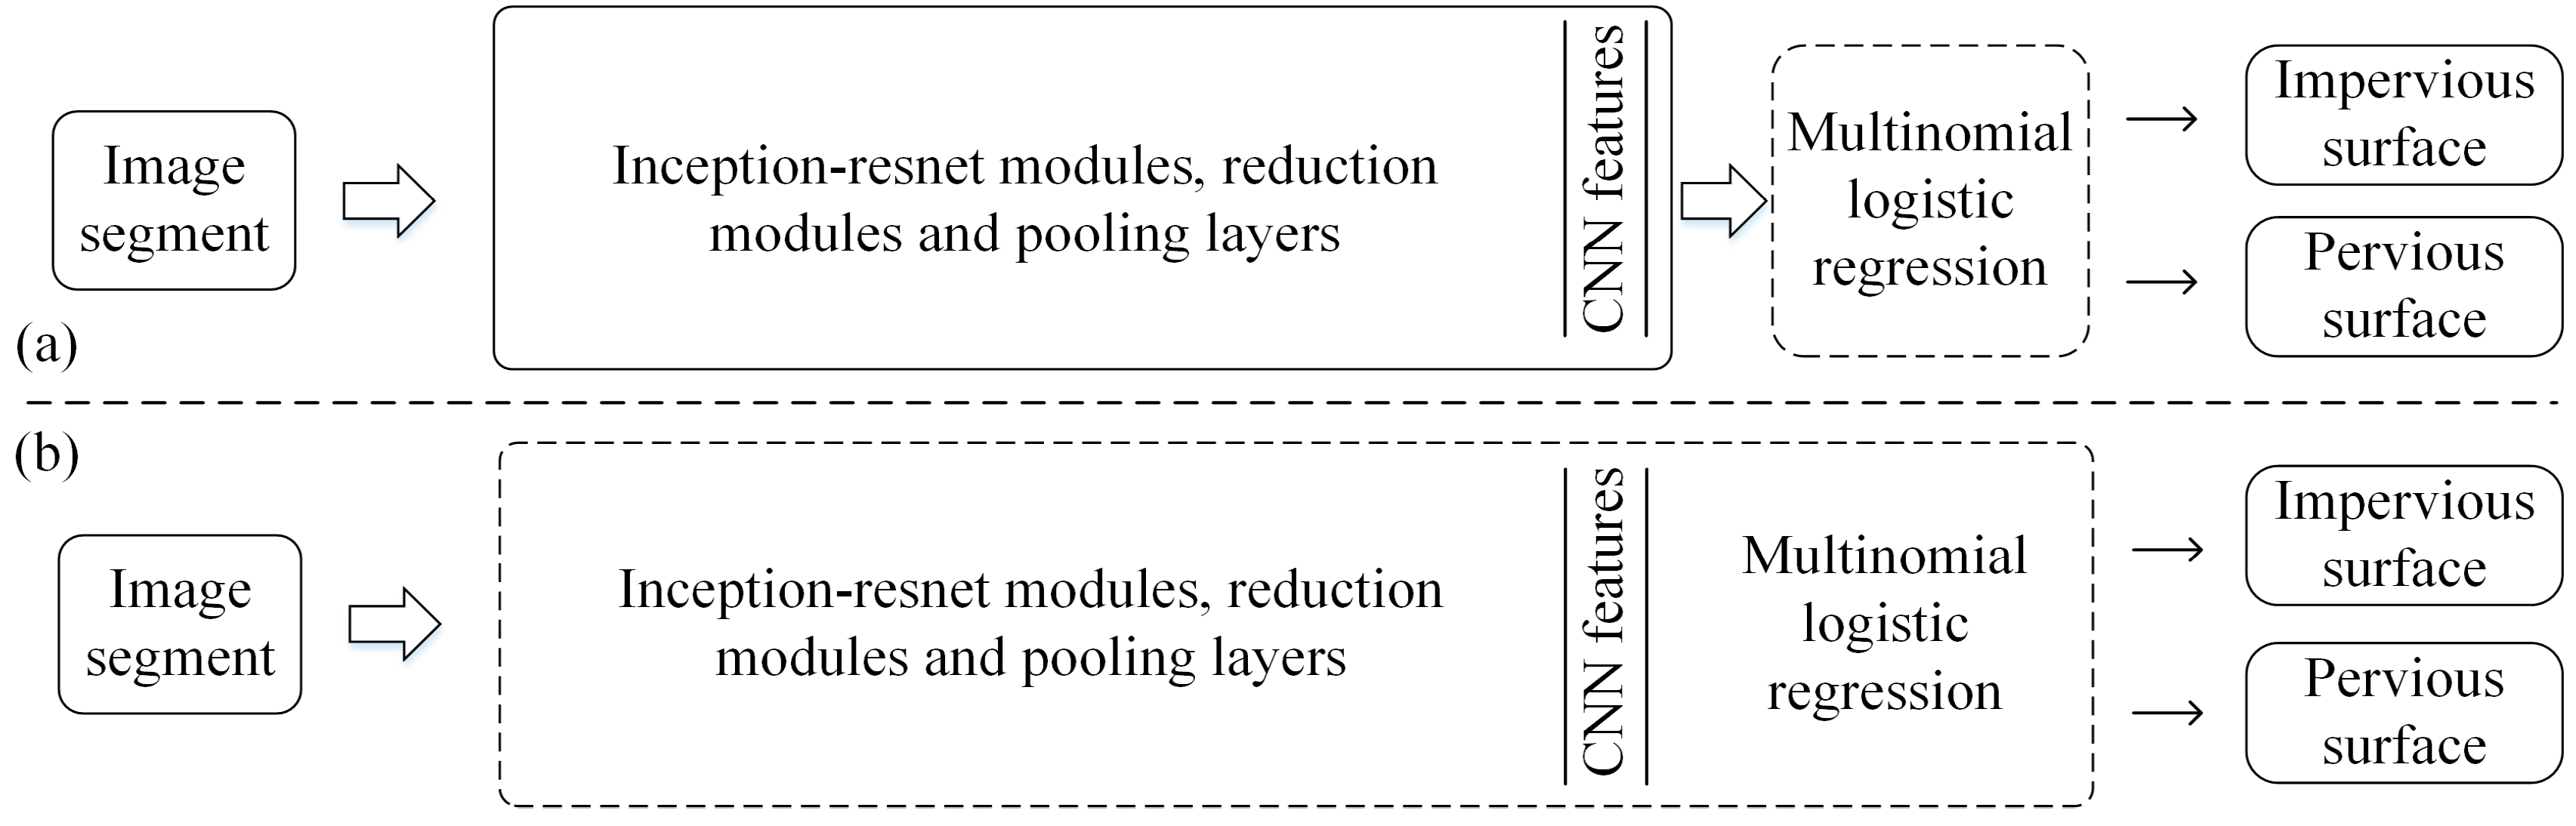
3.4. Transfer Learning Based on a Pre-Trained Inception-Resnet V2 Model
3.5. Comparison Methods
3.5.1. Object-Based Nearest Neighbor Classification
3.5.2. Fully Convolutional Neural Networks
3.6. Accuracy Assessment and Comparison
4. Results
4.1. Segmentation Results with Optimal Scale Parameter
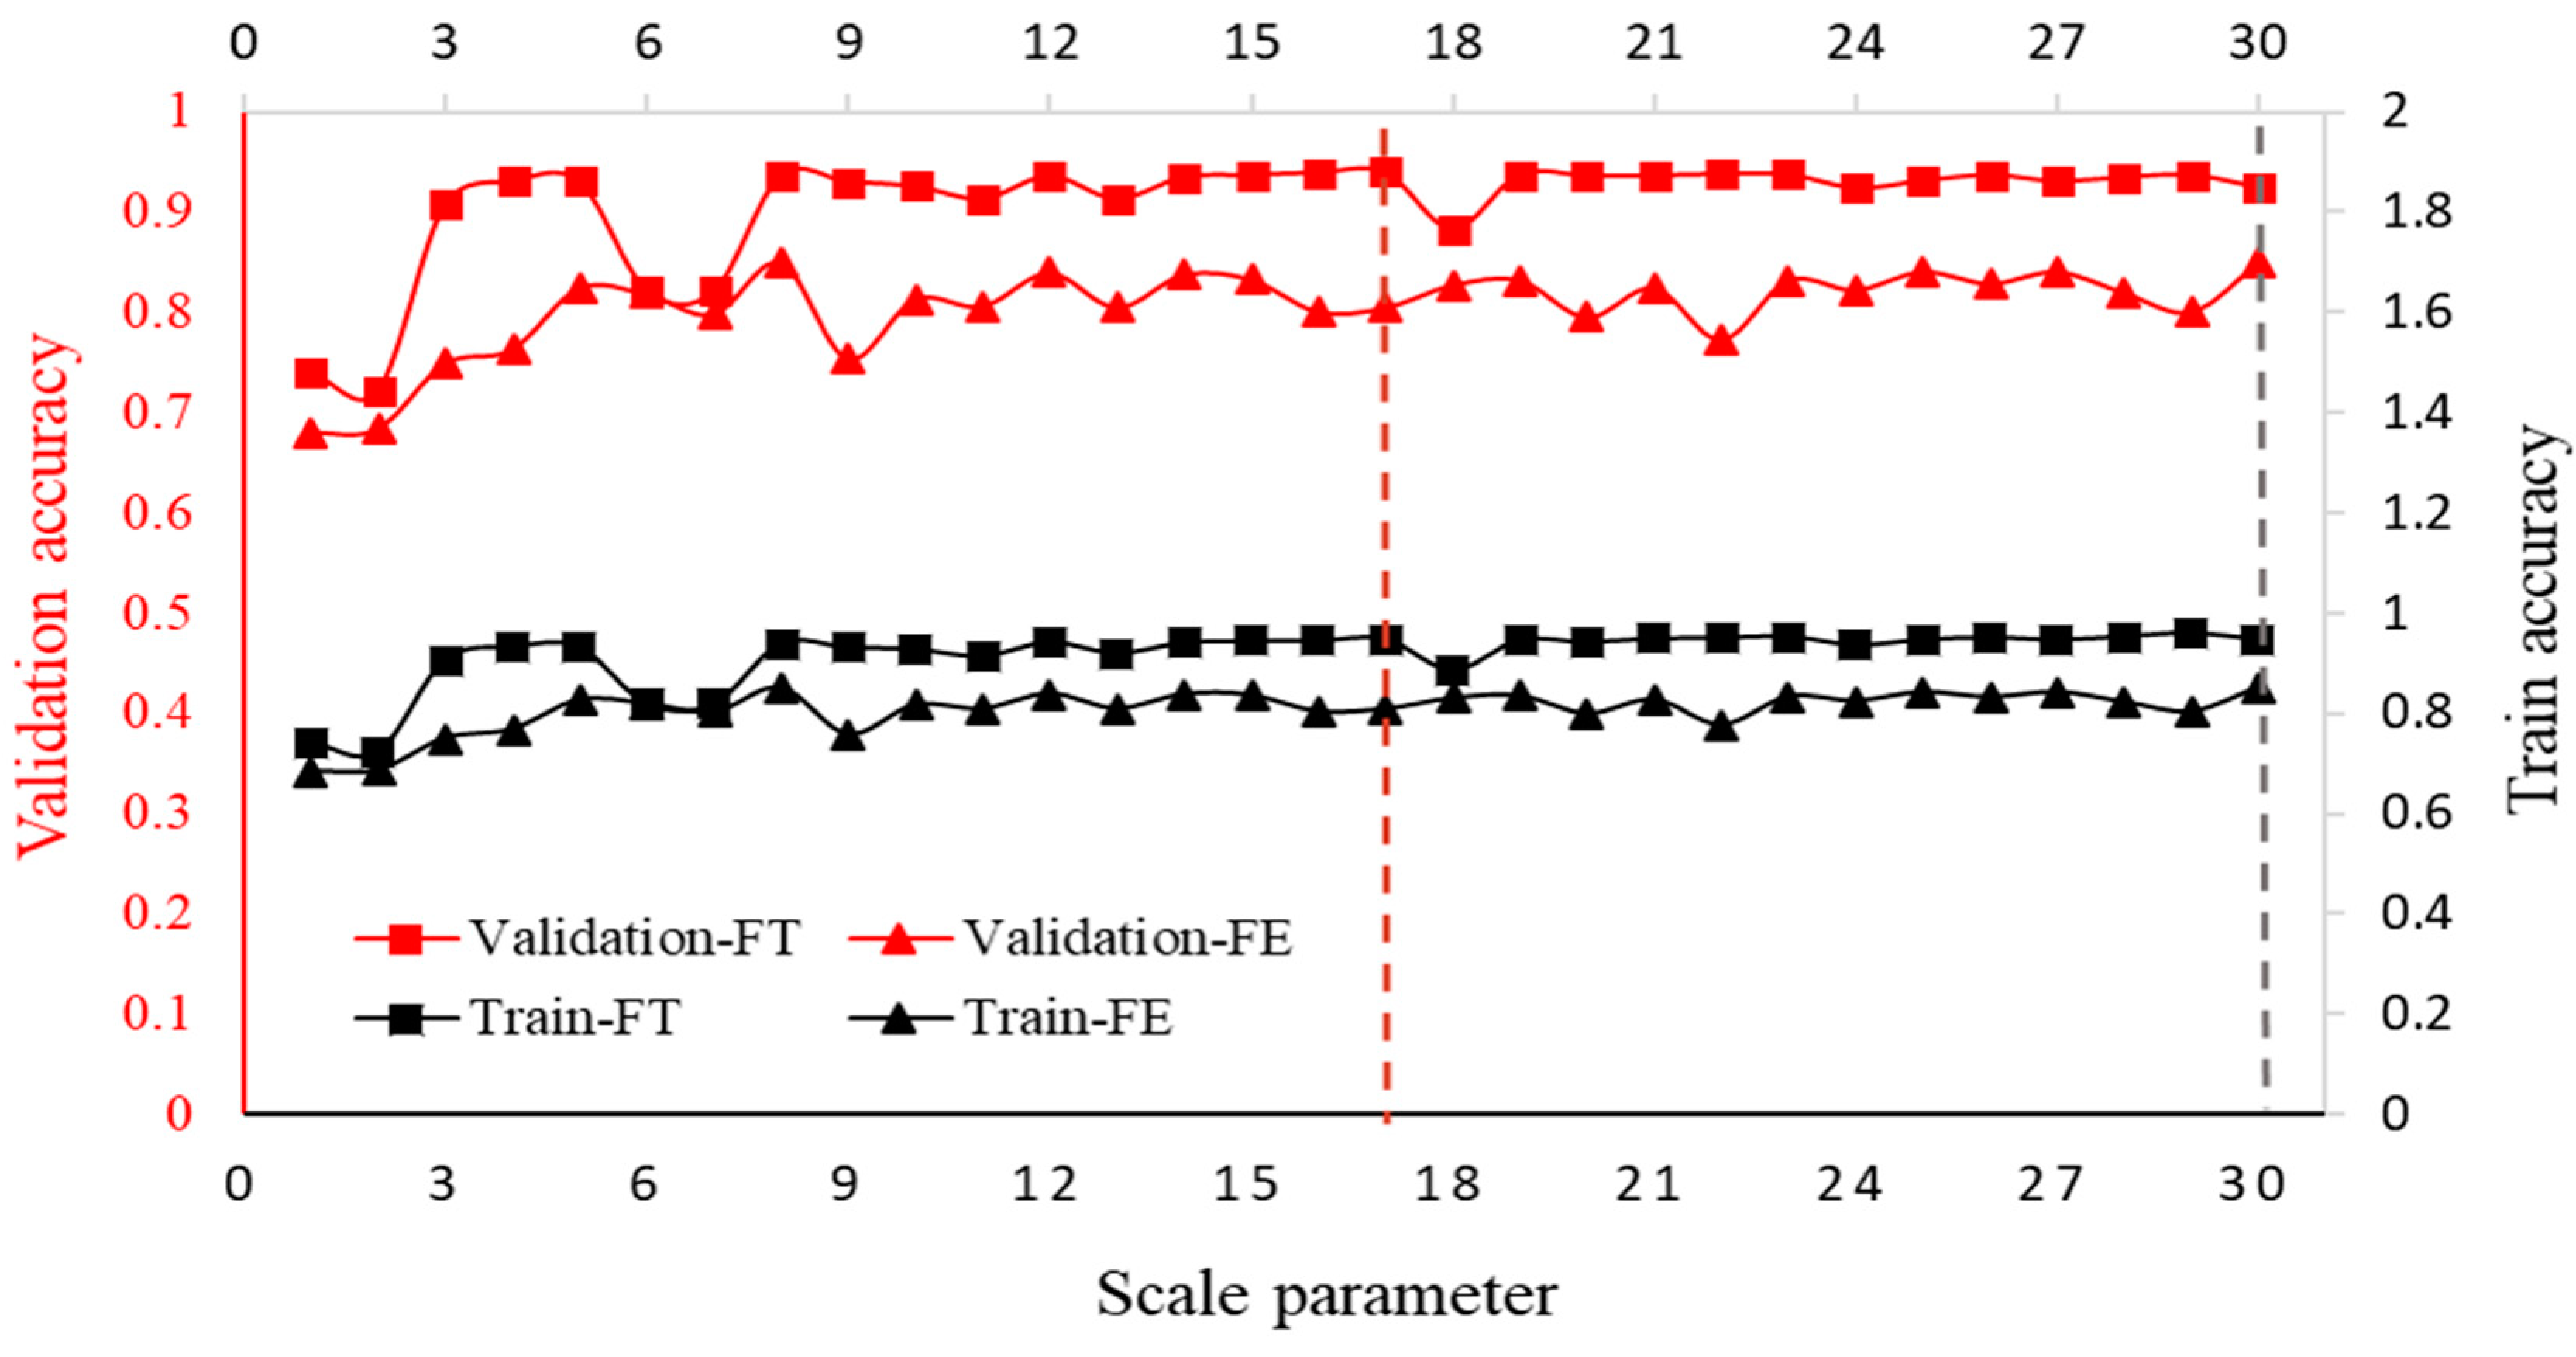
4.2. Optimal Model Selection Results
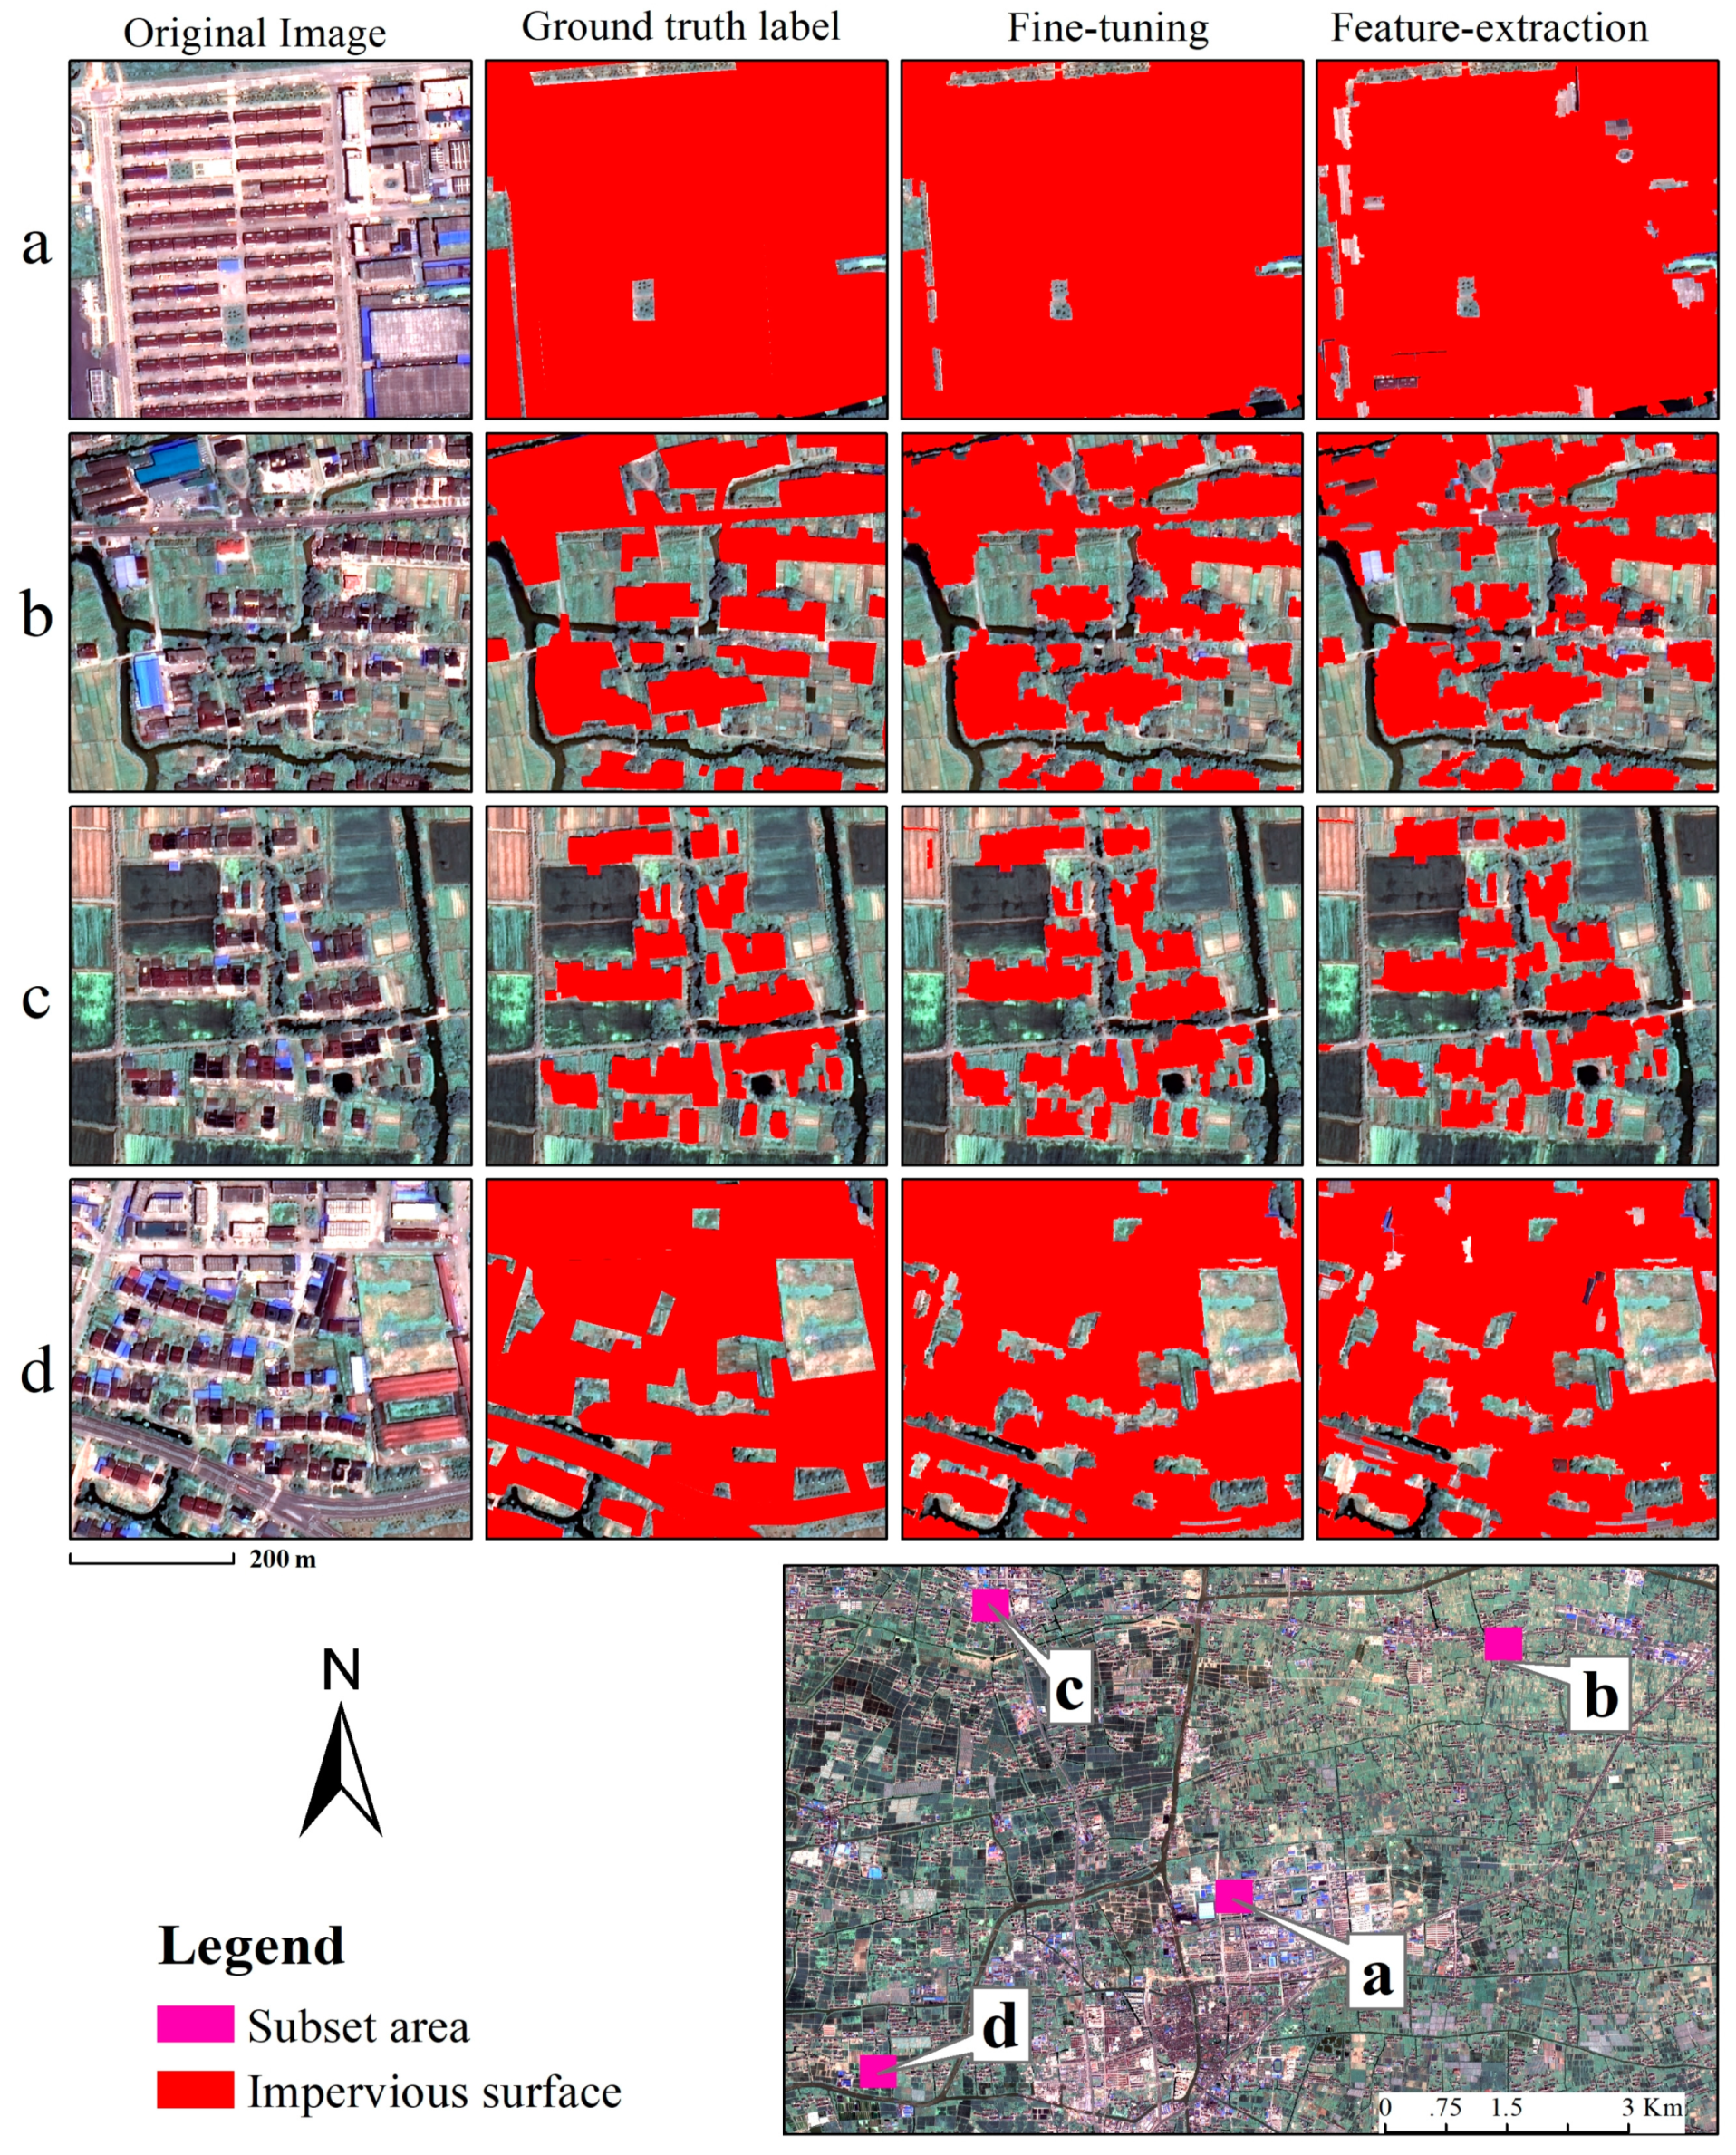
4.3. Final Map and Accuracy Assessment
4.4. Accuracy Comparison
5. Discussion
5.1. Object-Based NNC vs Our Approach
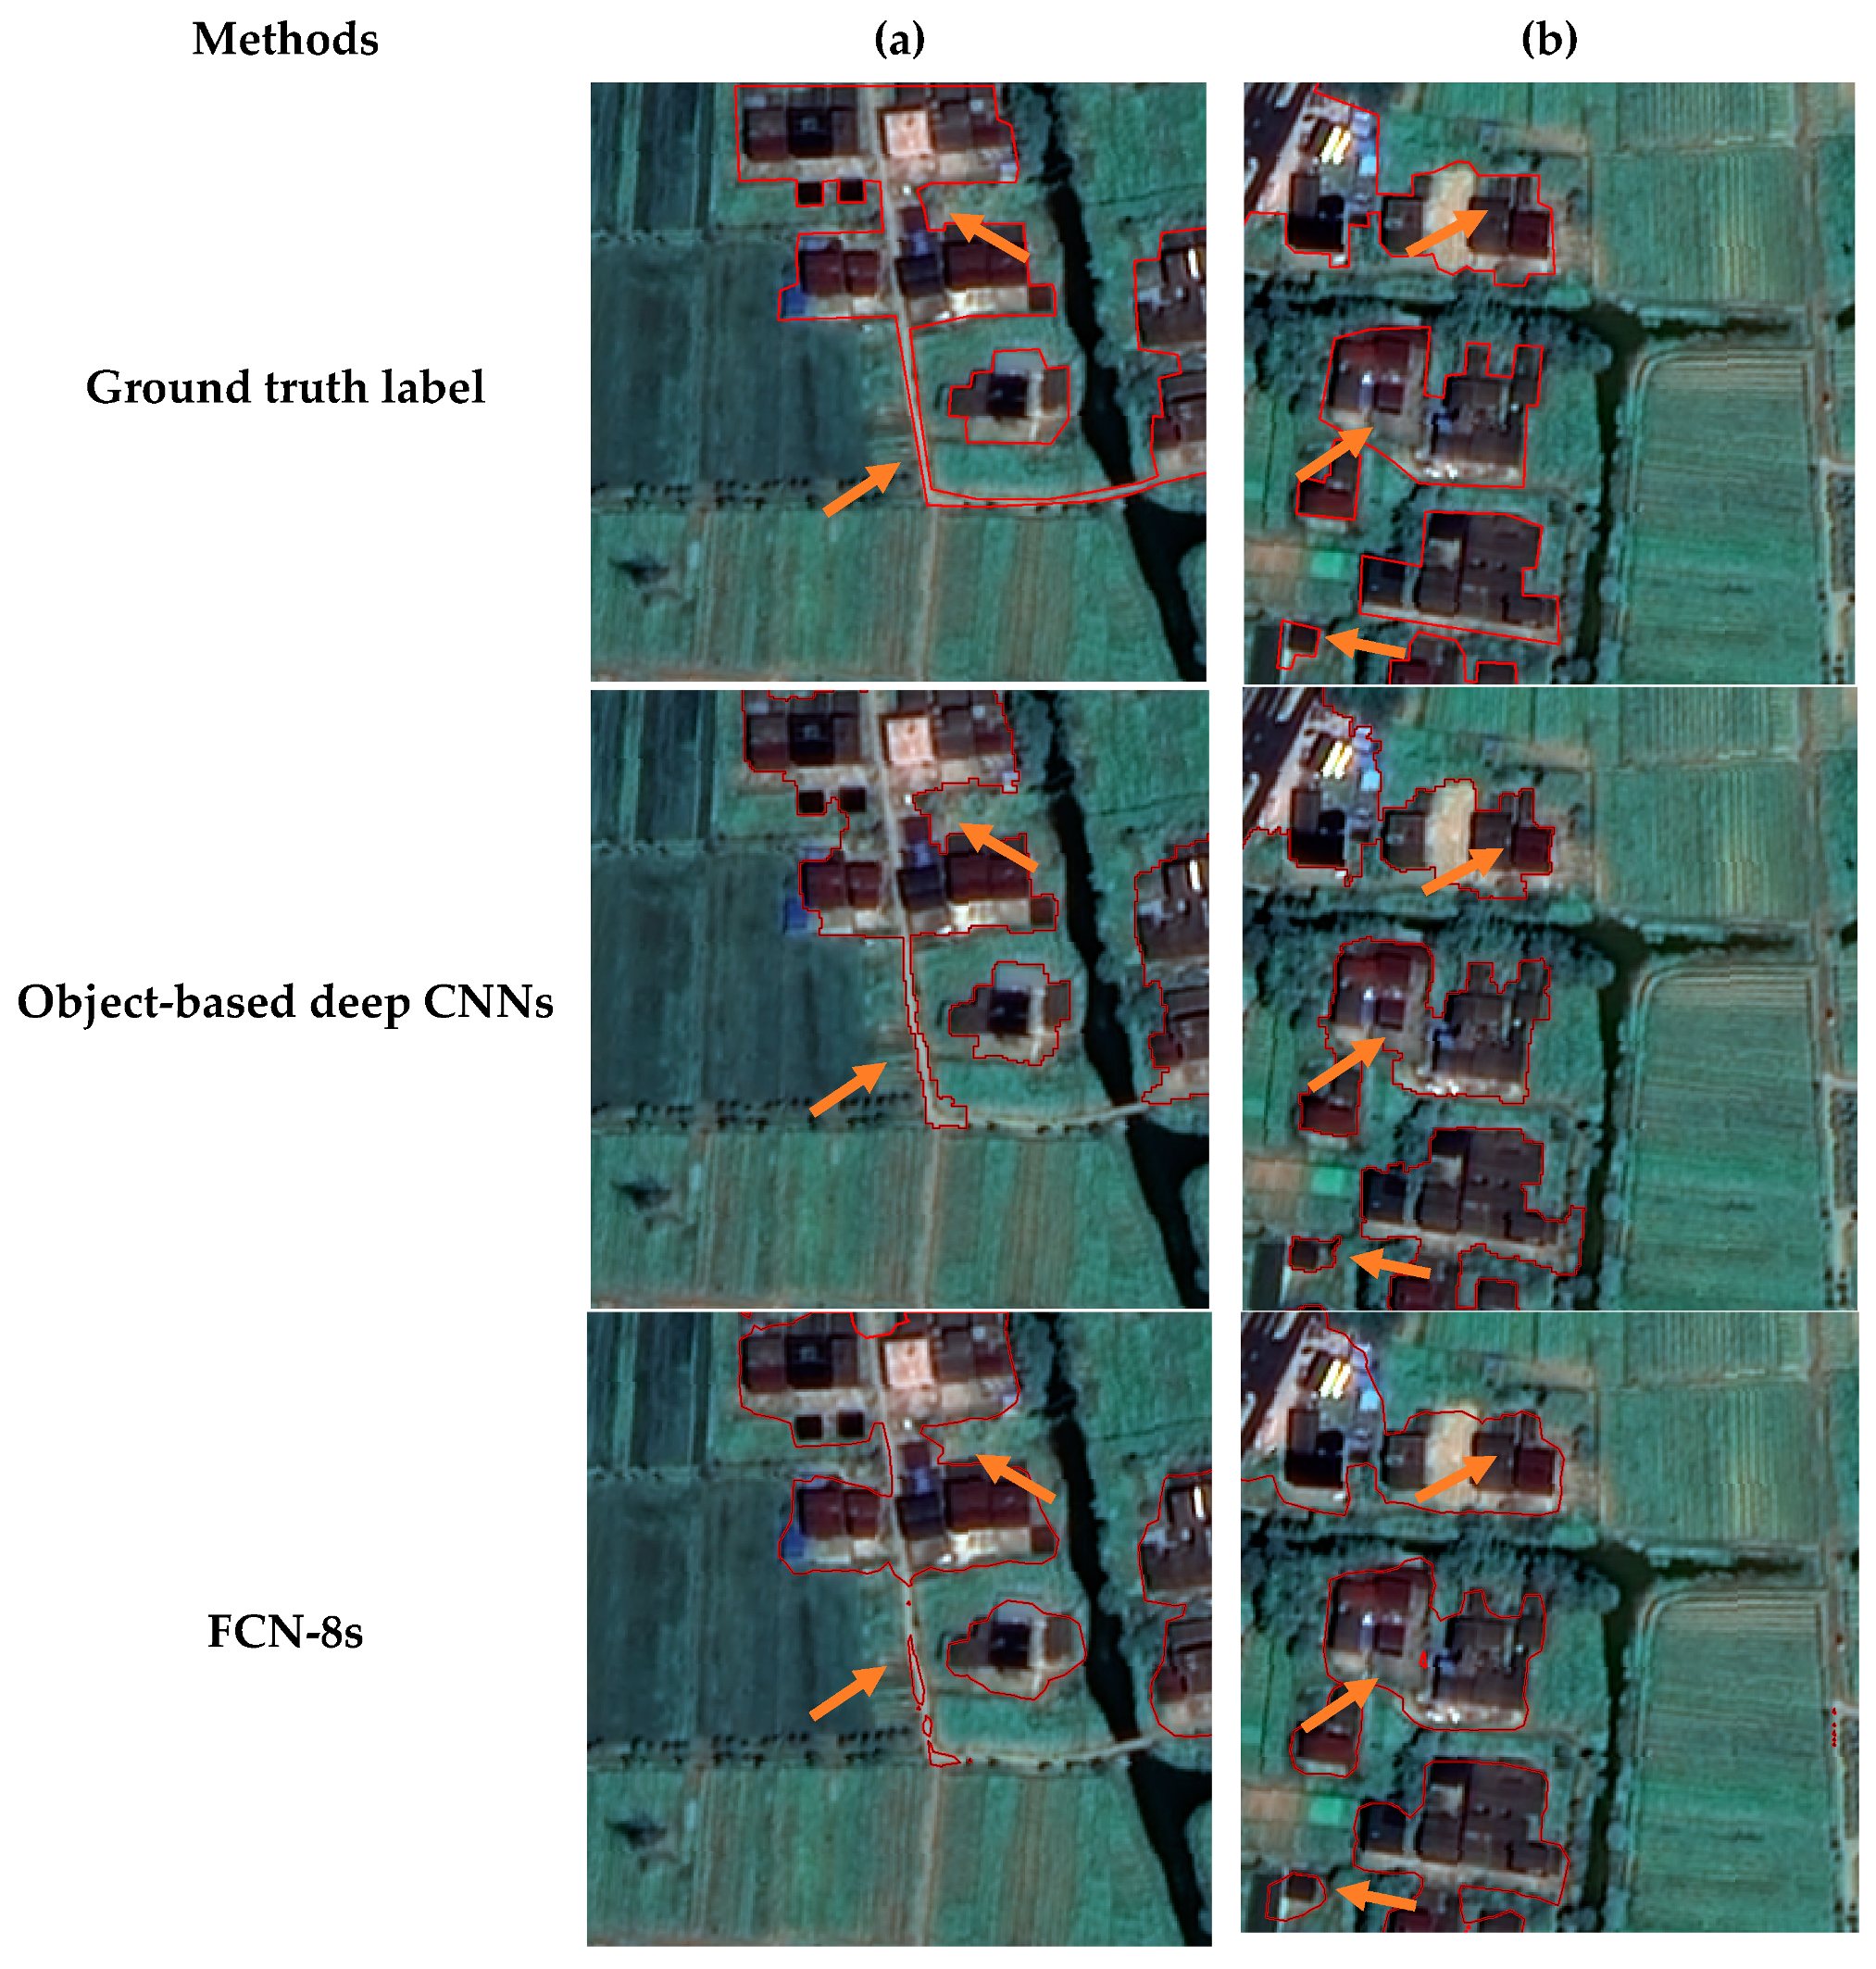
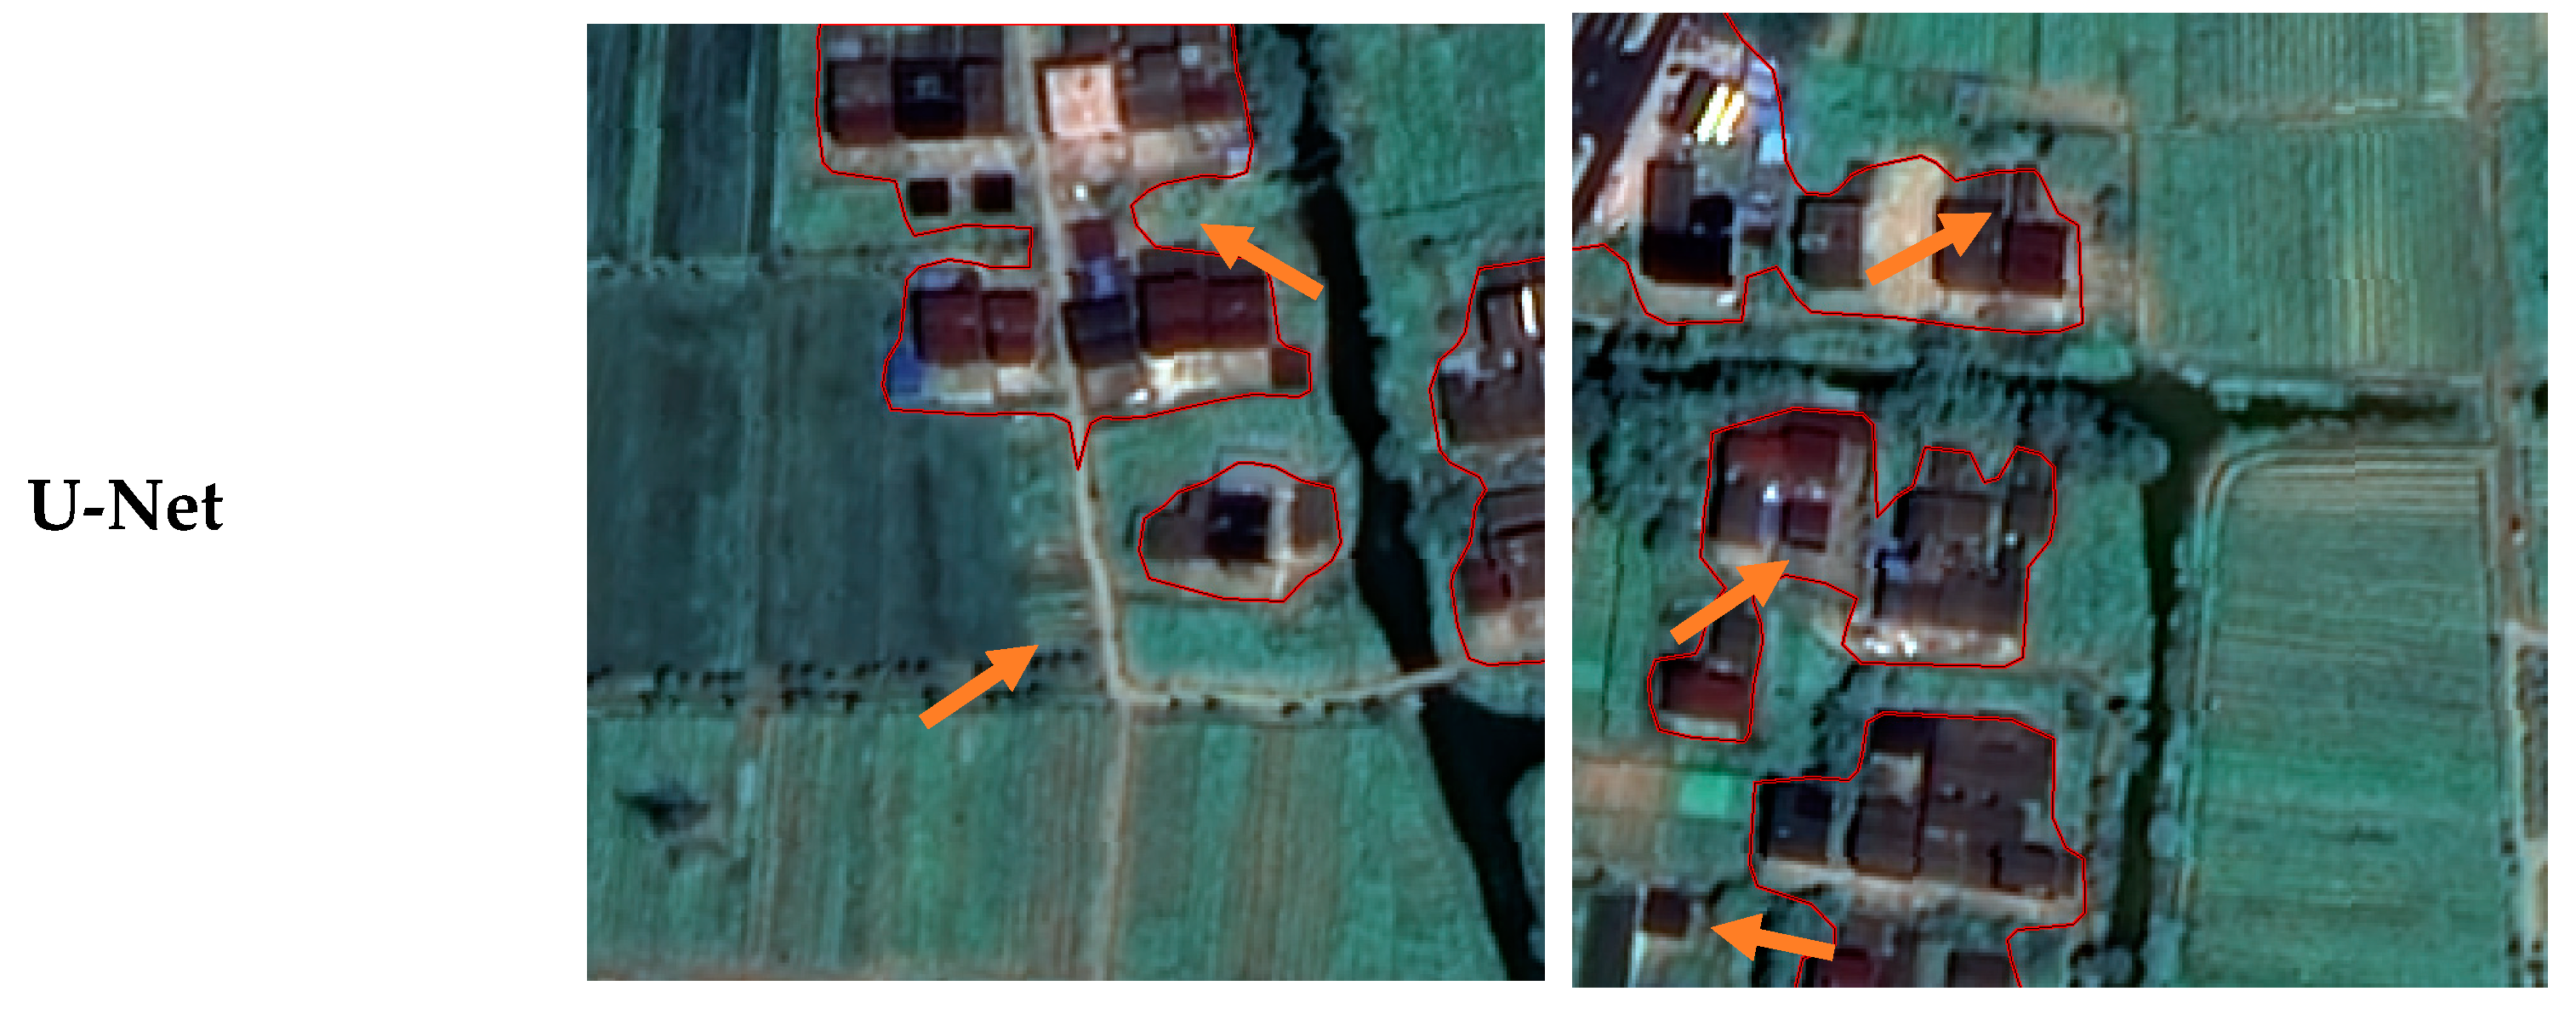
5.2. Pixel-Wise FCN-Based Methods vs Our Approach
5.3. Training Strategies and Scale Effects
6. Conclusions
Author Contributions
Funding
Acknowledgments
Conflicts of Interest
References
- Xian, G.; Homer, C. Updating the 2001 National Land Cover Database Impervious Surface Products to 2006 using Landsat Imagery Change Detection Methods. Remote Sens. Environ. 2010, 114, 1676–1686. [Google Scholar] [CrossRef]
- Xu, H.; Shi, T.; Wang, M.; Fang, C.; Lin, Z. Predicting effect of forthcoming population growth–induced impervious surface increase on regional thermal environment: Xiong’an New Area, North China. Build. Environ. 2018, 136, 98–106. [Google Scholar] [CrossRef]
- Lan, Y.; Zhan, Q. How do urban buildings impact summer air temperature? The effects of building configurations in space and time. Build. Environ. 2017, 125, 88–98. [Google Scholar] [CrossRef]
- Mahmoud, S.H.; Gan, T.Y. Long-term impact of rapid urbanization on urban climate and human thermal comfort in hot-arid environment. Build. Environ. 2018, 142, 83–100. [Google Scholar] [CrossRef]
- Cablk, M.E.; Minor, T.B. Detecting and discriminating impervious cover with high-resolution IKONOS data using principal component analysis and morphological operators. Int. J. Remote Sens. 2003, 24, 4627–4645. [Google Scholar] [CrossRef]
- Lu, D.; Weng, Q. Extraction of urban impervious surfaces from an IKONOS image. Int. J. Remote Sens. 2009, 30, 1297–1311. [Google Scholar] [CrossRef]
- Goetz, S.J.; Wright, R.K.; Smith, A.J.; Zinecker, E.; Schaub, E. IKONOS imagery for resource management: Tree cover, impervious surfaces, and riparian buffer analyses in the mid-Atlantic region. Remote Sens. Environ. 2003, 88, 195–208. [Google Scholar] [CrossRef]
- Hu, X.; Weng, Q. Impervious surface area extraction from IKONOS imagery using an object-based fuzzy method. Geocarto Int. 2011, 26, 3–20. [Google Scholar] [CrossRef]
- Zhang, H.; Li, J.; Wang, T.; Lin, H.; Zheng, Z.; Li, Y.; Lu, Y. A manifold learning approach to urban land cover classification with optical and radar data. Landsc. Urban Plan. 2018, 172, 11–24. [Google Scholar] [CrossRef]
- Zhang, H.; Lin, H.; Wang, Y. A new scheme for urban impervious surface classification from SAR images. ISPRS J. Photogramm. Remote Sens. 2018, 139, 103–118. [Google Scholar] [CrossRef]
- Blaschke, T.; Hay, G.J.; Kelly, M.; Lang, S.; Hofmann, P.; Addink, E.; Queiroz Feitosa, R.; van der Meer, F.; van der Werff, H.; van Coillie, F.; et al. Geographic Object-Based Image Analysis—Towards a new paradigm. ISPRS J. Photogramm. Remote Sens. 2014, 87, 180–191. [Google Scholar] [CrossRef] [PubMed]
- Luo, K.; Li, B.; Moiwo, J.P. Monitoring Land-Use/Land-Cover Changes at a Provincial Large Scale Using an Object-Oriented Technique and Medium-Resolution Remote-Sensing Images. Remote Sens. 2018, 10, 2012. [Google Scholar] [CrossRef]
- Ventura, D.; Bonifazi, A.; Gravina, M.F.; Belluscio, A.; Ardizzone, G. Mapping and classification of ecologically sensitive marine habitats using unmanned aerial vehicle (UAV) imagery and Object-Based Image Analysis (OBIA). Remote Sens. 2018, 10, 1331. [Google Scholar] [CrossRef]
- Zhang, X.; Feng, X. Detecting urban vegetation from IKONOS data using an object-oriented approach. In Proceedings of the 2005 IEEE International Geoscience and Remote Sensing Symposium (IGARSS’05), Seoul, Korea, 29 July 2005. [Google Scholar]
- Zhang, L.; Zhang, L.; Du, B. Deep learning for remote sensing data: A technical tutorial on the state of the art. IEEE Geosci. Remote Sens. Mag. 2016, 4, 22–40. [Google Scholar] [CrossRef]
- Krizhevsky, A.; Sutskever, I.; Geoffrey, E.H. ImageNet Classification with Deep Convolutional Neural Networks. In Proceedings of the Neural Information Processing Systems Conference, Lake Tahoe, NV, USA, 3–6 December 2012; Volume 25, pp. 1–9. [Google Scholar]
- Simonyan, K.; Zisserman, A. Very Deep Convolutional Networks for Large-Scale Image Recognition. In Proceedings of the International Conference on Learning Representations (ICLR 2015), San Diego, CA, USA, 7–9 May 2015; pp. 1–14. [Google Scholar]
- Gong, F.Y.; Zeng, Z.C.; Zhang, F.; Li, X.; Ng, E.; Norford, L.K. Mapping sky, tree, and building view factors of street canyons in a high-density urban environment. Build. Environ. 2018, 134, 155–167. [Google Scholar] [CrossRef]
- Romero, A.; Gatta, C.; Camps-valls, G.; Member, S. Unsupervised Deep Feature Extraction for Remote Sensing Image Classification. IEEE Trans. Geosci. Remote Sens. 2016, 54, 1349–1362. [Google Scholar] [CrossRef]
- Weng, Q.; Mao, Z.; Lin, J.; Guo, W. Land-Use Classification via Extreme Learning Classifier Based on Deep Convolutional Features. IEEE Geosci. Remote Sens. Lett. 2017, 14, 704–708. [Google Scholar] [CrossRef]
- Sharma, A.; Liu, X.; Yang, X.; Shi, D. A patch-based convolutional neural network for remote sensing image classification. Neural Netw. 2017, 95, 19–28. [Google Scholar] [CrossRef]
- Santara, A.; Mani, K.; Hatwar, P.; Singh, A.; Garg, A.; Padia, K.; Mitra, P. Bass net: Band-adaptive spectral-spatial feature learning neural network for hyperspectral image classification. IEEE Trans. Geosci. Remote Sens. 2017, 55, 5293–5301. [Google Scholar] [CrossRef]
- Lagrange, A.; Le Saux, B.; Beaupere, A.; Boulch, A.; Chan-Hon-Tong, A.; Herbin, S.; Randrianarivo, H.; Ferecatu, M. Benchmarking classification of earth-observation data: From learning explicit features to convolutional networks. In Proceedings of the IEEE International Geoscience and Remote Sensing Symposium (IGARSS), Milan, Italy, 26–31 July 2015; Volume 15588863, pp. 4173–4176. [Google Scholar]
- Audebert, N.; Saux, B.L.; Lefèvre, S. How Useful is Region-based Classification of Remote Sensing Images in a Deep Learning Framework? In Proceedings of the 2016 IEEE International Geoscience and Remote Sensing Symposium, Beijing, China, 10–15 July 2016; pp. 5091–5094. [Google Scholar] [CrossRef]
- Xie, F.; Shi, M.; Shi, Z.; Yin, J.; Zhao, D. Multilevel cloud detection in remote sensing images based on deep learning. IEEE J. Sel. Top. Appl. Earth Obs. Remote Sens. 2017, 10, 3631–3640. [Google Scholar] [CrossRef]
- Long, J.; Shelhamer, E.; Darrell, T. Fully convolutional networks for semantic segmentation. In Proceedings of the IEEE Computer Society Conference on Computer Vision and Pattern Recognition, Boston, MA, USA, 8–10 June 2015; pp. 3431–3440. [Google Scholar]
- Maggiori, E.; Tarabalka, Y.; Charpiat, G.; Alliez, P. Convolutional Neural Networks for Large-Scale Remote-Sensing Image Classification. IEEE Trans. Geosci. Remote Sens. 2017, 55, 645–657. [Google Scholar] [CrossRef]
- Kampffmeyer, M.; Salberg, A.-B.; Jenssen, R. Semantic Segmentation of Small Objects and Modeling of Uncertainty in Urban Remote Sensing Images Using Deep Convolutional Neural Networks. In Proceedings of the 2016 IEEE Conference on Computer Vision and Pattern Recognition Workshops (CVPRW), Las Vegas, NV, USA, 26 June–1 July 2016; pp. 1–9. [Google Scholar] [CrossRef]
- Volpi, M.; Tuia, D. Dense semantic labeling of subdecimeter resolution images with convolutional neural networks. IEEE Trans. Geosci. Remote Sens. 2017, 55, 881–893. [Google Scholar] [CrossRef]
- Sun, W.; Wang, R. Fully Convolutional Networks for Semantic Segmentation of Very High Resolution Remotely Sensed Images Combined With DSM. IEEE Geosci. Remote Sens. Lett. 2018, 15, 474–478. [Google Scholar] [CrossRef]
- Ronneberger, O.; Fischer, P.; Brox, T. U-Net: Convolutional Networks for Biomedical Image Segmentation. In Proceedings of the Medical Image Computing and Computer-Assisted Intervention (MICCAI 2015), Munich, Germany, 5–9 October 2015; pp. 234–241. [Google Scholar] [CrossRef]
- Lin, C.; Wu, C.C.; Tsogt, K.; Ouyang, Y.C.; Chang, C.I. Effects of atmospheric correction and pansharpening on LULC classification accuracy using WorldView-2 imagery. Inf. Process. Agric. 2015, 2, 25–36. [Google Scholar] [CrossRef]
- Song, C.; Woodcock, C.E.; Seto, K.C.; Lenney, M.P.; Macomber, S.A. Classification and change detection using Landsat TM data: When and how to correct atmospheric effects? Remote Sens. Environ. 2001, 75, 230–244. [Google Scholar] [CrossRef]
- Benz, U.C.; Hofmann, P.; Willhauck, G.; Lingenfelder, I.; Heynen, M. Multi-resolution, object-oriented fuzzy analysis of remote sensing data for GIS-ready information. ISPRS J. Photogramm. Remote Sens. 2004, 58, 239–258. [Google Scholar] [CrossRef]
- Drǎguţ, L.; Csillik, O.; Eisank, C.; Tiede, D. Automated parameterisation for multi-scale image segmentation on multiple layers. ISPRS J. Photogramm. Remote Sens. 2014, 88, 119–127. [Google Scholar] [CrossRef] [PubMed]
- Drǎguţ, L.; Tiede, D.; Levick, S.R. ESP: A tool to estimate scale parameter for multiresolution image segmentation of remotely sensed data. Int. J. Geogr. Inf. Sci. 2010, 24, 859–871. [Google Scholar] [CrossRef]
- Belgiu, M.; Drǎguţ, L. Comparing supervised and unsupervised multiresolution segmentation approaches for extracting buildings from very high resolution imagery. ISPRS J. Photogramm. Remote Sens. 2014, 96, 67–75. [Google Scholar] [CrossRef]
- Pan, S.J.; Yang, Q. A survey on transfer learning. IEEE Trans. Knowl. Data Eng. 2010, 22, 1345–1359. [Google Scholar] [CrossRef]
- Russakovsky, O.; Deng, J.; Su, H.; Krause, J.; Satheesh, S.; Ma, S.; Huang, Z.; Karpathy, A.; Khosla, A.; Bernstein, M.; et al. ImageNet Large Scale Visual Recognition Challenge. Int. J. Comput. Vis. 2015, 115, 211–252. [Google Scholar] [CrossRef]
- Szegedy, C.; Liu, W.; Jia, Y.; Sermanet, P.; Reed, S.; Anguelov, D.; Erhan, D.; Vanhoucke, V.; Rabinovich, A. Going deeper with convolutions. In Proceedings of the IEEE Computer Society Conference on Computer Vision and Pattern Recognition, Columbus, OH, USA, 24–27 June 2014; pp. 1–9. [Google Scholar]
- Szegedy, C.; Vanhoucke, V.; Ioffe, S.; Shlens, J.; Wojna, Z. Rethinking the inception architecture for computer vision. In Proceedings of the IEEE Conference on Computer Vision and Pattern Recognition, Las Vegas, NV, USA, 27–30 June 2016; pp. 2818–2826. [Google Scholar]
- Lei, Y.; Jia, F.; Lin, J.; Xing, S.; Ding, S.X. An Intelligent Fault Diagnosis Method Using Unsupervised Feature Learning Towards Mechanical Big Data. IEEE Trans. Ind. Electron. 2016, 63, 3137–3147. [Google Scholar] [CrossRef]
- Xu, G.; Zhu, X.; Fu, D.; Dong, J.; Xiao, X. Automatic land cover classification of geo-tagged field photos by deep learning. Environ. Model. Softw. 2017, 91, 127–134. [Google Scholar] [CrossRef]
- Szegedy, C.; Ioffe, S.; Vanhoucke, V.; Alemi, A. Inception-v4, Inception-ResNet and the Impact of Residual Connections on Learning. In Proceedings of the 31st AAAI Conference on Artificial Intelligence, San Francisco, CA, USA, 4–9 February 2017; pp. 4278–4284. [Google Scholar]
- Ioffe, S.; Szegedy, C. Batch normalization: Accelerating deep network training by reducing internal covariate shift. In Proceedings of the International Conference on Machine Learning, Lille, France, 6–11 July 2015; pp. 448–456. [Google Scholar]
- eCognition Developer. Trimble eCognition Developer 9.0 User Guide; Trimble Germany GmbH: Munich, Germany, 2014. [Google Scholar]
- Witharana, C.; Lynch, H. An Object-Based Image Analysis Approach for Detecting Penguin Guano in very High Spatial Resolution Satellite Images. Remote Sens. 2016, 8, 375. [Google Scholar] [CrossRef]
- POWERS, D.M.W. Evaluation: From Precision, Recall and F-Measure To Roc, Informedness, Markedness & Correlation. J. Mach. Learn. Technol. 2011, 2, 37–63. [Google Scholar]
- Congalton, R.G.; Green, K. Assessing the Accuracy of Remotely Sensed Data: Principles and Practices, 2nd ed.; CRC Press: Boca Raton, FL, USA, 2008; ISBN 9781420055122. [Google Scholar]
- Lecun, Y.; Bengio, Y.; Hinton, G. Deep learning. Nature 2015, 521, 436–444. [Google Scholar] [CrossRef] [PubMed]
- Luus, F.P.S.; Salmon, B.P.; Van Den Bergh, F.; Maharaj, B.T.J. Multiview Deep Learning for Land-Use Classification. IEEE Geosci. Remote Sens. Lett. 2015, 12, 2448–2452. [Google Scholar] [CrossRef]
- Guo, Z.; Shengoku, H.; Wu, G.; Chen, Q.; Yuan, W.; Shi, X.; Shao, X.; Xu, Y.; Shibasaki, R. Semantic Segmentation for Urban Planning Maps Based on U-Net. In Proceedings of the IGARSS 2018—2018 IEEE International Geoscience and Remote Sensing Symposium, Valencia, Spain, 22–27 July 2018; pp. 6187–6190. [Google Scholar]
- Kellenberger, B.; Volpi, M.; Tuia, D. Learning class- and location-specific priors for urban semantic labeling with CNNs. In Proceedings of the 2017 Joint Urban Remote Sensing Event (JURSE), Dubai, UAE, 6–8 March 2017; p. 16868016. [Google Scholar]
- Sun, Y.; Zhang, X.; Zhao, X.; Xin, Q. Extracting building boundaries from high resolution optical images and LiDAR data by integrating the convolutional neural network and the active contour model. Remote Sens. 2018, 10, 1459. [Google Scholar] [CrossRef]
- Özbulak, G.; Aytar, Y.; Ekenel, H.K. How transferable are CNN-based features for age and gender classification. In Lecture Notes in Informatics (LNI), Proceedings—Series of the Gesellschaft fur Informatik (GI); IEEE: Darmstadt, Germany, 2016; pp. 1–6. [Google Scholar]

| Reference class | ||||
|---|---|---|---|---|
| Predicted class | PS | IS | Sum | UA |
| PS | 26,684 | 3846 | 30,530 | 87.40% |
| IS | 2874 | 11,575 | 14,449 | 80.11% |
| Sum | 29,558 | 15,421 | 44,979 | |
| PA | 90.28% | 75.06% | ||
| Overall accuracy | 85.06% | |||
| Reference class | ||||
|---|---|---|---|---|
| Predicted class | PS | IS | Sum | UA |
| PS | 28,028 | 1214 | 29,242 | 95.85% |
| IS | 1530 | 14,207 | 15,737 | 90.28% |
| Sum | 29,558 | 15,421 | 44,979 | |
| PA | 94.82% | 92.13% | ||
| Overall accuracy | 93.90% | |||
| Methods | FCN-8s | U-Net | OB-NNC | Ours-FE | Ours-FT |
|---|---|---|---|---|---|
| Learning rate | 0.0001 | 0.0001 | - | 0.01 | 0.01 |
| strategy | fine-tuning | fine-tuning | - | feature-extraction | fine-tuning |
| platform | GPU | GPU | CPU | GPU | GPU |
| time (hours) | 4.36 | 4.91 | 32.61 | 4.24 | 5.18 |
| Methods | FCN-8s | U-Net | OB-NNC | Ours-FE | Ours-FT | |
|---|---|---|---|---|---|---|
| Evaluation Criteria | Precision | 81.1% | 81.7% | 82.2% | 78.4% | 89.7% |
| Recall | 79.0% | 74.3% | 79.6% | 69.7% | 88.1% | |
| F-measure | 80.0% | 77.9% | 80.9% | 73.8% | 88.9% | |
| Kappa coefficient | 0.737 | 0.704 | 0.751 | 0.714 | 0.852 |
| Methods | FCN-8s | U-Net | OB-NNC | Ours-FE | Ours-FT |
|---|---|---|---|---|---|
| FCN-8s | Not significant | Not significant | Not significant | Significant | |
| U-Net | 0.57 | Not significant | Not significant | Significant | |
| OB-NNC | 0.24 | 0.81 | Not significant | Significant | |
| Ours-FE | 0.40 | 0.17 | 0.64 | Significant | |
| Ours-FT | 2.30 | 2.85 | 2.06 | 2.66 |
© 2019 by the authors. Licensee MDPI, Basel, Switzerland. This article is an open access article distributed under the terms and conditions of the Creative Commons Attribution (CC BY) license (http://creativecommons.org/licenses/by/4.0/).
Share and Cite
Fu, Y.; Liu, K.; Shen, Z.; Deng, J.; Gan, M.; Liu, X.; Lu, D.; Wang, K. Mapping Impervious Surfaces in Town–Rural Transition Belts Using China’s GF-2 Imagery and Object-Based Deep CNNs. Remote Sens. 2019, 11, 280. https://doi.org/10.3390/rs11030280
Fu Y, Liu K, Shen Z, Deng J, Gan M, Liu X, Lu D, Wang K. Mapping Impervious Surfaces in Town–Rural Transition Belts Using China’s GF-2 Imagery and Object-Based Deep CNNs. Remote Sensing. 2019; 11(3):280. https://doi.org/10.3390/rs11030280
Chicago/Turabian StyleFu, Yongyong, Kunkun Liu, Zhangquan Shen, Jinsong Deng, Muye Gan, Xinguo Liu, Dongming Lu, and Ke Wang. 2019. "Mapping Impervious Surfaces in Town–Rural Transition Belts Using China’s GF-2 Imagery and Object-Based Deep CNNs" Remote Sensing 11, no. 3: 280. https://doi.org/10.3390/rs11030280