Article

Spectral Diversity Successfully Estimates the α-Diversity of Biocrust-Forming Lichens

by
Javier Blanco-Sacristán
1,*,
Cinzia Panigada
1,
Giulia Tagliabue
1,
Rodolfo Gentili
1,
Roberto Colombo
1,
Mónica Ladrón de Guevara
2,3,
Fernando T. Maestre
4 and
Micol Rossini
1
1
Remote Sensing of Environmental Dynamics Lab, University of Milano – Bicocca, 20126 Milan, Italy
2
Universidad Rey Juan Carlos, 28933 Móstoles, Spain
3
Centre for Ecological Research and Forestry Applications, CREAF-CSIC-UAB, 08193 Barcelona, Spain
4
Department of Ecology, University of Alicante, 03690 San Vicente del Raspeig, Alicante, Spain
*
Author to whom correspondence should be addressed.
Remote Sens. 2019, 11(24), 2942; https://doi.org/10.3390/rs11242942
Submission received: 18 September 2019 / Revised: 5 December 2019 / Accepted: 6 December 2019 / Published: 9 December 2019

Abstract

:
Biocrusts, topsoil communities formed by mosses, lichens, liverworts, algae, and cyanobacteria, are a key biotic component of dryland ecosystems worldwide. Experiments carried out with lichen- and moss-dominated biocrusts indicate that climate change may dramatically reduce their cover and diversity. Therefore, the development of reproducible methods to monitor changes in biocrust diversity and abundance across multiple spatio-temporal scales is key for evaluating how climate change may impact biocrust communities and the myriad of ecosystem functions and services that rely on them. In this study, we collected lichen-dominated biocrust samples from a semi-arid ecosystem in central Spain. Their α-diversity was then evaluated using very high spatial resolution hyperspectral images (pixel size of 0.091 mm) measured in laboratory under controlled conditions. Support vector machines were used to map the biocrust composition. Traditional α-diversity metrics (i.e., species richness, Shannon’s, Simpson’s, and Pielou’s indices) were calculated using lichen fractional cover data derived from their classifications in the hyperspectral imagery. Spectral diversity was calculated at different wavelength ranges as the coefficient of variation of different regions of the reflectance spectra of lichens and as the standard deviation of the continuum removal algorithm (SD_CR). The accuracy of the classifications of the images obtained was close to 100%. The results showed the best coefficient of determination (r2 = 0.47) between SD_CR calculated at 680 nm and the α-diversity calculated as the Simpson’s index, which includes species richness and their evenness. These findings indicate that this spectral diversity index could be used to track spatio-temporal changes in lichen-dominated biocrust communities. Thus, they are the first step to monitor α-diversity of biocrust-forming lichens at the ecosystem and regional levels, a key task for any program aiming to evaluate changes in biodiversity and associated ecosystem services in drylands.

1. Introduction

Biocrusts are communities formed by photoautotrophic (algae, lichens, cyanobacteria, liverworts, and bryophytes) and heterotrophic (bacteria, fungi, protozoa, and nematodes) organisms that live on the soil surface and cover a large part of the non-vegetated surface in drylands worldwide [1]. These communities influence fundamental ecosystem processes in drylands, including—but not limited to—nutrient cycling, soil respiration, and runon-runoff dynamics [2], and are critical for maintaining the multiplicity of ecosystem services they provide [3]. Attributes of biocrust communities, such as their cover, composition, and diversity, largely modulate their impacts on multiple ecosystem functions simultaneously [4,5], and thus have been suggested as indicators of ecosystem functioning in drylands [6,7].
Multiple lines of evidence suggest that ongoing climate change can dramatically affect biocrust communities, reducing their cover and diversity [8]. Reference [9] estimated a global reduction of their cover by 40% globally within the next 65 years, and quick reductions in their cover have already been observed in experiments simulating climate change [10,11,12]. As biocrusts contribute to ecosystem multifunctionality [2,11,13,14], changes in their composition, cover and diversity could lead to a reduction of the capacity of drylands to provide essential ecosystem services such as atmospheric CO2 sequestration and the maintenance of soil fertility. For this reason, finding accurate and operational methods to estimate the cover and diversity of biocrust constituents is a key goal for any ecosystem monitoring program in drylands.
Remote sensing has been highlighted several times as an important tool for biodiversity monitoring and conservation [15,16,17,18]. It is one of the most cost-effective approaches to identify biodiversity hotspots and to predict changes in species composition, potentially providing repeated measurements and making it possible to study temporal changes in biodiversity [19]. In this context, the spectral variation hypothesis (SVH) proposes that the larger the spectral heterogeneity of an environment is, the higher the number of species found here will be [20]. This hypothesis has been validated several times using α-diversity metrics with vascular plants [21,22,23,24,25]. Even though measures of spectral diversity based on spectral dispersion (i.e., the coefficient of variation (CV) or the standard deviation (SD)) have shown good correlations with the richness, diversity, evenness, and composition of vascular plants [25,26,27], the SVH has never been tested using lichens.
The use of optical remote sensing of biocrusts so far has mainly focused on mapping and monitoring their distribution [28,29,30,31,32,33] and only one study [34] investigated lichens’ α-diversity at the landscape level through correlation of high-resolution data with field samples. Since biocrusts are spectrally characterized by narrow absorption features in specific spectral regions [35], hyperspectral data have shown potential when discriminating them from vegetation and other soil features (e.g., [35,36,37]). However, confounding factors such as water content and biocrust tridimensional structure might hinder their spectral characterization. For this reason, several authors [31,33,35,38,39,40] proposed the use of the continuum removal (CR) algorithm [41] to ensure the comparability of biocrusts’ absorption features. The CR quantifies the absorption features at specific wavelengths, normalizing the reflectance spectra to a common baseline. This is achieved by approximating the continuum between local spectral maxima through straight-line segments: a value of 1 is assigned to the local maxima, and a value between 0 and 1 is obtained in correspondence of the absorption features. This approach might be particularly useful to enhance the discrimination of lichens, which are characterized by subtle spectral differences [42].
In this framework, the objective of this study was to apply the SVH to capture the α-diversity of lichens to support dryland monitoring by (i) evaluating the potential of hyperspectral high spatial resolution images to identify biocrust-forming lichens (at the genus level); (ii) exploring the relationships between spectral diversity metrics and the α-diversity of lichens within biocrust communities.

2. Materials and Methods

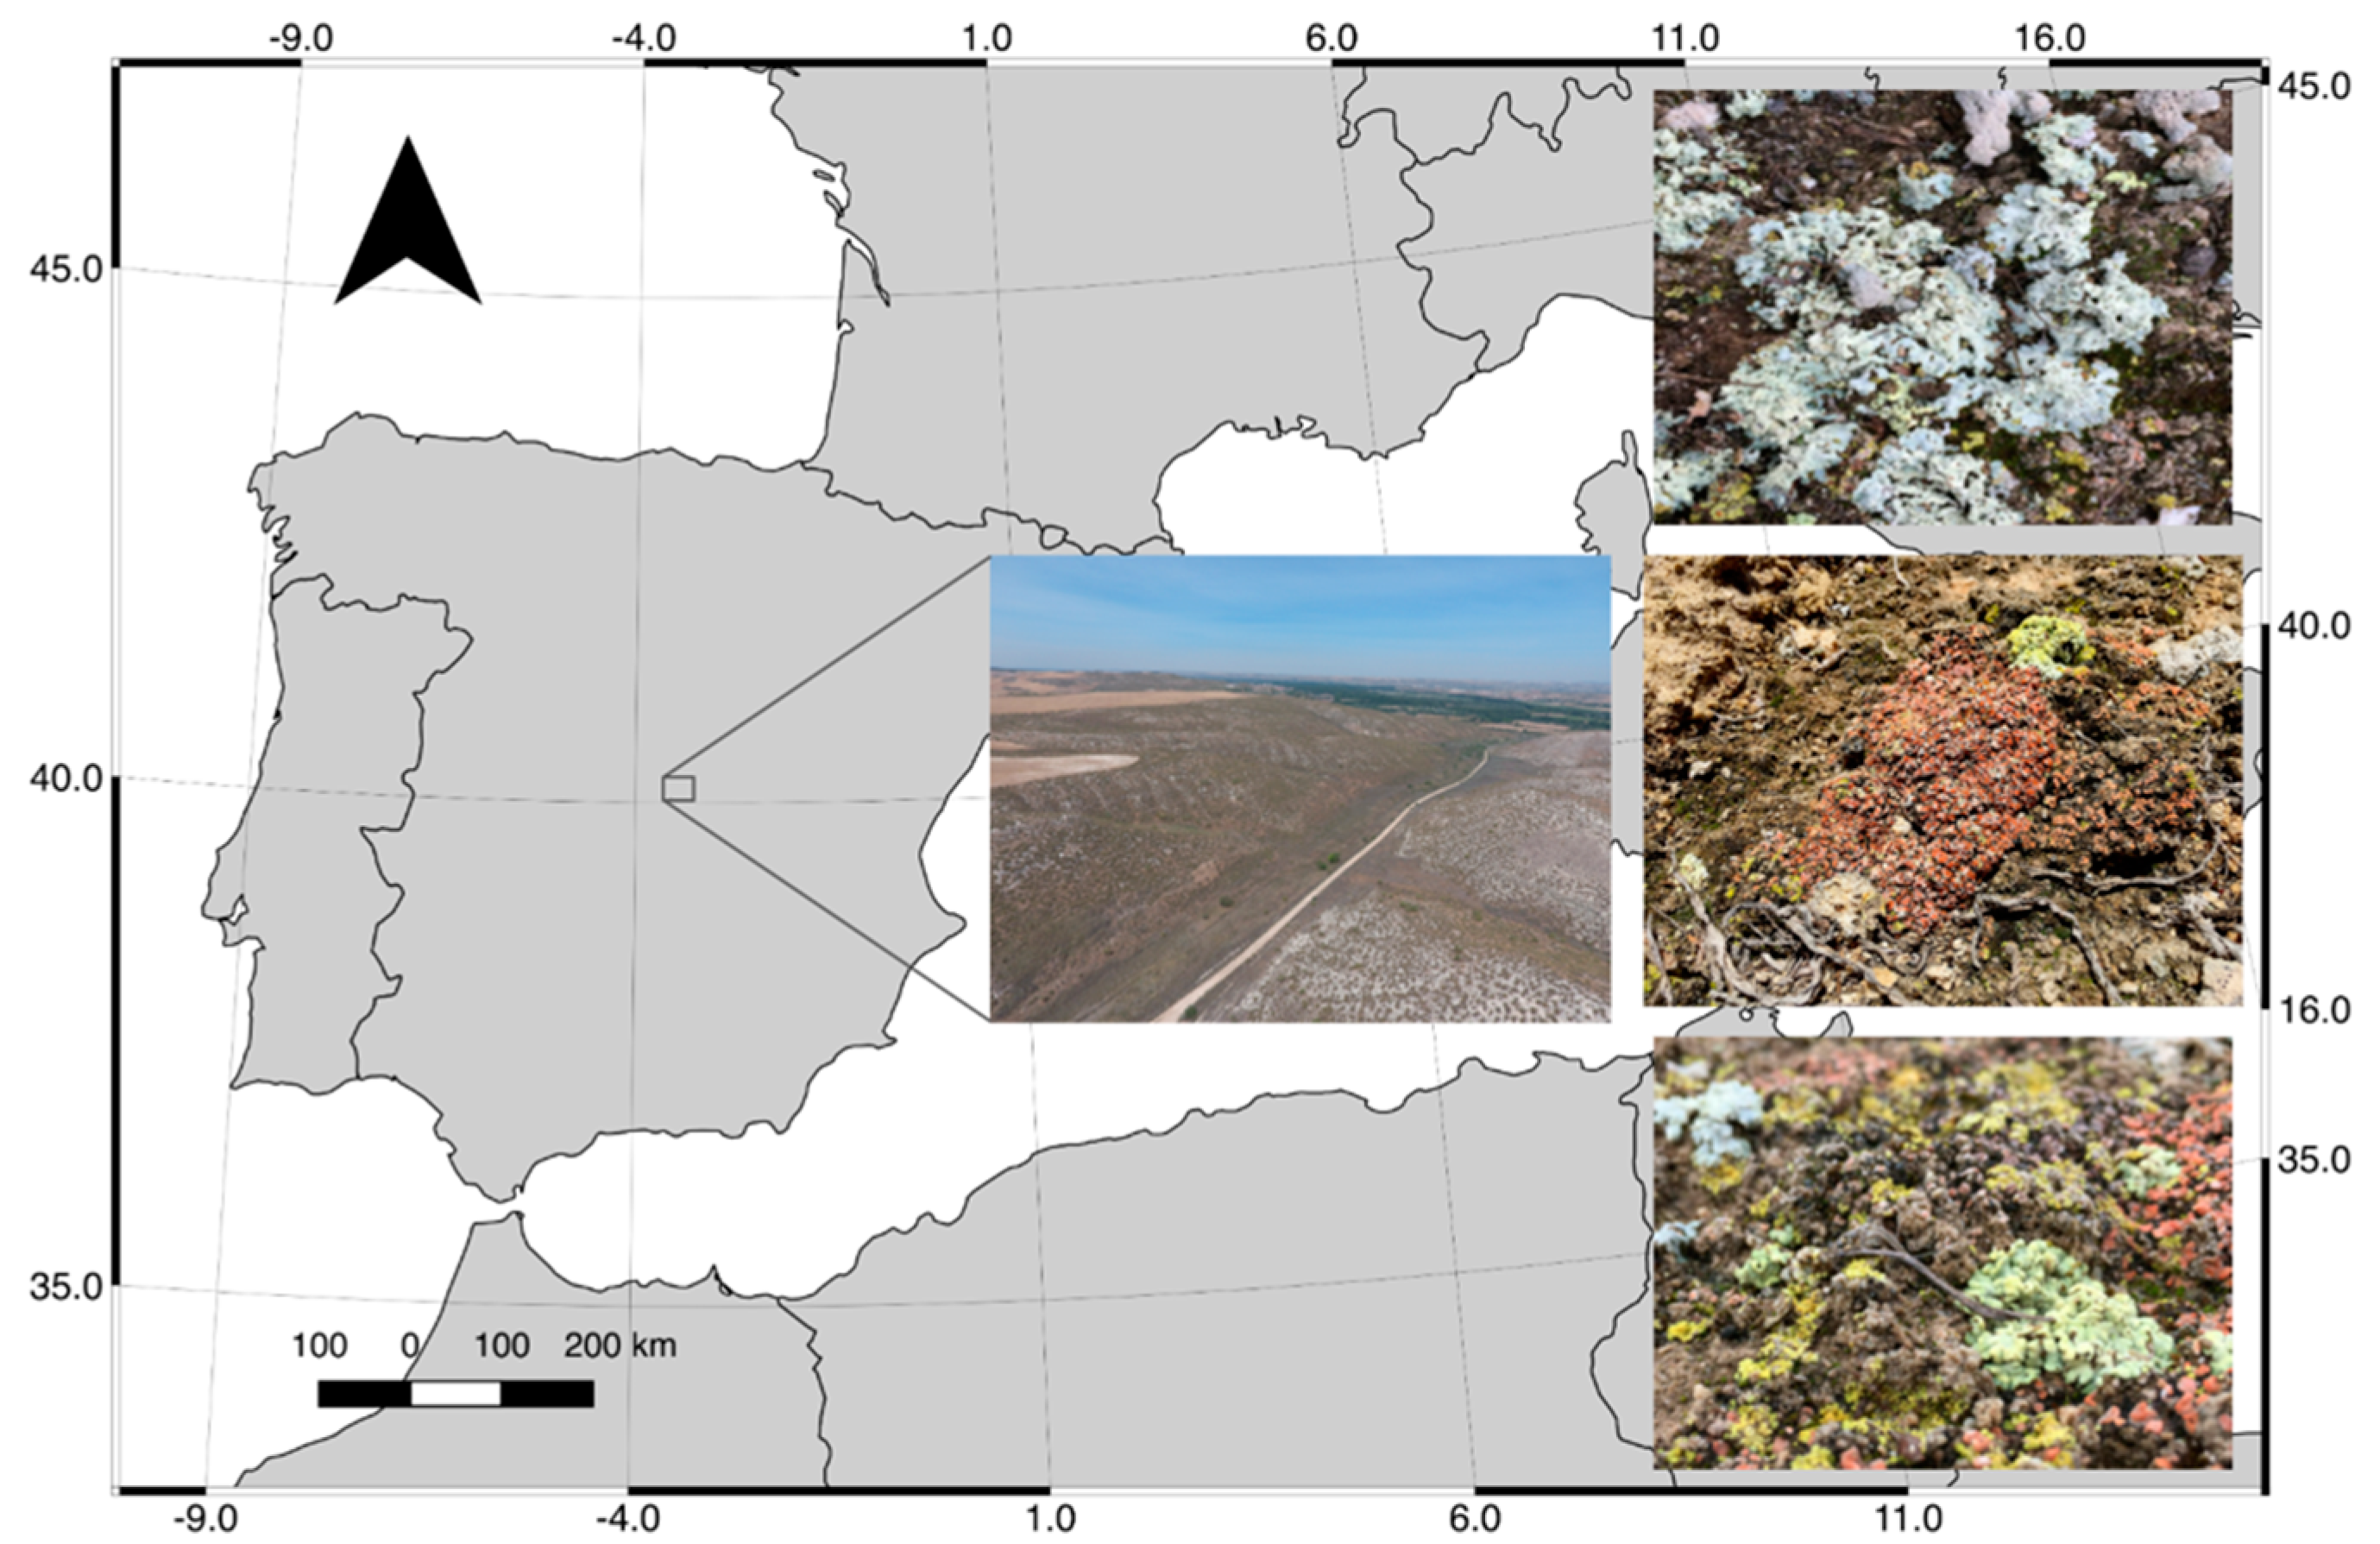
2.1. Study Area and Sampling

The study area is located in Aranjuez, central Spain (40°01′53.9″N 3°32′50.8″W; Figure 1). The climate is semi-arid Mediterranean, with mean annual temperature and rainfall of 15 °C and 349 mm, respectively. The plant cover is below 40%, and is dominated by Macrochloa tenacissima and other small shrubs, such as Helianthemum squamatum and Gypsophila struthium. A well-developed biocrust community, a mixture of lichens and mosses, is present between vegetation, covering up to more than 50% of the plant interspaces. In lichen-dominated biocrusts, Acarospora spp., Buellia spp., Diploschistes spp., Fulgensia spp., Psora spp., and Squamarina spp. are the most abundant genera, while in moss-dominated biocrusts, Pleurochaete squarrosa, Tortula revolvens, and Didymodon acutus are the most abundant mosses. Since this study focused on lichens, we decided to cluster the mosses identified (under the term Moss). Finally, in patches of soil dominated by cyanobacteria, genera as Microcoleus spp., Tolypothrix spp., and Nostoc spp. are present [43]. See [44] for a species list of the biocrust-forming lichens and mosses in our study area.
Following the sampling protocol described in [30], we collected 54 biocrust samples using Petri dishes of 8.5 cm of diameter from 18 plots (three samples per plot randomly chosen). These plots were distributed following two altitudinal transects in two separated slopes of the study area with different exposures (north- vs. south-facing). Each transect was divided in three levels depending on the height of the transect respect to its base, placing three plots on each level.

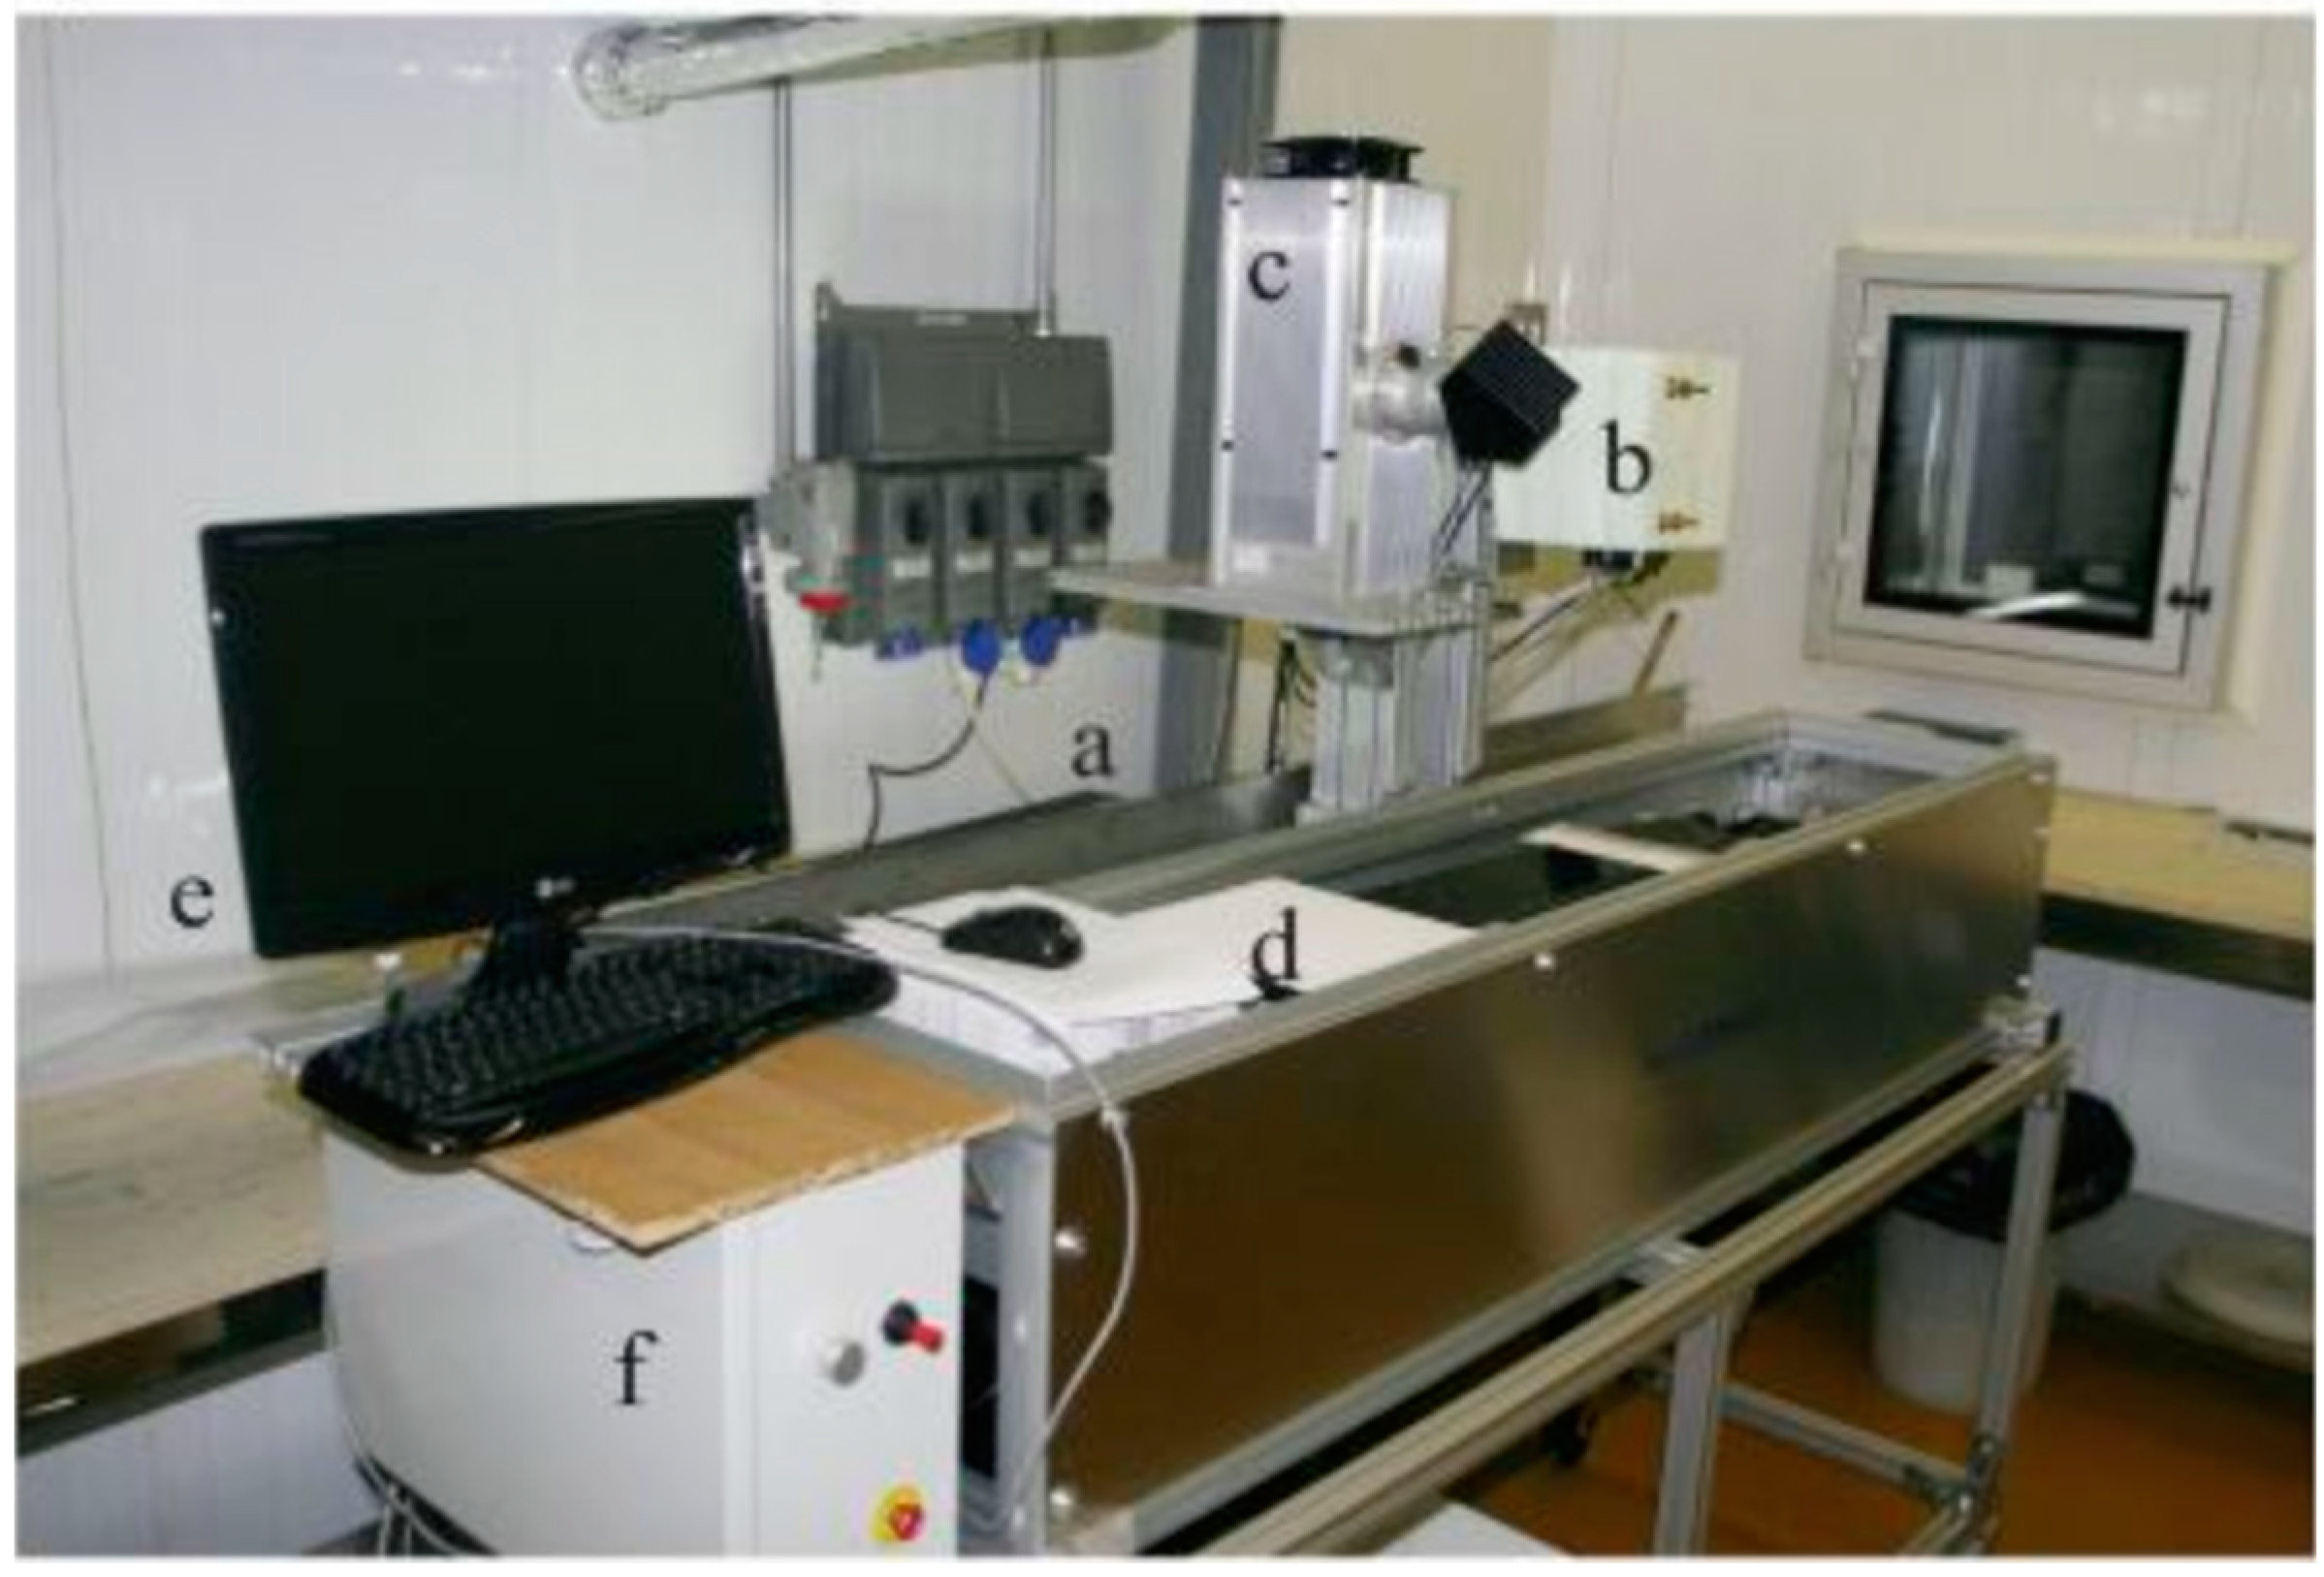
2.2. Hyperspectral Imagery Acquisition

Hyperspectral images of the biocrust samples were acquired with a hyperspectral scanning imaging system [45] measuring spectral reflectance in 840 bands in the visible (VIS) and near-infrared (NIR) spectral region (i.e., 380–1000 nm), with a spectral resolution of 2–3 nm (calculated at full width at half maximum; Figure 2). The system consists of a custom high-precision linear stage that embeds a hyperspectral imaging spectrometer (Hyperspec® VNIR, HeadWall Photonics, USA) and a dedicated halogen stable light source (i.e., 600 or 1000 W, LOT Quantum Design). Powered by an electrical engine, both the spectrometer and the halogen light source are able to move back and forth at a defined speed. The system is a push-broom scanner and it measures lines of 1004 pixels while moving forward by means of the linear stage until an image of the whole studied object is collected. We used a water-filter tube between the lamp and the mirror reflecting the light to the samples to avoid sample overheating.
Two sets of images were collected: one with the dry samples (dry set) and another 10 min after evenly watering the samples with 30 mL of distilled water (wet set). A total of 18 images (six samples on each set; Figure 3) with a spatial resolution of 0.091 mm were taken. A calibrated white Lambertian Spectralon® panel (Labsphere, North Sutton, USA) was placed close to the samples to calculate the reflectance as the ratio between the radiance reflected by the biocrust samples and the panel. The instrument’s dark current signal was measured by manually closing the imaging spectrometer aperture prior to capturing each image and subtracted from the measured radiance.

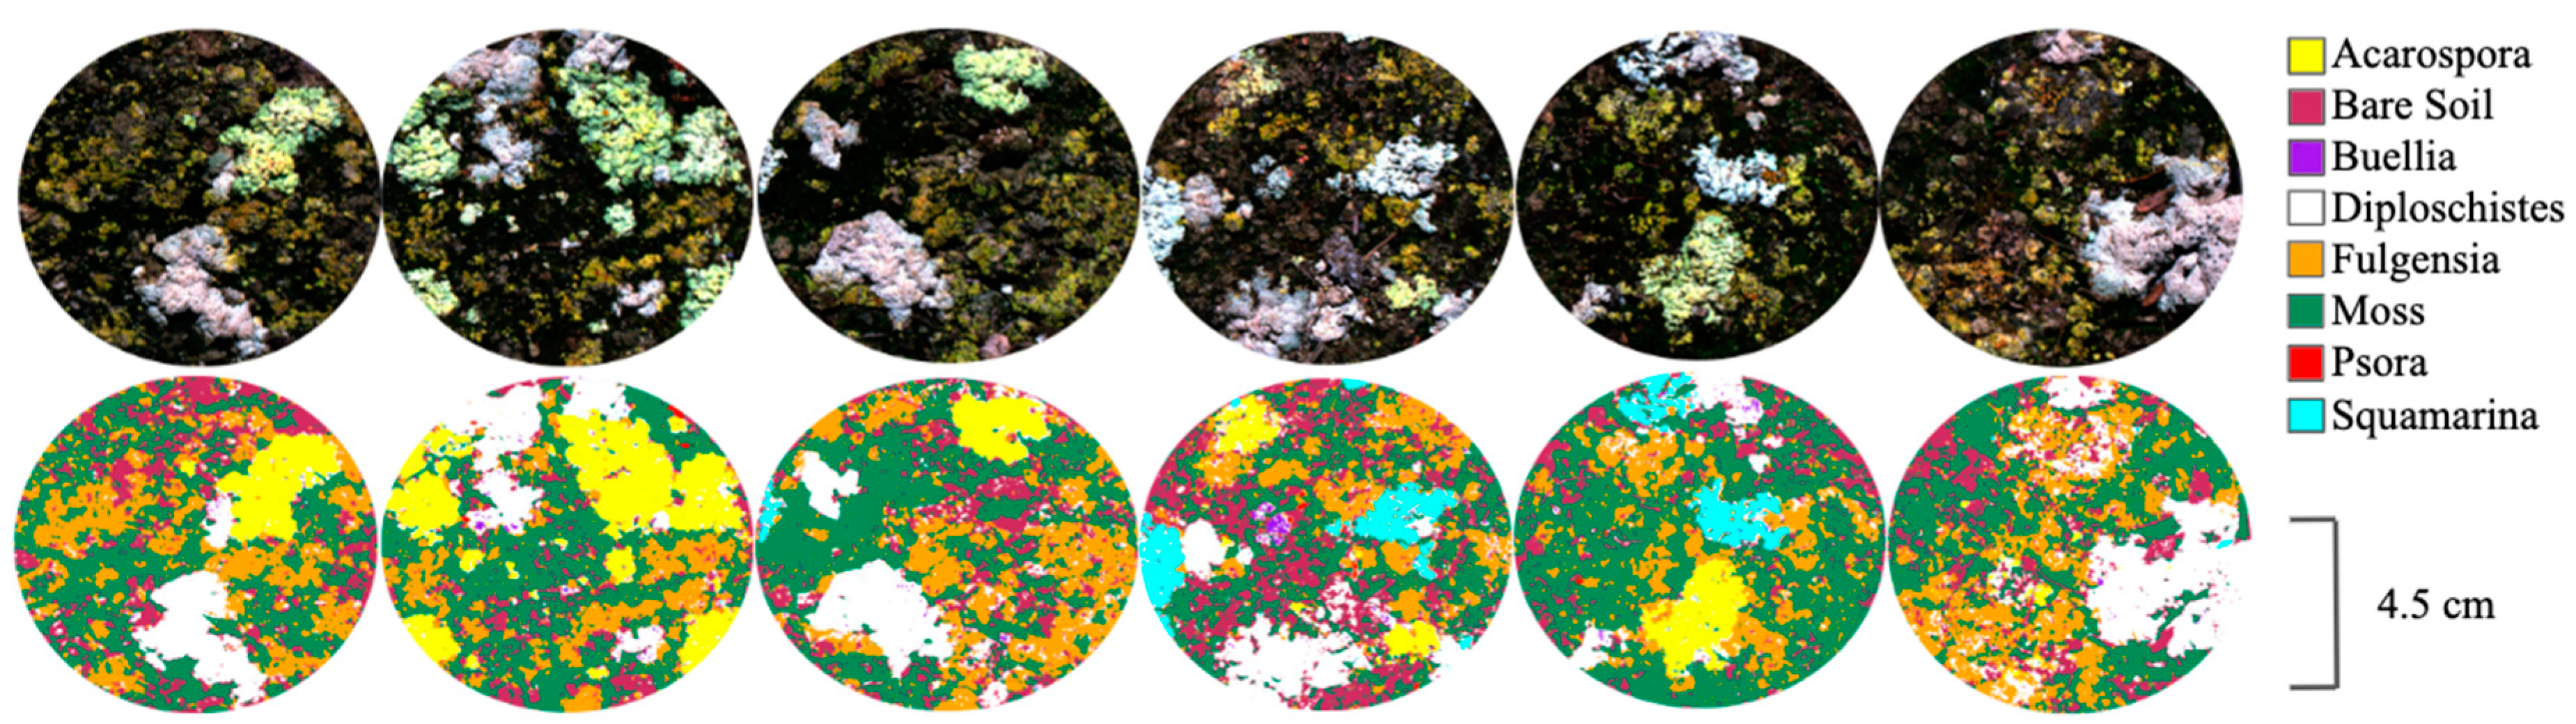
2.3. Images Processing and Classification

Both sets of images were pre-processed and classified to characterize the composition of each sample. First, the parts in the images not belonging to the samples were masked and the reflectance was computed between 420 and 900 nm. To reduce the noise in the measured signal, a Savitzky-Golay smoothing filter [46] was applied using a 20 band-window width. A minimum noise fraction (MNF) transformation was applied to the smoothed reflectances to synthesize the main information in a reduced number of MNF components as well as to remove the residual noise in the data. The first 15 MNF components of each image transformation were used as input of the classification algorithm.
The training set for the classification was created by selecting pure endmembers of each classes by visual-identification on the images of the samples. The following classes were considered in the classification process: Acarospora (Acarospora spp.), Buellia (Buellia spp.), Diploschistes (Diploschistes spp.), Fulgensia (Fulgensia spp.), Psora (Psora spp.), Squamarina (Squamarina spp.), Moss and Bare Soil. Biocrust classification was performed with a supervised machine learning method, using a total of around 1000 pixels per class identified in each image to train the support vector machine (SVM) algorithm.
The SVM is a supervised classification method based on statistical learning theory [47,48]. Using training samples from the classes of interest, it separates them by a decision surface, called hyperplane, that maximizes the margin between them. The closest training samples to the hyperplane are the ones used by the algorithm, called support vectors. SVM is a binary classifier in its simplest form, but can also act as a multiclass classifier by creating a binary classifier for each possible pair of classes. SVM uses a penalty parameter that allows a certain degree of misclassification. Fine tuning is important to avoid overfitting of the model because increasing its value increases the cost of misclassifying points and forces the creation of a more accurate model, which might be not generalizable. We used a radial basis kernel function, which usually performs well in remote sensing applications [49]. This kernel is controlled by two parameters that determine the final classification accuracy, the penalty parameter (C) and the width of the Gaussian kernel (c). A large C reduces the training dataset error, but may result in model overfitting to the training data, reducing their generalizability. We used the SVM in a pairwise classification way to classify the images and evaluate the best parameters to use for each classification using the LIBVSM library [31,50].

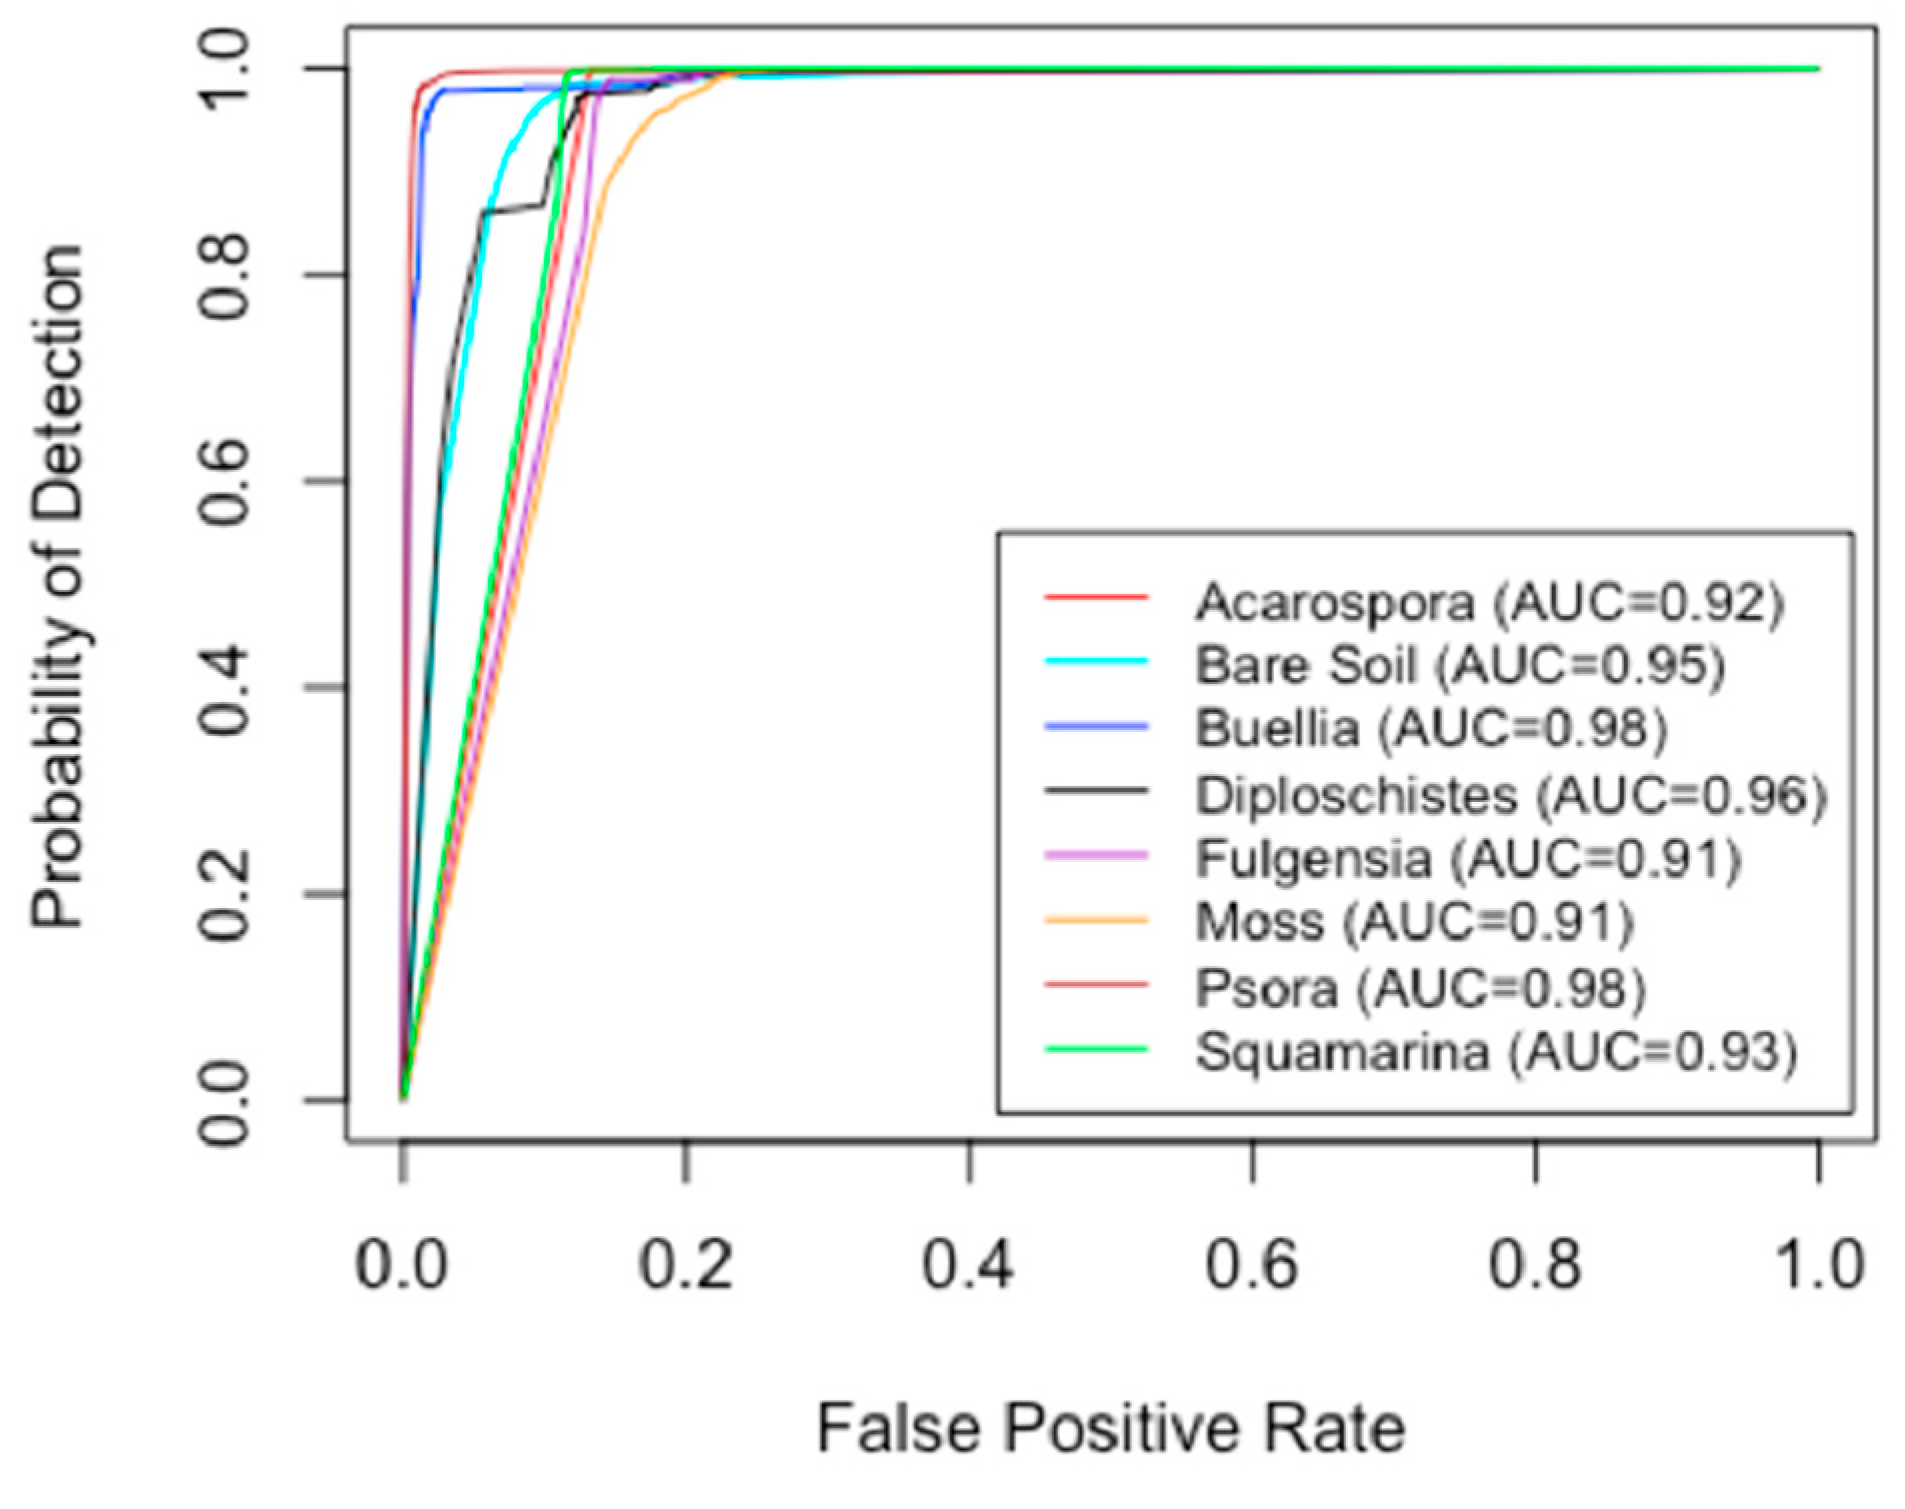
2.4. Validation of Classifications

The validation set for each classification was created selecting 300 pixels per class of pure endmembers by visual-identification. We assessed the accuracy of the classifications using the receiver operating characteristics (ROC) technique [51] and the area under the curve (AUC) [52,53] derived from it. A ROC graph is a two-dimensional depiction of a classifier’s performance [54] and is constructed calculating the sensitivity and specificity of the resulting classification for each possible classification threshold, where
s e n s i t i v i t y = a / a + c
s p e c i f i c i t y = b / b + d ,
with a and d as the true positives and the true negatives for a certain classification, respectively, and b and c as the corresponding false positives and false negatives. The ‘sensitivity’ is the probability that a pixel of a particular class is correctly classified, while the ‘specificity’ is the probability that a pixel not belonging to that class is correctly classified. In this way, the best performing classification would be that with the highest possible value of both sensitivity and specificity. We evaluated the probability of detection (calculated as the sensitivity) against the false positive rate (calculated as 1 – specificity). A ROC graph was calculated for each of the classifications produced (i.e., 18 classifications, six samples each), averaging the curves obtained for each class.
From each ROC graph, we calculated its corresponding area under the curve (AUC), that is an overall quantitative performance score of the classification that allows to reduce the ROC performance to a single scalar value independent of a single prediction threshold [52,54]. The AUC represents the probability that a randomly chosen positive sample is correctly classified with greater suspicion than a randomly chosen negative one [53]. This value might range from 0.5 (a random assignment to the class of interest) to 1 (a perfect classification). The AUC values were calculated by joining the points of the ROC through a composite trapezoid rule using the AUC function from the R package DescTools [55]. To assess classification accuracy, we also evaluated the average accuracy creating a confusion matrix with the average accuracies from the classifications of each set of images (i.e., dry and wet), extracting the overall accuracy and Cohen’s kappa coefficient [56]. The points used to create these matrices were the same used to create the ROC curves.

2.5. Computation of the Spectral Diversity

Using the classifications previously obtained, we calculated, for each biocrust sample, the average spectral reflectance of each lichen genera from the reflectance images. We then calculated the pigment absorption features by the continuum removal method, normalizing the spectra to a common baseline. Several metrics were then calculated as indicators of spectral diversity for each sample: the coefficient of variation (CV; i.e., ratio of the standard deviation to the mean), calculated between 420–900 nm (CV420-900), between 550–750 nm (CV550750), and at 680 nm (CV680), and the standard deviation of the continuum removal (SD_CR), calculated between 550–750 nm (SD_CR550750; i.e., absorption feature related to the presence of chlorophyll) and at 680 nm (SD_CR680; i.e., maximum peak of this absorption feature).

2.6. Biodiversity Metrics

The fractional cover of each lichen class (classified at the genus level) was used to calculate the following α-diversity metrics for each sample: species richness (S), Shannon’s index (H’; [57]), Simpson’s index (D; [58]) and Pielou’s index (J’; [59]). The details of the calculation are reported in Table 1. These metrics were calculated using the ‘vegan’ R package, version 2.4–5 [60].

2.7. Statistical Analysis

To evaluate the spectral diversity metrics that better capture the α-diversity of biocrust-forming lichens, we evaluated through linear regression models the relationships between spectral diversity (calculated as the average CV and CR of the three samples from each plot) and α-diversity metrics (species richness, Shannon’s index, Simpson’s index, and Pielou’s index), calculated using the fractional cover of each plot (the average of three samples). Due to the high heterogeneity of four plots, their samples were not averaged, and the values of the single samples were used in the analysis. Species richness was calculated as the total number of genera observed in the three samples from each plot. Due to the small sample size (n = 26) in this analysis, the cross-validated statistics obtained with the leave-one-out cross-validation procedure were also computed to compare performances of different spectral diversity metrics in predicting α-diversity.

3. Results

3.1. Classifications and Accuracy Evaluation

The classification (Figure 3) of both dry and wet images was highly accurate. The high values of the AUC derived from the ROC curves showed that the SVMs used were successfully trained to classify biocrust-forming lichens (Figure 4).
The classification of the wet dataset had an average AUC of 0.95 (Figure 4), a kappa coefficient of 0.97 and an overall accuracy of 97.83% (Table 2). The lowest accuracies were achieved classifying Moss and Fulgensia, with AUCs of 0.91 and 0.92, respectively. The most accurate results were obtained for Buellia and Psora, with AUCs values of 0.99 and 0.98, respectively. Bare soil was the most confused class, mostly with moss, even though it was better classified than in the dry set of images, where it presented an AUC of 0.82. The dry set was less accurate, presenting an average AUC of 0.93, an average kappa coefficient of 0.95 and an overall accuracy of 95.69%. All the lichens were accurately classified, with values of AUC over 0.95, similar to those obtained from the wet set. Moss presented the lowest accuracy, with an AUC of 0.75, and was the most misclassified, being confused mostly with bare soil.

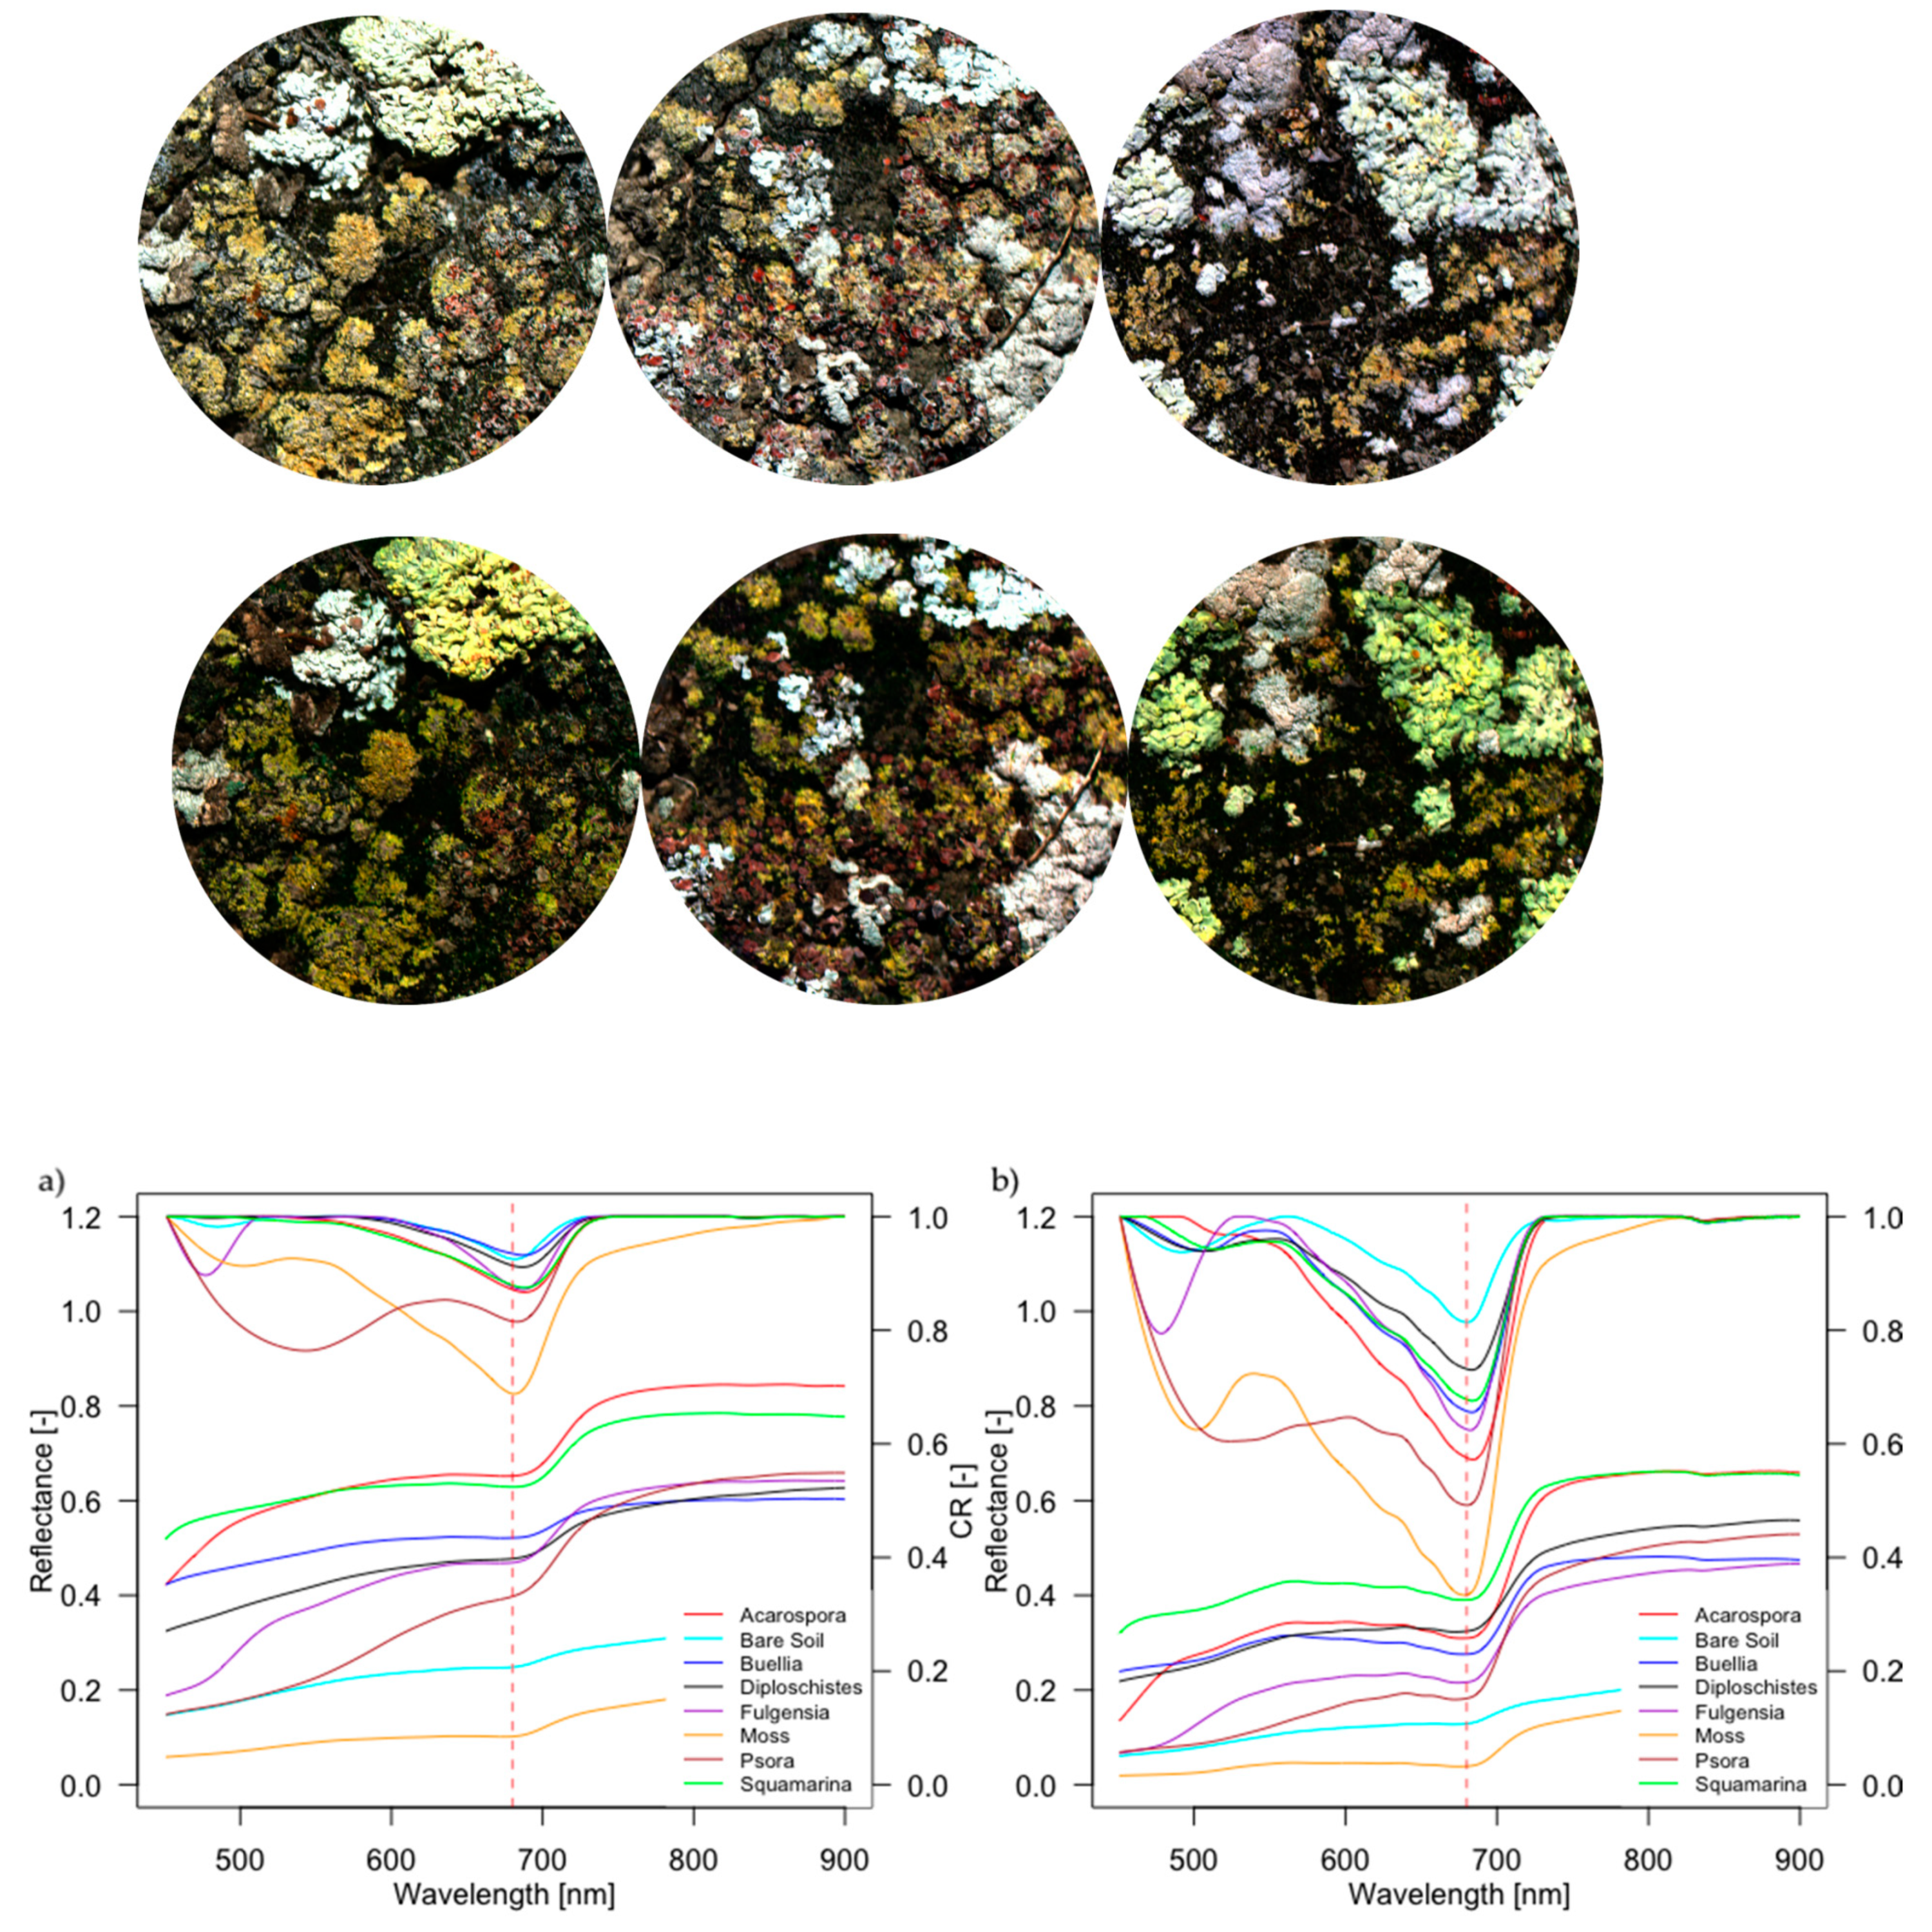
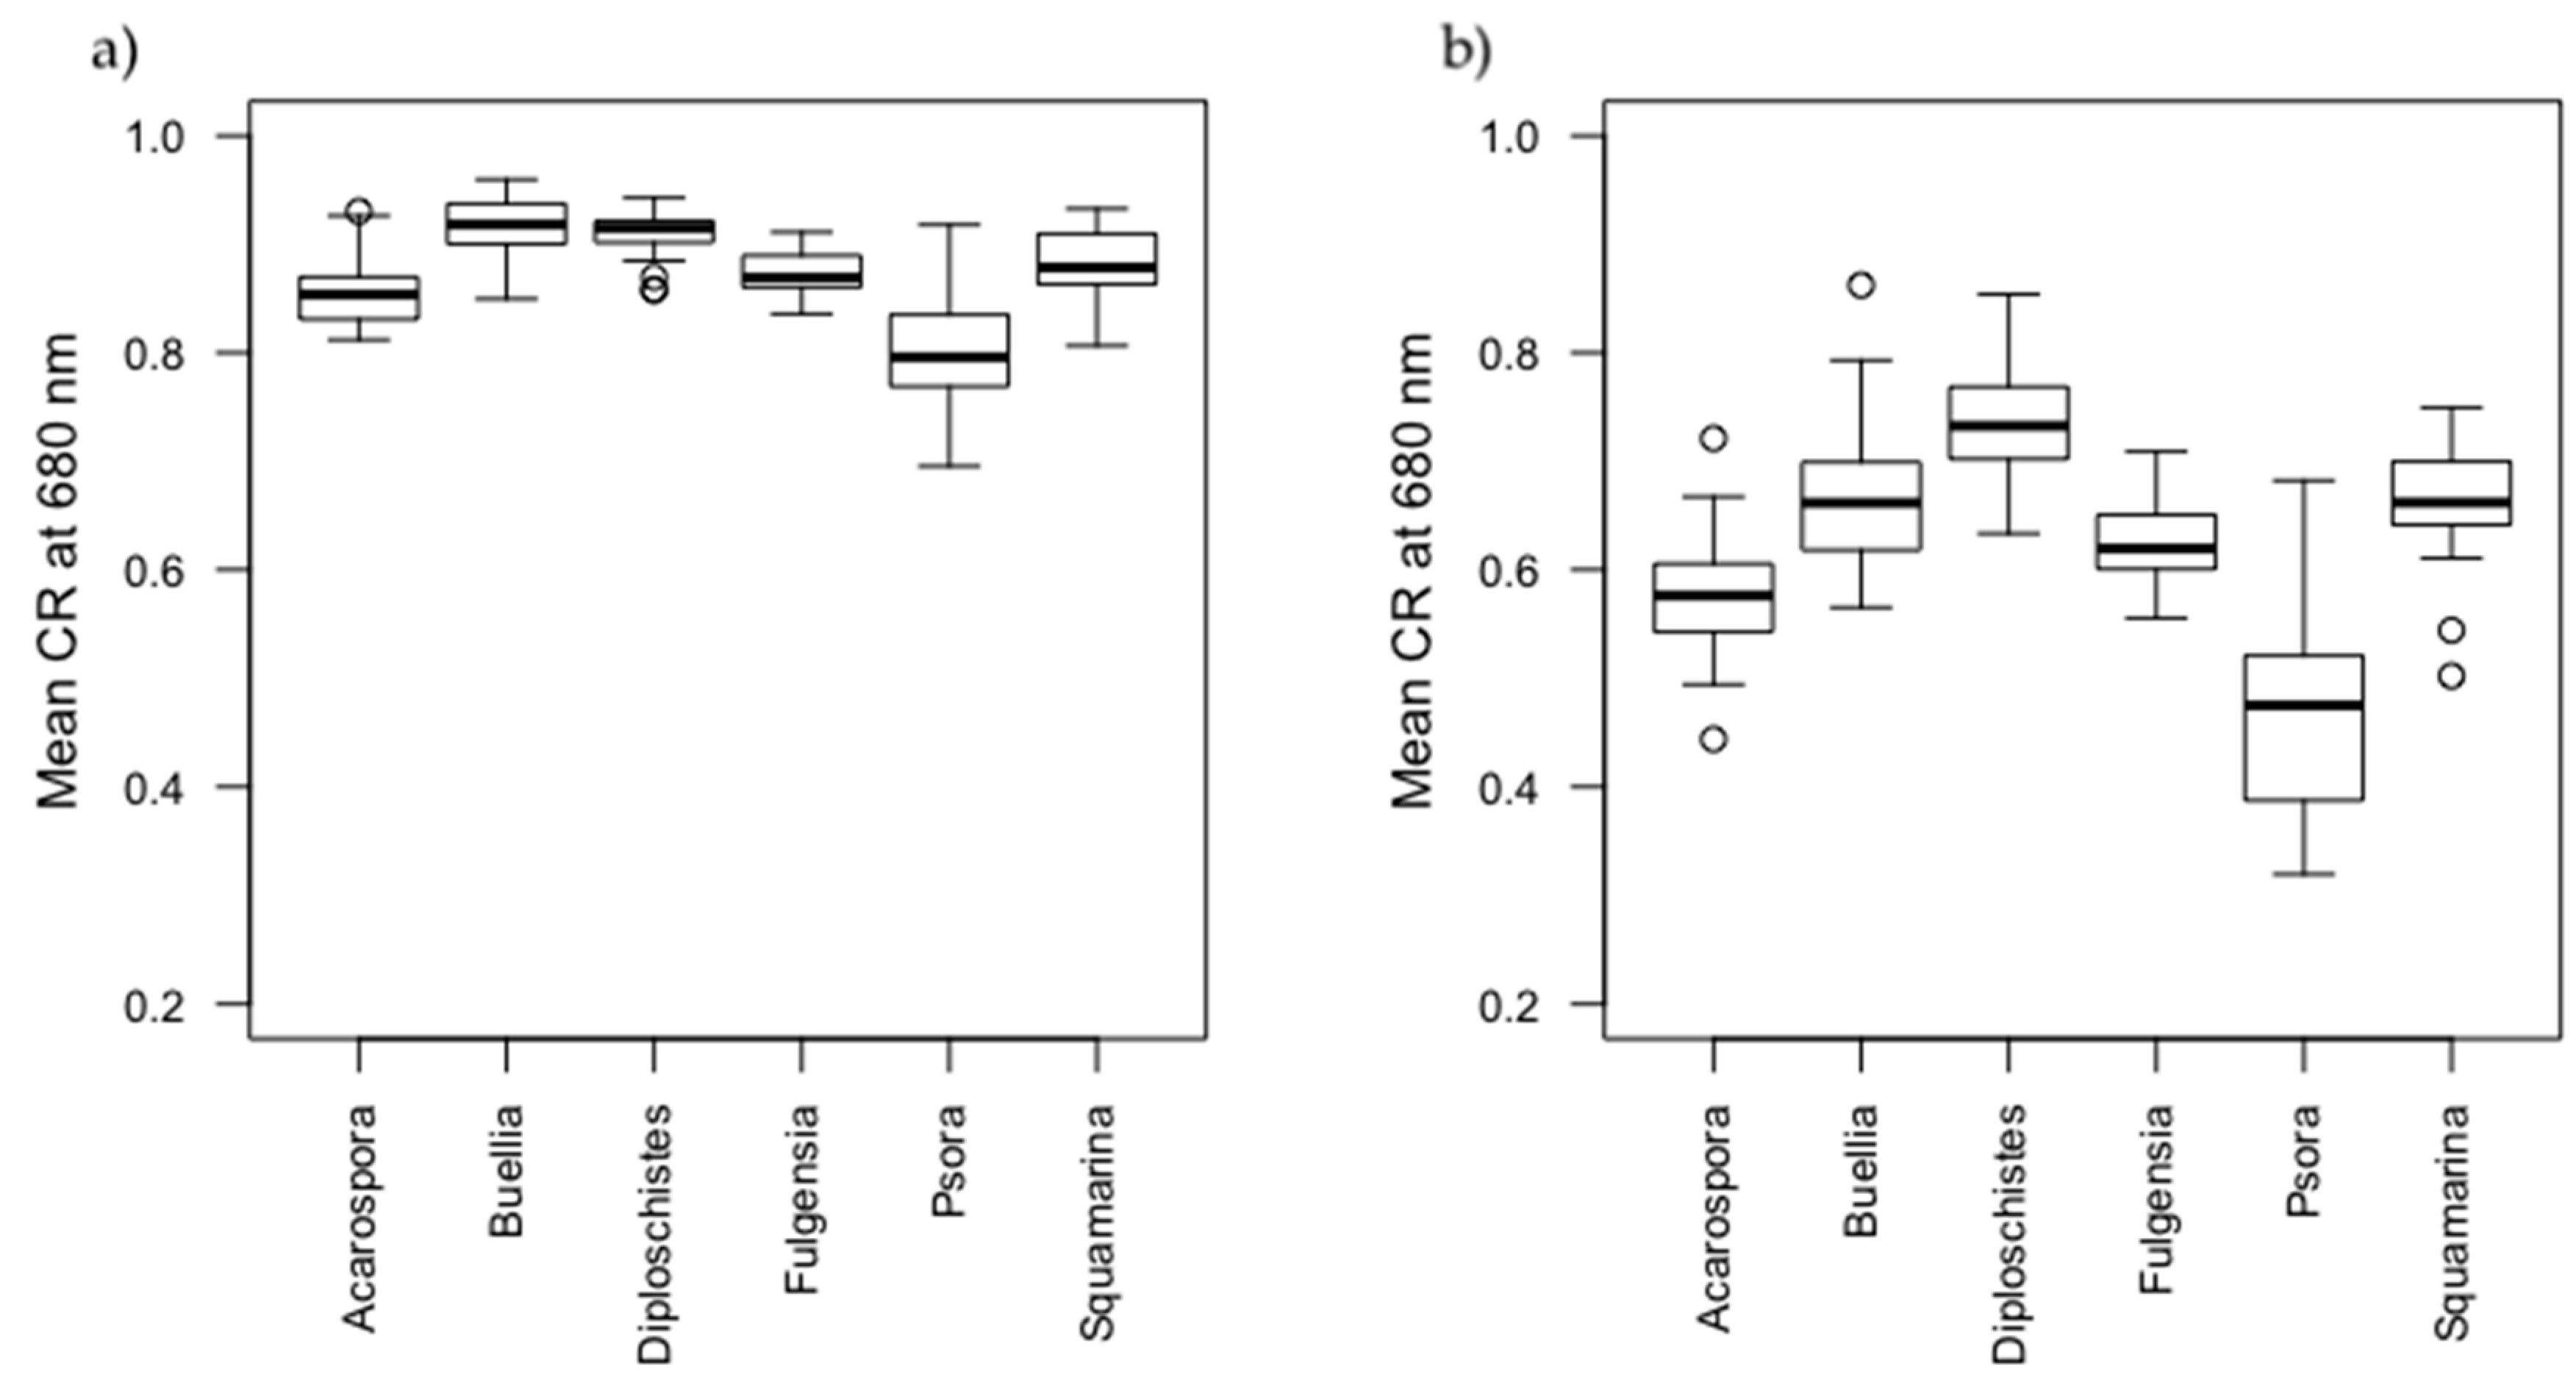
3.2. Spectral Characterization of Biocrusts

Dry biocrusts had increasing reflectances from the blue region until 700 nm. In the visible region the reflectances of various biocrust classes differ because of different pigment content and composition (Figure 5) differences in the NIR region are mainly related to the biocrust tridimensional structure. Lichens presented higher reflectances than bare soil and moss across the whole spectrum. Their higher reflectance in the NIR region is related to their more developed structure, which causes multi-scattering of light in this region. Acarospora, Squamarina, Buellia, and Diploschistes are light-colored lichens that showed higher reflectances in the visible region; Psora presented the lowest reflectance among lichens. Mosses had the lowest reflectance due to their darker color and less developed structure, resulting in a reduction of light scattering. The application of the continuum removal algorithm in the spectral range 450–900 nm highlighted the absorption features caused by different pigments. The chlorophyll absorption feature at 680 nm was present in all the classes. Bare soil showed a weak absorption feature at 680 nm, evidencing the presence of cyanobacteria colonizing the soils interspace within lichens and moss patches. Psora showed an absorption feature around 550 nm due to phycoerythrin, which is absent in the other lichens. An absorption feature at 500 nm related to the presence of carotenoids was observed in mosses. Fulgensia presented an absorption peak around 490 nm due to the presence of carotenoids or phycoerythrin.
Watering had a strong effect on biocrust optical properties (Figure 5b), causing a decrease of reflectance across the whole spectrum. The change was particularly evident in the absorption feature caused by chlorophyll at ~680nm, which became deeper, evidencing the abrupt change in the reflectance from red to NIR, typical of vegetation (i.e., red edge region). The continuum removal algorithm allowed to enhance this absorption feature at ~680 nm related to the activation of chlorophyll after watering, increasing its variation (Figure 6).

3.3. Fractional Cover of Biocrusts and Diversity Metrics

The most abundant classes were moss and bare soil, covering more than 76% and 46% of the surface in some samples, respectively (Table 3). The most abundant lichen was Diploschistes, while the least were Psora and Buellia, which appeared scarcely. Species richness ranged from 2 to 6. Shannon’s index ranged from 0.18 to 1.53, with a mean value of 1.03, and Simpson’s index from 0.08 to 0.77, with a mean of 0.56. Pielou’s index ranged from 0.14 to 0.95, with a mean value of 0.66.

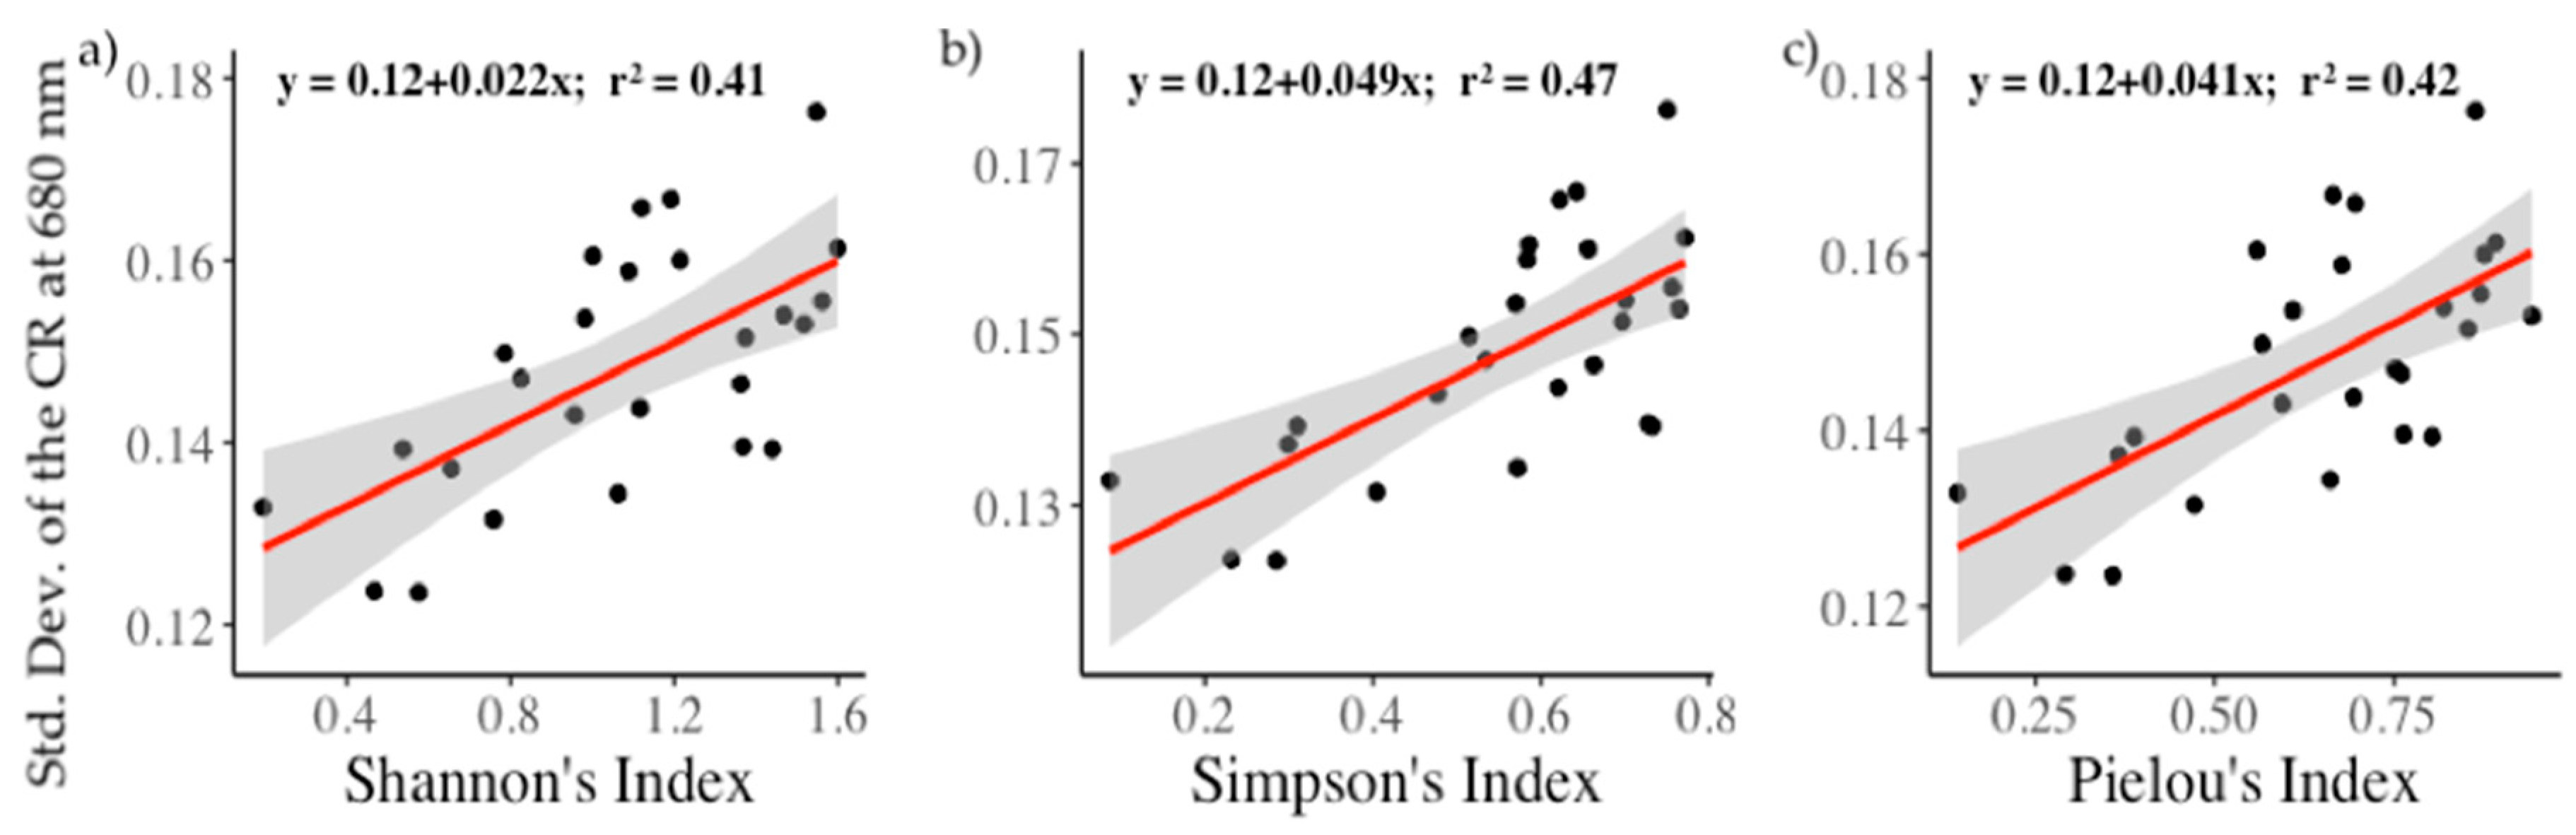
3.4. Relationships between Biodiversity and Spectral Diversity

The correlation analysis between spectral diversity (CV and SD_CR) and α-diversity metrics (i.e., species richness, Shannon’s Index, Simpson’s Index, and Pielou’s Index) showed that there were no significant correlations with the dry samples (results not shown). Conversely, positive and statistically significant relationships were found when the samples were wet (Table 4).
When the spectral diversity was calculated as SD_CR550-750 and SD_CR680, the relationships with α-diversity were positive and strongly significant for all the diversity metrics (Table 4). The standard deviation of the CR at 680 nm (SD_CR680), which is related to the difference in chlorophyll content, was the spectral diversity metric better related to α-diversity metrics. Neither the SD_CR nor the CV captured the species richness. The Simpson’s index was positively correlated to the CV at all the spectral ranges analyzed (420–900, 550–750, and 680 nm), especially at 680 nm. While Simpson’s and Pielou’s indices were the metrics that correlated best with SD_CR680 (r2 = 0.47 and r2 = 0.42, respectively; Table 4, Figure 7), they did not show any significant correlation with CV420–900 or CV550–750. The statistics in cross-validation (Table 5) of the linear regressions presented similar values to the original analysis, showing the stability of the predictions made by the linear regression models between spectral diversity and α-diversity of lichens.

4. Discussion

The high accuracies obtained using SVM to classify hyperspectral imagery reinforce their use to differentiate biocrusts [31]. Differences in the reflectance of biocrust constituents are subtle (Figure 5), but SVMs are capable of differentiating spectrally similar classes when the inputs are spectral signatures [61,62,63]. Even though the accuracy metrics from both sets of images were similar, the classification improved when biocrusts were wet. This result is explained by the enhanced differences that appear in the reflectance spectra when biocrusts are metabolically activated after irrigation [35]. Several studies have characterized the optical properties of biocrust communities in the same optical range used in this study [42]. However, the spatial scale of these studies only allowed characterization of biocrust communities. Conversely, the fine spatial resolution of the imaging system used in this work allowed to characterize for the first time the pure spectral signature of six lichen genera, to compare their characteristics and to capture the spectral diversity among them. In fact, we used a pixel size lower than the size of each object of interest (i.e., thallus of lichens), as suggested by [64,65].
Lichens present different structural and biochemical traits, which create wavelength-dependent variations that can be integrated by spectral diversity, as shown in vascular plants by [66]. Different genera of lichens are characterized by particular biochemical traits that promote spectral variations, so their spectral diversity can be exploited to infer their α-diversity. However, it is important to understand which are the best metrics to represent the relationship between lichen spectral diversity and α-diversity. Since the absorption peak around 680 nm has been widely investigated as a spectral feature of biocrusts and is present in all lichens (e.g., [35,40,67,68,69]), we tested if a spectral diversity metric focused on this feature may be suitable for monitoring changes in their composition. We found that using a spectral diversity metric based on this absorption feature (i.e., the SD_CR680) increases the spectral variability determined by the chlorophyll content of different lichens, while removing the confounding influence of other factors such as the structure of lichens. In fact, some lichen genera are characterized by a strong tridimensional component (e.g., Diploschistes spp., Squamarina spp.) relative to others, which can determine a higher intra-genera variability compared to the inter-genera variability. The normalization of the reflectance spectra to a common baseline through the CR algorithm minimized these structural effects, allowing to capture the spectral variability of lichens determined by the chlorophyll content. Conversely, the CV is influenced by both variations in the content of pigments and the structure of biocrusts, which may hide inter-genera variability. This might be the reason why the CV did not perform as well as expected in previous studies conducted with vascular plants (e.g., [23,24,25]), where the structural component constitutes were the main source of spectral variability. Conversely, the results obtained in this study highlight the dominant role of the chlorophyll content to determine the differences between lichen genera and the importance of using the absorption feature centered at ~680 nm to capture their spectral diversity. Nevertheless, using absorption features that are found in the shortwave infrared region of the spectra of lichens [35] might help to improve the results obtained in this study, that investigated only the visible and near infrared spectral domain.
Among the α-diversity metrics tested, the Simpson’s index correlated the most with the spectral diversity of lichens. The better performance of the Simpson’s index compared to the Shannon’s index is in agreement with recent studies conducted in tropical forests [21] and in a prairie grassland [24]. The latter found similar and weaker relationships between spectral diversity and evenness (calculated as Pielou’s index) as we did here, although they correlated these metrics with the CV instead of the SD_CR. This might be due to the fact that Shannon’s index assumes that all the species are present and randomly sampled [70], and the Simpson’s index is more sensitive to dominant or common species, as noted by [24], making it more suitable when this is the case. The similar relationships obtained in cross-validation show that these results are reliable despite their sample size.
The imagery used in this study captured with high detail the lichen genera present in our samples, allowing to identify positive and significant relationships between the spectral diversity and the α-diversity of lichens. The methodology proposed in this study should be in principle applied to monitor α-diversity of lichens at wider scales, a key task to understand the shifts in the composition that these communities are undergoing in the actual context of global change [9,10,11,12]. However, the upscaling of this methodology may be not trivial due to the decreased spatial and/or spectral resolution when working on wider scales.
Many ecological processes maintain scale-dependent relations [24,71,72,73] and a sampling scale bigger than the object studied might cause a loss of information that is provided at finer spatial resolutions [26]. In order to understand if the relations found in this work hold with decreasing spatial resolution, the spatial sensitivity of the spectral diversity–biodiversity relationship should be investigated. A previous work in a prairie grassland [24] identified a strong scale dependence of the spectral diversity–biodiversity relationships and suggested that the optimal pixel size for distinguishing α-diversity in prairie plots was similar to the size of an individual herbaceous plant (1 mm to 10 cm). This might hamper the monitoring of the α-diversity of lichen-dominated biocrusts at landscape scale with sensors installed on satellite or airborne platforms, which most likely would have a bigger pixel size than the one used in this work.
Conversely, the use of unmanned aerial vehicles (UAVs), which can carry light-weight imaging sensors of different spatial (reaching 2–4 cm/pixel in many cases) and spectral resolutions [74] may allow replicating studies like ours at landscape level [75]. Many of these sensors do not have very high spectral resolution, but have at least one band at ~680 nm [74], which would allow to calculate the SD_CR680 (the spectral diversity metric that presented the highest predictability of lichens’ α-diversity in our study) to monitor α-diversity of lichens at larger spatial scales. Achieving the results shown in this work at landscape scale might also be hampered by the spectral properties that other components (e.g., vascular plants, mosses, bare soil) have on the spectral reflectance measured from remote sensors, which might hinder the separation of the pure spectral component of lichens and to estimate their α-diversity. This issue could be however solved using spectral mixture analysis [76], a technique that models a mixed spectrum as a combination of its spectral components weighted by the correspondent subpixel fractional covers [77] and has already proved to be successful for mapping biocrusts [31].

5. Conclusions

The very high accuracies obtained classifying the hyperspectral images using SVMs showed the reliability of this methodology to identify different biocrust-forming lichens. Therefore, we were able to extract pure spectral signatures of different biocrust constituents and to evaluate the relationships between α-diversity and spectral diversity of lichens. We found that the SD_CR680 nm was the spectral diversity metric that predicted the best the α-diversity metrics that include richness and evenness in their calculations (i.e., Pielou’s and Simpson’s indices). As such, we suggest that this index could help to track spatio-temporal changes in lichen-dominated biocrust communities. In this context, the results of this study will help to improve future works upscaling the methodology here shown to coarser scales in drylands, a key task in any monitoring program aiming to assess the impacts of ongoing climate change and desertification processes in these environments.

Author Contributions

J.B.-S., C.P., G.T., R.G., M.L.d.G., F.T.M., and M.R. designed the field sampling; J.B.-S., C.P., G.T., R.G., M.L.d.G., conducted the field sampling; J.B.-S. and C.P. conducted imaging measurements; J.B.-S. analyzed the data; J.B.-S., C.P., G.T., and M.R. interpreted the results. All authors contributed to the discussion of the results and the final version of the manuscript.

Funding

The research has received funding from the European Union’s Horizon 2020 research and innovation 514 program under the Marie Sklodowska-Curie grant agreement no. 721995. F.T.M. acknowledges support from the European Research Council grant agreement no. 647038 (BIODESERT).

Acknowledgments

We thank Roberto Garzonio and Khelvi Biriukova for their help during the hyperspectral images acquisition, and Biagio Di Mauro for his comments during the early stages of this manuscript. We are also grateful to the three reviewers for their comments and suggestions, which improved this manuscript.

Conflicts of Interest

The authors declare no conflict of interest.

References

  1. Belnap, J.; Lange, O.L. Biological Soil Crusts: Structure, Function, and Management; Springer Science & Business Media: Berlin, Germany, 2003; p. 150. [Google Scholar]
  2. Weber, B.; Büdel, B.; Belnap, J. Biological Soil Crusts: An Organizing Principle in Drylands, 1st ed.; Weber, B., Büdel, B., Belnap, J., Eds.; Ecological Studies; Springer: Berlin, Germany, 2016; Volume 226. [Google Scholar]
  3. Rodríguez-Caballero, E.; Castro, A.J.; Chamizo, S.; Quintas-Soriano, C.; Garcia-Llorente, M.; Cantón, Y.; Weber, B. Ecosystem services provided by biocrusts: From ecosystem functions to social values. J. Arid Environ. 2018, 159, 45–53. [Google Scholar] [CrossRef]
  4. Bowker, M.A.; Mau, R.L.; Maestre, F.T.; Escolar, C.; Castillo-Monroy, A.P. Functional profiles reveal unique roles of various biological soil crust organisms in Spain. Funct. Ecol. 2011, 25, 787–795. [Google Scholar] [CrossRef]
  5. Bowker, M.A.; Maestre, F.T.; Mau, R.L. Diversity and patch-size distributions of biological soil crusts regulate dryland ecosystem multifunctionality. Ecosystems 2013, 16, 923–933. [Google Scholar] [CrossRef]
  6. Bowker, M.A.; Maestre, F.T.; Escolar, C. Biological crusts as a model system for examining the biodiversity-ecosystem function relationship in soils. Soil Biol. Biochem. 2010, 42, 405–417. [Google Scholar] [CrossRef]
  7. Tongway, D.J.; Hindley, N. Landscape Function Analysis: Procedures for Monitoring and Assessing Landscapes; CSIRO Publishing: Brisbane, Australia, 2004; p. 82. [Google Scholar]
  8. Reed, S.C.; Maestre, F.T.; Ochoa-Hueso, R.; Kuske, C.R.; Darrouzet-Nardi, A.; Oliver, M.; Darby, B.; Sancho, L.G.; Sinsabaugh, R.L.; Belnaup, J. Biocrusts in the Context of Global Change. In Biological Soil Crust: An Organizing Principle in Drylands, 1st ed.; Weber, B., Büdel, B., Belnap, J., Eds.; Ecological Studies; Springer: Berlin, Germany, 2016; Volume 226, pp. 451–476. [Google Scholar]
  9. Rodríguez-Caballero, E.; Belnap, J.; Büdel, B.; Crutzen, P.J.; Andreae, M.O.; Pöschl, U.; Weber, B. Dryland photoautotrophic soil surface communities endangered by global change. Nat. Geosci. 2018, 11, 185–189. [Google Scholar] [CrossRef]
  10. Ferrenber, S.; Reed, S.C.; Belnap, J. Climate change and physical disturbance cause similar community shifts in biological soil crusts. Proc. Natl Acad. Sci. USA 2015, 112, 12116–12121. [Google Scholar] [CrossRef] [Green Version]
  11. Maestre, F.T.; Escolar, C.; Bardgett, R.D.; Dungait, J.A.J.; Gozalo, B.; Ochoa, V. Warming reduces the cover and diversity of biocrust-forming mosses and lichens, and increases the physiological stress of soil microbial communities in a semi-arid Pinus halepensis plantation. Front. Microbiol. 2015, 6, 865. [Google Scholar] [CrossRef] [Green Version]
  12. Ladrón de Guevara, M.; Gozalo, B.; Raggio, J.; Lafuente, A.; Prieto, M.; Maestre, F.T. Warming reduces the cover, richness and evenness of lichen-dominated biocrusts but promotes moss growth: Insights from an 8 yr experiment. New Phytol. 2018, 220, 811–823. [Google Scholar] [CrossRef] [Green Version]
  13. Bowker, M.A.; Eldridge, D.J.; Val, J.; Soliveres, S. Hydrology in a patterned landscape is co-engineered by soil-disturbing animals and biological crusts. Soil Biol. Biochem. 2013, 61, 14–22. [Google Scholar] [CrossRef]
  14. Delgado-Baquerizo, M.; Maestre, F.T.; Reich, P.B.; Jeffries, T.C.; Gaitán, J.J.; Encinar, D.; Berdugo, M.; Campbell, C.D.; Singh, B.K. Microbial diversity drives multifunctionality in terrestrial ecosystems. Nat. Commun. 2016, 7, 10541. [Google Scholar] [CrossRef] [Green Version]
  15. Nagendra, H. Using remote sensing to assess biodiversity. Int. J. Remote Sens. 2001, 22, 2377–2400. [Google Scholar] [CrossRef]
  16. Turner, W.; Spector, S.; Gardiner, N.; Fladeland, M.; Sterling, E.; Steininger, M. Remote sensing for biodiversity science and conservation. Trends Ecol. Evol. 2003, 18, 306–314. [Google Scholar] [CrossRef]
  17. Pettorelli, N.; Safi, K.; Turner, W.; Pettorelli, N. Satellite remote sensing, biodiversity research and conservation of the future. Philos. Trans. R. Soc. B 2014, 369, 20130190. [Google Scholar] [CrossRef] [PubMed]
  18. Rocchini, D.; Boyd, D.S.; Féret, J.B.; Foody, G.M.; He, K.S.; Lausch, A.; Nagendra, H.; Wegmann, M.; Pettorelli, N. Satellite remote sensing to monitor species diversity: Potential and pitfalls. Remote Sens. Ecol. Conserv. 2015, 2, 25–36. [Google Scholar] [CrossRef]
  19. Gillespie, T.W.; Foody, G.M.; Rocchini, D.; Giorgi, A.P.; Saatchi, S. Measuring and modelling biodiversity from space. Prog. Phys. Geogr. 2008, 32, 203–221. [Google Scholar] [CrossRef]
  20. Palmer, M.W.; Earls, P.; Hoagland, B.W.; White, P.S.; Wohlgemuth, T. Quantitative tools for perfecting species lists. Environmetrics 2002, 13, 121–137. [Google Scholar] [CrossRef]
  21. Schäfer, E.; Heiskanen, J.; Heikinheimo, V.; Pellikka, P. Mapping tree species diversity of a tropical montane forest by unsupervised clustering of airborne imaging spectroscopy data. Ecol. Indic. 2016, 64, 49–58. [Google Scholar] [CrossRef]
  22. Wang, R.; Gamon, J.A.; Emmerton, C.A.; Li, H.; Nestola, E.; Pastorello, G.Z.; Menzer, O. Integrated analysis of productivity and biodiversity in a southern Alberta prairie. Remote Sens. 2016, 8, 214. [Google Scholar] [CrossRef] [Green Version]
  23. Aneece, I.P.; Epstein, H.; Lerdau, M. Correlating species and spectral diversities using hyperspectral remote sensing in early-successional fields. Ecol. Evol. 2017, 7, 3475–3488. [Google Scholar] [CrossRef] [Green Version]
  24. Wang, R.; Gamon, J.A.; Cavender-Bares, J.; Townsend, P.A.; Zygielbaum, A.I. The spatial sensitivity of the spectral diversity-biodiversity relationship: An experimental test in a prairie grassland. Ecol. Appl. 2018, 28, 541–556. [Google Scholar] [CrossRef] [Green Version]
  25. Wang, R.; Gamon, J.A.; Schweiger, A.K.; Cavender-Bares, J.; Townsend, P.A.; Zygielbaum, A.I.; Kothari, S. Influence of species richness, evenness, and composition on optical diversity: A simulation study. Remote Sens. Environ. 2018, 211, 218–228. [Google Scholar] [CrossRef]
  26. Rocchini, D.; Balkenhol, N.; Carter, G.A.; Foody, G.M.; Gillespie, T.W.; He, K.S.; Kark, S.; Levin, N.; Lucas, K.; Luoto, M.; et al. Remotely sensed spectral heterogeneity as a proxy of species diversity: Recent advances and open challenges. Ecol. Inform. 2010, 5, 318–329. [Google Scholar] [CrossRef]
  27. Gholizadeh, H.; Gamon, J.A.; Zygielbaum, A.I.; Wang, R.; Schweiger, A.K.; Cavender-Bares, J. Remote sensing of biodiversity: Soil correction and data dimension reduction methods improve assessment of α-diversity (species richness) in prairie ecosystems. Remote Sens. Environ. 2018, 206, 240–253. [Google Scholar] [CrossRef]
  28. Karnieli, A. Development and implementation of spectral crust index over dune sands. Int. J. Remote Sens. 1997, 18, 1207–1220. [Google Scholar] [CrossRef]
  29. Chen, J.; Yuan Zhang, M.; Wang, L.; Shimazaki, H.; Tamura, M. A new index for mapping lichen-dominated biological soil crusts in desert areas. Remote Sens. Environ. 2005, 96, 165–175. [Google Scholar] [CrossRef]
  30. Weber, B.; Olehowski, C.; Knerr, T.; Hill, J.; Deutschewitz, K.; Wessels, D.C.J.; Eitel, B.; Büdel, B. A new approach for mapping of Biological Soil Crusts in semidesert areas with hyperspectral imagery. Remote Sens. Environ. 2008, 112, 2187–2201. [Google Scholar] [CrossRef]
  31. Rodríguez-Caballero, E.; Escribano, P.; Cantón, Y. Advanced image processing methods as a tool to map and quantify different types of biological soil crust. ISPRS J. Photogramm. Remote Sens. 2014, 90, 59–67. [Google Scholar] [CrossRef]
  32. Rozenstein, O.; Karnieli, A. Identification and characterization of Biological Soil Crusts in a sand dune desert environment across Israel–Egypt border using LWIR emittance spectroscopy. J. Arid Environ. 2015, 112, 75–86. [Google Scholar] [CrossRef]
  33. Panigada, C.; Tagliabue, G.; Zaady, E.; Rozenstein, O.; Garzonio, R.; Di Mauro, B.; De Amicis, M.; Colombo, R.; Cogliati, S.; Miglietta, F.; et al. A new approach for biocrust and vegetation monitoring in drylands using multi-temporal Sentinel-2 images. Prog. Phys. Geogr. 2019. [Google Scholar] [CrossRef]
  34. Waser, L.T.; Kuechler, M.; Schwarz, M.; Ivits, E.; Stofer, S.; Scheidegger, C. Prediction of lichen diversity in an UNESCO biosphere reserve—Correlation of high resolution remote sensing data with field samples. Environ. Model. Assess. 2007, 12, 315–328. [Google Scholar] [CrossRef]
  35. Weber, B.; Hill, J. Remote Sensing of Biological Soil Crusts at Different Scales. In Biological Soil Crust: An Organizing Principle in Drylands, 1st ed.; Weber, B., Büdel, B., Belnap, J., Eds.; Ecological Studies; Springer: Berlin, Germany, 2016; Volume 226, pp. 215–234. [Google Scholar]
  36. Ustin, S.L.; Valko, P.G.; Kefauver, S.C.; Santos, M.J.; Zimpfer, J.F.; Smith, S.D. Remote sensing of biological soil crust under simulated climate change manipulations in the Mojave Desert. Remote Sens. Environ. 2009, 113, 317–328. [Google Scholar] [CrossRef]
  37. Weksler, S.; Rozenstein, O.; Ben-Dor, E. Mapping Surface Quartz Content in Sand Dunes Covered by Biological Soil Crusts Using Airborne Hyperspectral Images in the Longwave Infrared Region. Minerals 2018, 8, 318. [Google Scholar] [CrossRef] [Green Version]
  38. Rodríguez-Caballero, E.; Paul, M.; Tamm, A.; Caesar, J.; Büdel, B.; Escribano, P.; Hill, J.; Weber, B. Biomass assessment of microbial surface communities by means of hyperspectral remote sensing data. Sci. Total Environ. 2017, 586, 1287–1297. [Google Scholar] [CrossRef] [PubMed]
  39. Lehnert, L.; Jung, P.; Obermeier, W.; Büdel, B.; Bendix, J. Estimating Net Photosynthesis of Biological Soil Crusts in the Atacama Using Hyperspectral Remote Sensing. Remote Sens. 2018, 10, 891. [Google Scholar] [CrossRef] [Green Version]
  40. Román, J.R.; Rodríguez-Caballero, E.; Rodríguez-Lozano, B.; Roncero-Ramos, B.; Chamizo, S.; Águila-Carricondo, P.; Cantón, Y. Spectral Response Analysis: An Indirect and Non-Destructive Methodology for the Chlorophyll Quantification of Biocrusts. Remote Sens. 2019, 11, 1350. [Google Scholar] [CrossRef] [Green Version]
  41. Clark, R.N.; Roush, T.L. Reflectance spectroscopy. Quantitative analysis techniques for remote sensing applications. J. Geophys. Res. 1984, 89, 6329–6340. [Google Scholar] [CrossRef]
  42. Rees, W.G.; Tutubalina, O.V.; Golubeva, E.I. Reflectance spectra of subarctic lichens between 400 and 2400 nm. Remote Sens. Environ. 2004, 90, 281–292. [Google Scholar] [CrossRef]
  43. Cano-Díaz, C.; Mateo, P.; Muñoz, M.A.; Maestre, F.T. Diversity of biocrust- forming cyanobacteria in a semiarid gypsiferous site from central Spain. J. Arid Environ. 2018, 151, 83–89. [Google Scholar] [CrossRef]
  44. Maestre, F.T.; Escolar, C.; Ladrón de Guevara, M.; Quero, J.L.; Lázaro, R.; Delgado-Baquerizo, M.; Ochoa, V.; Bergudo, M.; Gozalo, B.; Gallardo, A. Changes in biocrust cover drive carbon cycle responses to climate change in drylands. Glob. Chang. Biol. 2013, 19, 3835–3847. [Google Scholar] [CrossRef]
  45. Garzonio, R.; Di Mauro, B.; Cogliati, S.; Rossini, M.; Panigada, C.; Delmonte, B.; Maggi, V.; Colombo, R. A novel hyperspectral system for high resolution imaging of ice cores: Application to light-absorbing impurities and ice structure. Cold Reg. Sci. Technol. 2018, 155, 47–57. [Google Scholar] [CrossRef]
  46. Savitzky, A.; Golay, M.J.E. Smoothing and differentiation of data by simplified least squares procedures. Anal. Chem. 1964, 36, 1627–1639. [Google Scholar] [CrossRef]
  47. Cortes, C.; Vapnik, V. Support-Vector Networks. Mach. Learn. 1995, 297, 273–297. [Google Scholar] [CrossRef]
  48. Vapnik, B.V. Universal Learning Technology: Support Vector Machines. J. Adv. Technol. 2005, 2, 137–144. [Google Scholar]
  49. Foody, G.M.; Mathur, A.; Sanchez-Hernandez, C.; Boyd, D.S. Training set size requirements for the classification of a specific class. Remote Sens. Environ. 2006, 104, 1–14. [Google Scholar] [CrossRef]
  50. Chang, C.; Lin, C. LIBSVM: A library for support vector machines. ACM Trans. Intell. Syst. Technol. 2011, 2. [Google Scholar] [CrossRef]
  51. DeLeo, J.M. Receiver operating characteristic laboratory (ROCLAB): Software for developing decision strategies that account for uncertainty. In Proceedings of the 1993 (2nd) International Symposium on Uncertainty Modeling and Analysis, College Park, MD, USA, 25–28 April 1993; IEEE. Computer Society Press: College Park, MD, USA, 1993; pp. 318–325. [Google Scholar]
  52. Bradlye, A.P. The use of the area under the ROC curve in the evaluation of machine learning algorithms. Pattern Recognit. 1997, 30, 1145–1159. [Google Scholar] [CrossRef] [Green Version]
  53. Hanley, J.A.; McNeil, B.J. The meaning and use of the area under a receiver operating characteristic (ROC) curve. Radiology 1982, 143, 29–36. [Google Scholar] [CrossRef] [Green Version]
  54. Fawcett, T. An Introduction to ROC Analysis. Pattern Recognit. Lett. 2006, 27, 861–874. [Google Scholar] [CrossRef]
  55. Signorell, A.; Aho, K.; Alfons, A.; Anderegg, N.; Aragon, T.; Arppe, A.; Baddeley, A.; Barton, K.; Bolker, B.; Borchers, H.W.; et al. DescTools: Descriptive Tools Analysis. R Package Version 3.6.1 (R Foundation for Statistical Computing, Vienna). Available online: https://cran.r-project.org/web/packages/DescTools/index.html (accessed on 16 May 2019).
  56. Congalton, R.G.; Green, K. Assessing the Accuracy of Remotely Sensed Data: Principles and Practices, 2nd ed.; CRC Press, Taylor and Francis Group: London, UK, 2008. [Google Scholar]
  57. Shannon, C.E. A mathematical theory of communication. Bell Syst. Tech. J. 1948, 27, 379–423. [Google Scholar] [CrossRef] [Green Version]
  58. Simpson, E.H. Measurement of diversity. Nature 1949, 163, 688. [Google Scholar] [CrossRef]
  59. Pielou, E.C. The measurement of diversity in different types of biological collections. J. Theor. Biol. 1966, 13, 131–144. [Google Scholar] [CrossRef]
  60. Oksanen, J.; Blanchet, F.G.; Kindt, R.; Legendre, P.; O’Hara, R.B.; Simpson, G.L.; Solymos, P.; Stevens, M.H.H.; Wagner, H. Vegan: Community Ecology Package. R Package Version 2.4-5 (R Foundation for Statistical Computing, Vienna). 2017. Available online: https://CRAN. R-project.org/package=vegan (accessed on 15 June 2019).
  61. Gualtieri, J.A.; Cromp, R.F. Support vector machines for hyperspectral remote sensing classification. Proc. SPIE 1998, 3584, 221–232. [Google Scholar]
  62. Watanachaturaporn, P.; Arora, M.K.; Varshney, P.K. Hyperspectral image classification using support vector machines: A comparison with decision tree and neural network classifiers. In Proceedings of the American Society for Photogrammetry & Remote Sensing (ASPRS) 2005 Annual Conference, Reno, NV, USA, 7–11 March 2005. [Google Scholar]
  63. Plaza, A.; Benediktsson, J.A.; Boardman, J.W.; Brazile, J.; Bruzzone, L.; Camps-Valls, G.; Chanussot, J.; Fauvel, M.; Gamba, P.; Gualtieri, A.; et al. Recent advances in techniques for hyperspectral image processing. Remote Sens. Environ. 2009, 113, 110–122. [Google Scholar] [CrossRef]
  64. Ricotta, C.; Avena, G.C.; Volpe, F. The influence of principal component analysis on the spatial structure of a multispectral dataset. Int. J. Remote Sens. 1999, 20, 3367–3376. [Google Scholar]
  65. Stickler, C.M.; Southworth, J. Application of a multi-scale spatial and spectral analysis to predict primate occurrence and habitat associations in Kibale National Park, Uganda. Remote Sens. Environ. 2008, 112, 2170–2186. [Google Scholar] [CrossRef]
  66. Schweiger, A.K.; Cavender-Bares, J.; Townsend, P.A.; Hobbie, S.E.; Madritch, M.D.; Wang, R.; Tilman, D.; Gamon, J.A. Plant spectral diversity integrates functional and phylogenetic components of biodiversity and predicts ecosystem function. Nat. Ecol. Evol. 2018, 2, 976–982. [Google Scholar] [CrossRef]
  67. O’Neill, A.L. Reflectance spectra of microphytic soil crusts in semiarid Australia. Int. J. Remote Sens. 1994, 15, 675–681. [Google Scholar] [CrossRef]
  68. Karnieli, A.; Sarafis, V. Reflectance spectrophotometry of cyanobacteria within soil crusts—A diagnostic tool. Int. J. Remote Sens. 1996, 17, 1609–1614. [Google Scholar] [CrossRef]
  69. Chamizo, S.; Stevens, A.; Cantón, Y.; Miralles, I.; Domingo, F.; Van Wesemael, B. Discriminating soil crust type, development stage and degree of disturbance in semiarid environments from their spectral characteristics. Eur. J. Soil Sci. 2012, 63, 42–53. [Google Scholar] [CrossRef]
  70. Peet, R.K. The measurement of species diversity. Ann. Rev. Ecol. Syst. 1974, 5, 285–307. [Google Scholar] [CrossRef]
  71. Stohlgren, T.J.; Chong, G.W.; Kalkhan, M.A.; Schell, L.D. Multiscale sampling of plant diversity: Effects of minimum mapping unit size. Ecol. Appl. 1997, 7, 1064–1074. [Google Scholar] [CrossRef]
  72. Kalkhan, M.A.; Stafford, E.J.; Stohlgren, T.J. Rapid plant diversity assessment using a pixel nested plot design: A case study in Beaver Meadows, Rocky Mountain National Park, Colorado, USA. Divers. Distrib. 2007, 13, 379–388. [Google Scholar] [CrossRef]
  73. Kumar, S.; Simonson, S.; Stohlgren, T.J. Effects of spatial heterogeneity on butterfly species richness in Rocky Mountain National Park, CO, USA. Biodiv. Conserv. 2009, 18, 739–763. [Google Scholar] [CrossRef]
  74. Aasen, H.; Honkavaara, E.; Lucieer, A.; Zarco-Tejada, P. Quantitative remote sensing at ultra-high resolution with UAV spectroscopy: A review of sensor technology, measurement procedures, and data correction workflows. Remote Sens. 2018, 10, 1091. [Google Scholar] [CrossRef] [Green Version]
  75. Anderson, K.; Gaston, K.J. Lightweight unmanned aerial vehicles will revolutionize spatial ecology. Front. Ecol. Environ. 2013, 11, 138–146. [Google Scholar] [CrossRef] [Green Version]
  76. Somers, B.; Asner, G.P.; Tits, L.; Coppin, P. Endmember variability in Spectral Mixture Analysis: A review. Remote Sens. Environ. 2011, 115, 1603–1616. [Google Scholar] [CrossRef]
  77. Keshava, N.; Mustard, J.F. Spectral unmixing. IEEE Signal Proc. 2002, 19, 44–57. [Google Scholar] [CrossRef]
Figure 1. Location of the study area in central Spain and some examples of the dominant lichen communities found in the area.
Remotesensing 11 02942 g001
Figure 2. Picture of the system used to acquire the hyperspectral imagery. The system consists of: (a) samples holder and motor driver; (b) HeadWall VNIR camera thermostated by heaters; (c) stable halogen lamp; (d) calibrated Lambertian Spectralon panel; (e) PC connected to the spectrometer by a dedicated interface.
Remotesensing 11 02942 g002
Figure 3. True color composite samples (upper images) from one of the hyperspectral images used and the classification derived (lower images).
Remotesensing 11 02942 g003
Figure 4. ROC curves of the genera classifications and the derived AUC values of the wet samples.
Remotesensing 11 02942 g004
Figure 5. Top: RGB composites of some of the samples used in the study, showing the change of color that takes place from dry (first row) to wet (second row) state of biocrusts. Down: Mean reflectance spectra and mean continuum removal absorption spectra between 450–900 nm of the biocrust classes and bare soil studied in this work. The red dashed line marks the absorption feature at 680 nm related to the presence of chlorophyll. (a) Dry samples; (b) Wet samples.
Remotesensing 11 02942 g005
Figure 6. Mean continuum removal at ~680 nm of the lichen classes identified. Bars indicate the first and third quartile of each class. (a) dry samples; (b) wet samples.
Remotesensing 11 02942 g006
Figure 7. Linear regression between the spectral diversity measured as the Standard Deviation of the Continuum removal at 680 nm and three α-diversity metrics: (a) Shannon’s index, (b) Simpson’s index, and (c) Pielou’s index. Shaded areas represent ±95% symmetrical confidence interval.
Remotesensing 11 02942 g007
Table 1. Diversity metrics used in this study. pi is the fractional cover of the ith class
α-Diversity Metric.Formula
Species richness (S)S = Number of classes
Shannon’s index (H’)H′ = −∑pi ∗ ln (pi)
Reciprocal of Simpson’s index (D)D = 1 / ∑pi 2
Pielou’s index (J’)J′ = H′ / ln (S)
Table 2. Average confusion matrix obtained crossing the ground truth (columns) with the results of the classification (lines) performed on wet samples. 300 pixels per class in each image were randomly selected as validation set to create this matrix. A total of 20,400 random selected pixels were used. The ground truth (%) shows the class distribution in percent for each ground truth class.
Ground truth (%)
AcarosporaBare SoilBuelliaDiploschistesFulgensiaMossPsoraSquamarina
Acarospora99.96000.040000
Bare soil0.0497.5500.720.40.321.060
Buellia0093.454.260000.98
Diploschistes01.636.4994.890.2401.30.23
Fulgensia00.040099.3100.050
Moss00.76000.0599.650.30
Psora00.02000.050.0397.290
Squamarina000.060.0900098.79
Table 3. Fractional cover values of the classes evaluated in this work. Samples: number of samples where the class was identified. Plots: number of plots where the class was identified. Mean Fc, Max Fc, Min Fc, SD Fc: mean, maximum, minimum and standard deviation of the fractional cover observed for each class. Classes: Acarospora: Acarospora spp.; Buellia: Buellia spp., Bare Soil: bare soil; Diploschistes: Diploschistes spp., Fulgensia: Fulgensia spp.; Moss: mosses; Psora: Psora spp.; Squamarina: Squamarina spp.
ClassSamplesPlotsMean Fc (%)Max Fc (%)Min Fc (%)SD Fc (%)
Acarospora37173.832.80.35.8
Bare Soil541821.646.15.18.1
Buellia33132.413.80.53
Diploschistes541814.653.10.111
Fulgensia53181225.40.77.3
Moss54843.576.94.917
Psora41161.912.60.12.6
Squamarina27134.34.30.34.5
Table 4. Slopes, coefficients of determination (r2) and p-values (between brackets) of the linear regression models calculated between spectral diversity metrics (standard deviation of the continuum removal calculated between 550–750 nm (SD_CR550–750) and at 680 nm (SD_CR680); coefficient of variation calculated between 420–900 nm (CV420–900), between 550–750 nm (CV550–750), and at 680 nm (CV680)) and α-diversity metrics (Species richness (S), Shannon’s index (H’), Simpson’s index (D), and Pielou’s Index (J’)) when the samples were wet.
α-Diversity MetricSD_CR550–750SD_CR680CV420–900CV550–750CV680
Species richness (S)0.0010.0030.0050.0130.08
-----
Shannon’s Index (H’)0.0120.0220.0560.0630.071
0.33(0.001)0.41(0.0004)--0.16(0.03)
Simpson’s Index (D)0.020.0490.1560.1640.184
0.39(0.0004)0.47(0.0001)--0.26(0.007)
Pielou’s Index (J’)0.0230.0410.1120.1180.141
0.39(0.0004)0.42(0.0002)--0.19(0.02)
Table 5. Summary of statistics in fitting (r2 and RMSE) and cross-validation (r2cv and RMSEcv) of the linear regression models between the spectral diversity measured as the standard deviation of the continuum removal at 680 nm and the α-diversity metrics (Shannon’s, Simpson’s, and Pielou’s indices). RMSE: root mean square error; r2: coefficient of determination.
α-Diversity Metricr2RMSErCV2RMSECV
Shannon’s index (H’)0.410.010.320.01
Simpson’s index (D)0.470.0090.390.01
Pielou’s index (J’)0.420.0090.350.01

