High-Resolution Imagery Classification Based on Different Levels of Information


1
School of Geography, Geomatics and Planning, Jiangsu Normal University, Xuzhou 221116, China
2
State Key Laboratory of Desert and Oasis Ecology, Xinjiang Institute of Ecology and Geography, Chinese Academy of Sciences, Urumqi 830011, China
3
School of Geography and Ocean Science, Nanjing University, Nanjing 210023, China
*
Author to whom correspondence should be addressed.
Remote Sens. 2019, 11(24), 2916; https://doi.org/10.3390/rs11242916
Submission received: 23 October 2019
/
Revised: 26 November 2019
/
Accepted: 2 December 2019
/
Published: 5 December 2019
(This article belongs to the Section Remote Sensing Image Processing)
Abstract
:Detailed land use and land cover (LULC) information is one of the important information for land use surveys and applications related to the earth sciences. Therefore, LULC classification using very-high resolution remotely sensed imagery has been a hot issue in the remote sensing community. However, it remains a challenge to successfully extract LULC information from very-high resolution remotely sensed imagery, due to the difficulties in describing the individual characteristics of various LULC categories using single level features. The traditional pixel-wise or spectral-spatial based methods pay more attention to low-level feature representations of target LULC categories. In addition, deep convolutional neural networks offer great potential to extract high-level features to describe objects and have been successfully applied to scene understanding or classification. However, existing studies has paid little attention to constructing multi-level feature representations to better understand each category. In this paper, a multi-level feature representation framework is first designed to extract more robust feature representations for the complex LULC classification task using very-high resolution remotely sensed imagery. To this end, spectral reflection and morphological and morphological attribute profiles are used to describe the pixel-level and neighborhood-level information. Furthermore, a novel object-based convolutional neural networks (CNN) is proposed to extract scene-level information. The object-based CNN method combines advantages of object-based method and CNN method and can perform multi-scale analysis at the scene level. Then, the random forest method is employed to carry out the final classification using the multi-level features. The proposed method was validated on three challenging remotely sensed imageries including a hyperspectral image and two multispectral images with very-high spatial resolution, and achieved excellent classification performances.

1. Introduction
Land use and land cover (LULC) information is an essential part of various geospatial applications in urban areas, such as urban planning, land resource survey and management, and environmental monitoring [1]. It also has a major part to play in understanding the complex interactions between human activities and environmental stresses [2]. Over the past few decades, extracting LULC information from remotely sensed imagery has attracted a lot of attention in remote sensing technology and application domains, and obtained great progress in information processing and applications. With the development of very high resolution (VHR) remotely sensed imagery it becomes possible to extract very detailed level LULC information [3,4]. However, the most of land cover or land use categories are artificial surface in urban areas, show complex composition in VHR images. Specifically, some land use types shared similar spectral and texture features (e.g., cement roads and building roof), even spatial structure features (e.g., urban main road and highways). Moreover, the same urban land use types like roads and residential buildings always consist of different land cover materials and have different spectral features. For the classification tasks with high level semantic categories, many land use types are defined according to their functional properties, are difficult to capture their distinctive features from spectral, texture, shape or spatial structure features individually in VHR images. With complex and diverse characteristics of LULC categories in urban areas, it remains challenging to complete successful LULC classification task based on VHR remote sensed imagery. Therefore, developing advanced feature representation and classification techniques to effectively utilize features of VHR images is important to improve the quality of remotely sensed imagery based LULC mapping in urban areas.
Since the advent of high-resolution remote sensing technology, substantial efforts have been dedicated to developing LULC classification methods using VHR remote sensed imagery [5,6]. Traditional classification methods early applied for remote sensing data preprocessing are pixel-wise classification approaches. These methods are widely used for land cover classification using coarse or medium resolution remote sensed imagery based purely on spectral features or additional conventional spatial information [7,8]. In addition, multi-temporal multi-source remote sensed image processing technologies are highly expected to solve the issue of more detailed land cover classification [9,10,11]. However, the traditional pixel-wise approaches proposed for lower resolution imagery are hard to work for VHR imagery due to poor feature representation of original spectral reflection and some simple spatial features. Besides, the pixel-wise methods always could not obtain a good smooth border close to reality. To improve thus weakness of pixel-wise methods, object-oriented image analysis method is built upon LULC objects extracted from VHR remote sensed imagery by segmentation algorithms and can achieve a better performance. Object-oriented and geographic object-based approaches use a new base unit to process image and construct feature representation of targets [12]. To this end, object-based information including spectral reflection, texture and shape is widely employed for land use or land cover classification [13,14]. These object-oriented methods provide an effective scheme to use different types of features to construct discriminative feature representation [15]. Moreover, some higher level features like object shape properties are developed to describe space objects of land use or land cover [16,17]. However, the features representing the characteristic of different categories are low level spectral and spatial texture features, and the higher level shape features have some advantages for some specific LULC types with particular shape attributes, but the objects produced by the segmentation methods have a great impact on the classification results. Actually, over-segmentation and under-segmentation phenomena caused by segmentation scales commonly exist in the segmentation result [18,19]. In addition, the base features (e.g., spectra, texture and shape) used for constructing object-based feature representations have not enough ability to distinguish some LULC types with complex structure or patterns because of their low semantic level. In other words, limited spectral information and other manually designed texture and shape features are insufficient to complete complex classification tasks that are particularly significant in urban settings [20,21].
Currently, deep learning has become the most popular solution for feature learning and classification, and succeeded in many applications, such as nature images classifications [22], image retrieval [23], action recognition [24] and object detection [25]. Its great ability of feature learning and abstraction has demonstrated great potential in remote sensing image processing and analysis, such as remotely sensed scene classification [26], hyperspectral imagery classification [27], target detection and semantic segmentation [28,29]. With multiple functional layers, the convolutional neural networks (CNN) model can obtain different levels of input data abstraction, ranging from low-level abstraction on the first few layers to high-level abstraction on the intermediate layers and higher-level abstractions on the last few layers. With respect to LULC classification, deep learning methods are not only used as a feature learning approach to exploit essential feature representation of raw spectral features by a supervised or unsupervised manner, but also can be employed as an end-to-end system to combine feature learning and classification process into one scheme. Over the past few years, deep leaning methods have obtained dramatic improvements beyond the previous state-of-the-art records in many remote sensing applications. Especially deep convolutional neural networks (CNNs) have been acknowledged as the most popular method to solve the computer vision problems, and have attracted great interest in remotely sensed tasks including land use or land cover classification [30,31].
In contrast with pixel-wise and object-oriented methods, the input of CNN model is always image patches, so the learnt features based CNN are feature representations of input image patches, and classification output of CNN model is the semantic category of the input patch other than the class of any pixel in the patch. While for LULC classification task, its ultimate goal is classified every pixel of an imagery into different classes accurately. Thus, some studies attempt to directly apply CNN into the LULC classification task by a moving window-based strategy [32,33]. According to this scheme, the centered pixel of an image patch is replaced by this patch to carry out feature learning and classification training process based on CNN methods, and determined its land use or land cover class by classification output of the patch [34]. It has achieved better performance compared with pixel-wise classification methods in hyperspectral remote sensing image classification [35]. Moreover, spectral-spatial features also have been stacked to enrich information of input image patches and further improve the generalization capability of trained CNN [36]. These aforementioned approaches ordinarily select a fixed size to generate image patches and are deemed to describe all target classes using the same and single spatial scale. This rule is clearly contrary to realism. Thus, a multi-scale CNN based method is proposed to address this issue and achieved an obvious improvement compared with single-scale CNN methods [32,34]. At the same time, other works also try to improve the performance of the CNN based classification scheme through designing enhanced CNN network or fusing more spatial information [37]. Although these efforts discovered an effective pattern of applying CNN models in LULC classification, and proved its superiority in higher level feature learning and representation. However, the moving window-based strategy determines that it is still a kind of pixel-wise classification framework. Since adjacent pixels belonging to the same category are included in different windows, they are easily divided into different classes. Besides, the computation burden is another insurmountable shortcoming for these methods.
In addition to the above-mentioned methods, another popular deep learning framework proposed for image classification task is semantic segmentation networks. A range of research has focused on adapting semantic segmentation methods to LULC classification. A semantic segmentation network classifies every pixel in an image, resulting in an image that is segmented by class. Typically, fully convolutional networks (FCNs) are early proposed for semantic segmentation [38]. It gives an end-to-end network architecture combing feature learning with classifier training simultaneously to accomplish semantic segmentation. To overcome the defect of FCN in predicting precise boundaries, some improved or initial semantic segmentation networks were proposed successively, such as SegNet [39], UNet [40] and DeepNet v3+ [41]. These creative works strengthen the ability to exploit low-level features and relatively keep edges by expanding receptive fields. On the VHR remotely sensed image classification, some improvements of ensemble strategy and new upsampling operation on semantic segmentation networks have been carried out for better adapting to specific tasks [42,43]. However, there are still some challenges in practice, such as limited fully annotated training data, huge computation burden, blurry object boundaries [44]. More importantly, existing studies achieved good performances on test datasets that contain several easily distinguishable categories, are still quite difficult to deal with more complex tasks to date.
Besides, some other works attempt to propose a more competitive mode to use CNN methods for LULC classification by combing superiorities of object-oriented and CNN methods [45,46]. In this scenario, the object-oriented method is employed to discover precise edges of target objects in an image through image segmentation process, and CNN method is trained to explore accumulated contextual information over very large receptive fields and construct robust spatial feature representation. In actual studies, the deep feature representations of an image extracted by moving window-based CNN can be stacked with object-based features at the pixel level for classification [47]. According to their detailed design, the final classification result of an object is determined by the major voting of all pixels class in the object. In order to reduce the computation burden of patch-wise feature learning process, superpixel is taken as the basic analysis unit instead of pixel to construct a CNN based classification process. The authors extract six patches around each superpixel object to construct a joint representation [45]. In addition, another work recently proposed a novel object-based model that also combines object-oriented and CNN techniques to distinguish land use objects through considering within-object and between-object information simultaneously [48]. In this study, an over segmented object is represented by some representational image patches but not dense patches to learn higher-level feature representations based on CNN model. Although these patch-based CNN approaches provided new perspectives to solve the complicated problem of land use or land cover classification using VHR remotely sensed imagery, and demonstrated their superiorities. However, there are still some issues to be discussed, such as accuracy, computational efficiency and feature representation ability. In short, these methods paid more attention to learn accumulate contextual information at the scene level but ignored the complex scale characteristics of different classes.
In this paper, we propose a framework of exploiting different spatial level information to address the complex LULC classification using hyperspectral or multispectral VHR remotely sensed imagery. To this, spectral reflection, morphological and morphological attribute profiles are applied to characterize pixel and neighborhood levels information of VHR remotely sensed imagery, respectively. A multi-scale object-based CNN method is proposed to extract high-level semantic information at the scene level. These features consisting of different level information are finally fused at the pixel level into the model for urban LULC classification. The main contributions of this work can be summarized as (1) using multi-level features to improve the LULC classification performance, (2) to propose an object-based CNN method to learn the multi-scale scene-level features and (3) to investigate the responsible of different scale scene image for the prediction of the CNN network and importance of different level features for classification result.
2. Methods
2.1. Understanding LULC Categories Based on Multiple Levels of Information
In a remotely sensed imagery, land use or land cover areas are divided into pixels, and characterized by spectral reflectance features. Therefore, spectral features of original remotely sensed imagery are usually deployed as input features of the model for land use or land cover classification. However, some categories with similar material are difficult to be separated merely dependent on spectral features. Adjacent pixels belonging to the same category generally show specific texture or structural visual characteristics. It is natural to consider its neighboring pixels and their spatial relationship to construct the spatial features to describe the texture or structural characteristics. These spatial features contain abundant contextual information of a central pixel due to the use of a fixed size neighboring region to describe the background environment. Actually, LULC classification with spectral features, spatial features or joint spectral-spatial features is commonly applied in the remote sensing community. As indicated in many existing studies, the use of spectral-spatial features can significantly improve the performance of land cover classification [8]. Whereas spectral-spatial classification scheme still has challenges for some land use classes with complex materials and spatial structure. For instance, the cement road always shares a similar spectral reflection and neighborhood-level spatial information with some building roofs although they belong to different land use classes. Besides, the object-oriented classification methods use the object as the basic unit to process the classification task, and are efficient to some land use classes. However, the objects generated by the segmentation method are not the real objects, which is important for the classification result. An object-oriented classification based on real objects is an ideal method for successfully extracting most land use classes, but it is difficult to obtain real objects in applications. In this case, more discriminative information with higher semantic connotation should be considered in the feature representation process. In reality, the land use category as a region with specific functions shows a particular spatial structure and contains some types of land cover classes in a larger space. As a result of which, the spectral-spatial features have a poor ability to describe the characteristics of some land use classes. Therefore, it is necessary to exploit the features with higher semantic information for a better understanding of land use. As presented in remote sensing scene classification studies, Land use scenario categories can be distinguished perfectly by feature representation at the scene level [49,50,51]. It indicates that scene level features can capture more effective information for land use classification. Summarizing the above discussion, it is important to develop a technical framework that makes full use of a different level of information for LULC classification.
In this study, we first attempted to construct a technical process to understanding the land use or land cover category by considering multiple level information. As illustrated in Figure 1, to determine the type of a pixel in the remotely sensed imagery, four-level information could be used to help improve the separability of different categories, which includes pixel-level, neighborhood-level, object-level and scene-level information. Here, spectral reflection of the original image is directly used to represent the pixel-level information; the morphological and morphological attribute profiles methods are utilized to extract neighborhood-based spatial information; a superpixel segmentation approach is employed to obtain object-based image representation; moreover, an object-based CNN method is proposed to carry out scene-level information extraction.
Summarized as Figure 2, the proposed LULC classification framework contains three major steps: (a) extracting neighborhood-level spatial information by morphological and morphological attribute filters; (b) constructing scene level information based on an object CNN method and (c) different level features joint representation and classification. It is worth noting that the proposed objected-CNN is based on object-oriented and CNN methods, combines advantages of the two methods. Therefore, the semantic features extracted by the objected-CNN method contain object-level and scene-level information simultaneously. Specifically, object-level information is primarily reflected in the boundaries of objects in this study. In the classification phase, the random forest is used as the classifier to perform classification using the joint features.
2.2. Morphological and Morphological Attribute Profiles
Morphological filters have proved to be effective in extracting informative spatial features from VHR images [52]. The filtering technique has the ability to simultaneously attenuate the slight details and preserve the important characteristics of the regions through openings and closings by reconstruction. The morphological profiles (MPs) are computed with a compact structuring element (SE; e.g., square, disk and linear), and can be used for modeling the size of the objects in the analyzed image. The SE specifies the neighborhood considered for each pixel, so the MPs of a pixel are a function of the values of its adjacent pixels. As a result, the MPs as neighborhood-based spatial features can be used to characterize neighborhood-level information for VHR images. Specifically, given a band of VHR image f, and selected a SE of size , the opening and closing by reconstruction can be computed by two fundamental operators erosion and dilation [53]. The corresponding morphological opening and closing profile can be respectively formalized as:
The MPs can be defined as:
where and demote the opening and closing by reconstruction operators, respectively. When the size of the SE is increasing, a sequence of opening and closing profiles can be obtained to perform a multi-scale analysis.
In addition, morphological attribute profiles (APs) [54] are a generalization of morphological profiles. In contrast with standard MPs, the morphological attribute method execute the filtering operations on the mat-tree representation of the analyzed image. Similar to MPs extracted by two base operators, APs are built on opening and thinning operators by adjusting the criterion of the attributes [54]. The commonly used attributes include area, moment of inertia, standard deviation and length of the diagonal. The created max-tree of the image is pruned according to different criteria of the attributes, and to obtain the filtered images by image restitution, which converts back the pruned tree to an image. Thus, the APs are mathematically expressed as:
where and T demote the opening and thinning operators, respectively; a, i, s and d represent the four attributes.
Given different criterion of the attributes, a sequence of APs also can be used to perform a multi-scale analysis for images. To characterize the image using different attributes can provide more complete description of the regions and be used for accurately modeling the spatial information. In this paper, MPs and APs were employed simultaneously to describe the neighborhood-level information of the VHR remotely sensed imagery. Therefore, the joint feature representation of neighborhood-level was summarized as:
2.3. Image Segmentation
Object-oriented methods always start with an image segmentation process to achieve a segmented image in support of objected-based feature representation. In this work, there were two main goals for image segmentation. The first one was to obtain object-level information for better understanding the category of the pixels within an object. Here, only object boundaries were considered in the application of object-level information. The other one was to help construct the object-based CNN method to learn scene-level information. In this scheme, the objects provided positions of defining scene images to extract scene-level features using the CNN-based method. Compared to the pixel-wise CNN method, object-based CNN can significantly reduce the computation time of image processing, including feature learning, representation and classification processes. In this paper, a superpixel segmentation algorithm, simple linear iterative clustering (SLIC) [55], was employed to execute the image segmentation task. As a superpixel algorithm, SLIC has its own advantages that is suited to help construct object-CNN method, such as faster and more memory efficient and perfect adherence to image boundaries [55]. More importantly, the over-segmented superpixels generated by SLIC are similar in size and shape, and not inlaid with each other. Based on such characteristics, the scene images of fixed size generated around superpixels have a consistent scale and the similar proportion of background information. It is more suitable for training a CNN feature learning model.
SLIC utilizes limited space k-means clustering by grid search to generate superpixels. By default, each pixel of the image is first represented as in a plane space, where is the color representations in CIELAB color space, and is the position of the corresponding pixel. In the initialization phase, it starts from rough initial clustering centers by sampling pixels at a regular grid steps. Then Euclidean distance as the distance measure is used to compute the distance between a pixel and its nearest cluster center and each pixel is associated with the nearest cluster center. Similar to the K-means method, the cluster centers should be updated after all pixels are associated until the condition to stop iteration is reached. To prevent inconsistencies in clustering behavior for different superpixel sizes, the Euclidean distance is not directly calculated based on the five features , but compute a combined distance D as:
where m is defined as a constant parameter to normalize color similarity ; is used to normalize spatial similarity , N is the total number of pixels and k is the desired number of superpixels. Therefore, there are two parameters to be set in advance for SLIC. In practice, instead of using constant values, ASLIC also namely SLIC0 [55] can dynamically normalize the proximities for each cluster using its maximum observed spatial and color distances from the previous iteration. Thereby, the adaptive distance measure can be adjusted to as:
After such improvement, only one parameter k must be set during execution. In this study, this segmentation process was performed on RGB images of the multispectral or hyperspectral data. The RGB image should be converted into CIELAB color space before inputting the SLIC model.
2.4. Object-Based CNN
To extract scene-level information, an object-based CNN was proposed for learning the robust feature representation of the scene images. The object-based CNN method was designed for integrating benefits of object-based and CNN methods. Here, the proposed object-based method was simple to use and understand. Given an image I, suppose it is split into k superpixels, so the image can be represented as . If the superpixel contains n pixels such as , the corresponding spatial positions of these pixels are denoted as . Thus, the central position of superpixel can be calculated by Equation (10):
As illustrated by Figure 3, when the central position of a superpixel is determined, a scene image patch with a fixed size can be extracted centered on this position to describe the background environment of the superpixel at the scene level. Considering that it is difficult to find an optimal size of extracting scene patches to characterize all land use or land cover classes, a sequence of scene images with increasing size can be extracted to perform a multi-scale analysis. Specifically, these scene images of various sizes will be used to train the CNN model and complete the joint feature representation at the scene level. For this purpose, according to commonly used computational blocks of the CNN framework, a genetic CNN model can be defined as:
where the represents the input features to the Lth layer; the and are the weights and biases of the layer to execute the convolution operation denoted as ; the denotes the activation function, which often occurs after the convolutional layer and performs non-linear mapping; besides, a CNN model usually also includes a pooling layer with a window of size , which is denoted as . Given a scene image as the input data, the output features on the final fully connected layer of a trained CNN model are the highly abstraction representation of the scene image, and can be employed to express the scene level information of pixels in the central superpixel. For multiple scene images extracted based on a superpixel, a feature fusion method for merging multi-scale scene-level information can be defined as:
where f′ denotes the fused features of m scene images ; the indicates the output features on the final fully-connected layer of the trained CNN model for ith scene image. If choosing a CNN model with a very deep architecture, the output features on the final fully connected layer have a high dimension. It will increase computational complexity and cause feature imbalance when the high-dimensional features are combined with other features (e.g., spectral and spatial features) into a classifier. Therefore, a transform matrix P is defined to complete the dimensional reduction task. Here, the principal component analysis (PCA) method was used to determine the transform matrix P, and 90% of all variability is preserved when using PCA in the experiments.
The entire process of extracting scene-level features based on the proposed object-based CNN is summarized in Figure 4. To train the CNN model, the scene images were labeled automatically according to the labeled training data for the given LULC classification task. After the scene images were marked by land use or land cover classes, they were used as training data for the CNN model to update the parameters. As illustrated in Figure 4, scene images of the same size were independently used to train the CNN model. Therefore, when the multi-scale analysis was performed by changing the size of the input scene image, multiple CNN models could be obtained. The single-scale scene-level feature presentation can be extracted by each trained CNN model and then fused by Equation (12). In this study, the fusion feature was used as the final scene-level feature representation, and together with other level features to achieve multi-level information joint representation. In addition, some pre-trained CNN models were used as the base architectures in training CNN models, and they were re-trained using target datasets.
3. Experimental Results and Discussion
3.1. Datasets
In this research, four VHR remotely sensed images were chosen for evaluating our proposed method. The first data GRSS_DFC2018 was hyperspectral imagery provided by the Hyperspectral Image Analysis Laboratory and the National Airborne Laser Mapping Center (NCALM) of the University of Houston in the 2018 IEEE GRSS Data Fusion Competition. The data was acquired by NCALM over the University of Houston campus and its neighborhood on 16 February 2017. The image has 48 spectral bands with a spatial resolution of 1 m. It also provided a very high-resolution RGB imagery covering the same area with a spatial resolution of 0.05 m. This dataset was released to challenge urban land use and land cover classification task. Therefore, the ground truth of the data was also defined and released, including 20 urban land-cover or land-use classes and with a spatial resolution of 0.5 m. In order to unify the spatial resolution of the hyperspectral data and ground truth, the hyperspectral image and RGB image were first fused by the Gram-Schmidt sharpening method, and then sampled to the same spatial resolution as the ground truth map, with a size of 1202 pixels × 4768 pixels. The original image (R-G-B) and its ground truth are shown in Figure 5a,b. Detailed information about each land use or land cover class is listed in Figure 5 as well. According to the scores of the contest in 2018, it is a challenge to perform LULC classification using this dataset.
The other two experimental images are parts of the Zurich dataset [56] collected over the city of Zurich in Switzerland by the QuickBird satellite in august 2002, available at https://sites.google.com/site/michelevolpiresearch/. The two images (zh9 and zh17) had four spectral bands (blue, green, red and near infrared) with a spatial resolution of about 0.62 m after pan-sharpening, and with spatial extents of 1342 pixels × 1447 pixels for zh9 and 1025 pixels × 1112 pixels for zh17, respectively. Their ground truth includes seven different urban land use or land cover classes. The color images (NIR-R-G) and their corresponding ground truth information are all shown in Figure 6.
For comparison with other advanced methods, the fourth data set is a well-known data covering the University of Pavia and acquired by the ROSIS sensor in 2003. It has 115 spectral bands with a spatial resolution of about 1.3 m, and with spatial extends of 610 pixels × 340 pixels. Due to removing the noise bands, the remaining 103 bands were used in the experiment. Its ground truth includes nine different classes. More details can be found in [34].
3.2. CNN Model and Parameter Settings
The proposed method was implemented based on different level features, and then joint multi-level features were input into random forest to complete the classification task. At the pixel level, the only original spectral reflectance was directly used in this classification framework. For other level features, the detailed parameters and model architecture were introduced in this subsection.
In this paper, morphological and morphological attribute profiles were employed to describe neighborhood-level spatial features. For the morphological filters, select square as the SE shape and SE with increasing size (3, 5, 7 and 9) to extract more informative spatial features. About morphological attribute profiles, four attributes including area, moment of inertia, standard deviation and length of the diagonal were chosen to characterize the spatial information of the image. Specifically, the thresholds selected for each attribute were 100, 500, 1000 and 5000 for the area, 0.2, 0.3, 0.4 and 0.5 for the moment of inertia, 20, 30, 40 and 50 for the standard deviation, 10, 25, 50 and 100 for the diagonal length. To improve the efficiency of feature creating, the first six principal components (PCs) of the hyperspectral data (GRSS_DFC2018) were considered in the analysis. As for the other experimental images, all of their original four bands were used directly to construct morphological and morphological attribute profiles.
For the object-based CNN method, the SLIC0 segmentation algorithm was used to compute superpixels. The only parameter, desired number of superpixels k was set to , N is the total number of pixels. As a result, the region of each superpixel is an approximately regular square of size 10 × 10. Such over-segmentation result can effectively discover and preserve small objects and obtain more precise boundaries. This is important for some sporadic land cover. In the CNN design section, three popular pre-trained CNN models trained on a subset of the ImageNet database [57], including AlexNet [58], GoogLeNet [59] and ResNet-18 [60], were used to help construct the proposed object-based CNN model. The input size of AlexNet was 227 × 227 × 3, and the other two models were 224 × 224 × 3. We could completely design a new CNN structure in this process, but using a pre-trained network with transfer learning was typically much faster and easier than training a network from scratch, which is especially effective for tasks with limited samples. After training the network on the new data set with the pre-trained CNN models, we obtained the feature extractors to extract scene-level features of the input scene images. Here, the 1000-dimensional features outputted on the final fully connected layer of the pre-trained CNN model were used as the scene-level feature representations. Thus, each scene image was finally represented as a feature vector of size 1000. To perform multi-scale analysis, we needed to select scene images with different sizes to extract their deep features, and then fuse these features into the final scene level features. In this study, the sizes of scene image including {10 × 10, 20 × 20, 30 × 30, 40 × 40, 50 × 50, 60 × 60, 80 × 80, 100 × 100, 150 × 150, 200 × 200, 250 × 250, 300 × 300} were evaluated, and ultimately selected four sizes {10 × 10, 50 × 50,150 × 150, 250 × 250} to build multi-scale scene-level feature representations. A more detailed analysis was discussed in the following subsection.
In the classification stage, random forest as the classifier was to carry out the classification process based on the multi-level features. The number of the base tree was set to 150. To evaluate the performance of the classification results, for the first three data sets, 1% of labeled samples were chosen as the training data, and the rest were used as the testing data for all the experimental images. Besides, if the number of training samples for some LULC classes was less than 30 at 1%, then 30 samples were selected as the training data. In order to compare with other methods, the same training and testing rules as in reference [34] are used for the fourth data set. Follow the routine, pixel-based overall accuracy (OA), Kappa coefficient (κ) and the per-class mapping accuracy were adopted to evaluate the classification results. All procedures for the proposed method were implemented in MATLAB 2018b.
3.3. Classification Results and Analysis
Since scene-level features were constructed by considering multi-scale scene images in our proposed object-based CNN method. Therefore, in order to determine the sizes of multi-scale scene images, we first performed experimental analyses on the effects of different sizes based on the first experimental data. As shown in Figure 7a, the correlation between scene level features of different sized scene images was highly dependent on the difference in their size. Generally, the scene-level features of the adjacent sized images had a higher correlation. Furthermore, when the size of the two scene images was large, the correlation increased. From Figure 7b, the classification accuracy increased as the image size increased, and it would fall after reaching the maximum. Thus, we had chosen some typical sizes such as 10, 50, 150 and 250 to perform multi-scale analysis.
To investigate the performance of multi-scale fusion features compared to single-scale features, they were independently used as input features to execute the classification on the three experimental data sets. As shown in Figure 8, the multi-scale fusion scene-level features achieved higher accuracy on GRSS_DFC2018 and zh9 datasets compared to the use of single-scale features. For the zh17 data, no significant competing performance was obtained by the fusion features, but the best accuracy was also achieved, which was close to the best result obtained by single-scale features extracted from the scene images of size 50 × 50. These results indicate that multi-scale features contained richer information and could better describe different land cover or land use categories with various spatial scales. More importantly, it avoided the problem of finding the optimal region size for scene-level feature representation.
The above results demonstrated the validity of constructing multi-scale scene-level features for LULC category feature representation. To evaluate our proposed LULC classification method based on multi-level features, more experiments were carried out on the experimental data sets. As shown in Table 1, multi-level features achieved the best overall accuracy of 96.16 with a Kappa coefficient (κ) of 0.95. For the single-level features, the original spectral reflection features had the worst performance in classification accuracy, followed by MAPs and scene-level features. The accuracy increase based on MAPs (92.96% OA and κ of 0.91) and scene-level features (95.45% OA and κ of 0.94) was much more significant than the result achieved based on original features (73.68% OA and κ of 0.65). These results clearly demonstrated the enormous impact of selecting different level features on the classification task. Further, we analyzed the per-class classification accuracy, the original spectral reflection features had a strong ability to distinguish some common land cover categories such as grass, water and tree, but failed to separate most of the artificial objects such as road, sidewalk, highways, railway, etc. This condition had significantly improved by MAPs features. For instance, the accuracies of road, crosswalk, etc. were markedly increased by more than 20%. When focusing on performance of the scene-level features, higher accuracies were achieved for the classes with complex spatial structures in comparison with using MAPs features. For examples, the accuracies of residential building, road, sidewalk, crosswalk, major thoroughfares, highway, car and train were increased by 4.87%, 8.89%, 9.58%, 28.42%, 5.16%, 8.39%, 2.02% and 5.93%, respectively. Whereas for some land cover classes such as healthy grass, stressed grass, evergreen tree and water, the scene-level features were not substantially superior to the MAPs, were decreased in terms of classification accuracy (more than 1.9%). When using multi-level features, the accuracies were increased for most of the classes compared to use of single-level features, except for few classes with slight accuracy decrease, such as residential building, sidewalk, highway and train (less than 1%). In addition, the class crosswalk showed the worst classification accuracy no matter which level of features was used in classification process. It achieved the highest accuracy of 35.64% when using scene-level features. Some reasons can be summarized by analyzing the visual features of the class. In contrast with its similar classes including road, sidewalk and highway, the most special characteristic of this class is zebra crossing painted with broad white stripes on the road. However, it is a challenge to capture the semantic features of the class based on the original or MAPs features. The scene-level features have the potentiality to represent thus property, but also experience difficult when the white stripes are blurred in the scene images of crosswalk or having few training data of the class to train the CNN model.
In summary, original features achieved the worst performance in this classification experiment, and scene-level features shown more competitive capability than MAPs to conduct a classification task when comparing among the single-level features. Specifically, original spectral reflection features and MAPs had comparative advantages to identify some traditional land cover classes such as grass, tree and water; scene-level features shown the excellent ability to represent the objects with complex semantic functions, including various types of buildings and roads. From the results shown in Table 1, different level features contributed their specific importance for different types of land use and land cover and improved the classification performance together. Furthermore, these results clearly indicated the importance to construct feature representation from a different level information perspective and demonstrated the effectiveness of our proposed classification framework and methods.
The same evaluation scheme was performed on the other two VHR remote sensing images. The accurate classification performance was also obtained by the proposed method, as illustrated by per-class and overall accuracies shown in Table 2 and Table 3. Unlike the first data, the other two data sets zh9 and zh17 are multispectral images, and a small number of original spectral reflection features were harder to distinguish different land use or land cover classes. Therefore, the original features also achieved the worst overall accuracies of 74.32% and 75.94% for the two data sets, respectively. By contrast, MAPs and scene-level features all significantly improved the classification performance, and the overall accuracies of the two experiments were increased by more than 10%. Moreover, the scene-level features also achieved the largest accuracies for the two data sets. Compared with MAPs, the scene-level features shown better representation ability to accurately describe different classes. For the per-class accuracies, the similar results were obtained compared to results obtained from the first data. Original and MAPs features had good classification performance for the classes including tree and grass. The scene-level features were effective for all categories and achieved more competitive accuracies for most categories. Furthermore, the increased accuracy was always produced for each class when multi-level features were fused to carry out the classification procedure. However, there was a new situation for the experiment on zh17, the accuracies of some classes including roads, buildings, trees and bare soil were slightly decreased when using multi-level features. For the two classes (water and swimming pools) that were easy confused, original features and MAPs lost the advantages to separate them better due to their similar material and spatial texture. In this case, the scene-level features shown their powerful ability to describe semantic information of land use types and significantly improved the classification performance.
As shown in the classification accuracy reports, the different level features provided more comprehensive information to understand the category properties of pixels in an image. The advantages of using multi-level features can also be seen in the classification maps, as displayed in Figure 9 and Figure 10. The classification maps of the data sets zh9 and zh17 were present here.
As shown in Figure 9b, buildings, bare soil and railways were misclassified when using raw spectral reflection features only. At the same time, the classification map contained a lot of salt-and-pepper noise, and the edges of the objects were blurred. Turning to Figure 9c, the misclassification situation was significantly improved, where most misclassified buildings and railways were rectified. However, a small amount of salt-and-pepper noise still existed in the map, and buildings and roads in many areas were misclassified. In Figure 9d, the more precise boundaries were obtained and the confusion of some classes (e.g., roads and buildings, bare soil and grass) was improved as well. These improvements shown in the classification map demonstrated the superiority of the proposed object-based CNN method in constructing scene-level features. However, some drawbacks had also been discovered in Figure 9d. For instance, some small objects are easily misclassified as the surrounding categories because they were merged with surrounding pixels into the same objects during the segmentation phase. Besides, the local inaccurate boundaries generated by the segmentation method also caused deviation from the real edges. In Figure 9e, these defects showed in Figure 9d had been improved relatively. It indicated that other different level features were helpful to more accurate classification. The same phenomena can also be discovered in the classification maps of zh17, as shown in Figure 10. From the figures, sporadic trees and grasses were well preserved when accomplishing classification based on multi-level features.
4. Discussion
4.1. Comparison with Other Methods
The above experiments are performed on three large images recently shared and have not been widely used in related works. To compare with other methods, the same experimental procedure was performed on the University of Pavia data set. From the classification results shown in Table 4, the proposed multi-level feature based classification method outperformed the method MCNN. According to the report in [34], MCNN achieved the highest classification accuracy compared to the other five advanced methods. In this study, our proposed method produced higher accuracies for most classes than MCNN. The MCNN also extracted multi-scale features based on CNN models and combined them with spectral features to complete classification. It showed better performance in terms of asphalt, metal sheet and brick than our proposed method, but performed worse for the other six classes. Overall, these results indicate that our proposed method could extract more robust features to represent different classes and could deal with complex shapes and textures in different scenarios.
4.2. Feature Importance Analysis
It can be seen from the above results that different level features played special roles in obtaining accurate classification results. The predictor importance could be estimated to quantitatively evaluate the importance of the different level features. Based on the random forest classifier trained on multi-level features, the predictor importance of each feature for the classifier could be computed by summing these estimates over all weak learners in the ensemble. As shown in Figure 11, the importance of different level features were visually represented by a box plot for each experimental dataset. From the displays, the importance values of the original features were lower than the values of the other two level features, which indicated that they were relatively unimportant to the classifier. The scene-level features had the highest importance values and once again proved its superiority. Among these different level features, MAPs contained more features compared to the other level features, and the importance values of the features changed over a large range. This indicated that some features of MAPs also played a very important role for the classifier.
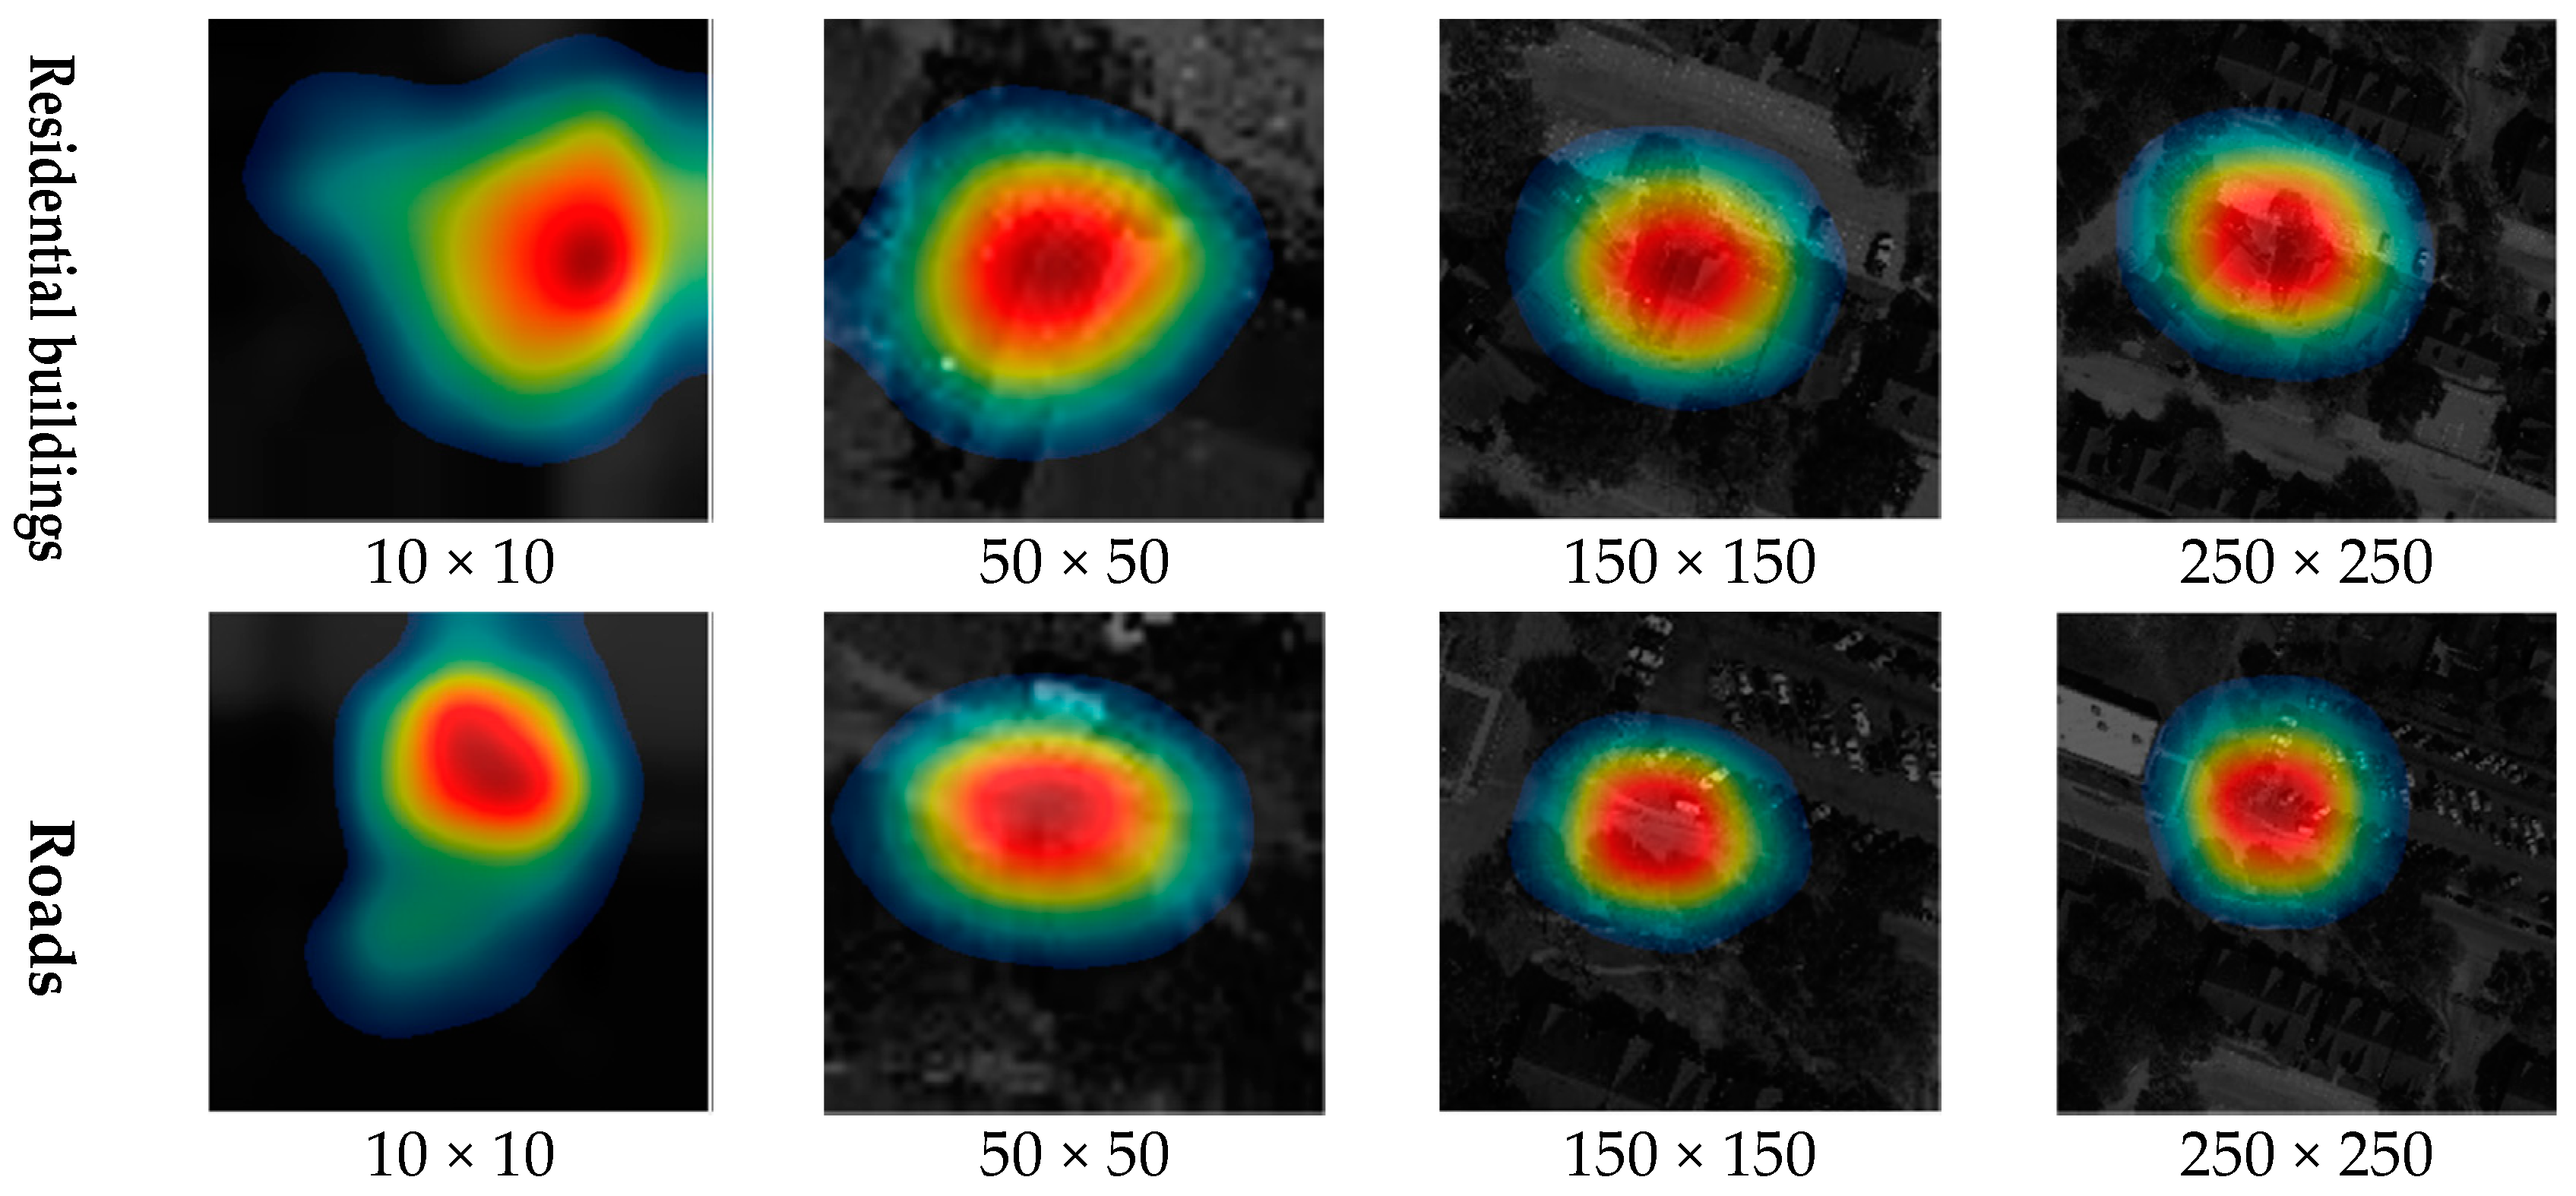
With respect to the scene-level features, it provided a larger receptive field to understand the semantic information of the targets. In this scenario, the land use or land cover types would be represented by the higher semantic features, including more abundant background environment information. In this study, we constructed multi-scale scene-level features to adapt to different targets. The scene images of different sizes were used to train CNN models for scene-level feature extracting. Therefore, it is necessary to analysis the discriminative regions of the scene images for various classes. It may provide a different view to understanding the importance of performing multi-scale analysis at the scene level. Here, class activation mapping (CAM) was used to investigate the discriminative regions of the scene images [61]. In order to achieve this, it computed a weighted sum of the feature maps of the last convolutional layer to obtain the class activation maps. In Figure 12, some examples of the CAM output were presented, the maps highlight the discriminative image regions used for image classification. From the displays, the highlighted regions changed as the size of the scene image increases for the same class. At the same time, the range of discriminative region extended as the size of the scene image increases. However, we could also see that when the size of the scene image reached a larger value, the range of the non-highlighted area increased. This phenomenon indicated that the discriminative regions did not continuously expand with the size of input scene image increased. Therefore, it could not further improve the feature representation ability by choosing a lager-sized scene image. To compare the CAM outputs of the easily confused classes (e.g., roads, sidewalks, crosswalks, etc.), the discriminative regions contained pivotal spatial traits to distinguish the target classes, which demonstrated that the CNN model had powerful capabilities to capture the essential information of different classes. Moreover, the range of highlighted regions extended far beyond the edges of the object, indicating that the surrounding environment information was also important for understanding the category of the object. This is why scene-level features achieved better classification performance for these classes than other features in our experiments.
5. Conclusions
In this work, we first designed a framework to understand land use or land cover categories from a different level information perspective. To this end, an object-based CNN method was proposed to extract scene-level features, which combines the advantages of object-based and CNN methods and can fuse multi-scale information. Besides, morphological and morphological attribute profiles methods were utilized to extract neighborhood-level features. The proposed methods were evaluated on three real VHR remotely sensed images, demonstrating that multi-level features could comprehensively characterize land use or land cover categories and showed outstanding representation capabilities even for the complex land use categories. Furthermore, amongst the different level features, scene-level features played the most important role for the classifier according to the predictor importance analysis, followed by neighborhood-level features (MAPs). The original spectral reflection features as pixel-level features had the worst performance, whereas for the performance on per-class, the pixel-level and neighborhood-level features achieved better performance for some land cover categories. Therefore, multi-level features are more competitive than single level features in completing LULC classification tasks.
Author Contributions
Conceptualization, E.L.; methodology, E.L.; validation, C.L., X.B. and W.L.; formal analysis, W.L.; writing—original draft preparation, E.L.; writing—review and editing, A.S.
Funding
This research was jointly funded by National Natural Science Foundation of China (NSFC) under Grant No. 41801327 and 41601405, and A Project funded by the Priority Academic Program Development of Jiangsu Higher Education Institutions (PAPD).
Acknowledgments
This study is jointly supported by the by National Natural Science Foundation of China (NSFC) under Grant No. 41801327 and 41601405, and A Project funded by the Priority Academic Program Development of Jiangsu Higher Education Institutions (PAPD).
Conflicts of Interest
The authors declare no conflict of interest.
References
- Gómez, C.; White, J.C.; Wulder, M.A. Optical remotely sensed time series data for land cover classification: A review. ISPRS J. Photogramm. Remote Sens. 2016, 116, 55–72. [Google Scholar] [CrossRef] [Green Version]
- Tesfaw, A.T.; Pfaff, A.; Golden Kroner, R.E.; Qin, S.; Medeiros, R.; Mascia, M.B. Land-use and land-cover change shape the sustainability and impacts of protected areas. Proc. Natl. Acad. Sci. USA 2018, 115, 2084–2089. [Google Scholar] [CrossRef] [PubMed] [Green Version]
- Karpatne, A.; Ebert-Uphoff, I.; Ravela, S.; Babaie, H.A.; Kumar, V. Machine Learning for the Geosciences: Challenges and Opportunities. IEEE Trans. Knowl. Data Eng. 2019, 31, 1544–1554. [Google Scholar] [CrossRef] [Green Version]
- Zhang, L.; Zhang, L.; Du, B. Deep Learning for Remote Sensing Data: A Technical Tutorial on the State of the Art. IEEE Geosci. Remote Sens. Mag. 2016, 4, 22–40. [Google Scholar] [CrossRef]
- Agüera, F.; Aguilar, F.J.; Aguilar, M.A.J.I.J.o.P.; Sensing, R. Using texture analysis to improve per-pixel classification of very high resolution images for mapping plastic greenhouses. ISPRS J. Photogramm. Remote Sens. 2008, 63, 635–646. [Google Scholar] [CrossRef]
- Romero, A.; Gatta, C.; Camps-Valls, G. Unsupervised deep feature extraction for remote sensing image classification. IEEE Trans. Geosci. Remote Sens. 2015, 54, 1349–1362. [Google Scholar] [CrossRef] [Green Version]
- Maulik, U.; Chakraborty, D. Remote Sensing Image Classification: A survey of support-vector-machine-based advanced techniques. IEEE Geosci. Remote Sens. Mag. 2017, 5, 33–52. [Google Scholar] [CrossRef]
- Tuia, D.; Persello, C.; Bruzzone, L. Domain adaptation for the classification of remote sensing data: An overview of recent advances. IEEE Geosci. Remote Sens. Mag. 2016, 4, 41–57. [Google Scholar] [CrossRef]
- Tuia, D.; Marcos, D.; Camps-Valls, G. Multi-temporal and multi-source remote sensing image classification by nonlinear relative normalization. ISPRS J. Photogramm. Remote Sens. 2016, 120, 1–12. [Google Scholar] [CrossRef] [Green Version]
- Shao, Y.; Lunetta, R.S.; Wheeler, B.; Iiames, J.S.; Campbell, J.B. An evaluation of time-series smoothing algorithms for land-cover classifications using MODIS-NDVI multi-temporal data. Remote Sens. Environ. 2016, 174, 258–265. [Google Scholar] [CrossRef]
- Viana, C.M.; Girão, I.; Rocha, J.J.R.S. Long-Term Satellite Image Time-Series for Land Use/Land Cover Change Detection Using Refined Open Source Data in a Rural Region. Remote Sens. 2019, 11, 1104. [Google Scholar] [CrossRef] [Green Version]
- Arvor, D.; Durieux, L.; Andrés, S.; Laporte, M.-A.J.I.J.o.P.; Sensing, R. Advances in geographic object-based image analysis with ontologies: A review of main contributions and limitations from a remote sensing perspective. ISPRS J. Photogramm. Remote Sens. 2013, 82, 125–137. [Google Scholar] [CrossRef]
- Huang, X.; Zhang, L. An SVM Ensemble Approach Combining Spectral, Structural, and Semantic Features for the Classification of High-Resolution Remotely Sensed Imagery. IEEE Trans. Geosci. Remote Sens. 2013, 51, 257–272. [Google Scholar] [CrossRef]
- Piazza, G.A.; Vibrans, A.C.; Liesenberg, V.; Refosco, J.C. Object-oriented and pixel-based classification approaches to classify tropical successional stages using airborne high–spatial resolution images. GISci. Remote Sens. 2016, 53, 206–226. [Google Scholar] [CrossRef]
- Ma, L.; Li, M.; Ma, X.; Cheng, L.; Du, P.; Liu, Y. A review of supervised object-based land-cover image classification. ISPRS J. Photogramm. Remote Sens. 2017, 130, 277–293. [Google Scholar] [CrossRef]
- Zhong, Y.; Zhao, B.; Zhang, L. Multiagent object-based classifier for high spatial resolution imagery. IEEE Trans. Geosci. Remote Sens. 2013, 52, 841–857. [Google Scholar] [CrossRef]
- Lv, Z.; Zhang, P.; Atli Benediktsson, J. Automatic Object-Oriented, Spectral-Spatial Feature Extraction Driven by Tobler’s First Law of Geography for Very High Resolution Aerial Imagery Classification. Remote Sens. 2017, 9, 285. [Google Scholar] [CrossRef] [Green Version]
- Blaschke, T. Object based image analysis for remote sensing. ISPRS J. Photogramm. Remote Sens. 2010, 65, 2–16. [Google Scholar] [CrossRef] [Green Version]
- Troya-Galvis, A.; Gançarski, P.; Passat, N.; Berti-Equille, L. Unsupervised quantification of under-and over-segmentation for object-based remote sensing image analysis. IEEE J. Sel. Top. Appl. Earth Obs. Remote Sens. 2015, 8, 1936–1945. [Google Scholar] [CrossRef] [Green Version]
- Huang, B.; Zhao, B.; Song, Y. Urban land-use mapping using a deep convolutional neural network with high spatial resolution multispectral remote sensing imagery. Remote Sens. Environ. 2018, 214, 73–86. [Google Scholar] [CrossRef]
- Helber, P.; Bischke, B.; Dengel, A.; Borth, D. EuroSAT: A Novel Dataset and Deep Learning Benchmark for Land Use and Land Cover Classification. IEEE J. Sel. Top. Appl. Earth Obs. Remote Sens. 2019, 12, 2217–2226. [Google Scholar] [CrossRef] [Green Version]
- Sullivan, D.P.; Winsnes, C.F.; Åkesson, L.; Hjelmare, M.; Wiking, M.; Schutten, R.; Campbell, L.; Leifsson, H.; Rhodes, S.; Nordgren, A. Deep learning is combined with massive-scale citizen science to improve large-scale image classification. Nat. Biotechnol. 2018, 36, 820–828. [Google Scholar] [CrossRef] [PubMed]
- Radenović, F.; Tolias, G.; Chum, O. Fine-tuning CNN image retrieval with no human annotation. IEEE Trans. Pattern Anal. Mach. Intell. 2018, 41, 1655–1668. [Google Scholar] [CrossRef] [PubMed] [Green Version]
- Varol, G.; Laptev, I.; Schmid, C. Long-term temporal convolutions for action recognition. IEEE Trans. Pattern Anal. Mach. Intell. 2017, 40, 1510–1517. [Google Scholar] [CrossRef] [PubMed] [Green Version]
- Cai, Z.; Vasconcelos, N. Cascade R-CNN: Delving Into High Quality Object Detection. In Proceedings of the IEEE Conference on Computer Vision and Pattern Recognition (CVPR), Salt Lake City, UT, USA, 18–22 June 2018; pp. 6154–6162. [Google Scholar]
- Xia, G.-S.; Hu, J.; Hu, F.; Shi, B.; Bai, X.; Zhong, Y.; Zhang, L.; Lu, X. AID: A benchmark data set for performance evaluation of aerial scene classification. IEEE Trans. Geosci. Remote Sens. 2017, 55, 3965–3981. [Google Scholar] [CrossRef] [Green Version]
- Mou, L.; Ghamisi, P.; Zhu, X.X. Deep recurrent neural networks for hyperspectral image classification. IEEE Trans. Geosci. Remote Sens. 2017, 55, 3639–3655. [Google Scholar] [CrossRef] [Green Version]
- Zhu, X.X.; Tuia, D.; Mou, L.; Xia, G.-S.; Zhang, L.; Xu, F.; Fraundorfer, F. Deep learning in remote sensing: A comprehensive review and list of resources. IEEE Geosci. Remote Sens. Mag. 2017, 5, 8–36. [Google Scholar] [CrossRef] [Green Version]
- Cheng, G.; Han, J. A survey on object detection in optical remote sensing images. ISPRS J. Photogramm. Remote Sens. 2016, 117, 11–28. [Google Scholar] [CrossRef] [Green Version]
- Luus, F.P.S.; Salmon, B.P.; Van den Bergh, F.; Maharaj, B.T.J. Multiview deep learning for land-use classification. IEEE Geosci. Remote Sens. Lett. 2015, 12, 2448–2452. [Google Scholar] [CrossRef] [Green Version]
- Zhang, C.; Sargent, I.; Pan, X.; Li, H.; Gardiner, A.; Hare, J.; Atkinson, P.M. Joint Deep Learning for land cover and land use classification. Remote Sens. Environ. 2019, 221, 173–187. [Google Scholar] [CrossRef] [Green Version]
- Zhao, W.; Guo, Z.; Yue, J.; Zhang, X.; Luo, L. On combining multiscale deep learning features for the classification of hyperspectral remote sensing imagery. Int. J. Remote Sens. 2015, 36, 3368–3379. [Google Scholar] [CrossRef]
- Sharma, A.; Liu, X.; Yang, X.; Shi, D. A patch-based convolutional neural network for remote sensing image classification. Neural Netw. 2017, 95, 19–28. [Google Scholar] [CrossRef] [PubMed]
- Zhao, W.; Du, S. Learning multiscale and deep representations for classifying remotely sensed imagery. ISPRS J. Photogramm. Remote Sens. 2016, 113, 155–165. [Google Scholar] [CrossRef]
- Yu, S.; Jia, S.; Xu, C. Convolutional neural networks for hyperspectral image classification. Neurocomputing 2017, 219, 88–98. [Google Scholar] [CrossRef]
- Li, Y.; Zhang, H.; Shen, Q. Spectral–spatial classification of hyperspectral imagery with 3D convolutional neural network. Remote Sens. 2017, 9, 67. [Google Scholar] [CrossRef] [Green Version]
- Paoletti, M.E.; Haut, J.M.; Plaza, J.; Plaza, A. A new deep convolutional neural network for fast hyperspectral image classification. ISPRS J. Photogramm. Remote Sens. 2018, 145, 120–147. [Google Scholar] [CrossRef]
- Long, J.; Shelhamer, E.; Darrell, T. Fully convolutional networks for semantic segmentation. In Proceedings of the IEEE Conference on Computer Vision and Pattern Recognition, Boston, MA, USA, 7–12 June 2015; pp. 3431–3440. [Google Scholar]
- Badrinarayanan, V.; Kendall, A.; Cipolla, R. Segnet: A deep convolutional encoder-decoder architecture for image segmentation. IEEE Trans. Pattern Anal. Mach. Intell. 2017, 39, 2481–2495. [Google Scholar] [CrossRef]
- Ronneberger, O.; Fischer, P.; Brox, T. U-net: Convolutional networks for biomedical image segmentation. In Proceedings of the International Conference on Medical Image Computing and Computer-Assisted Intervention, Munich, Germany, 5–9 October 2015; pp. 234–241. [Google Scholar]
- Chen, L.-C.; Zhu, Y.; Papandreou, G.; Schroff, F.; Adam, H. Encoder-decoder with atrous separable convolution for semantic image segmentation. In Proceedings of the European Conference on Computer Vision, Munich, Germany, 8–14 September 2018; pp. 801–818. [Google Scholar]
- Volpi, M.; Tuia, D. Dense semantic labeling of subdecimeter resolution images with convolutional neural networks. IEEE Trans. Geosci. Remote Sens. 2016, 55, 881–893. [Google Scholar] [CrossRef] [Green Version]
- Liu, Y.; Fan, B.; Wang, L.; Bai, J.; Xiang, S.; Pan, C. Semantic labeling in very high resolution images via a self-cascaded convolutional neural network. ISPRS J. Photogramm. Remote Sens. 2018, 145, 78–95. [Google Scholar] [CrossRef] [Green Version]
- Marmanis, D.; Schindler, K.; Wegner, J.D.; Galliani, S.; Datcu, M.; Stilla, U. Classification with an edge: Improving semantic image segmentation with boundary detection. ISPRS J. Photogramm. Remote Sens. 2018, 135, 158–172. [Google Scholar] [CrossRef] [Green Version]
- Zhao, W.; Jiao, L.; Ma, W.; Zhao, J.; Zhao, J.; Liu, H.; Cao, X.; Yang, S. Superpixel-based multiple local CNN for panchromatic and multispectral image classification. IEEE Trans. Geosci. Remote Sens. 2017, 55, 4141–4156. [Google Scholar] [CrossRef]
- Lv, X.; Ming, D.; Chen, Y.; Wang, M. Very high resolution remote sensing image classification with SEEDS-CNN and scale effect analysis for superpixel CNN classification. Int. J. Remote Sens. 2019, 40, 506–531. [Google Scholar] [CrossRef]
- Zhao, W.; Du, S.; Emery, W. Object-based convolutional neural network for high-resolution imagery classification. IEEE J. Sel. Top. Appl. Earth Obs. Remote Sens. 2017, 10, 3386–3396. [Google Scholar] [CrossRef]
- Zhang, C.; Sargent, I.; Pan, X.; Li, H.; Gardiner, A.; Hare, J.; Atkinson, P.M. An object-based convolutional neural network (OCNN) for urban land use classification. Remote Sens. Environ. 2018, 216, 57–70. [Google Scholar] [CrossRef] [Green Version]
- Hu, F.; Xia, G.-S.; Hu, J.; Zhang, L. Transferring deep convolutional neural networks for the scene classification of high-resolution remote sensing imagery. Remote Sens. 2015, 7, 14680–14707. [Google Scholar] [CrossRef] [Green Version]
- Nogueira, K.; Penatti, O.A.B.; dos Santos, J.A. Towards better exploiting convolutional neural networks for remote sensing scene classification. Pattern Recognit. 2017, 61, 539–556. [Google Scholar] [CrossRef] [Green Version]
- Li, E.; Xia, J.; Du, P.; Lin, C.; Samat, A. Integrating multilayer features of convolutional neural networks for remote sensing scene classification. IEEE Trans. Geosci. Remote Sens. 2017, 55, 5653–5665. [Google Scholar] [CrossRef]
- Dalla Mura, M.; Atli Benediktsson, J.; Waske, B.; Bruzzone, L. Extended profiles with morphological attribute filters for the analysis of hyperspectral data. Int. J. Remote Sens. 2010, 31, 5975–5991. [Google Scholar] [CrossRef]
- Ghamisi, P.; Souza, R.; Benediktsson, J.A.; Zhu, X.X.; Rittner, L.; Lotufo, R.A. Extinction profiles for the classification of remote sensing data. IEEE Trans. Geosci. Remote Sens. 2016, 54, 5631–5645. [Google Scholar] [CrossRef]
- Dalla Mura, M.; Benediktsson, J.A.; Waske, B.; Bruzzone, L. Morphological attribute profiles for the analysis of very high resolution images. IEEE Trans. Geosci. Remote Sens. 2010, 48, 3747–3762. [Google Scholar] [CrossRef]
- Achanta, R.; Shaji, A.; Smith, K.; Lucchi, A.; Fua, P.; Süsstrunk, S. SLIC superpixels compared to state-of-the-art superpixel methods. IEEE Trans. Pattern Anal. Mach. Intell. 2012, 34, 2274–2282. [Google Scholar] [CrossRef] [PubMed] [Green Version]
- Volpi, M.; Ferrari, V. Semantic segmentation of urban scenes by learning local class interactions. In Proceedings of the IEEE CVPR 2015 Workshop Looking from above: When Earth Observation Meets Vision (EARTHVISION), Boston, MA, USA, 12 June 2015; pp. 1–9. [Google Scholar]
- Russakovsky, O.; Deng, J.; Su, H.; Krause, J.; Satheesh, S.; Ma, S.; Huang, Z.; Karpathy, A.; Khosla, A.; Bernstein, M. Imagenet large scale visual recognition challenge. Int. J. Comput. Vis. 2015, 115, 211–252. [Google Scholar] [CrossRef] [Green Version]
- Krizhevsky, A.; Sutskever, I.; Hinton, G.E. Imagenet classification with deep convolutional neural networks. In Proceedings of the Advances in Neural Information Processing Systems 25 (NIPS 2012), Lake Tahoe, NV, USA, 3–8 December 2012; pp. 1097–1105. [Google Scholar]
- Szegedy, C.; Liu, W.; Jia, Y.; Sermanet, P.; Reed, S.; Anguelov, D.; Erhan, D.; Vanhoucke, V.; Rabinovich, A. Going deeper with convolutions. In Proceedings of the IEEE Conference on Computer Vision and Pattern Recognition (CVPR), Boston, MA, USA, 8–10 June 2015; pp. 1–9. [Google Scholar]
- He, K.; Zhang, X.; Ren, S.; Sun, J. Deep residual learning for image recognition. In Proceedings of the IEEE Conference on Computer Vision and Pattern Recognition (CVPR), Las Vegas, NV, USA, 26 June–1 July 2016; pp. 770–778. [Google Scholar]
- Zhou, B.; Khosla, A.; Lapedriza, A.; Oliva, A.; Torralba, A. Learning deep features for discriminative localization. In Proceedings of the IEEE Conference on Computer Vision and Pattern Recognition (CVPR), Las Vegas, NV, USA, 27–30 June 2016; pp. 2921–2929. [Google Scholar]
Figure 1.
The spatial relationship of four-level information.

Figure 2.
Flowchart of the proposed classification method based on different level information.

Figure 3.
Multi-scale scene images extraction process. (a) Very high resolution (VHR) remotely sensed imagery. (b) The superpixels generated by simple linear iterative clustering (SLIC). The red area is a superpixel, and its central position is displayed as the blue point. The yellow boxes represent the regions of extracting scene images.

Figure 4.
Illustration of scene-level feature representation based on the object-based convolutional neural network (CNN) model.
Figure 4.
Illustration of scene-level feature representation based on the object-based convolutional neural network (CNN) model.

Figure 5.
The experimental hyperspectral data (GRSS_DFC2018) and its corresponding ground truth. (a) Original images (R-G-B). (b) Ground truth image. (c) Detailed information of the labeled samples.
Figure 5.
The experimental hyperspectral data (GRSS_DFC2018) and its corresponding ground truth. (a) Original images (R-G-B). (b) Ground truth image. (c) Detailed information of the labeled samples.

Figure 6.
Experimental images from the Zurich dataset and related ground truth images. (a) The image zh9 (NIR-R-G). (b) Ground truth map of zh9. (c) The image zh17 (NIR-R-G). (d) Ground truth map of zh17. (e) Detailed information of the labeled samples for the two images.
Figure 6.
Experimental images from the Zurich dataset and related ground truth images. (a) The image zh9 (NIR-R-G). (b) Ground truth map of zh9. (c) The image zh17 (NIR-R-G). (d) Ground truth map of zh17. (e) Detailed information of the labeled samples for the two images.

Figure 7.
(a) The correlation coefficient between the scene-level features of different size scene images. (b) The influence of the scene image size on the classification accuracy based on different CNN models.
Figure 7.
(a) The correlation coefficient between the scene-level features of different size scene images. (b) The influence of the scene image size on the classification accuracy based on different CNN models.

Figure 8.
The classification performances based on the scene-level features of different size scene images and multi-scale fusion scene-level features. (a) GRSS_DFC2018, (b) zh9 and (c) zh17.
Figure 8.
The classification performances based on the scene-level features of different size scene images and multi-scale fusion scene-level features. (a) GRSS_DFC2018, (b) zh9 and (c) zh17.

Figure 9.
Classification results on zh9 data set, with (a) the ground truth, the classification results based on (b) original reflection features, (c) MAPs features, (d) scene-level features and (e) multi-level features. The scene-level features were constructed by the CNN model GoogLeNet.
Figure 9.
Classification results on zh9 data set, with (a) the ground truth, the classification results based on (b) original reflection features, (c) MAPs features, (d) scene-level features and (e) multi-level features. The scene-level features were constructed by the CNN model GoogLeNet.

Figure 10.
Classification results on zh17 data set, with (a) the ground truth, the classification results based on (b) original reflection features, (c) MAPs features, (d) scene-level features and (e) multi-level features. The scene-level features were constructed by the CNN model GoogLeNet.
Figure 10.
Classification results on zh17 data set, with (a) the ground truth, the classification results based on (b) original reflection features, (c) MAPs features, (d) scene-level features and (e) multi-level features. The scene-level features were constructed by the CNN model GoogLeNet.

Figure 11.
The importance of different level features for land use and land cover (LULC) classification. (a) GRSS_DFC2018, (b) zh9 and (c) zh17.
Figure 11.
The importance of different level features for land use and land cover (LULC) classification. (a) GRSS_DFC2018, (b) zh9 and (c) zh17.

Figure 12.
The class-specific discriminative regions of different sized scene images generated by the trained CNN models (these examples were from GRSS_DFC2018, and GoogLeNet was used to create class activation mapping (CAM) maps).
Figure 12.
The class-specific discriminative regions of different sized scene images generated by the trained CNN models (these examples were from GRSS_DFC2018, and GoogLeNet was used to create class activation mapping (CAM) maps).


Table 1.
Comparison of classification accuracy obtained based on single-level features and multi-level features for GRSS_DFC2018. The scene-level features were constructed by the CNN model GoogLeNet.
Table 1.
Comparison of classification accuracy obtained based on single-level features and multi-level features for GRSS_DFC2018. The scene-level features were constructed by the CNN model GoogLeNet.
| Class | Original Feature | MAPs | Scene-Level Feature | Multi-Level Feature |
|---|---|---|---|---|
| Healthy grass | 75.85 | 87.55 | 77.67 | 87.85 |
| Stressed grass | 90.24 | 95.45 | 93.53 | 95.57 |
| Artificial turf | 85.59 | 99.70 | 100.00 | 100.00 |
| Evergreen trees | 87.72 | 96.77 | 93.33 | 97.13 |
| Deciduous trees | 31.73 | 71.14 | 88.15 | 88.74 |
| Bare earth | 64.71 | 99.35 | 99.92 | 99.99 |
| Water | 84.24 | 99.71 | 97.58 | 100.00 |
| Residential buildings | 64.43 | 94.71 | 99.58 | 99.15 |
| Non-residential buildings | 93.02 | 98.76 | 98.89 | 99.44 |
| Roads | 46.23 | 82.02 | 91.00 | 91.28 |
| Sidewalks | 43.99 | 72.37 | 81.95 | 81.27 |
| Crosswalks | 0.45 | 7.22 | 35.64 | 21.19 |
| Major thoroughfares | 53.51 | 90.81 | 95.97 | 96.40 |
| Highways | 51.86 | 87.51 | 95.90 | 95.35 |
| Railways | 53.53 | 99.23 | 97.77 | 99.85 |
| Paved parking lots | 62.98 | 96.44 | 97.31 | 98.90 |
| Unpaved parking lots | 88.69 | 99.28 | 100.00 | 100.00 |
| Cars | 16.34 | 90.68 | 92.70 | 94.69 |
| Trains | 26.58 | 93.83 | 99.76 | 99.18 |
| Stadium seats | 66.71 | 98.44 | 99.65 | 99.95 |
| Overall accuracy (%) | 73.68 | 92.96 | 95.45 | 96.16 |
| Kappa coefficient (κ) | 0.65 | 0.91 | 0.94 | 0.95 |
Table 2.
Comparison of classification accuracy obtained based on single-level features and multi-level features for zh9. The scene-level features were constructed by the CNN model GoogLeNet.
Table 2.
Comparison of classification accuracy obtained based on single-level features and multi-level features for zh9. The scene-level features were constructed by the CNN model GoogLeNet.
| Class | Original Feature | MAPs | Scene-Level Feature | Multi-Level Feature |
|---|---|---|---|---|
| Roads | 67.95 | 83.85 | 95.80 | 95.72 |
| Buildings | 78.11 | 90.84 | 96.23 | 97.08 |
| Trees | 92.04 | 96.84 | 92.24 | 97.31 |
| Grass | 75.08 | 90.19 | 96.36 | 97.38 |
| Bare Soil | 22.35 | 97.27 | 94.97 | 99.32 |
| Water | 33.92 | 97.47 | 96.06 | 99.09 |
| Railways | 8.09 | 72.26 | 96.29 | 95.40 |
| Overall accuracy (%) | 74.32 | 88.83 | 95.58 | 96.63 |
| Kappa coefficient (κ) | 0.60 | 0.83 | 0.93 | 0.95 |
Table 3.
Classification accuracy obtained based on single-level features and multi-level features for zh17. The scene-level features were constructed by the CNN model GoogLeNet.
Table 3.
Classification accuracy obtained based on single-level features and multi-level features for zh17. The scene-level features were constructed by the CNN model GoogLeNet.
| Class | Original Feature | MAPs | Scene-Level Feature | Multi-Level Feature |
|---|---|---|---|---|
| Roads | 77.21 | 90.31 | 95.93 | 94.27 |
| Buildings | 73.77 | 89.58 | 95.62 | 95.15 |
| Trees | 78.63 | 88.47 | 92.70 | 92.31 |
| Grass | 82.22 | 90.07 | 92.62 | 94.98 |
| Bare Soil | 32.79 | 79.30 | 98.71 | 94.40 |
| Water | 14.35 | 54.47 | 71.79 | 73.70 |
| Swimming Pools | 82.04 | 96.46 | 96.83 | 97.11 |
| Overall accuracy (%) | 75.94 | 89.00 | 94.15 | 93.99 |
| Kappa coefficient (κ) | 0.69 | 0.86 | 0.92 | 0.92 |
Table 4.
Classification accuracies for the University of Pavia data set. Multi-level feature represents our proposed classification method based on multi-level information. MCNN refers to the classification method based on multi-scale and deep representations [34]. The best accuracy of each class is marked in bold.
| Class | Multi-Level Feature | MCNN |
|---|---|---|
| Asphalt | 97.19 | 98.10 |
| Meadow | 99.09 | 94.58 |
| Gravel | 99.76 | 98.43 |
| Tree | 99.27 | 99.09 |
| Metal sheet | 99.61 | 100 |
| Bare soil | 99.80 | 97.45 |
| Bitumen | 100 | 99.10 |
| Brick | 97.77 | 99.05 |
| Shadow | 100 | 99.58 |
| Overall accuracy (%) | 98.87 | 96.78 |
| Kappa coefficient (κ) | 0.99 | 0.96 |
© 2019 by the authors. Licensee MDPI, Basel, Switzerland. This article is an open access article distributed under the terms and conditions of the Creative Commons Attribution (CC BY) license (http://creativecommons.org/licenses/by/4.0/).
Share and Cite
MDPI and ACS Style
Li, E.; Samat, A.; Liu, W.; Lin, C.; Bai, X. High-Resolution Imagery Classification Based on Different Levels of Information. Remote Sens. 2019, 11, 2916. https://doi.org/10.3390/rs11242916
AMA Style
Li E, Samat A, Liu W, Lin C, Bai X. High-Resolution Imagery Classification Based on Different Levels of Information. Remote Sensing. 2019; 11(24):2916. https://doi.org/10.3390/rs11242916
Chicago/Turabian StyleLi, Erzhu, Alim Samat, Wei Liu, Cong Lin, and Xuyu Bai. 2019. "High-Resolution Imagery Classification Based on Different Levels of Information" Remote Sensing 11, no. 24: 2916. https://doi.org/10.3390/rs11242916
Note that from the first issue of 2016, this journal uses article numbers instead of page numbers. See further details here.