Article

Evaluation of PERSIANN-CDR Constructed Using GPCP V2.2 and V2.3 and A Comparison with TRMM 3B42 V7 and CPC Unified Gauge-Based Analysis in Global Scale

1
Center for Hydrometeorology and Remote Sensing (CHRS), The Henry Samueli School of Engineering, Department of Civil and Environmental Engineering, University of California, Irvine, CA 92697, USA
2
Universities Space Research Association, Mountain View, CA 94043, USA
3
Department of Earth System Science, University of California Irvine, 3200 Croul Hall, Irvine, CA 92697-2175, USA
*
Author to whom correspondence should be addressed.
Remote Sens. 2019, 11(23), 2755; https://doi.org/10.3390/rs11232755
Submission received: 4 October 2019 / Revised: 21 November 2019 / Accepted: 21 November 2019 / Published: 23 November 2019
(This article belongs to the Special Issue Precipitation and Water Cycle Measurements Using Remote Sensing)

Abstract

:
Providing reliable long-term global precipitation records at high spatial and temporal resolutions is crucial for climatological studies. Satellite-based precipitation estimations are a promising alternative to rain gauges for providing homogeneous precipitation information. Most satellite-based precipitation products suffer from short-term data records, which make them unsuitable for various climatological and hydrological applications. However, Precipitation Estimation from Remotely Sensed Information using Artificial Neural Networks-Climate Data Record (PERSIANN-CDR) provides more than 35 years of precipitation records at 0.25° × 0.25° spatial and daily temporal resolutions. The PERSIANN-CDR algorithm uses monthly Global Precipitation Climatology Project (GPCP) data, which has been recently updated to version 2.3, for reducing the biases in the output of the PERSIANN model. In this study, we constructed PERSIANN-CDR using the newest version of GPCP (V2.3). We compared the PERSIANN-CDR dataset that is constructed using GPCP V2.3 (from here on referred to as PERSIANN-CDR V2.3) with the PERSIANN-CDR constructed using GPCP V2.2 (from here on PERSIANN-CDR V2.2), at monthly and daily scales for the period from 2009 to 2013. First, we discuss the changes between PERSIANN-CDR V2.3 and V2.2 over the land and ocean. Second, we evaluate the improvements in PERSIANN-CDR V2.3 with respect to the Climate Prediction Center (CPC) unified gauge-based analysis, a gauged-based reference, and Tropical Rainfall Measuring Mission (TRMM 3B42 V7), a commonly used satellite reference, at monthly and daily scales. The results show noticeable differences between PERSIANN-CDR V2.3 and V2.2 over oceans between 40° and 60° latitude in both the northern and southern hemispheres. Monthly and daily scale comparisons of the two bias-adjusted versions of PERSIANN-CDR with the above-mentioned references emphasize that PERSIANN-CDR V2.3 has improved mostly over the global land area, especially over the CONUS and Australia. The updated PERSIANN-CDR V2.3 data has replaced V2.2 data for the 2009–2013 period on CHRS data portal and NOAA National Centers for Environmental Information (NCEI) Program.

Graphical Abstract

1. Introduction

Precipitation is widely recognized as the driving component of the global water cycle, and has a significant impact on climatic patterns [1]. Providing reliable long-term global precipitation records at high spatial and temporal resolutions is crucial for climatological studies [2,3,4,5]. Gauge, radar, and satellite instruments are the primary methods for precipitation measurements. Ground-based rain gauge networks represent the most direct means for precipitation measurements, and also provide the longest historical precipitation records [6,7]. Several global gauge-based precipitation datasets have been developed for climatological studies by interpolating long-term in-situ observations. The Climate Prediction Center (CPC) global unified gauge-based analysis of daily precipitation is one of the most well-known gauged-based products, which reports global land precipitation information with a resolution of 0.5° × 0.5° from 1979 to present [8,9]. However, global gauge-based observations are limited due to inadequate and sparse networks of stations over land, especially in remote areas, and lack of data over oceans [10,11,12]. Moreover, extending point observations to a gridded rainfall dataset introduces another drawback for rain gauges and a decisive source of uncertainty [13]. Radar networks are viable alternatives for rain gauge networks due to their continuous precipitation measurements with high temporal and spatial resolutions [14]. However, radars do not cover remote regions and ocean regions. Furthermore, establishing and maintaining a radar network with global coverage is difficult due to accessibility and financial limitations [15,16].
Due to the limitations of both ground-based rain gauges and radar networks, satellite-based quantitative precipitation estimates are promising alternatives for providing homogeneous precipitation estimation with high spatial and temporal resolutions and global coverage [6,17,18,19,20]. Over recent decades, several satellite-based precipitation datasets have been constructed with different spatial and temporal resolutions. As specified by the World Meteorological Organization, more than 30 years of data is needed for global and regional climate studies [21]. Current well-known satellite-based and satellite + gauge precipitation datasets suffer from coarse spatial and/or coarse temporal resolution, or from periods of record too short for climatological studies. For example, the Global Precipitation Climatology Project (GPCP) is a global monthly precipitation dataset with a spatial resolution of 2.5°, which provides information from 1979 to the present [22,23,24]. GPCP merges gauge observations with low-orbit and geosynchronous-orbit satellite information and is one the most commonly used products for climate studies [24]. However, its coarse spatial and temporal resolutions limit the capability of capturing the spatial details and dynamics of extreme precipitation events [25]. Higher spatiotemporal resolution precipitation products are needed for studying the diurnal cycle and are essential for hydrological modeling studies [26,27,28]. The Tropical Rainfall Measuring Mission (TRMM) project at the National Aeronautics and Space Administration (NASA) provides TRMM 3B42 V7, which is a satellite-based precipitation product with a 0.25° × 0.25° spatial resolution and a three-hourly temporal resolution beginning from 1998 [29]. Similarly, the Climate Prediction Center at the National Oceanic and Atmospheric Administration (NOAA) developed a product named NOAA-CPC morphing technique (CMORPH Version 1.0), which provides precipitation estimates with three spatial and temporal resolutions (8 km—30 min, 0.25°—3 hourly, and 0.25°—daily) starting from 1998 [30]. These two products are among the most well-known satellite-based precipitation estimation algorithms; however, their precipitation estimation records are too short to be utilized for climatological studies.
Among different remotely sensed satellite precipitation products, Precipitation Estimation from Remotely Sensed Information and Artificial Neural Networks-Climate Data Record (PERSIANN-CDR) is an attractive candidate for climatological studies [31]. PERSIANN-CDR is attractive for climatological studies for two reasons. First, its higher spatial and temporal resolution. Compared to GPCP, PERSIANN-CDR provides higher spatial (0.25° × 0.25°) and temporal (daily) resolution precipitation estimates, which addresses the need for capturing the spatial and temporal variability of precipitations for climate studies [25]. Second, its longer record of data. PERSIANN-CDR provides a relatively longer record of precipitation estimates with 36+ years of data (starting from 1983) in comparison to TRMM 3B42 V7 and CMORPH with 21-year records. PERSIANN-CDR has been widely used for different applications requiring long-term data, such as developing intensity–duration–frequency (IDF) curves [32,33,34], monitoring drought [5,35,36,37], identifying trends in precipitation and extreme events [38,39,40,41], and simulating stream flow [42,43,44,45,46,47,48,49,50].
The PERSIANN-CDR product is constructed from the PERSIANN algorithm using GridSat-B1 infrared information as input [51,52]. Due to the sensitivity of satellite-based precipitation algorithms to precipitation type (rain or snow), underestimation of orographic rainfall, and systematic biases in mountainous regions, most satellite-based algorithms apply a ground-based observation to bias-adjust their estimations [29,53]. The PERSIANN-CDR algorithm utilizes 2.5° × 2.5° monthly GPCP precipitation information in order to reduce the biases in the output of the PERSIANN model. By doing this, PERSIANN-CDR precipitation estimation becomes consistent with the monthly GPCP Satellite-Gauge product at 2.5° × 2.5° spatial resolution while still preserving the daily spatial rainfall estimation from the PERSIANN algorithm. Recently, GPCP has been updated to version 2.3 in order to improve the quality and homogeneity of the product. These updates include adjustments in the cross-calibration procedures of satellite inputs due to transitions from previous sensors to new ones. The first sensor change was transitioning from the TIROS Operational Vertical Sounder (TOVS) to the Atmospheric Infrared Sounder (AIRS)/Advanced Microwave Sounding Unit (AMSU) in 2003, both of which are used for precipitation estimation for high latitudes. Next, the Special Sensor Microwave Imager (SSMI) sensor was superseded by the Special Sensor Microwave Imager/Sounder (SSMIS) in 2009. Both SSMI and SSMIS play important roles in providing information for low-latitude precipitation estimation over both land and oceans. In addition to the above-mentioned updates in satellite sensors, a new set of gauge analyses computed by the by the Global Precipitation Climatology Centre, GPCC V7 Full analysis, was used for updating precipitation estimation over land for the period between 1979 and 2013. The impact of using the GPCC Monitoring product for the years after 2013 is under investigation. [54]. Adler et al. [54] covers the improvements in the new version of GPCP (V2.3) from the previous version (V2.2). Their results show that the total global precipitation estimated for GPCP V2.3 increased by 1.8% over oceans for the post-2002 period and 1.8% over land for the years after 2009. The changes applied in GPCP V2.3 also correct small errors in GPCP V2.2 estimates, which are significant for investigating the changes in inter-annual rainfall variabilities (e.g., due to El Niño—Southern Oscillation (ENSO)) and trends over large areas.
Since PERSIANN-CDR has been a widely used precipitation estimation product for climate studies in the scientific community, it is vital to continuously improve and evaluate the quality of this product [31]. In this study, we employed a similar method for constructing PERSIANN-CDR with the new version of GPCP (V2.3), which is discussed in the methodology section. The newly constructed version of PERSIANN-CDR with GPCP V2.3, called PERSIANN-CDR V2.3, was compared and evaluated with the previous V2.2 version for the period of 2009 to 2013. For comparison, the differences between PERSIANN-CDR V2.3 and the previous version (PERSIANN-CDR V2.2) and also the two latest versions of GPCP (V2.2 and V2.3) at the monthly scale were investigated. The estimation accuracy of the two versions of PERSIANN-CDR was evaluated over land and ocean surfaces using the CPC gauge-based precipitation dataset and the TRMM 3B42 V7 product. The comparison was made at both the monthly and daily scales over the CONUS and the globe. The rest of this paper is organized as follows. Section 2 explains the detailed structure of the datasets. Section 3 provides a description of the methodology. Section 4 discusses the results, along with statistical and visual analyses. Lastly, Section 5 concludes the paper by highlighting the main findings and evaluations.

2. Materials

2.1. Global Precipitation Climatology Project (GPCP) Monthly Product

GPCP is part of the Global Energy and Water Cycle Exchanges (GEWEX) activity under the World Climate Research Program (WCRP). The GPCP monthly 2.5° × 2.5° precipitation product provides consistent global data by merging different satellite-based estimations (passive microwave/infrared) over the land and ocean along with precipitation gauge information from GPCC over the land. More detail on the input data and the merging process can be found in [22,24,55]. Recently, version 2.3 of the GPCP product has been released, which includes updates to the cross-calibration procedures of rainfall estimation and updates in the gauge analysis methods [54]. The GPCP dataset is available via the Earth System Science Interdisciplinary Center (ESSIC) and Cooperative Institute for Climate and Satellites (CICS), University of Maryland College Park (http://gpcp.umd.edu). Additional information can be found in [54].

2.2. CPC Global Unified Gauge-Based Analysis of Daily Precipitation

The CPC Global Unified Gauge-Based Analysis of Daily Precipitation dataset is a National Oceanic and Atmospheric Administration (NOAA) Climate Prediction Center (CPC) product. Across the globe, the CPC unified gauge-based analysis product employs more than 30,000 stations from multiple sources, including Global Telecommunication System (GTS), Cooperative Observer Network (COOP), and other national and international agencies, providing a daily precipitation estimation at a 0.5° × 0.5° spatial resolution from 1979 to the present [56]. Over the CONUS, the CPC unified gauge-based analysis product contains information from more than 8000 stations in order to estimate precipitation with a spatial resolution of 0.25° × 0.25° at the daily scale from 1948 to the present. One of the challenges in producing a gauged-based daily precipitation data set is to handle the reported data from different stations, which use various methods of reporting time [9]. The end of day (EOD) definition for accumulating 24-hour precipitation may differ from one country to another. For example, over the CONUS, the rain rate values are accumulated from 12Z of the day before to 12Z of that day. In this study, we used the finer resolution CPC unified gauge-based analysis dataset for evaluations over the CONUS. In addition, as we discuss in the methodology section, we used a custom variant of the PERSIANN-CDR with the same EOD definition as CPC unified gauge-based analysis for our comparisons over the CONUS. The CPC global unified gauge analysis was used for comparison at the monthly scale over the globe. Both CPC datasets are available for public use (ftp://ftp.cdc.noaa.gov/Datasets). A comprehensive description of the CPC unified gauge-based analysis interpolation algorithm can be found in [8,56,57]

2.3. The Tropical Rainfall Measuring Mission (TRMM 3B42 V7)
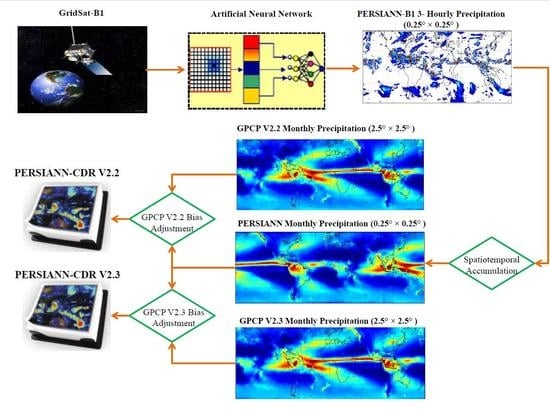
The National Aeronautics and Space Administration (NASA) in cooperation with the Japan Aerospace Exploration Agency (JAXA) launched The Tropical Rainfall Measuring Mission (TRMM) in 1997 in order to measure rainfall information around tropical and subtropical areas. TRMM Multi-Satellite Precipitation Analysis (TMPA), one of the TRMM products, provides 3-hourly precipitation estimates at 0.25° × 0.25° for the latitude band of 50°N to 50°S. In this study, we utilized the daily temporal scale of TRMM 3B42 V7, which was obtained from (https://pmm.nasa.gov/data-access/downloads/trmm). This product derives precipitation by combining information from two different types of satellite sensors: PMW and geostationary-infrared (Geo-IR) sensors. More detailed information can be found in [29]. In this study, the TRMM 3B42 V7 estimates were utilized for evaluating the two versions of PERSIANN-CDR over the ocean and for daily global comparison over the land. We did not use CPC unified gauge-based analysis for daily comparison over land due to its EOD definition, which may vary from one country to another.

2.4. PERSIANN-CDR

The PERSIANN-CDR product was developed by the Center for Hydrometeorology and Remote Sensing (CHRS) at the University of California, Irvine (UCI). This dataset is available as an operational climate data record via the NOAA National Centers for Environmental Information (NCEI) Program (https://www.ncdc.noaa.gov/cdr) and via the CHRS Data Portal (http://chrsdata.eng.uci.edu/). This near-global (60°N–60°S), high-resolution (0.25° × 0.25°), long-term record (from 1983 to present) precipitation product has a daily resolution on UTC days. The PERSIANN-CDR algorithm utilizes GridSat-B1 infrared information [58,59,60] as input and NCEP stage IV hourly precipitation data [61,62,63] to update the model parameters. In order to reduce the bias, this product is bias adjusted with the GPCP precipitation product at a 2.5° × 2.5° and a monthly time scale. Additional details about the PERSIANN-CDR algorithm can be found in [25].

3. Methodology

This study applied the same methodology used in the original PERSIANN-CDR algorithm introduced by [25]. In the first step of the PERSIANN-CDR algorithm, the PERSIANN algorithm [52,64] is applied to GridSat-B1 merged infrared data from GEO satellites. The outcome is called PERSIANN-B1 and it is a 3-hourly precipitation estimate dataset from 1983 to present at a quarter degree resolution for the latitude band 60°N to 60°S. Then, in order to adjust the biases of this dataset, PERSIANN-B1 is temporally aggregated to obtain a monthly scale PERSIANN-B1 dataset to match the GPCP data in temporal resolution. In the same manner, PERSIANN-B1 data with a spatial resolution of 0.25° × 0.25° will be aggregated to match the 2.5° × 2.5° GPCP data. The temporal and spatial aggregations were computed using the following equation:
R PERSIANN B 1 ( i ,   j ) = nd nh ( 10 10 [ r PERSIANN B 1 ( i , j ) thd ] ) .
In Equation (1), R PERSIANN B 1 and r PERSIANN B 1 are the aggregated monthly 2.5° PERSIANN-B1 data and original 3-hourly 0.25° PERSIANN-B1 data, respectively. The i and j are the latitude and longitude of the PERSIANN-B1 at the 0.25° resolution. Similarly, i and j′ are the latitude and longitude of the aggregated PERSIANN-B1 at the 2.5° resolution. thd is a pre-defined threshold to eliminate noisy low-value pixels. As an artifact of the PERSIANN estimation process, small fractions of non-raining pixels are falsely assigned with light rainfall rates. To minimize this effect, we applied a threshold of 0.1 mm/day, which eliminates the falsely assigned light rainfall rates with no rainfall. The nd and nh are the number of days and number of 3-hourly samples in a day, respectively. In the next step, the bias-adjustment weights were calculated for each 2.5° grid cell of monthly data:
w ( i ,   j ) =   R GPCP ( i ,   j ) /   R PERSIANN B 1 ( i ,   j ) ,   0 w 20 ,
where R GPCP is the monthly rain rate of GPCP for a given cell. Due to the linearity of the bias-adjusting technique, the bias-adjustment weights ( w ) at the 2.5° spatial resolution and monthly temporal resolution can be linearly interpolated into its corresponding 10 × 10, 0.25°, 3-hourly PERSIANN-B1 grid cell estimates. The interpolation of w will ensure a smooth and continuous transition of bias-adjustment factors at the 0.25° resolution:
Adj_r PERSIANN B 1 ( i , j ) =   w ( i , j )   r PERSIANN B 1 ( i , j ) ,
where Adj_rPERSIANN−B1 is the GPCP-adjusted 3-hourly 0.25° PERSIANN-B1 precipitation data. In the final step of PERSIANN-CDR preparation, 3-hourly PERSIANN-B1 data were aggregated to the daily scale to reduce uncertainties:
PERSIANN-CDR   ( i , j ) = n = 1 N Adj r PERSIANN B 1 ( i , j , n ) ,
where N is the number of 3-hourly Adj r PERSIANN B 1 data for each day. Data for each 3-hourly file were accumulated on a pixel-by-pixel basis and then converted to 24 h if N was more than 4 out of 8 per day.
It should be noted that we accumulated 3-hourly PERSIANN-B1 with two different EOD definitions in order for each to be consistent with TRMM 3b42 V7 or the CPC CONUS dataset.
In the first part of this study, we determined the amount of change between the two bias-adjusted versions of PERSIANN-CDR and two versions of GPCP (V2.2 and V2.3) at monthly scales from 2009 to 2013. Both versions of PERSIANN-CDR at the daily scale were aggregated to the monthly time scale. To determine the amount of change, we used the mean absolute difference (MAD) (Equation (5)). The relative mean absolute difference (RMAD) was also computed to determine areas in which the percentage of change was more significant (Equation (6)):
MAD =   1 n   i = 1 n | V 2.3 V 2.2 | ,
RMAD =   1 n   i = 1 n | V 2.3 V 2.2 | 1 n   i = 1 n V 2.3 .
In the second part of the analysis, we evaluated the performance of both PERSIANN-CDR V2.2 and V2.3 over global land areas with respect to CPC unified gauge-based analysis and over the ocean with respect to TRMM 3B42 V7 at monthly and daily scales. For the evaluation over land, we re-projected PERSIANN-CDR V2.2 and V2.3 to a 0.5° × 0.5° resolution to be consistent with the CPC unified gauge-based analysis dataset. Two commonly used statistical matrices, the correlation coefficient (CORR) and root mean square error (RMSE) (Equations (7) and (8)), were used for the evaluations. CORR was employed to measure the agreement between PERSIANN-CDR V2.3 and V2.2 with CPC unified gauge-based analysis and TRMM 3B42 V7. RMSE is widely used to measure the error in the estimation of satellite-based datasets compared with observed datasets:
RMSE =   1 n i = 1 n ( Est i Ref i ) 2 ,
CORR =   1 n   i = 1 n ( Est i Est i ¯ ) ( Ref i Ref i ¯ ) σ Est   σ Ref ,
where: Est: Estimation (PERSIANN-CDR V2.2 and V2.3); and Ref: Reference (CPC unified gauge-based analysis and TRMM 3B42 V7).

4. Results and Discussion

4.1. Changes in the PERSIANN-CDR and GPCP Monthly Analysis from V2.2 to V2.3

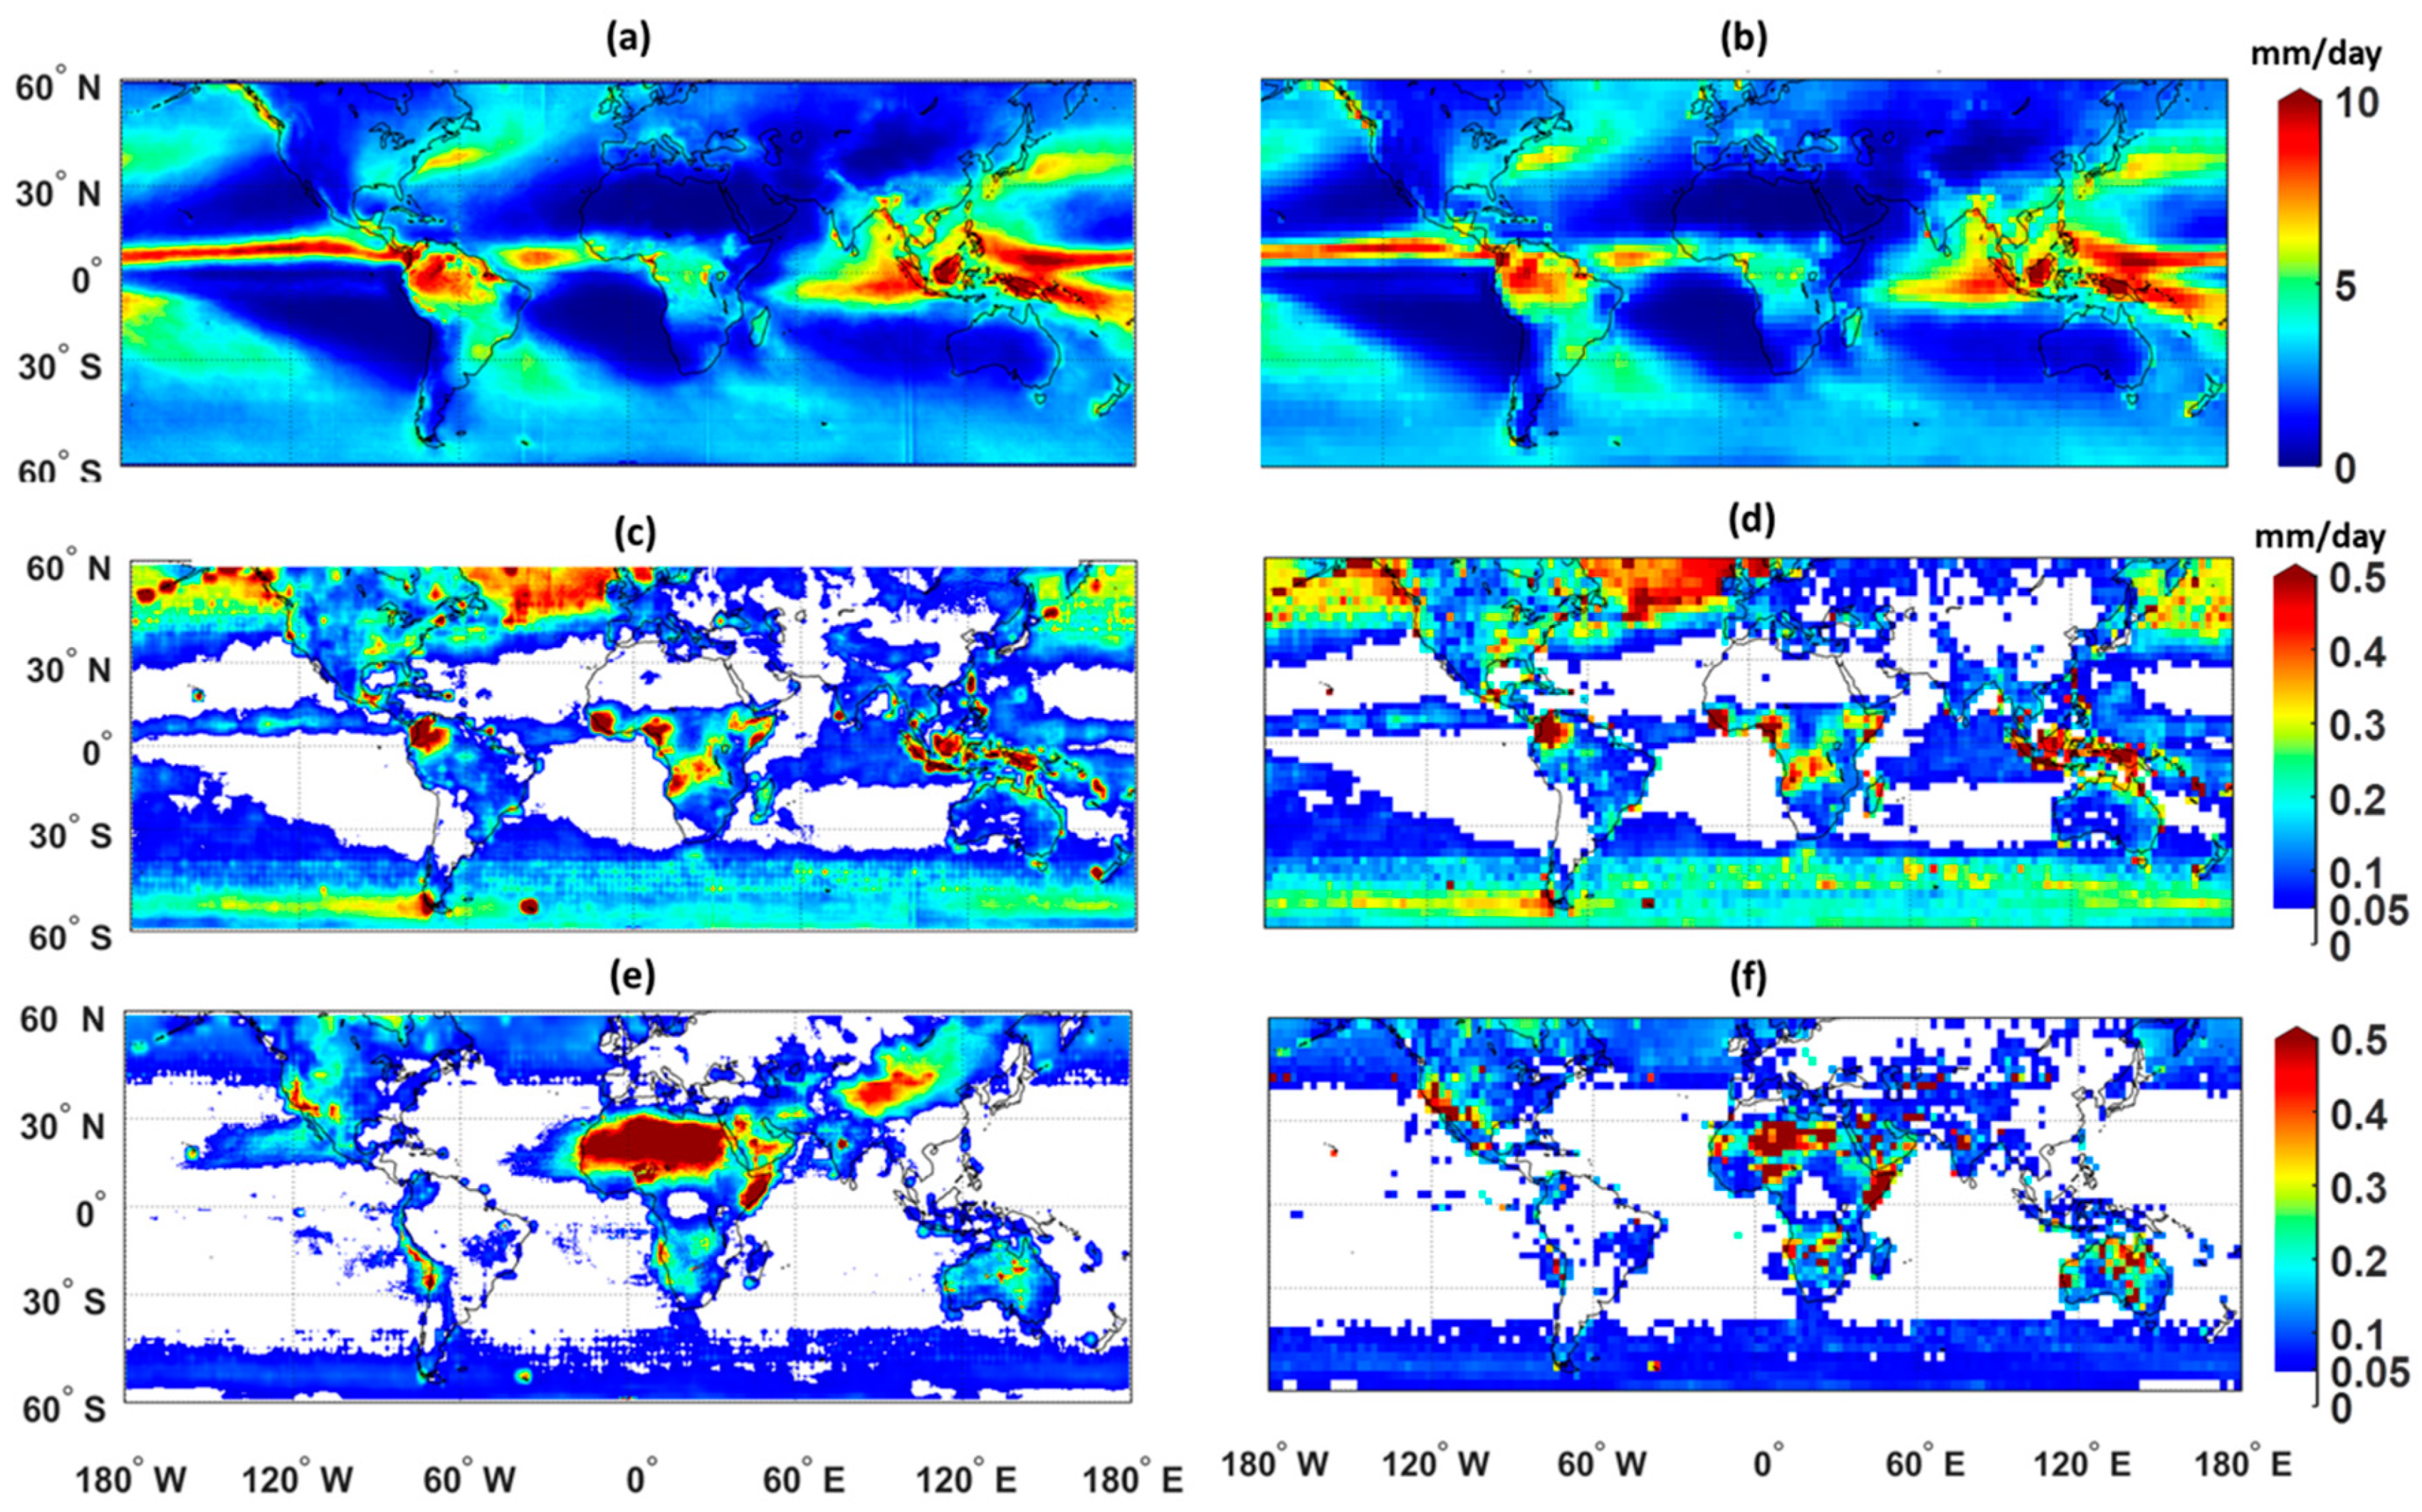
4.1.1. Comparison in Spatial Domain

Figure 1a,b display the mean daily precipitation estimates of PERSIANN-CDR V2.3 and GPCP V2.3 from 2009 to 2013. Both datasets show the same precipitation patterns in annual mean precipitation. This similarity is reasonable since PERSIANN-CDR is bias-adjusted with the GPCP dataset at a monthly scale. Figure 1c,d present the spatial pattern between MAD of the two versions of PERSIANN-CDR and the two versions of GPCP for that period. On average, MAD is approximately 0.07 mm/day for both versions of GPCP and PERSIANN-CDR at a monthly scale in the latitude bands of 60°N to 60°S. The changes in the mean daily precipitation rate exceed 0.3 mm/day between the two versions of PERSIANN-CDR and the two versions of GPCP over the North Atlantic Ocean, the North Pacific Ocean, Northern South America, Central Africa, and Indonesia. Although the absolute difference in the mean daily precipitation pattern reveals the average changes between the two versions of the datasets, it cannot demonstrate the relative importance of these changes in various regions. The spatial pattern of relative differences between the two versions of GPCP and PERSIANN-CDR was calculated to show the percentage of change in the mean daily precipitation rain rate estimation for each pixel. Calculating the relative difference is important because even small differences are critical in arid regions. Figure 1e,f present the RMAD between V2.2 and V2.3 of the PERSIANN-CDR and GPCP products. MAD is more significant over tropical regions and oceans between the latitudes 40° and 60° in both the northern and southern hemispheres, whereas RMAD between the two versions of PERSIANN-CDR is more noticeable over North Africa, Australia, north China, Mongolia, and southeastern Russia. These regions receive substantially less rainfall than other parts of globe; therefore, small changes in the new versions of GPCP and consequently PERSIANN-CDR V2.3 could create significant variations in RMAD.

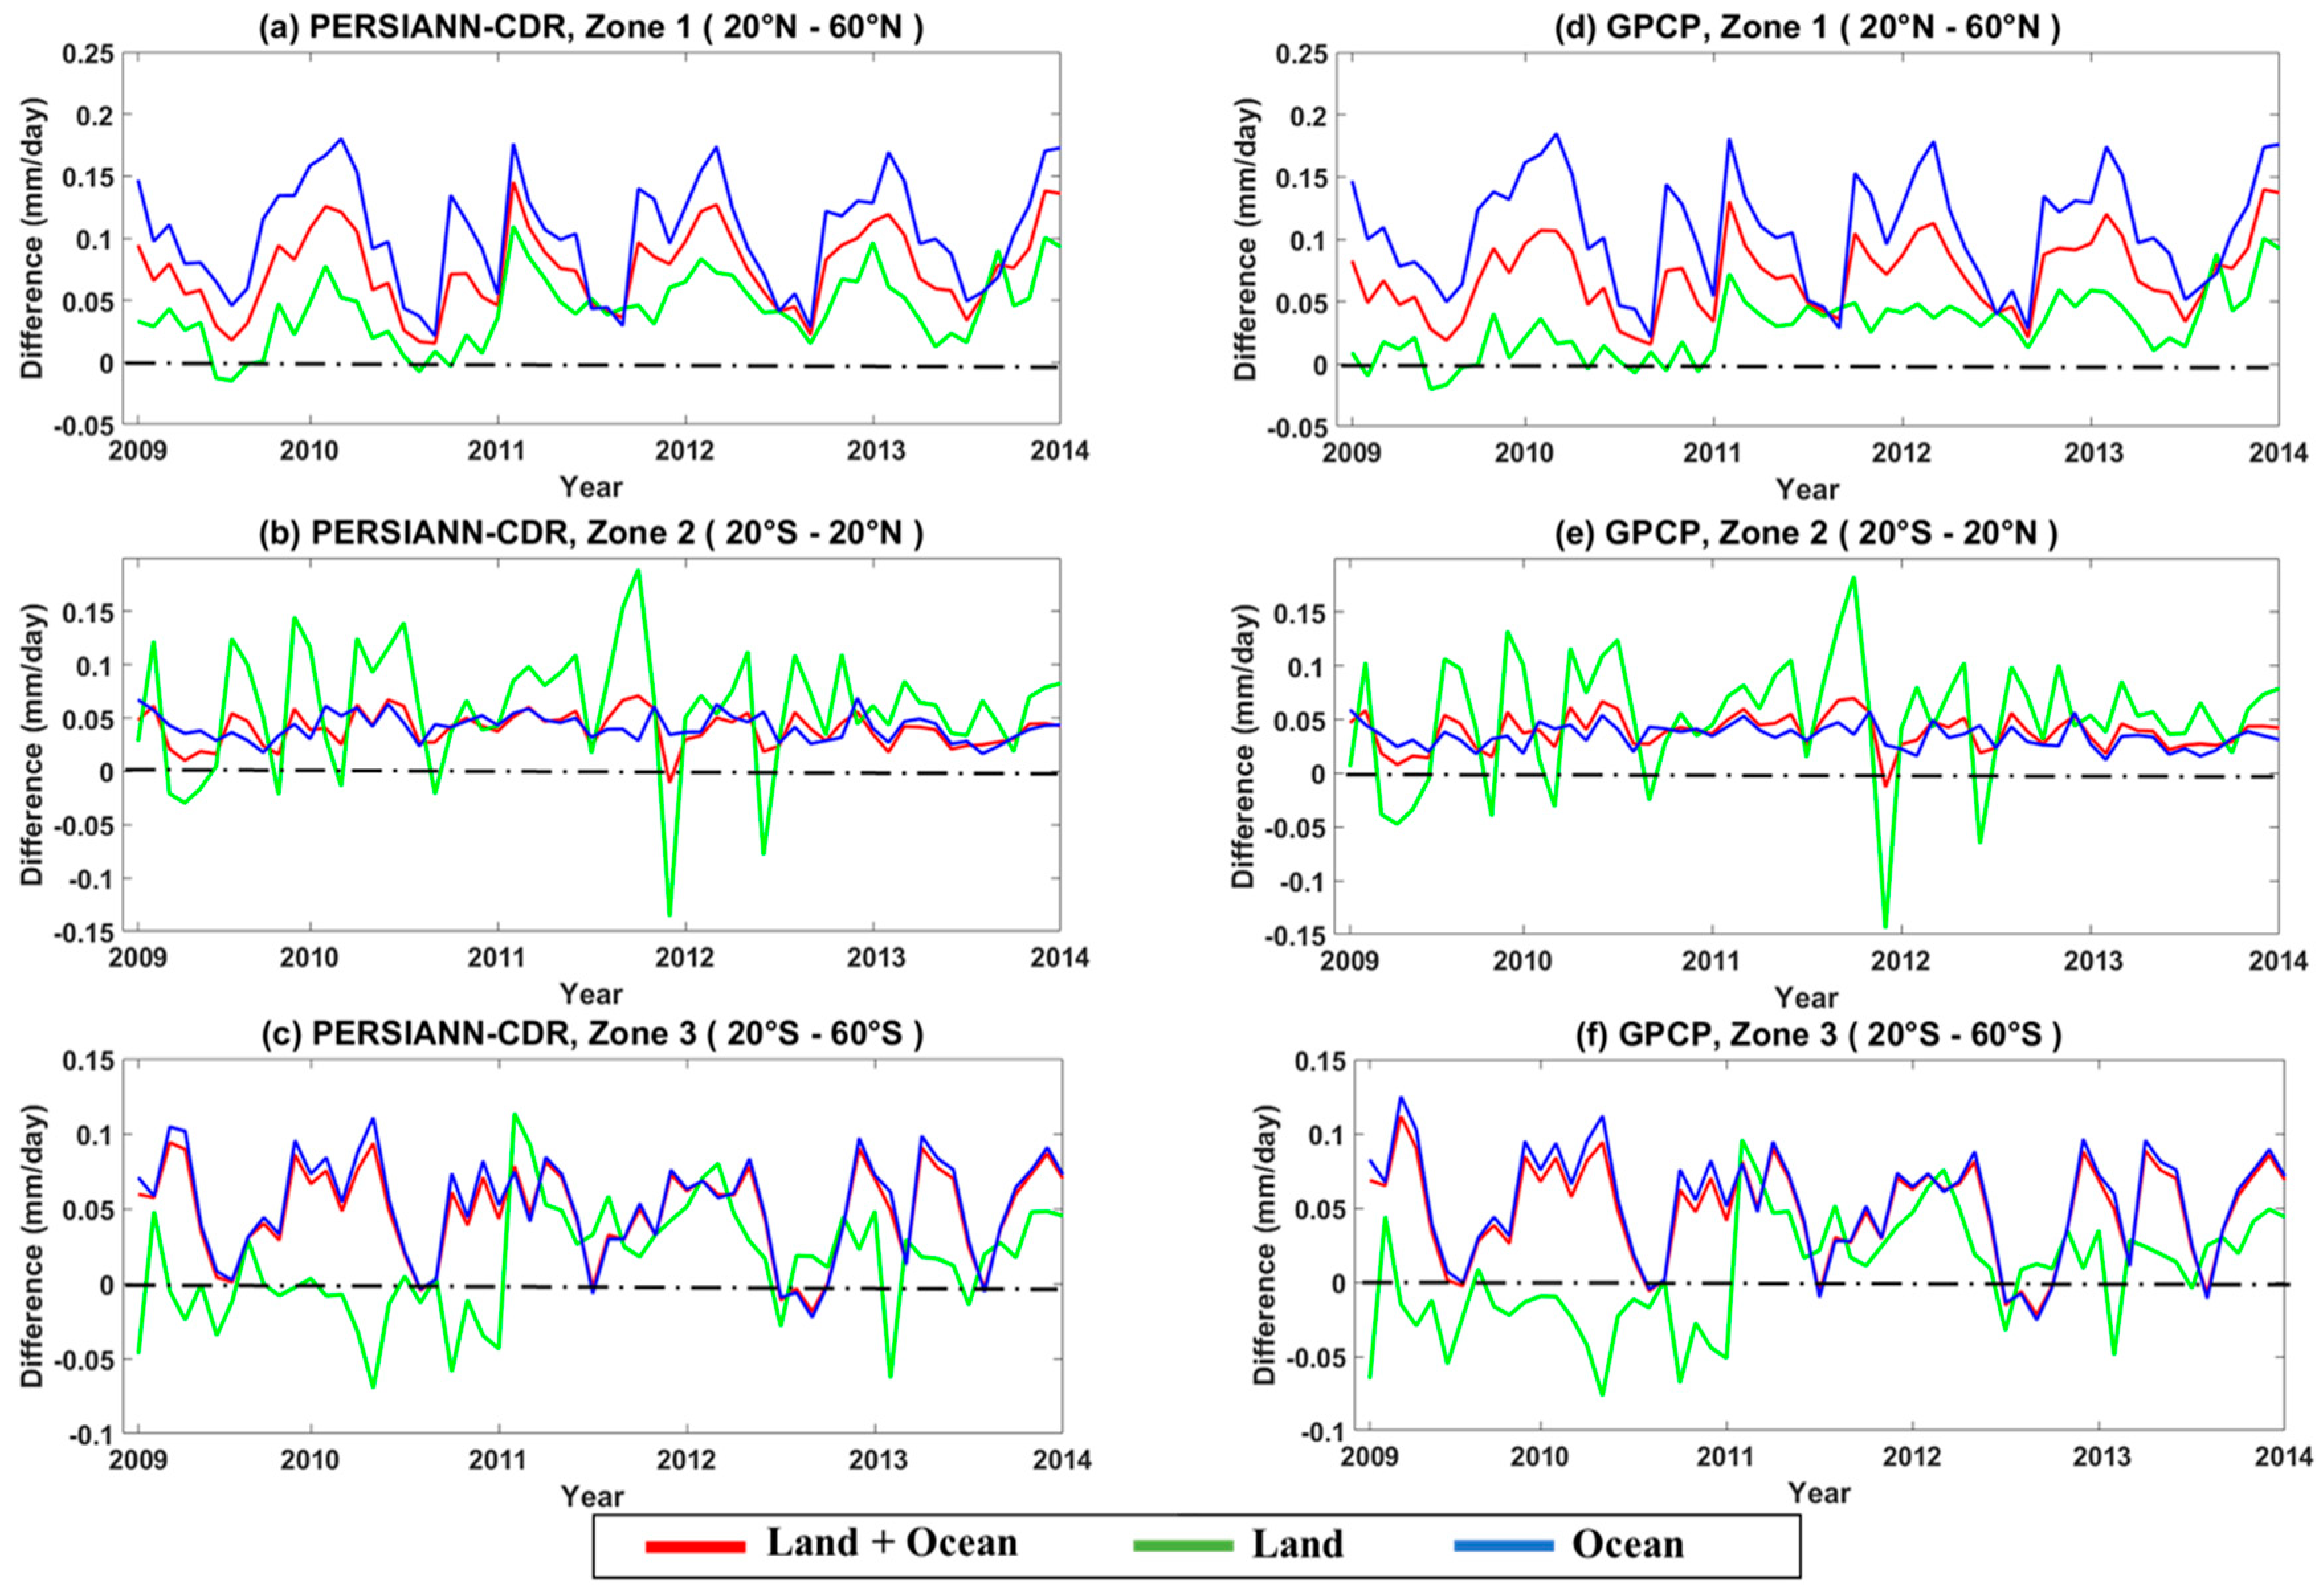
4.1.2. Comparison in Temporal Domain

Figure 2 shows the time series of differences between the mean monthly precipitation estimates for the two versions of PERSIANN-CDR (V2.2 and V2.3) and two versions of GPCP (V2.2 and V2.3) across three latitude bands. The analysis was done for tropical (20°S–20°N) and subtropical (60°S–20°S and 20°N–60°N) bands. As shown in Figure 2, changes between the two versions of PERSIANN-CDR (V2.2 and 2.3) and the two GPCP (V2.2 and 2.3) for tropical and subtropical zones over the land and ocean are the same, demonstrating that PERSIANN-CDR follows the GPCP in this regard. Over the ocean, the changes are more noticeable over subtropical regions, where the differences (V2.3–V2.2) vary between 0.02 to 0.19 mm/day in the northern hemisphere, and −0.02 to 0.13 mm/day in the southern hemisphere. These findings are consistent with those in Adler et al. [43], where they showed that corrections in the new version of GPCP result in higher rainfall accumulations over the oceans, especially in the higher latitudes and after 2003. Over oceans, most of the changes are primarily due to the sensor shifting from TOVS to AIRS for GPCP estimates, which consequently affects the PERSIANN-CDR product. Whereas GPCP V2.2 employed TOVS data for precipitation estimates, GPCP V2.3 uses TOVS estimates before 2003 and different versions of AIRS data (based on availability of sensors) thereafter. TOVS and AIRS data are utilized for precipitation estimation at high latitudes over both land and ocean; however, changes over land are discounted after merging with the gauge information [54]. Over land, the difference between the two versions of PERSIANN-CDR and the corresponding versions of GPCP are more detectable over tropical regions than over other land regions. The changes ranged between −0.01 to 0.11 mm/day but are generally positive, showing an increase in precipitation estimates over land for both PERSIANN-CDR V2.3 and their corresponding versions of GPCP. These variations are mainly related to the change from the GPCC monitoring product in GPCP V2.2 to the GPCC V7 full analysis in GPCP V2.3 for the time period used (2009–2013).

4.2. Monthly Evaluation of the Two Versions of PERSIANN-CDR

In this section, the performance of the two versions of PERSIANN-CDR is evaluated against the CPC gauge-based observation dataset, over the CONUS, and against TRMM 3B42 V7 over water bodies and global land areas at monthly time scales.

4.2.1. Evaluation over the CONUS

Figure 3 presents the spatial correlation and root mean squared error (mm/day) of PERSIANN-CDR V2.3 and V2.2 with respect to CPC unified gauge-based analysis over CONUS from 2009 to 2013. As mentioned in the data section, we utilized CPC unified gauge-based analysis at the 0.25° × 0.25° spatial resolution for evaluation over the CONUS. Locations with higher CORR values in Figure 3c show where PERSIANN-CDR V2.3 has improved in terms of its correlation with CPC unified gauge-based analysis. Locations with lower RMSE values in Figure 3f show where PERSIANN-CDR V2.3 has a lower RMSE compared with PERSIANN-CDR V2.2. The performance of PERSIANN-CDR V2.3 is noticeably improved over the eastern and northeastern regions of the United States. The highest improvement can be detected over the states of Virginia, New York, Pennsylvania, Wyoming, Idaho, and Oregon, where correlation improved by approximately 14% and RMSE decreased by 0.15 mm/day. Figure 4 shows the time series of the average RMSE and CORR for PERSIANN-CDR V2.3 (red) and V2.2 (blue) against CPC unified gauge-based analysis over CONUS. As shown, PERSIANN-CDR V2.3 outperforms the previous version in terms of the correlation coefficient and RMSE throughout the studied period. Furthermore, the highest correlation and the lowest RMSE values are observed in June and July, when lower amounts of rainfall are observed compared to the other months of the year for both versions of PERSIANN-CDR (not shown).
In order to investigate the statistical behavior of various performance evaluation metrics computed for both versions of PERSIANN-CDR, frequency distribution histograms for bias, RMSE, R99p, and R95p are presented in Figure 5. As can be seen in each histogram, the distribution of PERSIANN-CDR V2.3 has mean values closer to optimal (zero). The mean values closer to zero suggest that the precipitation estimation accuracy of PERSIANN-CDR V2.3 has improved compared to PERSIANN-CDR V2.2. For extreme events, both versions of PERSIANN-CDR tend to underestimate the rain rate, as the 95th (R95p) and 99th (R99p) percentiles indicate. However, the error of PERSIANN-CDR V2.3 for extreme events is less than V2.2.

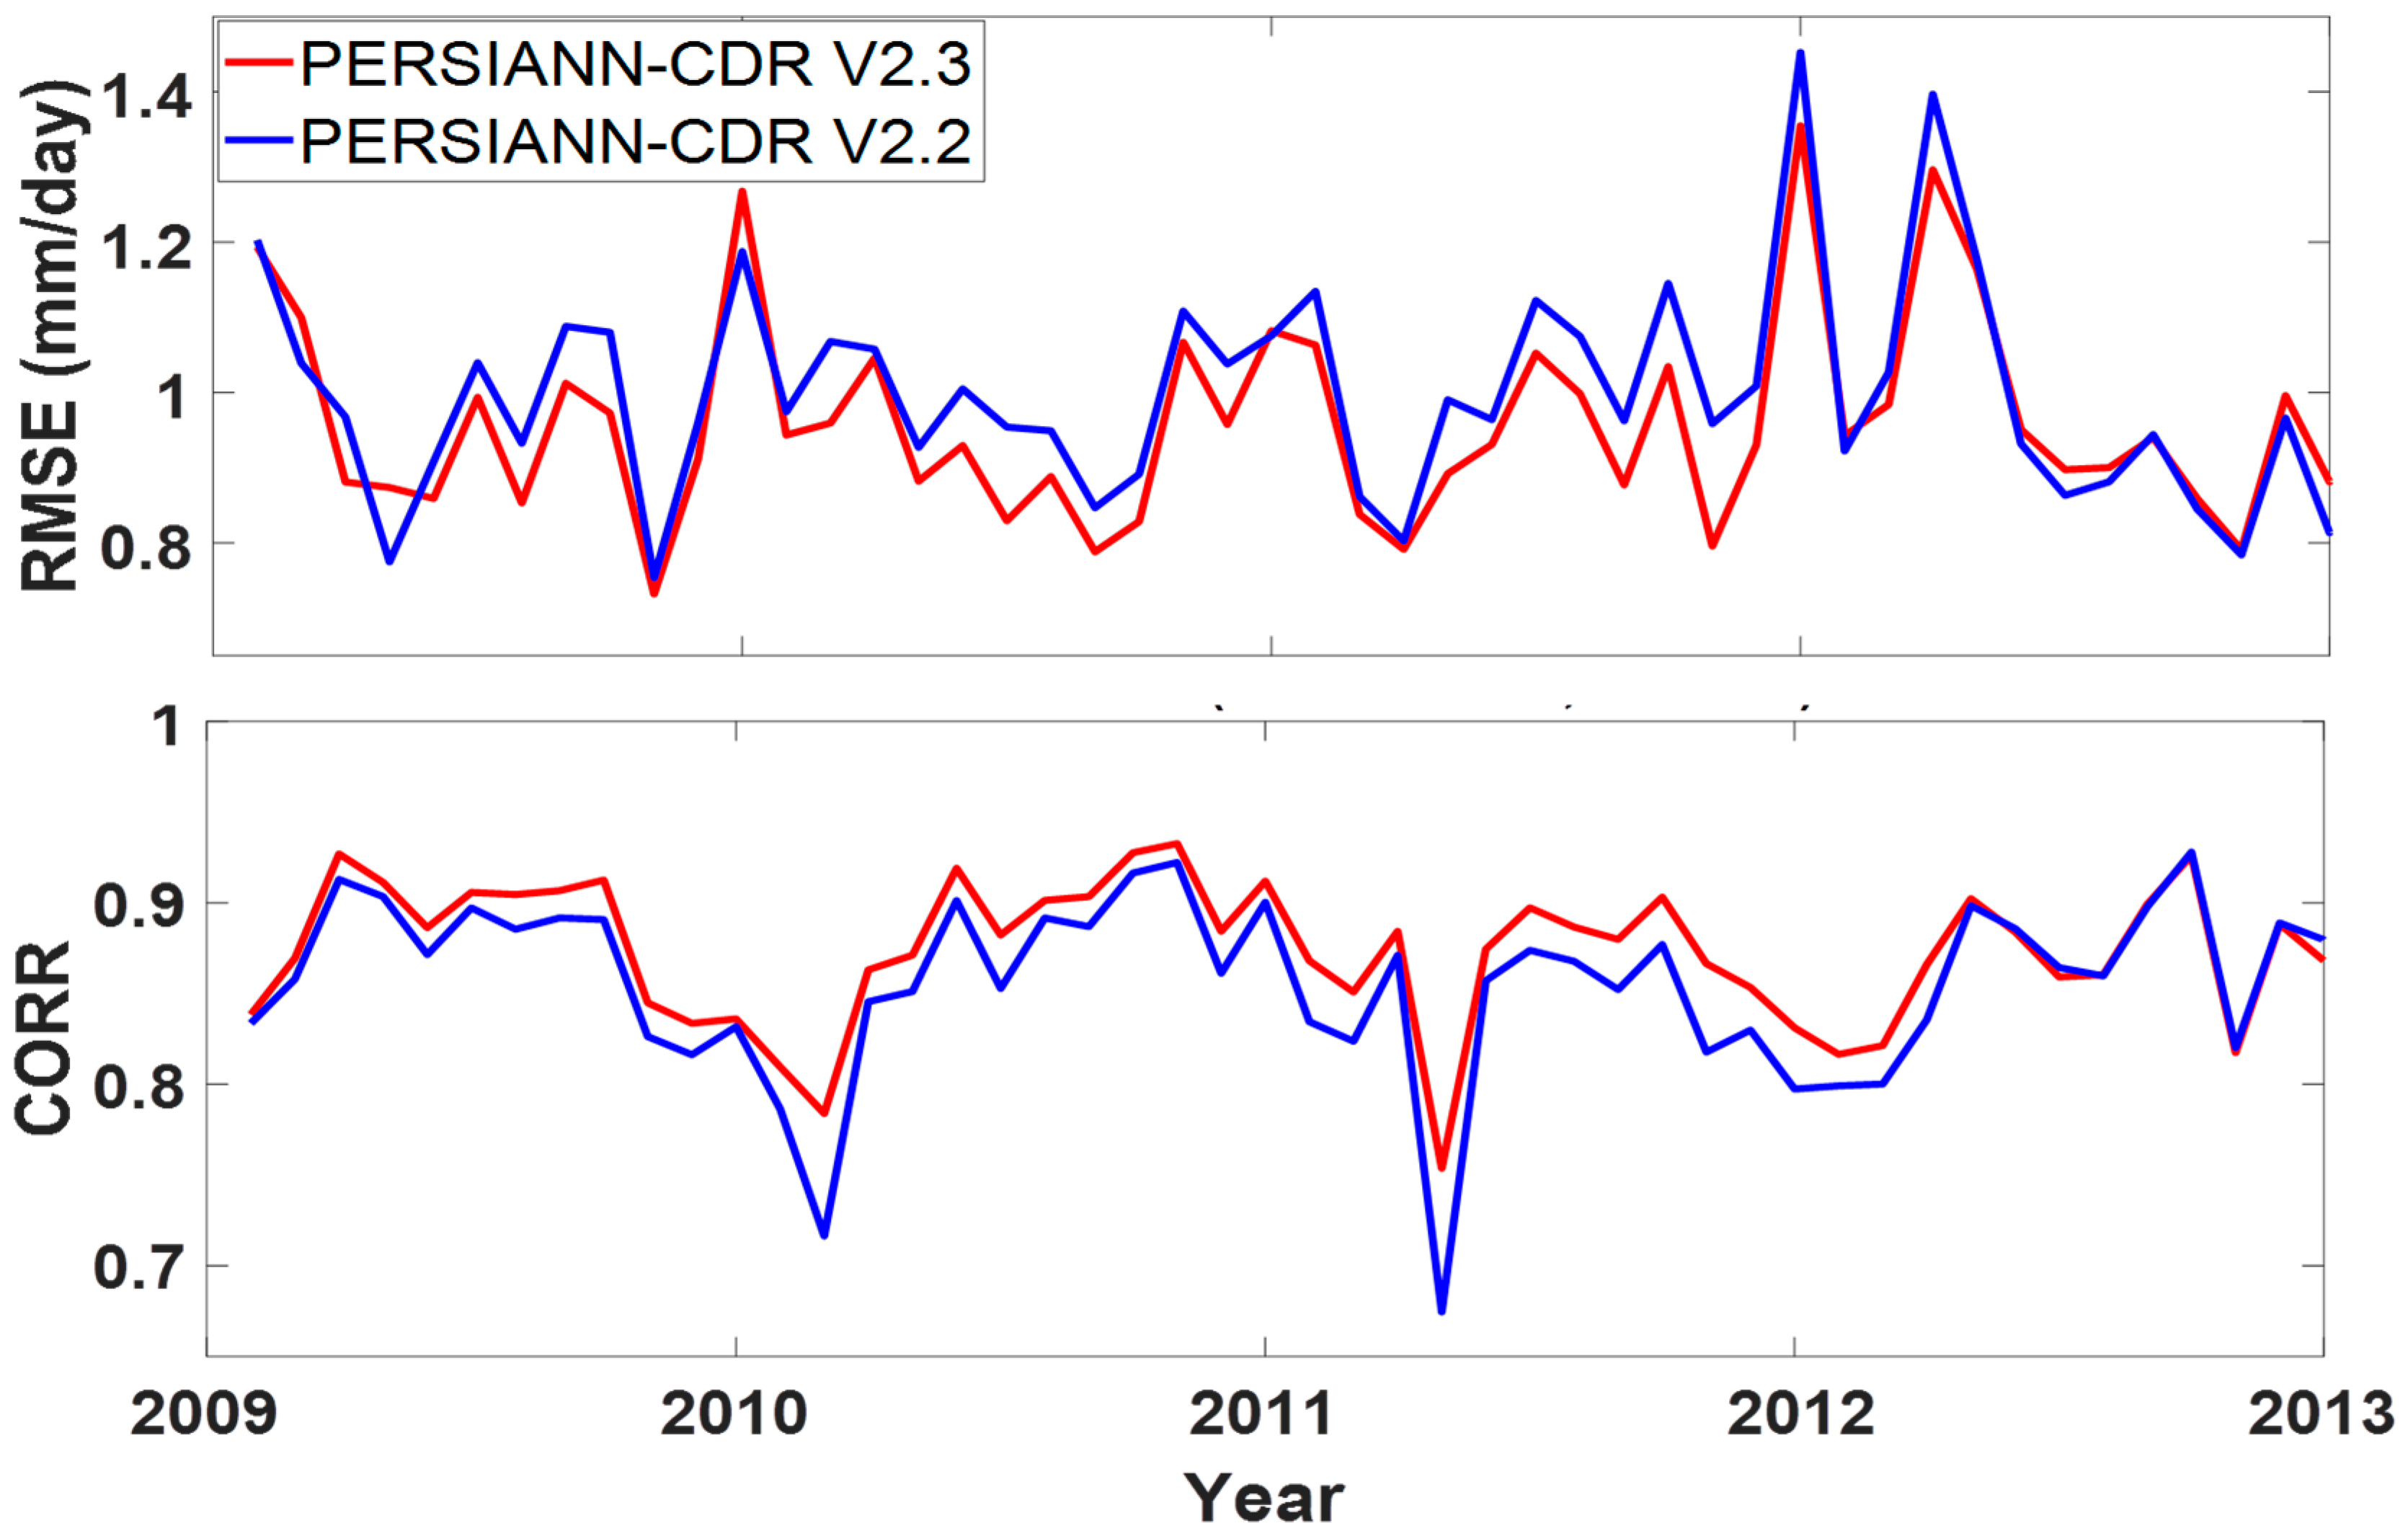
4.2.2. Evaluation over the Globe

Figure 6 and Figure 7 display the spatial distribution maps of CORR and RMSE for the two bias-adjusted versions of PERSIANN-CDR versus CPC and TRMM 3B42 V7 at a monthly scale over the globe, respectively. The CPC dataset at the 0.5° × 0.5° spatial resolution was utilized as a gauged-based reference for comparison over global land areas. The original 0.25°PERSIANN-CDR datasets were resampled to the 0.5° spatial resolution using the bilinear interpolation method to match the spatial resolution of the CPC unified gauge-based analysis dataset. Moreover, due to the unavailability of gauge data over water bodies and oceans, TRMM 3B42 V7 at the 0.25° spatial resolution was employed primarily for the evaluation of the two versions of PERSIANN-CDR over the ocean. As shown in Figure 6, the estimation accuracy of PERSIANN-CDR V2.3 is improved mostly over CONUS and Australia, marked by increases in the correlation and decreases in the RMSE with respect to CPC unified gauge-based analysis. This figure also shows that PERSIANN-CDR V2.2 estimates have a higher correlation with CPC over Africa than V2.3. However, due to an inadequate number of samples being used for CPC precipitation estimates over tropical Africa [8], the higher correlation in this area does not necessarily mean that the previous version of PERSIANN-CDR works better in this region. Comparison with TRMM 3B42 V7 over the ocean indicates similar performances by both versions of PERSIANN-CDR at a monthly scale. Specifically, the overall spatial CORR and RMSE of both bias-adjusted versions of PERSIANN-CDR (V 2.2 and V2.3) with TRMM 3B42 V7 is 0.78 and 1.34 mm/day, respectively. Table 1 summarizes the average value of the spatial maps of CORR (in black) and RMSE (in red) between the two versions of PERSIANN-CDR against the reference datasets. The table also shows that the improvement in PERSIANN-CDR V2.3 at monthly scales is more noticeable over land areas, especially over the CONUS. The CORR and RMSE between PERSIANN-CDR V2.3 and CPC unified gauge-based analysis over the CONUS are improved by 5.2% and 2.3%, respectively. Over land, globally, the CORR between PERSIANN-CDR V2.3 and CPC unified gauge-based analysis increased by 1.2%; while RMSE increased by 0.8%. Evaluation over the oceans using TRMM 3B42 V7 as the reference shows that both CORR and RMSE increased by 1.25% and 0.74%, respectively.

4.3. Daily Evaluation of the Two Versions of PERSIANN-CDR

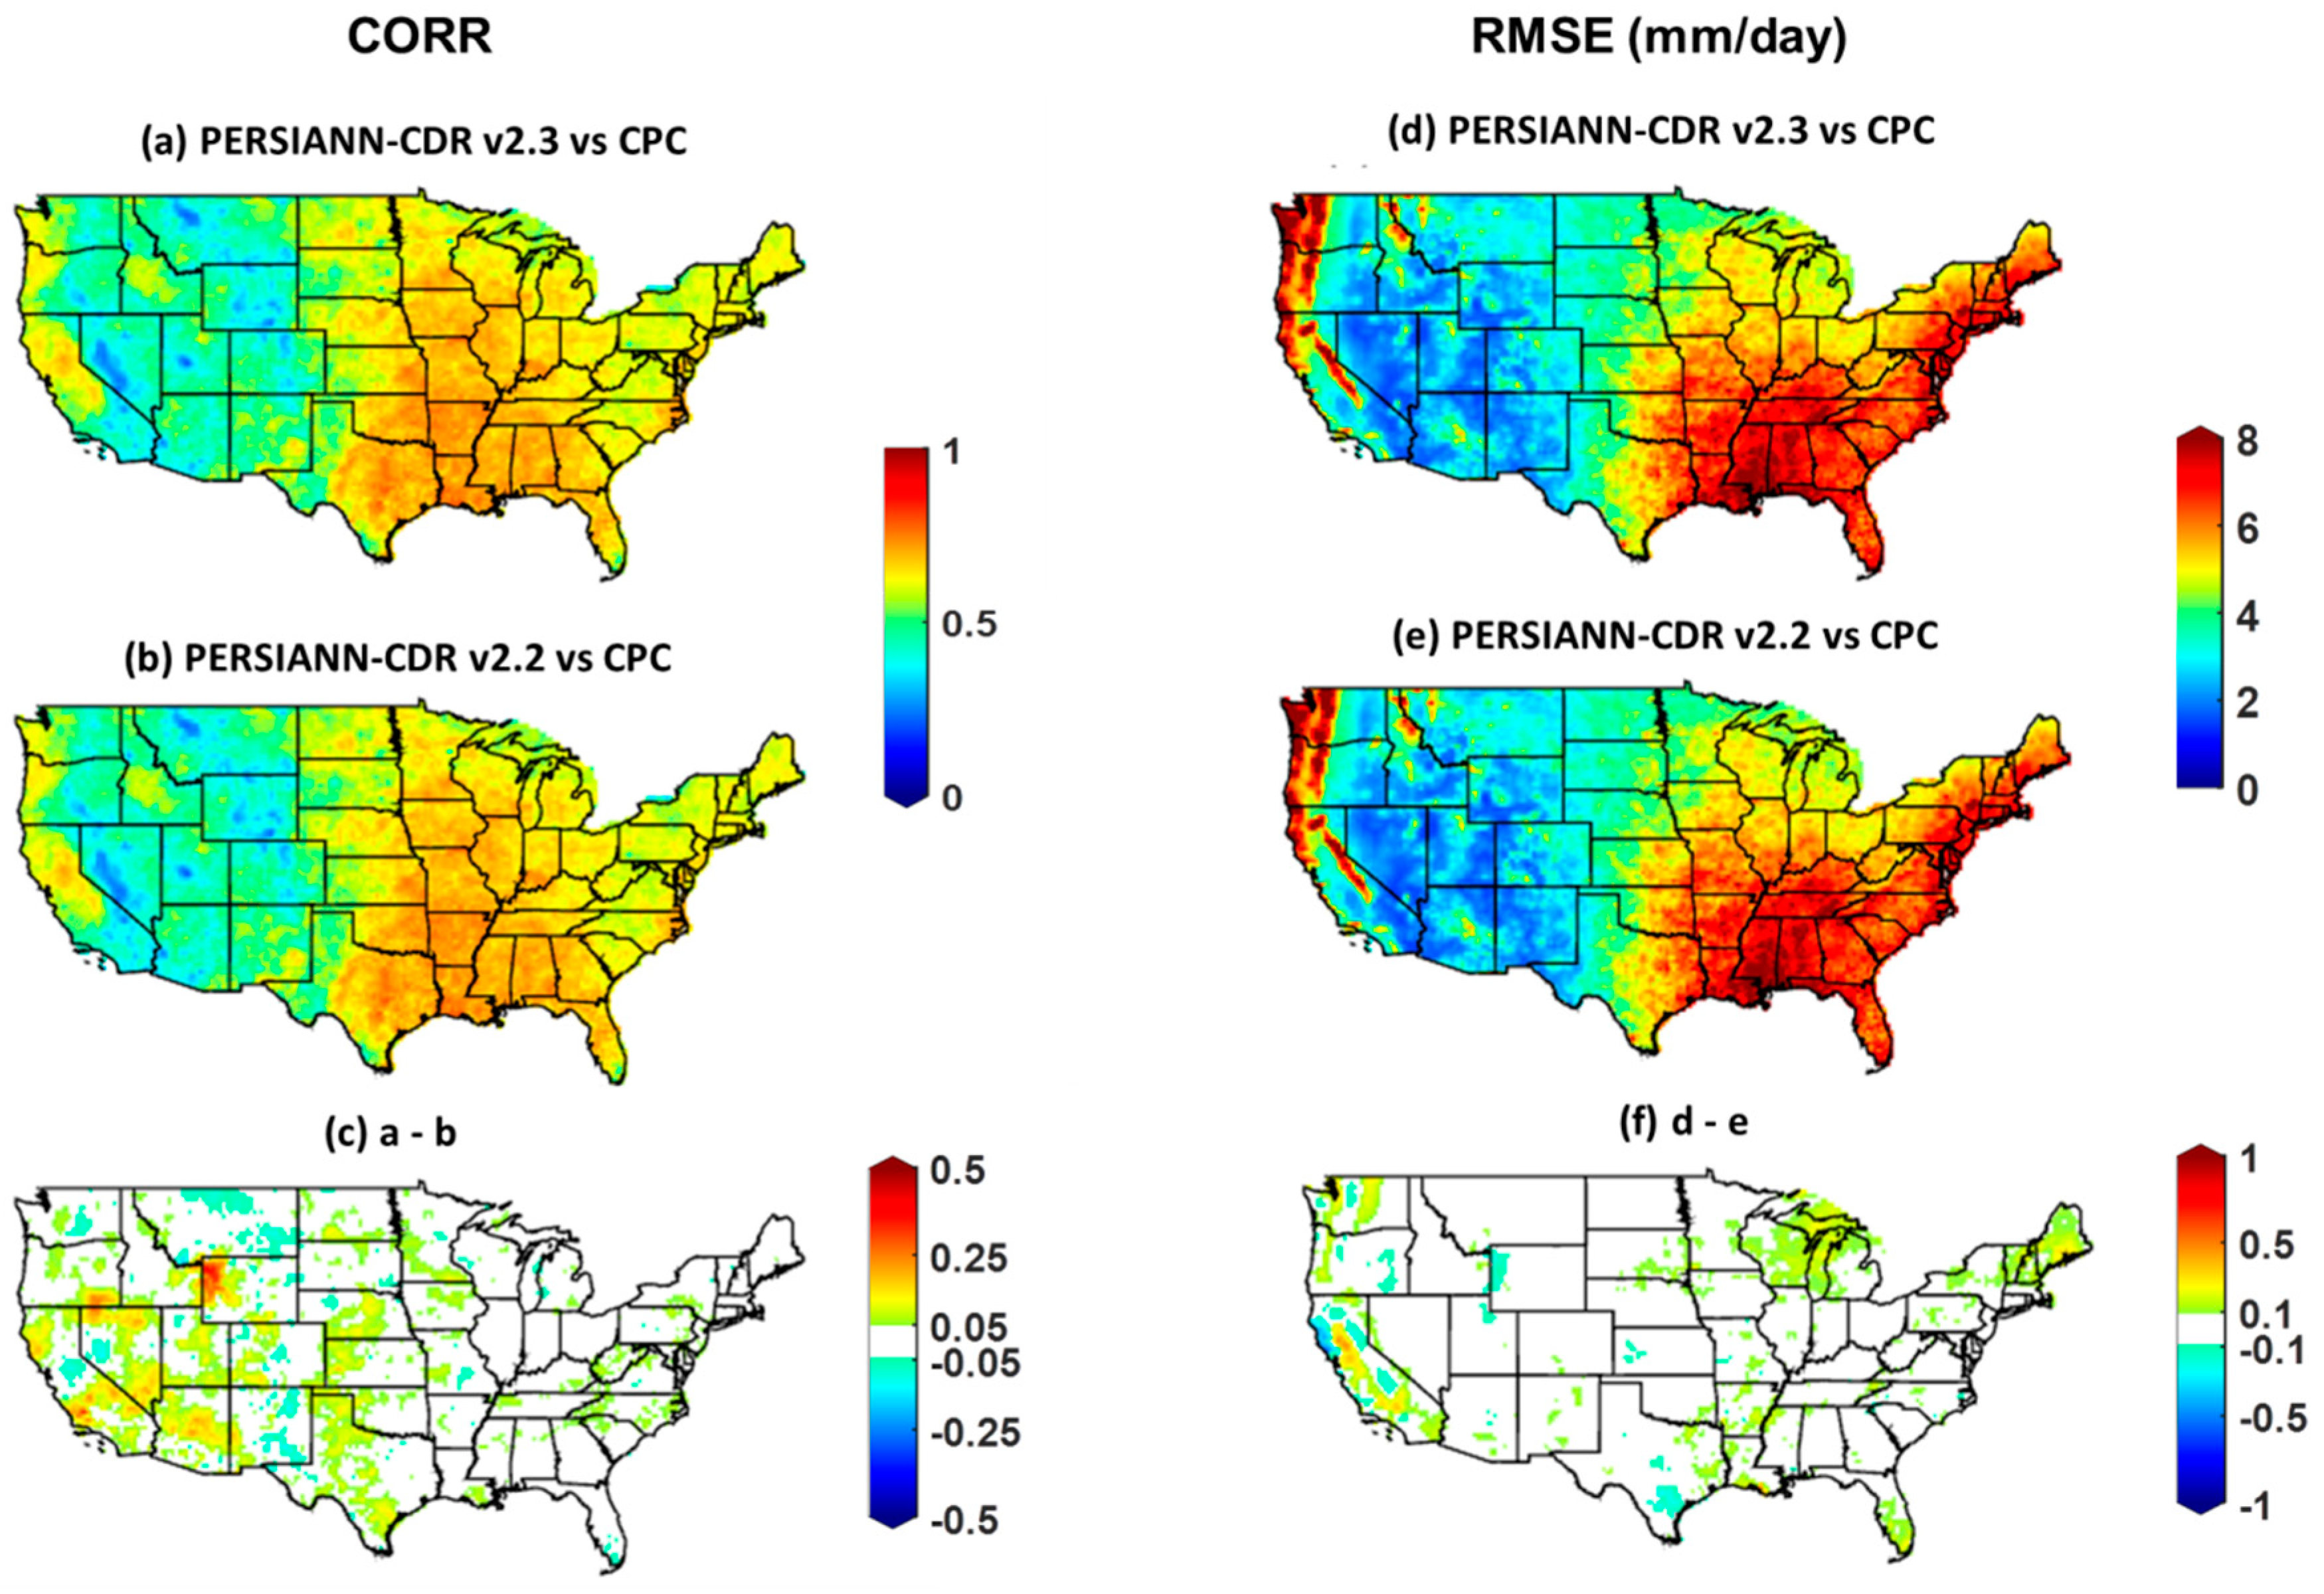
4.3.1. Evaluation over the CONUS

Figure 8 displays the maps of daily CORR and RMSE between PERSIANN-CDR V2.3 and PERSIANN-CDR V2.2 against CPC unified gauge-based analysis at a daily scale over the CONUS for the period of 2009 to 2013. Figure 8 indicates that the CORR between the two versions of PERSIANN-CDR and CPC unified gauge-based analysis varies geographically, with relatively higher values over the eastern states and lower values over the western states. However, RMSE shows better performance (lower values of RMSE) of PERSIANN-CDR over the western CONUS and poorer performance (higher values of RMSE) over the eastern states. This geographical pattern in CORR and RMSE is mainly due to differences in the average precipitation intensity. On average, the western states receive less precipitation compared to the eastern part of the CONUS. Consequently, RMSE is affected by the amount of rain, and often shows higher values over regions with higher rainfall. Note the results might have been affected by the lower number of rainfall gauges over the western CONUS that were used in the CPC unified gauge-based analysis gridded product. Based on Figure 8c,f, a small improvement in the new bias-adjusted version of PERSIANN-CDR (V2.3) can be detected over the central United States, where CORR increased and RMSE was constant.

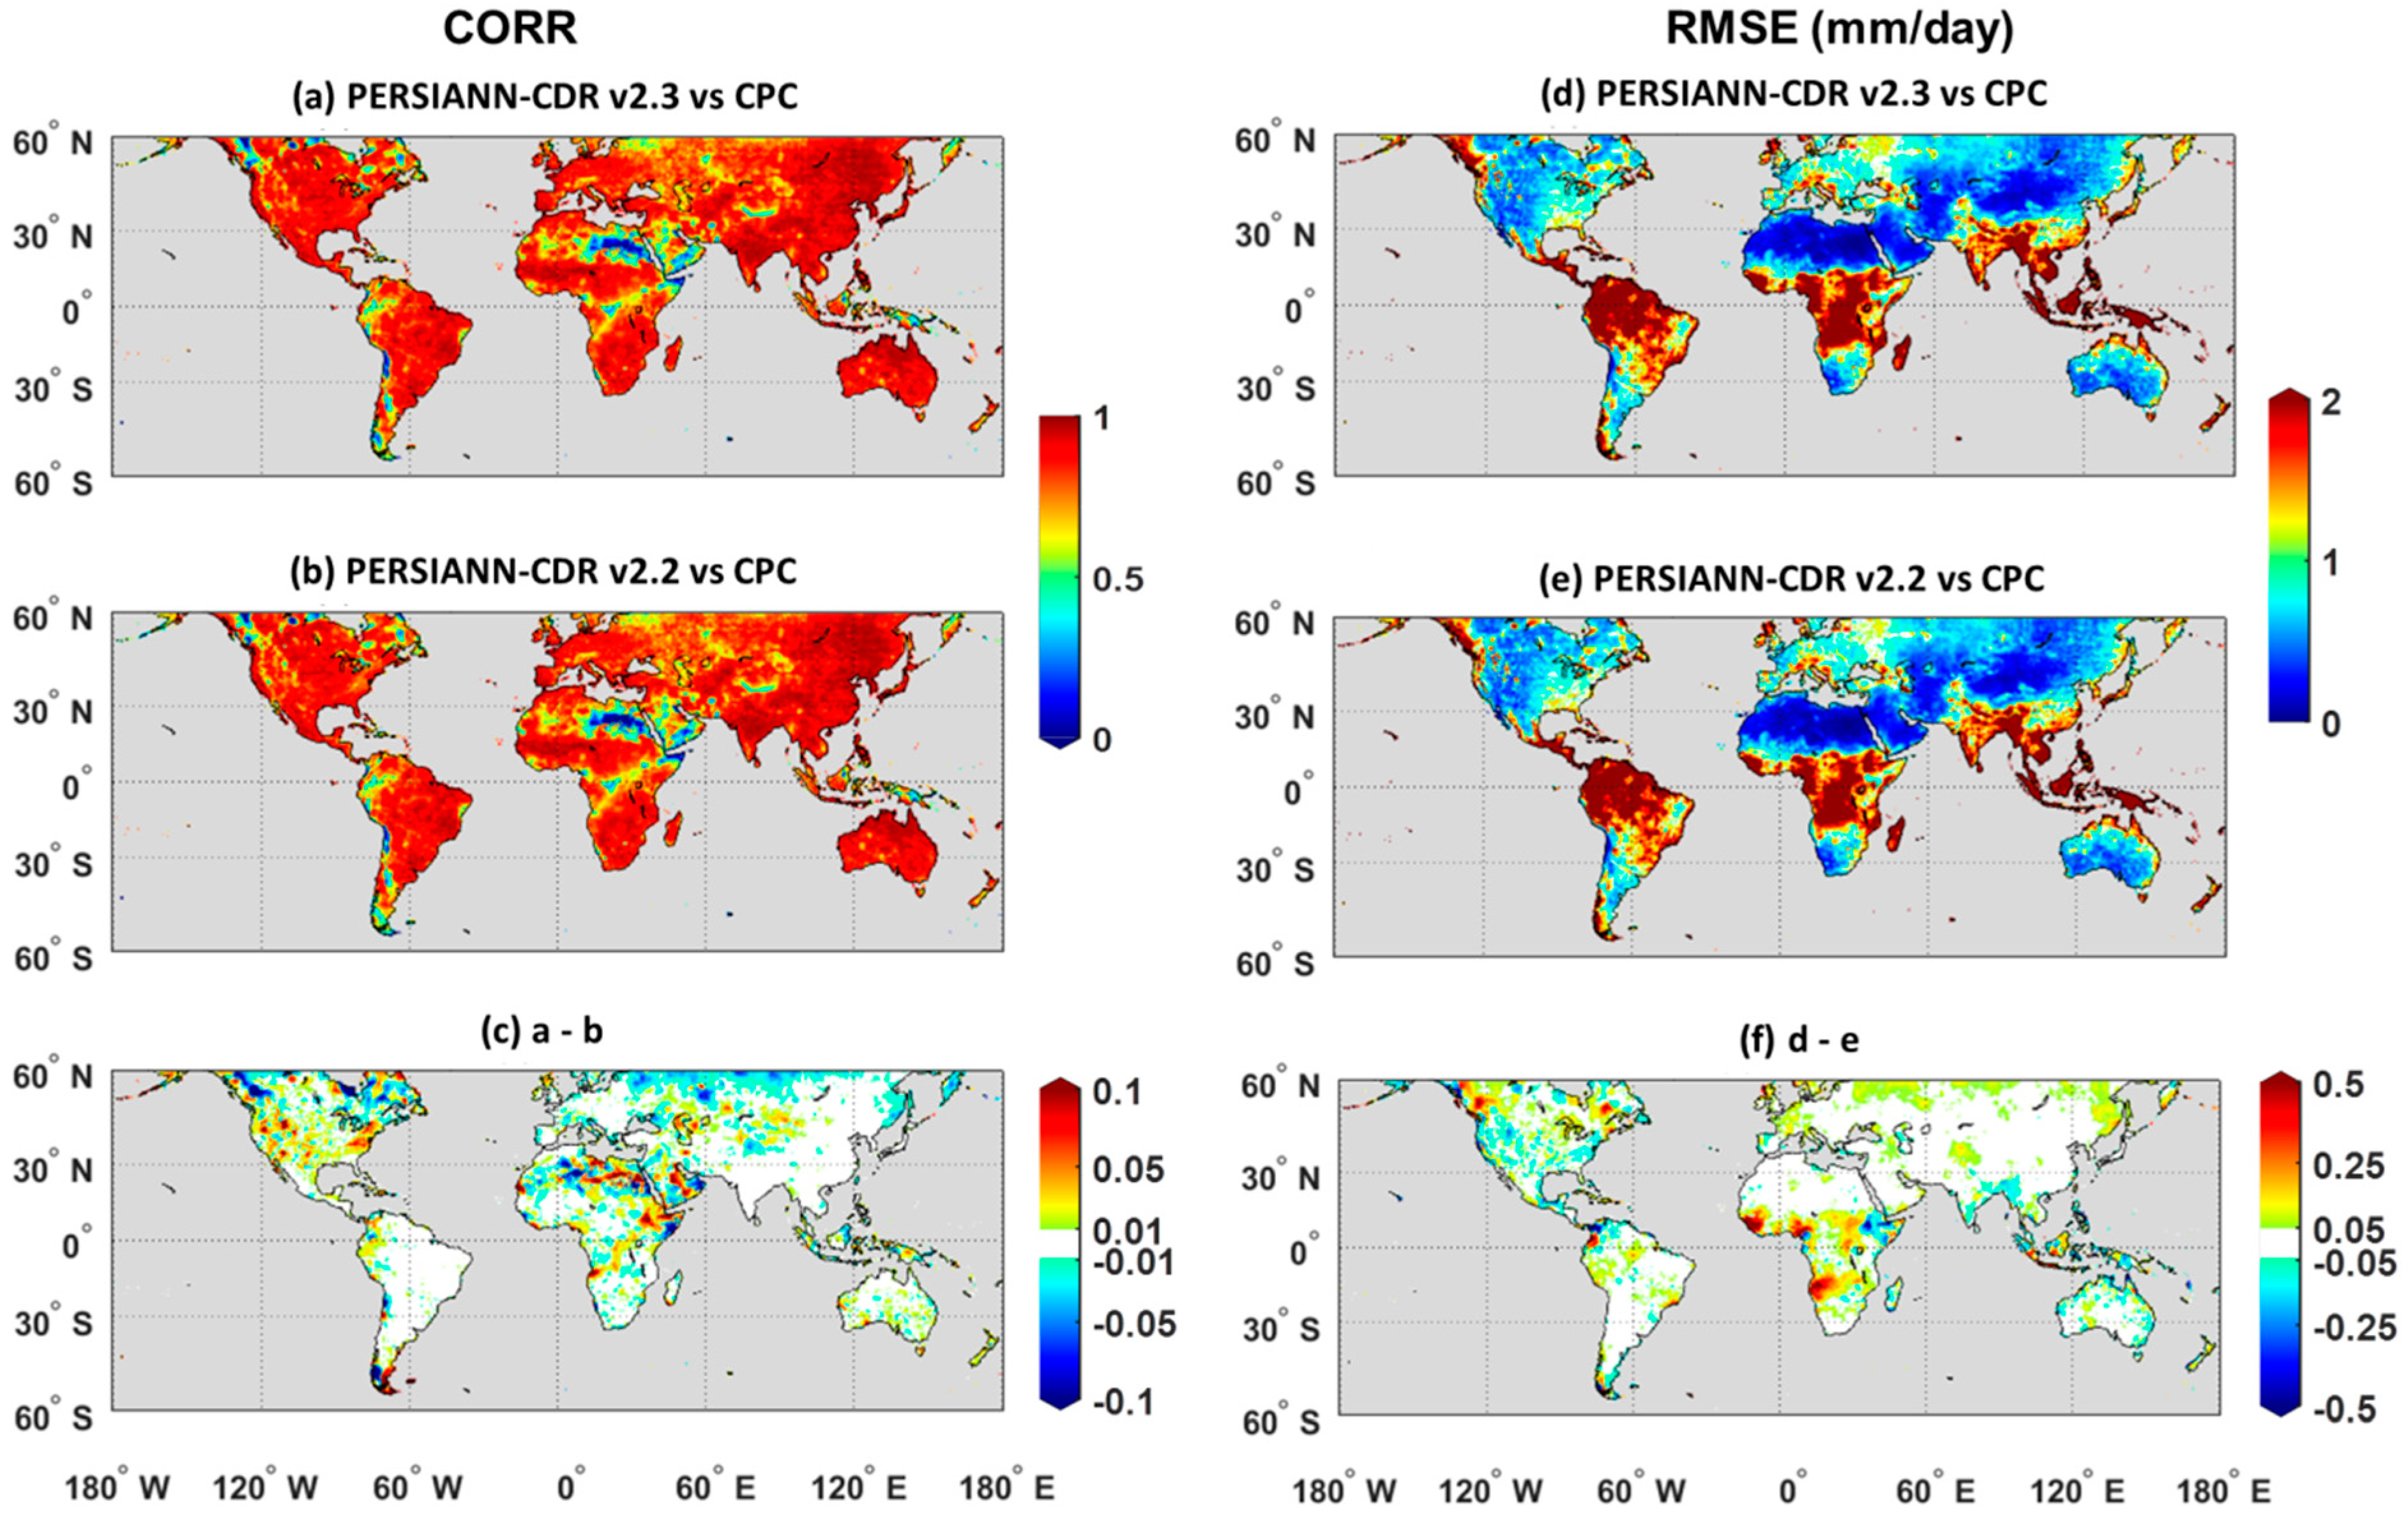
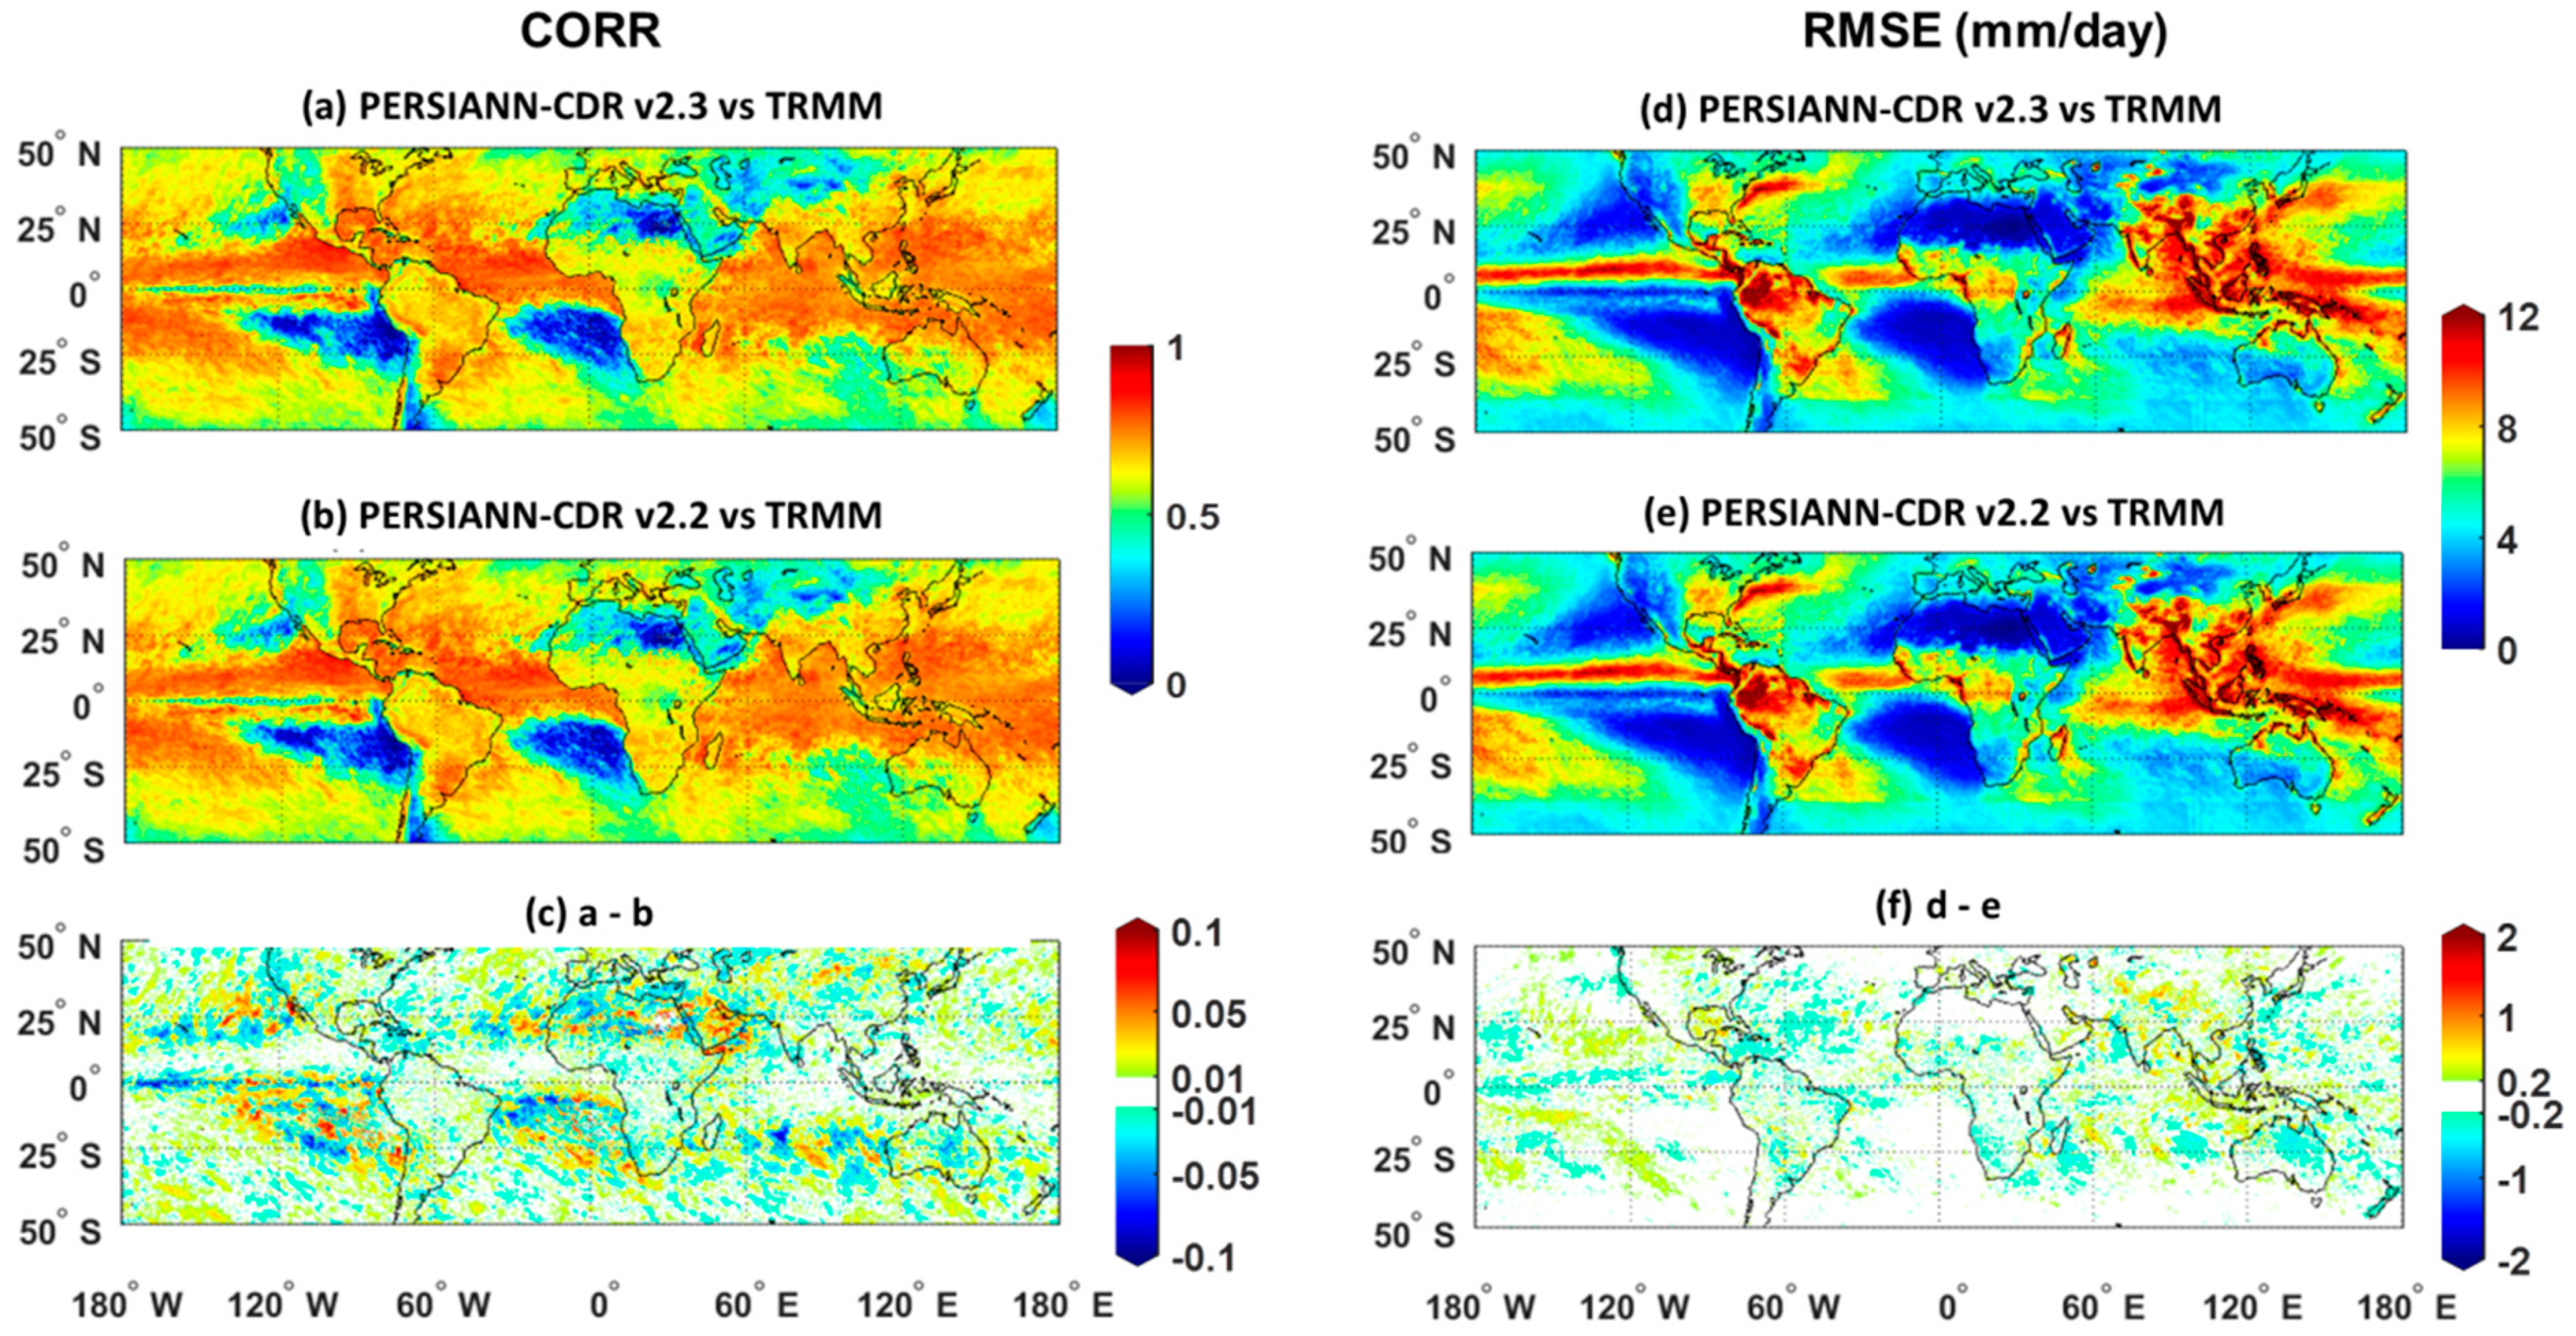
4.3.2. Evaluation over the Globe

We used TRMM 3B42 V7 for daily comparison of the two versions of PERSIANN-CDR over both land and oceans. PERSIANN-CDR and TRMM 3b42 v7 give the daily accumulated rainfall starting at 22:30Z of the previous day to 22:30Z of the day named. The reason that we did not use global CPC unified gauge-based analysis is that the EOD definition varies from one country to another country. This can create inconsistency in daily evaluation since PERSIANN-CDR has a unique EOD definition, but CPC unified gauge-based analysis does not. Figure 9 illustrates the CORR and RMSE between TRMM 3B42 V7 and the two versions of PERSIANN-CDR over land and oceans. The correlation between PERSIANN-CDR and TRMM 3B42 V7 shows a strong correspondence between these two datasets in estimating the daily precipitation rate. This is reasonable since the information of IR imagery has been used in both the TRMM 3B42 V7 and PERSIANN-CDR algorithms for estimation of the three-hourly rain rates. That said, PERSIANN-CDR relies mainly on IR data, whereas TRMM combines IR and PMW data. Furthermore, PERSIANN-CDR is bias-adjusted with the GPCP dataset; and both GPCP and TRMM apply to be relatively similar procedures with different initial inputs for their precipitation estimates [65]. Both the GPCP and TRMM algorithms utilize the more accurate rain rate estimates from passive microwave data captured by low-orbit satellites to adjust the more frequent geosynchronous-orbit satellite infrared information. TRMM 3B42 V7 inserts the microwave estimates into the individual precipitation maps while GPCP only uses microwave estimates in monthly calibrations. Then, in both products, the combined satellite-based products are bias-adjusted with rain gauge analysis. Particularly over low latitudes, one can see a higher correlation between both versions of PERSIANN-CDR against TRMM. This is mainly due to the use of SSMI microwave observations in both the TRMM 3B42 V7 and GPCP V2.2 algorithms for latitudes between 40° and 40°N. The statistical indices including CORR and RMSE between the two versions of PERSIANN-CDR and references at the daily scale over the CONUS and the globe are summarized in Table 2. The changes in both CORR and RMSE between PERSIANN-CDR V2.2 and V2.3 are modest. A slight improvement can be seen in CORR between PERSIANN-CDR V2.3 as opposed to PERSIANN-CDR V2.2 against TRMM 3B42 V7 over the ocean. However, the RMSE has increased for PERSIANN-CDR V2.3 against TRMM 3B42 V7.

5. Conclusions

Historical precipitation estimates from PERSIANN-CDR have been widely used for climatological studies across the globe. Accurate precipitation information from PERSIANN-CDR could contribute to meteorological, hydrological, and water resources management applications. Recently, GPCP was updated to version 2.3 by applying adjustments in the cross-calibration of satellite data inputs and updating the gauge analysis. In this study, we compared the PERSIANN-CDR product constructed with the GPCP V2.3 with the previous version, PERSIANN-CDR V2.2, for the period between 2009 and 2013. First, the differences between the two versions of PERSIANN-CDR (V2.3 and V2.2) and GPCP (V2.3 and V2.2) were described. We utilized the mean absolute difference (MAD) and relative mean absolute difference (RMAD) to track the changes between the latest two versions of both PERSIANN-CDR and GPCP. Comparison of PERSIANN-CDR V2.2 and V2.3 over ocean areas at a monthly scale indicated that the changes in MAD are more than 0.25 mm/day at latitude bands between 40° to 60° in the northern and southern hemispheres after 2009. The increase in PERSIANN-CDR’s estimates over the oceans is mainly due to the adjustments implemented in the GPCP V2.3 dataset. These adjustments include improvement in the cross-calibration of precipitation from TOVS to AIRS since January 2003 and from SSMI to SSMIS after 2009. Over land areas, changes in MAD were more significant over the tropical region while the highest percentage of changes (RMAD) were detectable in other regions of the globe, including north Africa, Australia, north China, Mongolia, and southeastern Russia. The main reasons for changes in MAD and RMAD over the global land areas were: i) Increasing the gauge samples over the entire period of the record, and ii) updating from the GPCC monitoring product to the GPCC full product.
The two versions of PERSIANN-CDR were evaluated over CONUS and global land areas and oceans using the CPC unified gauge-based analysis and TRMM 3B42 V7. Over CONUS, results showed that on average the performance of PERSIANN-CDR V2.3 has improved in terms of RMSE and CORR in both daily and monthly scales. Between 2009 and 2013, RMSE at the monthly (and daily) scale decreased by 2.3% (and 0%) and the CORR increased by 5.1 % (and 1%) compared to PERSIANN-CDR V2.2. Improvements in terms of RMSE and CORR were evident over various states (e.g., Virginia, New York, Pennsylvania, and Oregon). Over global land areas, results indicated that the performance of PERSIANN-CDR V2.3 at the monthly and daily scale is better than the previous version, especially over CONUS and Australia. The performance evaluation of the two versions of PERSIANN-CDR against TRMM 3B42 V7 over the oceans revealed a slight increase in both CORR and RMSE. CORR improved by 1.6% (and 1.2%) and RMSE has increased by 0.74% (and 0.5%) in a monthly (and daily) scale.
In summary, the analyses show that the corrections and adjustments in GPCP V2.3 were successfully translated onto PERSIANN-CDR V2.3. The results indicate that most of the changes in the amount of rainfall are detectable over tropical regions and oceans between the latitudes 40° and 60° in both the northern and southern hemispheres. The changes in the amount of rainfall improve the accuracy of PERSIANN-CDR V2.3 over most regions of the globe, especially over the CONUS and Australia. Although these corrections and adjustments are small, they are crucial when applied to large areas, particularly over oceans and arid regions. In addition, these improvements are important for investigating the changes in inter-annual rainfall variabilities (e.g., due to El Niño—Southern Oscillation (ENSO)) [54].

Author Contributions

Conceptualization, M.S., V.A.G., P.N., K.H., and S.S.; methodology, M.S., A.A.A.; software, M.S. and D.B.; validation, M.S. and M.F.; formal analysis, M.S.; investigation, M.S. and A.A.A.; resources, M.S., P.N., A.A.A., and M.F.; data curation, M.F.; writing—original draft preparation, M.S.; visualization, M.S.; supervision, S.S., K.H., and P.N.; project administration, M.S.; funding acquisition, S.S.

Funding

The financial support of this research is from the U.S. Department of Energy (DOE Prime Award # DE-IA0000018), the California Energy Commission (CEC Award # 300-15-005), MASEEH fellowship, the NSF Project (Award CCF-1331915), NOAA/NESDIS/NCDC (Prime award NA09NES4400006 and NCSU CICS and subaward 2009-1380-01), the U.S. Army Research Office (award W911NF-11-1-0422) and the National Key R&D Program of China (Grant No. 2016YFE0102400).

Acknowledgments

Authors would like to thank Robert F. Adler for valuable comments and suggestions made during the AGU Fall meeting 2018.

Conflicts of Interest

The authors declare no conflict of interest.

References

  1. Trenberth, K.E.; Dai, A.; Rasmussen, R.M.; Parsons, D.B. The changing character of precipitation. Bull. Am. Meteorol. Soc. 2003, 84, 1205–1218. [Google Scholar] [CrossRef]
  2. Miao, C.; Ashouri, H.; Hsu, K.-L.; Sorooshian, S.; Duan, Q. Evaluation of the PERSIANN-CDR daily rainfall estimates in capturing the behavior of extreme precipitation events over China. J. Hydrometeorol. 2015, 16, 1387–1396. [Google Scholar] [CrossRef]
  3. Nguyen, P.; Thorstensen, A.; Sorooshian, S.; Hsu, K.; AghaKouchak, A.; Sanders, B.; Koren, V.; Cui, Z.; Smith, M. A high resolution coupled hydrologic–hydraulic model (HiResFlood-UCI) for flash flood modeling. J. Hydrol. 2016, 541, 401–420. [Google Scholar] [CrossRef]
  4. Beck, H.E.; Van Dijk, A.I.; Levizzani, V.; Schellekens, J.; Gonzalez Miralles, D.; Martens, B.; De Roo, A. MSWEP: 3-hourly 0.25 global gridded precipitation (1979–2015) by merging gauge, satellite, and reanalysis data. Hydrol. Earth Syst. Sci. 2017, 21, 589–615. [Google Scholar] [CrossRef]
  5. Katiraie-Boroujerdy, P.-S.; Asanjan, A.A.; Hsu, K.-L.; Sorooshian, S. Intercomparison of PERSIANN-CDR and TRMM-3B42V7 precipitation estimates at monthly and daily time scales. Atmos. Res. 2017, 193, 36–49. [Google Scholar] [CrossRef]
  6. Kidd, C.; Levizzani, V. Status of satellite precipitation retrievals. Hydrol. Earth Syst. Sci. 2011, 15, 1109–1116. [Google Scholar] [CrossRef]
  7. Mahmoud, M.T.; Al-Zahrani, M.A.; Sharif, H.O. Assessment of global precipitation measurement satellite products over Saudi Arabia. J. Hydrol. 2018, 559, 1–12. [Google Scholar] [CrossRef]
  8. Chen, M.; Shi, W.; Xie, P.; Silva, V.B.; Kousky, V.E.; Wayne Higgins, R.; Janowiak, J.E. Assessing objective techniques for gauge-based analyses of global daily precipitation. J. Geophys. Res. Atmos. 2008, 113, D4. [Google Scholar] [CrossRef]
  9. Xie, P.; Chen, M.; Yang, S.; Yatagai, A.; Hayasaka, T.; Fukushima, Y.; Liu, C. A gauge-based analysis of daily precipitation over East Asia. J. Hydrometeorol. 2007, 8, 607–626. [Google Scholar] [CrossRef]
  10. Maggioni, V.; Meyers, P.C.; Robinson, M.D. A review of merged high-resolution satellite precipitation product accuracy during the Tropical Rainfall Measuring Mission (TRMM) era. J. Hydrometeorol. 2016, 17, 1101–1117. [Google Scholar] [CrossRef]
  11. Yang, D.; Kane, D.; Zhang, Z.; Legates, D.; Goodison, B. Bias corrections of long-term (1973–2004) daily precipitation data over the northern regions. Geophys. Res. Lett. 2005, 32, 19. [Google Scholar] [CrossRef]
  12. Li, Z.; Yang, D.; Hong, Y. Multi-scale evaluation of high-resolution multi-sensor blended global precipitation products over the Yangtze River. J. Hydrol. 2013, 500, 157–169. [Google Scholar] [CrossRef]
  13. Villarini, G.; Mandapaka, P.V.; Krajewski, W.F.; Moore, R.J. Rainfall and sampling uncertainties: A rain gauge perspective. J. Geophys. Res. Atmos. 2008, 113, D11. [Google Scholar] [CrossRef]
  14. Ryzhkov, A.; Diederich, M.; Zhang, P.; Simmer, C. Potential utilization of specific attenuation for rainfall estimation, mitigation of partial beam blockage, and radar networking. J. Atmos. Ocean. Technol. 2014, 31, 599–619. [Google Scholar] [CrossRef]
  15. Guo, H.; Chen, S.; Bao, A.; Hu, J.; Gebregiorgis, A.; Xue, X.; Zhang, X. Inter-comparison of high-resolution satellite precipitation products over Central Asia. Remote Sens. 2015, 7, 7181–7211. [Google Scholar] [CrossRef]
  16. Germann, U.; Galli, G.; Boscacci, M.; Bolliger, M. Radar precipitation measurement in a mountainous region. Q. J. R. Meteorol. Soc. 2006, 132, 1669–1692. [Google Scholar] [CrossRef]
  17. Sun, Q.; Miao, C.; Duan, Q.; Ashouri, H.; Sorooshian, S.; Hsu, K.L. A review of global precipitation data sets: data sources, estimation, and intercomparisons. Rev. Geophys. 2018, 56, 79–107. [Google Scholar] [CrossRef]
  18. Xie, P.; Janowiak, J.E.; Arkin, P.A.; Adler, R.; Gruber, A.; Ferraro, R.; Huffman, G.J.; Curtis, S. GPCP pentad precipitation analyses: An experimental dataset based on gauge observations and satellite estimates. J. Clim. 2003, 16, 2197–2214. [Google Scholar] [CrossRef]
  19. Sadeghi, M.; Asanjan, A.A.; Faridzad, M.; Nguyen, P.; Hsu, K.; Sorooshian, S.; Braithwaite, D. PERSIANN-CNN: Precipitation Estimation from Remotely Sensed Information Using Artificial Neural Networks—Convolutional Neural Networks. J. Hydrometeorol. 2019, 2019. [Google Scholar] [CrossRef]
  20. Hayatbini, N.; Kong, B.; Hsu, K.-L.; Nguyen, P.; Sorooshian, S.; Stephens, G.L. A Deep Learning Framework for Precipitation Estimation from GOES-16 multispectral satellite imagery-Application of the conditional Generative Adversarial Networks (cGANs). In Proceedings of the AGU Fall Meeting, San Francisco, CA, USA, 9–13 December 2019. [Google Scholar]
  21. Burroughs, W.; Burroughs, W.S. Climate: Into the 21st Century; Cambridge University Press: Cambridge, UK, 2003. [Google Scholar]
  22. Huffman, G.J.; Adler, R.F.; Arkin, P.; Chang, A.; Ferraro, R.; Gruber, A.; Janowiak, J.; McNab, A.; Rudolf, B.; Schneider, U. The global precipitation climatology project (GPCP) combined precipitation dataset. Bull. Am. Meteorol. Soc. 1997, 78, 5–20. [Google Scholar] [CrossRef]
  23. Huffman, G.J.; Adler, R.F.; Morrissey, M.M.; Bolvin, D.T.; Curtis, S.; Joyce, R.; McGavock, B.; Susskind, J. Global precipitation at one-degree daily resolution from multisatellite observations. J. Hydrometeorol. 2001, 2, 36–50. [Google Scholar] [CrossRef]
  24. Adler, R.F.; Huffman, G.J.; Chang, A.; Ferraro, R.; Xie, P.-P.; Janowiak, J.; Rudolf, B.; Schneider, U.; Curtis, S.; Bolvin, D. The version-2 global precipitation climatology project (GPCP) monthly precipitation analysis (1979–present). J. Hydrometeorol. 2003, 4, 1147–1167. [Google Scholar] [CrossRef]
  25. Ashouri, H.; Hsu, K.-L.; Sorooshian, S.; Braithwaite, D.K.; Knapp, K.R.; Cecil, L.D.; Nelson, B.R.; Prat, O.P. PERSIANN-CDR: Daily precipitation climate data record from multisatellite observations for hydrological and climate studies. Bull. Am. Meteorol. Soc. 2015, 96, 69–83. [Google Scholar] [CrossRef]
  26. Dai, A.; Lin, X.; Hsu, K.-L. The frequency, intensity, and diurnal cycle of precipitation in surface and satellite observations over low-and mid-latitudes. Clim. Dyn. 2007, 29, 727–744. [Google Scholar] [CrossRef]
  27. Joseph, R.; Ting, M.; Kumar, P. Multiple-scale spatio–temporal variability of precipitation over the coterminous United States. J. Hydrometeorol. 2000, 1, 373–392. [Google Scholar] [CrossRef]
  28. Joseph, R.; Smith, T.M.; Sapiano, M.R.; Ferraro, R.R. A new high-resolution satellite-derived precipitation dataset for climate studies. J. Hydrometeorol. 2009, 10, 935–952. [Google Scholar] [CrossRef]
  29. Huffman, G.J.; Bolvin, D.T.; Nelkin, E.J.; Wolff, D.B.; Adler, R.F.; Gu, G.; Hong, Y.; Bowman, K.P.; Stocker, E.F. The TRMM multisatellite precipitation analysis (TMPA): Quasi-global, multiyear, combined-sensor precipitation estimates at fine scales. J. Hydrometeorol. 2007, 8, 38–55. [Google Scholar] [CrossRef]
  30. Joyce, R.J.; Janowiak, J.E.; Arkin, P.A.; Xie, P. CMORPH: A method that produces global precipitation estimates from passive microwave and infrared data at high spatial and temporal resolution. J. Hydrometeorol. 2004, 5, 487–503. [Google Scholar] [CrossRef]
  31. Sadeghi, M. Assessment of the PERSIANN-CDR Products Bias-Corrected with the GPCP Datasets Versions 2.2 & 2.3; UC Irvine: Irvine, CA, USA, 2018. [Google Scholar]
  32. Faridzad, M.; Yang, T.; Hsu, K.; Sorooshian, S.; Xiao, C. Rainfall frequency analysis for ungauged regions using remotely sensed precipitation information. J. Hydrol. 2018, 563, 123–142. [Google Scholar] [CrossRef]
  33. Ombadi, M.; Nguyen, P.; Sorooshian, S.; Hsu, K.l. Developing Intensity-Duration-Frequency (IDF) Curves From Satellite-Based Precipitation: Methodology and Evaluation. Water Resour. Res. 2018, 54, 7752–7766. [Google Scholar] [CrossRef]
  34. Gado, T.A.; Hsu, K.; Sorooshian, S. Rainfall frequency analysis for ungauged sites using satellite precipitation products. J. Hydrol. 2017, 554, 646–655. [Google Scholar] [CrossRef] [Green Version]
  35. Guo, H.; Bao, A.; Liu, T.; Chen, S.; Ndayisaba, F. Evaluation of persiann-cdr for meteorological drought monitoring over china. Remote Sens. 2016, 8, 379. [Google Scholar] [CrossRef] [Green Version]
  36. Zambrano, F.; Wardlow, B.; Tadesse, T.; Lillo-Saavedra, M.; Lagos, O. Evaluating satellite-derived long-term historical precipitation datasets for drought monitoring in Chile. Atmos. Res. 2017, 186, 26–42. [Google Scholar] [CrossRef]
  37. Lai, C.; Zhong, R.; Wang, Z.; Wu, X.; Chen, X.; Wang, P.; Lian, Y. Monitoring hydrological drought using long-term satellite-based precipitation data. Sci. Total Environ. 2019, 649, 1198–1208. [Google Scholar] [CrossRef] [PubMed]
  38. Nguyen, P.; Ombadi, M.; Sorooshian, S.; Hsu, K.; AghaKouchak, A.; Braithwaite, D.; Ashouri, H.; Thorstensen, A.R. The PERSIANN family of global satellite precipitation data: a review and evaluation of products. Hydrol. Earth Syst. Sci. 2018, 22, 5801–5816. [Google Scholar] [CrossRef] [Green Version]
  39. Katiraie-Boroujerdy, P.-S.; Ashouri, H.; Hsu, K.-L.; Sorooshian, S. Trends of precipitation extreme indices over a subtropical semi-arid area using PERSIANN-CDR. Theor. Appl. Climatol. 2017, 130, 249–260. [Google Scholar] [CrossRef] [Green Version]
  40. Arvor, D.; Funatsu, B.; Michot, V.; Dubreuil, V. Monitoring rainfall patterns in the southern amazon with PERSIANN-CDR data: Long-term characteristics and trends. Remote Sens. 2017, 9, 889. [Google Scholar] [CrossRef] [Green Version]
  41. Dubreuil, V.; Funatsu, B.M.; Michot, V.; Nasuti, S.; Debortoli, N.; de Mello-Thery, N.A.; Le Tourneau, F.-M. Local rainfall trends and their perceptions by Amazonian communities. Clim. Chang. 2017, 143, 461–472. [Google Scholar] [CrossRef]
  42. Liu, X.; Yang, T.; Hsu, K.; Liu, C.; Sorooshian, S. Evaluating the streamflow simulation capability of PERSIANN-CDR daily rainfall products in two river basins on the Tibetan Plateau. Hydrol. Earth Syst. Sci. (Online) 2017, 21. [Google Scholar] [CrossRef] [Green Version]
  43. Nguyen, P.; Thorstensen, A.; Sorooshian, S.; Hsu, K.; AghaKouchak, A. Flood forecasting and inundation mapping using HiResFlood-UCI and near-real-time satellite precipitation data: the 2008 Iowa flood. J. Hydrometeorol. 2015, 16, 1171–1183. [Google Scholar] [CrossRef]
  44. Zhu, Q.; Xuan, W.; Liu, L.; Xu, Y.P. Evaluation and hydrological application of precipitation estimates derived from PERSIANN-CDR, TRMM 3B42V7, and NCEP-CFSR over humid regions in China. Hydrol. Process. 2016, 30, 3061–3083. [Google Scholar] [CrossRef]
  45. Ashouri, H.; Nguyen, P.; Thorstensen, A.; Hsu, K.-l.; Sorooshian, S.; Braithwaite, D. Assessing the efficacy of high-resolution satellite-based PERSIANN-CDR precipitation product in simulating streamflow. J. Hydrometeorol. 2016, 17, 2061–2076. [Google Scholar] [CrossRef]
  46. Casse, C.; Gosset, M. Analysis of hydrological changes and flood increase in Niamey based on the PERSIANN-CDR satellite rainfall estimate and hydrological simulations over the 1983–2013 period. Proc. Int. Assoc. Hydrol. Sci. 2015, 370, 117–123. [Google Scholar] [CrossRef] [Green Version]
  47. Gao, X.; Zhu, Q.; Yang, Z.; Wang, H. Evaluation and hydrological application of CMADS against TRMM 3B42V7, PERSIANN-CDR, NCEP-CFSR, and Gauge-Based Datasets in Xiang River Basin of China. Water 2018, 10, 1225. [Google Scholar] [CrossRef] [Green Version]
  48. Jiang, S.; Liu, S.; Ren, L.; Yong, B.; Zhang, L.; Wang, M.; Lu, Y.; He, Y. Hydrologic evaluation of six high resolution satellite precipitation products in capturing extreme precipitation and streamflow over a Medium-sized basin in China. Water 2018, 10, 25. [Google Scholar] [CrossRef] [Green Version]
  49. Su, J.; Lü, H.; Wang, J.; Sadeghi, A.; Zhu, Y. Evaluating the applicability of four latest satellite–gauge combined precipitation estimates for extreme precipitation and streamflow predictions over the upper Yellow River basins in China. Remote Sens. 2017, 9, 1176. [Google Scholar] [CrossRef] [Green Version]
  50. Shah, H.L.; Mishra, V. Uncertainty and bias in satellite-based precipitation estimates over indian subcontinental basins: Implications for real-time streamflow simulation and flood prediction. J. Hydrometeorol. 2016, 17, 615–636. [Google Scholar] [CrossRef]
  51. Sorooshian, S.; Hsu, K.-L.; Gao, X.; Gupta, H.V.; Imam, B.; Braithwaite, D. Evaluation of PERSIANN system satellite-based estimates of tropical rainfall. Bull. Am. Meteorol. Soc. 2000, 81, 2035–2046. [Google Scholar] [CrossRef] [Green Version]
  52. Hsu, K.-l.; Gao, X.; Sorooshian, S.; Gupta, H.V. Precipitation estimation from remotely sensed information using artificial neural networks. J. Appl. Meteorol. 1997, 36, 1176–1190. [Google Scholar] [CrossRef]
  53. Müller, M.F.; Thompson, S.E. Bias adjustment of satellite rainfall data through stochastic modeling: Methods development and application to Nepal. Adv. Water Resour. 2013, 60, 121–134. [Google Scholar] [CrossRef] [Green Version]
  54. Adler, R.; Sapiano, M.; Huffman, G.; Wang, J.-J.; Gu, G.; Bolvin, D.; Chiu, L.; Schneider, U.; Becker, A.; Nelkin, E. The Global Precipitation Climatology Project (GPCP) monthly analysis (new version 2.3) and a review of 2017 global precipitation. Atmosphere 2018, 9, 138. [Google Scholar] [CrossRef] [PubMed] [Green Version]
  55. Huffman, G.J.; Adler, R.F.; Bolvin, D.T.; Gu, G. Improving the global precipitation record: GPCP version 2.1. Geophys. Res. Lett. 2009, 36, 17. [Google Scholar] [CrossRef] [Green Version]
  56. Xie, P.; Chen, M.; Shi, W. CPC unified gauge-based analysis of global daily precipitation. In Proceedings of the Preprints, 24th Conference on Hydrology, Atlanta, GA, USA, 17–21 January 2010; American Meteorological Society. Available online: https://ams.confex.com/ams/90annual/techprogram/paper_163676.htm (accessed on 3 October 2019).
  57. Xie, P.; Arkin, P.A. Global precipitation: A 17-year monthly analysis based on gauge observations, satellite estimates, and numerical model outputs. Bull. Am. Meteorol. Soc. 1997, 78, 2539–2558. [Google Scholar] [CrossRef]
  58. Knapp, K.R. Scientific data stewardship of International Satellite Cloud Climatology Project B1 global geostationary observations. J. Appl. Remote Sens. 2008, 2, 023548. [Google Scholar] [CrossRef]
  59. Rossow, W.B.; Schiffer, R.A. ISCCP cloud data products. Bull. Am. Meteorol. Soc. 1991. Available online: https://journals.ametsoc.org/doi/abs/10.1175/1520-0477(1991)072%3C0002:ICDP%3E2.0.CO;2 (accessed on 3 October 2019).
  60. Rossow, W.B.; Garder, L.C. Cloud detection using satellite measurements of infrared and visible radiances for ISCCP. J. Clim. 1993, 6, 2341–2369. [Google Scholar] [CrossRef]
  61. Lin, Y.; Mitchell, K.E. 1.2 the NCEP stage II/IV hourly precipitation analyses: Development and applications. In Proceedings of the 19th Conference Hydrology, American Meteorological Society, San Diego, CA, USA, 9–13 January 2005; Available online: http://citeseerx.ist.psu.edu/viewdoc/download?doi=10.1.1.182.2080&rep=rep1&type=pdf (accessed on 3 October 2019).
  62. Fulton, R.A.; Breidenbach, J.P.; Seo, D.-J.; Miller, D.A.; O’Bannon, T. The WSR-88D rainfall algorithm. Weather Forecast. 1998, 13, 377–395. [Google Scholar] [CrossRef]
  63. Westrick, K.J.; Mass, C.F.; Colle, B.A. The limitations of the WSR-88D radar network for quantitative precipitation measurement over the coastal western United States. Bull. Am. Meteorol. Soc. 1999, 80, 2289–2298. [Google Scholar] [CrossRef]
  64. Hsu, K.l.; Gupta, H.V.; Gao, X.; Sorooshian, S.; Imam, B. Self-organizing linear output map (SOLO): An artificial neural network suitable for hydrologic modeling and analysis. Water Resour. Res. 2002, 38, 38-1–38-17. [Google Scholar] [CrossRef] [Green Version]
  65. Adler, R.F.; Huffman, G.J.; Bolvin, D.T.; Curtis, S.; Nelkin, E.J. Tropical rainfall distributions determined using TRMM combined with other satellite and rain gauge information. J. Appl. Meteorol. 2000, 39, 2007–2023. [Google Scholar] [CrossRef] [Green Version]
Figure 1. (a) PERSIANN-CDR V2.3 (mm/day) (b) GPCP V2.3 annual mean precipitation (mm/day) (c) MAD (mm/day) between PERSIANN-CDR V2.3 and V2.2 at a monthly scale, (d) MAD (mm/day) between GPCP V2.3 and V2.2 at a monthly scale, (e) RMAD between PERSIANN-CDR V2.3 and V2.2 at a monthly scale, and (f) RMAD between GPCP V2.3 and V2.2 at a monthly scale. All figures are for 2009 to 2013.
Remotesensing 11 02755 g001
Figure 2. Time series of differences between precipitation estimates of PERSIANN-CDR V2.3 and V2.2 (ac) and GPCP V2.3 and V2.2 (df) for three zones from 2009 to 2013.
Remotesensing 11 02755 g002
Figure 3. Monthly spatial CORR and RMSE (mm/day) maps for PERSIANN-CDR V2.3 (a,d) and PERSIANN-CDR V2.2 (b,e) against CPC unified gauge-based analysis and their difference (c,f) for the period of 2009 to 2013 over the CONUS.
Remotesensing 11 02755 g003
Figure 4. Time series of RMSE and correlation coefficient for PERSIANN-CDR V2.3 (red) and V2.2 (blue) against CPC unified gauge-based analysis for 2009 to 2013 over CONUS at a monthly scale.
Remotesensing 11 02755 g004
Figure 5. Histograms of various performance evaluation metrics, (a) bias, (b) RMSE, (c) R99p, and (d) R95p, of the two bias-adjusted versions of PERSIANN-CDR at a monthly scale over the CONUS for 2009 to 2013.
Remotesensing 11 02755 g005
Figure 6. Monthly spatial CORR and RMSE (mm/day) maps over land for PERSIANN-CDR V2.3 (a,d) and PERSIANN-CDR V2.2 (b,e) against CPC unified gauge-based analysis and their differences (c,f) for the period of 2009 to 2013 over the globe.
Remotesensing 11 02755 g006
Figure 7. Monthly spatial CORR and RMSE (mm/day) maps for PERSIANN-CDR V2.3 (a,d) and PERSIANN-CDR V2.2 (b,e) against TRMM 3B42 V7 and their differences (c,f) for the period of 2009 to 2013 over the globe.
Remotesensing 11 02755 g007
Figure 8. Daily spatial CORR and RMSE (mm/day) maps for PERSIANN-CDR V2.3 (a,d) and PERSIANN-CDR V2.2 (b,e) against CPC and their differences (c,f) for the period of 2009 to 2013 over the CONUS.
Remotesensing 11 02755 g008
Figure 9. Daily spatial CORR and RMSE (mm/day) maps for PERSIANN-CDR V2.3 (a,d) and PERSIANN-CDR V2.2 (b,e) against TRMM 3B42 V7 and their difference (c,f) for the period of 2009 to 2013 over the globe.
Remotesensing 11 02755 g009
Table 1. Summary of CORR (in black) and RMSE (in red) for the two versions of PERSIANN-CDR against references (CPC unified gauge-based analysis over the CONUS and globe land and TRMM 3B42 V7 over the ocean) at a monthly scale for the period of 2009 to 2013.
Data SetCPC(CONUS)CPC(Globe land)TRMM(Ocean)
PERSIANN-CDR V2.30.87 (0.87)0.81 (1.25)0.79 (1.34)
PERSIANN-CDR V2.20.84 (0.89)0.80 (1.24)0.78 (1.33)
Relative Difference5.2% (−2.3%)1.2 % (+0.8%)1.2% (+0.74%)
Table 2. Summary of CORR (in black) and RMSE (in red) for the two versions of PERSIANN-CDR against CPC unified gauge-based analysis over the CONUS (0.25° × 0.25° spatial resolution) and TRMM 3B42 V7 (0.25° × 0.25° spatial resolution) over the global land mass and ocean) at a daily scale for the period of 2009 to 2013.
CPC(CONUS)TRMM(land)TRMM(Ocean)
PERSIANN-CDR V2.30.57 (4.58)0.56 (5.65)0.63 (5.63)
PERSIANN-CDR V2.20.56 (4.58)0.55 (5.65)0.62(5.60)
Relative Difference1% (0%)1% (0%)1.6% (0.5%)

