Article

Decline in Transparency of Lake Hongze from Long-Term MODIS Observations: Possible Causes and Potential Significance

1
Key Laboratory of Virtual Geographic Environment of Education Ministry, Nanjing Normal University, Nanjing 210023, China
2
Taihu Lake Laboratory Ecosystem Station, State Key Laboratory of Lake Science and Environment, Nanjing Institute of Geography and Limnology, Chinese Academy of Sciences, Nanjing 210008, China
3
University of Chinese Academy of Sciences, Beijing 100049, China
4
CAS Center for Excellence in Tibetan Plateau Earth Sciences, Beijing 100101, China
*
Author to whom correspondence should be addressed.
Remote Sens. 2019, 11(2), 177; https://doi.org/10.3390/rs11020177
Submission received: 12 December 2018 / Revised: 9 January 2019 / Accepted: 12 January 2019 / Published: 18 January 2019
(This article belongs to the Special Issue Remote Sensing of Inland Waters and Their Catchments)

Abstract

:
Transparency is an important indicator of water quality and the underwater light environment and is widely measured in water quality monitoring. Decreasing transparency occurs throughout the world and has become the primary water quality issue for many freshwater and coastal marine ecosystems due to eutrophication and other human activities. Lake Hongze is the fourth largest freshwater lake in China, providing water for surrounding cities and farms but experiencing significant water quality changes. However, there are very few studies about Lake Hongze’s transparency due to the lack of long-term monitoring data for the lake. To understand long-term trends, possible causes and potential significance of the transparency in Lake Hongze, an empirical model for estimating transparency (using Secchi disk depth: SDD) based on the moderate resolution image spectroradiometer (MODIS) 645-nm data was validated using an in situ dataset. Model mean absolute percentage and root mean square errors for the validation dataset were 27.7% and RMSE = 0.082 m, respectively, which indicates that the model performs well for SDD estimation in Lake Hongze without any adjustment of model parameters. Subsequently, 1785 cloud-free images were selected for use by the validated model to estimate SDDs of Lake Hongze in 2003–2017. The long-term change of SDD of Lake Hongze showed a decreasing trend from 2007 to 2017, with an average of 0.49 m, ranging from 0.57 m in 2007 to 0.42 m in 2016 (a decrease of 26.3%), which indicates that Lake Hongze experienced increased turbidity in the past 11 years. The loss of aquatic vegetation in the northern bays may be mainly affected by decreases of SDD. Increasing total suspended matter (TSM) concentration resulting from sand mining activities may be responsible for the decreasing trend of SDD.

1. Introduction

Lakes provide multiple socioeconomic and ecosystem services for humans, including drinking water supply, irrigation, tourism, etc. [1,2]. Human activities are considered to be one of the main factors that accelerates the change of lake water quality [3,4,5]. However, under the effects of climate change and human activities, lakes have experienced dramatic changes during the past decades, which have resulted in significant deterioration of water quality, such as eutrophication, cyanobacteria bloom [6,7], and vegetation degradation [8,9], which directly affect water transparency, produce declines in biodiversity, and destroy the ecological environments of the lakes. Therefore, monitoring the long-term changes in water quality, clarifying the affecting causes and proposing the solutions are necessary and urgent.
Water transparency is an important and direct parameter for describing the optical characteristics of water bodies and their water quality; transparency is widely measured using Secchi disks to obtain Secchi disk depths (SDDs) in freshwater and marine water monitoring [10,11]. Water transparency visually reflects the clarity and turbidity of a water body and can evaluate trophic status and the underwater light field [12,13,14,15]. SDD, total nitrogen, total phosphorus, and chlorophyll a are considered to be the criteria for assessing the eutrophication of lakes [16]. Carlson used SDD to propose a trophic state index [17]. On the other hand, SDD also provides important information on the ability of light to transmit through water, which directly impacts the distribution of the underwater light climate and the process of photosynthesis of underwater ecosystems and thus affects the primary productivity of lakes [18]. Unfortunately, many studies have shown that SDDs have experienced a significant decline due to eutrophication and other intensive human activities. For example, after the late 1980s, a marked decrease in SDD was found in the central Bohai Sea caused by rapid economic development in the surrounding regions [19]. The increase in phytoplankton biomass and runoff-induced suspension concentrations led to the decrease of SDD in Xin’anjing Reservoir, a large deep lake [20]. A study of Minnesota lakes (nearly 1000 lakes) found that SDDs of small shallow lakes with more agricultural land were more likely to decrease over time [21]. A significant decrease was found of approximately 25–75% compared with pre-1950 in the southern and central North Sea during the 20th century; the variation may have resulted from increased concentration of suspended particulate matter rather than phytoplankton [22]. The decline in SDD will directly affect the survival of submerged aquatic vegetation and other aquatic organisms, thus leading to a vicious cycle of lake ecosystems and accelerating the development of lake eutrophication [20,23]. Therefore, monitoring and obtaining accurate information about long-term SDD distribution and changes can help us understand the dynamics and development of lake ecosystems and aid the development of effective lake management programs to improve water quality.
Owing to its simplicity and low cost, the Secchi disk has been widely used to measure water transparency since the nineteenth century [10,24]. However, this traditional method relies on manual sampling in the field, and manpower and material resources are thus consumed. Additionally, the inherent limitations of ship surveys of discreteness and sporadic nature make it difficult to obtain effective information and hinders a thorough and objective assessment of the spatial and temporal variations of water transparency in an entire lake [19,25]. Compared with traditional methods, satellite remote sensing provides repeated observations and synoptic view of the environment over large temporal and spatial scales. One of these satellite instruments, the moderate resolution image spectroradiometer (MODIS), has been successfully used for monitoring SDD [26,27,28]. Wu et al. established a linear relationship between the natural logarithm of transparency and the natural logarithm of blue and red bands based on Landsat and MODIS data of Poyang Lake; they pointed out that MODIS estimates water transparency better than Landsat Thematic Mapper [2]. Recently, a semi-analytical algorithm was implemented to estimate SDD based on radiation transfer theory using MODIS data [29]. Shi et al. developed an empirical algorithm using the red band (645 nm) of MODIS data to derive SDD and found a decreasing trend in the water transparency of Lake Taihu [23].
Lake Hongze is the fourth largest freshwater lake in China and provide important role in water supply, irrigation, fishery, etc. The water quality of Lake Hongze has attracted more attention due to strong human activities such as the South-to-North Water Transfer Project and dredging activities [30,31,32]. However, studies have shown a clear increase in suspended particulate concentrations in 2012 and first observed sand mining vessels using LANDSAT data and VIIRS data in Lake Hongze [30,33]. In fact, the first sand mining was discovered in Lake Hongze near the entrance of Huai River in 2007, not 2012 [34]. Just as was found by research in the middle and lower reaches of the Yangtze River, intensive sand mining in lakes not only changes the topography of the bottoms of the lakes [35], which leads to rapidly increasing suspended particulate matters and accelerates the attenuation of light in water columns but also reduces water transparency and affects lake ecosystems [3,33,36,37]. However, the long-term changes of water transparency in Lake Hongze, the possible driving factors and the potential significant effects on the ecological environment have received little attention.
Therefore, this study focuses on the period 2003–2017 to discuss SDD changes and the possible effects of the sand mining activity based on long-term MODIS observation data. Specifically, our goals in this study were to: (1) validate our previous SDD empirical estimation model developed in Lake Taihu using paired SDD in situ measurements in Lake Hongze; (2) generate a SDD remote sensing estimation dataset and analyses the seasonal, spatial variations and long-term trend in SDD from 2007 to 2017; and (3) elucidate possible driving mechanisms and the potential significance of SDD changes.

2. Materials and Methods
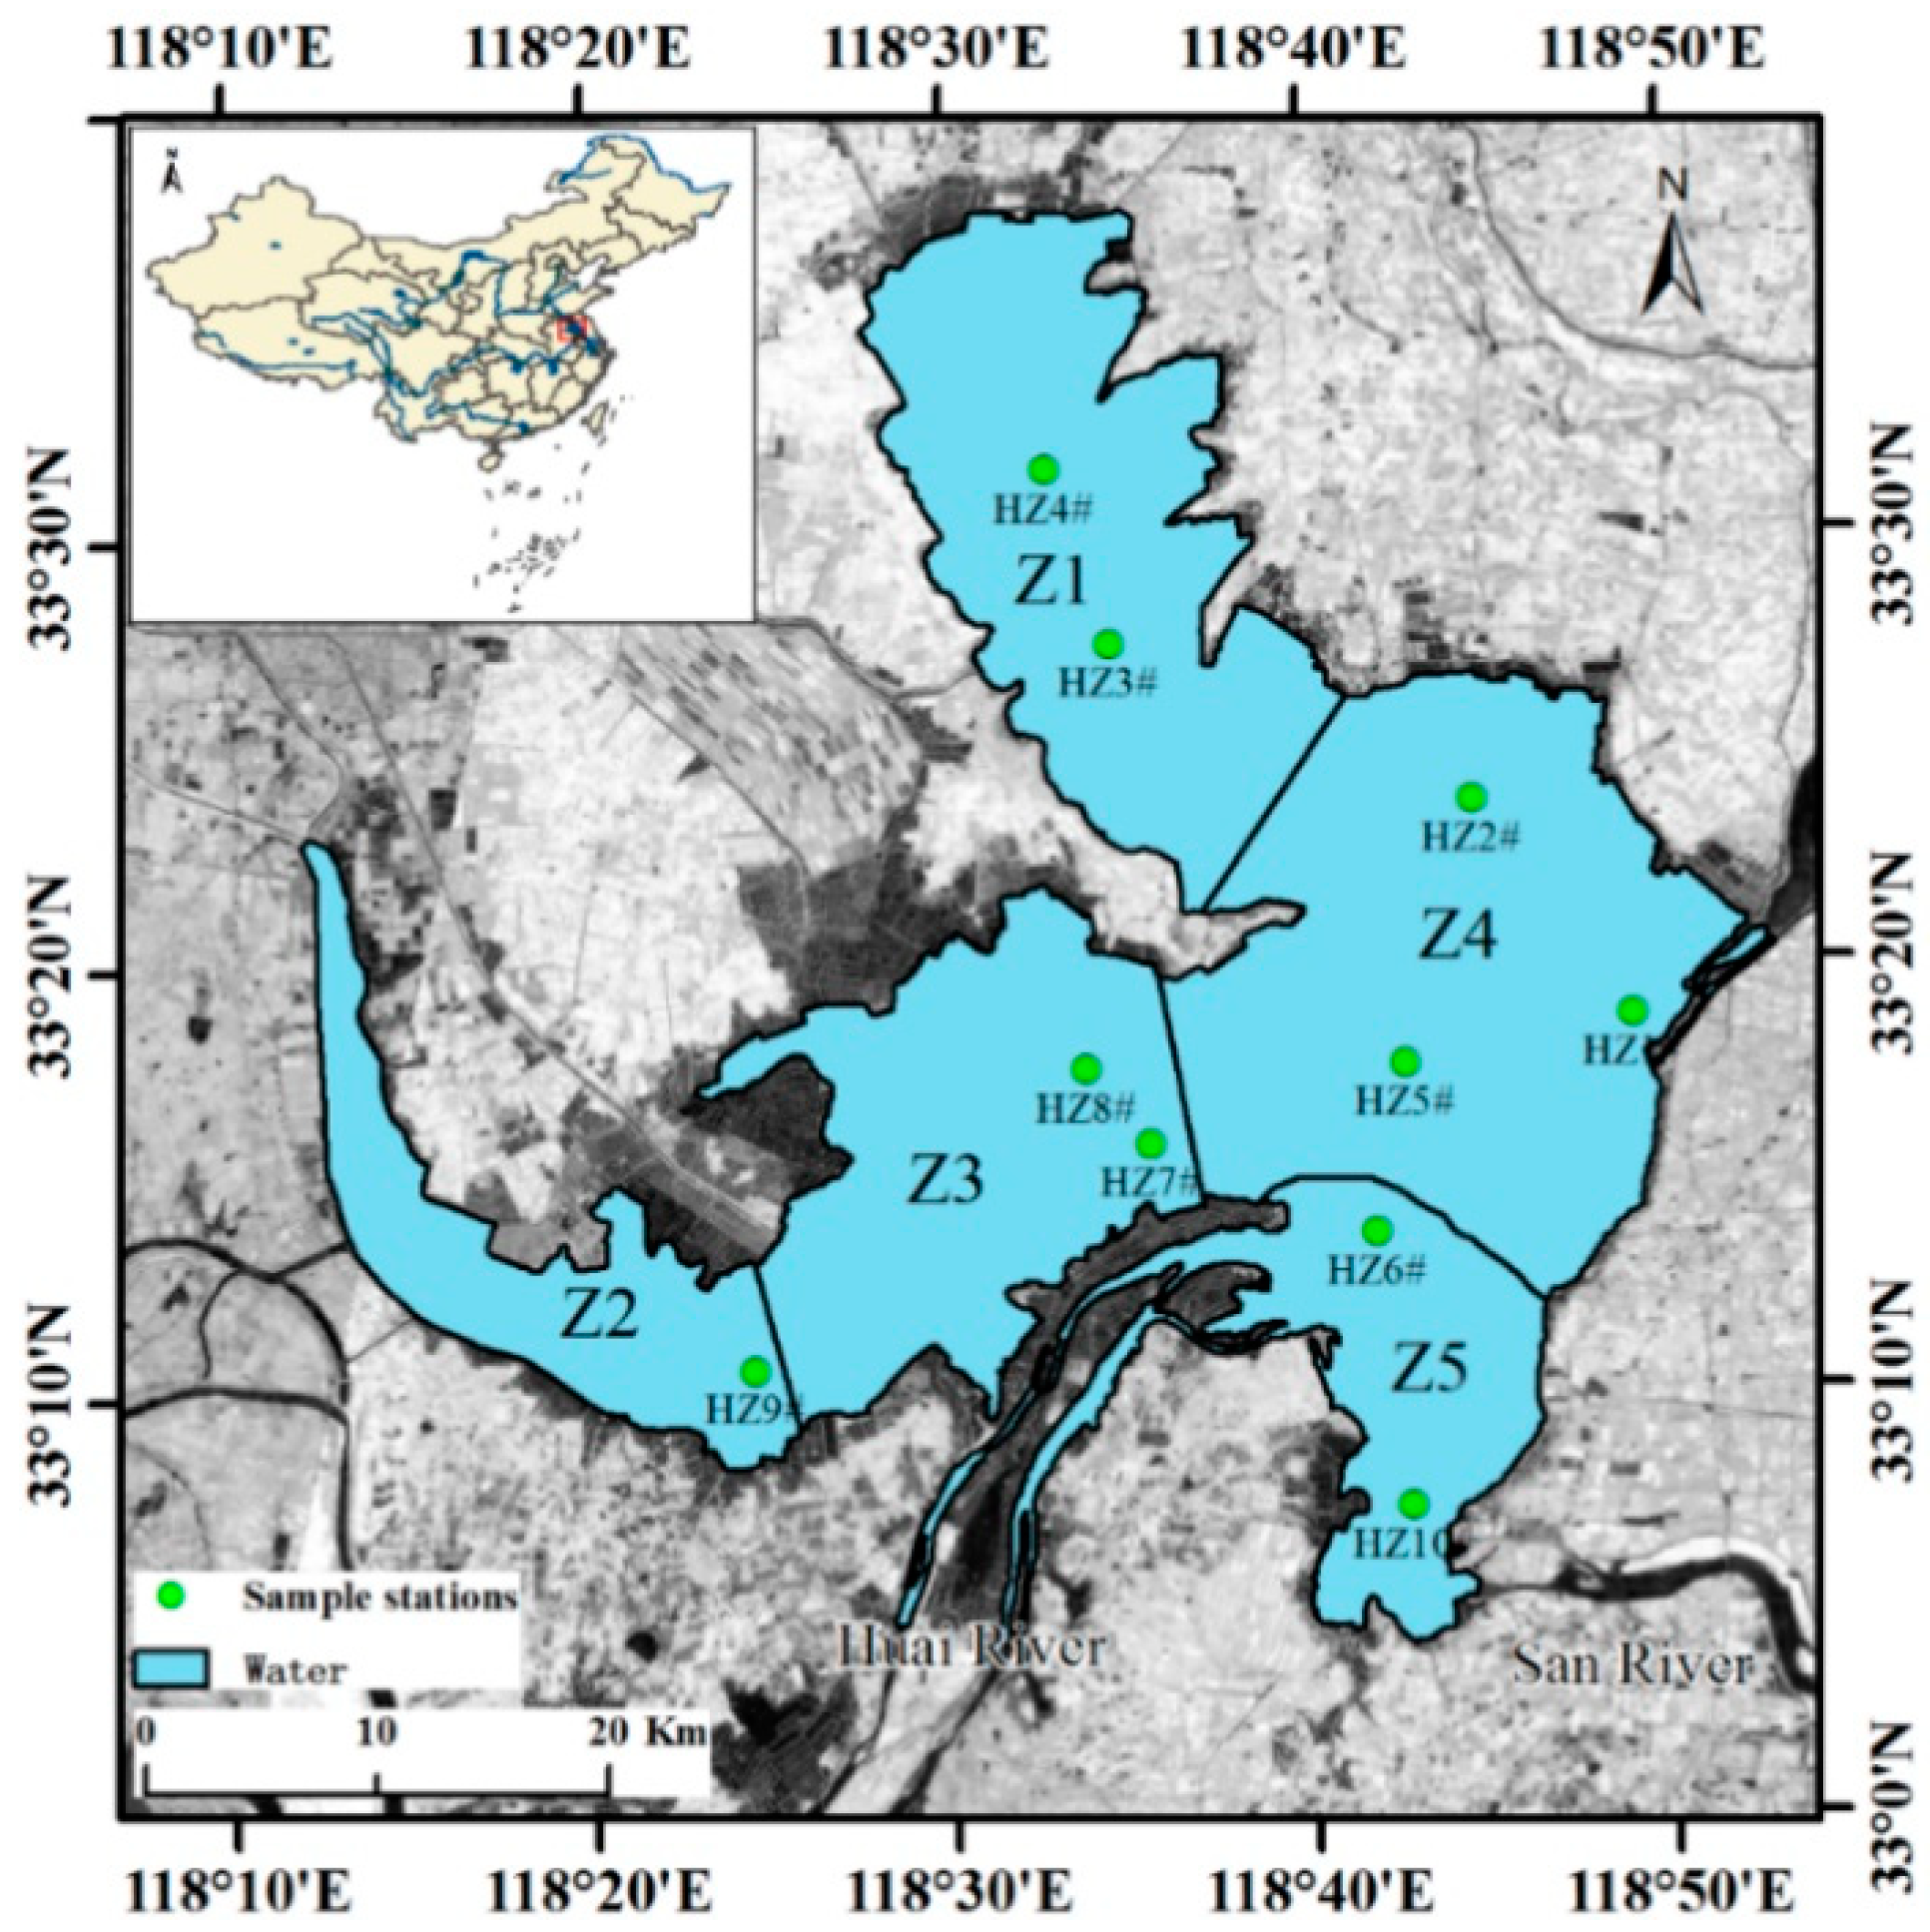
2.1. Study Area

Lake Hongze (33°06′–33°40′N and 118°10′–118°52′E), a typical shallow lake, is the fourth largest freshwater lake in China, located in the middle reach of the Huai River basin (Figure 1). The lake covers a water area of 1960 km2, with a mean water depth of 1.77 m [31]. Located in the monsoon climate region, the precipitation is unevenly distributed around the year, with cold and dry seasons during winter and spring but hot and rainy seasons during summer and autumn [38]. The main incoming rivers are concentrated in the west and south, where the contribution of the Huai River runoff accounts for more than 70% of the lake’s water input [32]. Lake Hongze also plays a role in providing food and habitat for freshwater organisms, which maintains biodiversity and ecological services [31]. In recent decades, increasing environmental pollution and human activities have caused water environment and water quality deterioration in Lake Hongze [32]. For example, a serious water environmental pollution incident on 27 August 2018 in Lake Hongze caused the sudden death of fish and crabs over more than ten thousand acres (http://tv.cctv.com/2018/09/06/VIDE1DcyQNK97zYLm7iNCRLh180906.shtml). Moreover, the aquatic vegetation has markedly degraded [9,39,40,41], which has caused the partial loss of water resources and ecological service functions in Lake Hongze. Since the discovery of the yellow sand resources near the entrance of the Huai River in 2007, driven by high profits, the number of illegal sand-dredging ships on Lake Hongze has increased from a few dozen to more than 600 in 2016 (http://www.cenews.com.cn/sylm/hjyw/201609/t20160912_809182.html). According to the statistics from the water conservancy section, up to 300,000 tons of yellow sand resources were dredged in Lake Hongze every day.

2.2. Sampling Sites and Water Quality Parameter Measurement

SDD observations were conducted monthly at 10 stations in Lake Hongze from December, 2012 to December, 2013 and from August, 2015 to June, 2017 (Figure 1), which resulted in a dataset of 340 in situ SDD measurements containing 34 water samples at each station. SDD was measured by a ruler with reading precision of 0.01 m and a standard Secchi disk, a circular alternating black and white disk with a 30-cm diameter. When the disk just disappears or appears in the field of vision by an observer on a vessel, its depth is recorded as the SDD. To better understand and discuss the spatial variations of the SDD in the varied aquatic environments of Lake Hongze, we separated the lake into five sub-regions based on the shape of the sub-region and the distance to the Huai River: Z1, Z2, Z3, Z4, and Z5 (Figure 1).

2.3. Satellite Data Acquisition and Process

To dynamically monitor Lake Hongze SDD changes, the medium-resolution satellite MODIS, which completely observes the Earth once in 1–2 days, was used in this study. Compared with other terrestrial remote sensing satellites, the spectral resolution of MODIS can meet the spectral requirements for inland water bodies with complex optical characteristics. In addition, previous studies have used MODIS series data for monitoring the water quality in Lake Hongze [1,30]. MODIS-Aqua L-0 data at 250-m resolution spanning the period between January 2003 and December 2017 were freely obtained from the NASA Ocean color Archive (http://oceandata.sci.gsfc.nasa.gov/). More than 5200 images were obtained covering Lake Hongze, with radiometric calibration and geometric correction using Seadas 7.4 software. After excluding the effects of clouds, sun glare, or thick aerosols, 1785 cloud-free images were chosen and processed (Table 1). The algorithm used for atmospheric correction to generate sensing reflectance products is denoted as Dense Dark Vegetation–Water Correction, an improved land target-based iterative method, which is described in detail in [42].
Water transparency is mainly affected by the optical components in the water body: pure water, suspended matter, chromophoric dissolved organic matter, and phytoplankton. In order to explore the effect of suspended matter on the transparency, we adopted an empirical model developed in Lake Hongze using two bands (645 nm and 1240 nm) of MODIS to estimate the total suspended matter (TSM) concentration [30]. We applied 1785 high-quality images to the model to obtain a TSM concentration dataset from 2003 to 2017.
TSM = exp ( 15.4   × ( R r c ( 645 ) R r c ( 1240 ) ) + 1.994 )
Rrc(645) and Rrc(1240) represent Rayleigh-corrected MODIS-Aqua reflectance at 645 nm.
In view of the fact that aquatic vegetation can counteract wind-driven waves, filter particulate matter, and prevent sediment resuspension [8], it is also an important factor that influences water transparency [43]. Therefore, we introduced the vegetation presence frequency (VPF) calculated from the floating algal index (FAI) to capture the temporal and spatial distribution of aquatic vegetation in turbid waters [44]. The FAI was proposed by Hu et al. for detecting cyanobacteria and floating vegetation in waters [45]. To distinguish the area with vegetation signal from the open water, −0.025 was set as the FAI threshold of aquatic vegetation, which has been successfully applied to the extraction of aquatic vegetation in Lake Taihu [8,44]. If the FAI value of pixel was greater than −0.025, it was considered as vegetation signals and the value of this pixel was set to 1 otherwise set to 0 in the FAI layer. The VPF of pixel j was calculated in a given set of n images
VPF ( j ) = i = 1 n FAI ( j , i ) n
where VPF(j) represents the proportion of pixel j with FAI = 1 in the total number of images (n).
An SDD estimation model using MODIS data has been developed by Shi et al. for Lake Taihu [23]. Considering that both Lake Taihu and Lake Hongze are large shallow lakes with similar optical properties and high turbidity, we directly used the SDD estimation model for Lake Taihu (Equation (3)). However, we validated the SDD estimation model for Lake Taihu to check its applicability in Lake Hongze using in situ data without any adjustment of parameters.
SDD = 1.259 × exp ( 46.02 × R r c ( 645 ) )
Rrc(645) represents Rayleigh-corrected MODIS-Aqua reflectance at 645 nm.

2.4. Meteorological Data

The daily mean wind speed data from 1957 to 2017 were collected from the nearest Xuyi meteorological station; data can be downloaded freely from the China Meteorological Data Sharing Service System (http://cdc.nmic.cn). The Huai River runoff accounts for more than 70% of the total flow coming into Lake Hongze, and the nearest Bengbu hydrological station was selected to collect the runoff data to explore the impact of runoff on water transparency. The monthly sediment discharge and runoff data from 2007 to 2017 and the annual sediment discharge and runoff data during 2003–2017 from this station can be freely download from the China River Sediment Announcement and the Annual Report of the State of Water Resources of the Ministry of Water Resources of the People’s Republic of China (http://www.mwr.gov.cn/).

2.5. Statistical Analysis and Accuracy Assessment

To compare the in situ measured data with the estimated results, we conducted statistical analysis and linear regression—including calculation of the average, maximum, absolute value, standard deviation, and other measures—and calculated the Pearson correlation coefficient. A one-way analysis of variance (ANOVA) and Mann–Whitney U test were used to compare the seasonal and spatial differences in parameters. To evaluate the performance of the algorithm in estimating SDD by MODIS data, the determination coefficient (R2), mean absolute percentage error (MAPE), root mean square error (RMSE) and relative error (RE) were introduced as statistical indicators to validate the applicability and accuracy of the model for estimating SDD over Lake Hongze. Significance level is considered significant at (p ≤ 0.05).
R M S E   = I = 1 N ( Y e s t i m a t e d , I Y o b s e r v e d , i ) 2 N
M A P E   = 1 N i = 1 N | Y e s t i m a t e d , i Y o b s e r v e d , i | Y o b s e r v e d , i
R E   = | Y e s t i m a t e d , i Y o b s e r v e d , i | Y o b s e r v e d , i * 100 %
N represents the number of sample stations, i represents the current sample number, Y o b s e r v e d , i represents the SDD measured in the field, and   Y e s t i m a t e d , i represents the SDD estimated from MODIS-Aqua data.

3. Results

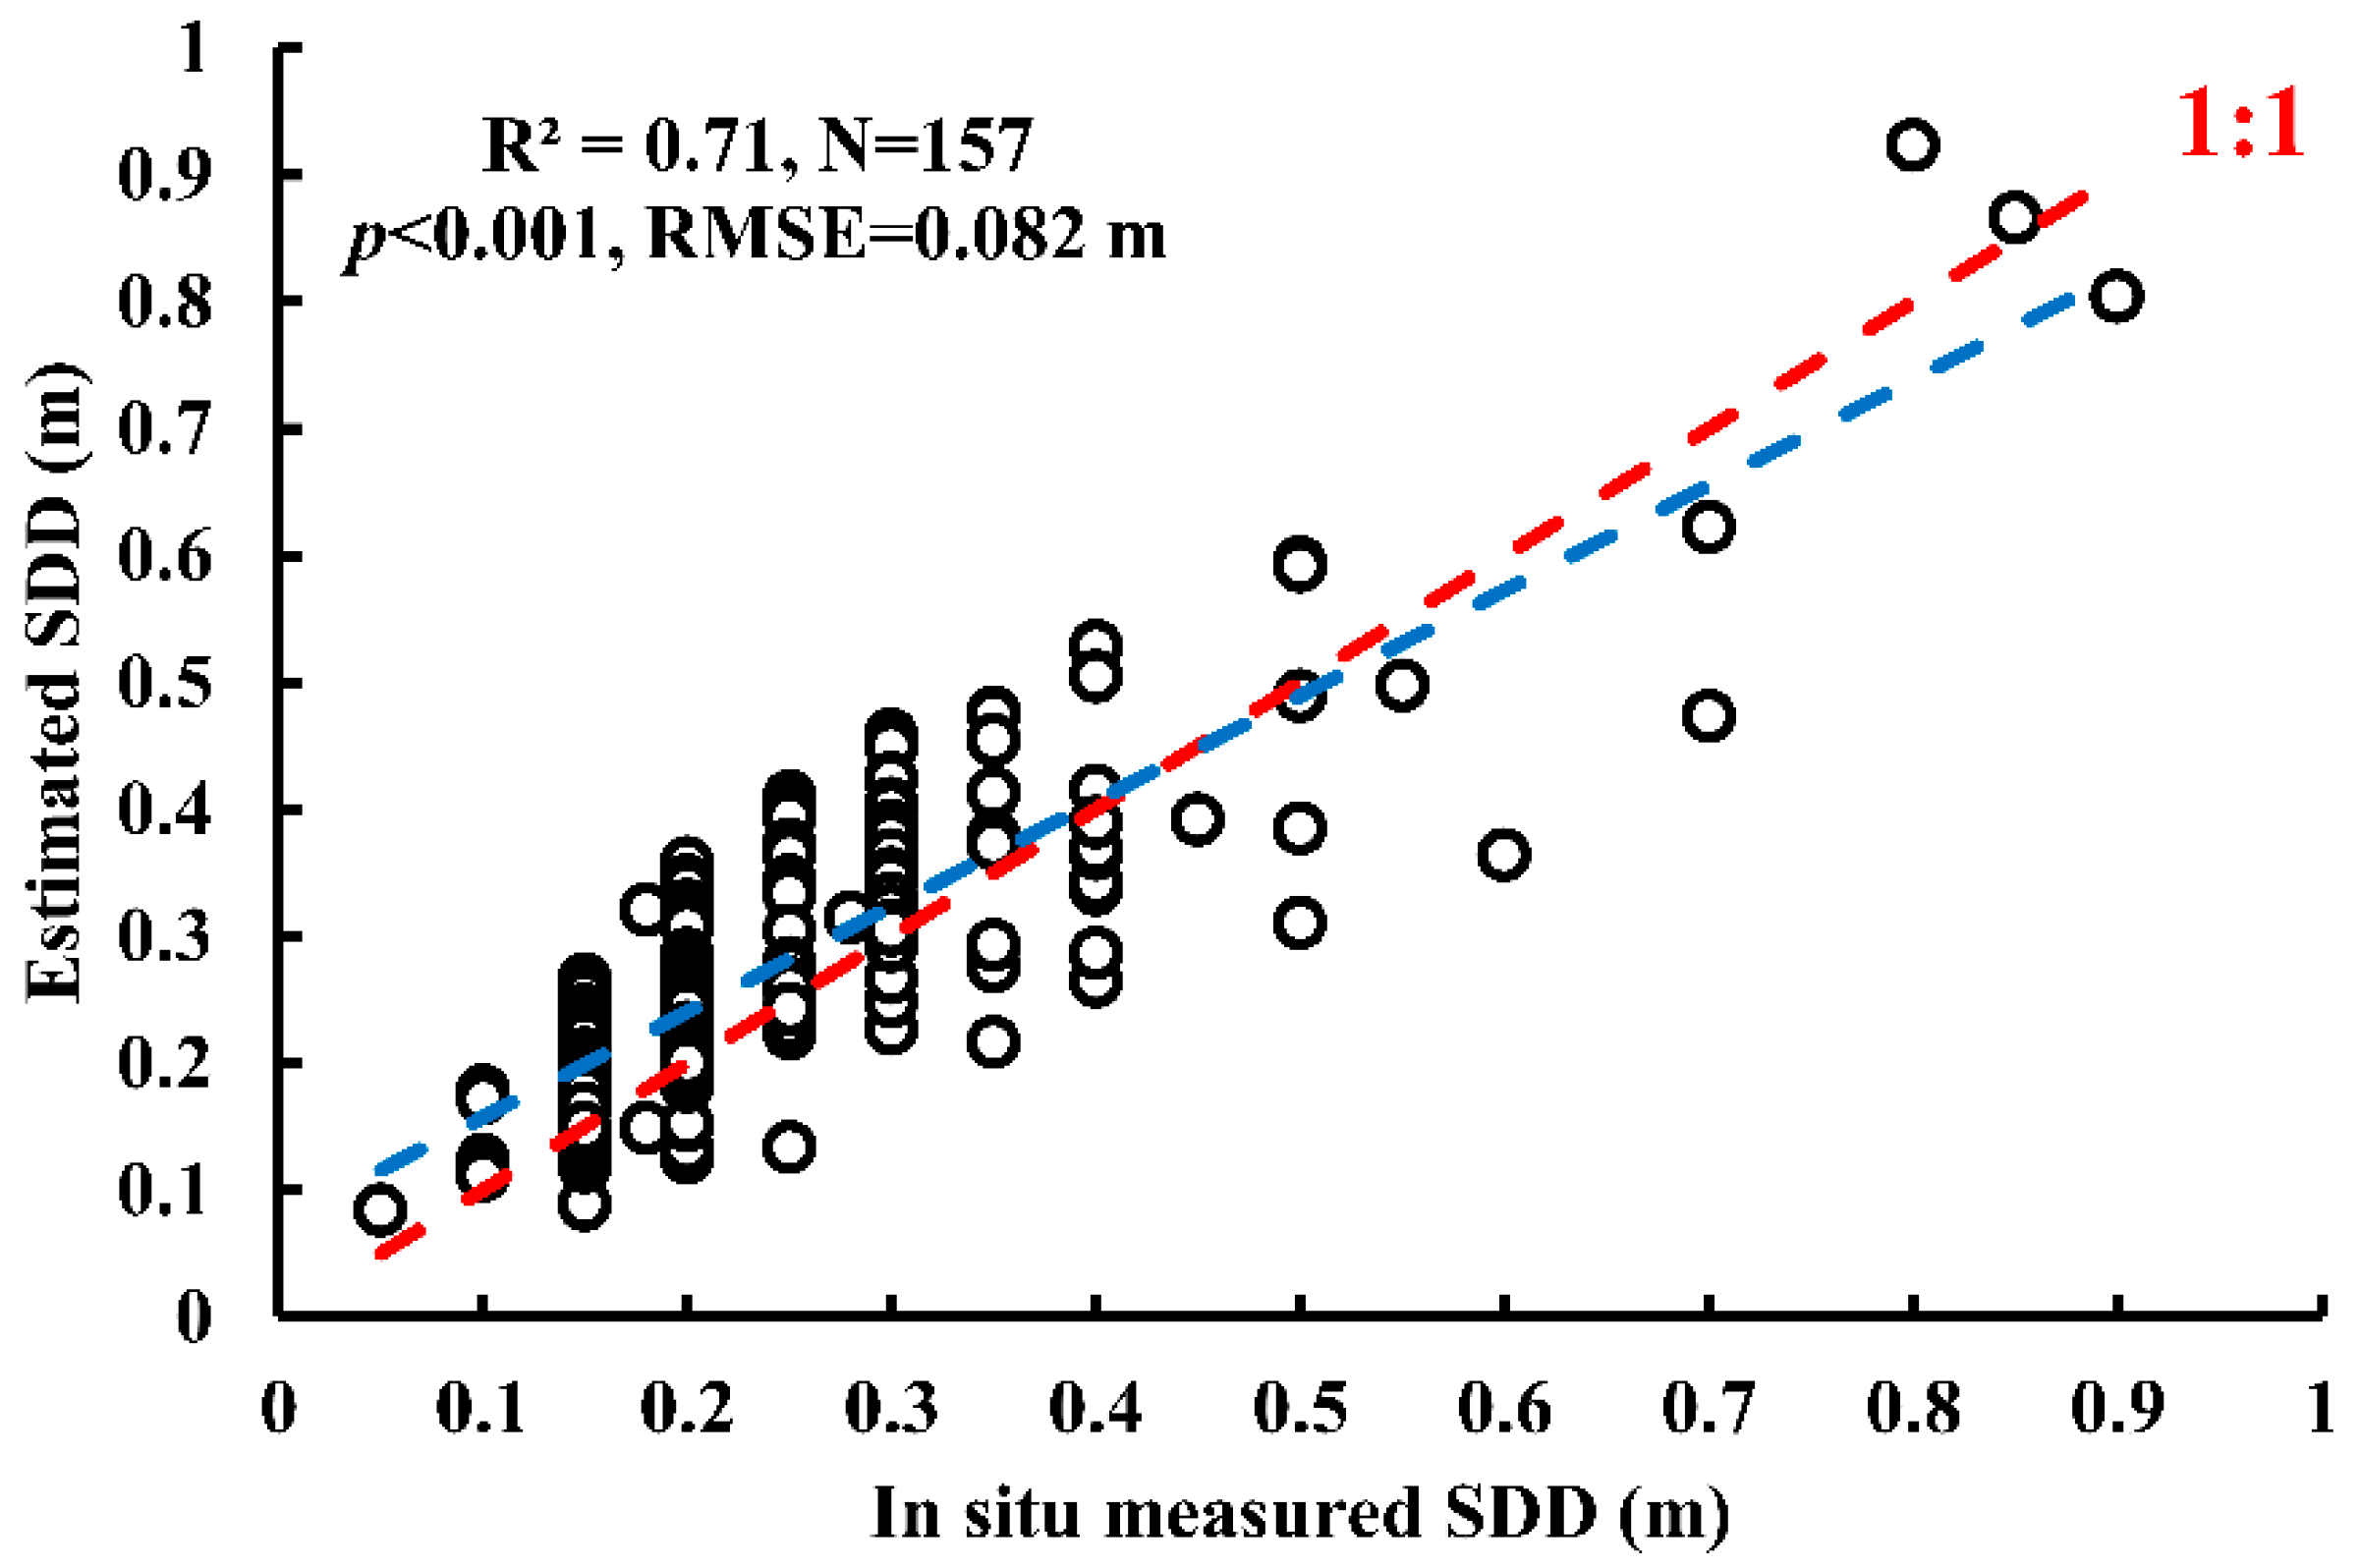
3.1. Validation of the SDD Estimation Model

To verify the performance and accuracy of the SDD estimation model developed in Lake Taihu when used in Lake Hongze, we matched the 340 in situ SDD measurements with satellite data. To ensure that the time difference of satellite data and measured data does not affect the results, we chose to match the satellite transit ± 6 h as paired data. The pixels used the mean value of the 3 × 3 pixels surrounding each station to carry out comparisons between in situ and satellite data. After excluding the in situ SDD data without satellite matching data, we obtained 157 pairs of matched data to validate the SDD estimation model. SDD ranged from 0.10 to 0.90 m, with a mean value of 0.26 m, for the matching dataset (N = 157), and 0.05 to 2.00 m, with a mean value of 0.26 m, for the entire dataset (N = 340).
Statistical analysis and linear regression for the obtained 157 pairs of matched data were performed, and the results showed good agreement and a strong linear correlation between the in situ measured and the remote sensing-estimated SDDs (R2 = 0.72, p < 0.001, N = 157). The REs of the model for the validation dataset ranged from 0.03% to 78.7% with a MAPE of 27.7% (RMSE = 0.082 m). The REs of 59.9% and 44.0% of the samples were below 30% and 20%, respectively. Additionally, the in situ measured and estimated SDDs by the empirical model were evenly distributed along a 1:1 line (Figure 2). The high determination coefficient and low errors obtained both showed that the SDD estimation model developed in Lake Taihu had satisfactory performance and good applicability in Lake Hongze. Therefore, the model could be used to quantify the spatial and temporal SDD distribution in Lake Hongze.

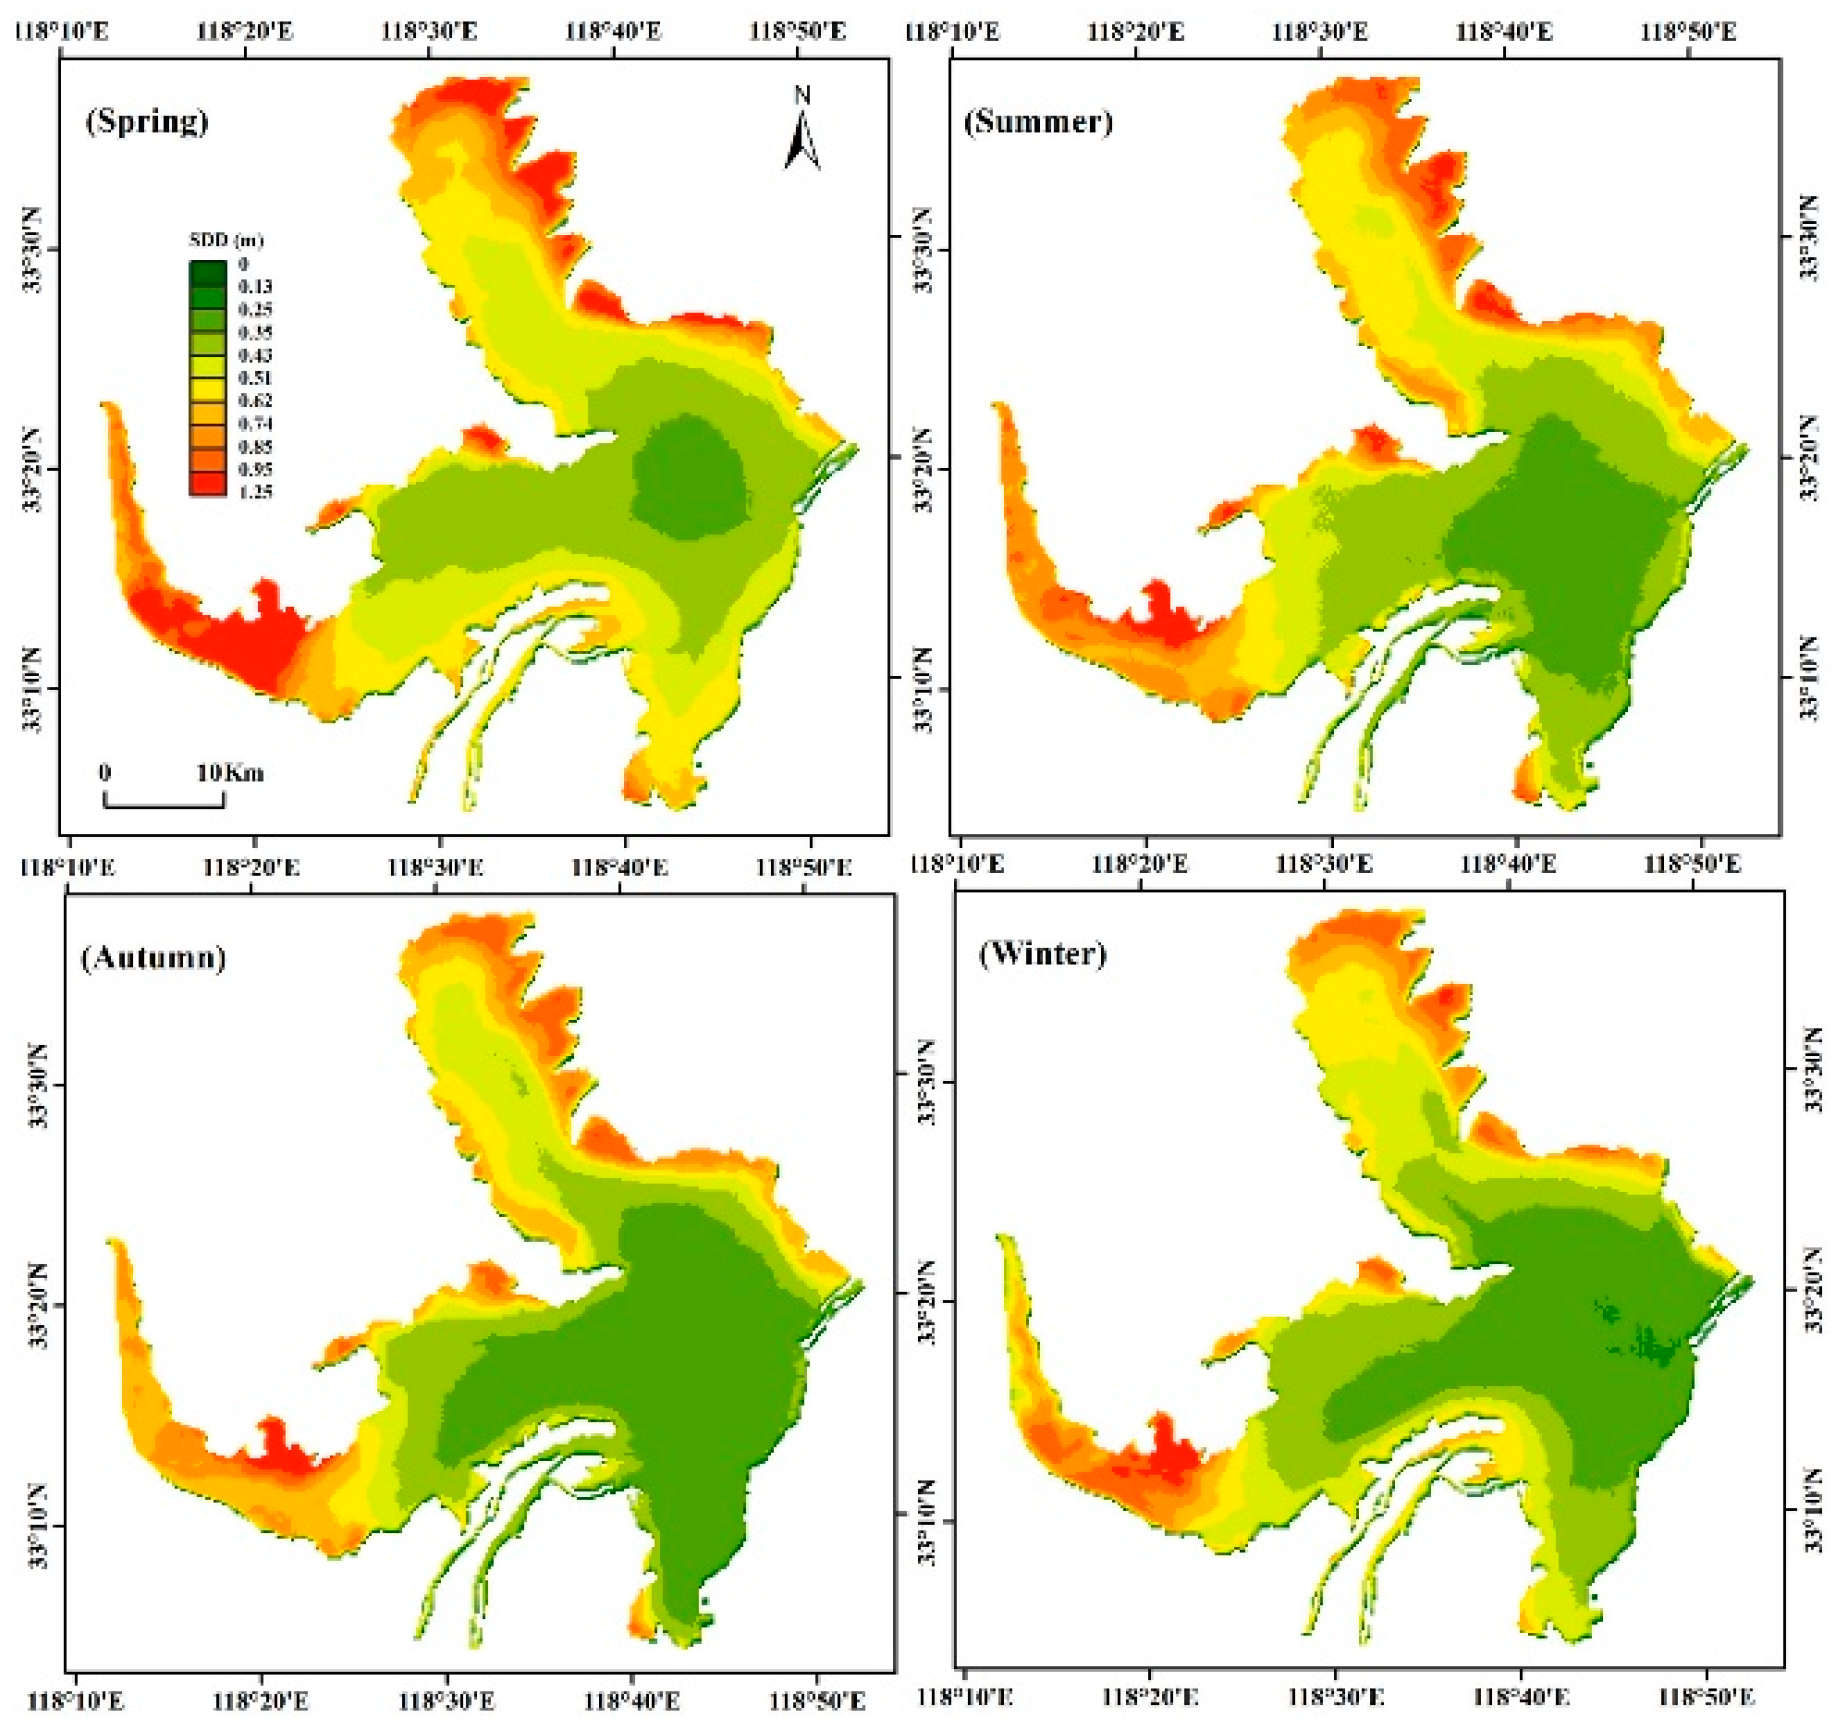
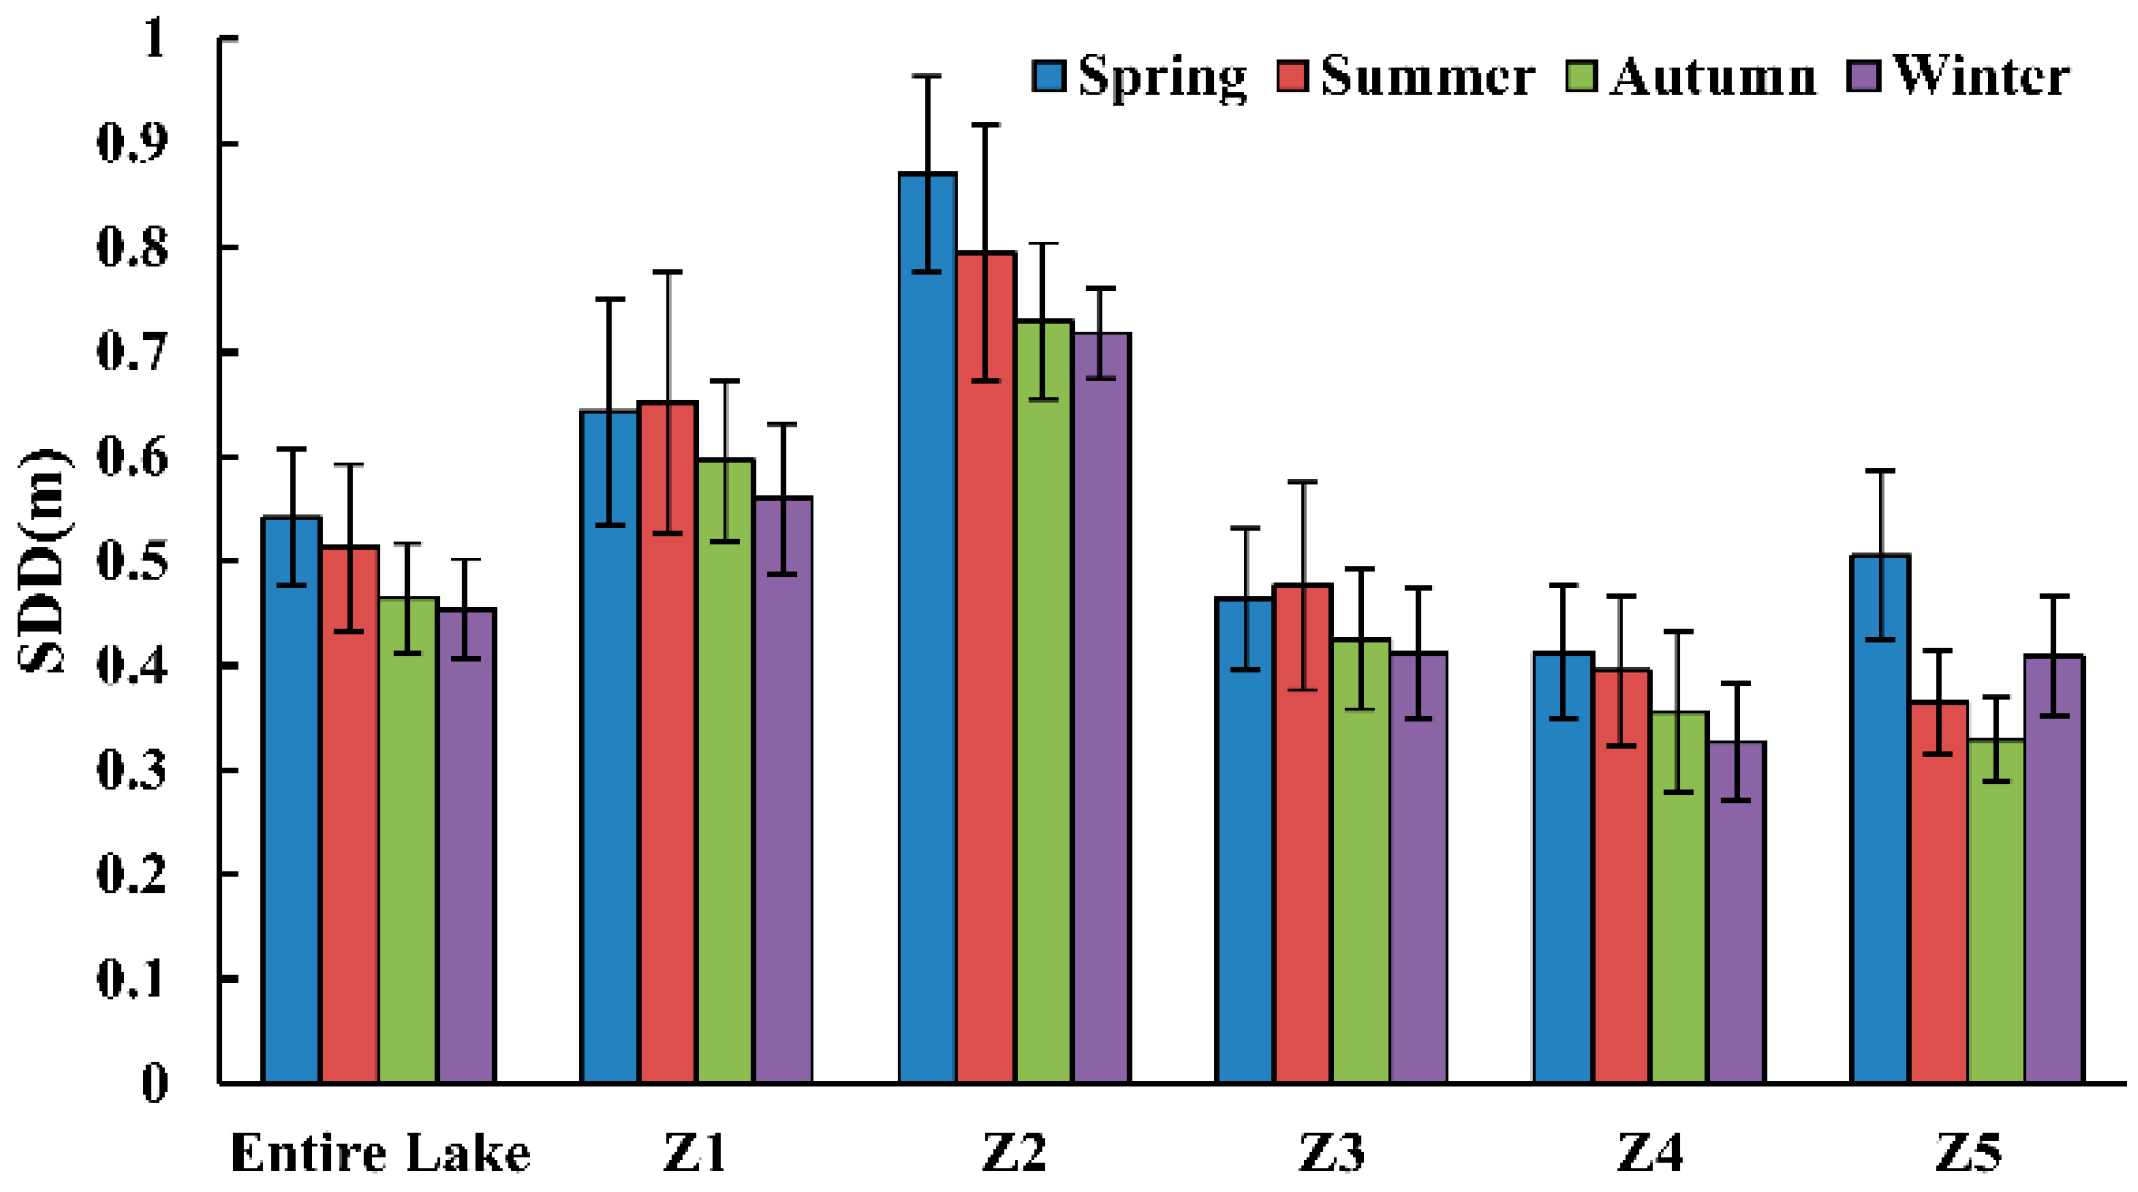
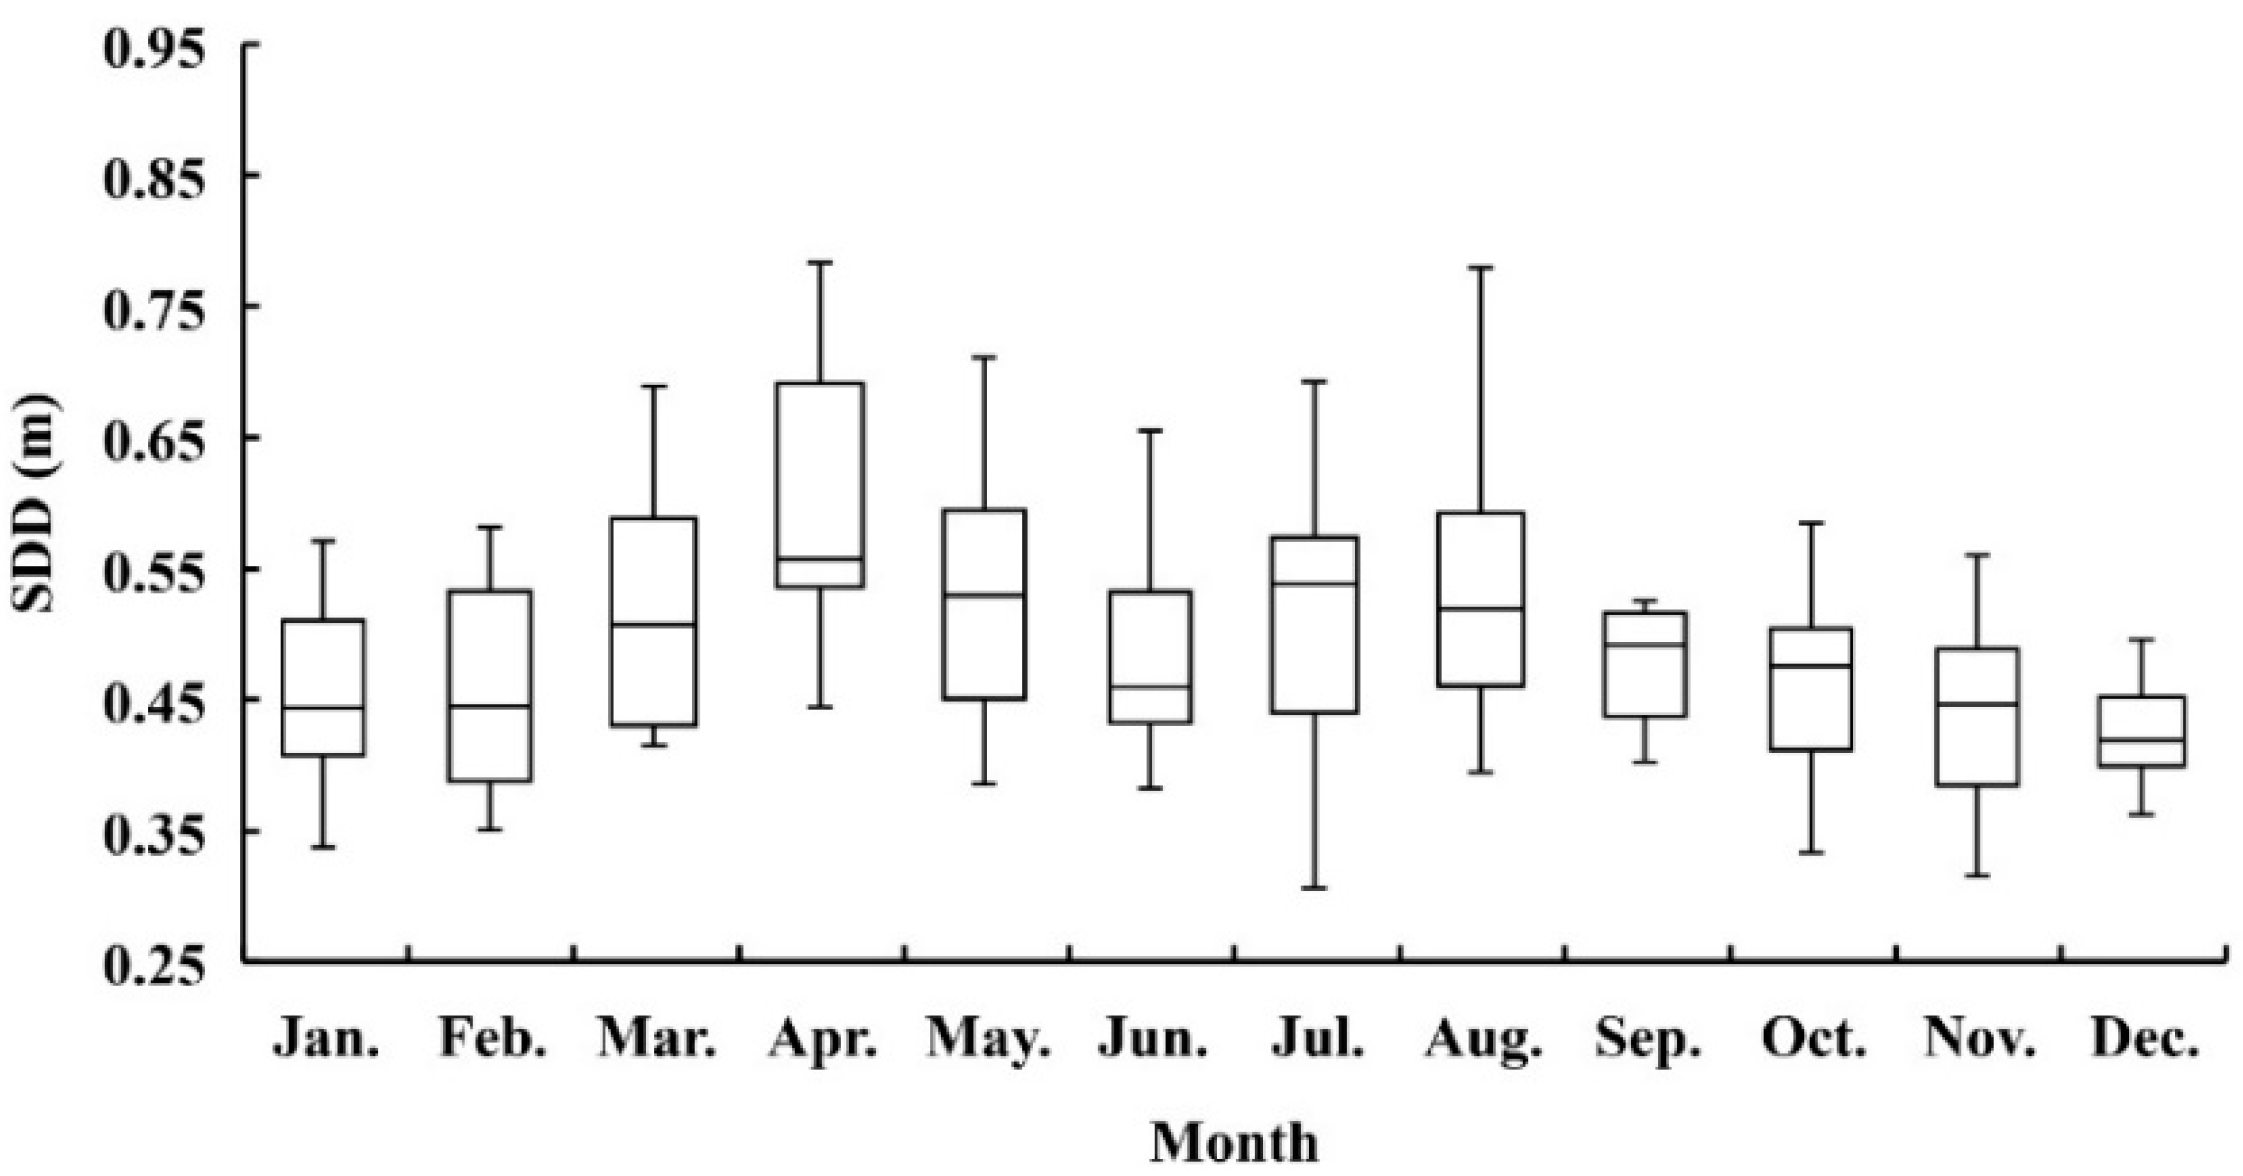
3.2. Temporal–Spatial Pattern of SDD

From 2003 to 2017, 1785 free-cloud images were used to calculate monthly and seasonal mean SDD distributions for Lake Hongze derived from MODIS-Aqua data using the validated estimation model (Equation (3)). Spatially, it is obvious that SDD of Z1 and Z2 is significantly higher than that of other lake segments throughout the year (Figure 3 and Figure 4) (Mann–Whitney U test, p < 0.01). In general, there were marked seasonal changes in the water transparency of the entire lake, which was relatively low over the four seasons (Figure 3). Overall, SDDs were higher in spring (March–May) and summer (June–August) and lower in autumn (September–November) and winter (December–February) (one way ANOVA, p < 0.001). The average values of the four seasons during the study period were 0.55 ± 0.07 m (average ± standard deviation) in spring, 0.52 ± 0.08 m in summer, 0.46 ± 0.05 m in autumn, and 0.45 ± 0.05 m in winter. The highest monthly mean SDD of 0.59 m appeared in April and the lowest monthly mean SDD of 0.43 m was found in November and December (Figure 5). Except for the Z5 with lower SDD in the summer and autumn than that in the spring and winter seasons, the other four sub-regions show the same seasonal variation pattern as the entire lake.

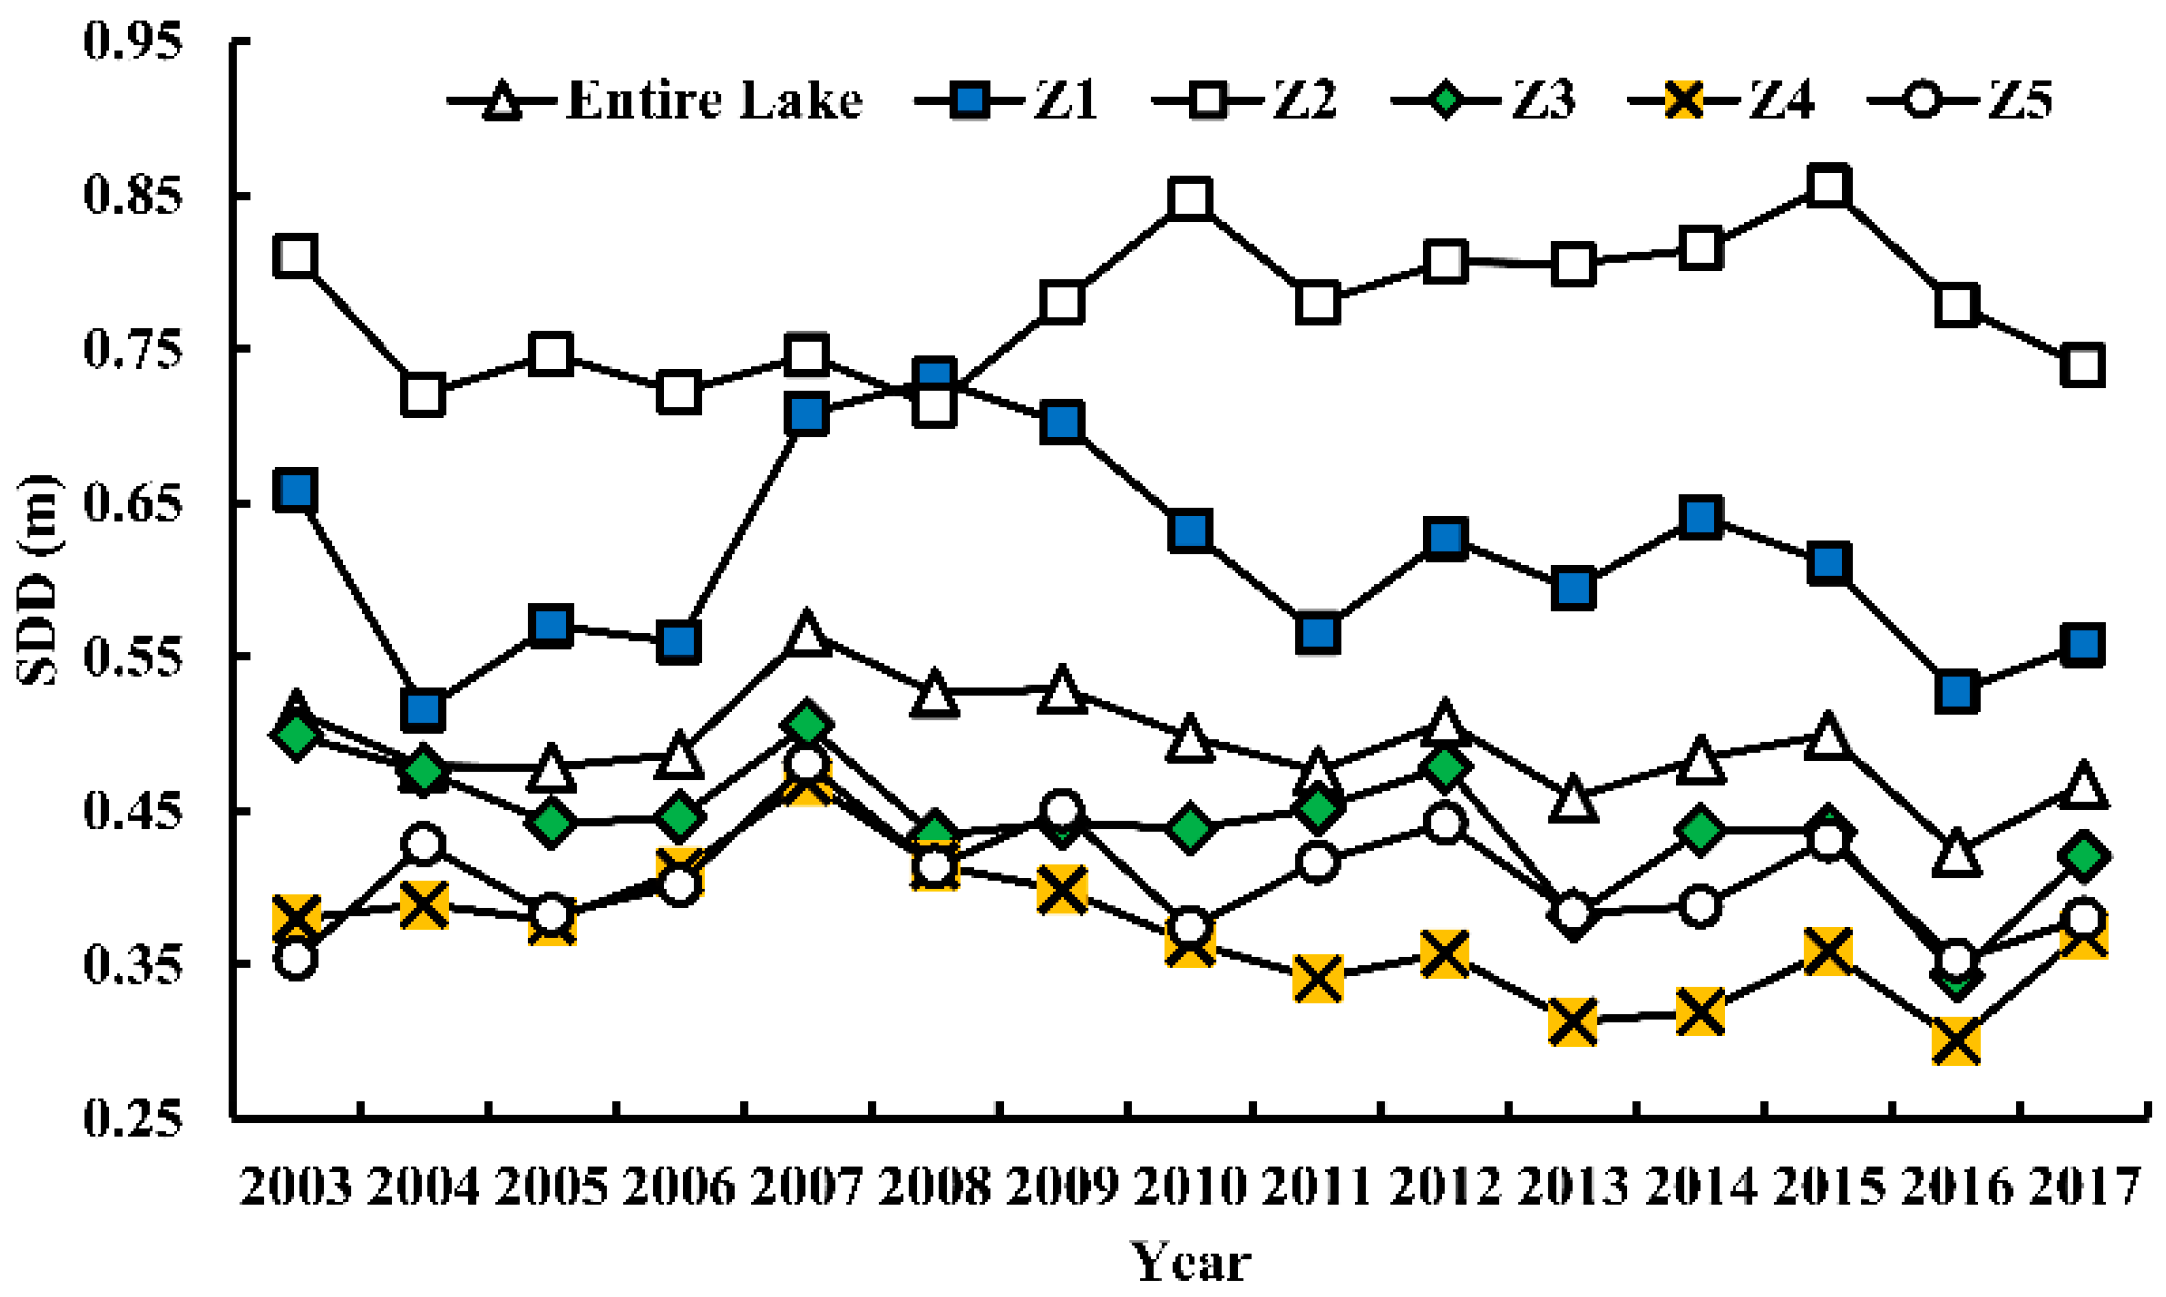
3.3. Long-Term Trends of SDD

Annual mean SDD in Lake Hongze exhibited distinct inter-annual and spatial variations from 2003 to 2017 (Figure 6). For the entire lake, the highest annual mean SDD was 0.57 m in 2007 and the lowest SDD of 0.42 m in 2016, with an average value of 0.49 ± 0.03 m from 2003 to 2017, suggesting Lake Hongze could be characterized by a highly turbid water. We divided the period into two stages to address the trend of SDD variations: Before (2003–2006) and after (2007–2017) start of sand mining. (1) From 2003 to 2006, the SDD in the entire ranged from 0.47 to 0.51 m, with an average value of 0.49 ± 0.02 m, and a slight increase of only 0.01m per year during 2004–2006. (2) From 2007 to 2017, the SDD in the entire lake exhibited a significant decreasing trend from 0.57 m in 2007 to 0.47 m in 2017 (R2 = 0.65, p = 0.003) (Figure 6), with a long-term mean value of 0.49 ± 0.04 m. A decrease of 17.3% in 2017 compared with 2007 indicated that the underwater light environment had experienced increased turbidity in the past 11 years.
To quantitatively explain the inter-annual and spatial distribution trends of the transparency of Lake Hongze, the time series of the annual mean value of the MODIS-Aqua derived SDDs from 2007 to 2017, including five regions (Z1, Z2, Z3, Z4, and Z5), are shown in Figure 6. Significant decreasing trends were found in Z1 (R2 = 0.68, p < 0.005), Z3 (R2 = 0.37, p < 0.05), Z4 (R2 = 0.53, p < 0.05), and Z5 (R2 = 0.40, p < 0.05). The four lake segments showed the same inter-annual variation pattern as the entire lake but no significant increasing or decreasing trend was found in the Z2 lake segment (p > 0.05), which had a stable value of 0.79 ± 0.04 m. In four regions, the fastest decline in SDD occurred in the Z1 lake segment, ranging from 0.71 m in 2007 to 0.56 m in 2017, with a 21.2% decrease. In terms of spatial distribution, the SDD values of the Z1 and Z2 regions were clearly higher than those of the entire lake and the other lake regions. The maximum value of the entire lake always appeared in the Z2 lake segment except for 2014, ranging from 1.05 m to 1.21 m. The SDD of the Z4 region was the lowest overall for the 11 years, which indicates that the lake waters in the east are the most turbid.

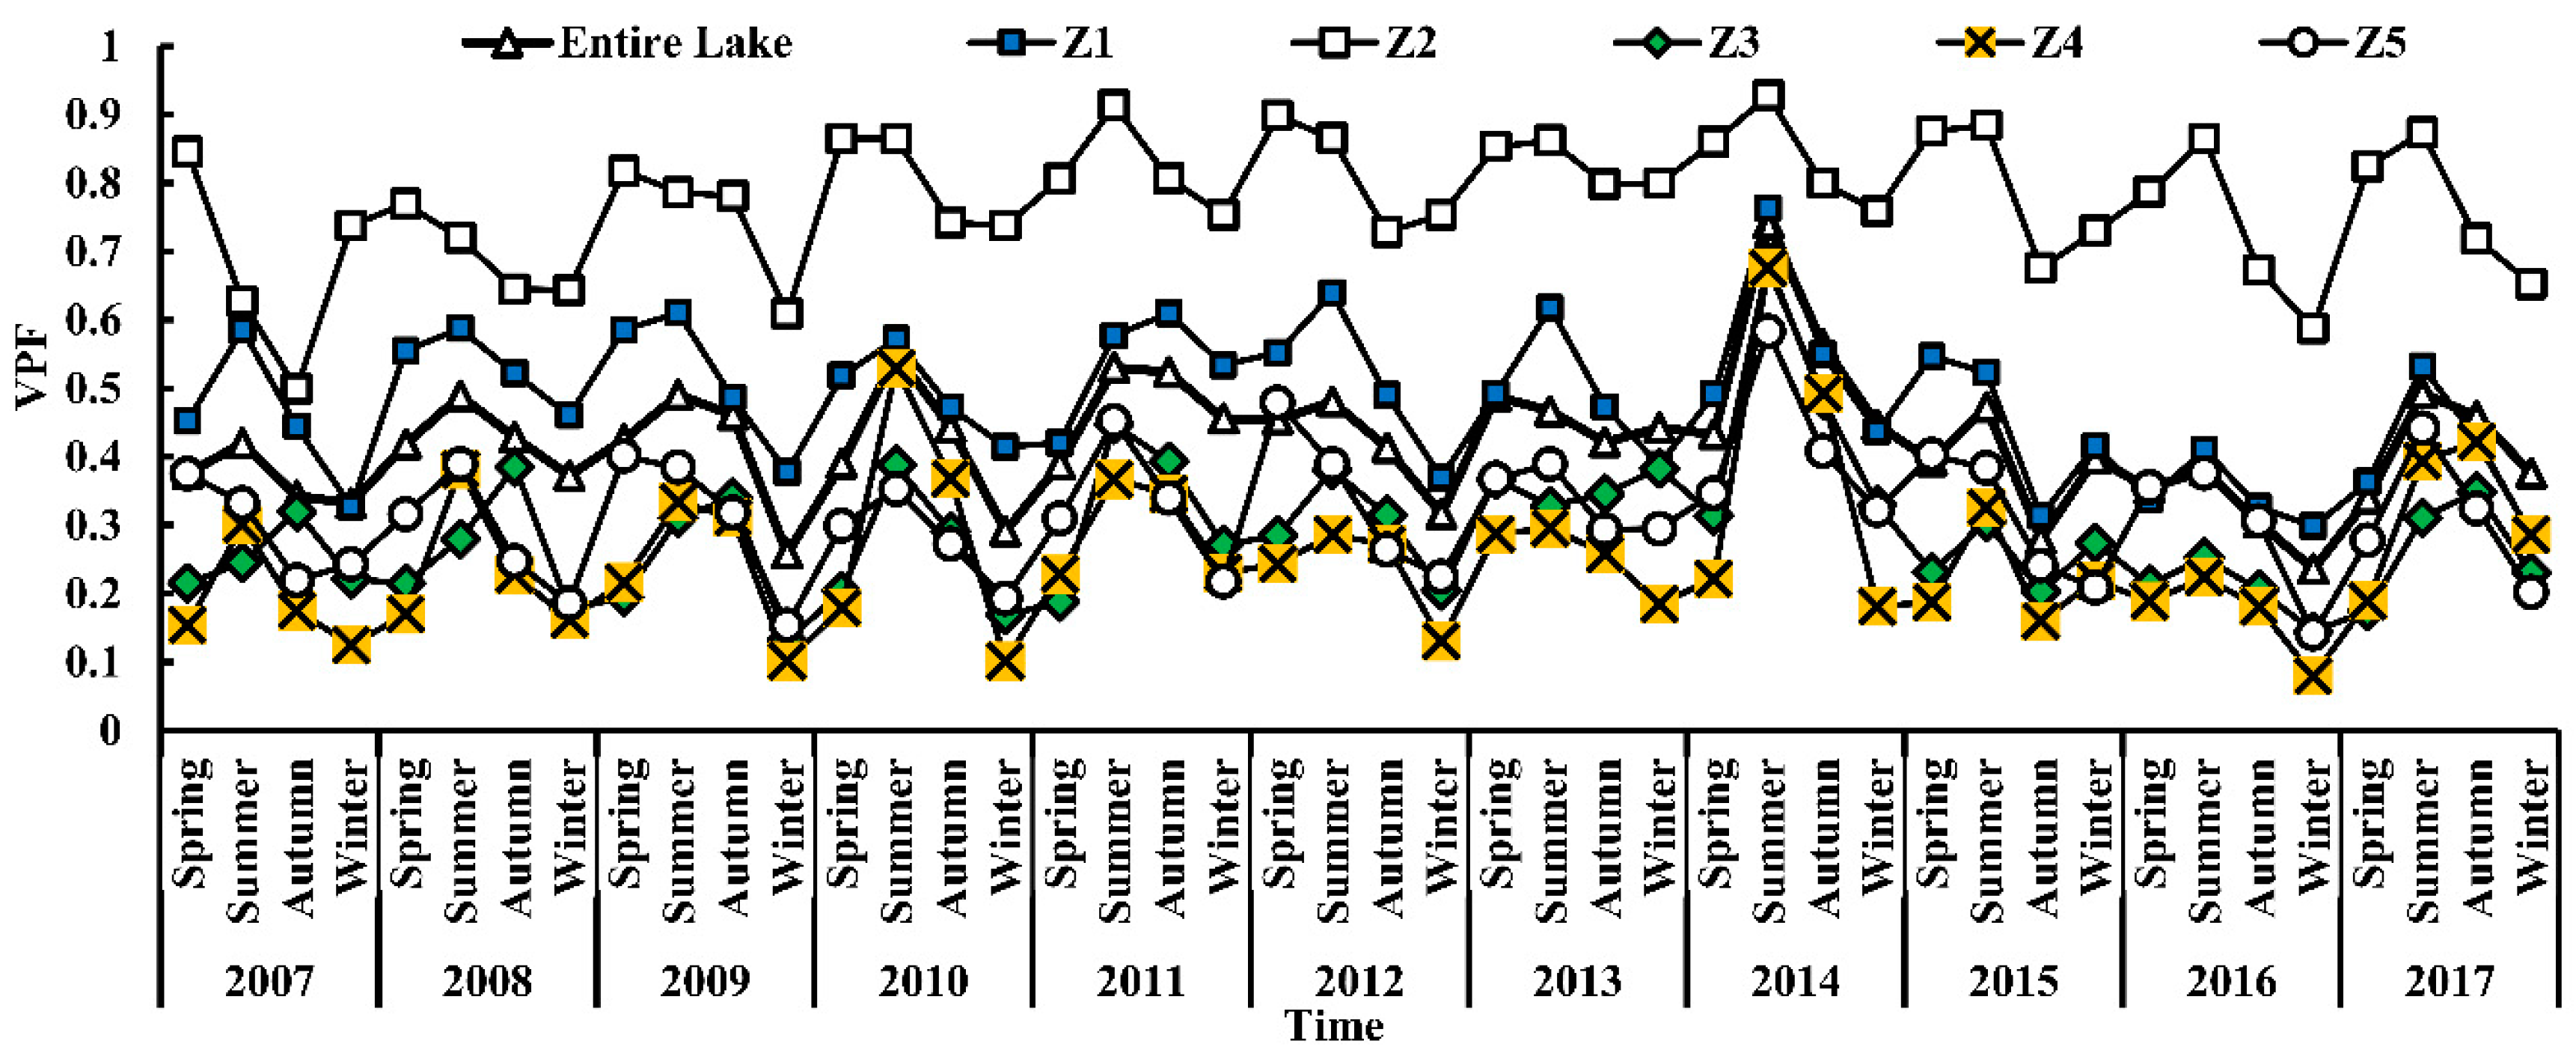
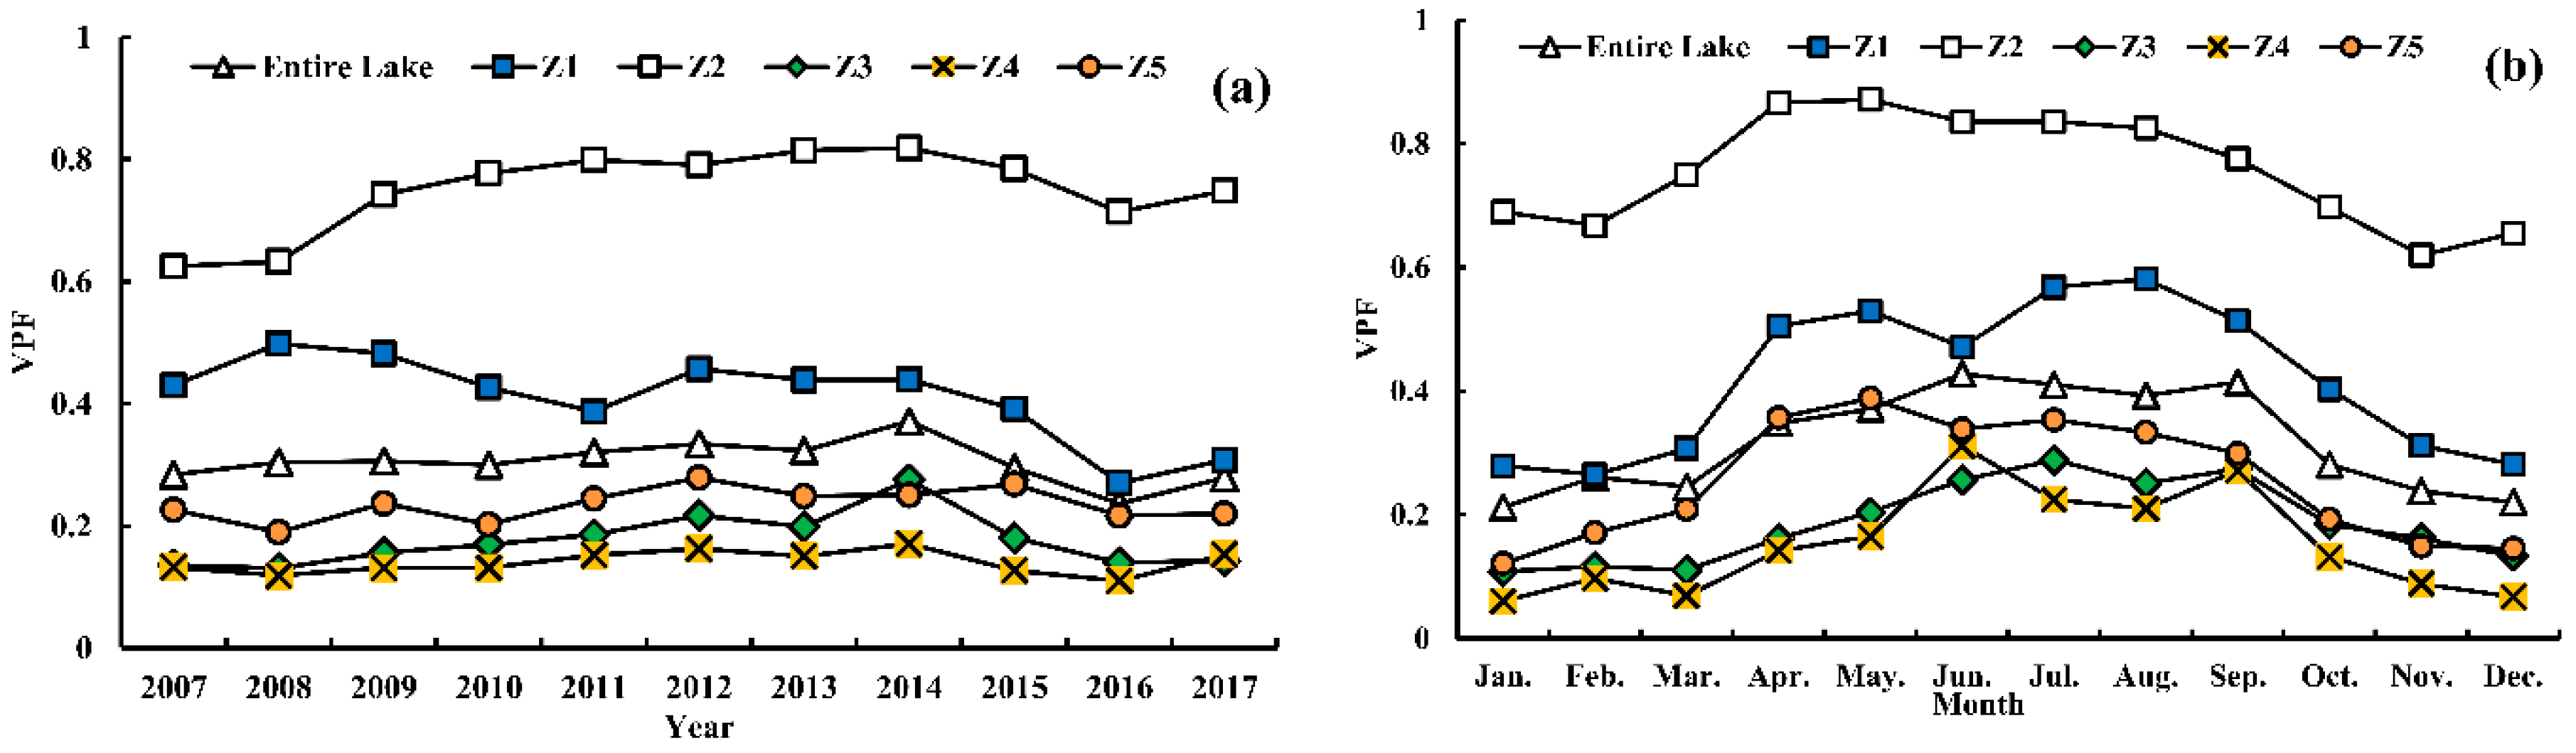
3.4. Temporal–Spatial Pattern of VPF

To explore the impact of reduced transparency on aquatic vegetation, the 11 years MODIS data was selected from 2007 to 2017 as a study period. The algorithm was applied to 1284 cloudless MODIS images, and the spatial and seasonal distribution of VPF was obtained for five lake segments and the entire lake. A clear seasonal repetition was revealed by time series of seasonal mean VPF for the whole of Lake Hongze (Figure 7), with the highest in summer, followed by spring and autumn, and the lowest in winter. Monthly, the highest value of VPF (0.43) appeared in June but the lowest value (0.21) was in January. The VPF from April to October was significantly higher than in the other months (one way ANOVA, p < 0.05) (Table 2), consistent with the growth period of aquatic vegetation.
Time-series maps of annual VPF for different lake segments were obtained by performing a mean calculation of all images for each year (Figure 8a). A linear regression analysis was performed for the entire lake that showed a weak decreasing trend, although without statistical significance (p = 0.64 > 0.05); the range over the past 11 years was from 0.37 in 2014 to 0.24 in 2016. However, owing to the heterogeneity of space, the VPF trend varied with the different lake areas. A significant and striking decreasing trend of VPF in the Z1 lake segment was found (R2 = 0.56; p < 0.01), with the highest value of 0.50 in 2008 and the lowest value of 0.27 in 2016, a decline of 45.8%. For the other four lakes segments, no significant decreasing or increasing trends were found for VPF (p > 0.05).
Spatially, the VPF of Lake Hongze is obviously different between lake segments. The VPF of the Z2 lake segment was significantly higher than that of other lake segments throughout the year (Mann–Whitney U test, p < 0.01), followed by Z1, and the lowest was in the Z4 lake segment; the monthly average values for 11 years were 0.76, 0.42 and 0.15, respectively (Figure 8b), which indicates high aquatic vegetation coverage in the Z1 and Z2 regions compared with the other lake segments.

4. Discussion

4.1. Natural Driving Mechanism of SDD Variations

For large shallow lakes, wind speed and waves are often considered to be important factors that affect sediment resuspension [46,47]. Under different wind waves condition, an increasing TSM concentration caused by wind waves enhanced PAR diffuse attenuation coefficients, resulting in less available light entering into the water column, which led to a decrease in euphotic depth and SDD [46]. Long-term meteorological observations showed that the annual mean wind speed significantly decreased from 3.55 to 1.82 m/s with a decrease of 48.7% from 1957 to 2017 (R2 = 0.89, p < 0.001) (Figure 9). Theoretically, the significant decrease in wind speed should cause an increase in SDD due to the weakening of sediment resuspension driven by wind. However, the SDD of Lake Hongze did not exhibit the expected increasing trend. In fact, no significant correlations were found between annual mean wind speed and SDD for the entire lake. Therefore, the result further showed that wind speed was not the main driving factor of the decreased SDD in Lake Hongze from 2003 to 2017. In order to explore the seasonal changes in SDD, we collected precipitation for spring-and-summer and autumn-and-winter respectively each year, showing a seasonal variation that higher in spring-and-summer and lower in autumn-and-winter. Statistically significant positive correlations were found between precipitation and SDD for entire lake (R2 = 0.34, p < 0.05), indicating that the seasonal variation of SDD may be affected by seasonal precipitation.
According to many previous studies, decreasing SDD is related to the discharge of input rivers [20,27]. Although seven rivers discharge into Lake Hongze, the Huai River accounts for 70% of the total runoff [19,30,32]. Before the start of the sand mining in 2007, the annual mean SDD were not higher even lower than in 2007 for the entire lake. Before sand mining, the annual average sediment from Huai River was 5.53 million ton with 2.46 million tons more than after sand mining. In addition, serious water pollution incidents occurred during 2003–2006. For instance, heavy rains in the middle and upper reaches of the Huai River caused more than 500 million tons of high-concentration sewage to form a pollution group of 133 kilometers in 2004, affecting the downstream Hongze Lake [48]. This reasons may explain the low value of SDD comparing with 2007 before sand mining. To further discover whether the Huaihe River runoff has driven the inter-annual and seasonal variation of SDD in Lake Hongze after sand mining, we performed a correlation analysis between monthly mean runoff and SDD from 2007 to 2017. However, no significant correlations were found between Huai River runoff for the entire lake and Z2 region (p > 0.05). In addition, there is no statistically significant correlation between annual mean and seasonal mean runoff and transparency for the whole lake (p > 0.05). Therefore, runoff cannot explain the long-term decreasing trend of SDD in Lake Hongze from 2007 to 2017. Considering that the reduced wind speed is beneficial for reducing wind-induced sediment resuspension and increasing SDD, the changes of the main natural conditions of wind speed and runoff cannot decrease and may even increase SDD in Lake Hongze.

4.2. Human-Induced Driving Mechanism of SDD Variations

With the development of urbanization in China, the demand for sandstone for buildings is increasing day by day, and sand mining activities are found in rivers, lakes and coastal areas [49]. At the end of the 20th century, the annual sand production in the middle and lower reaches of the Yangtze River reached 80 million tons per year, and the demand for sand is expected to increase by 55–110% in the next 20 years [50]. The dredging activity not only destroyed the sediment structure of the lake but also resulted in sediment resuspension, which enhances the scattering of light and hinders the propagation of light in the water column, resulting in a decrease in SDD and the disturbance of aquatic ecosystems [49].
The sand mining activities of Lake Hongze began in 2007 when high-quality sand sources were discovered in the Huai River estuary; the sand mining vessels then quickly increased to more than 100 [34]. However, with the discovery of sand sources in other lake segments, the sand mining area spread rapidly to the entire lake, and by 2016 more than 600 sand mining vessels were observed on Landsat images [30]. Previous studies have found that sand mining activities rapidly increased TSM [30,33,37]. Then, 1785 high-quality images were applied to the model (Equation (1)) to obtain a TSM concentration dataset in Lake Hongze from 2003 to 2017. Therefore, the relationship between SDD and the TSM concentrations of the Z1 and Z4 lake segments with frequent sand mining activities were analyzed to explore the impact of sand mining activities on SDD. The results showed that the monthly mean SDD was significantly negatively correlated with TSM concentration in Z1 (R2 = 0.41, p < 0.001) and Z4 (R2 = 0.62, p < 0.001) lake segments (Figure 10). The marked correlation thus demonstrated that the decreased SDD could be explained by an increased TSM concentration caused by artificial sand mining activities.
In addition, sand mining activities have increased the turbidity of the water body, which has had negative effects on the aquatic ecosystem [32]. Therefore, the illegal sand mining activities of the lake were severely diminished and then banned by the government department in March 2017 in Lake Hongze. Compared with 2016, TSM concentration decreased by 7.3 mg/L for the entire lake, with dramatic declines in the open water areas of the Z3 and Z4 regions of 10.6 and 10.3 mg/L, respectively. In contrast, it was clearly seen that SDD had rapidly risen in Lake Hongze, except for Z2 in 2017, in which almost no sand mining activity was found (Figure 4); the Z3 and Z4 regions increased by 0.077 m and 0.069 m, respectively, which suggested that water quality has significantly improved. SDD was in good agreement with the timing of sand mining activities, which further confirmed that the decrease in SDD could be attributed to the increase in TSM concentration caused by artificial sand mining activities.

4.3. Reciprocal Relationship between SDD and Aquatic Vegetation

It is well known that many lakes are facing a decline in transparency and the area of global aquatic vegetation is decreasing [9,40]. SDD is the main environmental factor for the survival and growth of submerged aquatic vegetation seedlings. With a low value of SDD, the seedlings of submerged plants would die in large numbers due to insufficient light [38]. Therefore, SDD is an important parameter for limiting the growth and distribution of submerged aquatic vegetation. To better understand the interaction between aquatic vegetation and SDD, linear regressions between the average SDD and VPF were performed.
However, there was no significant correlation between VPF and SDD derived from MODIS images for the entire lake (p > 0.05), which may be attributed to the uneven distribution of submerged aquatic vegetation. For the five regions, the ratio of the total area of aquatic vegetation in the Z1 and Z2 areas to the area of aquatic vegetation in the entire lake was as high as 83.83% in 2007, and the lowest ratio was 65.51% in 2016; the other segments accounted for approximately 10%. Therefore, we selected the lake segments (Z1, Z2) covered by aquatic vegetation for analysis. VPF exhibited significant positive correlations with the annual mean SDD in the Z1 and Z2 regions (R2 = 0.71, p ≤ 0.001; R2 = 0.54, p ≤ 0.01, respectively) (Figure 11), which indicates that submerged aquatic vegetation variation is mainly affected by SDD in Lake Hongze.
Previous studies have shown that submerged aquatic vegetation is also beneficial to the improvement of water quality by the weakening of wind-induced waves, which inhibits sediment resuspension and internal nutrient release [8,18,44]. Therefore, the result further confirmed a positive feedback between SDD and submerged aquatic vegetation. The SDDs of the Z1 and Z2 regions being significantly higher than that of other regions could thus be explained by their being covered by more submerged aquatic vegetation than in the other lake regions.

4.4. Potential Significance of this Study

Human-induced SDD decreases in Lake Hongze further confirmed that the decreasing trend of SDD is occurring throughout the world under the combined effect of human activities and changes in the natural environment [19,22,23]. Long-term observations of the wind speed in Lake Hongze show that a trend of decreasing wind speed will contribute to SDD increases and improve the underwater light environment. Since the strict sand mining policy was formulated in 2017, sand mining activities have been well controlled and water transparency has significantly increased [33]. Therefore, an increasing trend of SDD is predicted under the strict sand mining policy and reduced wind speeds. The increase in SDD indicated that more light will be available and that the depth of the euphotic zone will increase [15,22], which may promote the germination and photosynthesis of aquatic vegetation seedlings [38] and thus increase vegetation coverage and primary productivity. Then, the increased vegetation will in turn promote the improvement of water transparency by positive feedback [51]. In addition, with the restoration of aquatic vegetation, animals in the lake are provided with places for spawning and habitation, which is conducive to the recovery of species and the quantity of fish and benthic animals. A benign cycle is gradually formed.
However, according to the previous policy management experience of Lake Hongze, once the policy is relaxed or the law enforcement is not strict, the sand mining activities will return and transparency may continue to decrease. The structure of the lake bottom will be further damaged, which will cause great obstacles to the restoration of aquatic vegetation and benthic organisms in the future [33]. The reduction of transparency further limits the growth and distribution of aquatic vegetation [8], which may results in desertification at the bottom of the lake. The sand mining activities disturb the sediment by sand mining, sand washing, and other factors, which not only increases TSM concentration but also releases nutrients from the sediments to the water column and thus increases the nutrient load of the water body [3,46,47]. Studies have shown that weak underwater light conditions are beneficial to the growth of phytoplankton in the upper water layer. Under the stimulus of light, phytoplankton accumulates at the surface layer of water bodies, which increases the absorption of light and further reduces the underwater light. Reduced transparency, vegetation degradation, phytoplankton growth, and nutrient release will accelerate the transformation of the nutritional status of Lake Hongze and eventually form an algae-dominated ecosystem.
Therefore, the policy and implementation of the management department will determine the future direction of the transparency of Lake Hongze and affect the downstream drinking water safety of the South-to-North Water Diversion Project in China. It is thus urgent to formulate the following policies and measures to curb sand mining activities and improve water transparency: (1) strengthen the formulation and implementation of government policies, which will increase the cost of illegal sand mining; (2) conduct environmental protection education about sand mining hazards to local fishermen; and (3) protect aquatic vegetation in littoral lakes and bays to increase transparency.
In this study, the use of MODIS-Aqua data to estimate the SDD value of Lake Hongze, study the temporal and spatial variations, and elucidate the dominant factors that affect SDD change have many important implications for lake water quality management and eutrophication control. Our results provide an important basis and data for the restoration and management of Lake Hongze’s aquatic ecological environment and provide opinions and suggestions for the local government with respect to lake management

5. Conclusions

In this study, a SDD estimation model developed in Lake Taihu was validated using in situ SDD measurement data of Lake Hongze. Statistical results showed that the model performed well in estimating SDD in Lake Hongze during 2003–2017 (MAPE = 27.7%, RMSE = 0.082 m). Seasonally, SDD over the entire lake was higher in spring and summer than in autumn and winter, with the peak in April. Spatially, SDD was obviously higher in high vegetation coverage regions (such as Z1 and Z2) than in regions with less vegetation coverage (Z3–Z5). The inter-annual variations of the SDD of Lake Hongze showed a decreasing trend from 2007 to 2017, with an average of 0.49 m, ranging from 0.57 m in 2007 to 0.42 m in 2016 (a decrease of 26.3%), indicating that less available light enters into water column. Significant correlations were found between VPF and SDD in the Z1 and Z2 regions. A long-term decreasing trend of SDD in Lake Hongze was driven by a TSM increase caused by sand mining activities. Increasing TSM concentration, as a result of the activities of sand mining, may be responsible for decreasing SDD in the Z4 region. Our research provides important information for quantifying the spatial and temporal distribution of the SDD, and is of great significance to future aquatic vegetation protection, water ecological security, etc. in Lake Hongze.

Author Contributions

Conceptualization, N.L., K.S., and Y.Z. (Yunlin Zhang); Data curation, Z.G. and K.P.; Methodology, N.L.; Resources, Z.G. and K.P.; Software, N.L. and Y.Z. (Yibo Zhang); Validation, N.L. and Y.Z. (Yong Zha); Writing—original draft, N.L.; Writing—review and editing, Y.Z. (Yunlin Zhang), K.S. and Y.Z. (Yong Zha).

Funding

This research was funded by the National Natural Science Foundation of China (grants 41771472 and 41621002), the Key Program of the Chinese Academy of Sciences (ZDRW-ZS-2017-3-4), Youth Innovation Promotion Association (CAS) (2017365), the Key Research Program of Frontier Sciences of the Chinese Academy of Sciences (QYZDB-SSW-DQC016), NIGLAS Foundation (NIGLAS2017GH03 and NIGLAS2017QD08), Project of science and technology of Water Conservancy Department of Jangsu Province (2018039) and Program of Field Station Alliance, Chinese Academy of Sciences (KFJ-SW-YW036).

Acknowledgments

We would like to thank our all colleagues attending the field investigation.

Conflicts of Interest

The authors declare no conflict of interest.

References

  1. Cao, Z.; Duan, H.; Shen, M.; Ma, R.; Xue, K.; Liu, D.; Xiao, Q. Using VIIRS/NPP and MODIS/Aqua data to provide a continuous record of suspended particulate matter in a highly turbid inland lake. Int. J. Appl. Earth Obs. Geoinf. 2018, 64, 256–265. [Google Scholar] [CrossRef]
  2. Wu, G.; De Leeuw, J.; Skidmore, A.K.; Prins, H.H.T.; Liu, Y. Comparison of MODIS and Landsat TM5 images for mapping tempo-spatial dynamics of Secchi disk depths in Poyang Lake National Nature Reserve, China. Int. J. Remote Sens. 2008, 29, 2183–2198. [Google Scholar] [CrossRef]
  3. Feng, L.; Hu, C.; Chen, X.; Tian, L.; Chen, L. Human induced turbidity changes in Poyang Lake between 2000 and 2010: Observations from MODIS. J. Geophys. Res. Oceans 2012, 117, 1–19. [Google Scholar] [CrossRef]
  4. Shi, K.; Zhang, Y.; Xu, H.; Zhu, G.; Qin, B.; Huang, C.; Liu, X.; Zhou, Y.; Lv, H. Long-term satellite observations of microcystin concentrations in Lake Taihu during cyanobacterial bloom periods. Environ. Sci. Technol. 2015, 49, 6448–6456. [Google Scholar] [CrossRef] [PubMed]
  5. Baastrup-Spohr, L.; Sand-Jensen, K.; Olesen, S.C.H.; Bruun, H.H. Recovery of lake vegetation following reduced eutrophication and acidification. Freshw. Biol. 2017, 62, 1847–1857. [Google Scholar] [CrossRef]
  6. Aguilera, A.; Haakonsson, S.; Martin, M.V.; Salerno, G.L.; Echenique, R.O. Bloom-forming cyanobacteria and cyanotoxins in Argentina: A growing health and environmental concern. Limnologica 2018, 69, 103–114. [Google Scholar] [CrossRef]
  7. Qin, B.; Li, W.; Zhu, G.; Zhang, Y.; Wu, T.; Gao, G. Cyanobacterial bloom management through integrated monitoring and forecasting in large shallow eutrophic Lake Taihu (China). J. Hazard. Mater. 2015, 287, 356–363. [Google Scholar] [CrossRef] [PubMed]
  8. Zhang, Y.; Liu, X.; Qin, B.; Shi, K.; Deng, J.; Zhou, Y. Aquatic vegetation in response to increased eutrophication and degraded light climate in Eastern Lake Taihu: Implications for lake ecological restoration. Sci. Rep. 2016, 6, 23867. [Google Scholar] [CrossRef] [PubMed] [Green Version]
  9. Zhang, Y.; Jeppesen, E.; Liu, X.; Qin, B.; Shi, K.; Zhou, Y.; Thomaz, S.M.; Deng, J. Global loss of aquatic vegetation in lakes. Earth-Sci. Rev. 2017, 173, 259–265. [Google Scholar] [CrossRef]
  10. Alikas, K.; Kratzer, S. Improved retrieval of Secchi depth for optically-complex waters using remote sensing data. Ecol. Indic. 2017, 77, 218–227. [Google Scholar] [CrossRef]
  11. Rodrigues, T.; Alcântara, E.; Watanabe, F.; Imai, N. Retrieval of Secchi disk depth from a reservoir using a semi-analytical scheme. Remote Sens. Environ. 2017, 198, 213–228. [Google Scholar] [CrossRef]
  12. Kirk, J.T.O. Optical water quality: What does it mean and how should we measure it? Water Pollut. Control Fed. 1988, 60, 194–197. [Google Scholar] [CrossRef]
  13. Steel, E.A.; Neuhausser, S. Comparison of methods for measuring visual water clarity. J. N. Am. Benthol. Soc. 2002, 21, 326–335. [Google Scholar] [CrossRef]
  14. Doron, M.; Babin, M.; Hembise, O.; Mangin, A.; Garnesson, P. Ocean transparency from space: Validation of algorithms estimating secchi depth using MERIS, MODIS and SeaWiFS data. Remote Sens. Environ. 2011, 115, 2986–3001. [Google Scholar] [CrossRef]
  15. Zhang, Y.; Liu, X.; Yin, Y.; Wang, M.; Qin, B. Predicting the light attenuation coefficient through Secchi disk depth and beam attenuation coefficient in a large, shallow, freshwater lake. Hydrobiologia 2012, 693, 29–37. [Google Scholar] [CrossRef]
  16. Brezonik, P.L. Trophic state indices: Rational for multivariate approaches. Lake Reserv. Manag. 1984, 1, 441–445. [Google Scholar] [CrossRef]
  17. Carlson, R.E. A trophic state index for lakes. Limnol. Oceanogr. 1977, 22, 361–369. [Google Scholar] [CrossRef] [Green Version]
  18. Liu, X.; Zhang, Y.; Yin, Y.; Wang, M.; Qin, B. Wind and submerged aquatic vegetation influence bio-optical properties in large shallow Lake Taihu, China. J. Geophys. Res. Biogeosci. 2013, 118, 713–727. [Google Scholar] [CrossRef] [Green Version]
  19. Shang, S.; Lee, Z.; Shi, L.; Lin, G.; Wei, G.; Li, X. Changes in water clarity of the Bohai Sea: Observations from MODIS. Remote Sens. Environ. 2016, 186, 22–31. [Google Scholar] [CrossRef] [Green Version]
  20. Wu, Z.; Zhang, Y.; Zhou, Y.; Liu, M.; Shi, K.; Yu, Z. Seasonal-spatial distribution and long-term variation of transparency in Xin’anjiang Reservoir: Implications for reservoir management. Int. J. Environ. Res. Public Health 2015, 12, 9492–9507. [Google Scholar] [CrossRef]
  21. Olmanson, L.G.; Brezonik, P.L.; Bauer, M.E. Geospatial and temporal analysis of a 20-year record of Landsat-based water clarity in Minnesota’s 10,000 Lakes. JAWRA J. Am. Water Resour. Assoc. 2014, 50, 748–761. [Google Scholar] [CrossRef]
  22. Capuzzo, E.; Stephens, D.; Silva, T.; Barry, J.; Forster, R.M. Decrease in water clarity of the southern and central North Sea during the 20th century. Glob. Chang. Biol. 2015, 21, 2206–2214. [Google Scholar] [CrossRef] [PubMed] [Green Version]
  23. Shi, K.; Zhang, Y.; Zhu, G.; Qin, B.; Pan, D. Deteriorating water clarity in shallow waters: Evidence from long term MODIS and in-situ observations. Int. J. Appl. Earth Obs. Geoinf. 2018, 68, 287–297. [Google Scholar] [CrossRef]
  24. Tyler, J.E. The secchi disc. Limnol. Oceanogr. 1968, 13, 1–6. [Google Scholar] [CrossRef]
  25. Lee, Z.; Shang, S.; Qi, L.; Yan, J.; Lin, G. A semi-analytical scheme to estimate Secchi-disk depth from Landsat-8 measurements. Remote Sens. Environ. 2016, 177, 101–106. [Google Scholar] [CrossRef] [Green Version]
  26. Al Kaabi, M.; Zhao, J.; Ghedira, H. MODIS-based mapping of Secchi disk depth using a qualitative algorithm in the shallow Arabian Gulf. Remote Sens. 2016, 8, 423. [Google Scholar] [CrossRef]
  27. Fabricius, K.E.; Logan, M.; Weeks, S.J.; Lewis, S.E.; Brodie, J. Changes in water clarity in response to river discharges on the Great Barrier Reef continental shelf: 2002–2013. Estuar. Coast. Shelf Sci. 2016, 173, A1–A15. [Google Scholar] [CrossRef] [Green Version]
  28. Barnes, B.B.; Hu, C.; Schaeffer, B.A.; Lee, Z.; Palandro, D.A.; Lehrter, J.C. MODIS-derived spatiotemporal water clarity patterns in optically shallow Florida Keys waters: A new approach to remove bottom contamination. Remote Sens. Environ. 2013, 134, 377–391. [Google Scholar] [CrossRef] [Green Version]
  29. Lee, Z.P.; Shang, S.; Hu, C.; Du, K.; Weidemann, A.; Hou, W.; Lin, J.; Lin, G. Secchi disk depth: A new theory and mechanistic model for underwater visibility. Remote Sens. Environ. 2015, 169, 139–149. [Google Scholar] [CrossRef] [Green Version]
  30. Cao, Z.; Duan, H.; Feng, L.; Ma, R.; Xue, K. Climate- and human-induced changes in suspended particulate matter over Lake Hongze on short and long timescales. Remote Sens. Environ. 2017, 192, 98–113. [Google Scholar] [CrossRef]
  31. Li, S.; Guo, W.; Mitchell, B. Evaluation of water quality and management of Hongze Lake and Gaoyou Lake along the Grand Canal in Eastern China. Environ. Monit. Assess. 2011, 176, 373–384. [Google Scholar] [CrossRef]
  32. Wu, Y.; Dai, R.; Xu, Y.; Han, J.; Li, P. Statistical assessment of water quality issues in Hongze Lake, China, related to the operation of a water diversion project. Sustainability 2018, 10, 1885. [Google Scholar] [CrossRef]
  33. Duan, H.; Cao, Z.; Shen, M.; Liu, D.; Xiao, Q. Detection of illicit sand mining and the associated environmental effects in China’s fourth largest freshwater lake using daytime and nighttime satellite images. Sci. Total Environ. 2019, 647, 606–618. [Google Scholar] [CrossRef] [PubMed]
  34. Yan, D. Analysis on sand mining management in Hongze Lake. Jiangsu Sci. Technol. Inf. 2015, 30, 49–51. [Google Scholar]
  35. Lai, X.; Shankman, D.; Huber, C.; Yesou, H.; Huang, Q.; Jiang, J. Sand mining and increasing Poyang Lake’s discharge ability: A reassessment of causes for lake decline in China. J. Hydrol. 2014, 519, 1698–1706. [Google Scholar] [CrossRef]
  36. Cui, L.; Wu, G.; Liu, Y. Monitoring the impact of backflow and dredging on water clarity using MODIS images of Poyang Lake, China. Hydrol. Process. 2009, 23, 342–350. [Google Scholar] [CrossRef]
  37. Wu, G.; de Leeuw, J.; Skidmore, A.K.; Prins, H.H.; Liu, Y. Concurrent monitoring of vessels and water turbidity enhances the strength of evidence in remotely sensed dredging impact assessment. Water Res. 2007, 41, 3271–3280. [Google Scholar] [CrossRef]
  38. Zhang, S. Aquatic vegetation in Hongze Lake. J. Lake Sci. 1992, 4, 63–70. [Google Scholar] [Green Version]
  39. Liu, W.-L.; Deng, W.; Wang, G.-X.; Li, A.-M.; Zhou, J. Aquatic macrophyte status and variation characteristics in the past 50 years in Hongzehu Lake. J. Hydroecol. 2009, 2, 1–8. [Google Scholar] [CrossRef]
  40. Yu, K. Changes in vegetative coverage of the Hongze Lake national wetland nature reserve: A decade-long assessment using MODIS medium-resolution data. J. Appl. Remote Sens. 2013, 7, 073589. [Google Scholar] [CrossRef]
  41. Ruan, R.; Li, Z. Changes of Hongze Lake wetlands in the past three decades. In Proceedings of the 6th International Conference on Wireless Communications NETWORKING and Mobile Computing, Shenzhen, China, 23–25 September 2010; pp. 1–4. [Google Scholar]
  42. Liu, G.; Li, Y.; Lyu, H.; Wang, S.; Du, C.; Huang, C. An improved land target-based atmospheric correction method for Lake Taihu. IEEE J. Sel. Top. Appl. Earth Obs. Remote Sens. 2016, 9, 793–803. [Google Scholar] [CrossRef]
  43. Lee, B.S.; McGwire, K.C.; Fritsen, C.H. Identification and quantification of aquatic vegetation with hyperspectral remote sensing in western Nevada rivers, USA. Int. J. Remote Sens. 2011, 32, 9093–9117. [Google Scholar] [CrossRef]
  44. Liu, X.; Zhang, Y.; Shi, K.; Zhou, Y.; Tang, X.; Zhu, G.; Qin, B. Mapping aquatic vegetation in a Large, shallow eutrophic lake: A frequency-based approach using multiple years of MODIS data. Remote Sens. 2015, 7, 10295–10320. [Google Scholar] [CrossRef]
  45. Hu, C. A novel ocean color index to detect floating algae in the global oceans. Remote Sens. Environ. 2009, 113, 2118–2129. [Google Scholar] [CrossRef]
  46. Zhang, Y.; Qin, B.; Zhu, G.; Gao, G.; Luo, L.; Chen, W. Effect of sediment resuspension on underwater light field in shallow lakes in the middle and lower reaches of the Yangtze River: A case study in Longgan Lake and Taihu Lake. Sci. China Ser. D 2006, 49, 114–125. [Google Scholar] [CrossRef]
  47. Qin, B.; Fan, C. Exploration of conceptual model of nutrient release from inner source in large shallow lake. China Environ. Sci. 2002, 22, 150–153. [Google Scholar]
  48. Yin, J.W.; Liu, C.S. Analysis and potential countermeasures of water pollution in Hongze Lake from 1991 to 2005. Jiangsu Water Resour. 2009, 8, 30–33. [Google Scholar]
  49. Qi, S.; Zhang, X.; Wang, D.; Zhu, J.; Fang, C. Study of morphologic change in Poyang Lake basin caused by sand dredging using multi-temporal Landsat images and DEMs. ISPRS Int. Arch. Photogramm. Remote Sens. Spat. Inf. Sci. 2014, XL-1, 355–362. [Google Scholar] [CrossRef]
  50. Li, J.; Tian, L.; Chen, X.; Li, X.; Huang, J.; Lu, J.; Feng, L. Remote-sensing monitoring for spatio-temporal dynamics of sand dredging activities at Poyang Lake in China. Int. J. Remote Sens. 2014, 35, 6004–6022. [Google Scholar] [CrossRef]
  51. Kosten, S.; Lacerot, G.; Jeppesen, E.; da Motta Marques, D.; van Nes, E.H.; Mazzeo, N.; Scheffer, M. Effects of submerged vegetation on water clarity across climates. Ecosystems 2009, 12, 1117–1129. [Google Scholar] [CrossRef]
Figure 1. Spatial distributions of sampling stations and five lake segments of Lake Hongze.
Remotesensing 11 00177 g001
Figure 2. Linear regression relationship between MODIS estimated and in situ measured SDD.
Remotesensing 11 00177 g002
Figure 3. Seasonal results of SDD derived from MODIS-Aqua images for the entire lake during the period 2003–2017.
Remotesensing 11 00177 g003
Figure 4. Seasonal mean values of SDD derived from MODIS data for five lake segments and the entire lake from 2003 to 2017.
Remotesensing 11 00177 g004
Figure 5. Boxplot of monthly mean variation of SDD derived from MODIS data for the entire lake from 2003 to 2017.
Remotesensing 11 00177 g005
Figure 6. Time series of SDD derived from MODIS data over Lake Hongze for 15 years.
Remotesensing 11 00177 g006
Figure 7. Time series of seasonal values of VPF for five lake segments and the entire lake from 2007 to 2017.
Remotesensing 11 00177 g007
Figure 8. MODIS-Aqua derived VPF value of yearly (a) and monthly (b) for the five sub-regions and the entire lake from 2007 to 2017.
Remotesensing 11 00177 g008
Figure 9. Long-term trend of yearly mean wind speeds in Lake Hongze during 1957–2017.
Remotesensing 11 00177 g009
Figure 10. MODIS-Aqua derived monthly mean SDD and TSM derived from MODIS using the model proposed by Cao et al. [30] for Z1 (a) and Z4 (b) of Lake Hongze from 2007 to 2017.
Remotesensing 11 00177 g010
Figure 11. Linear regressions between annual mean SDD and VPF in Z1 (a) and Z2 (b) lake segments from 2007 to 2017.
Remotesensing 11 00177 g011
Table 1. Temporal distributions of the MODIS/Aqua data covering Lake Hongze from 2003 to 2017.
Jan.Feb.Mar.Apr.MayJun.Jul.Aug.Sep.Oct.Nov.Dec.Total
20031159968471612914110
20041413131212101261517168148
200511914161094710121017129
20067610581281012141012114
200781271213799815117118
2008618139656111071213116
20091836141474681457106
20101077491251611131315122
201112619147645911911113
201212866105154101377103
20131169131079161115138128
201414713912655716816118
201511981185111071359107
201691199889141041111113
2017912121316611912111415140
Total1631321551561491131161351561871531701785
Table 2. Monthly mean VPF of five lake segments and the entire lake.
Entire LakeZ1Z2Z3Z4Z5
Jan.0.2120.2790.6900.1080.0600.121
Feb.0.2610.2650.6680.1160.0970.171
Mar.0.2450.3070.7420.1120.0690.209
Apir.0.3480.5050.8660.1620.1420.357
May.0.3710.5290.8710.2040.1650.388
Jun.0.4280.4710.8360.2560.3110.339
Jul.0.4100.5680.8360.2890.2240.353
Aug.0.3920.5810.8250.2510.2100.333
Sep.0.4140.5130.7760.2740.2710.299
Oct.0.2810.4030.6970.1840.1320.192
Nov.0.2380.3120.6200.1620.0880.149
Dec.0.2200.2810.6550.1330.0670.146

