Article

Estimation and Mapping of Sub-National GDP in Uganda Using NPP-VIIRS Imagery

1
Department of Geography and the Environment, University of Denver, Denver, CO 80208, USA
2
The Frederick S. Pardee Center for International Futures Josef Korbel School of International Studies, University of Denver, 2201 South Gaylord Street, Denver, CO 80208, USA
3
USAID/Uganda Monitoring, Evaluation and Learning Program, Kampala, Uganda
*
Author to whom correspondence should be addressed.
Remote Sens. 2019, 11(2), 163; https://doi.org/10.3390/rs11020163
Submission received: 20 November 2018 / Revised: 3 January 2019 / Accepted: 9 January 2019 / Published: 16 January 2019
(This article belongs to the Special Issue Advances in Remote Sensing with Nighttime Lights)

Abstract

:
Uganda is one of the poorest nations in the world. It is important to obtain accurate, timely data on socio-economic characteristics sub-nationally, so as to target poverty reduction strategies to those most in need. Many studies have demonstrated that nighttime lights (NTL) can be used to measure human activities. Nevertheless, the methods developed from these studies (1) suffer from coarse resolutions, (2) fail to capture the nonlinearity and multi-scale variability of geospatial data, and (3) perform poorly for agriculture-dependent regions. This study proposes a new enhanced light intensity model (ELIM) to estimate the gross domestic product (GDP) for sub-national units within Uganda. This model is developed by combining the NTL data from the Suomi National Polar-orbiting Partnership Visible Infrared Imaging Radiometer Suite (NPP-VIIRS), the population data from the Global Human Settlement Layer (GHSL), and information on agricultural production and market prices across several commodity types. This resulted in a gridded dataset for Uganda’s GDP at sub-national levels, to capture the spatial heterogeneity in the economic activity.

1. Introduction

It is important to obtain accurate socio-economic information in a timely manner in order to evaluate the current development status in Africa and to address developmental challenges. Gross domestic product (GDP), one of the most widely used metric of national economic progress, measures the total amount of goods and services produced in a country. There is a very strong correlation between the GDP per capita and the Human Development Index (HDI), particularly for low-income countries [1]. Nevertheless, only aggregate data measuring the national GDP and GDP per capita exist for many African countries such as Uganda. There is a clear interest in understanding how the GDP and GDP per capita are distributed throughout Uganda at multiple scales, so as to target poverty interventions and bring greater prosperity to more people.
Africa is experiencing rapid urbanization because of fast population growth. It is estimated by the United Nations that more than 50% of the global population growth between now and 2050 will occur in Africa [2]. This rapid population growth is causing the fast expansion of megacities, small cities, and towns, and is putting great pressure on Africa’s sustainable development objectives by causing a loss of biodiversity, environmental degradation, and natural resource depletion. Indicators like gross domestic product (GDP) can help assess the pace and dynamics of urban development.
There are many challenges to measuring GDP accurately. For example, accurate information regarding the size and distribution of the human population is not available for many regions around the world, and sometimes these data are of poor quality [3]. National censuses are not able to capture the human mobility or activity, as they are conducted residentially. Additionally, national censuses often release their results with limited resolution below the national level, as is the case with Uganda [4]. Cross-country measurements of GDP lack standardized accounting methods and have inconsistent data collection methodologies [5]. Satellite-based nighttime light (NTL) data can provide a unique method to visualize and analyze the spatial distribution of the socio-economic environment in a consistent, efficient, and low-cost manner. By monitoring the anthropogenic nocturnal light intensity, these satellite image derived datasets can help us to evaluate human activities at multiple spatiotemporal scales.
In the past decades, many studies have utilized the Defense Meteorological Satellite Program’s Operational Linescan System (DMSP-OLS) NTL data to analyze various socio-economic indicators like GDP and electric power consumption. For instance, some researchers used the DMSP-OLS NTL imagery to generate and demonstrate the quantitative relationships between the NTLs and population and energy consumption in the USA [6,7]. Nevertheless, the DMSP-OLS satellite imagery suffers from significant deficiencies like coarse spatial resolution, saturation of bright lights, and the lack of in-flight calibration [8]. On 28 October 2011, the launch of the Suomi National Polar-Orbiting Partnership (NPP) marked a new generation of operational polar-orbiting spacecraft [9]. NPP-VIIRS exceeds its predecessors with its unique features, including a finer spatial resolution for all bands and a day night band (DNB) that can collect low-light imaging data. Thus, because of its improved NTL detecting ability, NPP-VIIRS has been applied in many fields that once used DMSP-OLS heavily.
Meanwhile, many studies have demonstrated that using nighttime lights alone is insufficient to accurately measure the GDP at sub-national levels. For example, in many countries in Sub-Saharan Africa (SSA), there is a large population (about 175 million) engaged in small-scale agricultural activities [10]. However, it is very difficult to capture these small-scale subsistence agriculture activities using nighttime lights, and their total economic activities can be underestimated. For example, nighttime lights fail to capture more than half of the economic activities in Liberia [11]. In addition, although GDP data is available at national level, it is important to obtain sub-national economic data to evaluate the distribution and dynamics of socio-economic development. This sub-national information is especially important for regions like SSA to address high population growth, food security, poverty, inequality, and growth challenges, and to meet the United Nations Sustainable Development Goals 2030. Therefore, the purpose of this study is to investigate the potential of combining nighttime lights with agriculture data in order to estimate the subnational GDP for countries with a large rural, agriculturally-dependent population. We aim to utilize the NPP-VIIRS NTL imageries in order to map the sub-national socio-economic development in Uganda. We have conducted our analysis using NPP-VIIRS nightlight imagery covering Uganda, for the year 2015, agricultural production and commodity price information [12], and population and settlement data from the Global Human Settlement Layer (GHSL). The structure of the paper is organized as follows: A detailed description of case study area, NTL data, and agricultural production data are presented in Section 2. The data processing and methods used in this study will be described in Section 3. We will then present the estimation results and discuss the performance of our methods by comparing with other existing methods. Finally, we summarize the results and draw conclusions in the last section.

2. Case Study Area and Data

2.1. Case Study Area

Uganda is one of the poorest nations in the world, and its GDP per capita (current US $) is only $740 [13]. In recent years, the proportion of the population living in poverty is increasing, and almost 10 million people are living under the poverty line. In addition, Uganda’s economy is heavily dependent on agriculture. Like many other sub-Saharan countries, Uganda has a large rural population. In Uganda, 76% of the population live in rural areas, and 24% of the national economy is derived from agricultural activity [13]. The district-level shapefile was obtained from U.S. Agency for International Development (there are 116 districts’ information in the shapefile, but the total number of districts increased to 127 as of July 2018). The GDP information was obtained from the World Bank database (in constant 2011 US $).

2.2. Data Collections

2.2.1. Nighttime Satellite Imagery

NPP-VIIRS NTL imagery was used to estimate the urban economic activities for each district in Uganda. The total estimated economic activities attributed to the commercial and industrial activities were calculated based on the total light intensity values within the districts. We selected the NPP-VIIRS “vcm-orm-ntl” product (VIIRS Cloud Mask-Outlier Removed-NTLs, obtained from http://ngdc.noaa.gov/eog/viirs/download_viirs_ntl.html) for extracting the urban and rural regions and for estimating productivity from the urban locations. This product contains cloud-free average radiance values with the outliers (including fires and other ephemeral light) removed. NPP-VIIRS is a stable, cloud-free, NTL intensity data source produced by the National Oceanic Atmospheric Administration (NOAA) and the National Aeronautics and Space Administration (NASA). Compared to the DMSP-OLS, NPP-VIIRS has a higher spatial resolution and wider radiometric detection range. Many studies have utilized NPP-VIIRS data for analyzing a range of socio-economic phenomena from a distance. NPP-VIIRS is suitable for detecting sub-national activities, because it captures high-radiance images and gathers information at roughly a 0.5 km2 level, with a high dynamic range [14]. Shi et al. [15] used NPP-VIIRS to extract built-up urban areas of 12 cities in China, and found that NPP-VIIRS data have higher spatial accuracies than those from the DMSP-OLS data for all 12 of the cities. They concluded that these improvements are due to its high spatial resolution and wide radiometric detection range.

2.2.2. Population, Settlement, and Agricultural Data
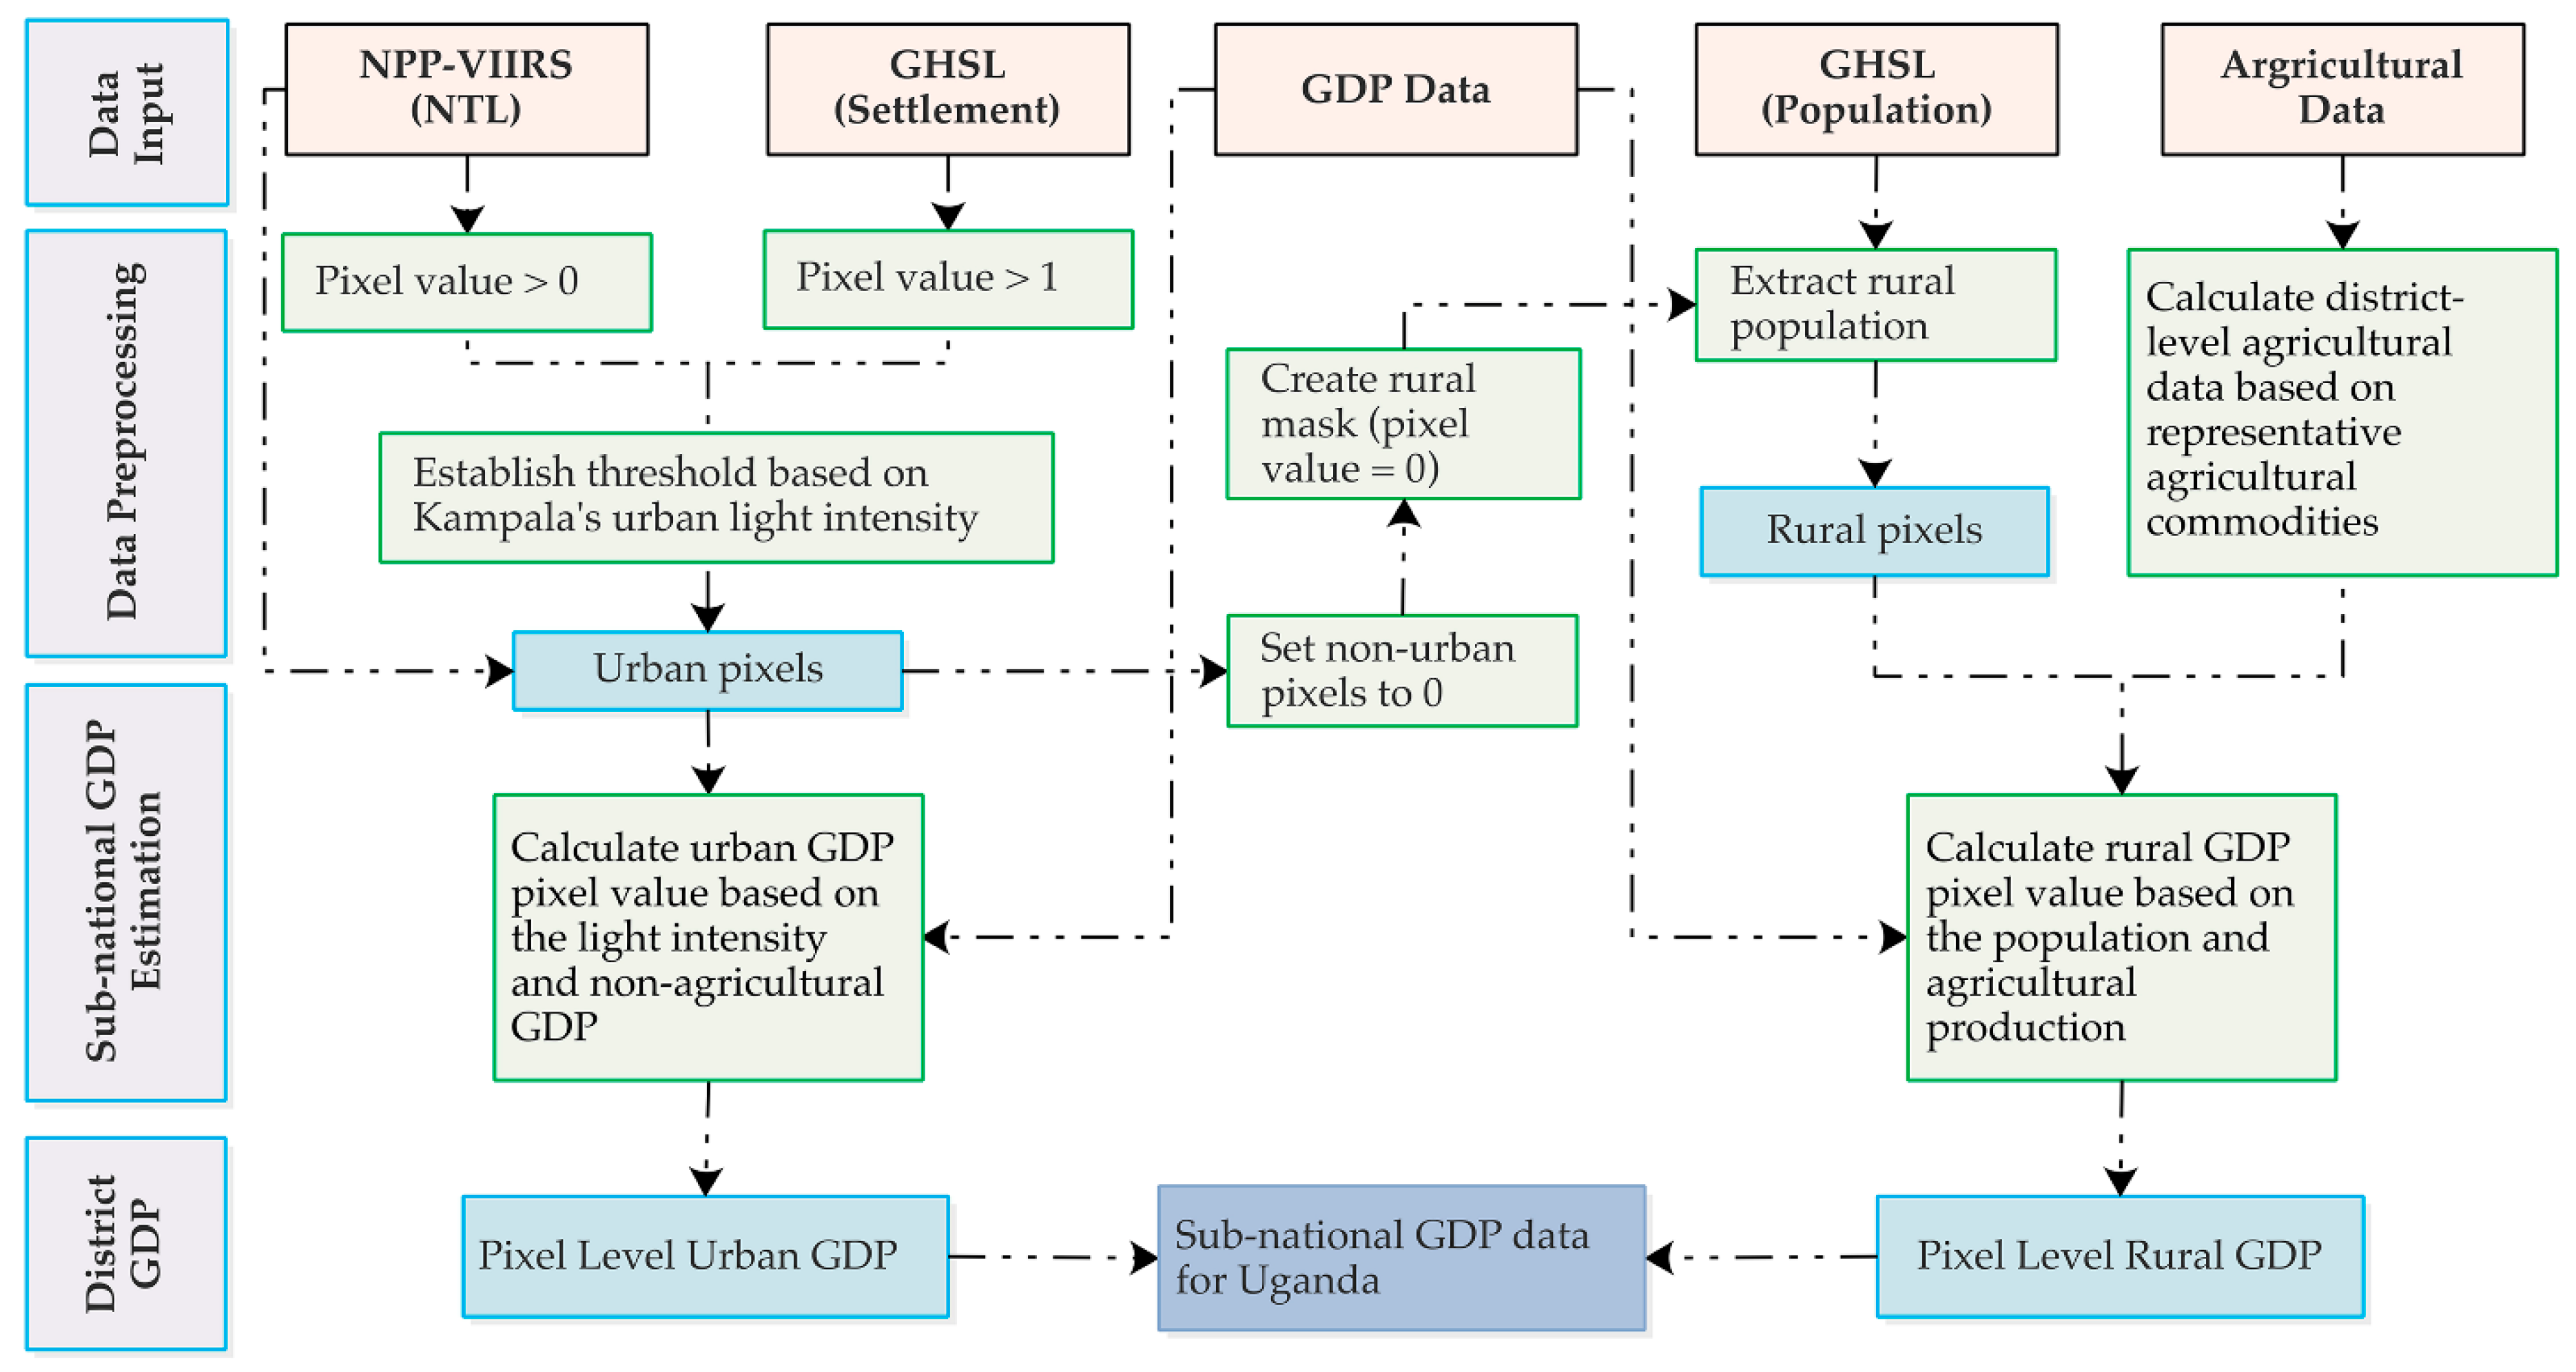
The spatial population and settlement information was obtained from the GHSL dataset, which was mapped based on the Landsat imagery to show the global built-up areas and population distribution from 1975 to 2014 [16]. The GHSL framework produces global spatial information in the form of built up maps, population density maps, and settlement maps about the human presence on the Earth’s surface over time. The GHSL population grid shows the distribution and density of the population. The population grid information is disaggregated from census or administrative units to number of people per cell (250 m and 1 km spatial resolution). The GHSL settlement grid shows the classified built-up areas, including “rural cells”, “urban clusters”, and “urban centers”. We used the “GHS_SMOD_POP2015_GLOBE_R2016A_54009_1k” and the “GHS_POP_GPW42015_GLOBE_R2015A_54009_1k” data with a resolution of 1 km for our model.
This model uses district-level agricultural data to supplement the spatial data in the model. Agricultural activity is not as light-intense as commercial activities, so it would be underrepresented in a model based solely on nighttime lights. Taken together, nighttime lights (representing a higher value-add economic activity) and agricultural production (an important aspect of Uganda’s economy) provide a broad-based estimate of economic activity at a sub-national level. This forms the conceptual foundation for the Enhanced Light Intensity Model.
These estimates use the data on 16 representative agricultural commodities (production and average market price) in order to derive an estimate of the spatial distribution of agricultural GDP in Uganda. A mix of food crops, cash crops, annual crops, and perennial crops are included, as well as cattle, Uganda’s primary animal industry. These representative commodities include maize, millet, sorghum, rice, beans, cow peas, soya beans, groundnuts, sesame, banana, cassava, sweet potatoes, Irish potatoes, coffee, cotton, and cattle. These are representative agricultural commodities and constitute the total agricultural output of each district, so the national agricultural GDP is used to normalize these estimates.
All of the district-level crop production estimates are taken from the 2008/09 Census of Agriculture [12]. The data measuring the heads of cattle per district are collected from the 2008 Livestock Census [17] and are normalized to national-level beef production data from the Food and Agricultural Organization. The cotton production data [18] are sourced from the 2009–2010 Annual Report by the Cotton Development Organization [19]. The agricultural component of the model merges the best available data in order to estimate the distribution of agricultural GDP across Uganda.
Coffee is Uganda’s top export, and is divided among arabica and robusta varieties. Production data by district and variety are not readily available, so, in an attempt to estimate the geographic distribution of the production value from coffee, a multi-step process is used. Census reports from the Uganda Bureau of Statistics provide information on the share of households engaged in coffee production [20] and on the total number of households per district [21]. A map produced by Geo Gecko in 2017 delineates the share of production per district among robusta and arabica among five categories, namely: fully arabica, mostly arabica, fifty–fifty, mostly robusta, and fully robusta [22]. Finally, the 2008/009 Census of Agriculture provides the total production data by geographic region for the arabica and robusta varieties. These data sources are combined in order to arrive at a production estimate by district and variety. The price data were derived from the average weekly commodity prices recorded at markets in 2015 in Gulu, Mbale, Mbarara, and Kampala, sourced from FIT Insights Group Limited [23]. We chose to use the 2015 data for commodity prices, because it was a relatively stable agricultural year. The average coffee prices are taken from the Uganda Coffee Development Authority from October 2014 to September 2015 [24].

3. Methods

3.1. Data Pre-Processing

As NPP-VIIRS is not a direct measurement of socio-economic activates, we adopted a sequence of data preprocessing measures to remove the irrelevant features. Many studies used DMSP-OLS data to extract NPP-VIIRS data. For instance, the released NPP-VIIRS data may be affected by fires, gas flares, volcanoes, and background noise, which need to be removed in order to improve the accuracy and relevancy of GDP estimation. Li et al. [25] used a mask generated from the DMSP-OLS data to obtain denoised NPP-VIIRS data, by assuming that the lit areas in 2010 and 2012 were the same. With a similar assumption, Shi et al. [15] extracted NPP-VIIRS data based on the DMSP-OLS data from the same year. We used the annual product of 2015 (“vcm-orm-ntl”), which contains cloud-free average radiance values that have undergone an outlier removal process to filter out fires and other ephemeral lights. In order to obtain the lit areas in urban regions, we generated a mask from the settlement data with pixels with a value greater than 1 (representing urban clusters and urban centers) to extract lit areas from NPP-VIIRS data within urban boundaries. This is to extract the urban pixels that are related to urban socio-economic activities and to remove irrelevant light detections. As Kampala is the biggest and most developed city in Uganda, the urban pixel values of other areas should not exceed that of Kampala. Therefore, we used the maximum urban pixel value of Kampala as a threshold and found that all of the pixel values in the other urban regions were below this threshold. Finally, we set the non-urban NPP-VIIRS pixel values to 0 to help us identify the rural socio-economic activities.
Then, the preprocessed NPP-VIIRS imagery is analyzed based on the pixel values—pixels with value of 0 and pixels with positive values. Ghosh et al. [26] developed the model by incorporating the agricultural economic activity, which is an important component of economic activity in the developing countries. Agricultural economic activity contributes significantly to the national GDP, but it is not efficiently captured by the nighttime light imagery. In addition, there is a lack of information of the agricultural production at sub-national levels. Therefore, Ghosh et al. assumed that the darker regions of the nighttime light can be used to represent non-urban land use, and the LandScan population data was used to estimate the agricultural activities. As agricultural productivities may not be uniform for all districts, population density cannot adequately reflect the actual agricultural economic activity. To overcome this limitation, we estimated the agricultural data based on 16 representative agricultural commodities (production and average market price) to derive an estimate of the spatial distribution of agricultural GDP in Uganda, and then applied the national agricultural GDP to normalize these estimates. Following the method developed by Ghosh et al., we assumed the following: (1) the preprocessed NPP-VIIRS imagery with pixel value >0 can represent the urban region that mainly consist of secondary and tertiary economic activities, and (2) pixel value = 0 can represent the rural regions that mainly consist of agricultural activities. We created a mask of the rural regions to extract the rural population from the GHSL’s population data. Therefore, the preprocessed NPP-VIIRS NTL imagery is mainly used to estimate the urban GDP values, whereas the extracted rural population, agricultural production, and price data are used to estimate the rural GDP values.

3.2. Model and Simulation of GDP

Many different models, including linear regression models, log–log regression models, and second-order regression models, have been developed to estimate socio-economic data using NTL [27,28,29,30,31]. For instance, Henderson, Storeygard, and Weil [5] developed a statistical model by combining the data from NTLs and income growth so as to better estimate the true income growth. They concluded that satellite imagery can be a useful proxy for estimating economic activity if traditional data is not available or is of poor quality. Shi et al. [15] used a simple linear regression model to estimate GDP and electric power consumption at multiple scales. Nevertheless, because of a lack of reliable ground survey data in African countries like Uganda, it is very difficult to develop and validate a statistical model based on these existing methods directly. It has also been found that the population data may not fully demonstrate the agricultural activities. For instances, studies have found that there is a weaker association between light and economic activities in agriculture dependent countries [11]. Thus, we have developed an enhanced light intensity model (ELIM) to estimate the sub-national GDP in Uganda based on the following steps (Figure 1): (1) using the light intensity to extract urban regions and estimate urban GDP for each district, (2) using the population distribution and agricultural value ratios to estimate the agricultural GDP for rural regions, and (3) the combination of urban and rural GDP can represent the total GDP at sub-national levels.
We defined the rural pixel value ( R V j ) of the rural GDP based on the population and agricultural production in each district, as follows:
R V j = P N j T R P i d X i Y i
where j is the unique identification (ID) of rural pixel (population layer), PNj is the population value of the corresponding pixel, TRP is the total rural population value, i is the type of the agricultural product, d is the total number of types of the agricultural product, X i is the production of the corresponding agricultural product, and Y i is the average crop price of the agricultural product.
Then, we defined the urban GDP pixel value ( U V i ) as follows:
U V i = P V i T N T L N A G D P
where i is the ID of the urban pixel (NPP-VIIRS NTL layer), P V i is the pixel value of the corresponding pixel, TNTL is the total night time light values of the country, and NAGDP is the total non-agricultural GDP of the country.

4. Results and Discussion
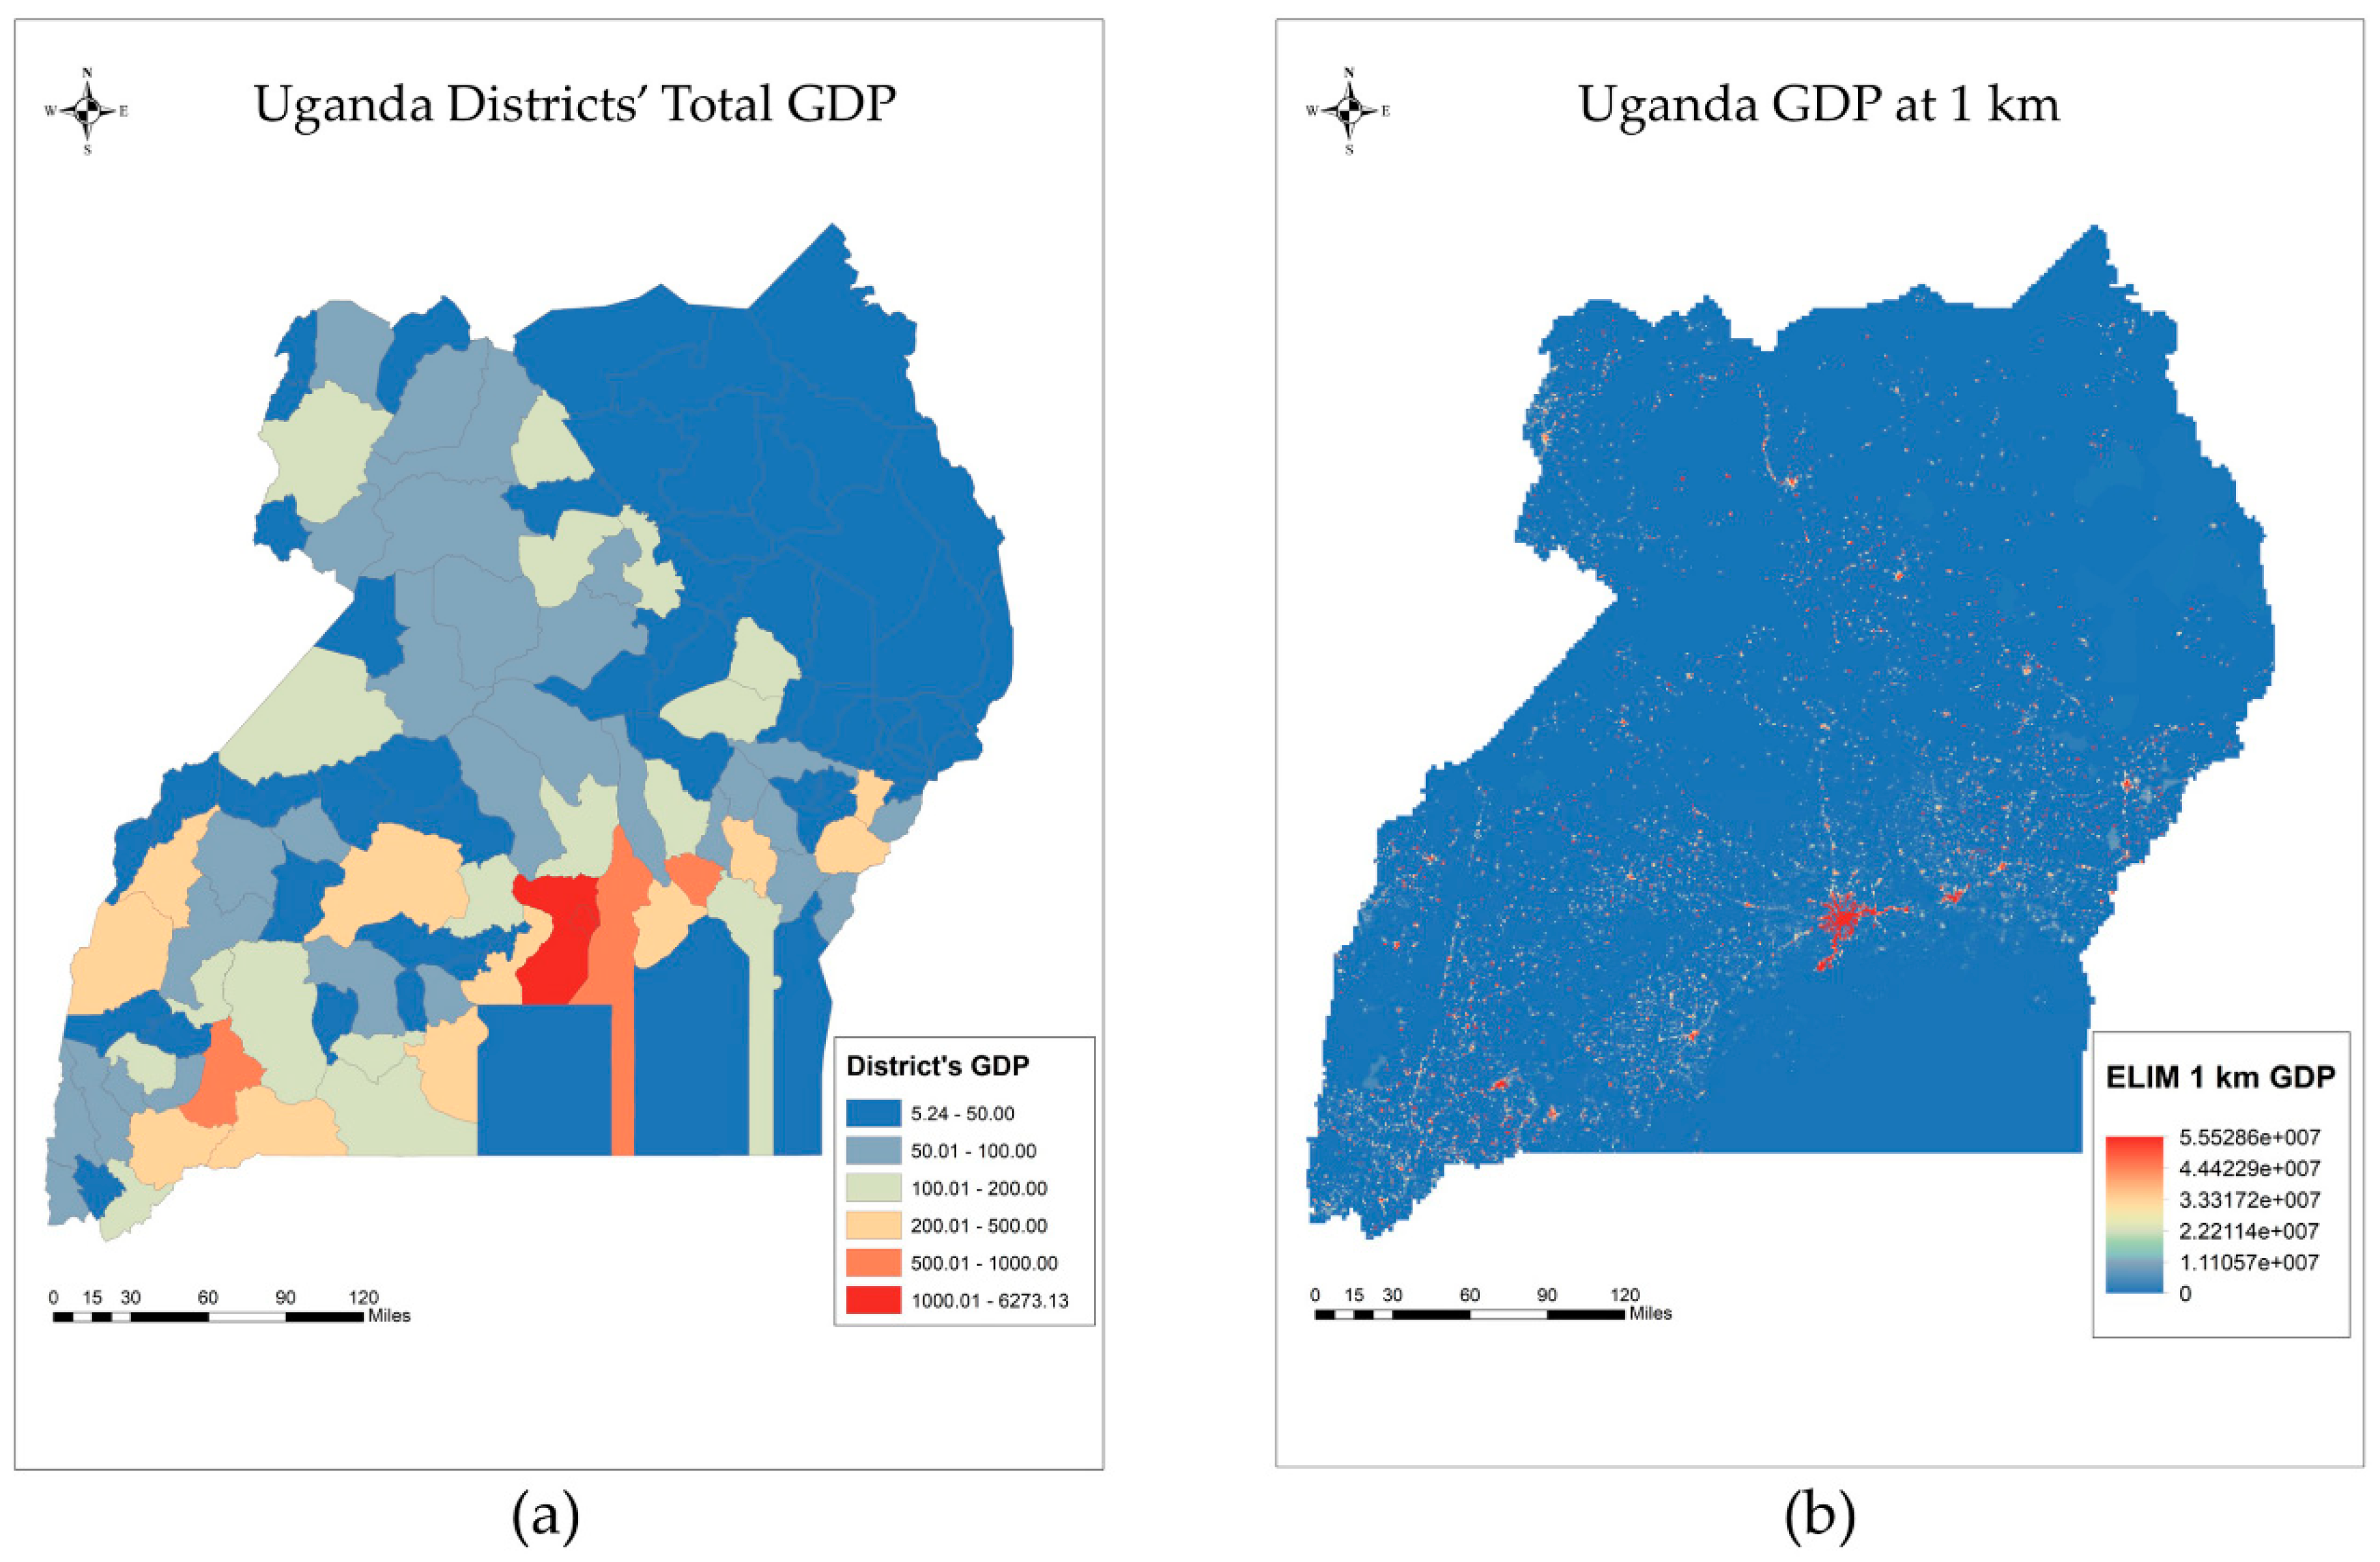
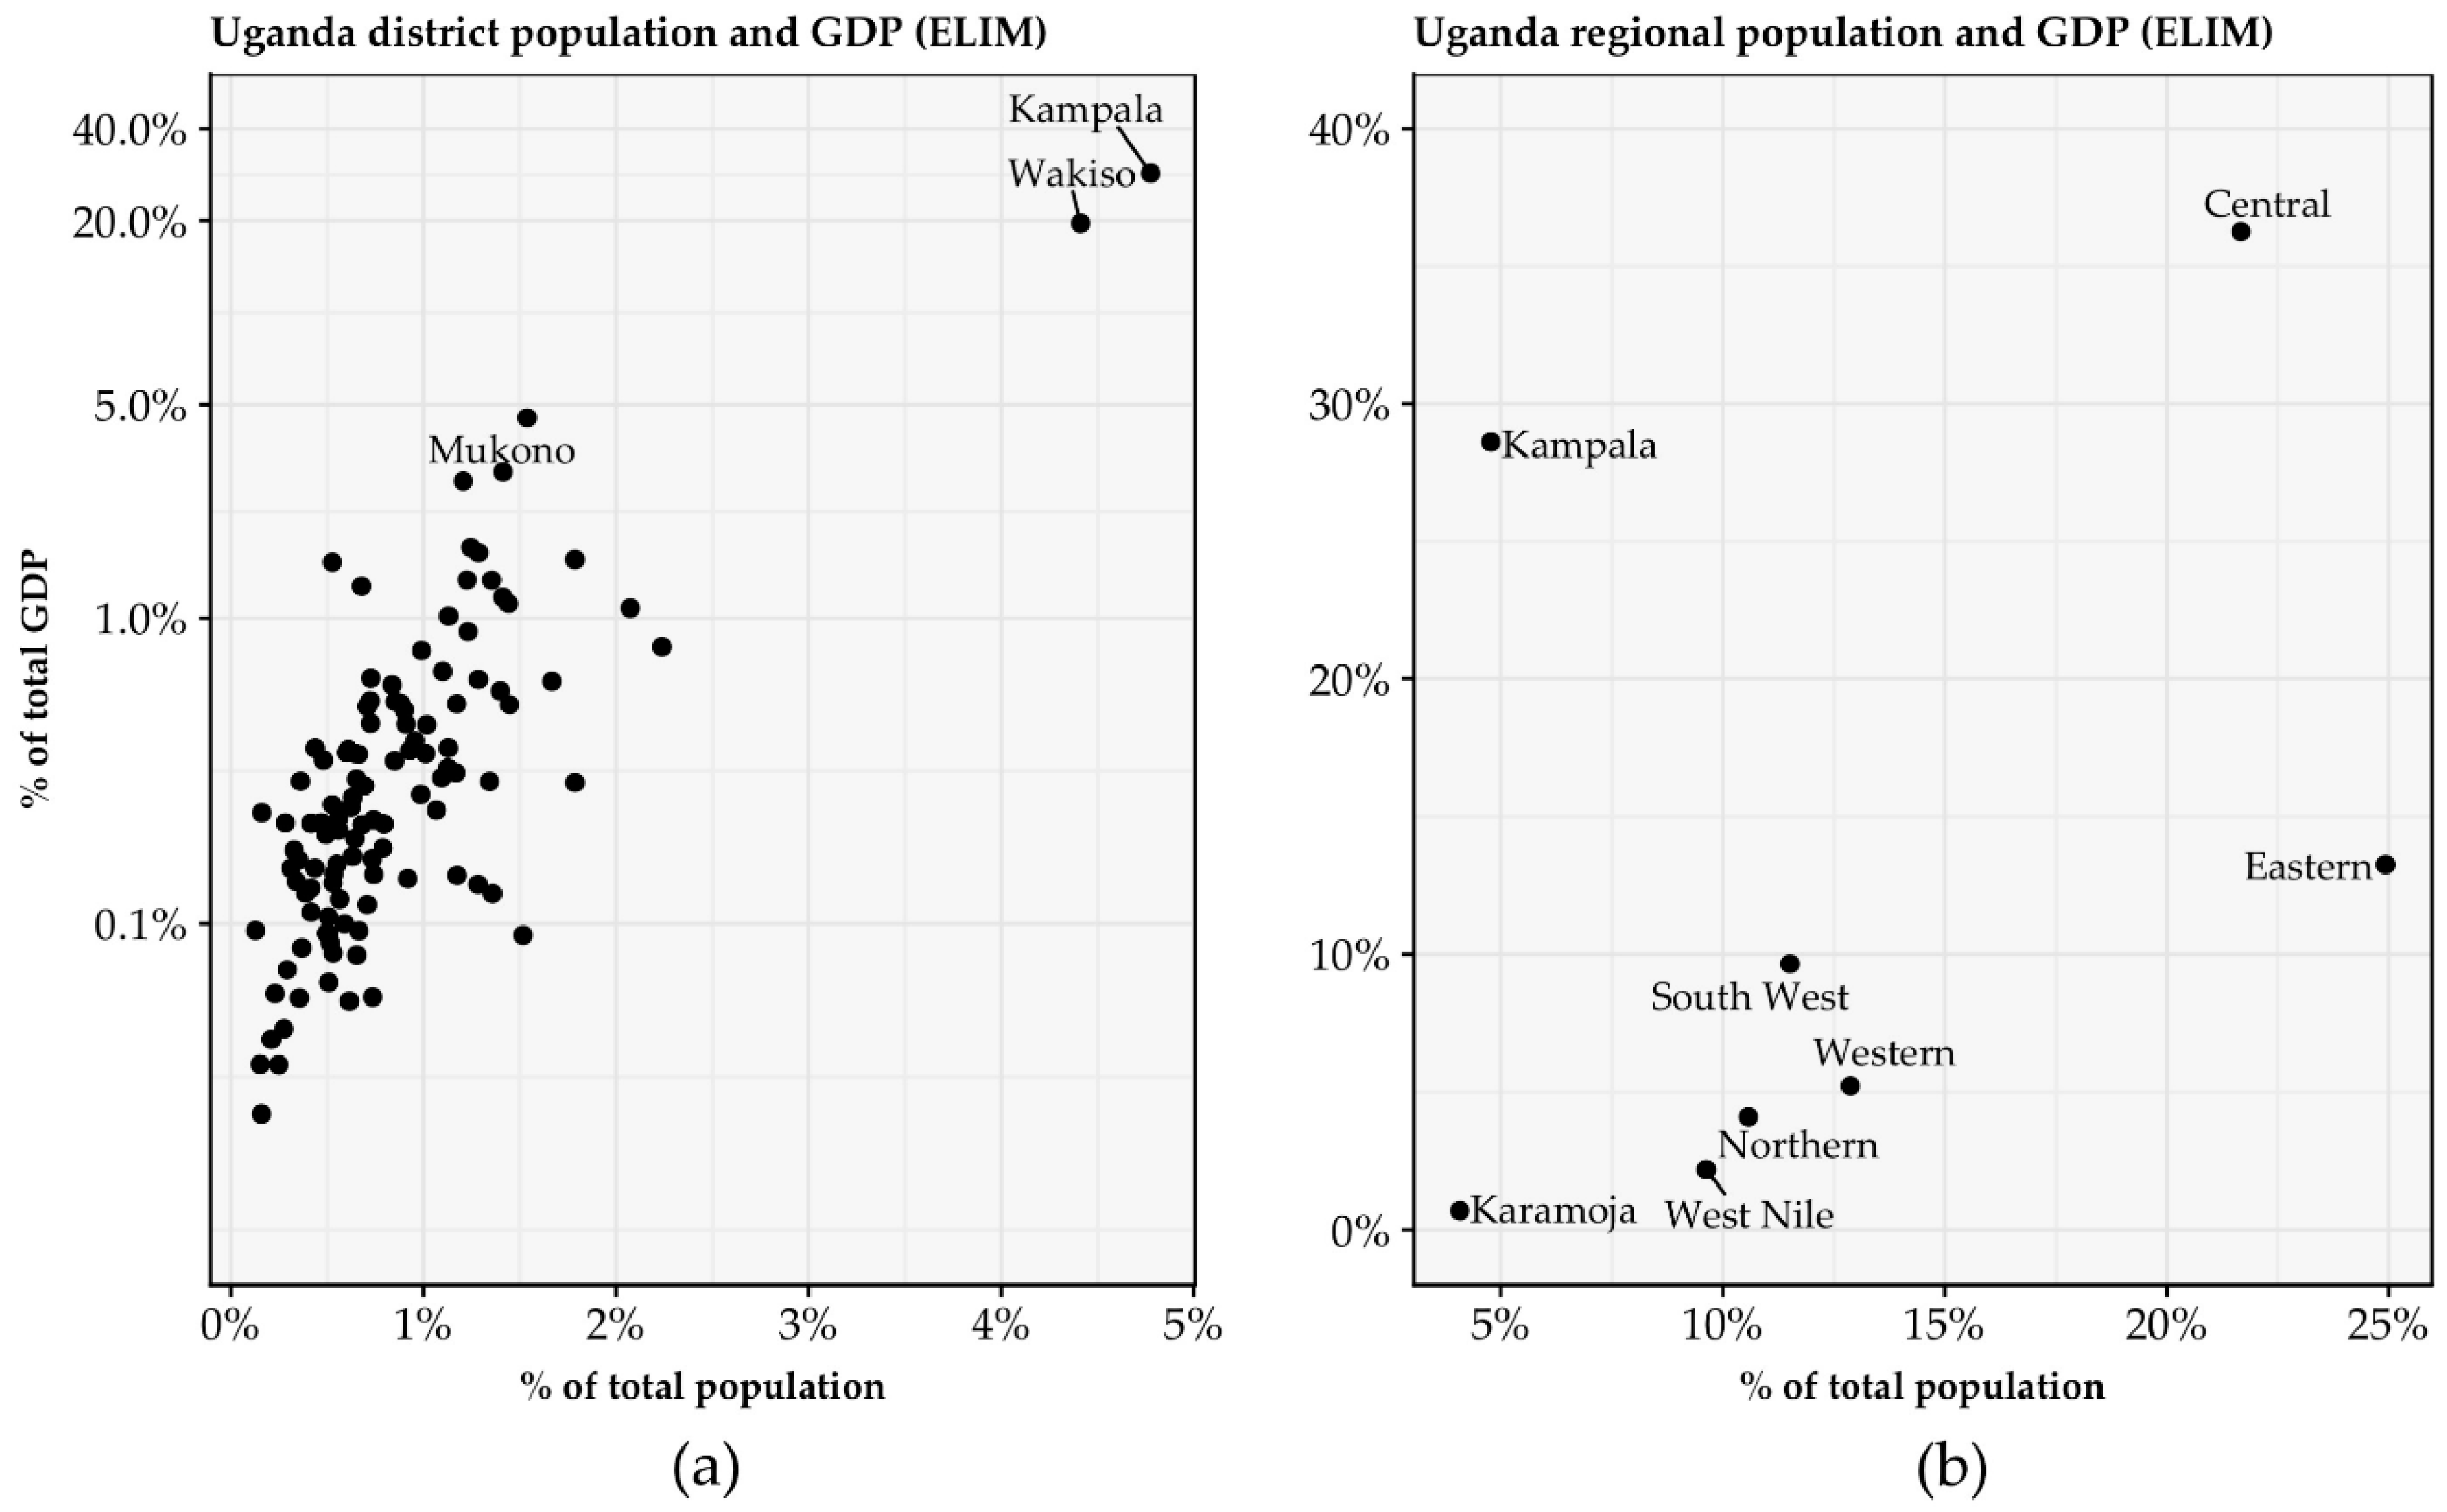
4.1. Results

Figure 2 shows Uganda’s GDP at sub-national levels for 116 districts in Uganda (detailed results are in Appendix A Table A1). In Figure 2b, the distribution of GDP in Uganda is heavily skewed. Only 11 out of the 116 districts have GDP per capita values above the national average, based on our results. This equates to roughly 81.5% (or about 32 million) of the population living in districts with GDP per capita estimates below the national average. Kampala has the largest GDP per capita ($3368), followed by Wakiso ($2496) and Mukono ($1653). Central (the central region dos not include Kampala) and Western Uganda tend to have larger per capita GDP estimates than Eastern and Northern Uganda.
Figure 3 shows that the GDP is heavily concentrated in Central Uganda and Kampala. The ELIM method estimates that Kampala (28.6%), Wakiso (19.6%), and Mukono (4.5%) account for more than half of Uganda’s total GDP. Of the ten largest district economies, six are in Central Uganda. Sub-regionally, Kampala and the South-Central sub-region account for an outsized proportion of Uganda’s GDP, relative to its population size, meaning that they are significantly more productive sub-regions in Uganda. Kampala is roughly 4.8% of Uganda’s population, but it generates 28.6% of its GDP, whereas the West Nile region comprises 9.7% of Uganda’s population and produces 2.2% of the country’s GDP. The top 10 district economies in Uganda make up about 66.3% of the total GDP, with the remaining 33.7% of the national economy coming from 106 districts. To put it another way, these top 10 districts consist of roughly 19.4% of the total population and generate more than 66.3% of the total GDP.

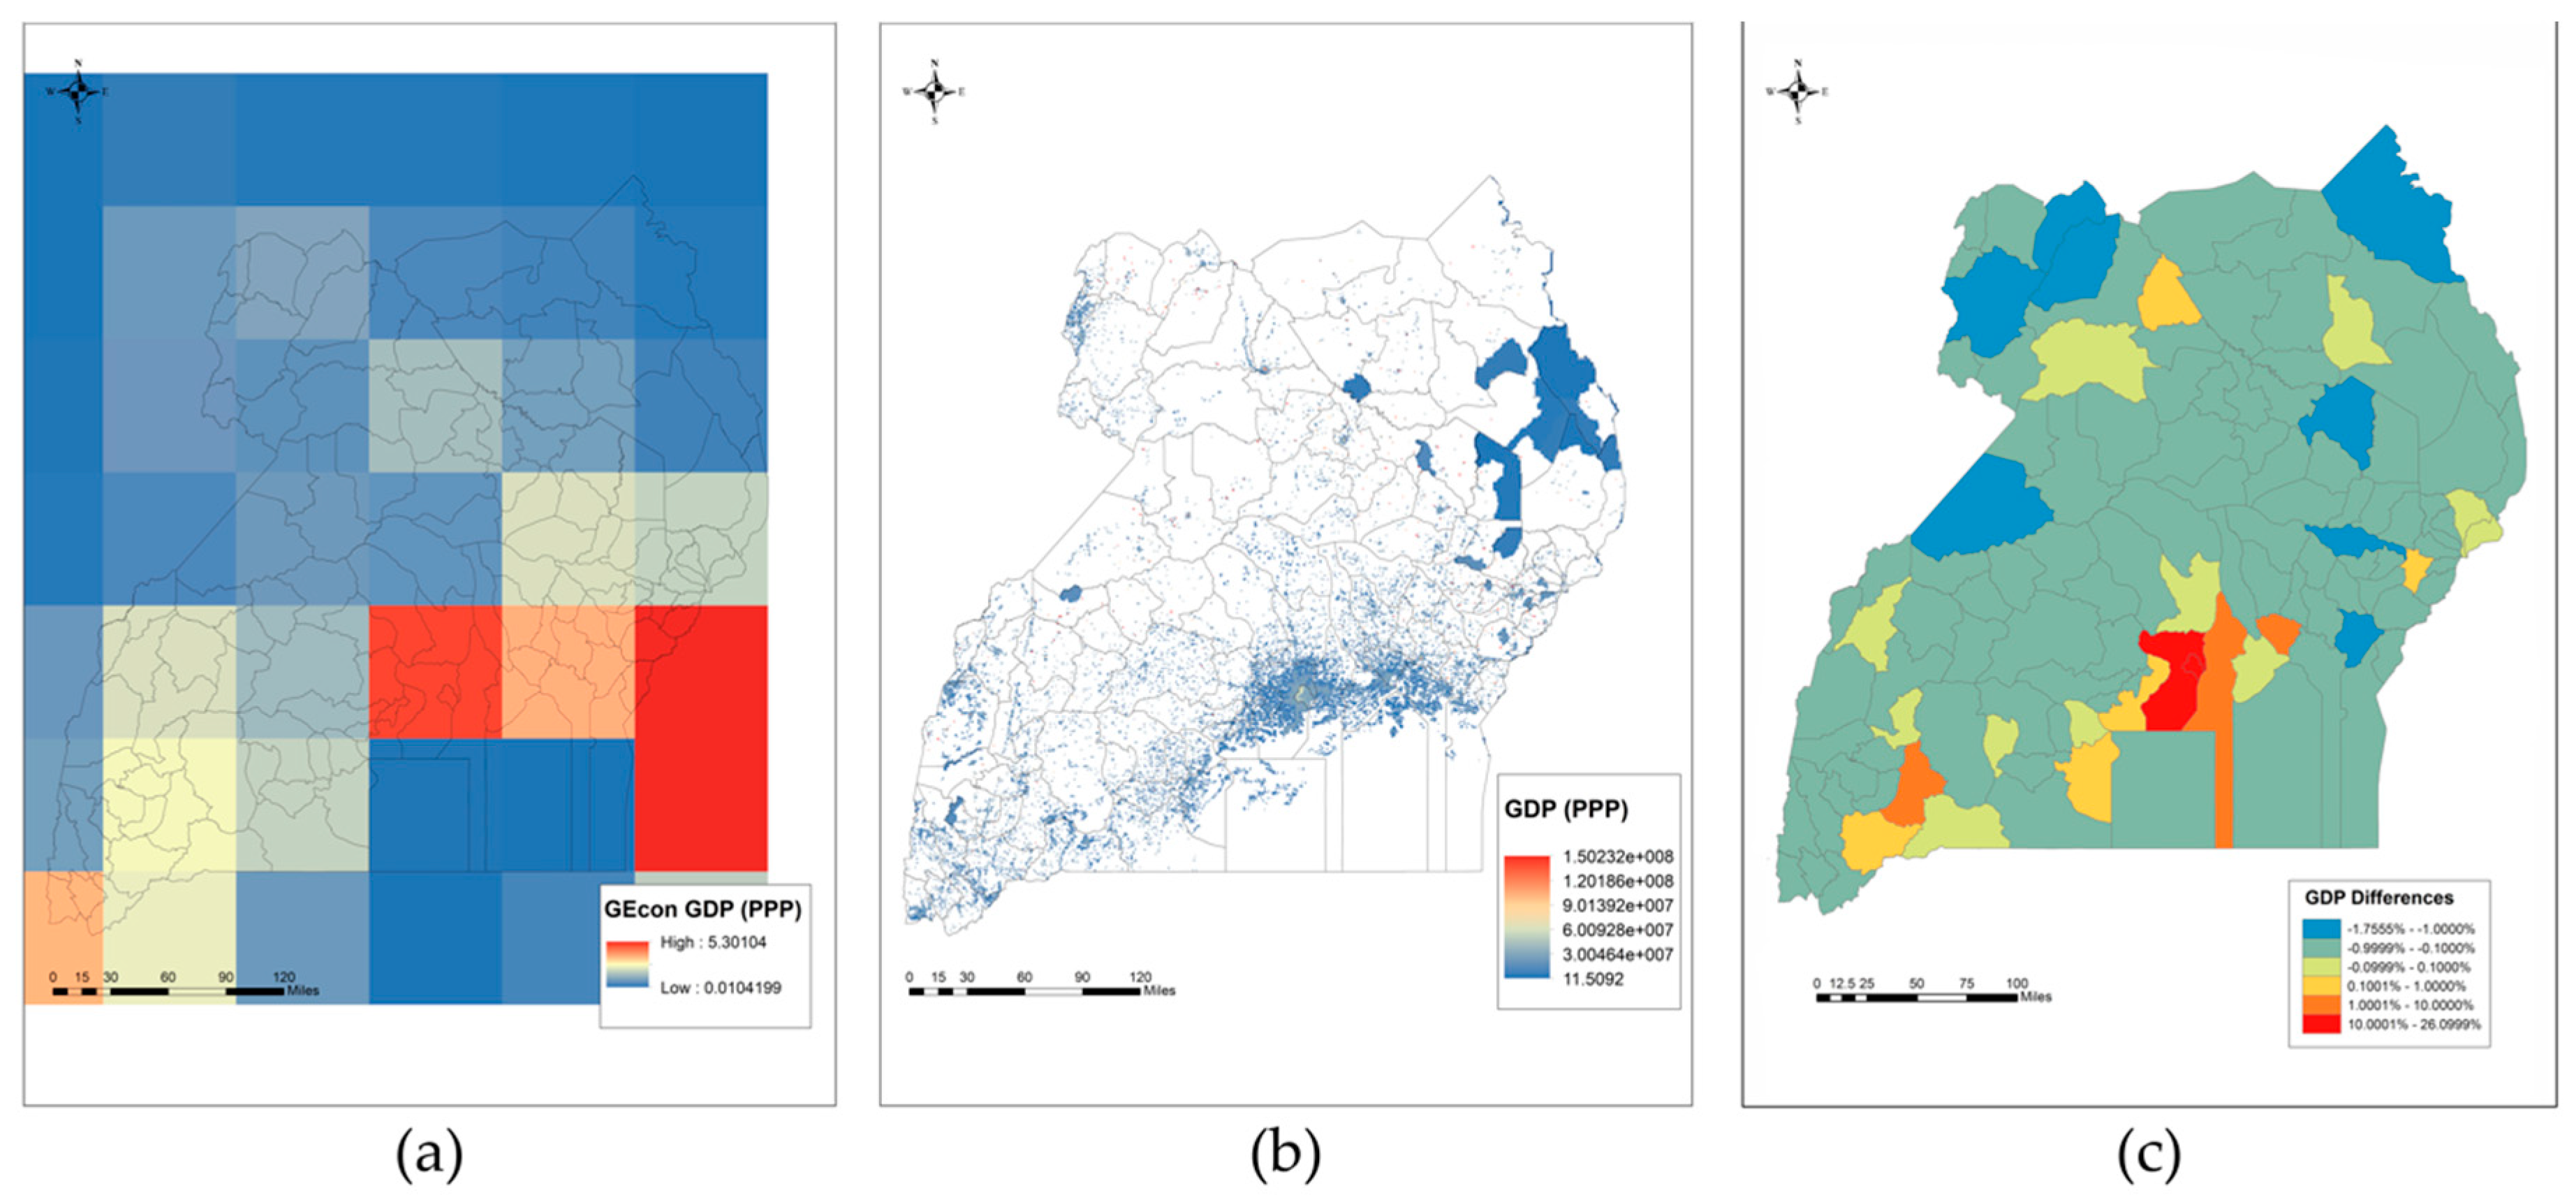
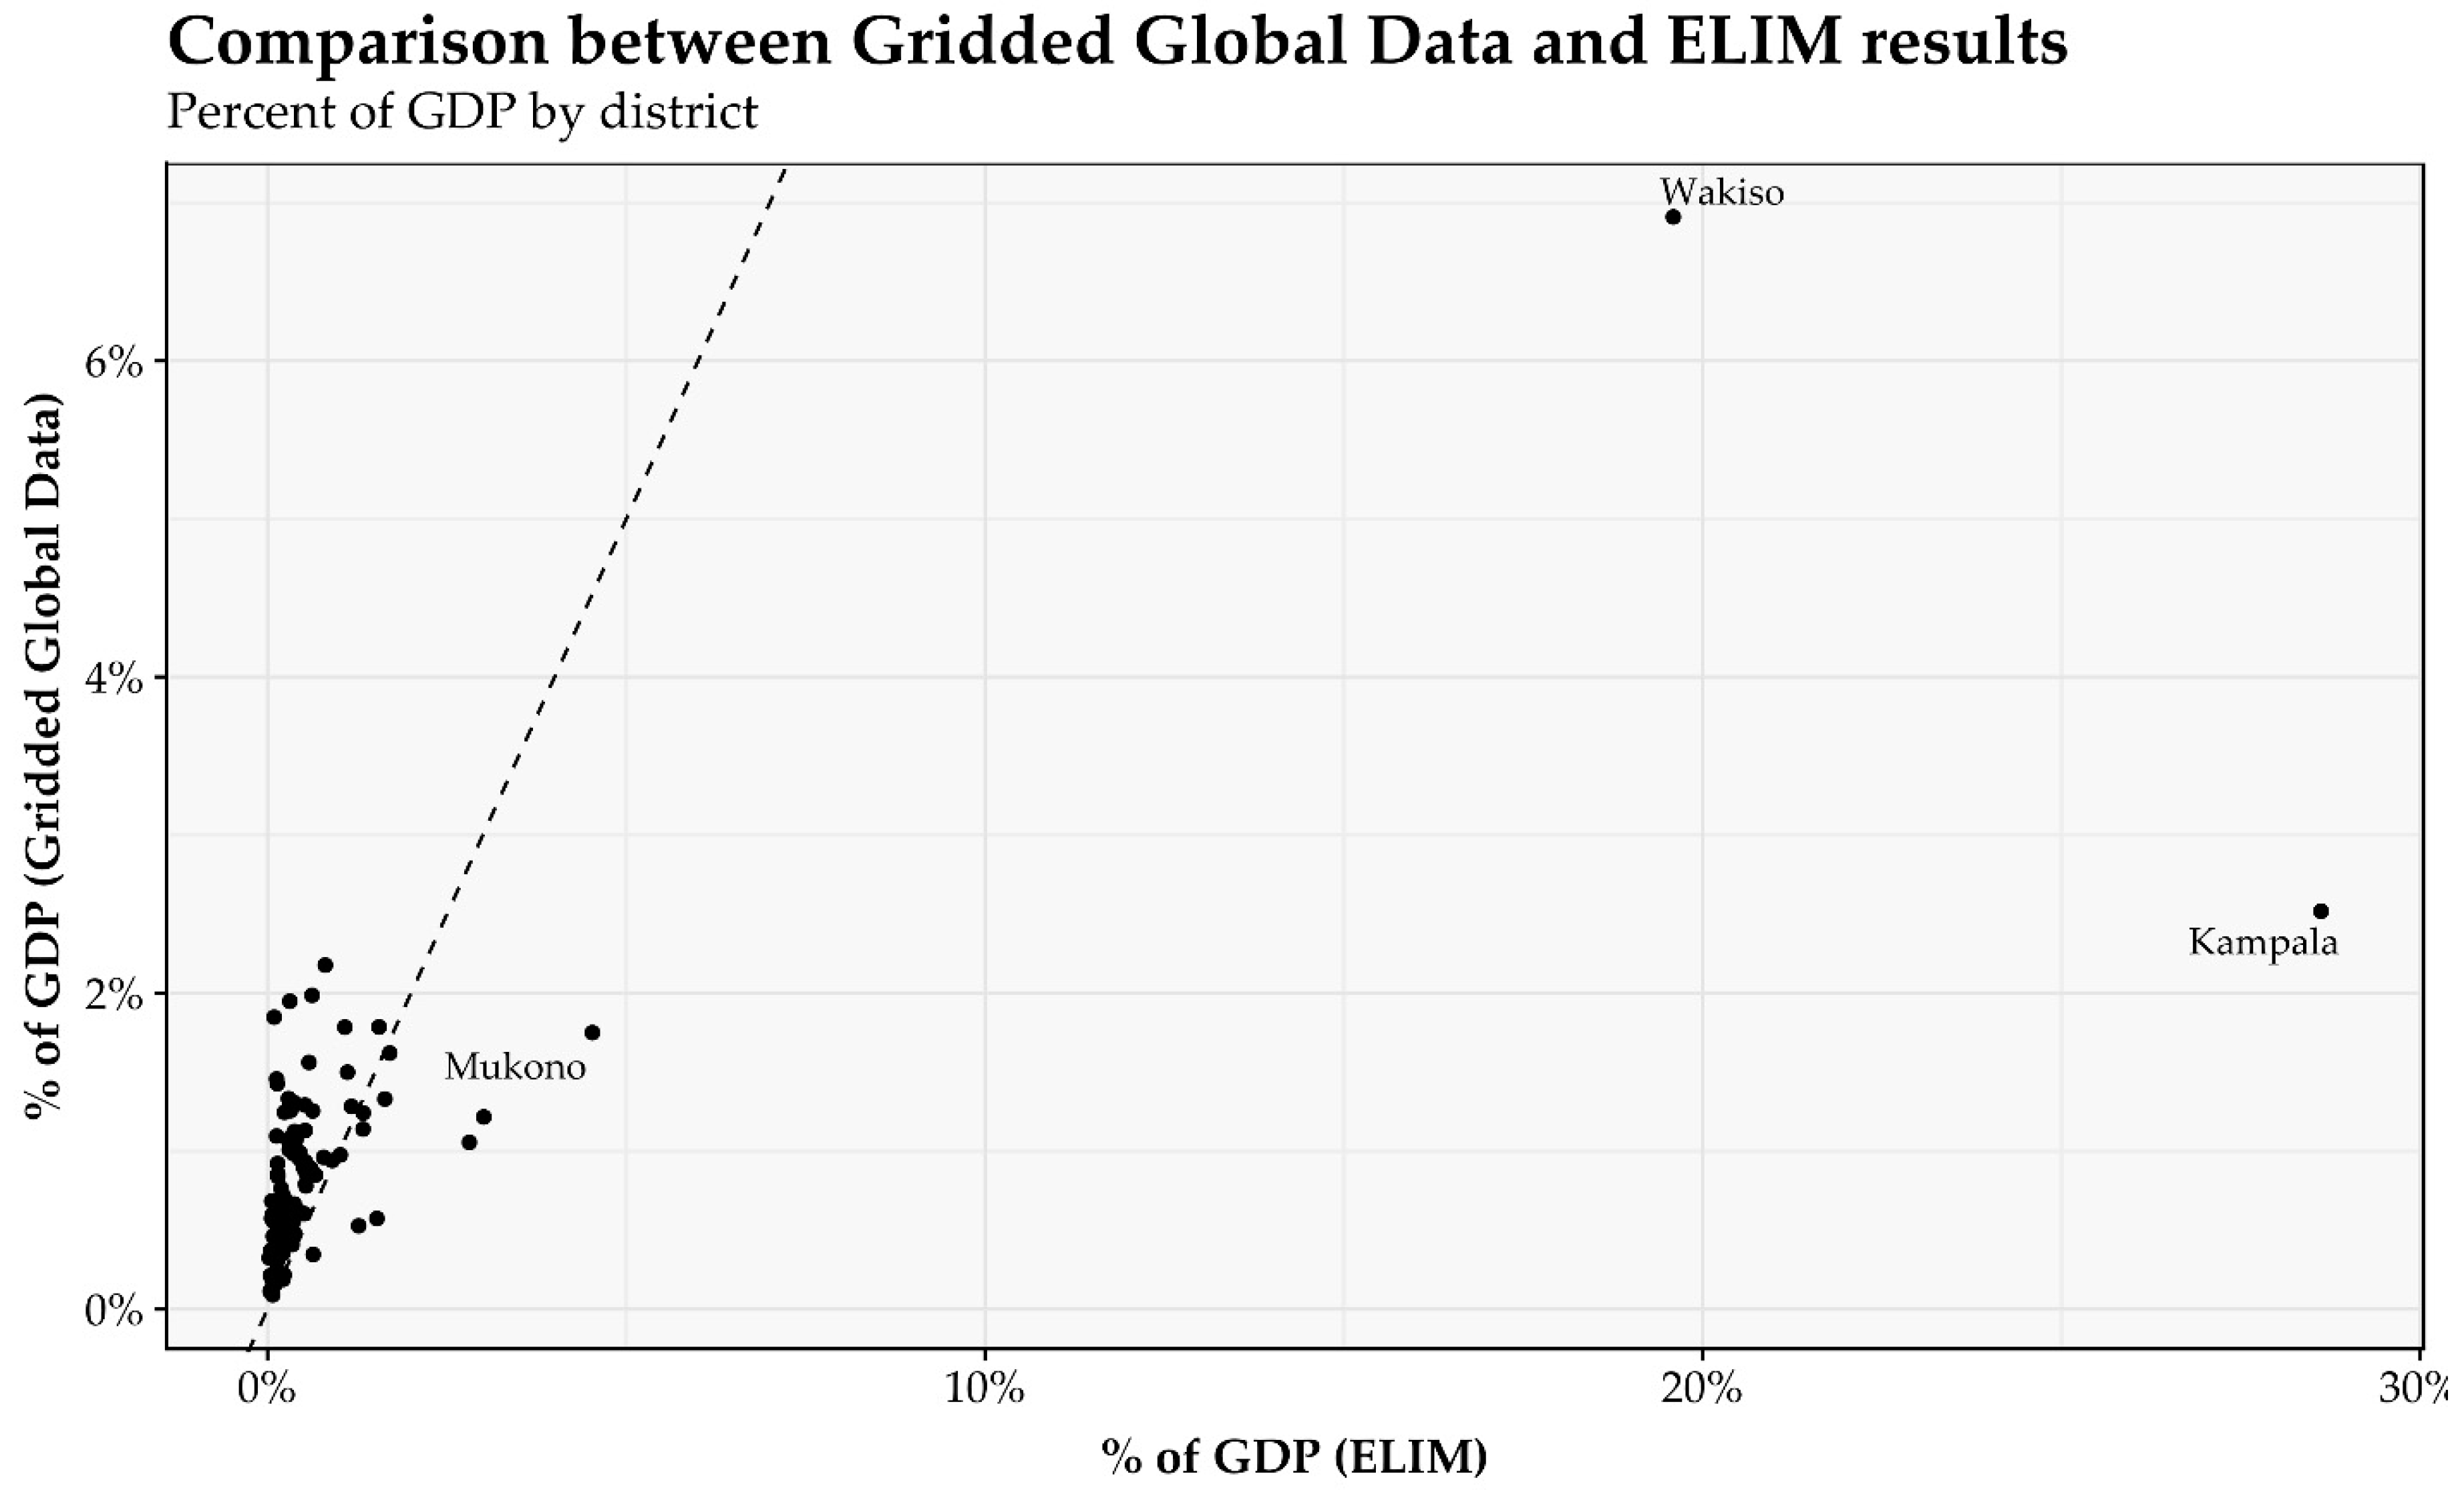
4.2. Data Comparisons

We compared our results with the publicly-available census data. Nevertheless, there are no sub-national-level GDP estimates in Uganda that can be used for direct comparison. Other researchers produced sub-national-level GDP estimates based on remotely sensed imagery. For instance, Nordhaus [32] produced the G-Econ database, which measures the global economic activity at a 1° latitude by 1° longitude scale (Figure 4a). Because of the coarse resolution, the G-Econ cannot sufficiently reflect the sub-national economic activities within the districts. However, the G-Econ data still supports our results by showing that Central and Western Uganda tend to have a greater GDP than the Eastern and Northern regions. Kummu, Taka, and Guillaume [33] produced the Gridded Global Dataset for GDP and a Human Development Index (HDI) at a sub-national level with a higher resolution (with 30 arc-sec resolution) (Figure 4b). The GDP data from the Gridded Global Dataset was derived from the GDP per capita (PPP), by multiplying it by the population data from GHSL. The input sub-national GDP per capita was produced by Gennaioli et al. for 1960–2010. The temporal interpolation and extrapolation approaches were used to fill the missing national and sub-national GDP per capita values. However, their data is unable to consider the nonlinearity and multi-scale variability of the geospatial data, and the GDP values are mainly derived from the population per pixel and GDP per capita at national level. This dataset is insufficient to identify the sources of the economic activities and the variation of productivity within districts. Figure 4c shows that the difference between this study’s ELIM results and the Gridded Global GDP dataset to the 1 km level. Figure 5 shows the same comparison, but aggregated to the district administrative unit. The Gridded Global GDP data have significantly underestimated the GDP from districts like Kampala, Wakiso, and Mukono, as the sub-national calculation is based on the sub-national population, not the heterogeneous productivity across rural and urban landscapes.

5. Discussion

The NTL imagery can record the dynamics of human activities by monitoring artificial light on the Earth’s surface. Therefore, we support the idea that in migrating from the DMSP-OLS to NPP-VIIRS data sources, the NTL imagery is an improved and more accurate source for estimating GDP. The traditional DMSP-OLS imagery has a coarse spatial resolution and this may limit its applications for estimating human activities at sub-national levels [35]. In addition, Bundervoet et al. [11] found that the correlation between lights and economic activity is stronger in places where agriculture is a a less significant component of the national GDP. Therefore, many traditional methods for estimating GDP with NTL may not be suitable for countries dependent on agriculture, like Uganda. Following this rationale, in this study, instead of using the population data only for estimating agricultural GDP, we proposed a simple process for estimating the rural GDP values, by combining the population and agricultural value ratios within the districts of Uganda.
There are still limitations for this method. First, because of the resolution restriction of NPP-VIIRS NTL, the NTL imagery is not likely to accurately demonstrate the dynamics of the economic activities at a finer spatial resolution. Second, since the NPP-VIIRS was only launched in 2012, there is a limited amount of time series data available. NPP-VIIRS may be combined with DMSP-OLS to cover a longer period of time, to demonstrate the dynamics of economic activities in Africa. Thirdly, because of the relatively coarse resolution of the NPP-VIIRS imagery, it may not be able to accurately define the urban regions and separate some agricultural activities from other secondary and tertiary sectors of the economy.

6. Conclusions

It is important to obtain timely and accurate information in order to evaluate the impacts of urbanization and to promote sustainable development in countries like Uganda. Stable nighttime light data from the DMSP-OLS and the NPP-VIIRS can be used to reveal the dynamics of urban expansion in Africa. In this study, we developed the ELIM method for extracting the dynamics of sub-national-level economic activities based on stable nighttime light data using a combination of population data from GHSL and agricultural value ratios. This ELIM method can be applied to many regions that (1) are dependent on agricultural activities and (2) have poor-quality census data. For example, ELIM can be applied to other Sub-Sahara African countries.
This ELIM method has improved upon the existing models by using agriculture production and price data to estimate the size of the agricultural economic activity in rural regions. Agricultural economic activity is a significant part of the national GDP, and it cannot be measured accurately using the nighttime light imagery alone. To overcome this limitation, we estimated the agricultural contribution geographically based on 16 representative agricultural commodities (production and average market price) so as to derive an estimate of the spatial distribution of agricultural GDP in Uganda, and then applied the national agricultural GDP to normalize these estimates. We applied a sequence of data preprocessing measures to remove the confounding factors from the NPP-VIIRS imagery.
The results of the ELIM indicate some emerging themes for those interested in district-level policy in Uganda. First, the distribution of economic activity is heavily concentrated in Central Uganda. Three districts (Kampala, Wakiso, and Mukono) account for nearly half of Uganda’s total GDP, while comprising only about 10.7% of Uganda’s population. Second, the top 10 district economies in Uganda make up about 66.3% of the total GDP, leaving the remaining 33.7% of the national economy coming from 106 districts.
Through a case study of Uganda, this research investigates the ability of the NPP-VIIRS data to estimate the sub-national GDP using multi-source data that not only improve the resolution of the dataset, but also capture the spatial heterogeneity of the socio-economic activities. By comparing our results with other publicly available data sources, the data generated from the ELIM model can better capture the variations of GDP within the sub-national administrative boundaries. GDP is also allocated based on the types of economic activities, instead of just based on the simple averaged values of population and GDP per capita, thus capturing the heterogeneous productivity across rural and urban landscapes. Because of the limited availability of calibrated and processed NPP-VIIRS data, it is important to produce multiple years of NPP-VIIRS NTL data analysis in the future, to further compare and improve the model performance. Moreover, obtaining accurate and relevant ground truth data is important for validation, so as to produce better-quality results.

Author Contributions

Conceptualization, all of the authors; methodology, all of the authors; validation, X.W. and M.R.; formal analysis, X.W. and M.R.; investigation, X.W. and M.R.; data curation, X.W., M.R, and P.S.; writing (original draft preparation), X.W. and M.R.; writing (review and editing), all of the authors; visualization, X.W. and M.R.; funding acquisition, M.R. and J.D.M.

Funding

This research was completed with the support from United States Agency for International Development (a subaward of AID-617-C-13-00007) and the Frederick S. Pardee Center for International Futures at the Josef Korbel School of International Studies at the University of Denver.

Acknowledgments

The authors would like to thank the staff and scientists at NOAA for providing VIIRS-NPP data. The authors would also like to thank the staff at the USAID-Uganda country office, the staff at The QED Group, LLC in Kampala, UNICEF-Uganda for hosting a presentation and discussion of this research, and the Frederick S. Pardee Center for International Futures for providing support.

Conflicts of Interest

The authors declare no conflict of interest.

Appendix A

Table A1. Enhanced light intensity model (ELIM) results. GDP—gross domestic product.
DistrictRegionRural GDP
(Million US $)
Urban GDP
(Million US $)
GDP Per Capita (US $)
AbimKaramoja5.831.78128
AdjumaniWest Nile61.247.04150
AgagoNorthern24.935.8786
AlebtongNorthern16.760.5768
AmolatarNorthern18.280.00127
AmudatKaramoja12.150.3990
AmuriaEastern26.960.5852
AmuruNorthern77.631.50317
ApacNorthern91.216.85247
AruaWest Nile101.1575.17202
BudakaEastern11.4011.75117
BududaEastern40.405.43244
BugiriEastern34.8429.08122
BuhwejuSouth West32.301.03275
BuikweCentral19.06354.35769
BukedeaEastern29.754.59160
BukomansimbiCentral39.047.72288
BukwoEastern20.210.61416
BulambuliEastern18.6210.10177
BuliisaWestern12.960.00145
BundibugyoWestern27.6211.14126
BushenyiSouth West51.2865.01415
BusiaEastern27.1747.48225
ButalejaEastern30.3611.30166
ButambalaCentral15.5522.58297
BuvumaCentral5.240.0084
BuyendeEastern45.071.45150
DokoloNorthern29.062.88153
GombaCentral26.407.01196
GuluNorthern50.3988.84492
HoimaWestern58.4777.40209
IbandaSouth West82.6829.75408
IgangaEastern152.6791.35434
IsingiroSouth West265.4126.58611
JinjaEastern35.28625.231199
KaabongKaramoja29.530.0059
KabaleSouth West49.0783.17405
KabaroleWestern158.0264.35505
KaberamaidoEastern21.330.5895
KagadiWestern19.3512.2469
KakumiroWestern20.645.78120
KalangalaCentral3.715.48112
KaliroEastern27.2152.22338
KalunguCentral38.5936.48401
KampalaKampala3.496269.643368
KamuliEastern72.4441.54202
KamwengeWestern79.477.38233
KanunguSouth West65.7812.77304
KapchorwaEastern19.8210.31226
KaseseWestern81.75154.39292
KatakwiEastern17.961.0094
KayungaCentral36.3542.59200
KibaaleWestern60.403.64453
KibogaCentral23.6624.64222
KibukuEastern22.237.56144
KiruhuraSouth West97.1118.07336
KiryandongoWestern34.4046.36223
KisoroSouth West36.2620.47230
KitgumNorthern16.0819.67125
KobokoWest Nile12.620.0044
KoleNorthern61.370.60229
KotidoKaramoja47.600.36166
KumiEastern23.847.97110
KweenEastern15.530.00136
KyankwanziCentral38.794.18223
KyegegwaWestern40.676.26256
KyenjojoWestern58.5712.08161
LamwoNorthern14.090.0071
LiraNorthern23.67122.63341
LuukaEastern89.0910.04351
LuweroCentral48.74148.98412
LwengoCentral56.5760.72416
LyantondeCentral25.0621.85424
ManafwaEastern44.3821.34154
MarachaWest Nile35.958.39203
MasakaCentral47.82230.471051
MasindiWestern32.4449.78187
MayugeCentral37.3889.07232
MbaleEastern88.91269.65715
MbararaSouth West221.84394.651311
MitoomaSouth West48.824.98262
MityanaCentral32.7883.85350
MorotoKaramoja7.8716.04147
MoyoWest Nile16.493.6334
MpigiCentral35.96298.051624
MubendeCentral215.47125.19489
MukonoCentral34.22958.081654
NakapiripiritKaramoja20.270.00102
NakasekeCentral25.4425.76234
NakasongolaCentral69.3512.77481
NamayingoEastern20.750.0080
NamutumbaEastern48.364.40217
NapakKaramoja12.250.0051
NebbiWest Nile45.6812.33151
NgoraEastern13.916.47105
NtorokoWestern6.093.8392
NtungamoSouth West240.6250.98552
NwoyaNorthern49.381.19802
OmoroNorthern27.450.19183
OtukeNorthern7.590.0078
OyamNorthern96.5818.18251
PaderNorthern21.254.1292
PallisaEastern41.4310.14124
RakaiCentral94.9242.93275
RubandaSouth West17.260.3585
RubiriziSouth West30.734.69257
RukungiriSouth West76.0622.50278
SerereEastern108.121.41312
SheemaSouth West44.6520.44256
SironkoEastern24.8321.47174
SorotiEastern98.4672.86444
SsembabuleCentral69.0212.11341
TororoEastern136.89119.59466
WakisoCentral32.004262.302496
YumbeWest Nile63.400.0091
ZomboWest Nile28.557.90148

References

  1. Deb, S. Gap between GDP and HDI: Are the Rich Country Experiences Different from the Poor? In Proceedings of the IARIW-OECD Special Conference, Paris, France, 16–17 August 2015. [Google Scholar]
  2. World Population Prospects: The 2017 Revision, Key Findings and Advance Tables; Working Paper No. ESA/P/WP/248; United Nations, Department of Economic and Social Affairs, Population Division: Rome, Italy, 2017.
  3. Clark, J.I.; Rhind, D.W. Population data and global environmental change; International Social Science Council and UNESCO: Paris, France, 1992. [Google Scholar]
  4. Rose, A.N.; Bright, E.A. The LandScan Global Population Distribution Project: Current State of the Art and Prospective Innovation; Oak Ridge National Lab. (ORNL): Oak Ridge, TN, USA, 2014.
  5. Henderson, J.V.; Storeygard, A.; Weil, D.N. Measuring Economic Growth from Outer Space. Am. Econ. Rev. Nashv. 2012, 102, 994–1028. [Google Scholar] [CrossRef] [Green Version]
  6. Welch, R. Monitoring urban population and energy utilization patterns from satellite Data. Remote Sens. Environ. 1980, 9, 1–9. [Google Scholar] [CrossRef]
  7. Welch, R.; Zupko, S. Urbanized area energy-utilization patterns from DMSP data. Photogramm. Eng. Remote Sens. 1980, 46, 201–207. [Google Scholar]
  8. Baugh, K.; Elvidge, C.D.; Ghosh, T.; Ziskin, D. Development of a 2009 stable lights product using DMSP-OLS data. Proc. Asia Pac. Adv. Netw. 2010, 30, 114–130. [Google Scholar] [CrossRef]
  9. Hillger, D.; Kopp, T.; Lee, T.; Lindsey, D.; Seaman, C.; Miller, S.; Solbrig, J.; Kidder, S.; Bachmeier, S.; Jasmin, T. First-light imagery from Suomi NPP VIIRS. Bull. Am. Meteorol. Soc. 2013, 94, 1019–1029. [Google Scholar] [CrossRef]
  10. Agriculture in Sub-Saharan Africa: Prospects and challenges for the next decade. In OECD-FAO Agricultural Outlook 2016–2025; OECD: Paris, France, 2016; pp. 59–95. ISBN 978-92-64-25322-3.
  11. Bundervoet, T.; Maiyo, L.; Sanghi, A. Bright Lights, Big Cities: Measuring National and Subnational Economic Growth in Africa from Outer Space, with an Application to Kenya and Rwanda; The World Bank: Washington, DC, USA, 2015. [Google Scholar]
  12. Uganda Bureau of Statistics. Uganda Census of Agriculture 2008/2009, Volume IV: Crop Area and Production Report. Uganda Bureau of Statistics 2010; Uganda Bureau of Statistics: Kampala, Uganda, 2010. [Google Scholar]
  13. Uganda Bureau of Statistics. Uganda Demographic and Health Survey 2016/17; Uganda Bureau of Statistics: Kampala, Uganda, 2016. [Google Scholar]
  14. Elvidge, C.D.; Baugh, K.E.; Zhizhin, M.; Hsu, F.-C. Why VIIRS data are superior to DMSP for mapping nighttime lights. Proc. Asia Pac. Adv. Netw. 2013, 35, 62–69. [Google Scholar] [CrossRef]
  15. Shi, K.; Yu, B.; Huang, Y.; Hu, Y.; Yin, B.; Chen, Z.; Chen, L.; Wu, J. Evaluating the ability of NPP-VIIRS nighttime light data to estimate the gross domestic product and the electric power consumption of China at multiple scales: A comparison with DMSP-OLS Data. Remote Sens. 2014, 6, 1705–1724. [Google Scholar] [CrossRef]
  16. Pesaresi, M.; Syrris, V.; Julea, A. A new method for earth observation data analytics based on symbolic machine learning. Remote Sens. 2016, 8, 399. [Google Scholar] [CrossRef]
  17. Uganda Bureau of Statistics. A Summary Report of the National Livestock Census, 2008; Uganda Bureau of Statistics: Kampala, Uganda, 2009. [Google Scholar]
  18. Food and Agriculture Organization Statistical Databases; Food and Agriculture Organization of the United Nations: Rome, Italy, 2012.
  19. Cotton Development Organisation. Cotton Development Organisation Annual Report 2009–2010; Cotton Development Organisation: Kampala, Uganda, 2010. [Google Scholar]
  20. Uganda Bureau of Statistics. National Population and Housing Census 2014, Subcounty Report—Northern Region; Uganda Bureau of Statistics: Kampala, Uganda, 2014. [Google Scholar]
  21. Uganda Bureau of Statistics. National Population and Housing Census 2014, Main Report; Uganda Bureau of Statistics: Kampala, Uganda, 2014. [Google Scholar]
  22. Coffee Producing Areas of Uganda. Available online: https://www.geogecko.com/blog/ugandacoffeemap/ (accessed on 27 August 2018).
  23. FIT Insights Group Limited. Available online: https://fitinsightsgroup.com/uganda-2/ (accessed on 27 August 2018).
  24. Uganda Coffee Development Authority. Coffee Price Trend 1992–2015; Uganda Coffee Development Authority: Kampala, Uganda, 2015.
  25. Li, X.; Xu, H.; Chen, X.; Li, C. Potential of NPP-VIIRS nighttime light imagery for modeling the regional economy of China. Remote Sens. 2013, 5, 3057–3081. [Google Scholar] [CrossRef]
  26. Ghosh, T.L.; Powell, R.D.; Elvidge, C.E.; Baugh, K.C.; Sutton, P.; Anderson, S. Shedding Light on the Global Distribution of Economic Activity. Open Geogr. J. 2010, 3, 147–160. [Google Scholar]
  27. Letu, H.; Hara, M.; Yagi, H.; Naoki, K.; Tana, G.; Nishio, F.; Shuhei, O. Estimating energy consumption from night-time DMPS/OLS imagery after correcting for saturation effects. Int. J. Remote Sens. 2010, 31, 4443–4458. [Google Scholar] [CrossRef]
  28. Aldhous, P. China’s burning ambition. Nature 2005, 435, 1152–1154. [Google Scholar] [CrossRef] [PubMed]
  29. Zhang, Q.; Seto, K.C. Mapping urbanization dynamics at regional and global scales using multi-temporal DMSP/OLS nighttime light data. Remote Sens. Environ. 2011, 115, 2320–2329. [Google Scholar] [CrossRef]
  30. Lo, C.P. Modeling the population of China using DMSP operational linescan system nighttime data. Photogramm. Eng. Remote Sens. 2001, 67, 1037–1047. [Google Scholar]
  31. Townsend, A.; Bruce, D. The Use of Night-time Lights Satellite Imagery as a Measure of Australia’s Regional Electricity Consumption and Population Distribution. Int. J. Remote Sens. 2010, 31, 4459–4480. [Google Scholar] [CrossRef]
  32. Nordhaus, W.D. Geography and macroeconomics: New data and new findings. Proc. Natl. Acad. Sci. USA 2006, 103, 3510–3517. [Google Scholar] [CrossRef] [PubMed] [Green Version]
  33. Kummu, M.; Taka, M.; Guillaume, J.H. Gridded global datasets for gross domestic product and Human Development Index over 1990–2015. Sci. Data 2018, 5, 180004. [Google Scholar] [CrossRef] [PubMed]
  34. Nordhaus, W.; Azam, Q.; Corderi, D.; Hood, K.; Makarova, N.; Mukhtar, A.; Miltner, A.; Weiss, J. The G-Econ Database on Gridded Output: Methods and Data; Yale University, 2006; Available online: http://gecon.yale.edu/ (accessed on 29 August 2018).
  35. Sutton, P.C.; Elvidge, C.D.; Ghosh, T. Estimation of gross domestic product at sub-national scales using nighttime satellite imagery. Int. J. Ecol. Econ. Stat. 2007, 8, 5–21. [Google Scholar]
Figure 1. Estimating sub-national gross domestic product (GDP) using enhanced light intensity model (ELIM) method.
Remotesensing 11 00163 g001
Figure 2. Map showing the distribution of Uganda’s districts’ total GDP (a) and GDP at a 1 km resolution (b).
Remotesensing 11 00163 g002
Figure 3. Uganda 116 Districts’ GDP and population (a) and Uganda regional GDP and population (b).
Remotesensing 11 00163 g003
Figure 4. Comparisons of (a) G-Econ data from [34], (b) Gridded Global GDP data from the authors of [33], and (c) the differences between the percent of GDP for ELIM and the percent of GDP for the Gridded global GDP data at a district level.
Remotesensing 11 00163 g004
Figure 5. Comparison between the ELIM and Gridded Global GDP data.
Remotesensing 11 00163 g005

