Evaluation of Landsat-8 and Sentinel-2A Aerosol Optical Depth Retrievals across Chinese Cities and Implications for Medium Spatial Resolution Urban Aerosol Monitoring


Abstract
:1. Introduction
2. Data
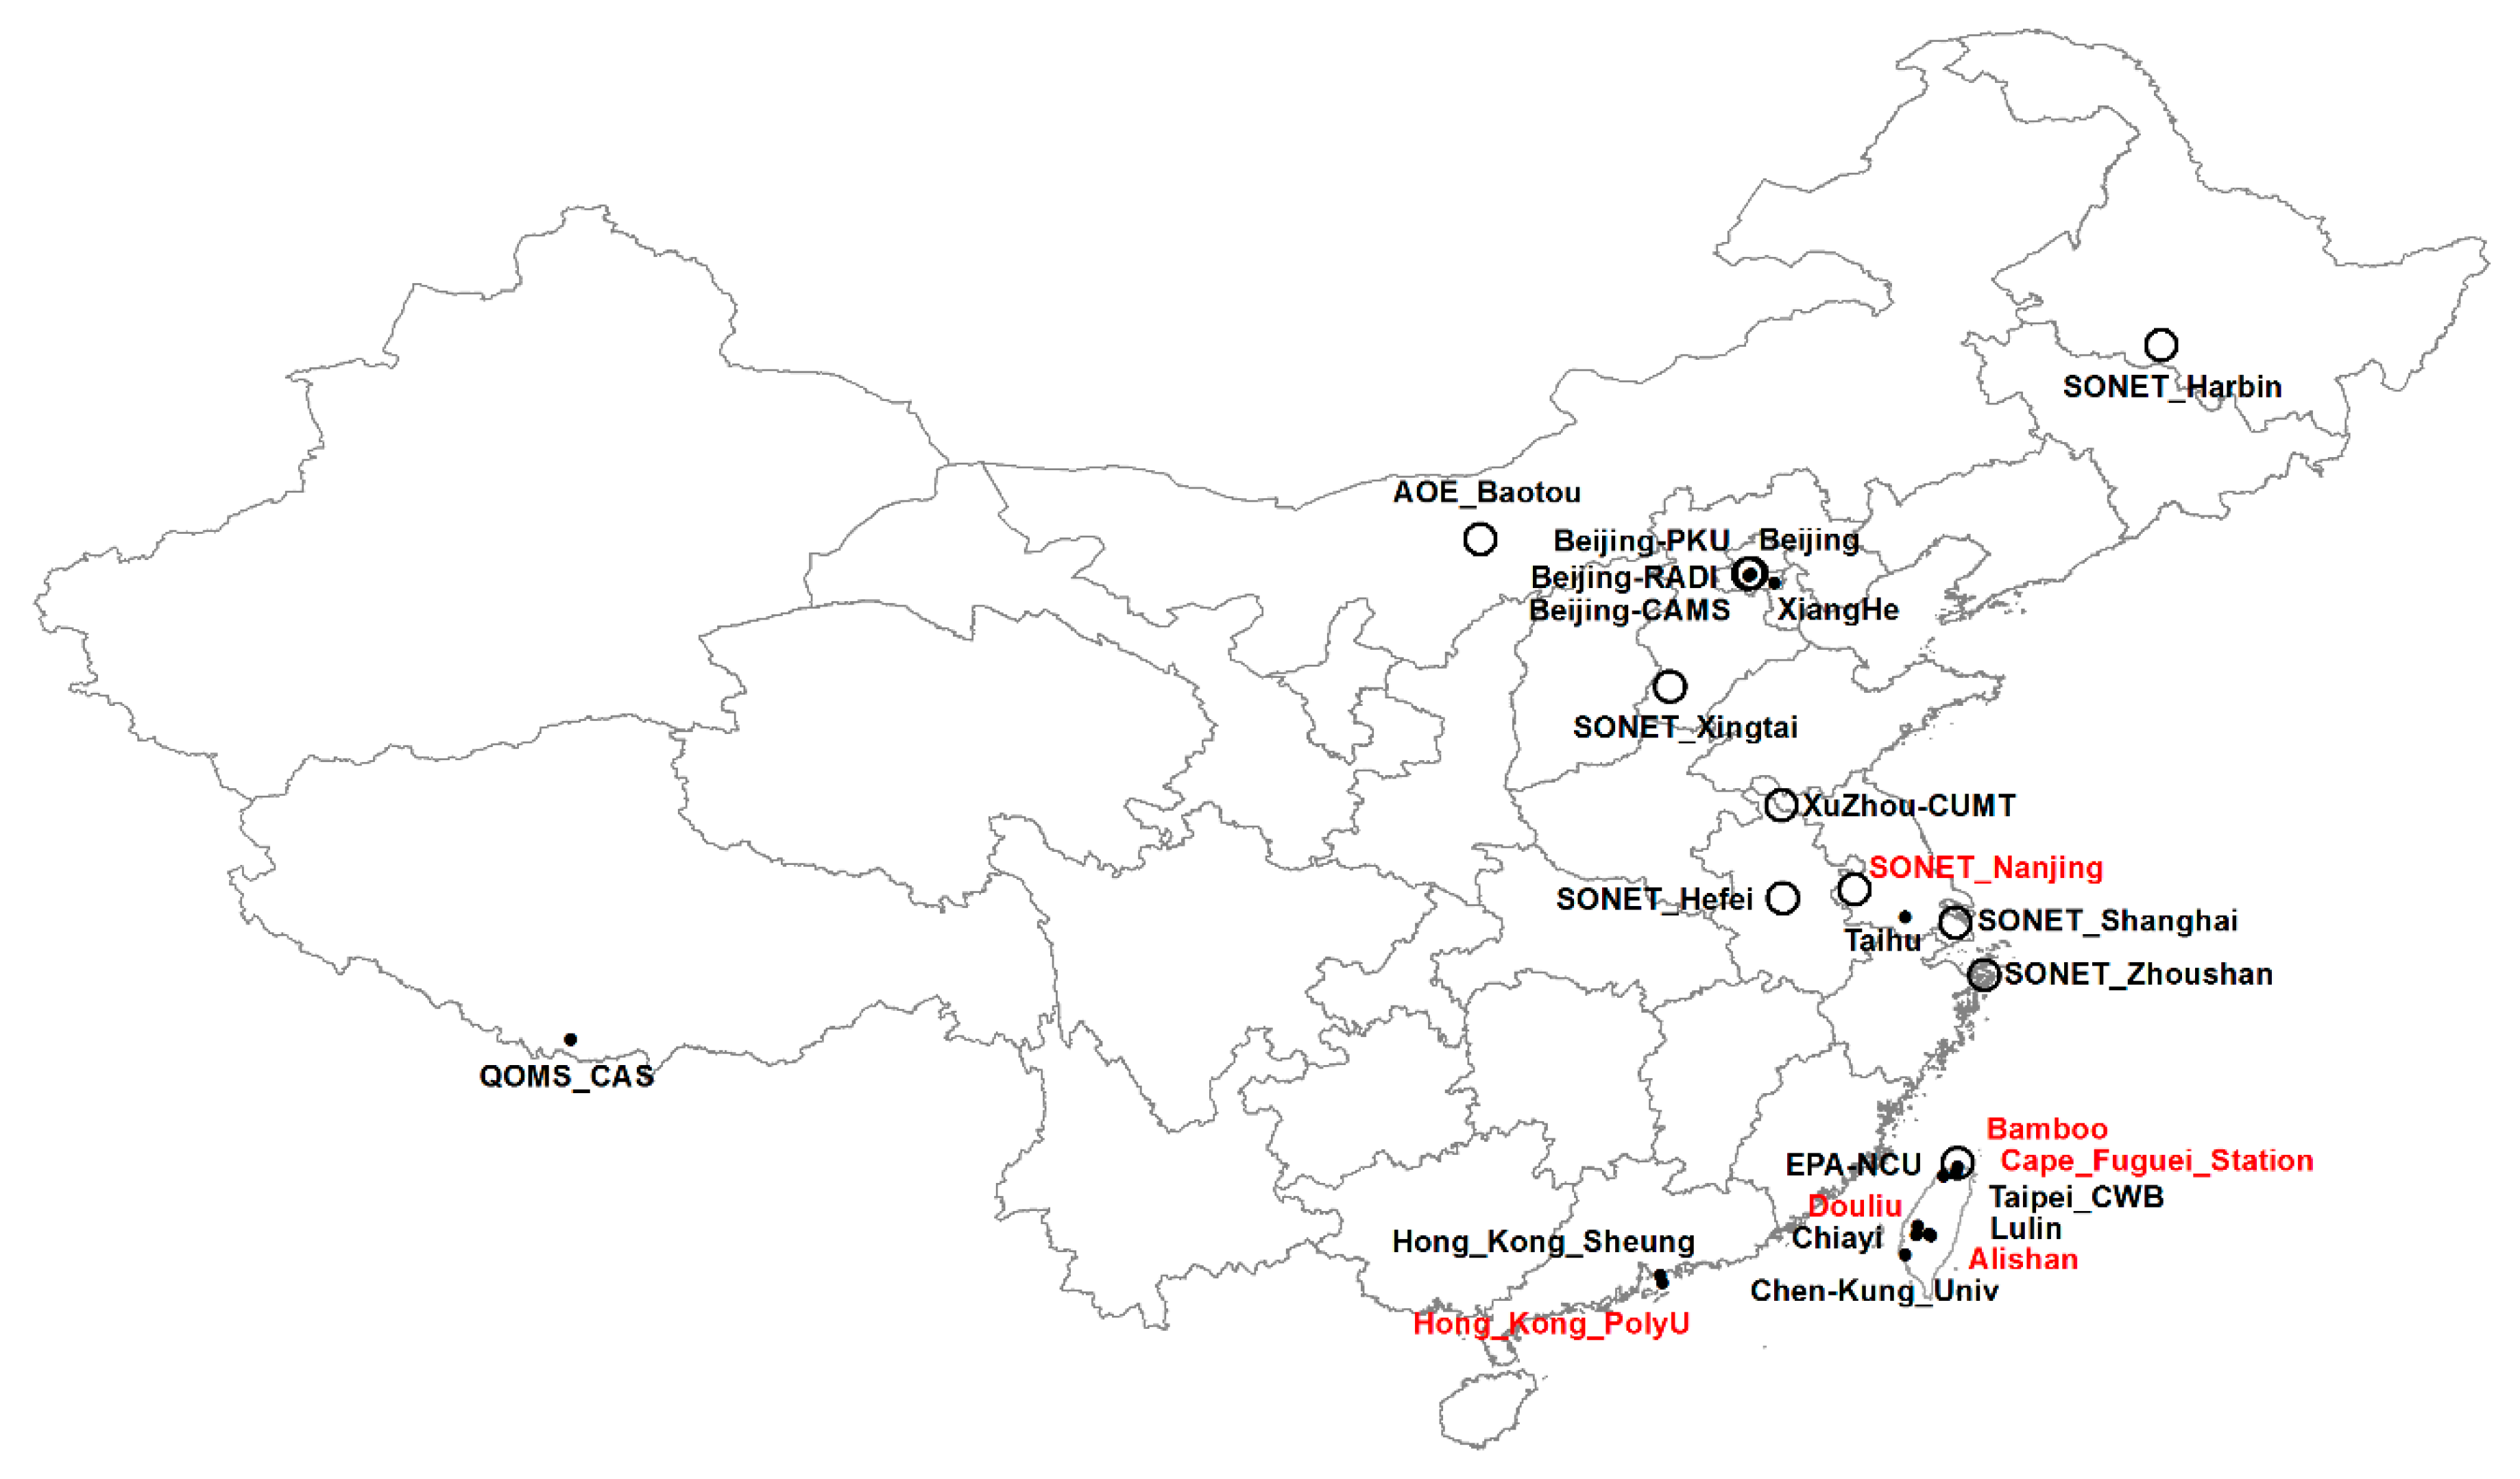
2.1. AERONET Data
2.2. Landsat-8 and Sentinel-2A Data
3. Methods
3.1. Landsat-8 and Sentinel-2A Aerosol Optical Depth (AOD) Retrieval
3.2. Comparison of Contemporaneous AERONET and Satellite Retrieved AOD
4. Results
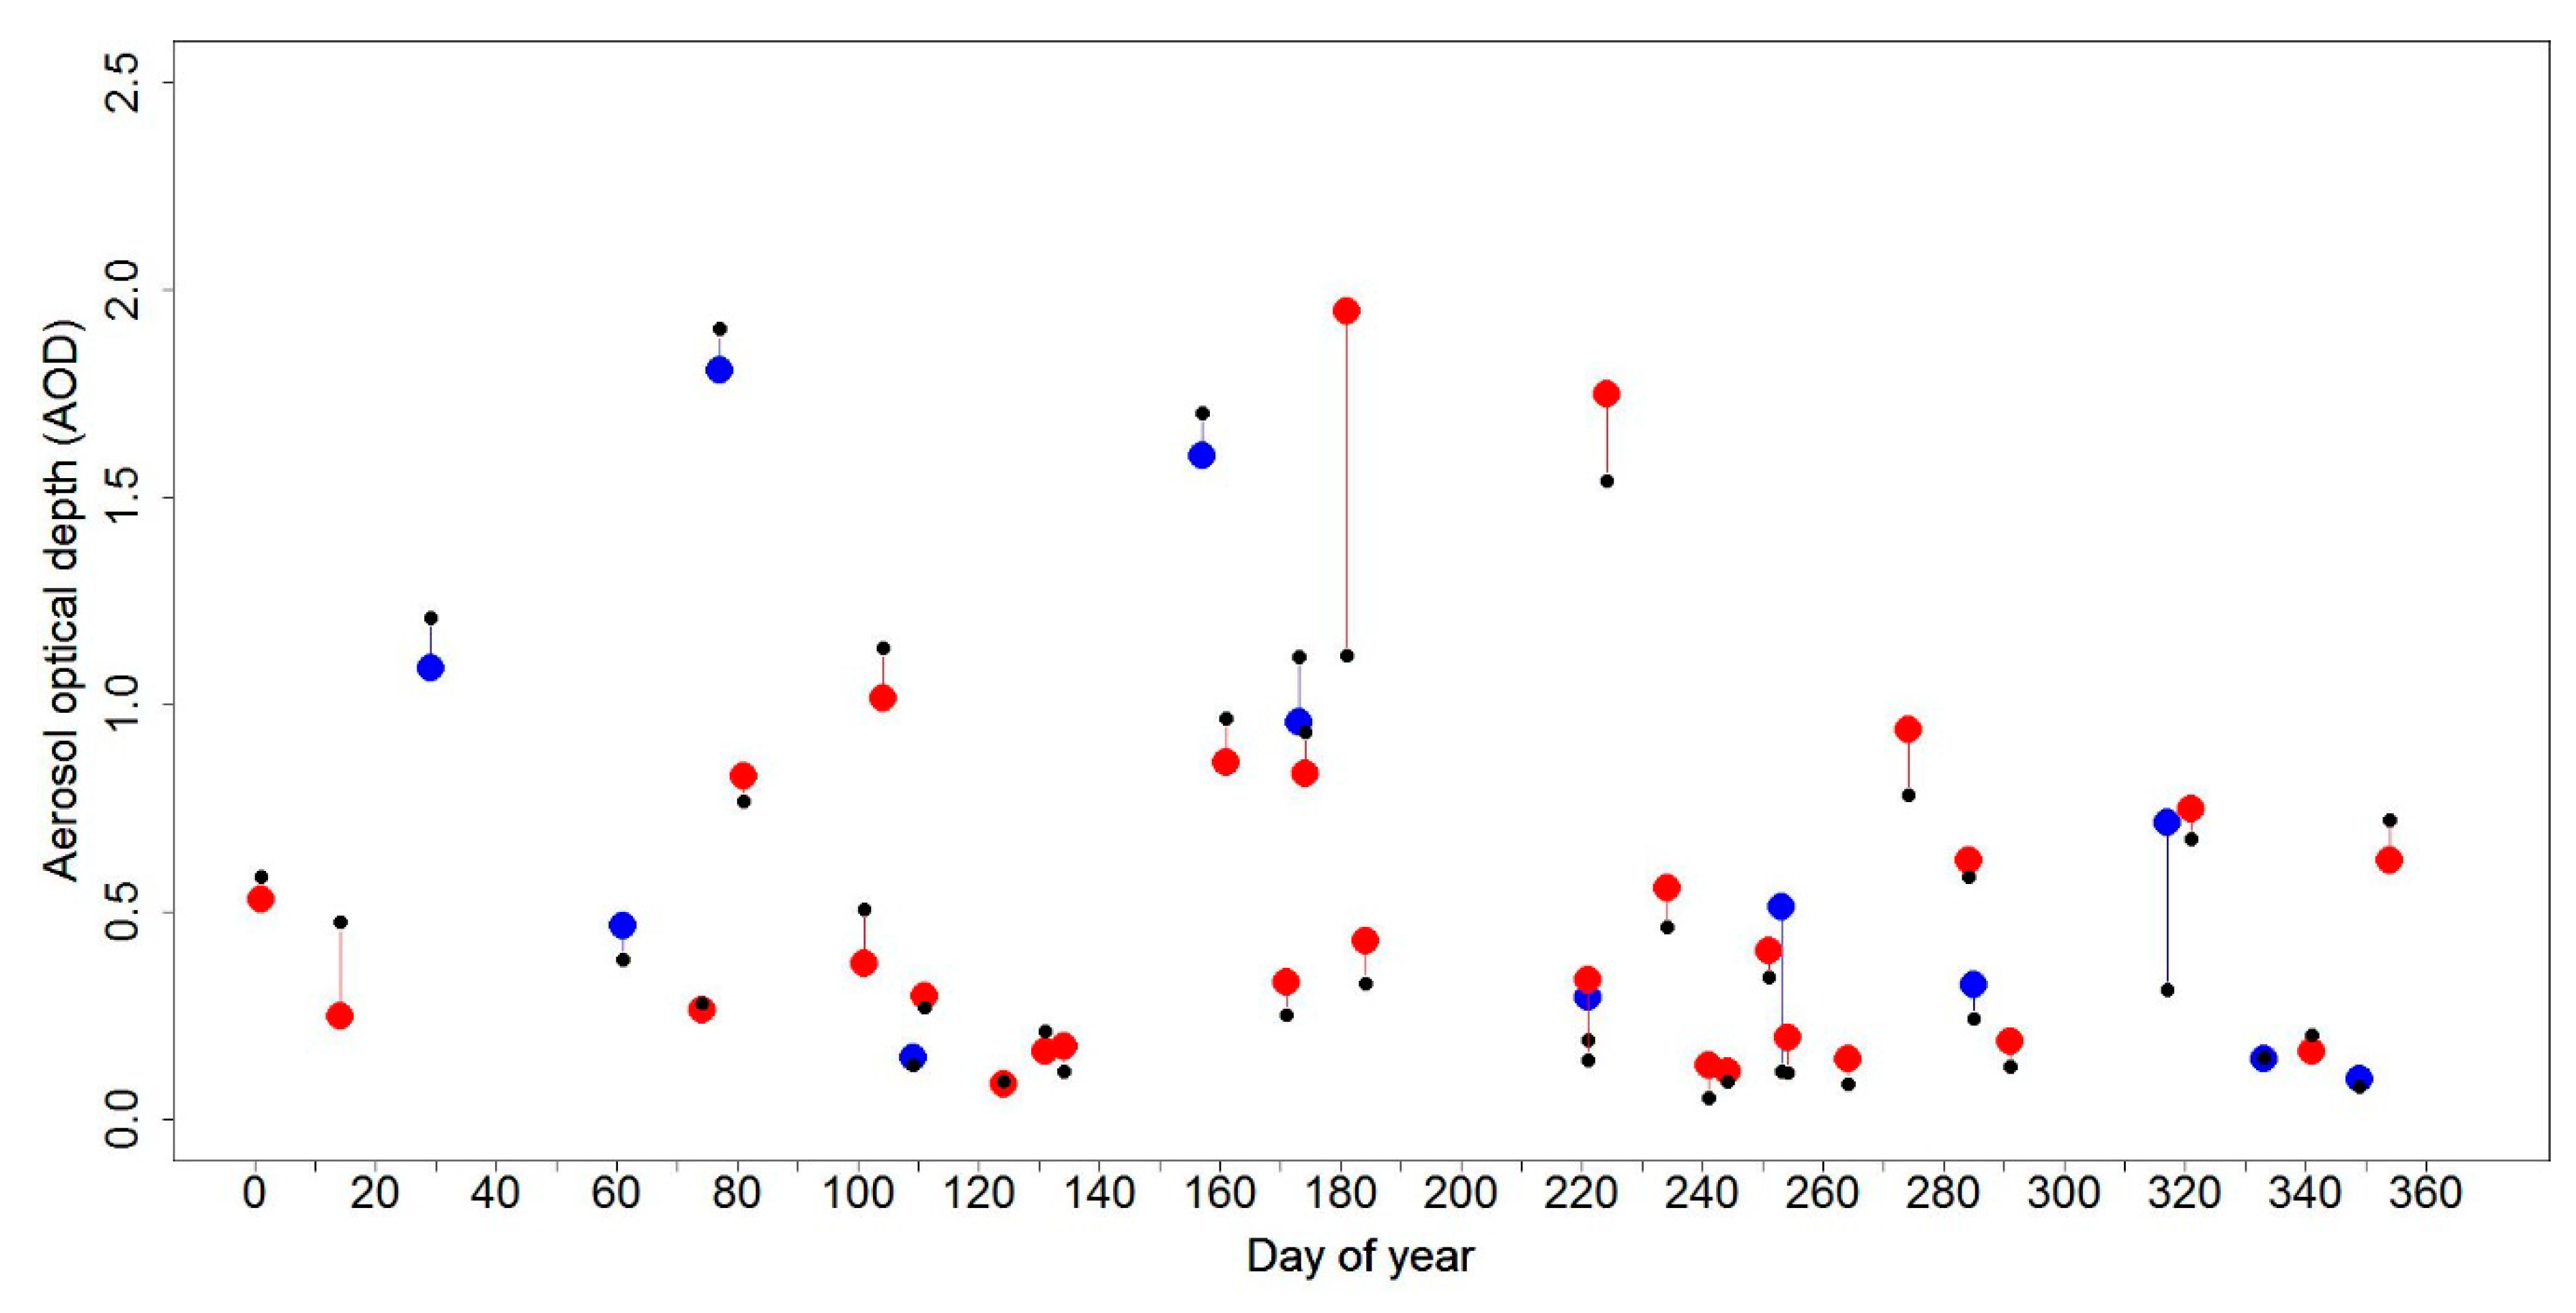
4.1. Contemporaneous Data Availability and Example Annual Satellite and AERONET AOD Data Comparison
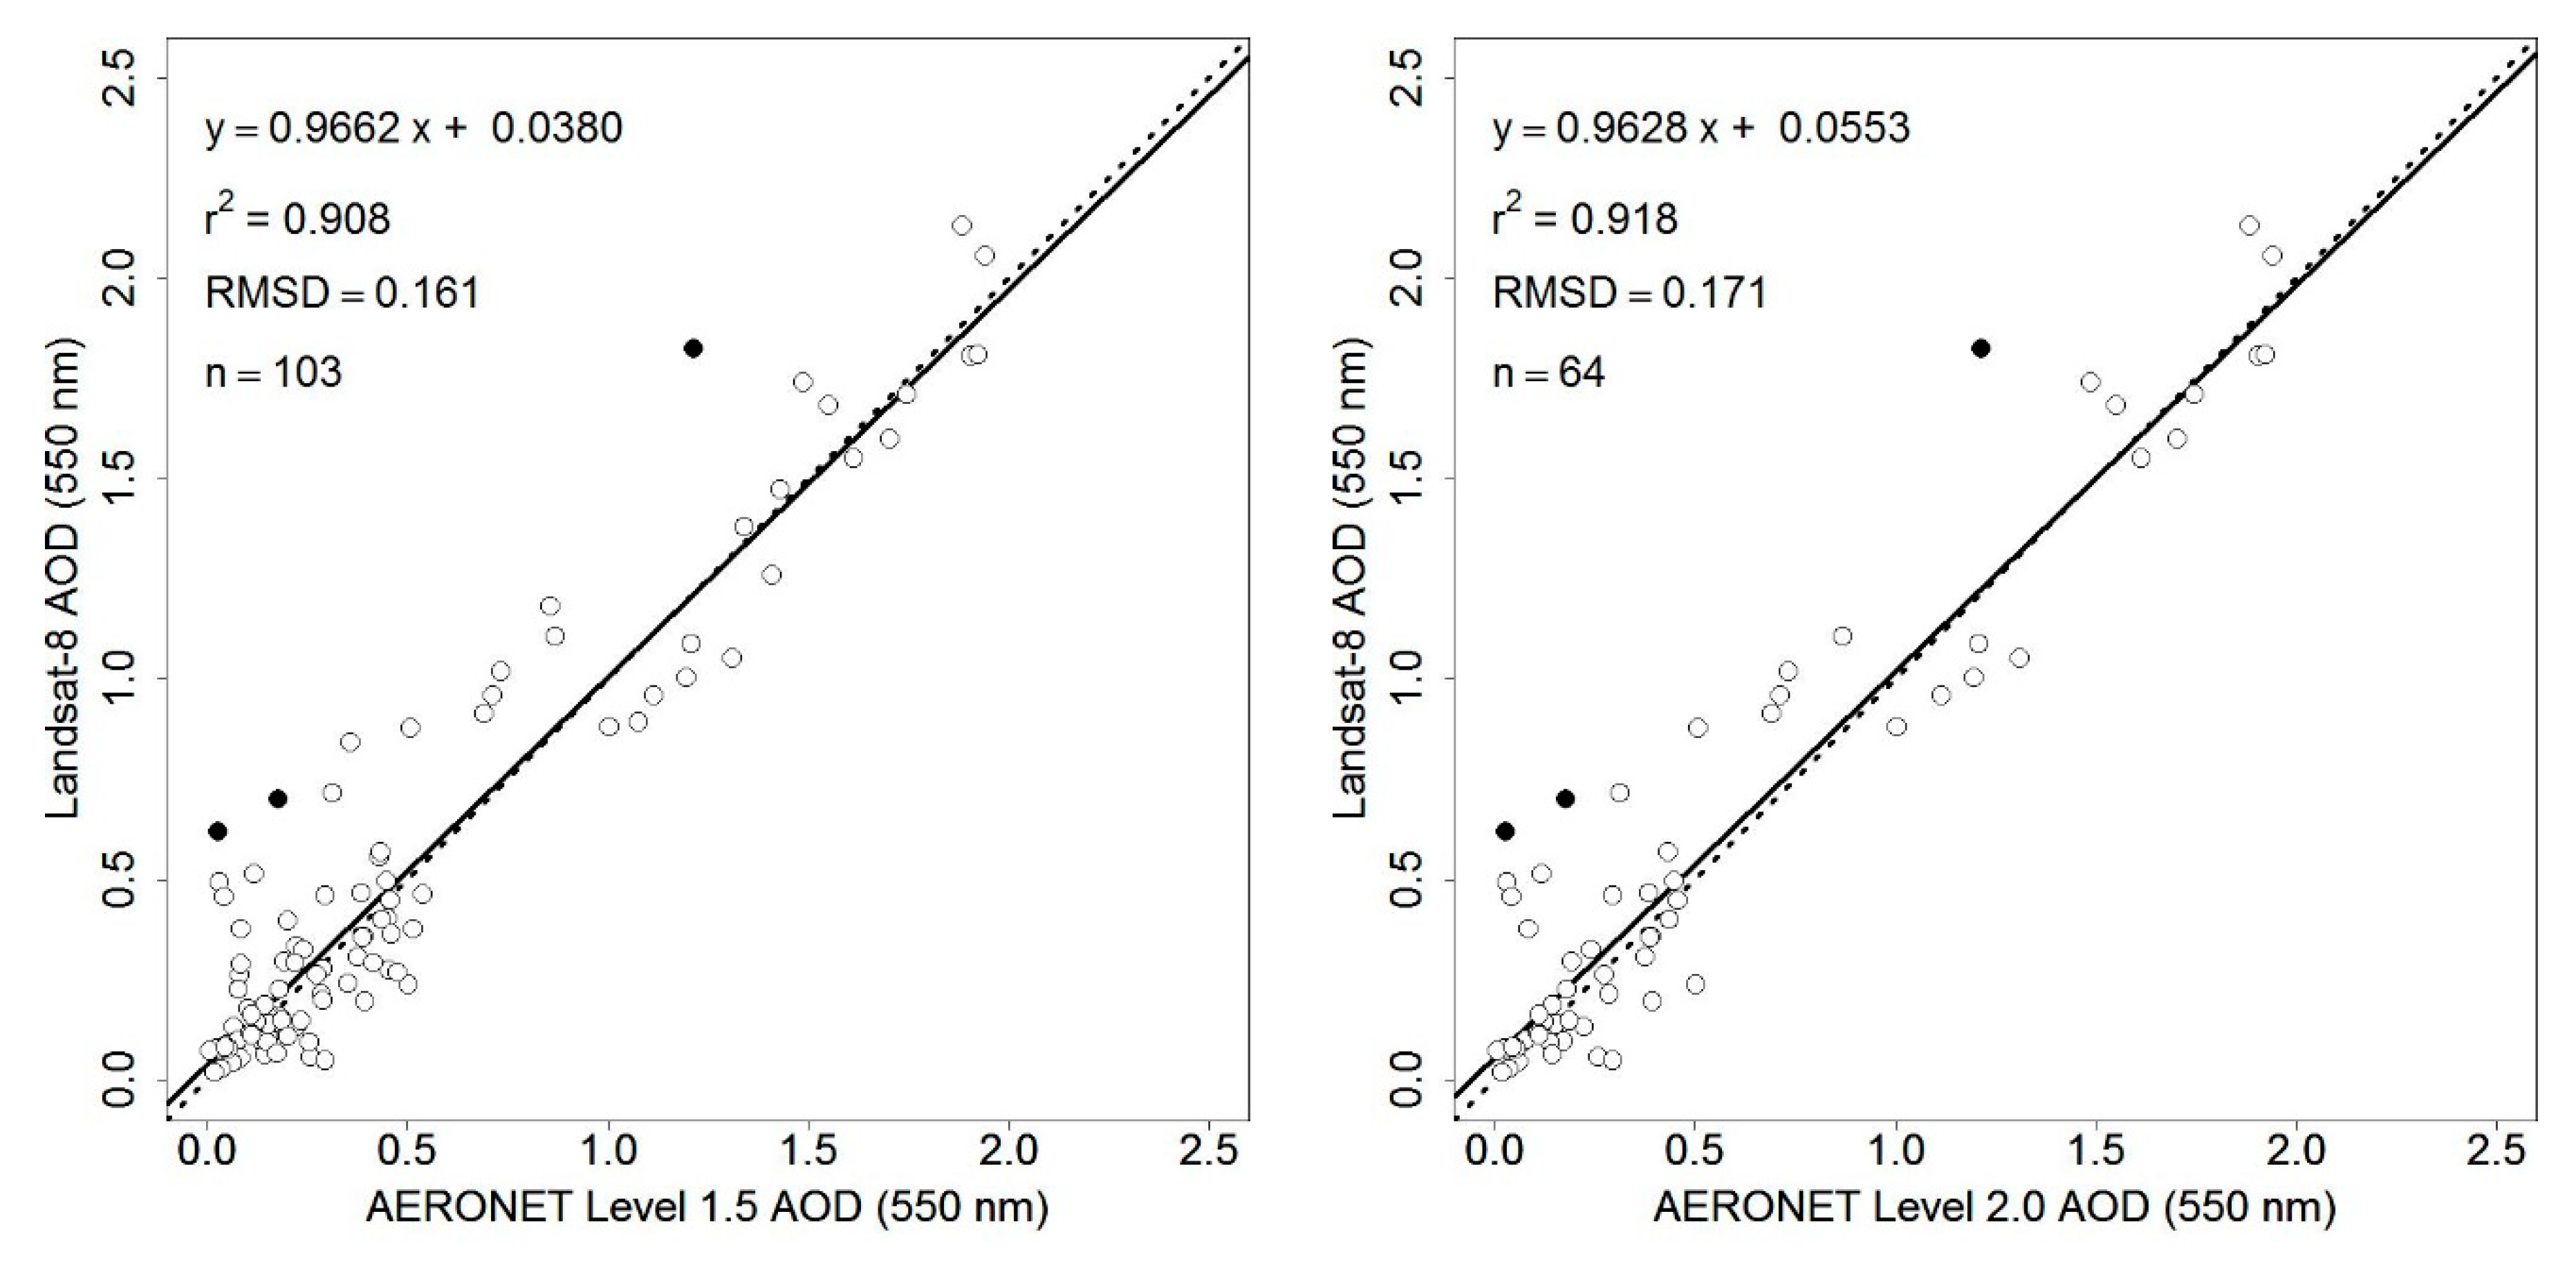
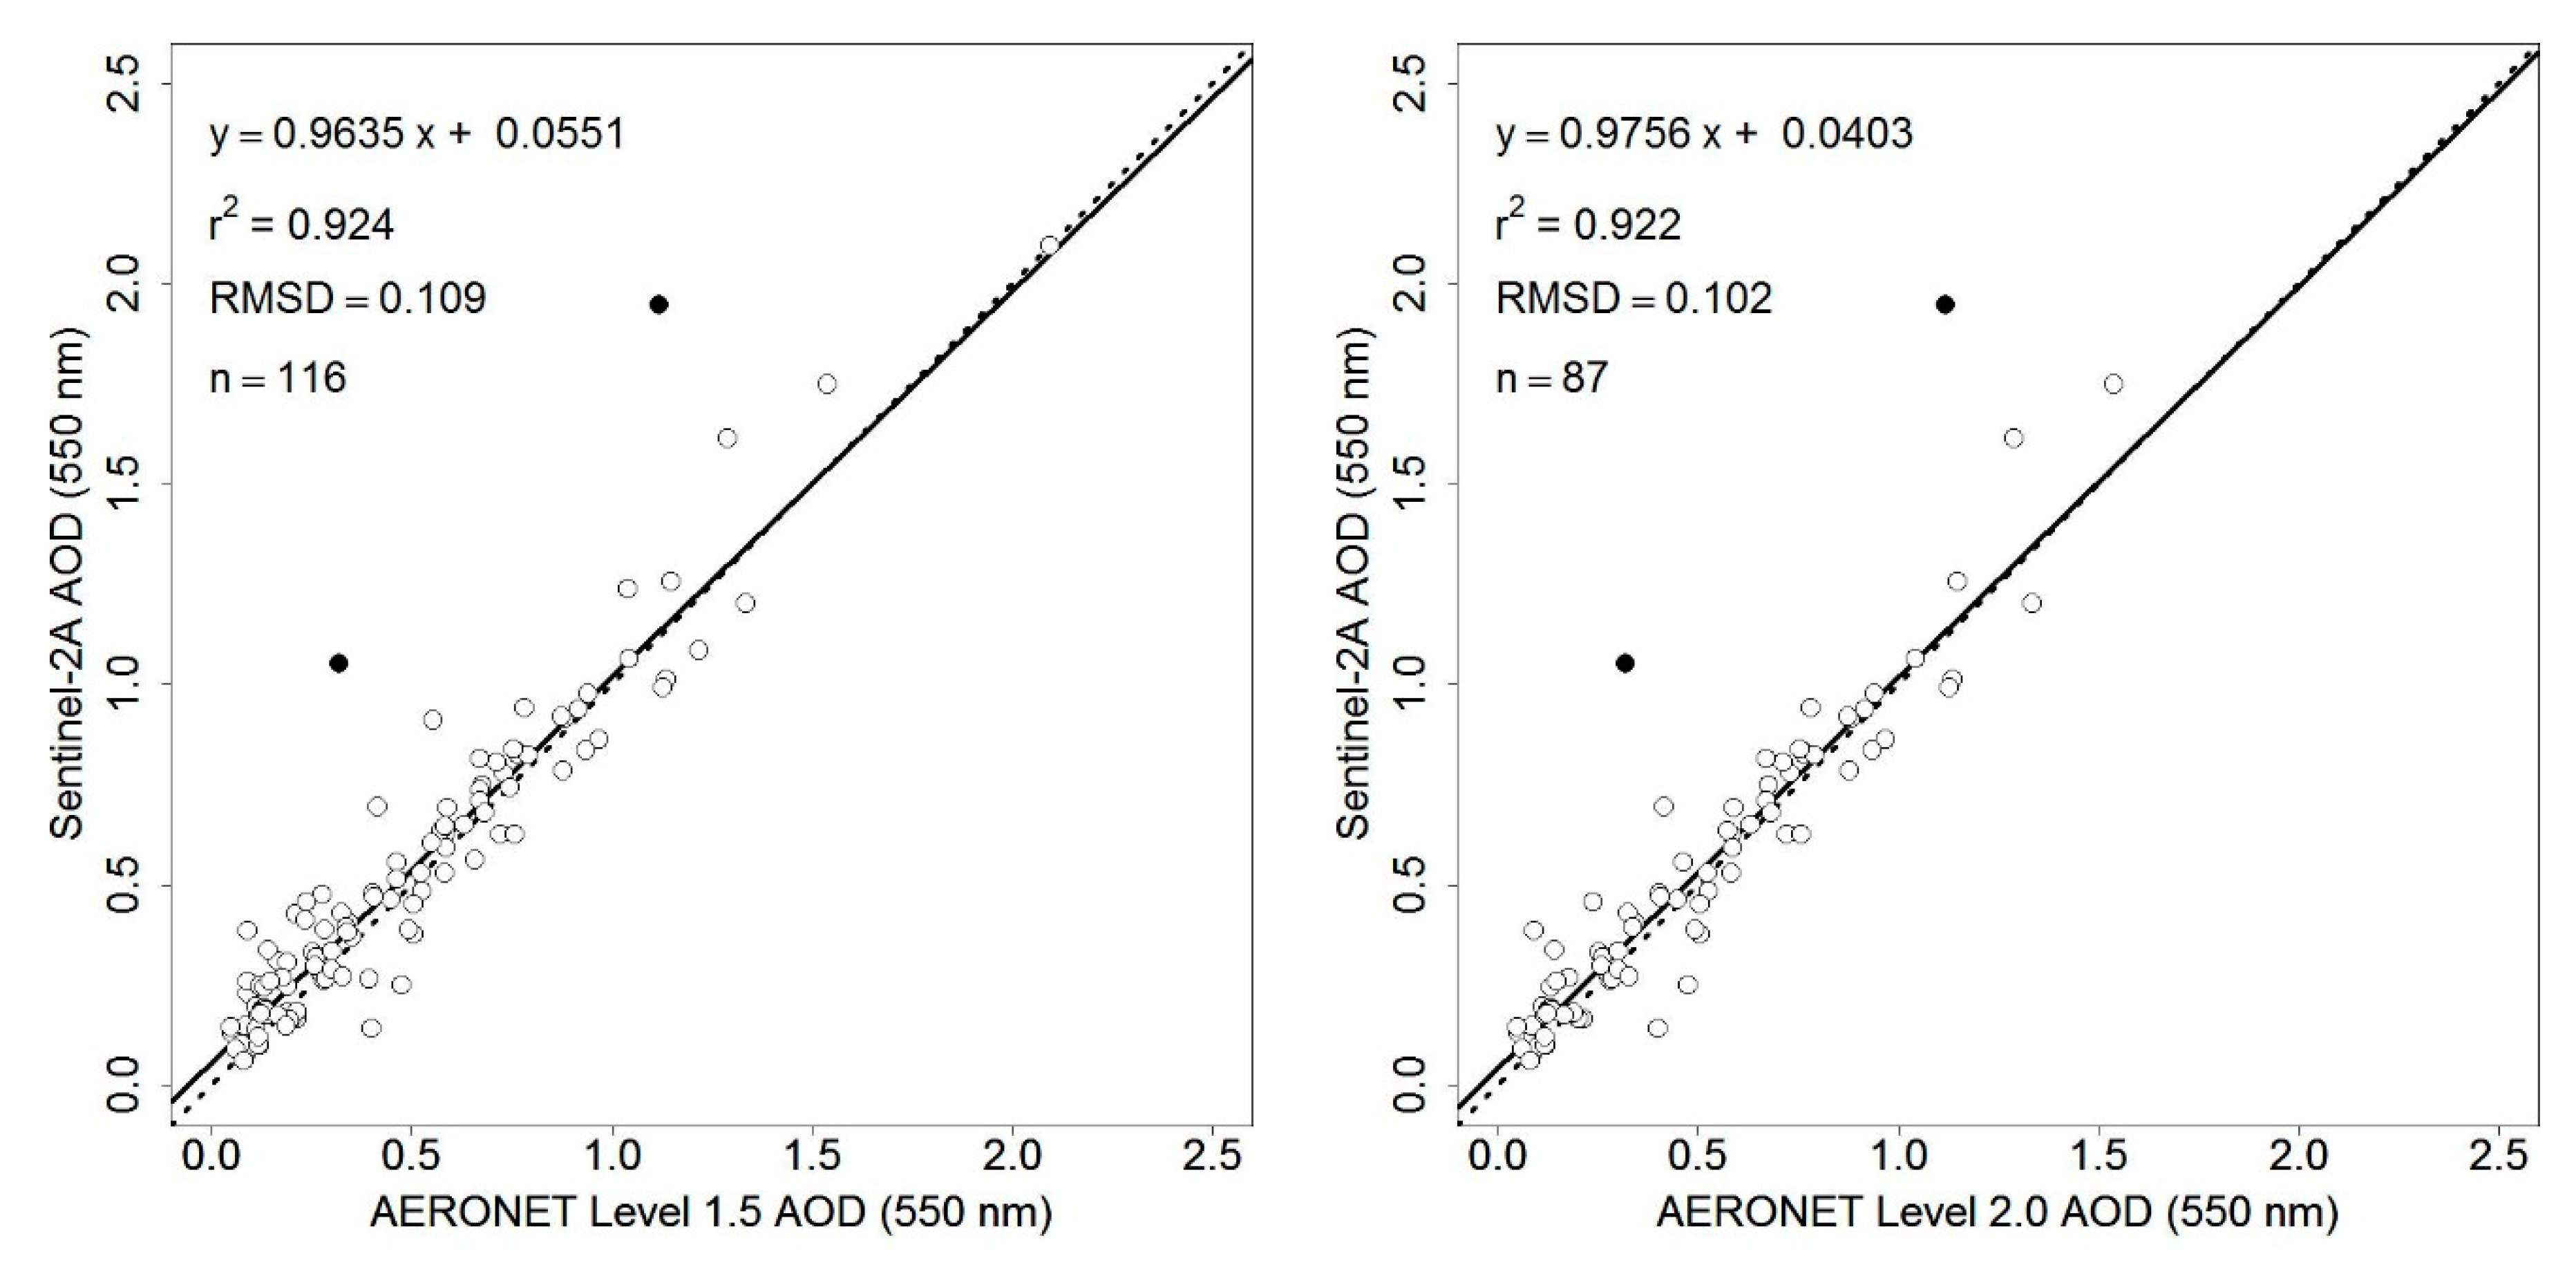
4.2. Satellite and AERONET AOD Comparison
5. Discussion
6. Conclusions
Author Contributions
Funding
Acknowledgments
Conflicts of Interest
References
- Guo, S.; Hu, M.; Zamora, M.L.; Peng, J.; Shang, D.; Zheng, J.; Du, Z.; Wu, Z.; Shao, M.; Zeng, L.; et al. Elucidating severe urban haze formation in China. Proc. Natl. Acad. Sci. USA 2014, 111, 17373–17378. [Google Scholar] [CrossRef] [PubMed] [Green Version]
- Guan, D.; Su, X.; Zhang, Q.; Peters, G.P.; Liu, Z.; Lei, Y.; He, K. The socioeconomic drivers of China’s primary PM2.5 emissions. Environ. Res. Lett. 2014, 9, 024010. [Google Scholar] [CrossRef]
- Rohde, R.A.; Muller, R.A. Air pollution in China: Mapping of concentrations and sources. PLoS ONE 2015, 10, e0135749. [Google Scholar] [CrossRef] [PubMed]
- Peng, J.; Chen, S.; Lü, H.; Liu, Y.; Wu, J. Spatiotemporal patterns of remotely sensed PM2.5 concentration in China from 1999 to 2011. Remote Sens. Environ. 2016, 174, 109–121. [Google Scholar] [CrossRef]
- Gao, J.; Woodward, A.; Vardoulakis, S.; Kovats, S.; Wilkinson, P.; Li, L.; Xu, L.; Li, J.; Yang, J.; Cao, L.; et al. Haze, public health and mitigation measures in China: A review of the current evidence for further policy response. Sci. Total Environ. 2017, 578, 148–157. [Google Scholar] [CrossRef] [PubMed] [Green Version]
- Lu, Y.; Wang, Y.; Zuo, J.; Jiang, H.; Huang, D.; Rameezdeen, R. Characteristics of public concern on haze in China and its relationship with air quality in urban areas. Sci. Total Environ. 2018, 637, 1597–1606. [Google Scholar] [CrossRef] [PubMed]
- Kaufman, Y.J.; Tanré, D.; Boucher, O. A satellite view of aerosols in the climate system. Nature 2002, 419, 215–223. [Google Scholar] [CrossRef]
- Kokhanovsky, A.A.; Deuzé, J.L.; Diner, D.J.; Dubovik, O.; Ducos, F.; Emde, C.; Garay, M.J.; Grainger, R.G.; Heckel, A.; Herman, M.; et al. The inter-comparison of major satellite aerosol retrieval algorithms using simulated intensity and polarization characteristics of reflected light. Atmos. Meas. Tech. 2010, 3, 909–932. [Google Scholar] [CrossRef] [Green Version]
- Levy, R.C.; Mattoo, S.; Munchak, L.A.; Remer, L.A.; Sayer, A.M.; Patadia, F.; Hsu, N.C. The Collection 6 MODIS aerosol products over land and ocean. Atmos. Meas. Tech. 2013, 6, 2989. [Google Scholar] [CrossRef]
- Wang, J.; Christopher, S.A. Intercomparison between satellite-derived aerosol optical thickness and PM2.5 mass: Implications for air quality studies. Geophys. Res. Lett. 2003, 30. [Google Scholar] [CrossRef]
- Van Donkelaar, A.; Martin, R.V.; Brauer, M.; Kahn, R.; Levy, R.; Verduzco, C.; Villeneuve, P.J. Global estimates of ambient fine particulate matter concentrations from satellite-based aerosol optical depth: Development and application. Environ. Health Perspect. 2010, 118, 847. [Google Scholar] [CrossRef] [PubMed]
- Kloog, I.; Chudnovsky, A.A.; Just, A.C.; Nordio, F.; Koutrakis, P.; Coull, B.A.; Lyapustin, A.; Wang, Y.; Schwartz, J. A new hybrid spatio-temporal model for estimating daily multi-year PM2.5 concentrations across northeastern USA using high resolution aerosol optical depth data. Atmos. Environ. 2014, 95, 581–590. [Google Scholar] [CrossRef] [PubMed]
- Ma, Z.; Hu, X.; Sayer, A.M.; Levy, R.; Zhang, Q.; Xue, Y.; Tong, S.; Bi, J.; Huang, L.; Liu, Y. Satellite-based spatiotemporal trends in PM2.5 concentrations: China, 2004–2013. Environ. Health Perspect. 2015, 124, 184–192. [Google Scholar] [CrossRef] [PubMed]
- Torres, O.; Bhartia, P.K.; Herman, J.R.; Sinyuk, A.; Ginoux, P.; Holben, B. A long-term record of aerosol optical depth from TOMS observations and comparison to AERONET measurements. J. Atmos. Sci. 2002, 59, 398–413. [Google Scholar] [CrossRef]
- Leroy, M.; Deuzé, J.L.; Bréon, F.M.; Hautecoeur, O.; Herman, M.; Buriez, J.C.; Tanré, D.; Bouffies, S.; Chazette, P.; Roujean, J.L. Retrieval of atmospheric properties and surface bidirectional reflectances over land from POLDER/ADEOS. J. Geophys. Res. Atmos. 1997, 102, 17023–17037. [Google Scholar] [CrossRef] [Green Version]
- Diner, D.J.; Abdou, W.; Ackerman, T.; Crean, K.; Gordon, H.; Kahn, R.; Martonchik, J.; McMuldroch, S.; Paradise, S.; Pinty, B.; et al. MISR Level 2 Aerosol Retrieval Algorithm Theoretical Basis; NASA: Greenbelt, MD, USA, 1999; JPL D11400.
- Mei, L.; Rozanov, V.; Vountas, M.; Burrows, J.P.; Levy, R.C.; Lotz, W. Retrieval of aerosol optical properties using MERIS observations: Algorithm and some first results. Remote Sens. Environ. 2017, 197, 125–140. [Google Scholar] [CrossRef] [PubMed]
- Jackson, J.M.; Liu, H.; Laszlo, I.; Kondragunta, S.; Remer, L.A.; Huang, J.; Huang, H.C. Suomi-NPP VIIRS aerosol algorithms and data products. J. Geophys. Res. Atmos. 2013, 118. [Google Scholar] [CrossRef]
- Kikuchi, M.; Murakami, H.; Suzuki, K.; Nagao, T.M.; Higurashi, A. improved hourly estimates of aerosol optical thickness using spatiotemporal variability derived from Himawari-8 geostationary satellite. IEEE Trans. Geosci. Remote Sens. 2018, 56, 3442–3455. [Google Scholar] [CrossRef]
- Gupta, P.; Remer, L.A.; Levy, R.C.; Mattoo, S. Validation of MODIS 3 km land aerosol optical depth from NASA’s EOS Terra and Aqua missions. Atmos. Meas. Tech. 2018, 11, 3145. [Google Scholar] [CrossRef]
- Lyapustin, A.; Wang, Y.; Korkin, S.; Huang, D. MODIS Collection 6 MAIAC algorithm. Atmos. Meas. Tech. 2018, 11, 5741–5765. [Google Scholar] [CrossRef]
- Chudnovsky, A.A.; Kostinski, A.; Lyapustin, A.; Koutrakis, P. Spatial scales of pollution from variable resolution satellite imaging. Environ. Pollut. 2013, 172, 131–138. [Google Scholar] [CrossRef]
- Zhang, Y.L.; Cao, F. Fine particulate matter (PM2.5) in China at a city level. Sci. Rep. 2015, 5, 14884. [Google Scholar] [CrossRef] [PubMed]
- He, J.; Wu, L.; Mao, H.; Liu, H.; Jing, B.; Yu, Y.; Ren, P.; Feng, C.; Liu, X. Development of a vehicle emission inventory with high temporal–spatial resolution based on NRT traffic data and its impact on air pollution in Beijing—Part 2: Impact of vehicle emission on urban air quality. Atmos. Chem. Phys. 2016, 16, 3171–3184. [Google Scholar] [CrossRef]
- Sun, L.; Wei, J.; Bilal, M.; Tian, X.; Jia, C.; Guo, Y.; Mi, X. Aerosol optical depth retrieval over bright areas using Landsat 8 OLI images. Remote Sens. 2016, 8, 23. [Google Scholar] [CrossRef]
- Doxani, G.; Vermote, E.; Roger, J.C.; Gascon, F.; Adriaensen, S.; Frantz, D.; Hagolle, O.; Hollstein, A.; Kirches, G.; Li, F.; et al. Atmospheric correction inter-comparison exercise. Remote Sens. 2018, 10, 352. [Google Scholar] [CrossRef]
- Holben, B.N.; Eck, T.F.; Slutsker, I.; Tanre, D.; Buis, J.P.; Setzer, A.; Vermote, E.; Reagan, J.A.; Kaufman, Y.J.; Nakajima, T.; et al. AERONET—A federated instrument network and data archive for aerosol characterization. Remote Sens. Environ. 1998, 66, 1–16. [Google Scholar] [CrossRef]
- Dubovik, O.; Holben, B.; Eck, T.F.; Smirnov, A.; Kaufman, Y.J.; King, M.D.; Tanré, D.; Slutsker, I. Variability of absorption and optical properties of key aerosol types observed in worldwide locations. J. Atmos. Sci. 2002, 59, 590–608. [Google Scholar] [CrossRef]
- Giles, D.M.; Sinyuk, A.; Sorokin, M.; Schafer, J.S.; Smirnov, A.; Slutsker, I.; Eck, T.F.; Holben, B.N.; Lewis, J.; Campbell, J.; et al. Advancements in the Aerosol Robotic Network AERONET) Version 3 Database—Automatic Quality Assurance of Sun Photometer Aerosol Optical Depth. Atmos. Meas. Tech. 2018. in preparation. [Google Scholar] [CrossRef]
- Roy, D.P.; Wulder, M.A.; Loveland, T.R.; Woodcock, C.E.; Allen, R.G.; Anderson, M.C.; Helder, D.; Irons, J.R.; Johnson, D.M.; Kennedy, R.; et al. Landsat-8: Science and product vision for terrestrial global change research. Remote Sens. Environ. 2014, 145, 154–172. [Google Scholar] [CrossRef] [Green Version]
- Loveland, T.R.; Irons, J.R. Landsat 8: The plans, the reality, and the legacy. Remote Sens. Environ. 2016, 185, 1–6. [Google Scholar] [CrossRef]
- Dwyer, J.L.; Roy, D.P.; Sauer, B.; Jenkerson, C.B.; Zhang, H.K.; Lymburner, L. Analysis Ready Data: Enabling analysis of the Landsat archive. Remote Sens. 2018, 10, 1363. [Google Scholar]
- Storey, J.; Choate, M.; Lee, K. Landsat 8 Operational Land Imager on-orbit geometric calibration and performance. Remote Sens. 2014, 6, 11127–11152. [Google Scholar] [CrossRef]
- Drusch, M.; Del Bello, U.; Carlier, S.; Colin, O.; Fernandez, V.; Gascon, F.; Hoersch, B.; Isola, C.; Laberinti, P.; Martimort, P.; et al. Sentinel-2: ESA’s optical high-resolution mission for GMES operational services. Remote Sens. Environ. 2012, 120, 25–36. [Google Scholar] [CrossRef]
- Roy, D.P.; Li, J.; Zhang, H.K.; Yan, L. Best practices for the reprojection and resampling of Sentinel-2 Multi Spectral Instrument Level 1C data. Remote Sens. Lett. 2016, 7, 1023–1032. [Google Scholar] [CrossRef] [Green Version]
- Yan, L.; Roy, D.P.; Li, Z.; Zhang, H.K.; Huang, H. Sentinel-2A multi-temporal misregistration characterization and an orbit-based sub-pixel registration methodology. Remote Sens. Environ. 2018, 215, 495–506. [Google Scholar] [CrossRef]
- Gascon, F.; Bouzinac, C.; Thépaut, O.; Jung, M.; Francesconi, B.; Louis, J.; Lonjou, V.; Lafrance, B.; Massera, S.; Gaudel-Vacaresse, A.; et al. Copernicus Sentinel-2A calibration and products validation status. Remote Sens. 2017, 9, 584. [Google Scholar] [CrossRef]
- Vermote, E.F.; El Saleous, N.Z.; Justice, C.O. Atmospheric correction of MODIS data in the visible to middle infrared: First results. Remote Sens. Environ. 2002, 83, 97–111. [Google Scholar] [CrossRef]
- Roy, D.P.; Qin, Y.; Kovalskyy, V.; Vermote, E.F.; Ju, J.; Egorov, A.; Hansen, M.C.; Kommareddy, I.; Yan, L. Conterminous United States demonstration and characterization of MODIS-based Landsat ETM+ atmospheric correction. Remote Sens. Environ. 2014, 140, 433–449. [Google Scholar] [CrossRef] [Green Version]
- Kaufman, Y.J.; Tanré, D.; Remer, L.A.; Vermote, E.F.; Chu, A.; Holben, B.N. Operational remote sensing of tropospheric aerosol over land from EOS moderate resolution imaging spectroradiometer. J. Geophys. Res. Atmos. 1997, 102, 17051–17067. [Google Scholar] [CrossRef] [Green Version]
- Vermote, E.; Justice, C.; Claverie, M.; Franch, B. Preliminary analysis of the performance of the Landsat 8/OLI land surface reflectance product. Remote Sens. Environ. 2016, 185, 46–56. [Google Scholar] [CrossRef]
- Claverie, M.; Ju, J.; Masek, J.G.; Dungan, J.L.; Vermote, E.F.; Roger, J.C.; Skakun, S.V.; Justice, C. The Harmonized Landsat and Sentinel-2 surface reflectance data set. Remote Sens. Environ. 2018, 219, 145–161. [Google Scholar] [CrossRef]
- Zhang, H.K.; Roy, D.P.; Yan, L.; Li, Z.; Huang, H.; Vermote, E.; Skakun, S.; Roger, J.C. Characterization of Sentinel-2A and Landsat-8 top of atmosphere, surface, and nadir BRDF adjusted reflectance and NDVI differences. Remote Sens. Environ. 2018, 215, 482–494. [Google Scholar] [CrossRef]
- Kotchenova, S.Y.; Vermote, E.F. Validation of a vector version of the 6S radiative transfer code for atmospheric correction of satellite data. Part II. Homogeneous Lambertian and anisotropic surfaces. Appl. Opt. 2007, 46, 4455–4464. [Google Scholar] [CrossRef] [PubMed]
- King, M.D.; Kaufman, Y.J.; Tanré, D.; Nakajima, T. Remote sensing of tropospheric aerosols from space: Past, present, and future. Bull. Am. Meteorol. Soc. 1999, 80, 2229–2260. [Google Scholar] [CrossRef]
- Schuster, G.L.; Dubovik, O.; Holben, B.N. Angstrom exponent and bimodal aerosol size distributions. J. Geophys. Res. Atmos. 2006, 111. [Google Scholar] [CrossRef] [Green Version]
- Levy, R.C.; Remer, L.A.; Kleidman, R.G.; Mattoo, S.; Ichoku, C.; Kahn, R.; Eck, T.F. Global evaluation of the Collection 5 MODIS dark-target aerosol products over land. Atmos. Chem. Phys. 2010, 10, 10399–10420. [Google Scholar] [CrossRef] [Green Version]
- Sayer, A.M.; Hsu, N.C.; Bettenhausen, C.; Jeong, M.J. Validation and uncertainty estimates for MODIS Collection 6 “Deep Blue” aerosol data. J. Geophys. Res. Atmos. 2013, 118, 7864–7872. [Google Scholar] [CrossRef] [Green Version]
- Guo, H.; Xu, M.; Hu, Q. Changes in near-surface wind speed in China: 1969–2005. Int. J. Climatol. 2011, 31, 349–358. [Google Scholar] [CrossRef]
- Kaufman, Y.J.; Remer, L.A.; Tanré, D.; Li, R.R.; Kleidman, R.; Mattoo, S.; Levy, R.C.; Eck, T.F.; Holben, B.N.; Ichoku, C.; et al. A critical examination of the residual cloud contamination and diurnal sampling effects on MODIS estimates of aerosol over ocean. IEEE Trans. Geosci. Remote Sens. 2005, 43, 2886–2897. [Google Scholar] [CrossRef]
- Zhao, T.X.P.; Chan, P.K.; Heidinger, A.K. A global survey of the effect of cloud contamination on the aerosol optical thickness and its long-term trend derived from operational AVHRR satellite observations. J. Geophys. Res. Atmos. 2013, 118, 2849–2857. [Google Scholar] [CrossRef] [Green Version]
- Smirnov, A.; Holben, B.N.; Eck, T.F.; Dubovik, O.; Slutsker, I. Cloud-screening and quality control algorithms for the AERONET database. Remote Sens. Environ. 2000, 73, 337–349. [Google Scholar] [CrossRef]
- Chen, W.; Tang, H.; Zhao, H. Diurnal, weekly and monthly spatial variations of air pollutants and air quality of Beijing. Atmos. Environ. 2015, 119, 21–34. [Google Scholar] [CrossRef]
- Wang, Y.Q.; Zhang, X.Y.; Sun, J.Y.; Zhang, X.C.; Che, H.Z.; Li, Y. Spatial and temporal variations of the concentrations of PM10, PM2.5 and PM1 in China. Atmos. Chem. Phys. 2015, 15, 13585–13598. [Google Scholar] [CrossRef]
- Ichoku, C.; Chu, D.A.; Mattoo, S.; Kaufman, Y.J.; Remer, L.A.; Tanré, D.; Slutsker, I.; Holben, B.N. A spatio-temporal approach for global validation and analysis of MODIS aerosol products. Geophys. Res. Lett. 2002, 29, MOD1-1. [Google Scholar] [CrossRef]
- Chu, D.A.; Kaufman, Y.J.; Ichoku, C.; Remer, L.A.; Tanré, D.; Holben, B.N. Validation of MODIS aerosol optical depth retrieval over land. Geophys. Res. Lett. 2002, 29, MOD2-1. [Google Scholar] [CrossRef]
- Lyapustin, A.; Wang, Y.; Laszlo, I.; Kahn, R.; Korkin, S.; Remer, L.; Levy, R.; Reid, J.S. Multiangle implementation of atmospheric correction (MAIAC): 2. Aerosol algorithm. J. Geophys. Res. Atmos. 2011, 116. [Google Scholar] [CrossRef]
- Nichol, J.E.; Bilal, M. Validation of MODIS 3 km resolution aerosol optical depth retrievals over Asia. Remote Sens. 2016, 8, 328. [Google Scholar] [CrossRef]
- Xie, Y.; Zhang, Y.; Xiong, X.; Qu, J.J.; Che, H. Validation of MODIS aerosol optical depth product over China using CARSNET measurements. Atmos. Environ. 2011, 45, 5970–5978. [Google Scholar] [CrossRef]
- Cohen, W.B.; Maiersperger, T.K.; Gower, S.T.; Turner, D.P. An improved strategy for regression of biophysical variables and Landsat ETM+ data. Remote Sens. Environ. 2003, 84, 561–571. [Google Scholar] [CrossRef] [Green Version]
- Smith, R.J. Use and misuse of the reduced major axis for line-fitting. Am. J. Phys. Anthropol. 2009, 140, 476–486. [Google Scholar] [CrossRef]
- Li, Z.; Zhao, X.; Kahn, R.; Mishchenko, M.; Remer, L.; Lee, K.H.; Wang, M.; Laszlo, I.; Nakajima, T.; Maring, H. Uncertainties in satellite remote sensing of aerosols and impact on monitoring its long-term trend: A review and perspective. Ann. Geophys. 2009, 27, 2755–2770. [Google Scholar] [CrossRef]
- Li, C.; Lau, A.; Mao, J.; Chu, D. Retrieval, validation, and application of the 1-km aerosol optical depth from MODIS measurements over Hong Kong. IEEE Trans. Geosci. Remote Sens. 2005, 43, 2650–2658. [Google Scholar]
- Hu, X.; Waller, L.A.; Lyapustin, A.; Wang, Y.; Al-Hamdan, M.Z.; Crosson, W.L.; Estes, M.G., Jr.; Estes, S.M.; Quattrochi, D.A.; Puttaswamy, S.J.; Liu, Y. Estimating ground-level PM2.5 concentrations in the Southeastern United States using MAIAC AOD retrievals and a two-stage model. Remote Sens. Environ. 2014, 140, 220–232. [Google Scholar] [CrossRef]
- Li, J.; Roy, D.P. A global analysis of Sentinel-2A, Sentinel-2B and Landsat-8 data revisit intervals and implications for terrestrial monitoring. Remote Sens. 2017, 9, 902. [Google Scholar]


| AERONET Site (Latitude, Longitude) | Number of Days in 2016 with AERONET Level 1.5 (Level 2.0) Data | Landsat-8 Path/Row | Number of Landsat-8 Images over the AERONET Site in 2016 | Sentinel-2A Tile ID | Number of Sentinel-2A Images over the AERONET Site in 2016 |
|---|---|---|---|---|---|
| AOE_Baotou (40.852°N, 109.629°E) | 173 (0) | 127/32 128/31 128/32 | 66 | 49TCF | 56 |
| Beijing (39.977°N, 116.381°E) | 243 (243) | 123/32 | 22 | 50TMK | 59 |
| Beijing-CAMS (39.933°N, 116.317°E) | 299 (299) | 123/32 | 22 | 50TMK | 59 |
| Beijing_PKU (39.992°N, 116.310°E) | 147 (0) | 123/32 | 22 | 50TMK | 59 |
| Beijing_RADI (40.005°N, 116.379°E) | 224 (0) | 123/32 | 22 | 50TMK | 59 |
| Hong_Kong_PolyU (22.303°N, 114.180°E) | 53 (53) | 121/45 122/45 122/44 | 45 | 50QKK 49QHE | 122 |
| Hong_Kong_Sheung (22.483°N, 114.117°E) | 52 (52) | 121/45 122/45 122/44 | 49 | 50QKK 49QHE | 122 |
| QOMS_CAS (28.365°N, 86.948°E) | 198 (198) | 140/40 140/41 | 35 | 45RVM | 21 |
| SONET_Harbin (45.705°N, 126.614°E) | 33 (0) | 117/28 117/29 118/28 | 46 | 52TCR 51TYL | 54 |
| SONET_Hefei (31.905°N, 117.162°E) | 23 (0) | 121/38 | 17 | 50SNA | 29 |
| SONET_Nanjing (32.115°N, 118.957°E) | 11 (0) | 120/38 | 17 | 50SPA | 33 |
| SONET_Shanghai (31.284°N, 121.481°E) | 16 (0) | 118/38 | 17 | 51RUQ | 62 |
| SONET_Xingtai (37.182°N, 114.360°E) | 22 (0) | 124/34 | 20 | 50SKG 49SGB | 74 |
| SONET_Zhoushan (29.994°N, 122.188°E) | 13 (0) | 118/39 117/39 | 26 | 51RVP | 23 |
| Taihu (31.421°N, 120.215°E) | 153 (129) | 119/38 | 14 | 51RTQ 50RQV | 77 |
| XiangHe (39.754°N, 116.962°E) | 289 (289) | 123/32 122/32 122/33 | 60 | 50TMK | 59 |
| XuZhou-CUMT (34.217°N, 117.142°E) | 258 (0) | 121/36 121/37 122/36 | 51 | 50SNC | 29 |
| Alishan (23.508°N, 120.813°E) | 14 (14) | 117/44 118/43 118/44 | 58 | 51QTG 50QRM | 38 |
| Bamboo (25.187°N, 121.535°E) | 11 (11) | 117/42 117/43 | 27 | 51RUH | 14 |
| Cape_Fuguei_Station (25.297°N, 121.538°E) | 16 (0) | 117/42 117/43 | 27 | 51RUJ 51RUH | 28 |
| Chen-Kung_Univ (23.000°N, 120.217°E) | 137 (80) | 118/44 | 20 | 51QTF 50QRL | 26 |
| Chiayi (23.496°N, 120.496°E) | 144 (144) | 118/44 117/44 118/43 | 39 | 51QTG 50QRM | 38 |
| Douliu (23.712°N, 120.545°E) | 19 (19) | 117/44 118/43 118/44 | 58 | 51QTG 50QRM | 38 |
| EPA-NCU (24.968°N, 121.185°E) | 201 (201) | 117/43 118/42 118/43 | 47 | 51RUH | 14 |
| Lulin (23.469°N, 120.874°E) | 190 (190) | 117/44 | 19 | 51QTG 51QTF 50QRM | 51 |
| Taipei_CWB (25.030°N, 121.500°E) | 188 (188) | 117/43 | 16 | 51RUH | 14 |
| AERONET Site (Latitude, Longitude) | Number of Days in 2016 with AERONET Level 1.5 (Level 2.0) Data | Number of Contemporaneous Landsat-8 and AERONET Level 1.5 (Level 2.0) AOD Data Pairs | Number of Contemporaneous Sentinel-2A and AERONET Level 1.5 (Level 2.0) AOD Data Pairs |
|---|---|---|---|
| AOE_Baotou (40.852°N, 109.629°E) | 173 (0) | 13 (0) | 9 (0) |
| Beijing (39.977°N, 116.381°E) | 243 (243) | 11 (11) | 22 (22) |
| Beijing-CAMS (39.933°N, 116.317°E) | 299 (299) | 12 (12) | 29 (29) |
| Beijing_PKU (39.992°N, 116.310°E) | 147 (0) | 3 (0) | 11 (0) |
| Beijing_RADI (40.005°N, 116.379°E) | 224 (0) | 4 (0) | 3 (0) |
| Hong_Kong_PolyU (22.303°N, 114.180°E) | 53 (53) | 0 (0) | 1 (1) |
| Hong_Kong_Sheung (22.483°N, 114.117°E) | 52 (52) | 3 (3) | 0 (0) |
| QOMS_CAS (28.365°N, 86.948°E) | 198 (198) | 2 (2) | 0 (0) |
| SONET_Harbin (45.705°N, 126.614°E) | 33 (0) | 2 (0) | 0 (0) |
| SONET_Hefei (31.905°N, 117.162°E) | 23 (0) | 0 (0) | 0 (0) |
| SONET_Nanjing (32.115°N, 118.957°E) | 11 (0) | 0 (0) | 0 (0) |
| SONET_Shanghai (31.284°N, 121.481°E) | 16 (0) | 0 (0) | 1 (0) |
| SONET_Xingtai (37.182°N, 114.360°E) | 22 (0) | 0 (0) | 0 (0) |
| SONET_Zhoushan (29.994°N, 122.188°E) | 13 (0) | 2 (0) | 0 (0) |
| Taihu (31.421°N, 120.215°E) | 153 (129) | 2 (2) | 5 (5) |
| XiangHe (39.754°N, 116.962°E) | 289 (289) | 18 (18) | 23 (23) |
| XuZhou-CUMT (34.217°N, 117.142°E) | 258 (0) | 15 (0) | 4 (0) |
| Alishan (23.508°N, 120.813°E) | 14 (14) | 0 (0) | 0 (0) |
| Bamboo (25.187°N, 121.535°E) | 11 (11) | 0 (0) | 0 (0) |
| Cape_Fuguei_Station (25.297°N, 121.538°E) | 16 (0) | 0 (0) | 0 (0) |
| Chen-Kung_Univ (23.000°N, 120.217°E) | 137 (80) | 2 (2) | 1 (0) |
| Chiayi (23.496°N, 120.496°E) | 144 (144) | 5 (5) | 2 (2) |
| Douliu (23.712°N, 120.545°E) | 19 (19) | 0 (0) | 1 (1) |
| EPA-NCU (24.968°N, 121.185°E) | 201 (201) | 3 (3) | 2 (2) |
| Lulin (23.469°N, 120.874°E) | 190 (190) | 4 (4) | 0 (0) |
| Taipei_CWB (25.030°N, 121.500°E) | 188 (188) | 5 (5) | 4 (4) |
© 2019 by the authors. Licensee MDPI, Basel, Switzerland. This article is an open access article distributed under the terms and conditions of the Creative Commons Attribution (CC BY) license (http://creativecommons.org/licenses/by/4.0/).
Share and Cite
Li, Z.; Roy, D.P.; Zhang, H.K.; Vermote, E.F.; Huang, H. Evaluation of Landsat-8 and Sentinel-2A Aerosol Optical Depth Retrievals across Chinese Cities and Implications for Medium Spatial Resolution Urban Aerosol Monitoring. Remote Sens. 2019, 11, 122. https://doi.org/10.3390/rs11020122
Li Z, Roy DP, Zhang HK, Vermote EF, Huang H. Evaluation of Landsat-8 and Sentinel-2A Aerosol Optical Depth Retrievals across Chinese Cities and Implications for Medium Spatial Resolution Urban Aerosol Monitoring. Remote Sensing. 2019; 11(2):122. https://doi.org/10.3390/rs11020122
Chicago/Turabian StyleLi, Zhongbin, David P. Roy, Hankui K. Zhang, Eric F. Vermote, and Haiyan Huang. 2019. "Evaluation of Landsat-8 and Sentinel-2A Aerosol Optical Depth Retrievals across Chinese Cities and Implications for Medium Spatial Resolution Urban Aerosol Monitoring" Remote Sensing 11, no. 2: 122. https://doi.org/10.3390/rs11020122