Improvement of EPIC/DSCOVR Image Registration by Means of Automatic Coastline Detection


Remote Sensing Technology Institute, German Aerospace Center (DLR), 82234 Oberpfaffenhofen, Germany
*
Author to whom correspondence should be addressed.
Remote Sens. 2019, 11(15), 1747; https://doi.org/10.3390/rs11151747
Submission received: 27 May 2019
/
Revised: 19 July 2019
/
Accepted: 23 July 2019
/
Published: 25 July 2019
(This article belongs to the Special Issue Pattern Recognition and Image Processing for Remote Sensing)
Abstract
:In this work, we address the image geolocation issue that is present in the imagery of EPIC/DSCOVR (Earth Polychromatic Imaging Camera/Deep Space Climate Observatory) Level 1B version 2. To solve it, we develop an algorithm that automatically computes a registration correction consisting of a motion (translation plus rotation) and a radial distortion. The correction parameters are retrieved for every image by means of a regularised non-linear optimisation process, in which the spatial distances between the theoretical and actual locations of chosen features are minimised. The actual features are found along the coastlines automatically by using computer vision techniques. The retrieved correction parameters show a behaviour that is related to the period of DSCOVR orbiting around the Lagrangian point L. With this procedure, the EPIC coastlines are collocated with an accuracy of about pixels, thus significantly improving the original registration of about 5 pixels from the imagery of EPIC/DSCOVR Level 1B version 2.

1. Introduction
The spacecraft DSCOVR (Deep Space Climate Observatory) provides a unique view of the Earth from its Lissajous orbit around the Earth–Sun Lagrangian point L, at a distance of 1.5 million kilometres from the Earth. DSCOVR carries a range of sensors on board, including EPIC (Earth Polychromatic Imaging Camera) for climate science applications [1].
EPIC consists of a CCD (Charge-Coupled Device) camera that monitors the sunlit half of the Earth in 10 spectral channels ranging in the ultraviolet, visible and near infrared—approximately from 317 to 780 nm. Every two hours, EPIC measures its 10 channel images with a shape of detector pixels, and a varying ground pixel size of approximately km at the center of the images. These available channels make EPIC a suitable candidate for several applications, such as monitoring the vegetation condition [2], the synoptic ozone [3], the sulphur dioxide content from volcanic eruptions [4,5], the aerosol layer height and optical depth [6,7], and different cloud properties [8]. Extensive work has been performed to estimate the cloud information content in the EPIC oxygen bands [9,10], as well as its sensitivity to liquid-phase cloud microphysical parameters [11].
Standard techniques for retrieval of atmospheric properties, such as the layer height and the optical depth of clouds and aerosols, are non-linear least squares fitting [12] and Tikhonov regularisation [13], which match the results of forward simulations (i.e., synthetic spectra) with the actual measurements (i.e., real spectra). The forward simulations are performed on the base of radiative transfer models. Due to the particular viewing geometry of EPIC, with scattering angles ranging between 168 and 176 degrees, the radiative transfer modelling faces challenges in terms of computational efficiency and accuracy [14,15], which can be solved by using various acceleration techniques [16,17,18]. Furthermore, this approach needs to assume that the surface properties required as input for the radiative transfer model, e.g., the surface altitude and the spectral surface albedo, are already known from external sources. The assignment of surface altitude and surface albedos must be performed for every image pixel based on their corresponding latitude and longitude values allocated in the EPIC Level 1B (L1B) arrays of Earth coordinates, which are provided together with the measurement arrays.
Since the evaluation of these surface properties for each image pixel is based on its geolocation information, any incorrect registration of the images can lead into an invalid assignment of these surface properties and, thus, an erroneous retrieval of the atmospheric properties. In the case of EPIC, the geolocation arrays, including the latitude and longitude locations as well as the Sun and instrument viewing angles, are computed by means of a complete navigation algorithm. Essentially, it determines the spacecraft location and orientation and maps the 3D-model coordinates into the 2D image coordinates [19]. This mapping includes an optical correction modelled as a small barrel distortion. Although this navigation algorithm provides a good first estimate for the image geolocation, the imagery from EPIC L1B version 2 presents a misregistration that is especially noticeable when inspecting the expected and actual locations of the land bodies (Figure 1). A similar problem was already mentioned and briefly described for the previous release L1B version 1 [20].
In this article, we develop an automatic registration algorithm for EPIC that relies on the expected location of the Earth land bodies. Assuming that the geolocation error is smaller than 10 detector pixels, we state that it is enough to apply a transformation on the measurement pixel indices, consisting of a motion (translation plus rotation of the Earth’s disk) together with a small optical correction, in order to improve the registration of the EPIC imagery. The optimal transformation parameters must be computed for every EPIC L1B dataset with the help of reference pixels taken from the expected and actual locations of the land bodies, which can be determined by using conventional pattern recognition techniques that are of common use in computer vision.
2. Methodology
In this section, we present a mathematical model that describes the misregistration of the EPIC L1B images, and we also describe the procedure to estimate the optimal transformation parameters that improve their registration quality. The original EPIC L1B images are accessible through NASA Earth Data portal [21]. In the following, we use the word image to refer to false-RGB images containing the reflectance values from the EPIC channels of 779.5, 551.0 and 443.0 nm, with the northern polar region of the Earth’s disk located at the top of the image (as the example shown in Figure 1). The original counts per second measured by EPIC can be converted into reflectance by using the calibration factors estimated by Geogdzhayev and Marshak [22] and dividing then by the solar zenith-directional cosine. Although the transformation parameters were obtained for these false-RGB images, they can be used for all the EPIC L1B channels.
2.1. Mathematical Description
Given an original image pixel located at indices (hereinafter the superscript stands for “transpose”) which is not aligned with the proper pixels from the arrays of Earth coordinates, we model its transformation into a registered pixel at indices by the following expression:
where is the shift vector, is the rotation angle around the center of rotation , and are the pixel indices after radial distortion correction by means of the single-parameter Fitzgibbon division model [23,24]:
where is the first radial distortion coefficient, is the center of distortion and r is the distance from the distorted point to the center of distortion:
The alignment transformation (Equation (1)) depends on eight different parameters which are unknown and need to be estimated. Before proceeding further, and based on empirical observations, we need to apply two restrictions in order to reduce the complexity of the problem:
- The center of distortion and the center of rotation are assumed identical, i.e., and .
- The center of distortion/rotation is assumed to be known and located at the center of the image.
Under these assumptions, the transformation (Equation (1)) from to can be simplified into:
which depends on four parameters (i.e., , , , and ), as the point is fixed now. To compute the optimal transformation parameters, we adapt Equation (4) for known pairs of distorted and registered points , i.e.,
rewritten in compact form as
where denotes the transformation of the distorted data vector into the registered data vector by means of a known center of distortion/rotation and an unknown state vector . The state vector that optimally transforms into can be computed by least squares minimisation of the Tikhonov function defined as
where is the regularisation parameter, is the regularisation matrix, and is the a priori state vector. The procedure to minimise is iterative; starting from an initial guess , the kth iteration consists of four steps [25]:
- Compute the vector at iteration k aswhere denotes the Jacobian matrix of with respect to the state vector at iteration k:
- Compute the regularised generalised inverse at iteration k by means of generalised singular value decomposition:
- Compute the state vector for the next iteration :
- Check the convergence criteria. If any is passed, set and exit; otherwise, go to Step 1 for iteration . We use the following convergence criteria:
- X-convergence criterion: , where is a predefined tolerance value.
- S-convergence criterion: , where is a predefined tolerance value and is the squared residual sum at iteration k.
Our fitting problem is much more sensitive to the parameters , i.e., small perturbations in these parameters cause large transformations, especially for points far from the center of distortion/rotation . For this reason, the computation of the optimal state vector is performed in two steps:
- Define an a priori state vector with no shift, and compute the optimal state vector by applying Tikhonov least squares minimisation with and as fixed parameters.
- Use from the previous step as the new a priori state vector , and compute the optimal state vector by applying Tikhonov least squares minimisation with no fixed parameters.
The configuration for the second-step Tikhonov least squares minimisation is summarised as follows:
- The analysis of the Jacobian matrices at the first iteration by means of the generalised singular value decomposition shows that is an appropriate value for the regularisation parameter.
- The regularisation matrix is defined as a diagonal matrix,where, for every parameter, we denote by its expected dispersion, and we denote by a weighting factor that determines its freedom in the retrieval, so that implies total freedom and fixes the parameter to the a priori solution [25]. Based on the expected dispersions of the state vector components, which are set asthe optimal weights have to be found empirically by performing a set of retrievals with synthetic data, ensuring that the state vector components stay within the valid ranges around the a priori solution. For our case, the following optimal values are found:thereby implying total freedom for and reduced freedom for .
- The first a priori state vector is set with the following initial guesses for the rotation angle and the radial distortion parameter:
The workflow for the complete non-linear optimisation process is summarised in Figure 2a.
2.2. Detection of Matching Coastline Features
The registration of an image by means of the model described in Section 2.1 assumes that the data vectors and are known. In our case, they can be built with a sufficient number of pairs of incorrect points and correct points within the image. The coastline that is visible in this kind of images is a source of these points of interest, as the correct coastline can be determined with the arrays of Earth coordinates, which are available. With this consideration, we compute the required pairs of incorrect and correct points as follows (see Figure 2b):
- Create a mask with the theoretical coastline, i.e., that inferred from the arrays of Earth coordinates.
- Create a mask with the radiometric coastline, i.e., that inferred from the actual image.
- Find pairs of common features from both coastline masks by using computer vision techniques.
2.2.1. Computation of the Theoretical Coastline
The computation of the theoretical coastline, i.e., the coastline that is assumed to be correct, can be divided into three steps:
- Create the theoretical land mask by checking for every image pixel if its (latitude, longitude) pair is contained inside a land polygon from the low-resolution GSHHG (Global Self-consistent, Hierarchical, High-resolution Geography database) [26].
- Apply one morphological binary erosion to the theoretical land mask with a flat diamond shaped structuring element of dimensions [27].
- Compute the theoretical coastline mask as the result of the bitwise operator XOR on the original and eroded theoretical land masks.
2.2.2. Computation of the Radiometric Coastline
The computation of the radiometric coastline, i.e., the coastline that is visible in the image, is a common edge detection problem in image analysis, and can be performed as follows:
- Convert the image channel with the highest contrast between land and water into 8-bit form (i.e., the false-red channel, which corresponds to the 779.5 nm EPIC channel).
- Compute the median value v from the Earth pixels of this 8-bit image.
- Compute the radiometric coastline mask by applying the Canny edge detection algorithm [28] on the previous 8-bit image with hysteresis thresholding parameters given bywhere is an argument that controls the separation between both thresholds [29] and its value is found empirically: if is small, only the strong borders are preserved; if is big, both strong and weak borders are kept. For our purpose, we found that is a good compromise.
With this procedure, the radiometric coastline will be polluted in general with other edges also present in the image, e.g., cloud edges (see Figure 3). However, they do not need to be filtered as long as the detected matching features are restricted to the neighbourhood of the theoretical coastline.
2.2.3. Matching of Coastline Features
Once the theoretical and radiometric coastline masks are computed, it is possible to find features that are common to both masks, as long as the misalignment and distortion of the radiometric coastline is not severe. Such image matching problem is one of the fundamental research topics in computer vision [30]; the procedure to find common features between two images consists of three steps:
- Detect keypoints (e.g., edges, corners, and regions of interest) in the compared images.
- Describe every keypoint by a descriptor vector with information from its neighbourhood.
- Match keypoint pairs based on the similarity of their descriptor vectors.
Examples of successful detectors and descriptors are SIFT (Scale-Invariant Feature Transform) [31], SURF (Speeded-Up Robust Features) [32] and ORB (Oriented FAST and Rotated BRIEF) [33]. OpenCV [34] already provides a complete interface to these algorithms. For our purpose, we use ORB because it is not patented, its time performance is better, and the amount of detected keypoints is enough. ORB consists of two routines:
- The ORB detector is a modified version of the keypoint detector FAST (Features from Accelerated Segment Test) [35]. In addition to the original FAST, it also computes the orientation angle of the detected keypoints.
- The ORB descriptor is a modified version of the descriptor BRIEF (Binary Robust Independent Elementary Features) [36]. The binary descriptor vector generated by the original BRIEF shows problems when identifying matching keypoints under rotation conditions; ORB fixes the issue taking into consideration the orientation computed by the ORB detector.
The keypoints detected and described with ORB for both the theoretical and radiometric coastline masks are matched by using a brute-force matcher with Hamming distance as measurement (see [37] for further details). Given a set of theoretical keypoints with descriptor vectors and a set of radiometric keypoints with descriptor vectors , the matching algorithm proceeds for every theoretical keypoint , , as follows:
- Compute the Hamming distance (i.e., the number of positions at which the corresponding values of arrays are different [38]) from to every radiometric keypoint , , aswhere is the length of the binary descriptor vectors, ⊕ is the XOR operator, and and denote the mth components of the descriptor vectors and , respectively.
- Select the radiometric keypoint with minimum Hamming distance to as the matching candidate for the theoretical keypoint , where
- For the given radiometric keypoint , compute its Hamming distance to every theoretical keypoint , , as
- The pair is a valid matching pair only if is the theoretical keypoint with minimum Hamming distance to , otherwise the pair is discarded, i.e., it is valid only if
The previous procedure ensures that all the valid pairs of matching keypoints hold the minimum Hamming distance criterion reciprocally. Note that this criterion, however, does not consider any spatial restriction, but only the similarity between the descriptor vectors. Due to the spatial constraints of our problem, the valid pairs need to be filtered based on two additional spatial criteria (Figure 4):
- The spatial distance between a theoretical keypoint and the theoretical coastline.
- The spatial distance between the keypoints of a matching pair .
If any of these spatial distances is greater than a threshold (e.g., 10 pixels), the pair is discarded. After the application of this filter, the remaining pairs are used to build the registered data vector with the theoretical keypoints and the distorted data vector with the radiometric keypoints. Alternatively, an approach based on RANSAC (RANdom SAmple Consensus) [39] could be added afterwards in the retrieval procedure to generate and . We do not use it in this article because the improvement in our registration problem was small and it increased the computation time in excess.
3. Results
We performed the estimation of the optimal transformation parameters for all the datasets from EPIC L1B version 2 within the time period from 13 June 2015 to 31 July 2018. The parameters were computed with an Intel(R) Core(TM) i7-3770 CPU @ 3.40 GHz processor using a single thread, and it required approximately 15 s of computation time for every image (i.e., roughly between 18 and 36 h for every year of datasets, assuming 12–24 available datasets per day). To assess the behaviour of the obtained results, we analysed the following aspects:
- The performance of the non-linearised fitting procedure in reducing the spatial distance between the image coordinates from matching theoretical and radiometric features.
- The global impact of this correction procedure on the image registration quality.
- The behaviour of the retrieved transformation parameters as a function of time.
In Figure 5, we show the result of computing the spatial distances between the points of every matching pair before and after applying the registration procedure described in the previous section. The histograms were calculated for all the matching pairs that were found in all the EPIC L1B images within the complete time period under study. In Figure 5a, we can observe a normal distribution of spatial distances spread within the interval of pixels, with a higher density of occurrences in the subinterval of pixels. We can find of the values in the range of pixels. The histogram is cut for values higher than 10 pixels due to the spatial constraints defined in Section 2.2.3. In Figure 5b, we see that the distribution of spatial distances is turned into a Gamma distribution whose mode is found in the bin of pixels, and where approximately of the values are located within the range of pixels. The distribution also shows a long decreasing tail on its right side, meaning that a small percentage of values are now greater than 5 pixels.
From these histograms, we conclude that the transformation significantly reduces the spatial distance between pairs of matching points. As long as these matching pairs are representative of the distortion that the original images suffer, this fact translates into an improvement in the registration of the images. The existence of the right tail in the histogram in Figure 5b also suggests that some matching pairs do not reduce its spatial distance after the transformation, or they might even increase it. Indeed, this means that there are matching pairs whose points do not correspond to the same feature, but they could still pass the quality filters applied in our procedure. As the amount of wrong matching pairs is not substantial, they do not significantly influence in the retrieval of the transformation parameters, and for every wrong matching pair the points are moved to their new positions determined by the optimal transformation parameters. The location of the histogram mode in Figure 5b is above one pixel due to the necessary discretisation of the coastline together with the actual ground pixel size. The theoretical coastlines were always computed as the last contour of land pixels for every land body based on the GSHHG database. The radiometric coastlines were obtained by finding intensity borders within the false-RGB images, which coincide in general with the actual land borders (see Figure 6), but in some cases they can be found one pixel inside land (because the land–ocean interface pixels are a mixture of land and ocean information) or one pixel outside land (due to water turbidity).
In Figure 7, we show the application of the registration procedure to four examples of EPIC L1B image regions. On the left side, we observe the original L1B images with the corresponding theoretical coastline shape vector superposed. On the right side, the image pixels are relocated by means of our registration model with the transformation parameters automatically retrieved for every image. It can be observed that there is an improvement in the collocation of the radiometric coastline and the theoretical coastline with respect to their original situation. Because the features were detected along the coastlines, the density of matching features is sensitive to the percentage of land that is visible on every image. As a consequence, the procedure may fail for those images in which the majority of the Earth’s disk corresponds to the Pacific Ocean due to the absence of matching features with enough quality. For these situations, we must rely on the retrieved parameters from other images that are close in time.
In Figure 8, we show the time evolution of the transformation parameters for the complete time period under study. The time series was computed for the daily mean values of each parameter. We observed that the horizontal shift has an oscillatory behaviour around its mean value of pixels, while the vertical shift also presents a periodic response around its mean value of pixels. The rotation angle and the distortion parameter present noisier time series, and their values remain closer to the mean values of deg and , respectively. Indeed, this means that these two parameters tend to stay close to their a priori solutions—an expected result based on the selection of the regularisation matrix . The negative sign of indicates that the original EPIC L1B images still suffer from a slight barrel distortion.
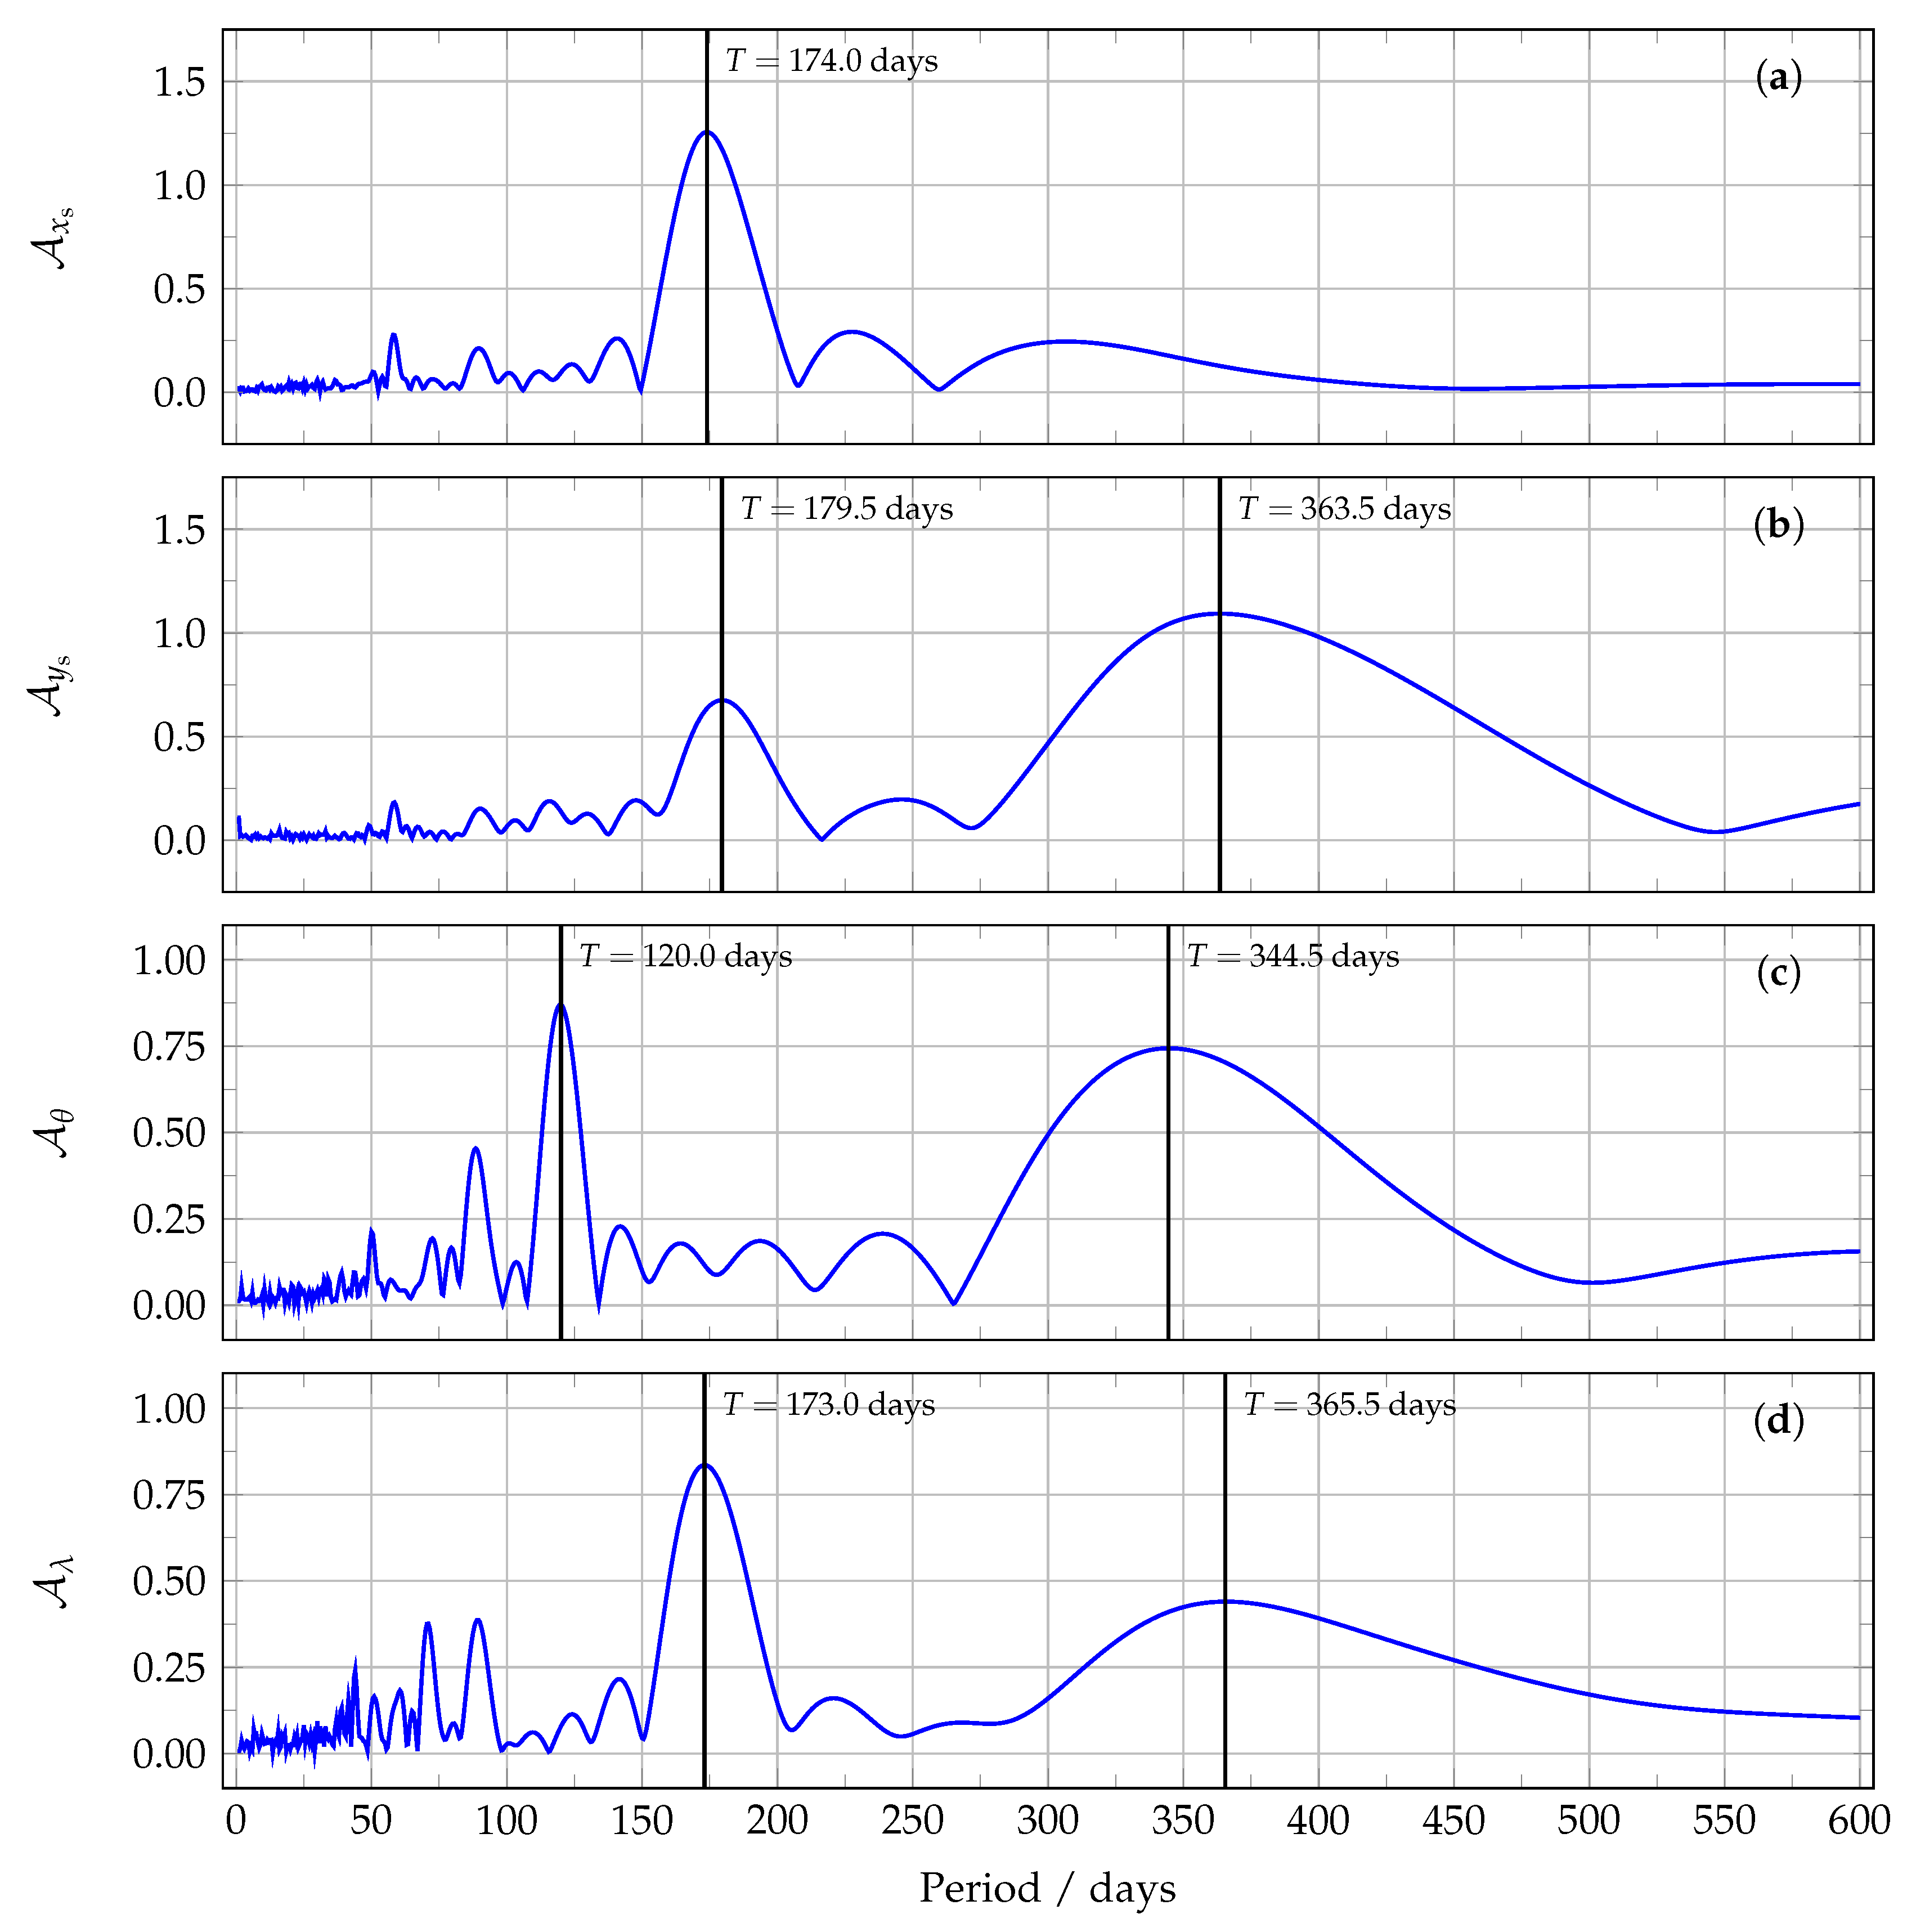
The time series in Figure 8 can be also interpreted as noisy signals with unevenly sampled data due to the days where there are not enough images to be processed. To estimate the dominant frequencies for every time series, we computed their periodograms by means of the Lomb–Scargle method [40,41,42]. Before this computation, the signals need to be adapted to have zero mean (subtracting their mean values) and standard deviation of unity (dividing by their standard deviations). In Figure 9, we show the resulting normalised periodogram amplitudes for every transformation parameter as a function of the time period. It can be noticed that three parameters (, , and ) share one common frequency whose period is located in the interval of days, and two parameters ( and ) share a second frequency whose period is located in the interval of days. The first period corresponds to the 180-day orbit period of DSCOVR’s spacecraft around the Lagrangian point L [43]. The rotation angle shows different dominant frequencies; however, we do not consider them relevant because the behaviour of its time series is indeed flat around a constant value.
4. Conclusions
In this study, we addressed the geolocation issue that is present in the imagery from EPIC L1B version 2, and to solve it we developed a fast automatic image registration scheme consisting of a motion plus a radial distortion correction. The optimal transformation parameters were computed through Tikhonov least squares minimisation, in which the reference pairs of distorted and registered pixel coordinates were determined automatically by matching features from the theoretical and radiometric coastlines.
We showed that the shift parameters present an oscillatory behaviour whose period is close to the period of DSCOVR’s Lissajous orbit, while the rotation angle and the distortion parameter were found to be more stable and close to the a priori solution that we provided. After the proposed registration, the spatial distances between the common features found in the theoretical and radiometric coastlines are concentrated around the interval of pixels, a considerable improvement compared to the interval of pixels from the original L1B images. Therefore, we conclude that this procedure enhances the registration of the images from EPIC L1B version 2 with their corresponding arrays of Earth coordinates. This enhancement will have a positive impact in climate science applications from EPIC measurements, as it will reduce the errors in the retrieval of atmospheric properties due to the inappropriate selection of the surface properties of every pixel. The algorithm developed in this work could be adapted for improving the registration of the future geostationary UVN (Ultraviolet-Visible-Near-infrared) sensors Sentinel-4, GEMS and TEMPO.
This study was based on the OpenCV library, which contains other matching algorithms apart from the brute-force matching of corresponding keypoints, including template matching (e.g., Chamfer matching [44]). In principle, it is interesting to compare their efficiencies for solving the registration problem considered in this article. In addition, the effect of using different robust estimators (e.g., RANSAC) can be analysed in more detail. These topics will be investigated in our future research.
Author Contributions
Conceptualisation, V.M.G.; methodology, V.M.G. and D.S.E.; software, V.M.G. and S.S.; visualisation, V.M.G. and S.S.; validation, V.M.G. and S.S. and D.S.E.; formal analysis, V.M.G., D.S.E. and D.L.; writing—original draft preparation, V.M.G. and S.S.; writing—review and editing, V.M.G., S.S., D.S.E. and D.L.; supervision, D.L.; and funding acquisition, D.L.
Funding
Acknowledgments
V.M.G. thanks Adrian Doicu for his support on questions related to regularised non-linear least squares minimisation processes.
Conflicts of Interest
The authors declare no conflict of interest. The funders had no role in the design of the study; in the collection, analyses, or interpretation of data; in the writing of the manuscript, or in the decision to publish the results.
Abbreviations
The following abbreviations are used in this manuscript:
| BRIEF | Binary Robust Independent Elementary Features |
| CCD | Charge-Coupled Device |
| DSCOVR | Deep Space Climate Observatory |
| EPIC | Earth Polychromatic Imaging Camera |
| FAST | Features from Accelerated Segment Test |
| GEMS | Geostationary Environment Monitoring Spectrometer |
| GSHHG | Global Self-consistent Hierarchical, High-resolution Geography database |
| L1B | Level 1B |
| MERIS | MEdium Resolution Imaging Spectrometer |
| NASA | National Aeronautics and Space Administration |
| ORB | Oriented FAST and Rotated BRIEF |
| RANSAC | RANdom SAmple Consensus |
| RGB | Red Green Blue |
| SIFT | Scale-Invariant Feature Transform |
| SURF | Speeded-Up Robust Features |
| TEMPO | Tropospheric Emissions: Monitoring of POllution |
| UVN | Ultraviolet-Visible-Near-infrared |
References
- Marshak, A.; Herman, J.; Szabo, A.; Blank, K.; Carn, S.; Cede, A.; Geogdzhayev, I.; Huang, D.; Huang, L.K.; Knyazikhin, Y.; et al. Earth Observations from DSCOVR EPIC Instrument. Bull. Am. Meteorol. Soc. 2018, 99, 1829–1850. [Google Scholar] [CrossRef] [PubMed]
- Marshak, A.; Knyazikhin, Y. The spectral invariant approximation within canopy radiative transfer to support the use of the EPIC/DSCOVR oxygen B-band for monitoring vegetation. J. Quant. Spectrosc. Radiat. Transf. 2017, 191, 7–12. [Google Scholar] [CrossRef] [PubMed] [Green Version]
- Herman, J.; Huang, L.; McPeters, R.; Ziemke, J.; Cede, A.; Blank, K. Synoptic ozone, cloud reflectivity, and erythemal irradiance from sunrise to sunset for the whole earth as viewed by the DSCOVR spacecraft from the earth–sun Lagrange 1 orbit. Atmos. Meas. Tech. 2018, 11, 177–194. [Google Scholar] [CrossRef]
- Carn, S.A.; Krotkov, N.A.; Fisher, B.L.; Li, C.; Prata, A.J. First observations of volcanic eruption clouds from the L1 Earth-Sun Lagrange point by DSCOVR/EPIC. Geophys. Res. Lett. 2018, 45, 11456–11464. [Google Scholar] [CrossRef]
- Efremenko, D.S.; Loyola, R.D.G.; Hedelt, P.; Spurr, R.J.D. Volcanic SO2 plume height retrieval from UV sensors using a full-physics inverse learning machine algorithm. Int. J. Remote Sens. 2017, 38, 1–27. [Google Scholar] [CrossRef]
- Xu, X.; Wang, J.; Wang, Y.; Zeng, J.; Torres, O.; Yang, Y.; Marshak, A.; Reid, J.; Miller, S. Passive remote sensing of altitude and optical depth of dust plumes using the oxygen A and B bands: First results from EPIC/DSCOVR at Lagrange-1 point. Geophys. Res. Lett. 2017, 44, 7544–7554. [Google Scholar] [CrossRef]
- Natraj, V.; Jiang, J.H.; Doicu, A.; Loyola, D.; Kopparla, P.; Yung, Y.L. Aerosol retrievals from DSCOVR measurements. In Proceedings of the IGARSS 2018—2018 IEEE International Geoscience and Remote Sensing Symposium, Valencia, Spain, 22–27 July 2018; pp. 6026–6028. [Google Scholar] [CrossRef]
- Yang, Y.; Meyer, K.; Wind, G.; Zhou, Y.; Marshak, A.; Platnick, S.; Min, Q.; Davis, A.B.; Joiner, J.; Vasilkov, A.; et al. Cloud products from the Earth Polychromatic Imaging Camera (EPIC): Algorithms and initial evaluation. Atmos. Meas. Tech. 2019, 12, 2019–2031. [Google Scholar] [CrossRef]
- Davis, A.B.; Merlin, G.; Cornet, C.; Labonnote, L.C.; Riédi, J.; Ferlay, N.; Dubuisson, P.; Min, Q.; Yang, Y.; Marshak, A. Cloud information content in EPIC/DSCOVR’s oxygen A- and B-band channels: An optimal estimation approach. J. Quant. Spectrosc. Radiat. Transf. 2018, 216, 6–16. [Google Scholar] [CrossRef]
- Davis, A.B.; Ferlay, N.; Libois, Q.; Marshak, A.; Yang, Y.; Min, Q. Cloud information content in EPIC/DSCOVR’s oxygen A- and B-band channels: A physics-based approach. J. Quant. Spectrosc. Radiat. Transf. 2018, 220, 84–96. [Google Scholar] [CrossRef]
- Gao, M.; Zhai, P.W.; Yang, Y.; Hu, Y. Cloud remote sensing with EPIC/DSCOVR observations: A sensitivity study with radiative transfer simulations. J. Quant. Spectrosc. Radiat. Transf. 2019, 230, 56–60. [Google Scholar] [CrossRef]
- Marquardt, D.W. An algorithm for least-squares estimation of nonlinear parameters. J. Soc. Ind. Appl. Math. 1963, 11, 431–441. [Google Scholar] [CrossRef]
- Tikhonov, A.N.; Arsenin, V.I. Solutions of Ill-Posed Problems; Scripta Series in Mathematics; Winston & Sons: Washington, DC, USA, 1977. [Google Scholar]
- Molina García, V.; Sasi, S.; Efremenko, D.S.; Doicu, A.; Loyola, D. Radiative transfer models for retrieval of cloud parameters from EPIC/DSCOVR measurements. J. Quant. Spectrosc. Radiat. Transf. 2018, 213, 228–240. [Google Scholar] [CrossRef] [Green Version]
- Molina García, V.; Sasi, S.; Efremenko, D.S.; Doicu, A.; Loyola, D. Linearized radiative transfer models for retrieval of cloud parameters from EPIC/DSCOVR measurements. J. Quant. Spectrosc. Radiat. Transf. 2018, 213, 241–251. [Google Scholar] [CrossRef] [Green Version]
- Efremenko, D.; Doicu, A.; Loyola, D.; Trautmann, T. Acceleration techniques for the discrete ordinate method. J. Quant. Spectrosc. Radiat. Transf. 2013, 114, 73–81. [Google Scholar] [CrossRef]
- Efremenko, D.S.; Doicu, A.; Loyola, D.; Trautmann, T. Fast stochastic radiative transfer models for trace gas and cloud property retrievals under cloudy conditions. In Springer Series in Light Scattering; Springer International Publishing: Basel, Switzerland, 2018; pp. 231–277. [Google Scholar]
- del Águila, A.; Efremenko, D.S.; Molina García, V.; Xu, J. Analysis of two dimensionality reduction techniques for fast simulation of the spectral radiances in the Hartley-Huggins band. Atmosphere 2019, 10, 142. [Google Scholar] [CrossRef]
- Blank, K. EPIC Geolocation and Color Imagery Algorithm Revision 5. Technical Report; 2017. Available online: https://eosweb.larc.nasa.gov/project/dscovr/DSCOVR_EPIC_Geolocation_V02.pdf (accessed on 23 July 2019).
- Haney, C.; Doelling, D.; Minnis, P.; Bhatt, R.; Scarino, B.; Gopalan, A. The calibration of the DSCOVR EPIC multiple visible channel instrument using MODIS and VIIRS as a reference. In Proceedings of the Earth Observing Systems XXI, San Diego, CA, USA, 28 August–1 September 2016. [Google Scholar] [CrossRef]
- Available online: https://search.earthdata.nasa.gov (accessed on 27 May 2019).
- Geogdzhayev, I.V.; Marshak, A. Calibration of the DSCOVR EPIC visible and NIR channels using MODIS Terra and Aqua data and EPIC lunar observations. Atmos. Meas. Tech. 2018, 11, 359–368. [Google Scholar] [CrossRef] [Green Version]
- Fitzgibbon, A.W. Simultaneous linear estimation of multiple view geometry and lens distortion. In Proceedings of the 2001 IEEE Computer Society Conference on Computer Vision and Pattern Recognition (CVPR 2001), Kauai, HI, USA, 8–14 December 2001; pp. 125–132. [Google Scholar] [CrossRef]
- Wang, A.; Qiu, T.; Shao, L. A simple method of radial distortion correction with centre of distortion estimation. J. Math. Imaging Vis. 2009, 35, 165–172. [Google Scholar] [CrossRef]
- Doicu, A.; Trautmann, T.; Schreier, F. Numerical Regularization for Atmospheric Inverse Problems; Springer: Berlin/Heidelberg, Germany, 2010. [Google Scholar]
- Wessel, P.; Smith, W.H.F. A global, self-consistent, hierarchical, high-resolution shoreline database. J. Geophys. Res. Solid Earth 1996, 101, 8741–8743. [Google Scholar] [CrossRef] [Green Version]
- Serra, J. Introduction to mathematical morphology. Comput. Vis. Graph. Image Process. 1986, 35, 283–305. [Google Scholar] [CrossRef]
- Canny, J. A computational approach to edge detection. IEEE Trans. Pattern Anal. Mach. Intell. 1986, 8, 679–698. [Google Scholar] [CrossRef]
- Available online: https://www.pyimagesearch.com/2015/04/06/zero-parameter-automatic-canny-edge-detection-with-python-and-opencv (accessed on 11 July 2019).
- Remondino, F.; Spera, M.G.; Nocerino, E.; Menna, F.; Nex, F. State of the art in high density image matching. Photogramm. Rec. 2014, 29, 144–166. [Google Scholar] [CrossRef] [Green Version]
- Lowe, D.G. Distinctive image features from scale-invariant keypoints. Int. J. Comput. Vis. 2004, 60, 91–110. [Google Scholar] [CrossRef]
- Bay, H.; Ess, A.; Tuytelaars, T.; Van Gool, L. Speeded-up robust features (SURF). Comput. Vis. Image Underst. 2008, 110, 346–359. [Google Scholar] [CrossRef]
- Rublee, E.; Rabaud, V.; Konolige, K.; Bradski, G. ORB: An efficient alternative to SIFT or SURF. In Proceedings of the 2011 International Conference on Computer Vision, Barcelona, Spain, 6–13 November 2011; pp. 2564–2571. [Google Scholar] [CrossRef]
- Kaehler, A.; Bradski, G. Learning OpenCV 3: Computer Vision in C++ with the OpenCV Library; O’Reilly Media: Sebastopol, CA, USA, 2016. [Google Scholar]
- Rosten, E.; Porter, R.; Drummond, T. Faster and better: A machine learning approach to corner detection. IEEE Trans. Pattern Anal. Mach. Intell. 2010, 32, 105–119. [Google Scholar] [CrossRef] [PubMed]
- Calonder, M.; Lepetit, V.; Ozuysal, M.; Trzcinski, T.; Strecha, C.; Fua, P. BRIEF: Computing a local binary descriptor very fast. IEEE Trans. Pattern Anal. Mach. Intell. 2012, 34, 1281–1298. [Google Scholar] [CrossRef]
- Available online: https://docs.opencv.org/3.0-beta/doc/py_tutorials/py_feature2d/py_matcher/py_matcher.html (accessed on 11 July 2019).
- Hamming, R. Error detecting and error correcting codes. Bell Syst. Tech. J. 1950, 29, 147–160. [Google Scholar] [CrossRef]
- Fischler, M.A.; Bolles, R.C. Random sample consensus: A paradigm for model fitting with applications to image analysis and automated cartography. Commun. ACM 1981, 24, 381–395. [Google Scholar] [CrossRef]
- Lomb, N. Least-squares frequency analysis of unequally spaced data. Astrophys. Space Sci. 1976, 39, 447–462. [Google Scholar] [CrossRef]
- Scargle, J. Studies in astronomical time series analysis. II - Statistical aspects of spectral analysis of unevenly spaced data. Astrophys. J. 1982, 263, 835–853. [Google Scholar] [CrossRef]
- Hocke, K. Phase estimation with the Lomb-Scargle periodogram method. Annal. Geophys. 1998, 16, 356–358. [Google Scholar]
- Jiang, J.H.; Zhai, A.J.; Herman, J.; Zhai, C.; Hu, R.; Su, H.; Natraj, V.; Li, J.; Xu, F.; Yung, Y.L. Using Deep Space Climate Observatory measurements to study the Earth as an exoplanet. Astron. J. 2018, 156, 26. [Google Scholar] [CrossRef]
- Van Herk, M. Image registration using Chamfer matching. In Handbook of Medical Image Processing and Analysis; Elsevier: Amsterdam, The Netherlands, 2009; pp. 591–603. [Google Scholar]
Figure 1.
Example of reflectance image from EPIC L1B version 2 on 20 March 2016 at 18:36:56 UTC, with the coastline shape vector drawn in white line. On the left side, the full Earth’s disk is shown. On the right side, we zoom into two regions where the misregistration is noticeable.
Figure 1.
Example of reflectance image from EPIC L1B version 2 on 20 March 2016 at 18:36:56 UTC, with the coastline shape vector drawn in white line. On the left side, the full Earth’s disk is shown. On the right side, we zoom into two regions where the misregistration is noticeable.
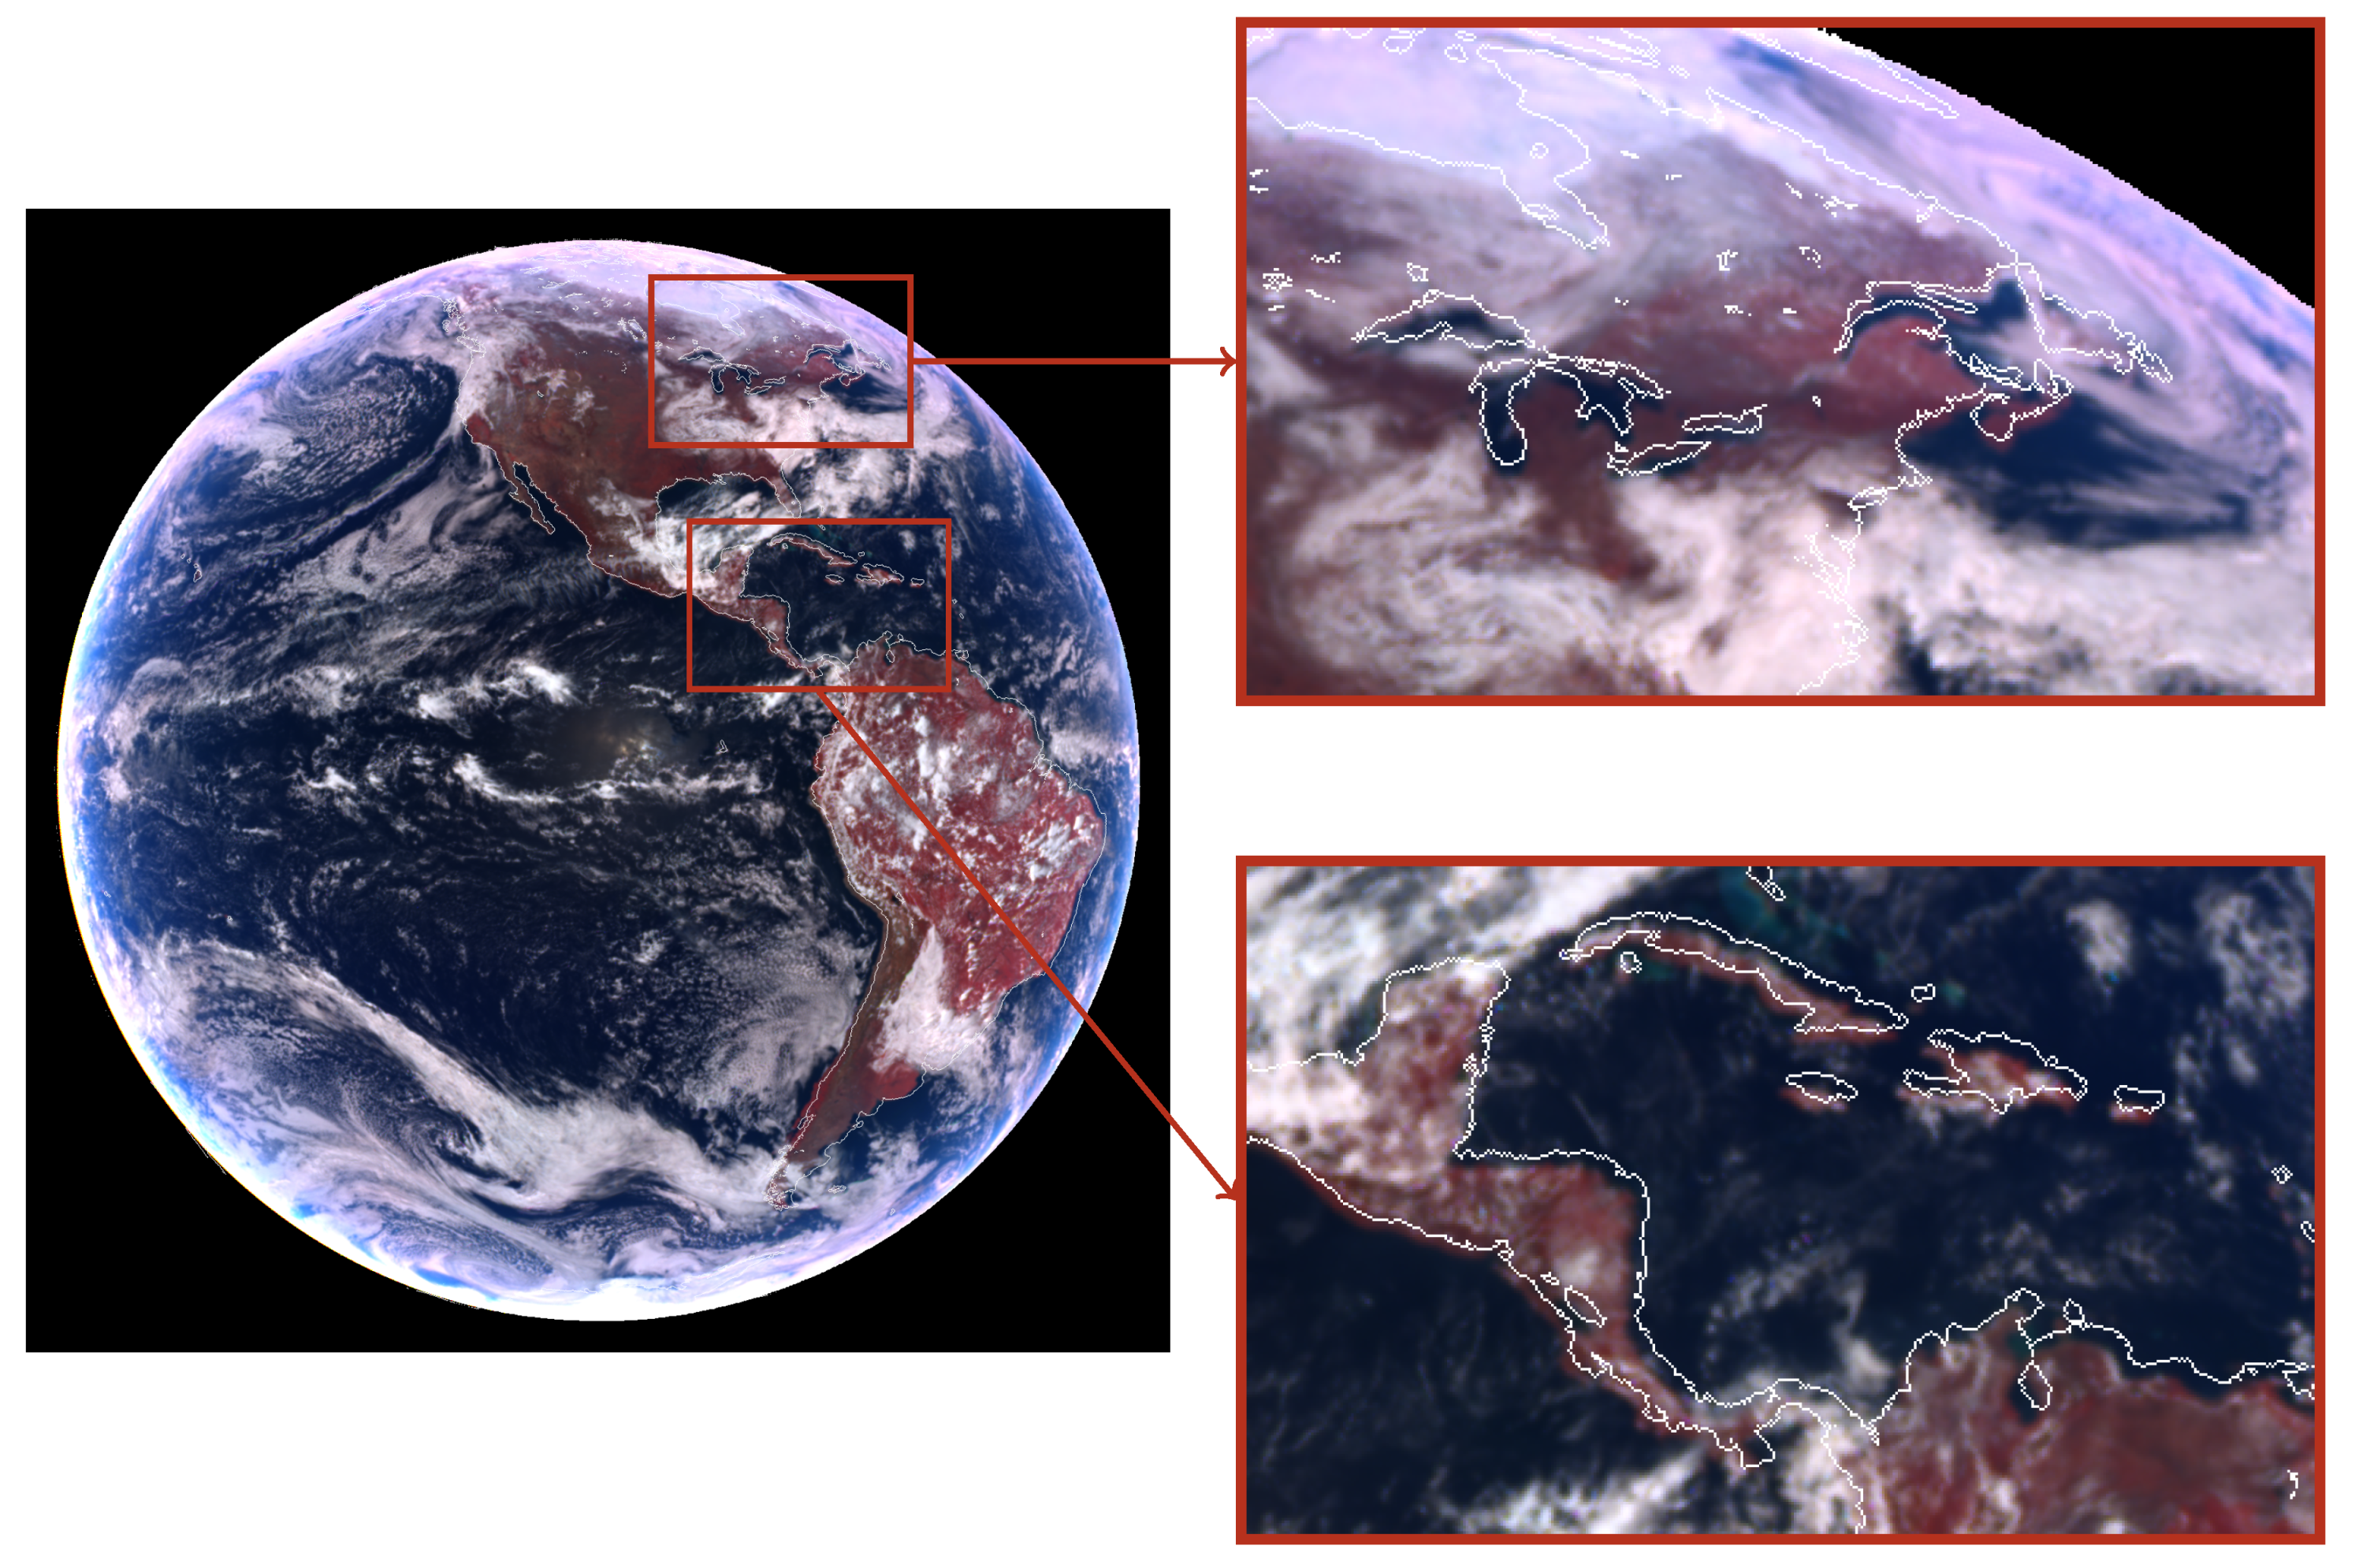
Figure 2.
Workflow chart for the computation of the optimal transformation parameters for a given image. (a) Main workflow chain in which the non-linear least squares fitting with regularisation is performed. (b) Secondary workflow chain in which the known data vectors and are prepared.
Figure 2.
Workflow chart for the computation of the optimal transformation parameters for a given image. (a) Main workflow chain in which the non-linear least squares fitting with regularisation is performed. (b) Secondary workflow chain in which the known data vectors and are prepared.
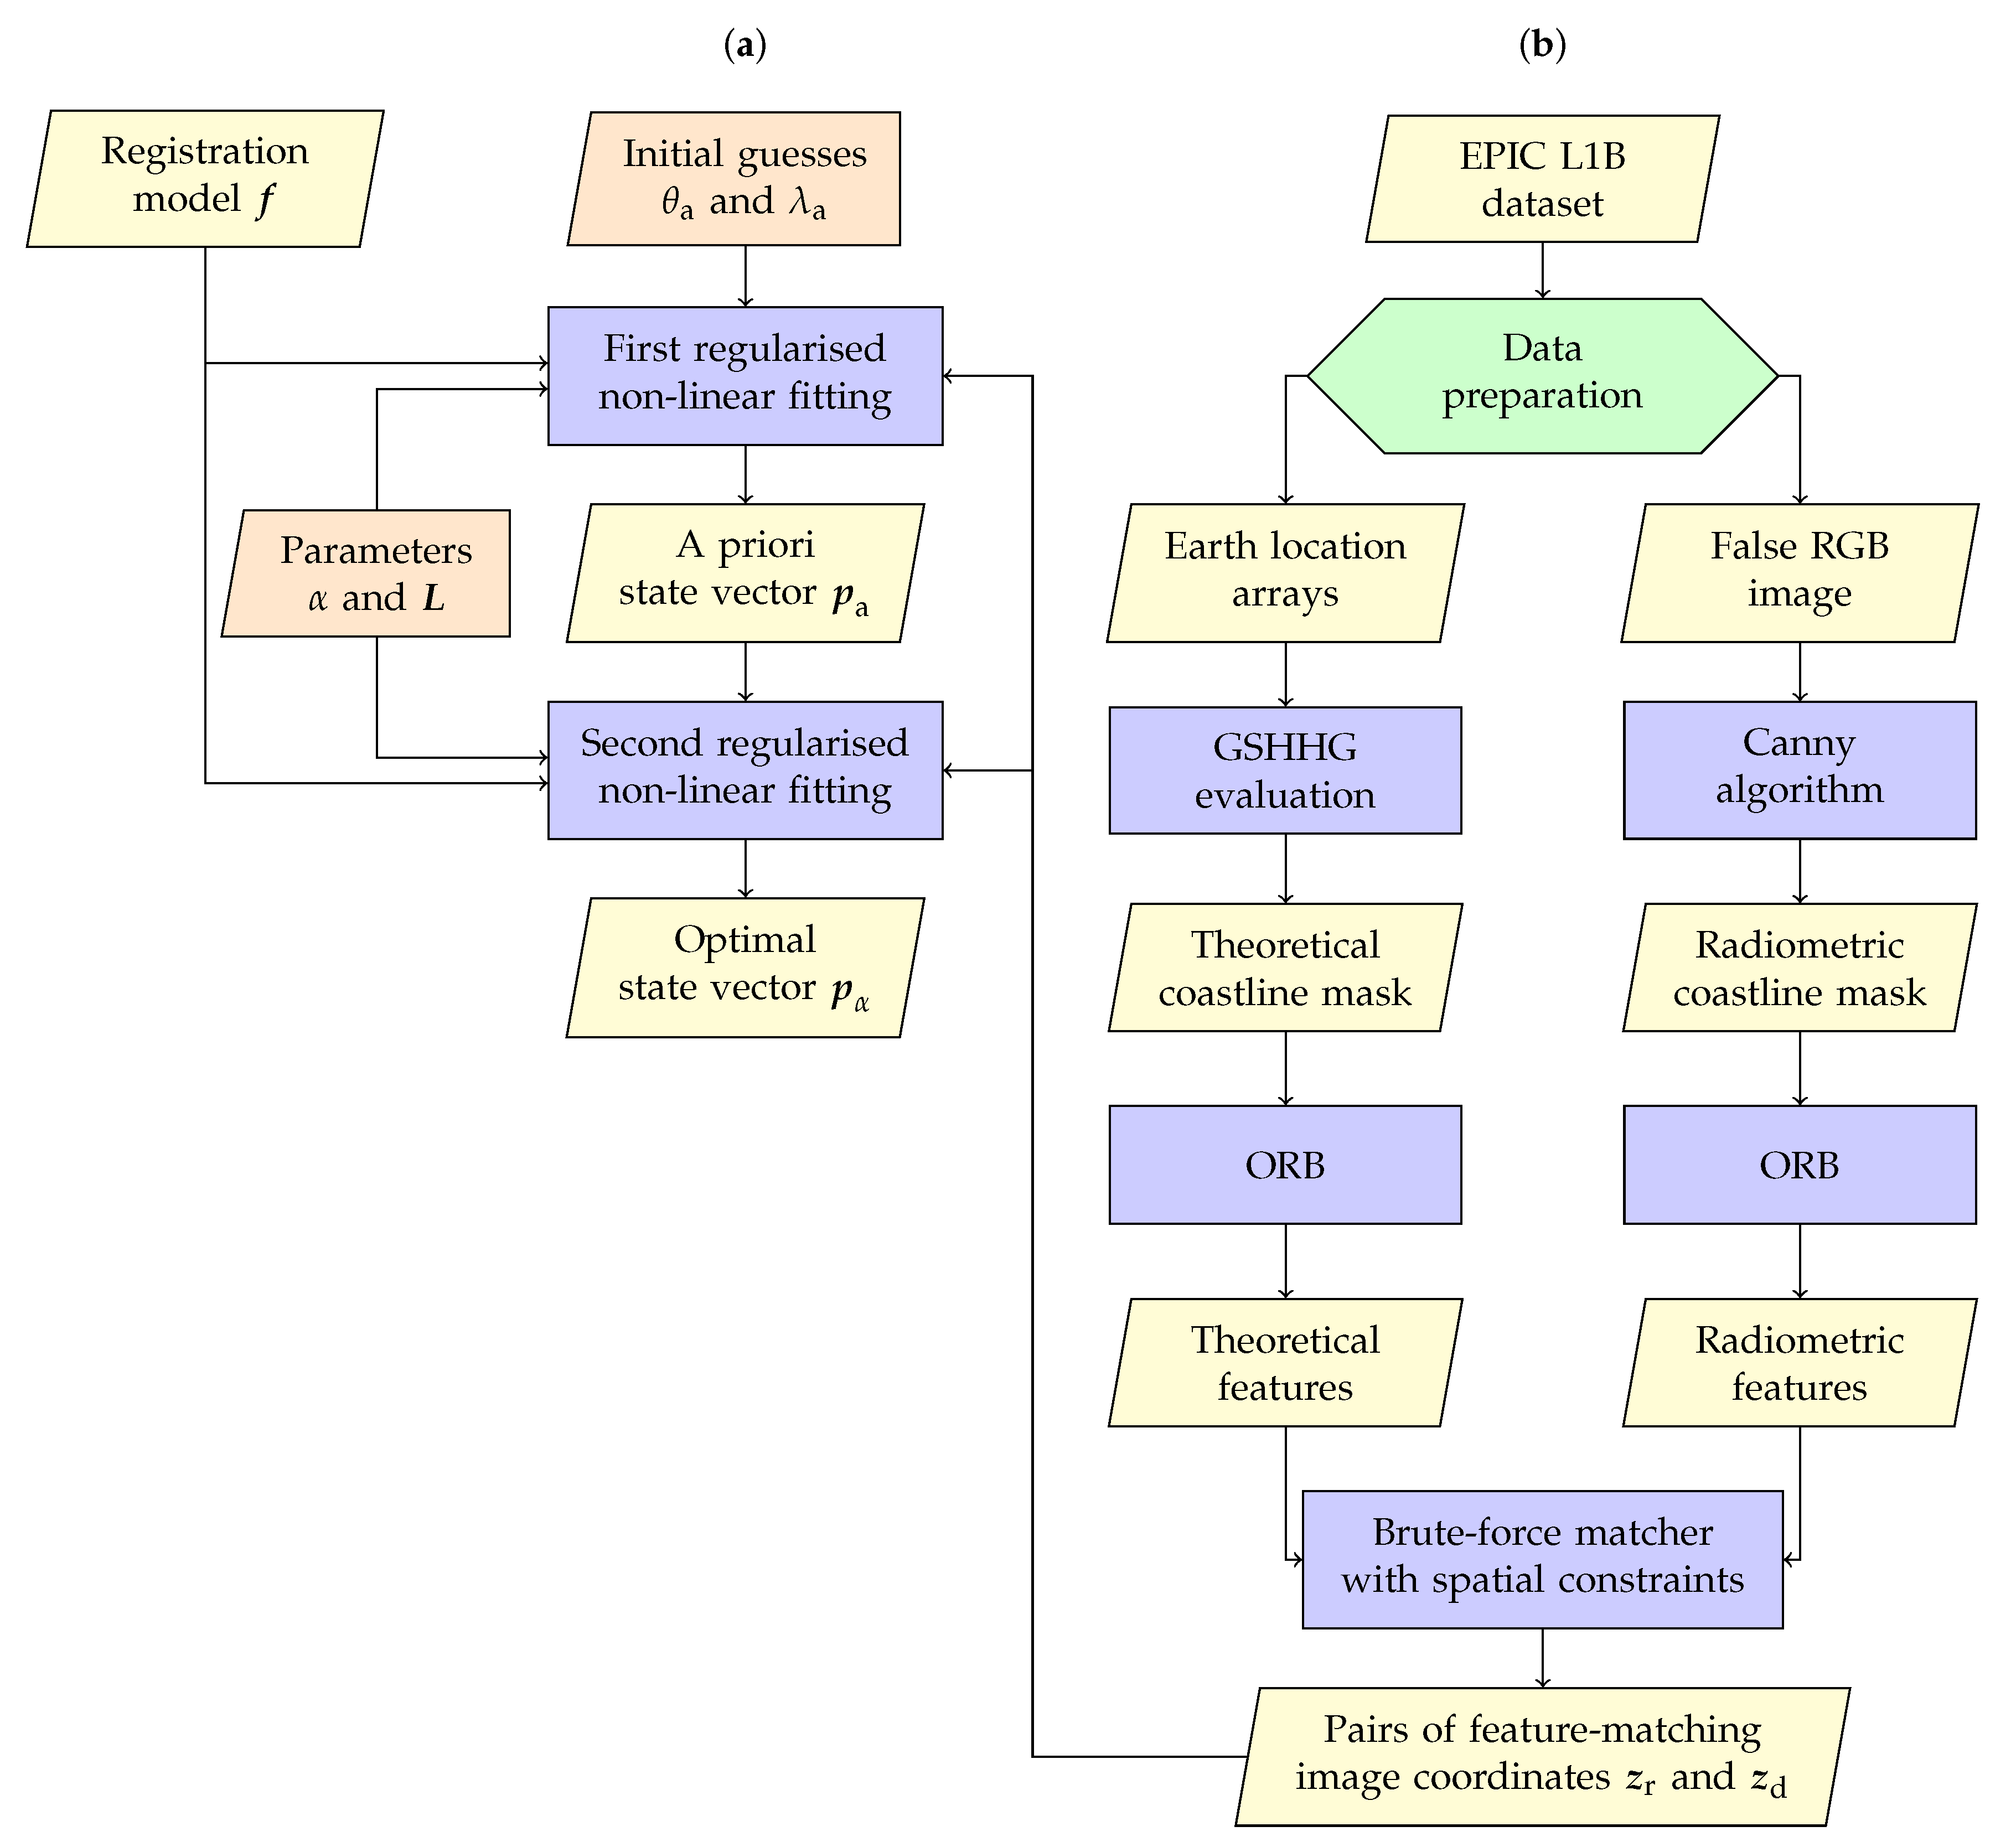
Figure 3.
Comparison of the (a) theoretical and (b) radiometric coastlines for one of the regions shown in Figure 1. The radiometric coastline is partially polluted with other type of borders detected by the Canny algorithm (e.g., clouds or interfaces between two different land covers).
Figure 3.
Comparison of the (a) theoretical and (b) radiometric coastlines for one of the regions shown in Figure 1. The radiometric coastline is partially polluted with other type of borders detected by the Canny algorithm (e.g., clouds or interfaces between two different land covers).
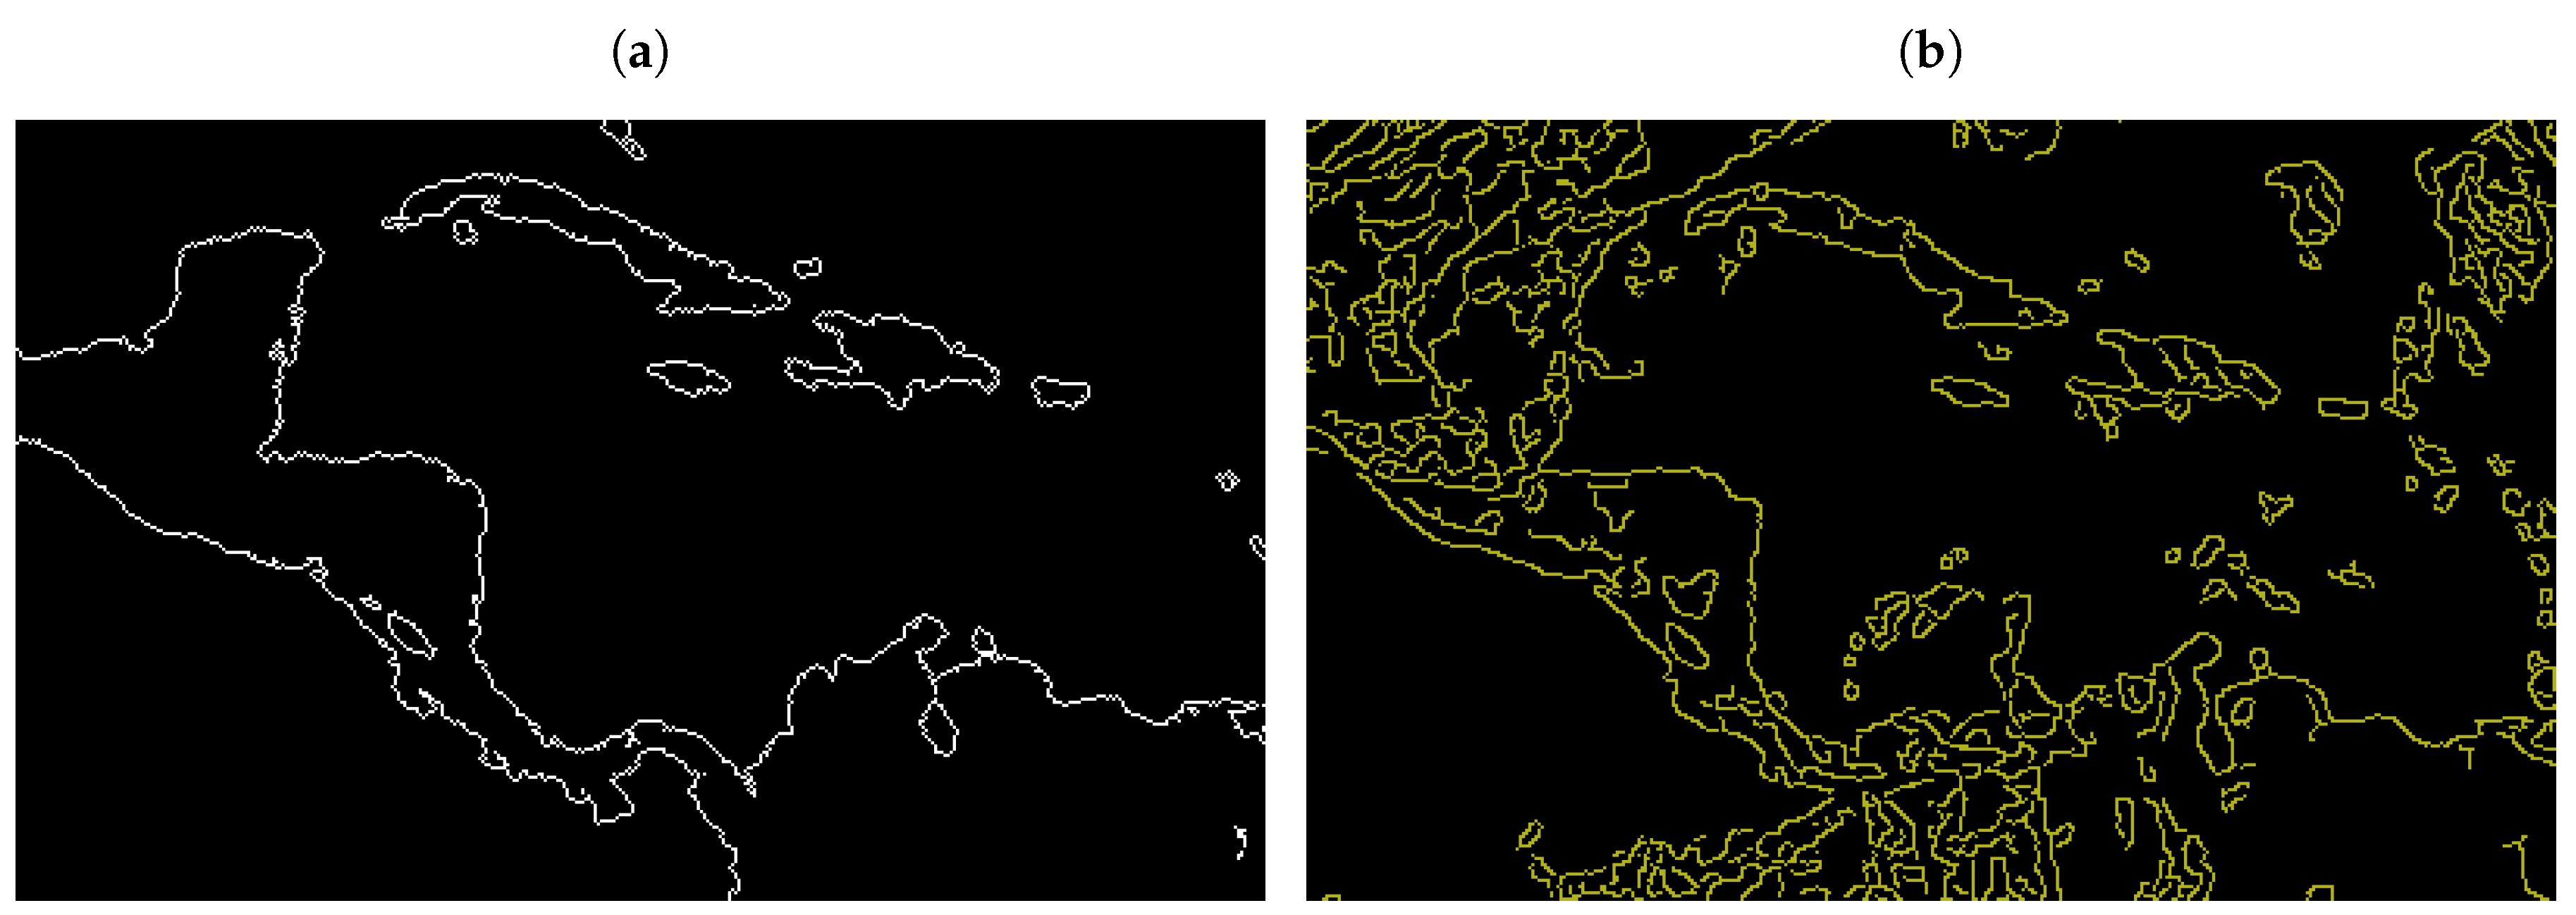
Figure 4.
Pairs of matching keypoints found within one of the regions shown in Figure 1 after applying the outlier rejection step based on spatial criteria. The keypoints detected in the theoretical coastline (white lines) are shown as yellow points, while the corresponding keypoints detected in the radiometric coastline are shown as green points. Every matching pair is connected with a red segment.
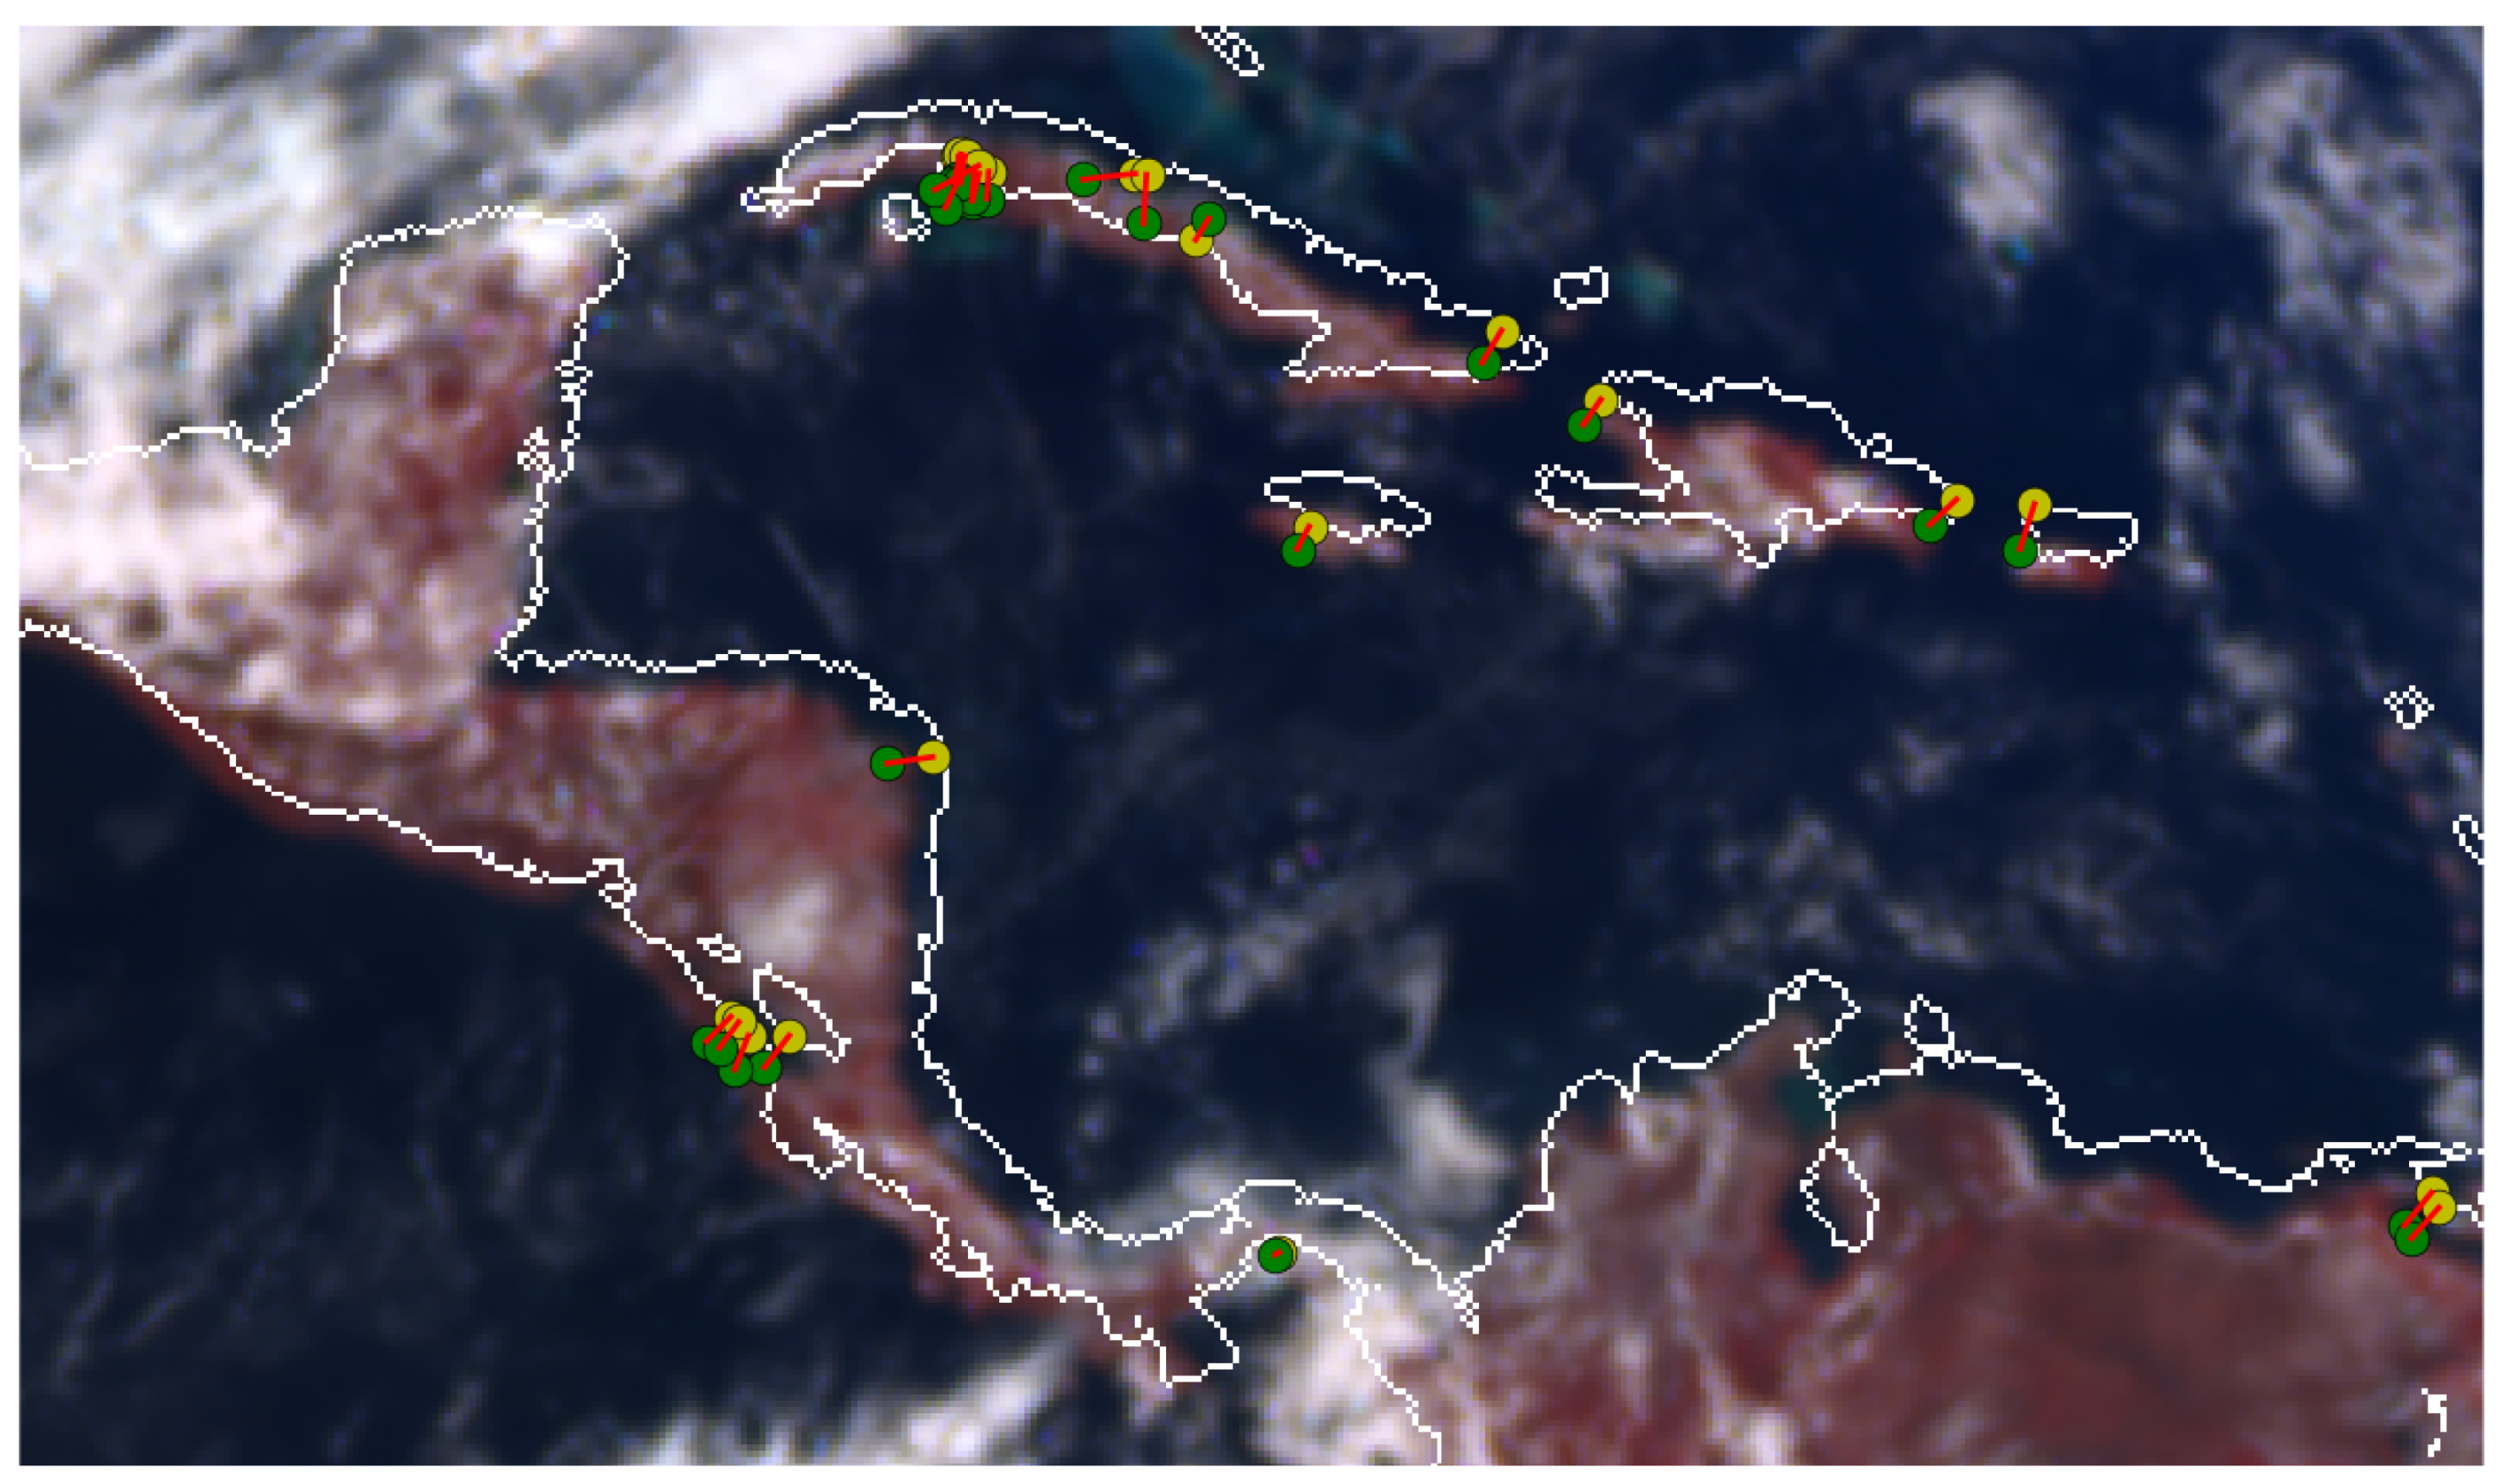
Figure 5.
Histograms of spatial distances (in pixels) between the points of matching pairs: (a) before applying registration, i.e., as they are originally located; and (b) after applying registration, i.e., after transforming the distorted points into registered points with the model described in Section 2. The histograms were computed for all the matching pairs found in three years of EPIC L1B images.
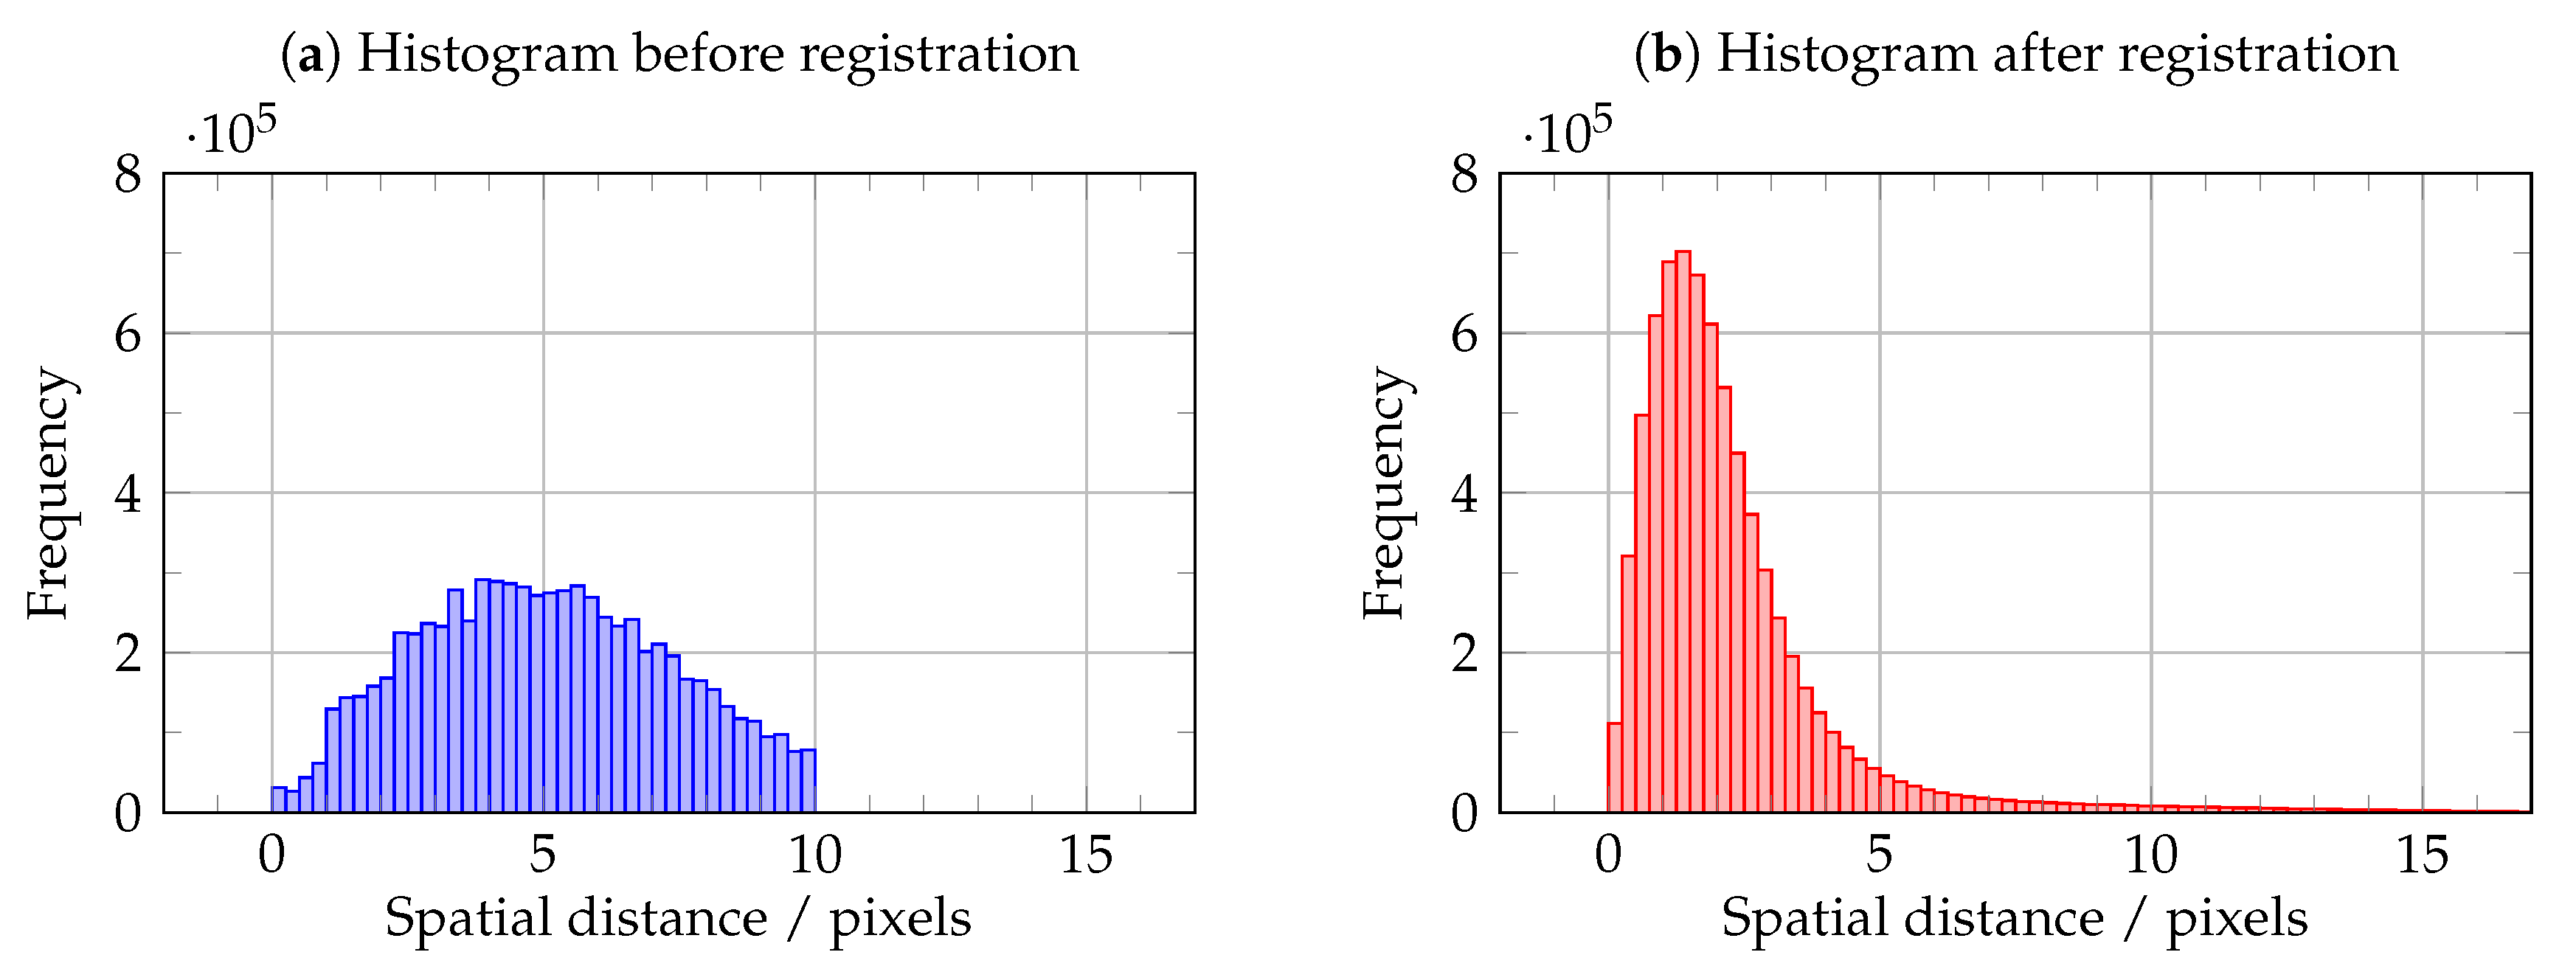
Figure 6.
Comparison of the theoretical coastline (white lines) and the radiometric coastline (yellow lines) for one of the regions shown in Figure 1 (a) before and (b) after applying the registration.
Figure 6.
Comparison of the theoretical coastline (white lines) and the radiometric coastline (yellow lines) for one of the regions shown in Figure 1 (a) before and (b) after applying the registration.

Figure 7.
Examples of different reflectance images from EPIC L1B version 2 before (left) and after (right) applying the new registration: (a) Europe and North Africa on 4 August 2015 14:37:27 UTC; (b) East Asia on 24 July 2016 07:09:19 UTC; (c) Caribbean Sea and Gulf of Mexico on 15 December 2017 17:17:03 UTC; and (d) the south of Africa and Madagascar on 16 May 2018 09:10:54 UTC.
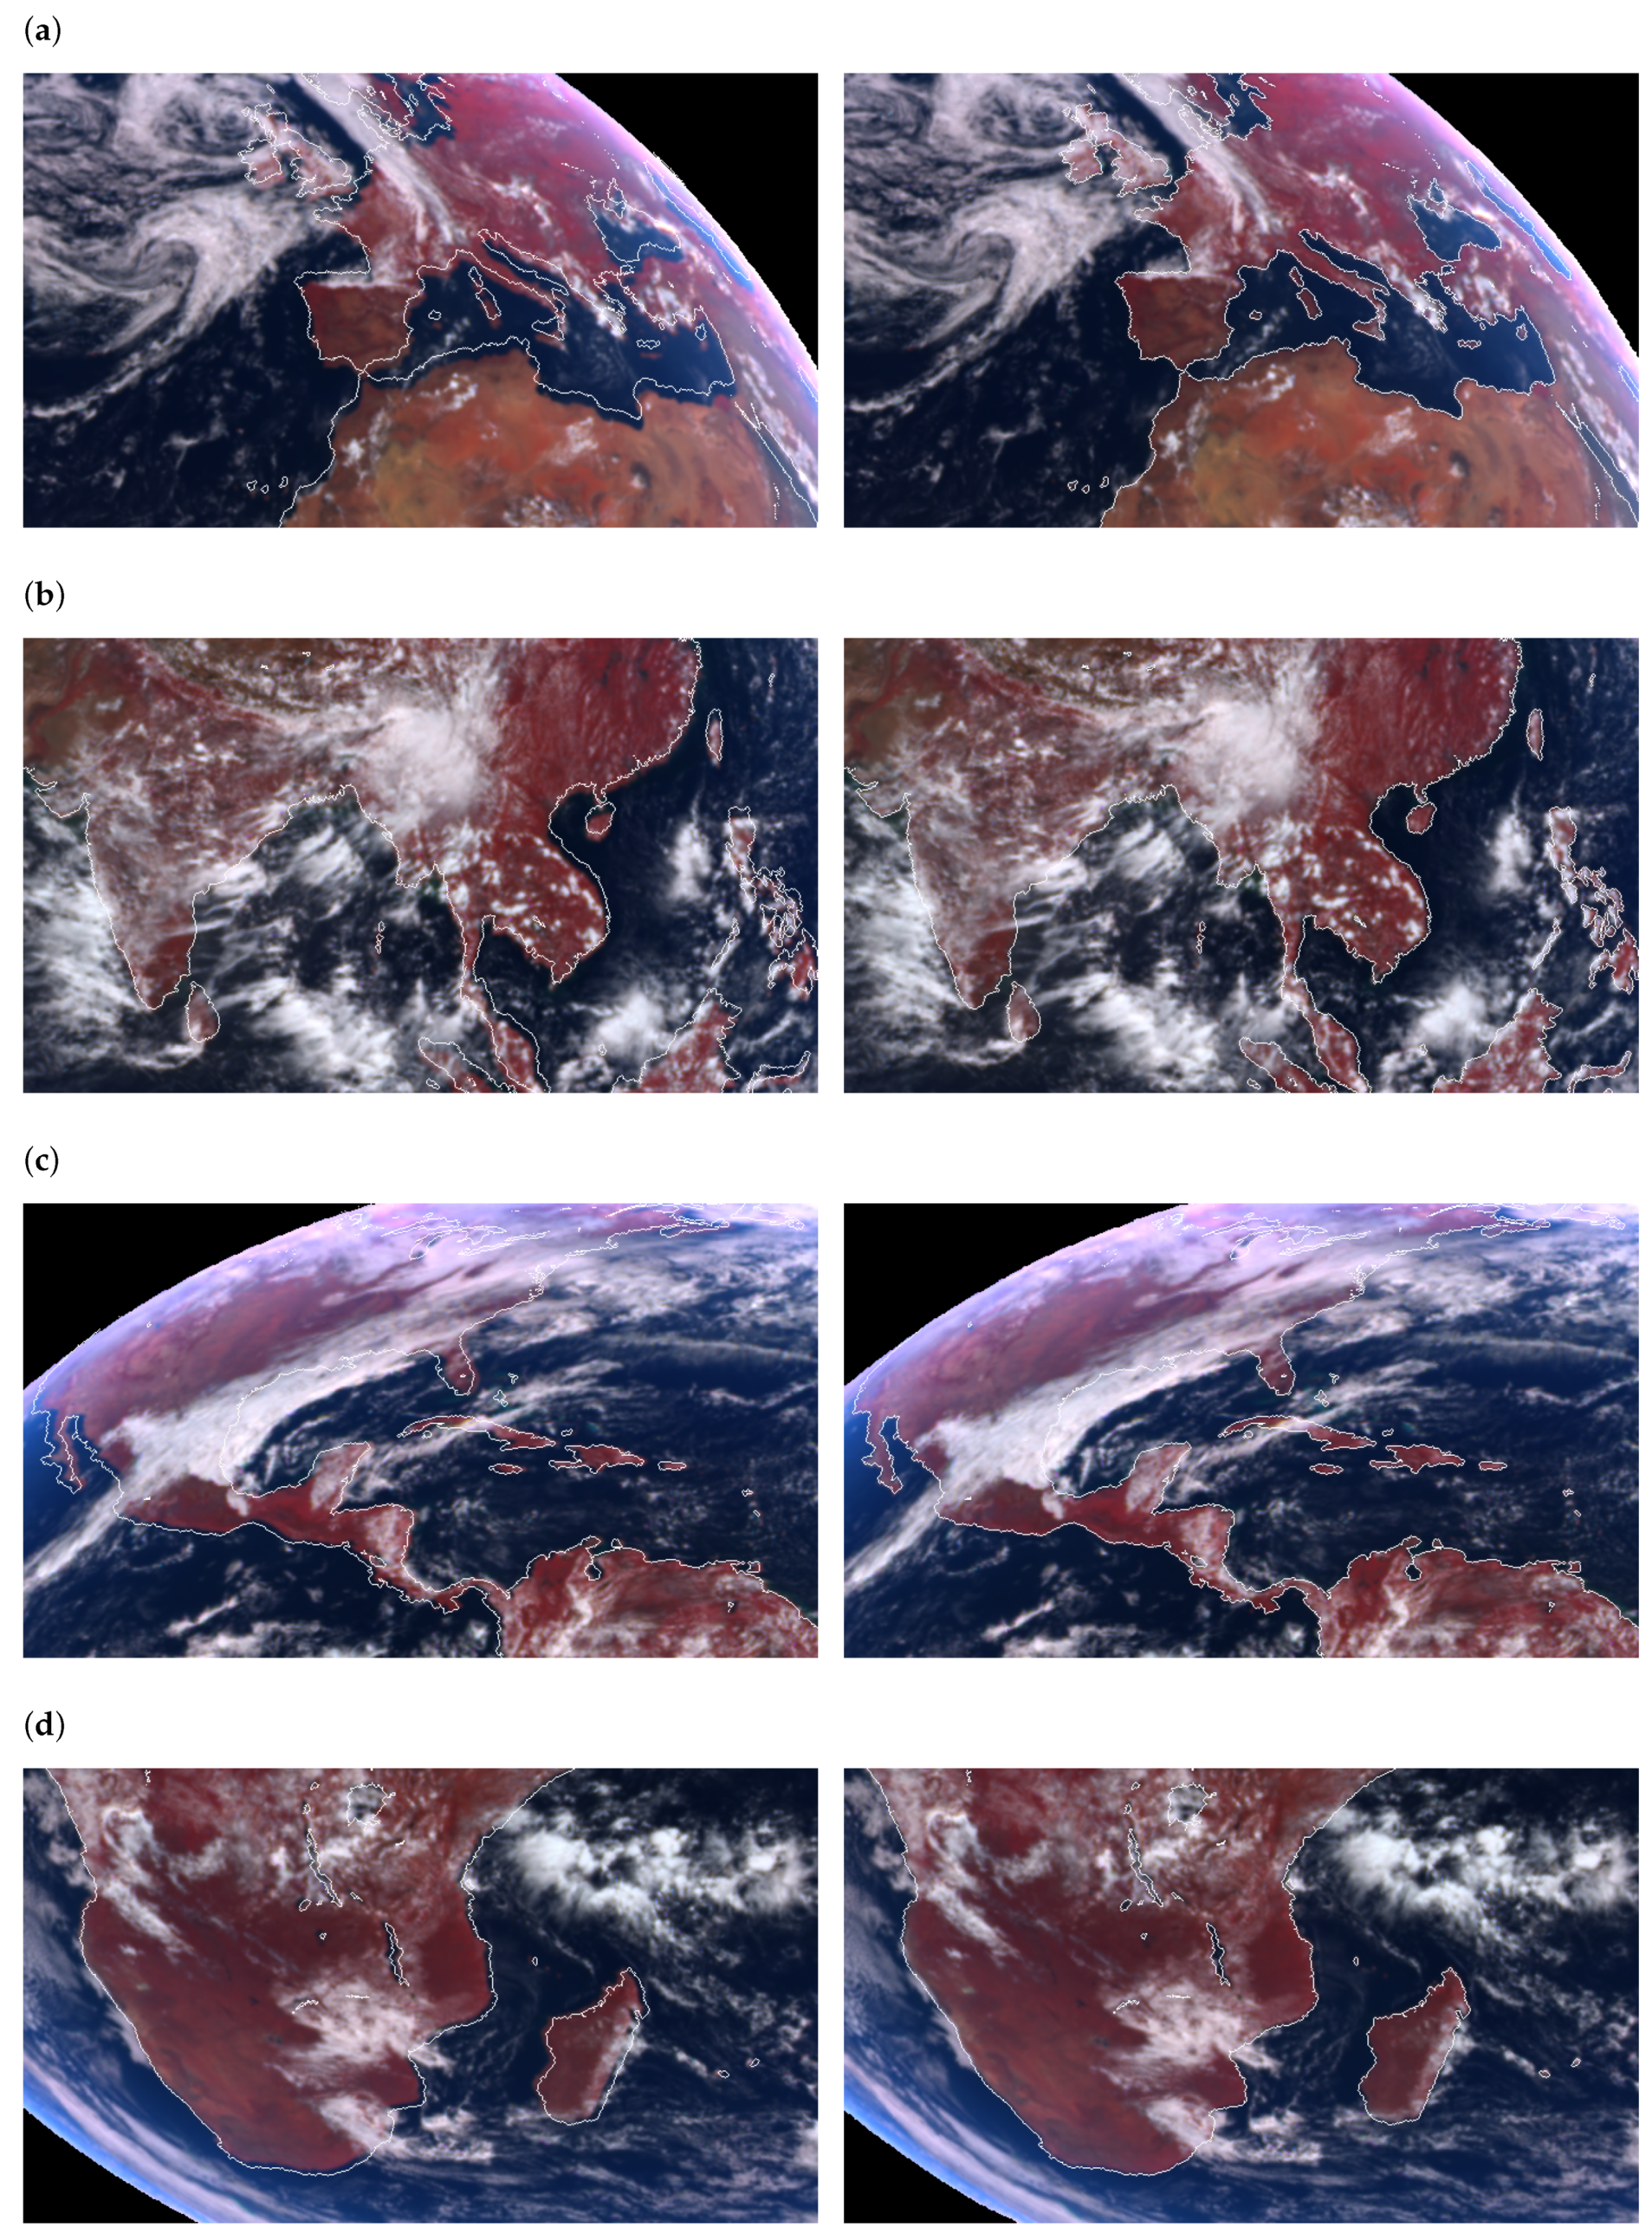
Figure 8.
Time series plot for every transformation parameter: (a) the horizontal shift ; (b) the vertical shift ; (c) the rotation angle ; and (d) the radial distortion parameter . The blue lines represent the evolution of the daily mean value for every parameter, while the light red curves represent the daily dispersion of each parameter given as the daily mean value plus/minus the daily standard deviation.
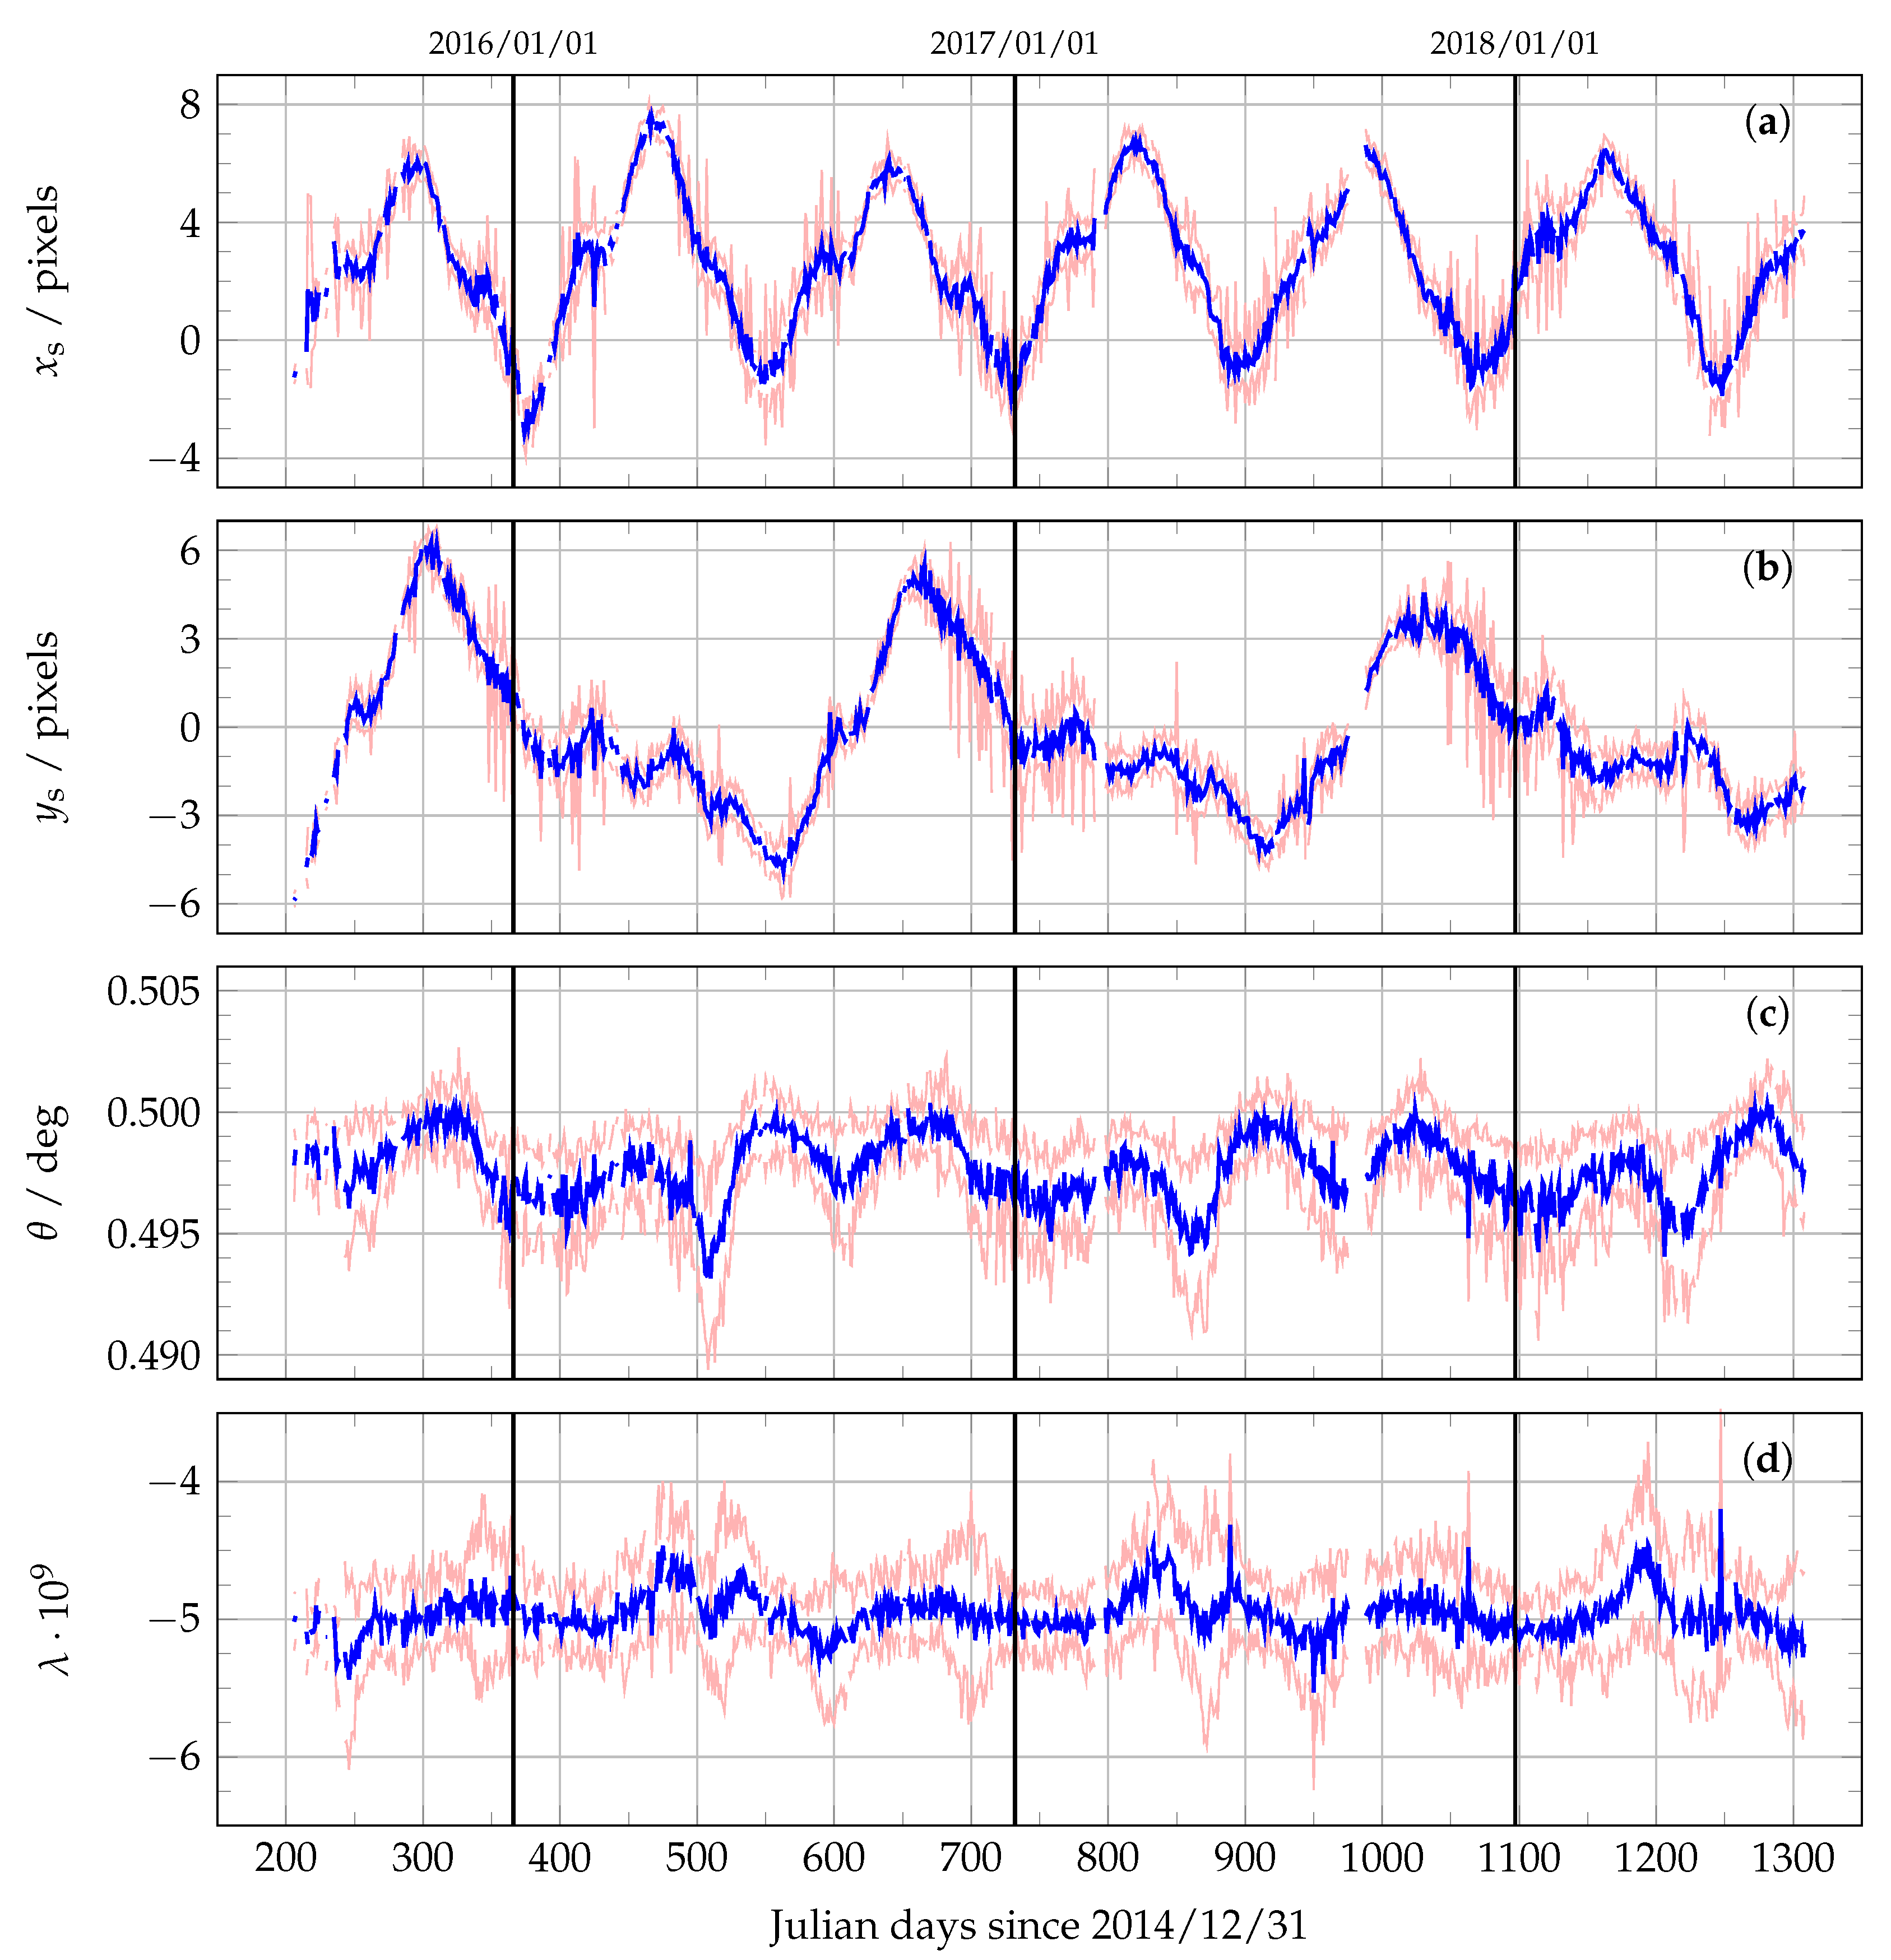
Figure 9.
Normalised periodogram amplitude as a function of the time period in days for every transformation parameter: (a) the horizontal shift ; (b) the vertical shift ; (c) the rotation angle ; and (d) the radial distortion parameter .
Figure 9.
Normalised periodogram amplitude as a function of the time period in days for every transformation parameter: (a) the horizontal shift ; (b) the vertical shift ; (c) the rotation angle ; and (d) the radial distortion parameter .
© 2019 by the authors. Licensee MDPI, Basel, Switzerland. This article is an open access article distributed under the terms and conditions of the Creative Commons Attribution (CC BY) license (http://creativecommons.org/licenses/by/4.0/).
Share and Cite
MDPI and ACS Style
Molina García, V.; Sasi, S.; Efremenko, D.S.; Loyola, D. Improvement of EPIC/DSCOVR Image Registration by Means of Automatic Coastline Detection. Remote Sens. 2019, 11, 1747. https://doi.org/10.3390/rs11151747
AMA Style
Molina García V, Sasi S, Efremenko DS, Loyola D. Improvement of EPIC/DSCOVR Image Registration by Means of Automatic Coastline Detection. Remote Sensing. 2019; 11(15):1747. https://doi.org/10.3390/rs11151747
Chicago/Turabian StyleMolina García, Víctor, Sruthy Sasi, Dmitry S. Efremenko, and Diego Loyola. 2019. "Improvement of EPIC/DSCOVR Image Registration by Means of Automatic Coastline Detection" Remote Sensing 11, no. 15: 1747. https://doi.org/10.3390/rs11151747
Note that from the first issue of 2016, this journal uses article numbers instead of page numbers. See further details here.