Letter

Evaluation of Synoptic Snowfall on the Antarctic Ice Sheet Based on CloudSat, In-Situ Observations and Atmospheric Reanalysis Datasets

1
Chinese Antarctic Center of Surveying and Mapping, Wuhan University, Wuhan 430079, China
2
State Key Laboratory of Information Engineering in Surveying, Mapping and Remote Sensing, Wuhan 430079, China
3
Collaborative Innovation Center for Territorial Sovereignty and Maritime Rights, Wuhan University, Wuhan 430079, China
4
Observatoire Géodésique de Tahiti, University of French Polynesia, Tahiti 98702, French Polynesia
5
College of Geography and Environment, Shandong Normal University, Jinan 250014, China
*
Author to whom correspondence should be addressed.
Remote Sens. 2019, 11(14), 1686; https://doi.org/10.3390/rs11141686
Submission received: 24 June 2019 / Revised: 28 June 2019 / Accepted: 12 July 2019 / Published: 16 July 2019

Abstract

:
Snowfall data are vital in calculating the surface mass balance of the Antarctic Ice Sheet (AIS), where in-situ and satellite measurements are sparse at synoptic timescales. CloudSat data are used to construct Antarctic snowfall data at synoptic timescales to compensate for the sparseness of synoptic snowfall data on the AIS and to better understand its surface mass balance. Synoptic CloudSat snowfall data are evaluated by comparison with daily snow accumulation measurements from ten automatic weather stations (AWSs) and the fifth generation of the European Centre for Medium-Range Weather Forecasts climate reanalysis (ERA5) snowfall. Synoptic snowfall data were constructed based on the CloudSat measurements within a radius of 1.41°. The results show that reconstructed CloudSat snowfall at daily and two-day resolutions cover about 28% and 29% of the area of the AIS, respectively. Daily CloudSat snowfall and AWS snow accumulation have similar trends at all stations. While influenced by stronger winds, >73.3% of extreme snow accumulation events correspond to snowfall at eight stations. Even if the CloudSat snowfall data have not been assimilated into the ERA5 dataset, the synoptic CloudSat snowfall data are almost identical to the daily ERA5 snowfall with only small biases (average root mean square error and mean absolute error < 3.9 mm/day). Agreement among the three datasets suggests that the CloudSat data can provide reliable synoptic snowfall data in most areas of the AIS. The ERA5 dataset captures a large number of extreme snowfall events at all AWSs, with capture rates varying from 56% to 88%. There are still high uncertainties in ERA5. Nevertheless, the result suggests that ERA5 can be used to represent actual snowfall events on the AIS at synoptic timescale.

Graphical Abstract

1. Introduction

The mass balance of the Antarctic Ice Sheet (AIS) has an important influence on global sea-levels due to global warming [1]. We need to accurately quantify the variability of precipitation, which is an important source of mass gain and affects the inter-annual variability of the surface mass balance (SMB) over the AIS [2,3]. However, it is still challenging to directly measure precipitation on the ground in the AIS as a result of the harsh environment [4,5]. Strong katabatic winds in coastal regions may mix precipitation with blowing or drifting snow. In addition, clear-sky precipitation may influence the accuracy of in-situ observations on the interior of the AIS [6,7,8].
CloudSat has recently become the most useful tool for directly measuring solid precipitation (i.e., snowfall) on the AIS [9]. The cloud profiling radar (CPR) system onboard CloudSat enables the direct observation of precipitation throughout the atmosphere and can measure light precipitation [10,11]. The CloudSat snowfall retrieval products have been used to reconstruct annual and seasonal snowfall on the AIS [12,13,14,15,16]. Monthly CloudSat snowfall data have been examined by snow accumulation measurements from automatic weather stations (AWSs) [17]. However, there are few attempts to use ground-based measurements (e.g., micro-rain radar (MRR)) to examine the CloudSat snowfall over the AIS at shorter timescales [5,18,19] because there is currently no precipitation gauge network and few continuous snowfall measurements for the AIS [5,20]. CloudSat provides a possible way to solve these problems.
CloudSat has a 16-day repeat period covering regions from 82° N to 82° S. The density of radar footprints increases with the rise of latitude. The daily overpass frequency of radar measurements for each grid box is between 0.3 and 1.3 days over continental Antarctica at a resolution of 1° latitude × 1.5° longitude [17]. Such a temporal resolution is enhanced in the interior AIS at higher latitudes. Comparisons between CloudSat and MRR data and in-situ measurements suggest that CloudSat can provide reliable snowfall data at monthly and synoptic timescales [19]. Synoptic snowfall data have daily or two-day temporal resolutions and can accurately represent snowfall events at a synoptic timescale. It is possible that CloudSat could provide a reliable database of snowfall observations at daily or multi-day resolutions in some areas of the AIS.
MRR measures vertical profiles and uses the radar reflectivity–snowfall rate relationship to acquire the precipitation rate based on the microphysical properties of snowfall [21]. Lemonnier et al. (2019) have compared CloudSat snowfall retrievals with MRR observations at two stations in Antarctica (Dumont d’Urville and Princess Elisabeth) [18]. Their results suggest that MRR has an advantage because it measures precipitation/snowfall directly and is less affected by wind than the acoustic depth gauges (ADGs) installed at AWSs. However, there are only a few of these radar systems and they require a good logistic service. AWSs provide the most efficient way of acquiring snow accumulation measurements for the AIS at a high temporal resolution (ten-minute) [22]. AWS snow accumulation has been used to examine the variability of the SMB, the characteristics of extreme precipitation events and the performance of reanalysis data and regional climate models [7,23,24,25,26]. While the number of stations is small at present and measurements are influenced by wind, AWS data are essential for a better understanding of the Antarctic SMB and high precipitation events at a synoptic timescale [23,25,26]. SMB contains snowfall which is the main positive term of the SMB, surface sublimation, drifting snow sublimation, surface melt and wind-induced accumulation or ablation by drifting and blowing snow [4,5]. A previous study used monthly AWS snow accumulation from two AWSs on the Ross Ice Sheet (RIS) to establish relationships with CloudSat snowfall [17]. AWS data are therefore also used to evaluate the relationships between ground measurements and CloudSat data at a synoptic timescale in this study.
CloudSat has a lot of flaws and disadvantages. It cannot measure below 1200 m and provide synoptic snowfall data for the entire AIS, especially in the coastal regions, as a result of the radar measurement frequency. Since there are few snowfall measurements for the AIS, atmospheric reanalysis data have been widely used to study Antarctic snowfall [3,27,28,29]. The use of hydrological variables, such as precipitation and snowfall, from reanalysis data requires great caution [24,30,31]. Previous studies have suggested that the performance of reanalysis data is reliable at annual and synoptic timescales based on in-situ observations from AWSs [24,25,26]. However, the capture rates of synoptic precipitation events are relatively low and the synoptic correlations between AWSs and reanalysis data are weak [25,26], mainly due to the effect of wind redistribution on some precipitation events recorded by AWSs [5,23]. Consequently, it is necessary to use more reliable snowfall data to evaluate the performance of reanalysis datasets at a synoptic timescale. While extreme precipitation/snowfall events are rare during the process of mass gain, they can contribute 40–60% of the total annual precipitation in Antarctica [3]. The characteristics of such events need to be investigated.
Snowfall data are required to understand the Antarctic SMB and to evaluate the simulation accuracy of reanalysis data. We reconstructed snowfall on the AIS at new temporal resolutions based on the CloudSat 2C-SNOW-PROFILE dataset. Monthly AWS snow accumulation was compared with monthly CloudSat snowfall and MRR was compared with instantaneous CloudSat snowfall in the previous studies [17,18]. Unlike previous studies [17,18], daily snow accumulation and extreme snow accumulation events were compared with synoptic CloudSat snowfall. We also compared the CloudSat snowfall with the ERA5 snowfall to evaluate the synoptic performance of the new European Centre for Medium-Range Weather Forecasts (ECMWF) climate reanalysis dataset [32], which has now fully replaced the ERA-Interim dataset [33]. The distribution of extreme snowfall events and their seasonal variations were analyzed from 1979 to 2018. Such events are important for the correct interpretation of ice cores and the reconstruction of past climate records [3,7].

2. Materials and Methods

2.1. CloudSat Data

CloudSat is part of NASA’s Earth System Science Pathfinder satellite mission and is supported by the Jet Propulsion Laboratory [34]. The CPR on CloudSat is a nadir-looking radar system operating at 94 GHz. The radar measures the power backscattered by clouds and hydrometeors with a ~1.7 × 1.4 km2 spatial footprint. It gives us the ability to measure much smaller particles of water and ice than ground-based weather radar systems at centimeter wavelengths. The measurements cover June 2006 to April 2011. The limited time coverage of the CloudSat data was due to battery problems and previous studies only used the time period from 2006 to 2011. The radar reflectivity profiles are divided into 150 bins with a 240 m vertical resolution. The lowest bin contains anomalously large reflectivity values due to contamination from ground clutter [35,36]. Therefore the near surface bin in the algorithms is placed at the third or fifth bin above the surface, depending on the type of surface [10]. The near surface bin is defined as the lowest bin above the blind zone (the part of the profiles likely contaminated by ground clutter) and provides the reflectivity used for calculating the snowfall rate in various algorithms [10].
The CPR reflectivity data in the near surface bin are used in the 2C-SNOW-PROFILE product to provide snowfall rate retrievals [12,14]. The reflectivity is filtered by a −15 dBZ threshold to determine whether there is snowfall from the near surface and top bins. Other auxiliary datasets are used to minimize the errors in the retrievals, including the 2-m temperature of the ECMWF-Auxiliary product [37] and cloud mask data from the Moderate-Resolution Imaging Spectroradiometer (MODIS) [38]. MODIS is part of the A-train, including CloudSat. Retrievals are only performed when the reflectivity meets the threshold (−15 dBZ) and the temperature is <1.5 °C. The 2C-SNOW-PROFILE product provides snowfall estimates only when the melted fraction of precipitation is lower than 0.1. Therefore, the algorithm is only used for dry snowfall. More details about the algorithm have been reported previously [14,15,16,17,39].

2.2. Synoptic CloudSat Snowfall

Previous studies processed the CloudSat data into grid boxes at spatial resolutions less than 1° × 1° latitude/longitude (e.g., 1° × 1.5°, 1° × 2° or 2.5° × 2.5°) [14,17,20,40], and suggest that the snowfall is uniform in each grid. Frezzotti et al. (2004) also suggested that the snowfall is fairly homogeneous for hundreds of square kilometers over the AIS [41]. However, snowfall may be affected by small-scale features in the atmospheric circulation with few topographic changes [23]. Based on repeated experimental results, we searched the CloudSat footprints within a radius of 1.41°, which is the maximum distance in a grid at a resolution of 1° × 1°. If there is at least one footprint of the satellite within 1.41° of an AWS every day (two days), then this suggests that CloudSat can provide daily (two-day) snowfall data for that particular AWS. Such a footprint is the closest footprint to each AWS every time the satellite passes over the grid. The temporal resolution of reconstructed CloudSat snowfall data are not determined by the number of CloudSat measurements per day, but is determined by whether there are measurements every day during a 16-day repeat period. While CloudSat measures up to 82° S, Elaine station is considered because of the search radius (1.41°). The accumulated snowfall data are obtained by multiplying the CloudSat snowfall rate by the corresponding time. For example, if there are three CloudSat observations at 10 am, 1 pm and 8 pm during a day, the three corresponding durations are three, seven and four hours, respectively. The first ten hours of the day (from midnight to 10 am) are not taken into account, because it is difficult to know the exact time when the snowfall occurs.
Figure 1 shows the temporal resolutions of synoptic CloudSat snowfall for different locations. The inland regions have a high temporal resolution with a higher footprint density. Daily measurements provided by CloudSat cover 28% of the area of the AIS, areas with at least a once every two days frequency represent 57% of the AIS, and four-day measurements cover 31% of the AIS. The temporal resolution is lower in the rest of the AIS (~12%). Daily and two-day measurements are distributed to the south of ~71.5° S. Such resolutions can cover almost the entire region of the RIS, the Ronne Ice Shelf, most areas of the East AIS and Marie Byrd Land. The satellite overpasses the regions that have daily or two-day temporal resolutions many times in one day and most of the regions that have a two-day temporal resolution only miss CloudSat snowfall on one or two days during a 16-day repeat period. Therefore, CloudSat could measure daily snowfall over large areas of the AIS. However, some snowfall events are probably missed by CloudSat due to its low temporal sampling.

2.3. AWS Data

Daily and ten-minute snow accumulations are collected at ten AWSs located in the RIS and East AIS (Figure 2). AWS 12 is operated by the Institute for Marine and Atmospheric Research Utrecht, Utrecht University [23], and Dome A and Eagle stations are provided by the Chinese National Antarctic Research Expedition Program. The other seven stations are operated by the Antarctic Meteorological Research Center and the Automatic Weather Station Program, which are sister projects of the United States Antarctic Program [22]. Table 1 shows the location, length of records and elevation for the ten AWSs.
Snow accumulation was measured with an accuracy of 0.01 m by ADGs installed at the AWSs. Clear examples of noise in the AWS snow accumulation were removed, such as some null measurements (e.g., 444) and meaningless measurements that were abnormally large or small. The remaining noise was removed using one standard deviation of a running daily value [25], which allowed the amplitude of the daily snow accumulation to be retained. Snow accumulations at the five stations marked with an asterisk in Table 1 were accumulated to a daily resolution for comparison with the daily CloudSat data and data from the other five stations were accumulated to a two-day resolution (Table 1). Snow accumulation measurements at ten AWSs before April 2011 were used, after which date CloudSat experienced battery problems.

2.4. Reanalysis Data

The fifth generation of the ECMWF climate reanalysis dataset, ERA5, benefits from research conducted in the EU-funded ERA-CLIM and ERA-CLIM2 projects carried out by the ECMWF and its partners. After many years of research and improvements in technology, ERA5 has a higher spatial and temporal resolution (0.25° and hourly), a greater number of vertical levels (137), a new assimilation system (IFS Cycle 41r2) and more assimilated data than the ERA-Interim dataset. These factors improve the input data for the assimilating model and better reflect the observed changes in climate forcing compared with the ERA-Interim dataset [42,43]. ERA5 covers the time period from 1979 to the present day. ERA5 snowfall data in the period January 1979 to December 2018 are used in this study.
Since extreme snowfall events in the reanalysis dataset could make the highest contribution to the total annual precipitation in Antarctica [3,26], they are used to investigate the variability of solid precipitation across the Antarctic continent over a long time span. To differentiate with ESE from CloudSat, extreme snowfall events from ERA5 are defined as EPEs. EPEs are identified as the top 10% of all daily snowfall events in every year on the basis of existing research results and methods [3,7,26]. Seasons are defined as follows: Summer, December–February; autumn, March–May; winter, June–August; and spring, September–November [23].
Blowing snow has an important role in snow accumulation [44]. A previous study suggests that blowing snow can be detected using ceilometers, but the ten stations in this study do not have ceilometer measurements. Thus, to assess the influence of wind, continuous wind measurements are needed. However, wind data are sparse in the AIS. Therefore, the wind speed and direction data from ERA5 are used as auxiliary data to evaluate the connections between in-situ observations from the AWSs and the amount of snowfall from CloudSat and ERA5.

3. Results

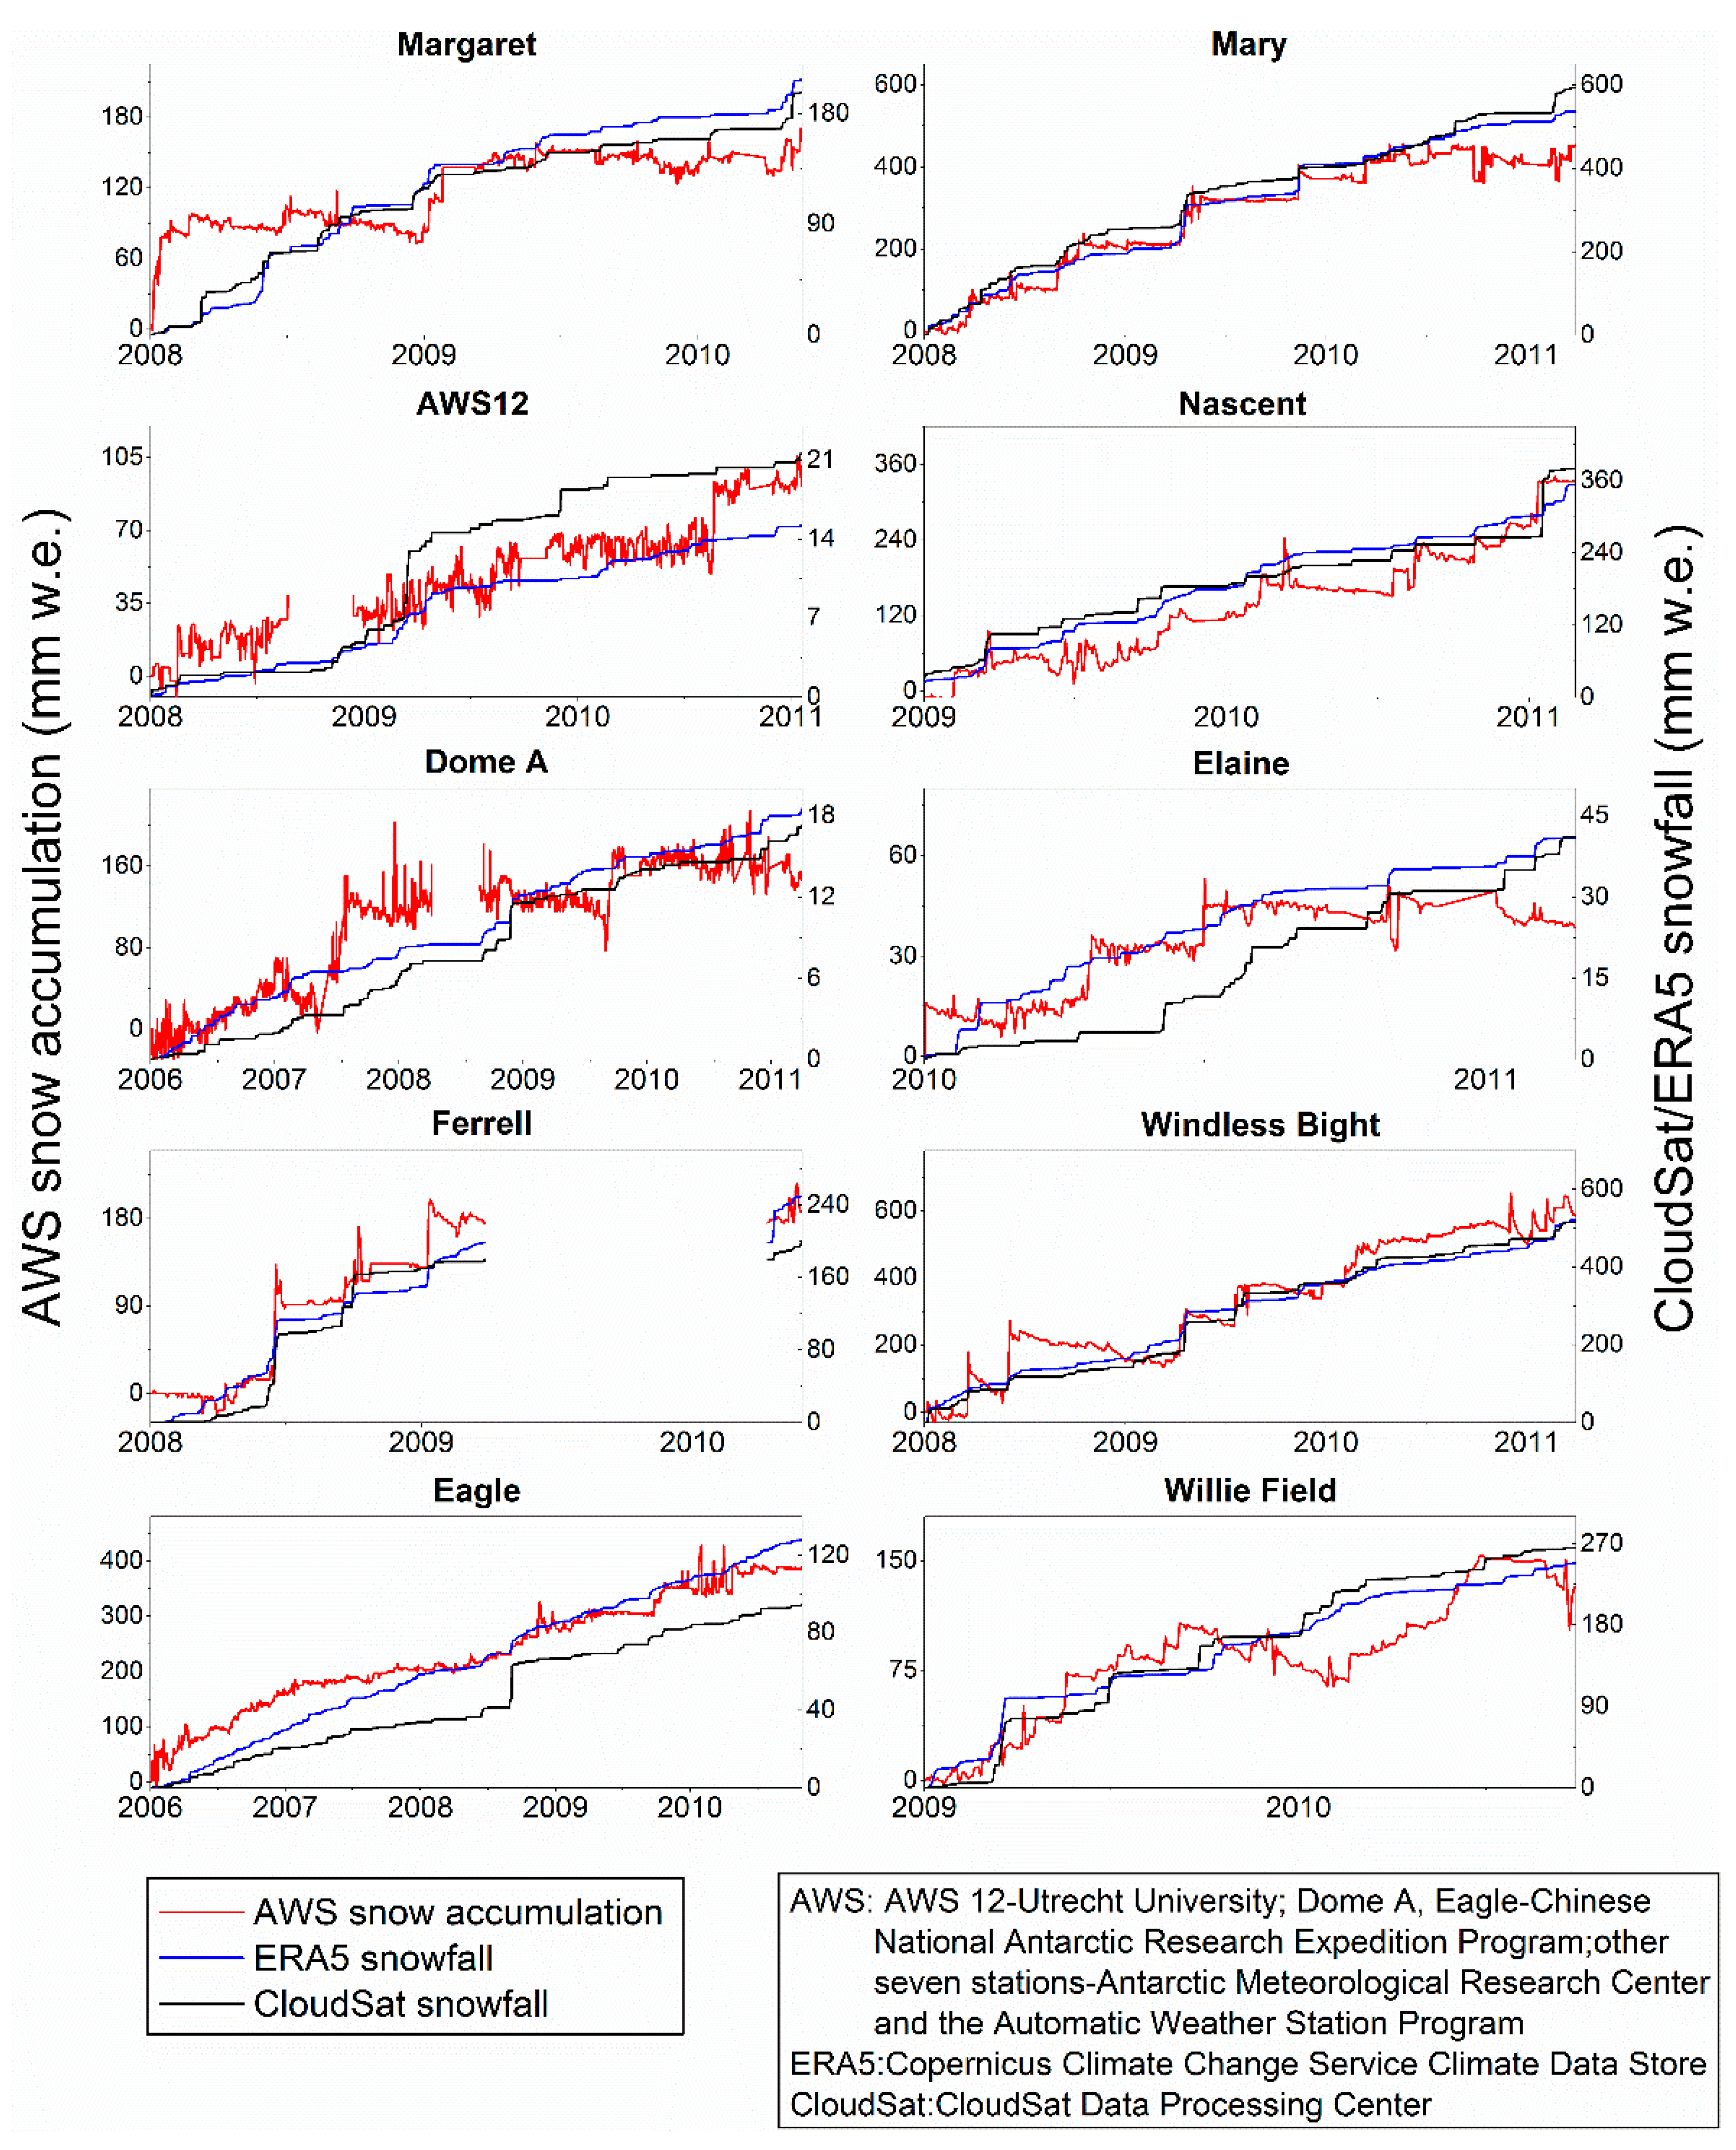
3.1. Time Series of Snowfall and Snow Accumulation

Figure 3 shows cumulative daily snowfall from CloudSat and the ERA5 dataset, and the daily snow accumulation from the ten AWSs from 2006 to 2011 (time coverage varies between stations). Snowfall and snow accumulation are the cumulative sum since the start of the period and not absolute values. For an approximate comparison of the magnitudes of snow accumulation and CloudSat snowfall, the unit of snow accumulation was converted based on a snow density. Since fluctuations in the snow density were large, an average surface snowpack density of 350 kg m−3 was used [25,45]. Three stations (AWS12, Dome A and Ferrell) had large gaps in measurements, due to the reinstallation of the AWSs and data transmission problems.
All the AWSs showed positive snow accumulation during the observation period. Negative accumulations frequently occurred at each station due to blowing snow, ablation, compaction or sublimation, whereas only positive changes occurred in snowfall due to the exclusion of these processes. A lower annual accumulation (<31 mm water equivalent (w. e.)) and snowfall (<18 mm w. e.) occurred at Dome A and AWS12, which are located on the Antarctic Plateau. The snow accumulation was less than the snowfall at the coastal stations except Ferrell. The difference between the magnitudes of snowfall and snow accumulation may be larger because the density (350 kg m−3) used in this study is larger than then density of freshly fallen snow (70–120 kg m−3) or wind-redistributed snow (250 kg m−3) [25]. While the differences in magnitude were larger at the inland stations, the trends of cumulative snow accumulation broadly agreed with the snowfall and larger accumulation events in the measurements corresponding with larger snowfall events at all stations. Agreement between large snowfall and snow accumulation events has also been shown at the Princess Elisabeth station [4,5]. The total annual precipitation and snow accumulation amount were influenced by these large events. The difference between daily snow accumulation and daily snowfall was obviously due to the influence of wind. During snowfall events, there may be a decrease in SMB. In addition, wind can also lead to mass gain and loss without any snowfall. The same results are shown in the previous studies [4,5].
The magnitude of CloudSat snowfall was similar to ERA5 snowfall at all stations. The daily changes in CloudSat snowfall were almost identical to the changes in ERA5 snowfall. Table 2 presents the mean absolute error (MAE), root mean square error (RMSE), mean bias (MB), percentage deviation (PD) and average CloudSat and ERA5 snowfall (SF-C and SF-E). The periods in which both CloudSat and ERA5 measure 0 precipitation are not included in the calculation of MAE and RMSE. Mean MAE at all stations was <1.9 mm day−1 and the mean RMSE was less than 3.9 mm day−1 at ten AWSs. MAEs and RMSEs were lower at the inland stations (Dome A and AWS12). RMSEs were >6 mm/day at two stations (Ferrell and Nascent). Mean MB was <14.2 mm year−1 at all stations, and was <6 mm year−1 at six stations. The absolute values of percentage deviation (PD) between CloudSat and ERA5 snowfall were less than 10% at seven of ten stations, except for AWS12 (−29.2%), Ferrell (26%) and Eagle (35.3%). The positive value of PD indicates that average annual ERA5 snowfall is larger than CloudSat snowfall.
For further evaluation of the difference between the three datasets, Figure 4 plots the size of coincident events and correlations between different events for each station. Correlation coefficients (r values) are shown for the relationships between CloudSat and ERA5 snowfall events, and CloudSat snowfall and AWS positive accumulation events at the 99% significance level. The correlations that are not significant (<90% significance level) are not shown in Figure 4. Coincident events mean that CloudSat snowfall events occurred accompanied by ERA5 snowfall events or AWS positive accumulation events. CloudSat had significant relationships with ERA5 at seven of ten stations, excepting AWS12, Elaine and Nascent. The r values varied between 0.37 and 0.71, indicating that most snowfall events could be accurately represented by ERA5. Only at two stations (Ferrell and Windless Bight), CloudSat snowfall events had significant relationships with AWS accumulation events. Most large accumulation events corresponded to smaller snowfall events, probably due to the complex effects of wind.

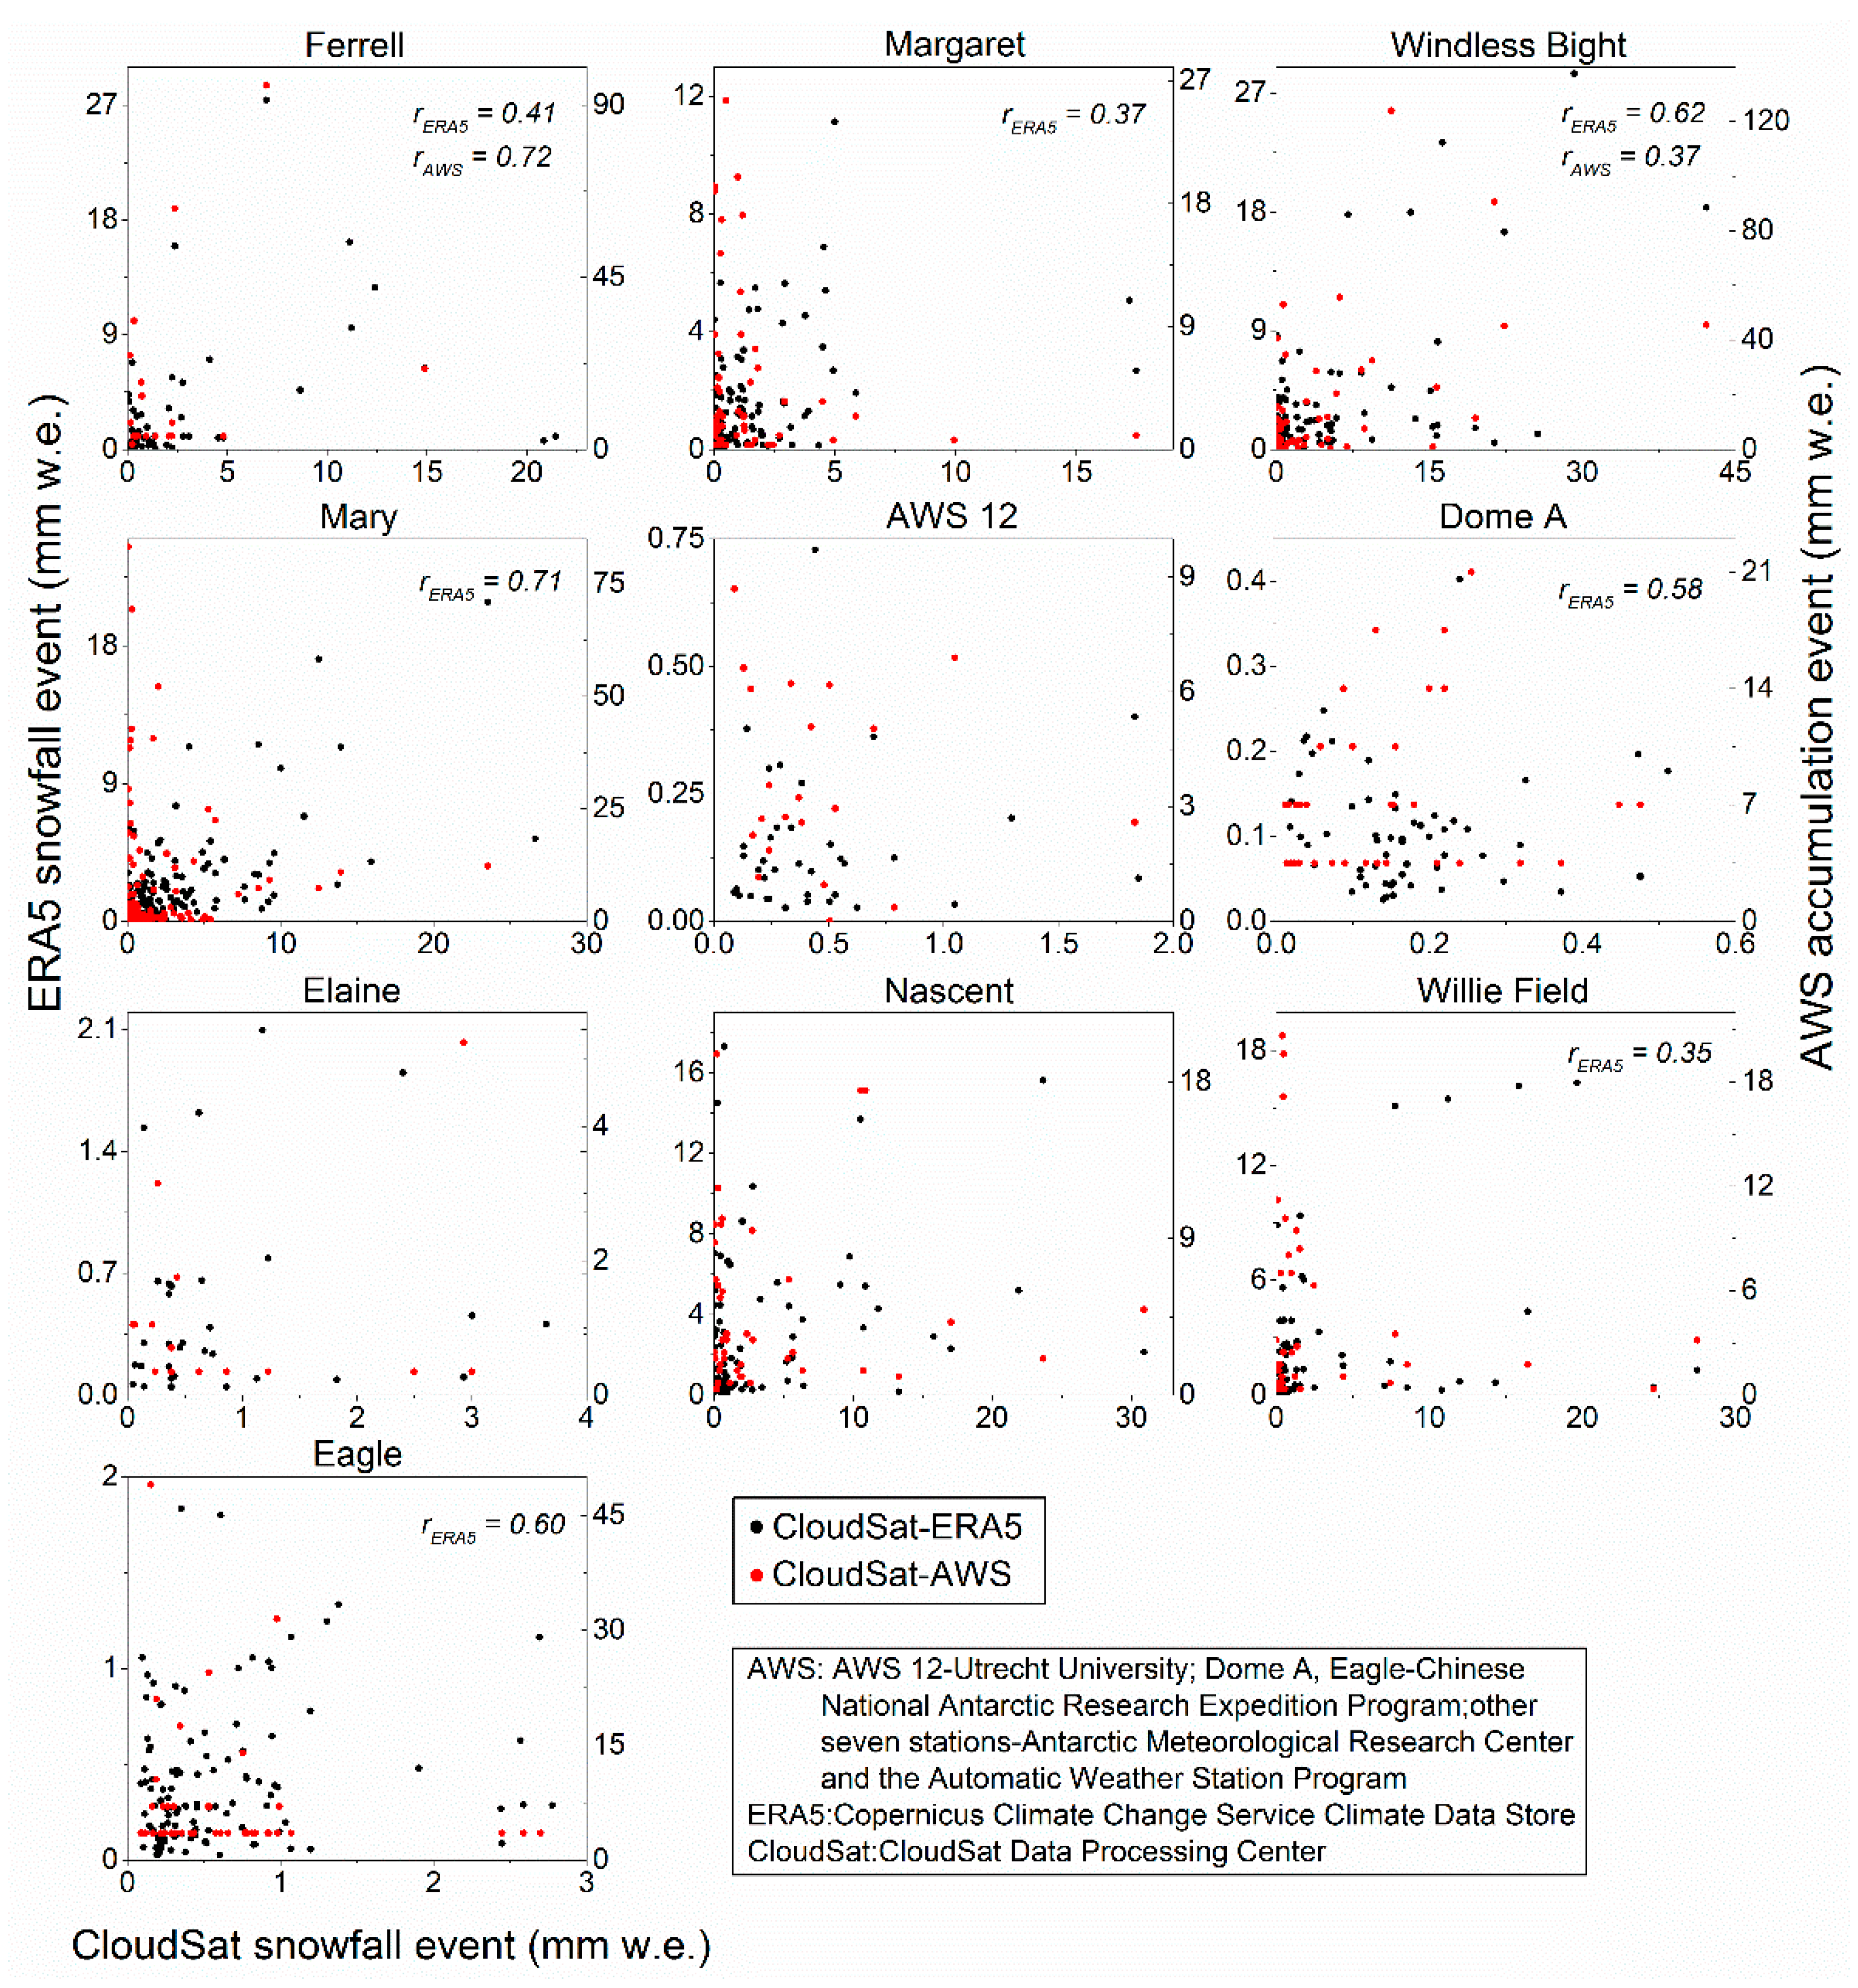
3.2. Synoptic Comparison between Extreme Events

Extreme snowfall events dominate the SMB, even if they are rare during the process of mass gain [3,26]. It is therefore necessary to analyze these extreme events. Extreme snowfall events (ESEs) are defined as the largest 10% of daily snowfall events. Analogous to the definition of ESEs, extreme snow accumulation events (EAEs) have also been identified. Table 3 shows the average and maximum wind speed and the mean wind direction for the entire time series and for periods with extreme events at ten stations. The wind direction begins from the south in a clockwise direction from 0° to 360°. The stations located on the RIS, except for Nascent, had lower wind speeds than the three stations (AWS12, Dome A and Eagle) located on the plateau. The average and maximum wind speeds were higher than usual at all stations when ESEs occurred. The maximum wind speed in >70% of the ESEs was larger than usual at seven of the ten AWSs, excepting AWS 12, Eagle and Willie Field (>60%). It is suggested that the ESEs were generally accompanied by stronger winds. The mean wind directions indicated that most of positive ESE stations were caused by stronger winds from the ocean.
The EAEs and ESEs were not completely coincident, mainly as a result of the complex influence of winds. The wind conditions were examined when EAEs occurred without snowfall (Table 4). The average wind speed was not high when only EAEs occurred, but the maximum wind speed was larger than usual. The EAEs were therefore probably caused by stronger winds. While influenced by stronger winds, <26.7% of EAEs did not correspond to snowfall at all stations, except for Mary and AWS12 (~53%). Apart from the impact of wind, the difference between EAEs and ESEs could be a result of missing measurements from the satellite or by noise in the AWS snow accumulation.
Table 5 shows the capture rate of ESEs in the ERA5 datasets. When the extreme events from CloudSat and ERA5 occurred on the same date, this suggested that the ESEs were captured by the EPEs. More than 56% of the ESEs were captured by ERA5 at all stations. These capture rates (56–88%) are higher than the capture rates of ERA-Interim in the previous studies [25,26]. While the CloudSat data have not been assimilated in ERA5, there is a high degree of consistency across the CloudSat and ERA5 data. Table 5 also shows the capture rate of CloudSat for EPEs at ten stations. Capture rates of CloudSat were lower than ERA5 and varied between 23.7% and 57.8% because ERA5 had more EPE events than CloudSat. Capture rates of CloudSat were relatively lower at the inland stations (AWS12, Eagle, Elaine and Dome A), suggesting that ERA5 has more slight snowfall events over these inland regions of the AIS.

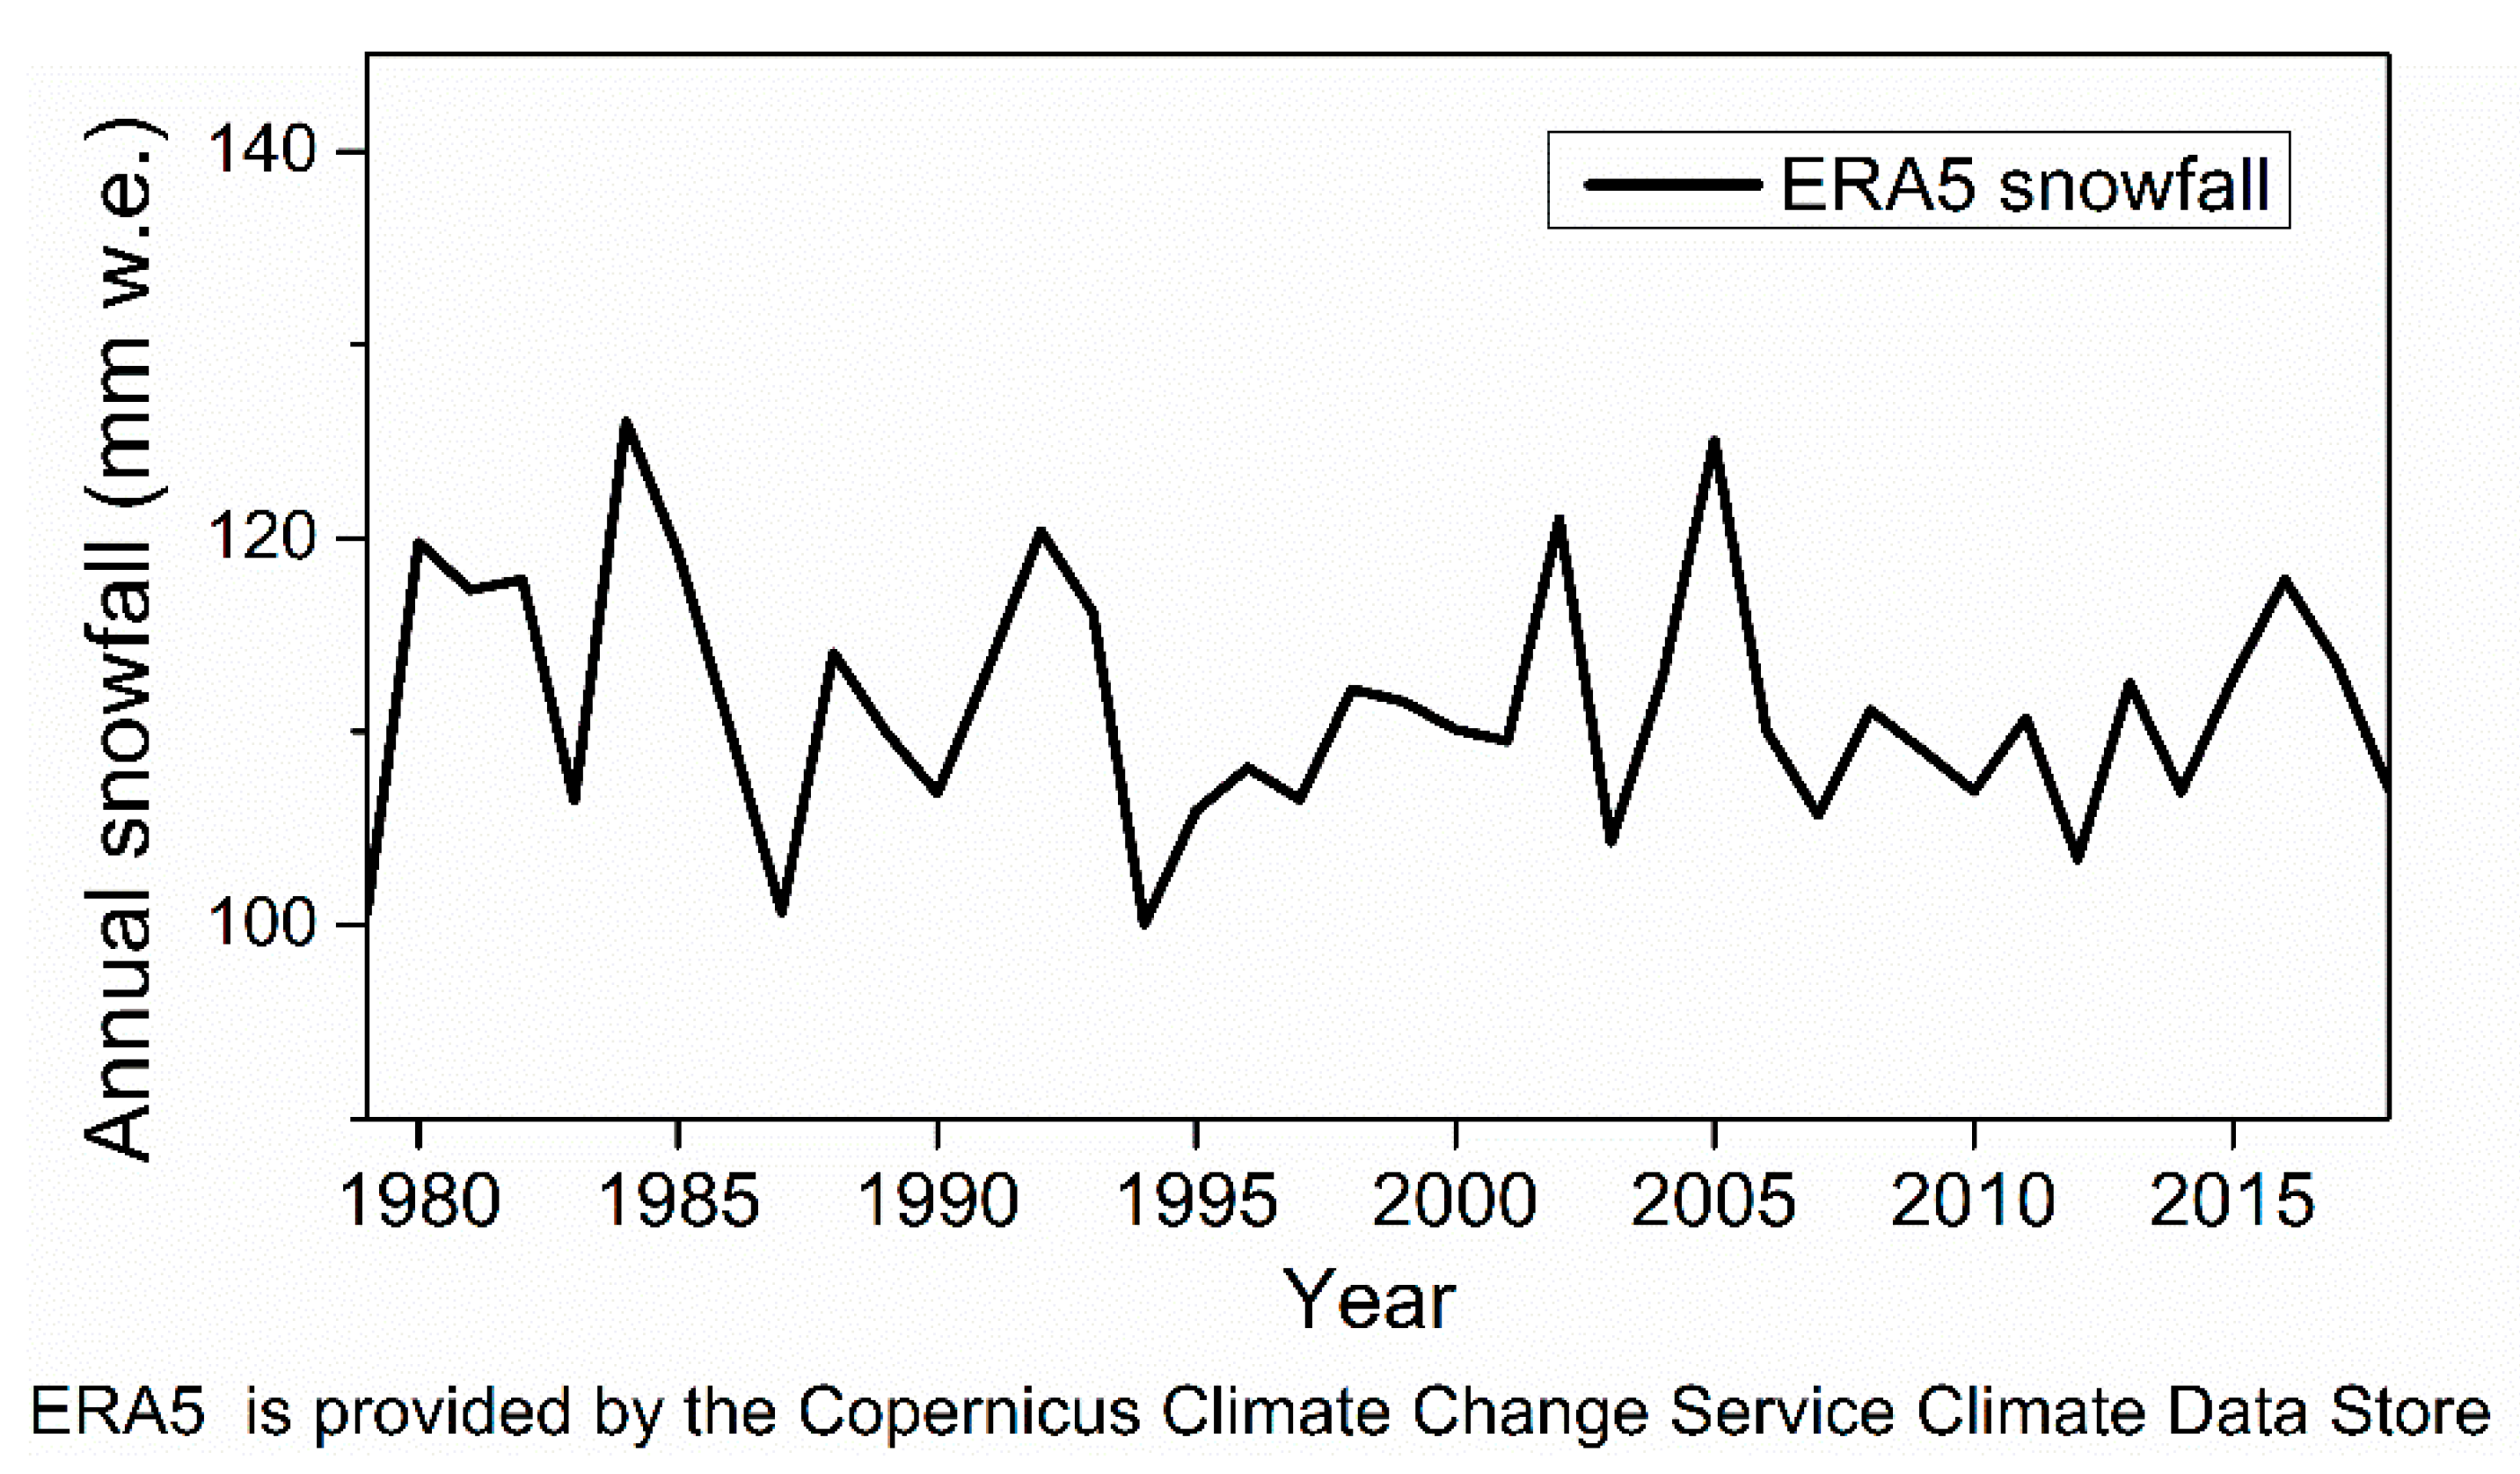
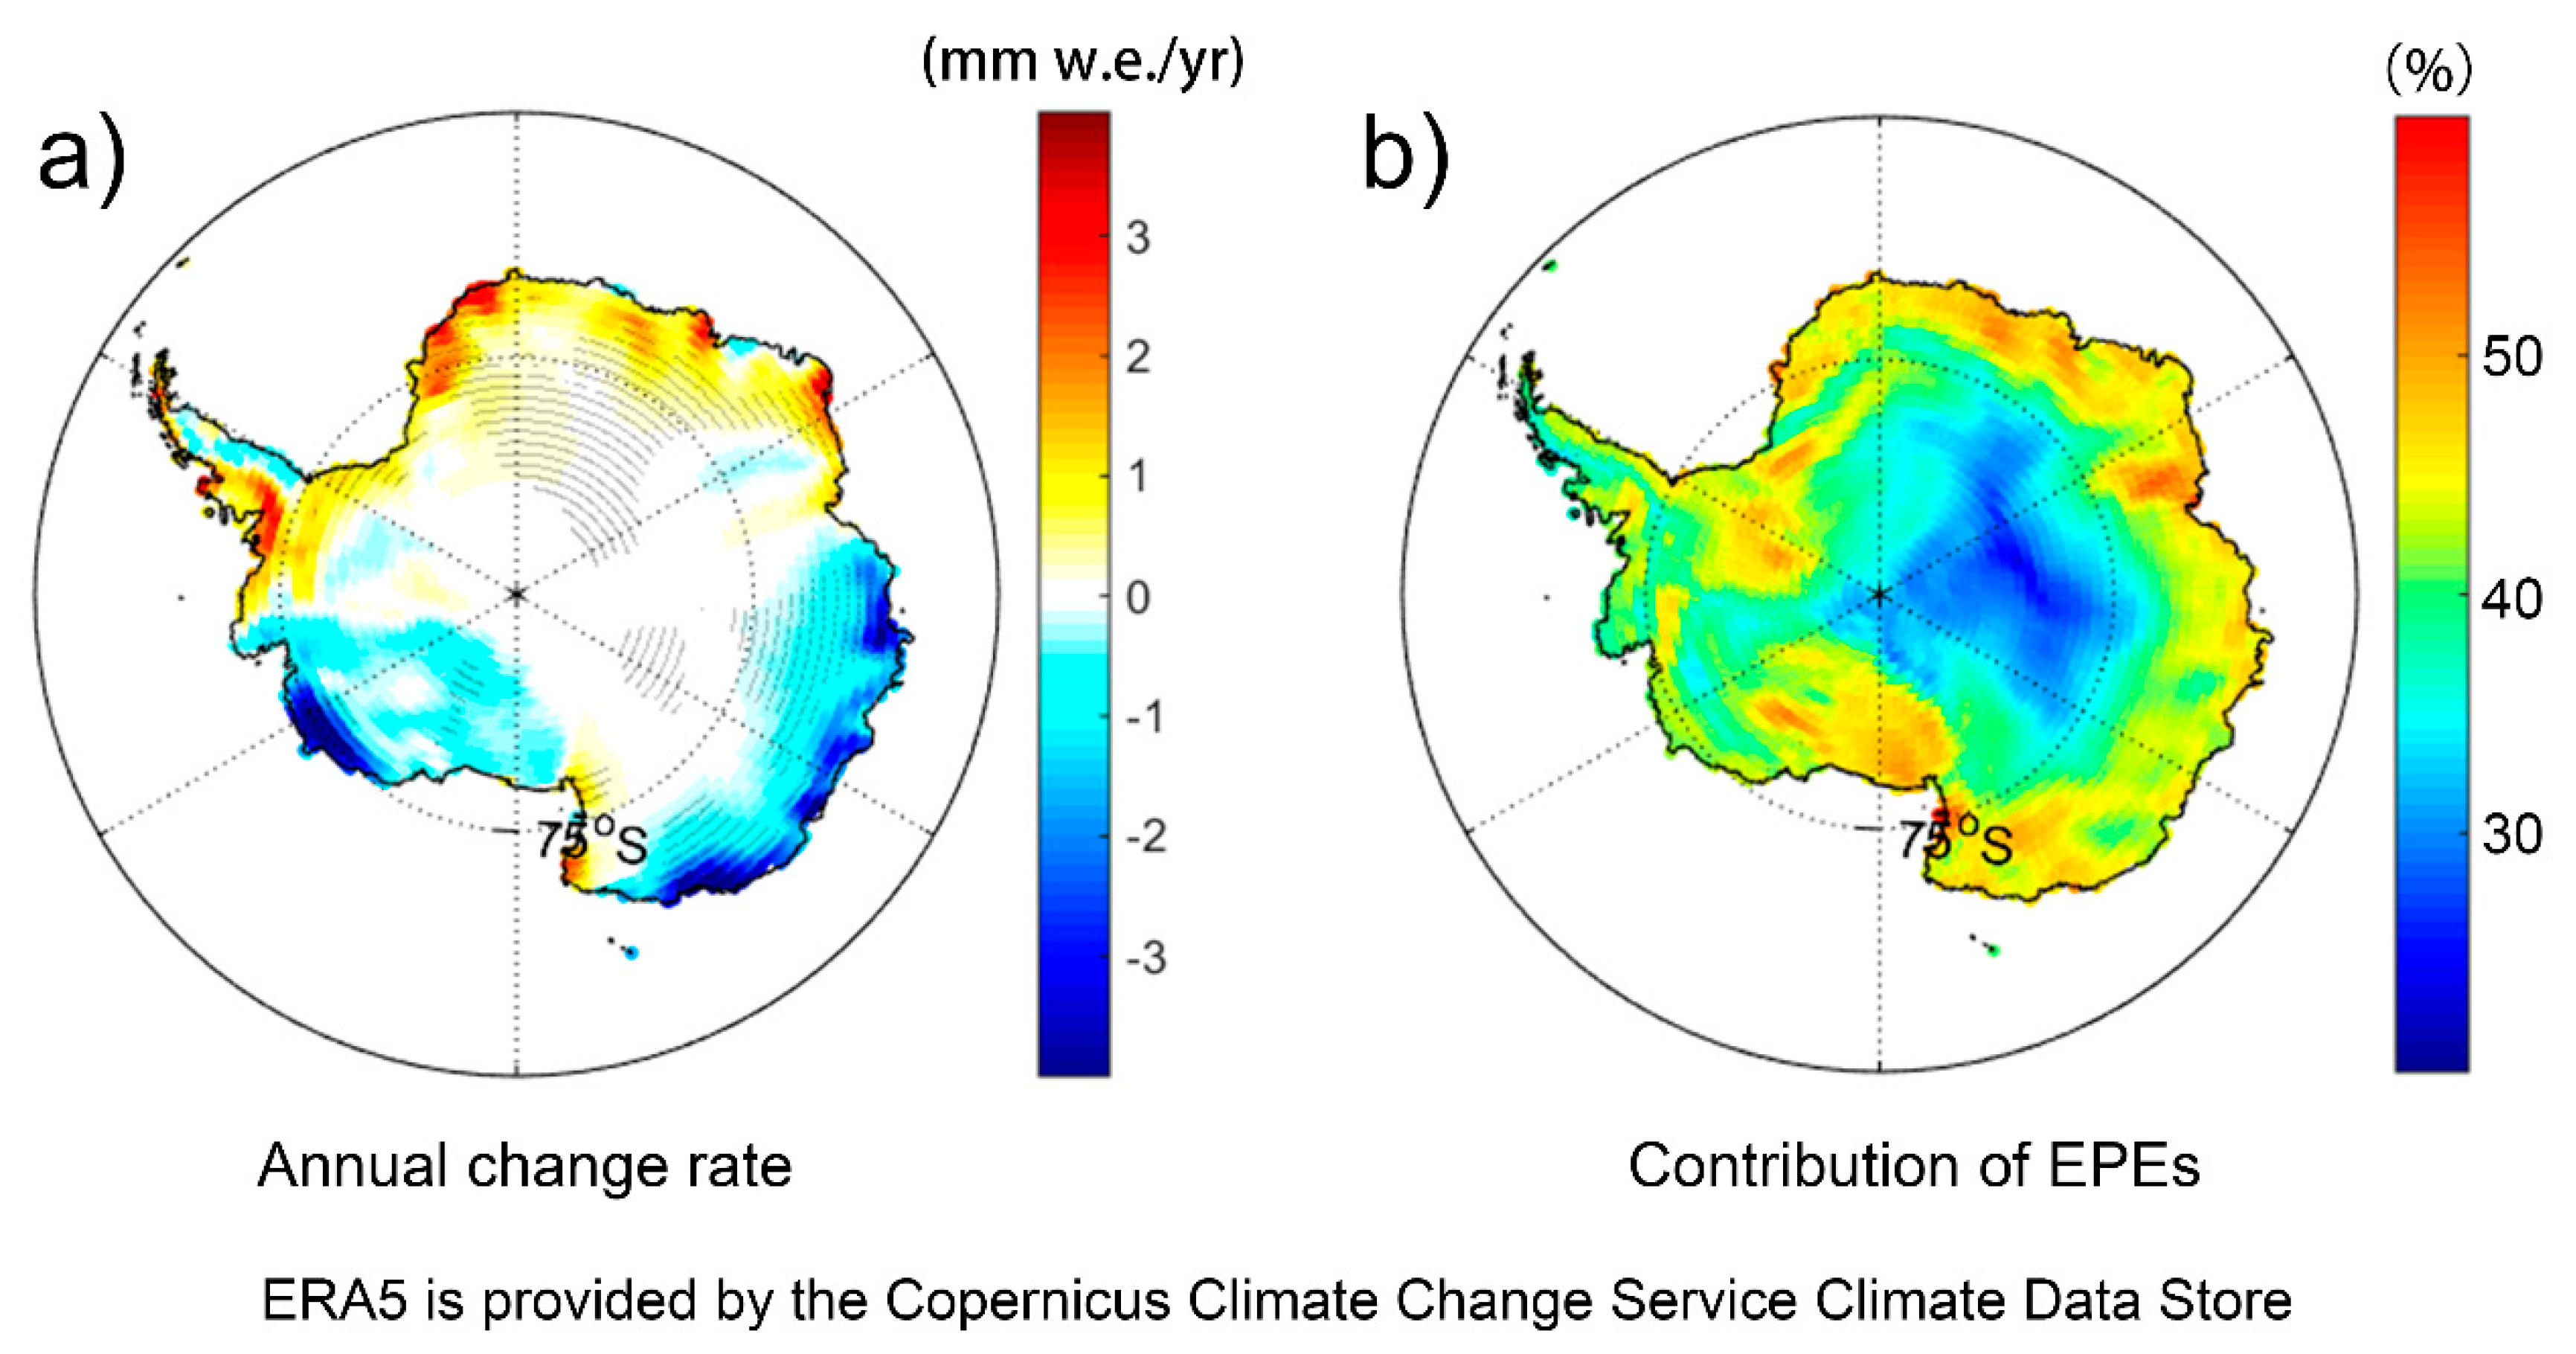
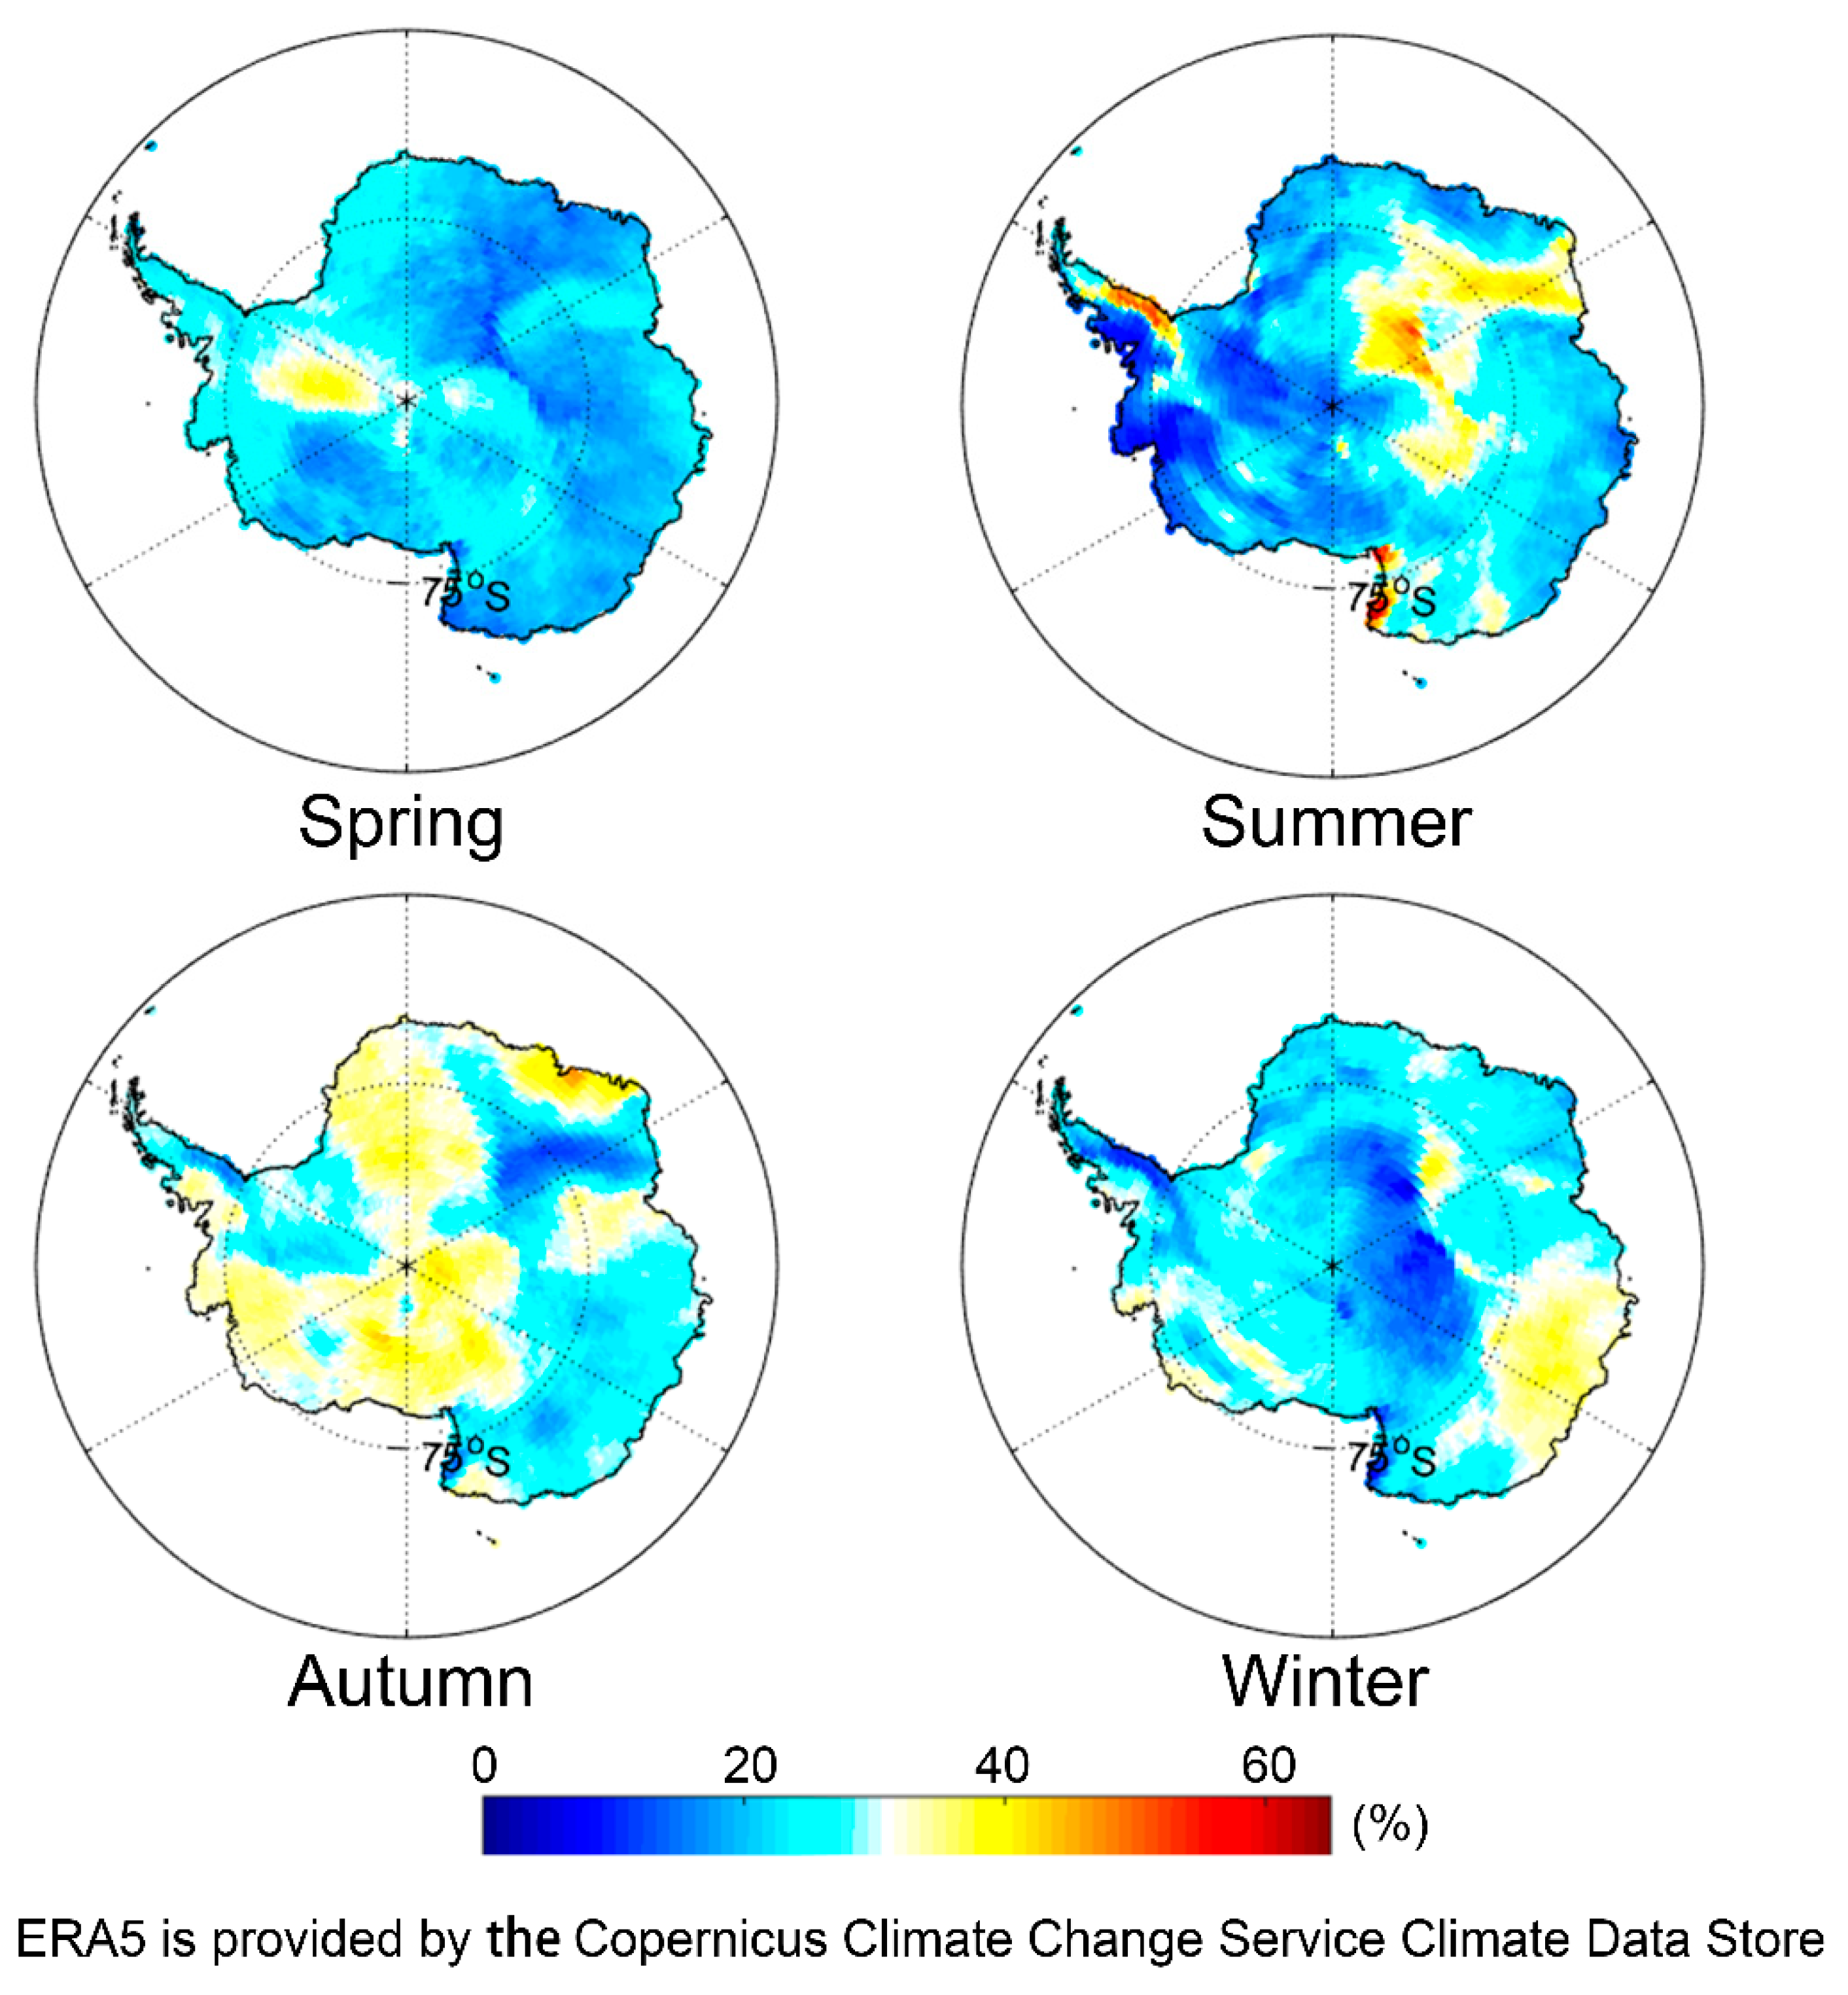
3.3. Snowfall over the AIS

Based on many enhancements and a large amount of assimilated data, the accuracy and temporal resolution of the ERA5 simulations have been improved. The spatial resolution (31 km) of ERA5 is similar to that of RACMO2 (27 km), which has been used to analyze EPEs in the AIS during the time period 1979–2016 [3]. However, ERA5 will publish a longer time series of reanalysis products since 1950 and will be updated daily in the future, when it will become the most important reanalysis dataset. ERA5 snowfall data were therefore used to evaluate the changes in Antarctic snowfall and the distribution of EPEs from 1979 to 2018.
Figure 5 shows the time series of annual snowfall over the entire AIS, including the Antarctic continent and ice shelves. There is no significant increasing or decreasing trend in total snowfall for the entire AIS. The fluctuations in annual snowfall suggest that there was a large inter-annual variability in snowfall. The minimum amount of snowfall occurred in 1994 and smaller annual snowfall events also occurred in 1987, 2001, 2007 and 2014. This annual snowfall enhanced the inter-annual variability and showed a periodicity with a cycle of six or seven years.
The change rates in annual snowfall varied between different regions of the AIS (Figure 6a). Change rates in the regions marked by dots were significant at the 90% level. Significant changes in annual snowfall were mainly distributed in the East AIS. Snowfall showed a clear increase on the coast of Dronning Maud Land (DML) and decreasing trends on Wilkes Land. The changes in annual snowfall were insignificant on the Antarctic Inland Plateau. The West AIS had a larger inter-annual snowfall on the west coast of Marie Byrd Land. The number of positive change rates was almost the same as the number of negative change rates. The opposite change rates were roughly bounded by longitudes 70° E and 80° W.
Figure 6b shows the contribution of EPEs to the annual snowfall. This result quantifies the importance of EPEs across the entire AIS. The EPEs contributed, on average, >38% of the annual snowfall over the entire AIS and in some areas >50%, e.g., on the RIS, Amery Ice Shelf, Ronne Ice Shelf and coastal regions of DML. The high elevation of the Antarctic Plateau stops the penetration of moist air from the ocean. The contributions of EPEs were less important in this region and the annual snowfall was likely influenced by clear-sky precipitation.
The EPEs mainly occurred in the autumn over most regions of the AIS (>60%), e.g., on the RIS, Marie Byrd Land and the west of DML (Figure 7). Wilkes Land had more EPEs in winter. In summer, EPEs were mainly distributed in the region from the Amery Ice Shelf to Dome A. Fewer EPEs occurred in summer, probably due to less cyclonic activity. Fewer cyclones led to fewer EPEs and reduced the influence of EPEs at the coast [3]. However, EPEs probably had a stronger influence over the coast of the Antarctic Peninsula and Victoria Land in summer. These results indicate that regional differences in snowfall are very large in Antarctica. To acquire more accurately simulated snowfall, models require a higher spatial resolution and the assimilation of more local parameters.

4. Conclusions and Discussion

CloudSat can provide vital data to improve our understanding of snowfall on the AIS, where ground observations are difficult to widely perform [14,17,18,20,24]. This study aimed to construct synoptic CloudSat snowfall for the AIS. These data are important for the interpretation of ice cores and Antarctic mass balance. In-situ observations from ten AWSs and wind data from the ERA5 dataset were used to examine synoptic CloudSat snowfall from the AIS. CloudSat snowfall data were also used to evaluate the performance of snowfall from the ERA5 dataset at a synoptic timescale.
Synoptic CloudSat snowfall data were constructed based on the frequency of footprints within a certain range of locations from June 2006 to March 2011. In total, 28 and 29% of the AIS could be covered by synoptic CloudSat snowfall at daily and two-day resolutions, respectively. Such CloudSat snowfall covered the entire RIS, Ronne Ice Shelf, almost all of Marie Byrd Land and most areas of the East AIS. The satellite overpassed these regions several times each day and only missed measurements on one or two days during a 16-day repeat period. Therefore, CloudSat can be used to provide a database of snowfall observations at a synoptic timescale in these regions of the AIS. However, few studies have used CloudSat data to analyze real snowfall on the AIS, where snowfall data are valuable and difficult to measure directly [20].
The daily CloudSat snowfall showed similar trends with snow accumulation at each station, but some of the EAEs did not correspond to ESEs. The impact of wind could not be ignored. The wind speed was higher than usual when >70% of ESEs occurred. The maximum wind speed was higher when EAEs occurred without snowfall. Caution should be observed when using such EAEs, which were probably caused by blowing snow. Nevertheless, on average, >73.3% of the EAEs corresponded to snowfall for eight of the AWSs. This suggests that the CloudSat snowfall could be used at a synoptic timescale.
The wind speed was higher when ESEs occurred, because snowfall is associated with cyclones, which can transport moist air from the ocean to the AIS. Previous studies also suggest that snowfall events were generally influenced by stronger wind originating from oceanic areas [5,46]. ESEs could lead to positive and negative snow accumulation. The difference in the result of snowfall was probably caused by the duration of snowfall events and the temporal cloud extent. Snowfall events lasting longer have a higher chance of resulting in positive accumulation [5]. In addition, the results of snowfall may be influenced by wind direction. Katabatic winds have higher wind speed and are dry, containing fewer snow particles. When there are katabatic winds from high altitude regions, snowfall may not lead to positive snow accumulation; winds may lead to negative accumulation without snowfall.
Measurement errors and clear-sky precipitation also lead to differences between the EAEs and ESEs—for example, snowfall events may have occurred before or after the daily overpass of CloudSat, noise may have occurred in the ADG measurements and clear-sky precipitation (diamond dust) may contribute to the snow accumulation on the Antarctic Plateau [6]. In addition, the uncertainty on CloudSat snowfall retrievals was between 1.5 and more than twice the snowfall rate in the 2C-SNOW-PROFILE product [14,47]. When synoptic CloudSat snowfall data were produced based on a large number of observations, this uncertainty significantly decreased. However, when all CloudSat snowfall observations were used for creating a daily database, this uncertainty was still very large. Another source of uncertainty in the CloudSat snowfall is the influence of ground clutter in the near-surface bin. Since the snowfall rate is assessed from the fifth bin above the surface, the snowfall rate can be overestimated or underestimated compared to the snowfall rate at the surface [48]. While recent studies compared CloudSat snowfall retrievals with ground-based radar observations and were encouraging for the reliability of CloudSat snowfall observations [18,48], these studies probably cannot be extrapolated to the entire Antarctic Ice Sheet due to the differences in snow microphysics between the different regions of the AIS. The reliability of synoptic CloudSat snowfall data has only been proven at ten stations in this study. Further research is needed to evaluate the reliability and uncertainty of synoptic CloudSat snowfall over other regions of the AIS based on ground-based observations.
The cumulative CloudSat snowfall and ERA5 snowfall had the same magnitude. The differences between them were relatively small on a daily basis. Mean MAEs and RMSEs were <3.9 mm/day at ten stations. Overall, 56–88% of the ESEs were captured by the ERA5 data at all stations. More extreme events were captured by the ERA5 than ERA-Interim in previous studies [25,26], probably due to the use of real snowfall events and the improvement of ERA5. This indicates that ERA5 can be used to represent actual snowfall events on the AIS at a synoptic timescale and it is important to use real snowfall to evaluate the performance of reanalysis datasets. There are still large uncertainties in ERA5—both due to the high bias in total accumulation compared to CloudSat snowfall and since, for 7 out of 10 AWSs, more than 30% of events are not captured. CloudSat data have not been assimilated in the ERA5 data and the ERA5 dataset does not assimilate other Antarctic precipitation/snowfall data. Agreement between the CloudSat snowfall and the ERA5 snowfall improves the reliability of both datasets at the ten stations at a synoptic timescale.
While the observing period (2006–2011) in this study was fairly short and not much longer than the previous studies, CloudSat provided valuable, directly measured snowfall and a unique daily database of CloudSat snowfall observations for the AIS at a synoptic timescale. Previous studies only used the limited time coverage of the CloudSat data from 2006 to 2011, because it is generally accepted that CloudSat only provides observations during daytime since battery problems occur. However, the team of CloudSat decided to save power and transmit only during certain hours and locations. Thus, the satellite still runs at night over some regions. Further research is needed to determine the location and timing of CloudSat snowfall for the AIS since April 2011.
Changes in snowfall over the AIS were examined at annual and synoptic timescales from 1979 to 2018 based on the ERA5 snowfall. The inter-annual variability in snowfall increased and the fluctuations showed a periodicity with a six- or seven-year cycle. This cycle is close to that of the El Niño Southern Oscillation (ENSO), but a previous study has shown that the relationship between them is non-linear [49]. The Southern Annular Mode (SAM) has been used to illustrate the variability of the climate in the Southern Ocean based on actual or simulated pressure anomalies [50]. The details of SAM are described on the website (http://www.nerc-bas.ac.uk/icd/gjma/). Larger fluctuations in annual snowfall correspond to the higher values of the SAM, which have been increasing since 1970. In addition, most EPEs occurred in autumn in stronger SAM phases. However, changes in the SAM are currently rapid and unpredictable. The trends in the SAM and ENSO and the corresponding changes in Antarctic snowfall require further study. In addition, EPEs at the ten stations may be associated with atmospheric rivers, which have been proved to affect large snowfall events at the Princess Elisabeth station [51]. Atmospheric rivers are long and narrow corridors of intense water vapor transport, and can lead to heavy rainfall/snowfall [52]. It is necessary to evaluate the connection between atmospheric rivers and extreme snowfall events at more stations over the AIS. These studies are important for the correct interpretation of ice cores and implications for future SMB changes.

Author Contributions

Y.L. wrote the original draft of the manuscript. W.H., J.-P.B. and Y.W. reviewed and edited the draft. F.L. acquired funding.

Funding

This research was funded by the National Key R&D Program of China (grant number 2017YFA0603104), the Strategic Priority Research Program of the Chinese Academy of Sciences (XAD19070103) and the Natural Science Foundation of China (grant number 41574004, 41531069).

Acknowledgments

We thank three anonymous reviewers and editors for their valuable comments and suggestions. The authors appreciate the use of AWS data provided by the Institute for Marine and Atmospheric Research Utrecht, Utrecht University, and the Antarctic Meteorological Research Center and Automatic Weather Station program; the use of the ERA5 data provided by the European Centre for Medium-Range Weather Forecasts and Copernicus Climate Change Service Climate Data Store. CloudSat data were obtained from the CloudSat Data Processing Center (http://www.cloudsat.cira.colostate.edu).

Conflicts of Interest

The authors declare no conflict of interest.

References

  1. Forsberg, R.; Sørensen, L.; Simonsen, S. Greenland and Antarctica Ice Sheet Mass Changes and Effects on Global Sea Level. Surv. Geophys. 2017, 38, 89–104. [Google Scholar] [CrossRef] [Green Version]
  2. Wouters, B.; Bamber, J.L.; van den Broeke, M.R.; Lenaerts, J.T.M.; Sasgen, I. Limits in detecting acceleration of ice sheet mass loss due to climate variability. Nat. Geosci. 2013, 6, 613–616. [Google Scholar] [CrossRef]
  3. Turner, J.; Phillips, T.; Thamban, M.; Rahaman, W.; Marshall, G.J.; Wille, J.D.; Favier, V.; Winton, V.H.; Thomas, E.; Wang, Z.; et al. The dominant role of extreme precipitation events in Antarctic snowfall variability. Geophys. Res. Lett. 2019, 46. [Google Scholar] [CrossRef]
  4. Gorodetskaya, I.V.; Kneifel, S.; Maahn, M.; Van Tricht, K.; Thiery, W.; Schween, J.H.; Mangold, A.; Crewell, S.; van Lipzig, N.P.M. Cloud and precipitation properties from ground-based remote-sensing instruments in East Antarctica. Cryosphere 2015, 9, 285–304. [Google Scholar] [CrossRef] [Green Version]
  5. Souverijns, N.; Gossart, A.; Gorodetskaya, I.V.; Lhermitte, S.; Mangold, A.; Laffineur, Q.; Delcloo, A.; Van Lipzig, N.P.M. How does the ice sheet surface mass balance relate to snowfall? Insights from a ground-based precipitation radar in East Antarctica. Cryosphere 2018, 12, 1987–2003. [Google Scholar] [CrossRef] [Green Version]
  6. Bromwich, D.H. Snowfall in high southern latitudes. Rev. Geophys. 1988, 26, 149–168. [Google Scholar] [CrossRef] [Green Version]
  7. Lawson, R.P.; Baker, B.A.; Zmarzly, P.; O’Connor, D.C.; Mo, Q.; Gayet, J.F.; Shcherbakov, V. Microphysical and optical properties of atmospheric ice crystals at south pole station. J. Appl. Meteorol. Clim. 2006, 45, 1505–1524. [Google Scholar] [CrossRef]
  8. Walden, V.P.; Warren, S.; Tuttle, E. Atmospheric ice crystals over the Antarctic Plateau in winter. J. Appl. Meteorol. Clim. 2003, 42, 1391–1405. [Google Scholar] [CrossRef]
  9. Stephens, G.L.; Vane, D.G.; Tanelli, S.; Im, E.; Durden, S.; Rokey, M.; Reinke, D.; Partain, P.; Mace, G.G.; Austin, R.; et al. CloudSat mission: Performance and early science after the first year of operation. J. Geophys. Res.-Atmos. 2008, 113. [Google Scholar] [CrossRef]
  10. Liu, G. Deriving snow cloud characteristics from CloudSat observations. J. Geophys. Res. 2008, 113. [Google Scholar] [CrossRef] [Green Version]
  11. Casella, D.; Panegrossi, G.; Sanò, P.; Marra, A.C.; Dietrich, S.; Johnson, B.T.; Kulie, M.S. Evaluation of the GPM-DPR snowfall detection capability: Comparison with CloudSat-CPR. Atmos. Res. 2017, 197, 64–75. [Google Scholar] [CrossRef]
  12. Wood, N.B. Estimation of Snow Microphysical Properties with Application to Millimeter-Wavelength Radar Retrievals for Snowfall Rate. Ph.D. Thesis, Colorado State University, Fort Collins, CO, USA, 2011. [Google Scholar]
  13. Boening, C.; Lebsock, M.; Landerer, F.; Stephens, G. Snowfall-driven mass change on the East Antarctic Ice Sheet. Geophys. Res. Lett. 2012, 39. [Google Scholar] [CrossRef]
  14. Palerme, C.; Kay, J.E.; Genthon, C.; L’Ecuyer, T.; Wood, N.B.; Claud, C. How much snow falls on the Antarctic ice sheet? Cryosphere 2014, 8, 1577–1587. [Google Scholar] [CrossRef] [Green Version]
  15. Kulie, M.S.; Milani, L.; Wood, N.B.; Tushaus, S.; Bennartz, R.; L’Ecuyer, T.S. A shallow cumuliform snowfall census using spaceborne radar. J. Hydrometeorol. 2016, 17, 1261–1279. [Google Scholar] [CrossRef]
  16. Kulie, M.S.; Milani, L. Seasonal variability of shallow cumuliform snowfall: A CloudSat perspective. Q. J. R. Meteorol. Soc. 2018, 144. [Google Scholar] [CrossRef]
  17. Milani, L.; Kulie, M.S.; Daniele, C.; Stefano, D.; L’Ecuyer Tristan, S.; Giulia, P. CloudSat snowfall estimates over antarctica and the southern ocean: An assessment of independent retrieval methodologies and multi-year snowfall analysis. Atmos. Res. 2018, 213, 121–135. [Google Scholar] [CrossRef]
  18. Lemonnier, F.; Madeleine, J.-B.; Claud, C.; Genthon, C.; Durán-Alarcón, C.; Palerme, C.; Berne, A.; Souverijns, N.; Lipzig, N.; Gorodetskaya, I.V.; et al. Evaluation of CloudSat snowfall rate profiles by a comparison with in-situ micro rain radars observations in East Antarctica. Cryosphere 2019, 13, 943–954. [Google Scholar] [CrossRef]
  19. Souverijns, N.; Gossart, A.; Lhermitte, S.; Gorodetskaya, I.V.; Grazioli, J.; Berne, A.; Duran-Alarcon, C.; Boudevillain, B.; Genthon, C.; Scarchilli, C.; et al. Evaluation of the CloudSat surface snowfall product over Antarctica using ground-based precipitation radars. Cryosphere 2018, 12, 3775–3789. [Google Scholar] [CrossRef] [Green Version]
  20. Palerme, C.; Genthon, C.; Claud, C.; Kay, J.E.; Wood, N.B.; L’Ecuyer, T. Evaluation of current and projected Antarctic precipitation in CMIP5 models. Clim. Dynam. 2017, 48, 225–239. [Google Scholar] [CrossRef]
  21. Souverijns, N.; Gossart, A.; Lhermitte, S.; Gorodetskaya, I.V.; Kneifel, S.; Maahn, M.; Bliven, L.F.; van Lipzig, N.P.M. Estimating radar reflectivity-Snowfall rate relationships and their uncertainties over Antarctica by combining disdrometer and radar observations. Atmos. Res. 2017, 196. [Google Scholar] [CrossRef]
  22. Fountain, A.G.; Nylen, T.H.; Macclune, K.L.; Dana, G.L. Glacier mass balances (1993–2001), Taylor Valley, McMurdo Dry Valleys, Antarctica. J. Glaciol. 2006, 52, 451–462. [Google Scholar] [CrossRef]
  23. Reijmer, C.H.; van den Broeke, M.R. Temporal and spatial variability of the surface mass balance in Dronning Maud Land, Antarctica. J. Glaciol. 2003, 49, 512–520. [Google Scholar] [CrossRef]
  24. Bromwich, D.H.; Nicolas, J.P.; Monaghan, A.J. An assessment of precipitation changes over Antarctica and the Southern Ocean since 1989 in contemporary global reanalyses. J. Clim. 2011, 24, 4189–4209. [Google Scholar] [CrossRef]
  25. Cohen, L.; Dean, S. Snow on the Ross Ice Shelf: Comparison of reanalyses and observations from automatic weather stations. Cryosphere 2013, 7, 1399–1410. [Google Scholar] [CrossRef]
  26. Welker, C.; Martius, O.; Froidevaux, P.; Reijmer, C.H.; Fischer, H. A climatological analysis of high-precipitation events in Dronning Maud Land, Antarctica, and associated large-scale atmospheric conditions. J. Geophys. Res. 2014, 119, 11932–11954. [Google Scholar] [CrossRef]
  27. Monaghan, A.J.; Bromwich, D.H.; Fogt, R.L.; Wang, S.H.; Mayewski, P.A.; Dixon, D.A.; Ekaykin, A.; Frezzotti, M.; Goodwin, I.; Isaksson, E.; et al. Insignificant change in Antarctic snowfall since the International Geophysical Year. Science 2006, 313, 827–831. [Google Scholar] [CrossRef] [PubMed]
  28. Agosta, C.; Favier, V.; Genthon, C.; Gallée, H.; Krinner, G.; Lenaerts, J.T.M.; van den Broeke, M.R. A 40-year accumulation dataset for Adelie Land, Antarctica and its application for model validation. Clim. Dyn. 2012, 38, 75–86. [Google Scholar] [CrossRef]
  29. Medley, B.; Joughin, I.; Das, S.B.; Steig, E.J.; Conway, H.; Gogineni, S.; Criscitiello, A.S.; McConnell, J.R.; Smith, B.E.; van den Broeke, M.R.; et al. Airborne-radar and ice-core observations of annual snow accumulation over Thwaites Glacier, West Antarctica confirm the spatiotemporal variability of global and regional atmospheric models. Geophys. Res. Lett. 2013, 40, 3649–3654. [Google Scholar] [CrossRef] [Green Version]
  30. Trenberth, K.E.; Fasullo, J.T.; Mackaro, J. Atmospheric moisture transports from ocean to land and global energy flows in reanalyses. J. Clim. 2010, 24, 4907–4924. [Google Scholar] [CrossRef]
  31. Bosilovich, M.G.; Robertson, F.R.; Chen, J.Y. Global energy and water budgets in MERRA. J. Clim. 2011, 24, 5721–5739. [Google Scholar] [CrossRef]
  32. Hersbach, H.; de Rosnay, P.; Bell, B.; Schepers, D.; Simmons, A.; Soci, C.; Abdalla, S.; Alonso-Balmaseda, M.; Balsamo, G.; Bechtold, P.; et al. Operational global reanalysis: Progress, future directions and synergies with NWP. ERA Rep. Ser. 2018. [Google Scholar] [CrossRef]
  33. Dee, D.P.; Uppala, S.M.; Simmons, A.J.; Berrisford, P.; Kobayashi, P.; Andrae, S.; Alonso-Balmaseda, U.; Balsamo, M.; Bauer, G.; Bechtold, P.; et al. The ERA-Interim reanalysis: Configuration and performance of the data assimilation system. Q. J. R. Meteorol. Soc. 2011, 137, 553–597. [Google Scholar] [CrossRef]
  34. Stephens, G.L.; Vane, D.G.; Boain, R.J.; Mace, G.G.; Sassen, K.; Wang, Z.; Illingworth, A.J.; O’Connor, E.J.; Rossow, W.B.; Durden, S.L.; et al. The CloudSat Mission and the A-Train. Bull. Am. Meteorol. Soc. 2002, 83, 1771–1790. [Google Scholar] [CrossRef]
  35. Marchand, R.; Mace, G.G.; Ackerman, T.; Stephens, G. Hydrometeor Detection Using CloudSat-An Earth-Orbiting 94-GHz Cloud Radar. J. Atmos. Ocean. Technol. 2008, 25, 519–533. [Google Scholar] [CrossRef]
  36. Tanelli, S.; Durden, S.L.; Im, E.; Pak, K.S.; Reinke, D.G.; Partain, P.; Haynes, J.M.; Marchand, R.T. CloudSat’s cloud profiling radar after two years in orbit: Performance, calibration, and processing. IEEE Trans. Geosci. Remote Sens. 2008, 46, 3560–3573. [Google Scholar] [CrossRef]
  37. Partain, P. CloudSat ECMWF-AUX Auxiliary Data Process Description and Interface Control Document, Algorithm Version 5.2. Available online: http://www.cloudsat.cira.colostate.edu/sites/default/files/products/files/ECMWF-AUX_PDICD.P_R04.20070718.pdf (accessed on 3 December 2018).
  38. Ackerman, S.A.; Frey, R. MODIS Atmosphere L2 Cloud Mask Product (35_L2); NASA MODIS Adaptive Processing System, NASA Goddard Space Flight Center: Greenbelt, MD, USA, 2015. [Google Scholar] [CrossRef]
  39. Cooper, S.J.; Wood, N.B.; L’Ecuyer, T.S. A variational technique to estimate snowfall rate from coincident radar, snowflake, and fall-speed observations. Atmos. Meas. Tech. 2017, 10, 2557–2571. [Google Scholar] [CrossRef] [Green Version]
  40. Behrangi, A.; Christensen, M.; Richardson, M.; Lebsock, M.; Stephens, G.; Huffman, G.J.; Bolvin, D.; Adler, R.F.; Gardner, A.; Lambrigtsen, B.; et al. Status of high-latitude precipitation estimates from observations and reanalyses. J. Geophys. Res. 2016, 121, 4468–4486. [Google Scholar] [CrossRef] [PubMed]
  41. Frezzotti, M.; Pourchet, M.; Flora, O.; Gandolfi, S.; Gay, M.; Urbini, S.; Vincent, C.; Becagli, S.; Gragnani, R.; Proposito, M.; et al. New estimations of precipitation and surface sublimation in East Antarctica from snow accumulation measurements. Clim. Dyn. 2004, 23, 803–813. [Google Scholar] [CrossRef]
  42. Olauson, J. Era5: The new champion of wind power modelling? Renew. Energy 2018. [Google Scholar] [CrossRef]
  43. Urraca, R.; Huld, T.; Gracia-Amillo, A.; Kaspar, F.; Sanz-Garcia, A. Evaluation of global horizontal irradiance estimates from era5 and cosmo-rea6 reanalyses using ground and satellite-based data. Sol. Energy 2018, 164, 339–354. [Google Scholar] [CrossRef]
  44. Fountain, A.G.; Nylen, T.H.; Monaghan, A.; Basagic, H.J.; Bromwich, D. Snow in the McMurdo Dry Valleys, Antarctica. Int. J. Climatol. 2010, 30, 633–642. [Google Scholar] [CrossRef]
  45. Kojima, K. Densification of Snow in Antarctica; Mellor, M., Ed.; AGU: Washington, DC, USA, 1964; Volume 2, pp. 157–218. [Google Scholar] [CrossRef]
  46. Nishimura, K.; Nemoto, M. Blowing snow at Mizuho station, Antarctica. Philos. Trans. R. Soc. A 2005, 363, 1647–1662. [Google Scholar] [CrossRef] [PubMed]
  47. Wood, N.B.; L’Ecuyer, T.; Vane, D.G.; Stephens, G.L.; Partain, P. Level 2C Snow Profile Process Description and Interface Control Document, Version 0. 2013. Available online: http://www.cloudsat.cira.colostate.edu/ICD (accessed on 5 December 2018).
  48. Maahn, M.; Burgard, C.; Crewell, S.; Gorodetskaya, I.V.; Kneifel, S.; Lhermitte, S.; Van Tricht, K.; van Lipzig, N.P. How does the spaceborne radar blind zone affect derived surface snowfall statistics in polar regions? J. Geophys. Res.-Atmos. 2014, 119, 13–604. [Google Scholar] [CrossRef]
  49. Schlosser, E.; Manning, K.W.; Powers, J.G.; Duda, M.G.; Birnbaum, G.; Fujita, K. Characteristics of high-precipitation events in dronning maud land, antarctica. J. Geophys. Res.-Atmos. 2010, 115. [Google Scholar] [CrossRef]
  50. Marshall, G.J. Trends in the Southern Annular Mode from observations and reanalyses. J. Clim. 2003, 14, 4134–4143. [Google Scholar] [CrossRef]
  51. Gorodetskaya, I.V.; Tsukernik, M.; Claes, K.; Ralph, F.M.; Neff, W.D.; Van Lipzig, N.P.M. The role of atmospheric rivers in anomalous snow accumulation in East Antarctica. Geophys. Res. Lett. 2014, 41, 6199–6206. [Google Scholar] [CrossRef] [Green Version]
  52. Ralph, F.M.; Neiman, P.J.; Wick, G.A. Satellite and CALJET aircraft observations of atmospheric rivers over the Eastern North Pacific Ocean during the winter of 1997/98. Mon. Weather Rev. 2004, 132, 1721–1745. [Google Scholar] [CrossRef]
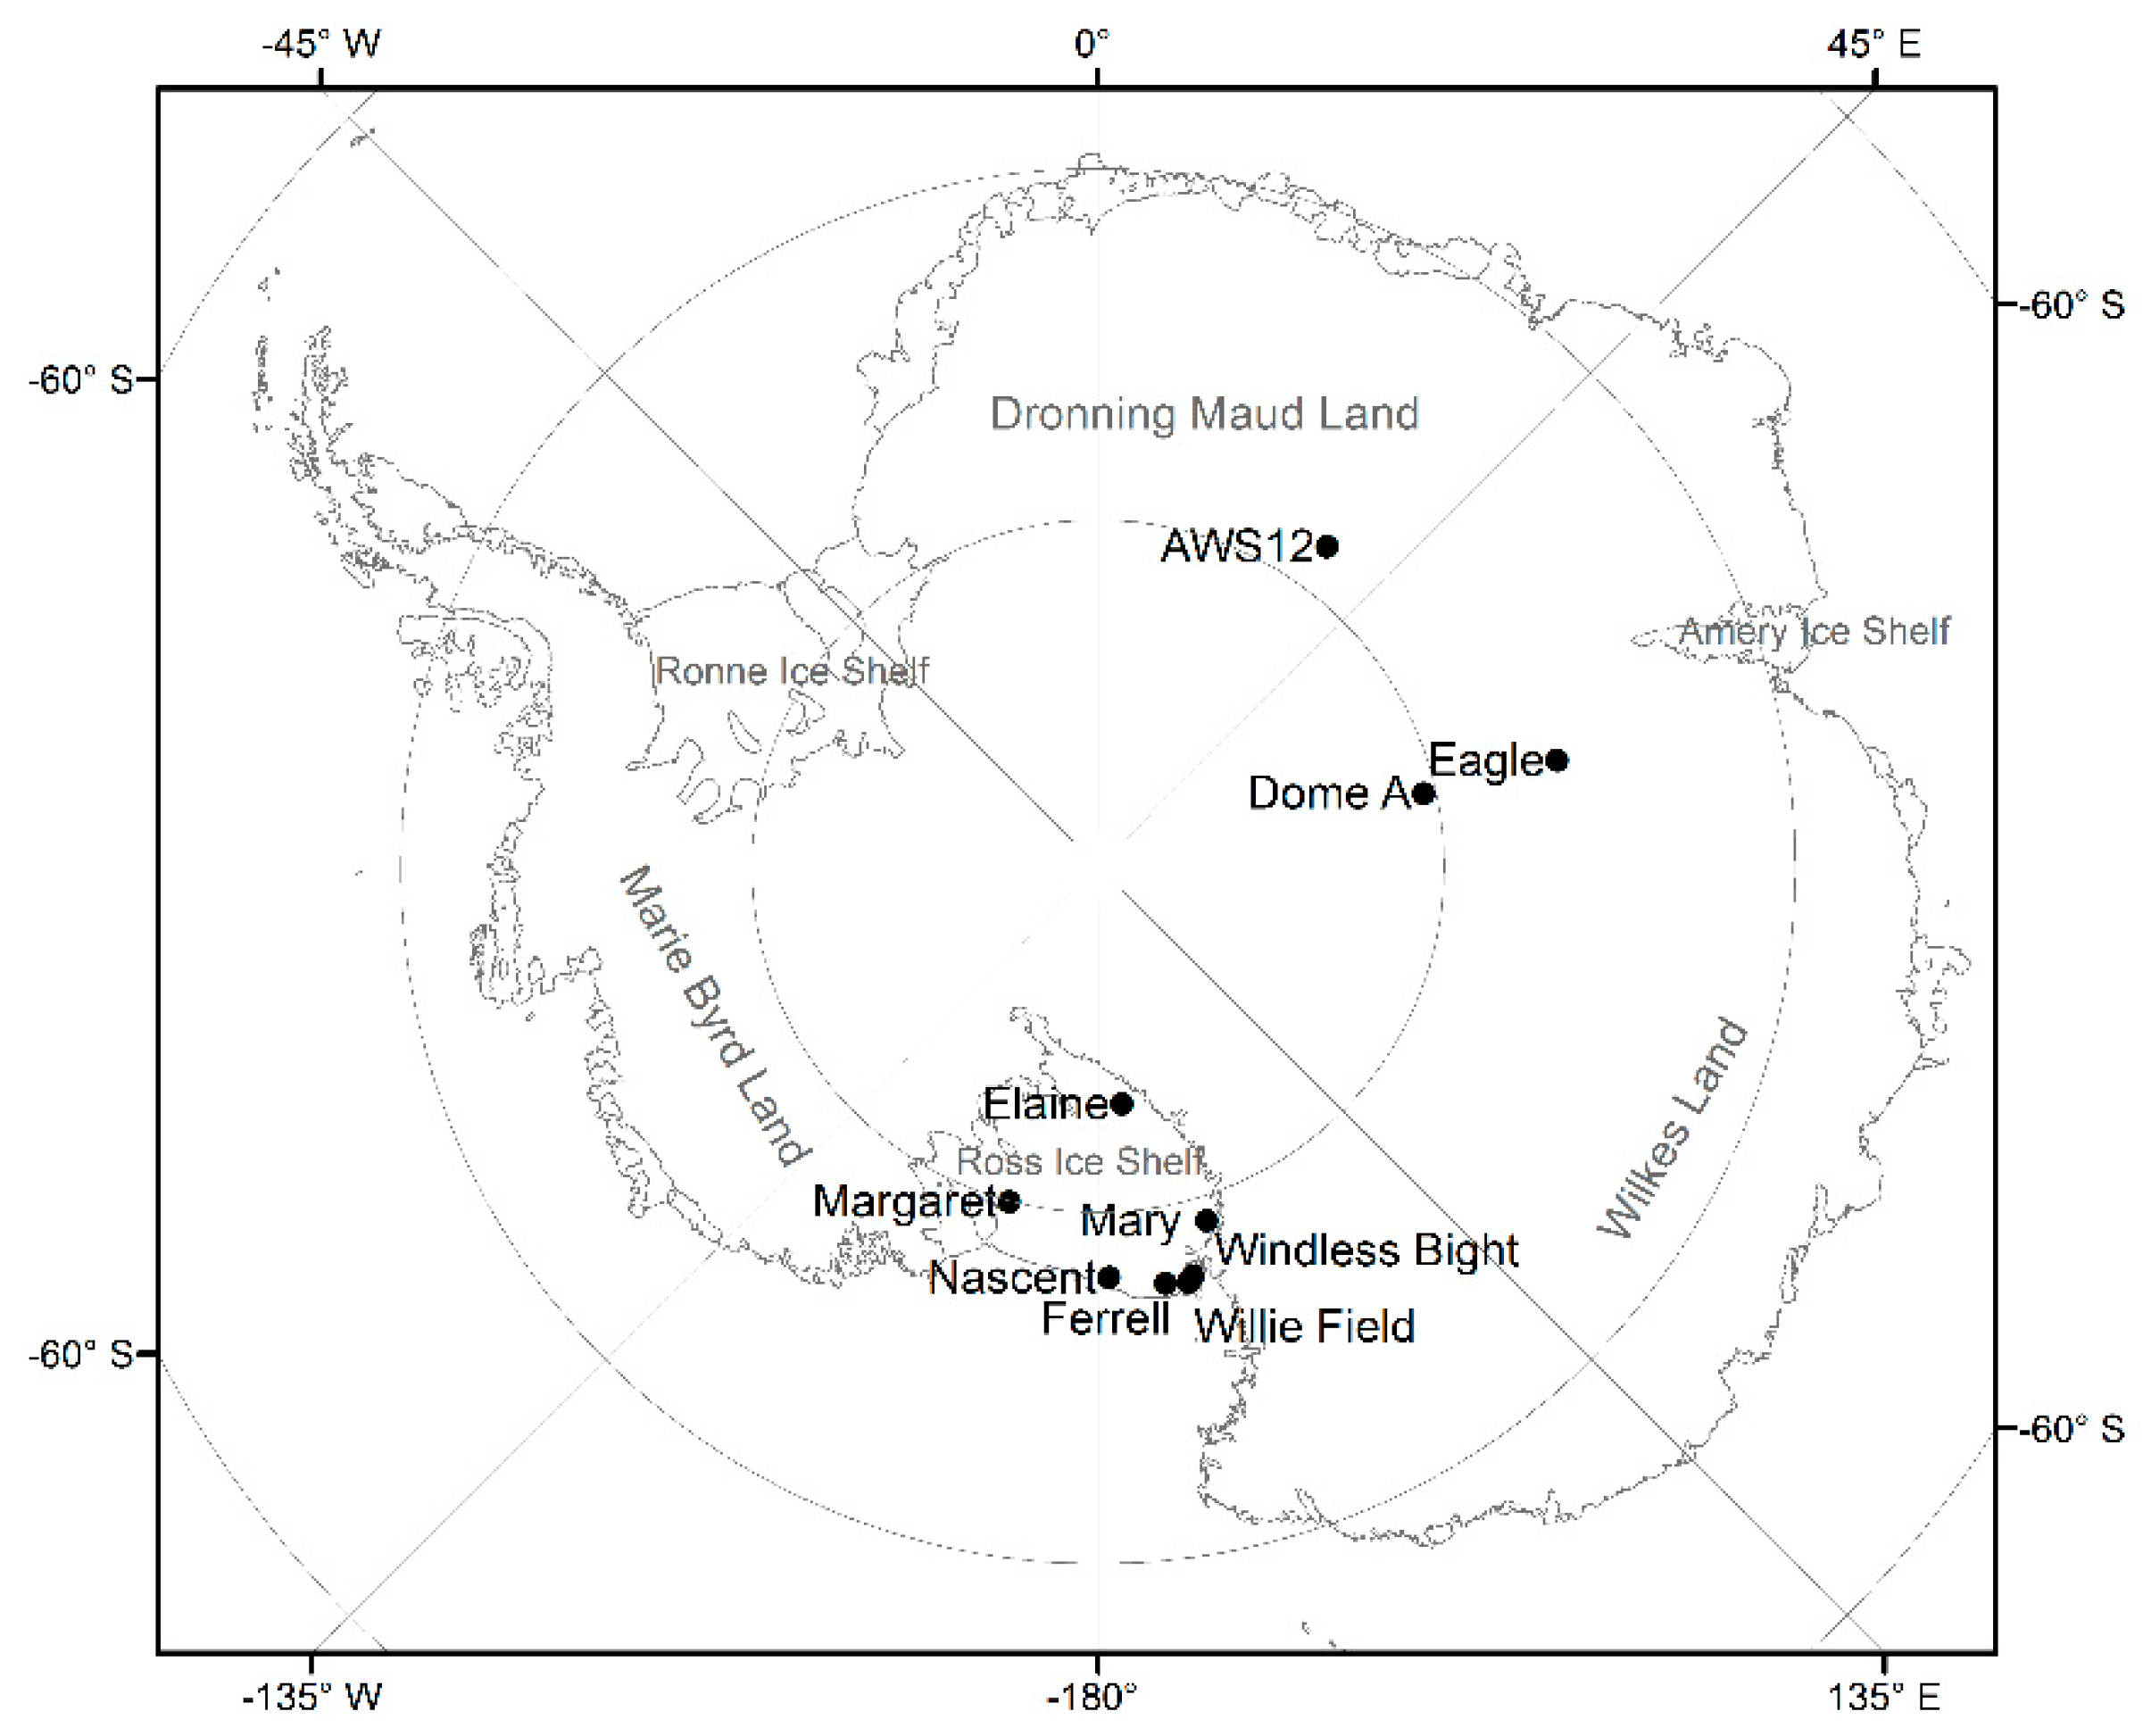
Figure 1. Maximum temporal resolution of CloudSat snowfall over the Antarctic Ice Sheet (AIS).
Remotesensing 11 01686 g001
Figure 2. Map of Antarctica showing the locations of the ten automatic weather stations (AWSs). The daily snowfall rate at the AWSs marked with an asterisk in Table 1 was measured by CloudSat. The time coverage varied between stations (see Table 1).
Remotesensing 11 01686 g002
Figure 3. Cumulative daily AWS snow accumulation, CloudSat snowfall and ERA5 snowfall. The left-hand axes show AWS snow accumulation (mm water equivalent (w. e.)) and the right-hand axes show CloudSat snowfall (black) and ERA5 snowfall (blue) (mm w. e.).
Remotesensing 11 01686 g003
Figure 4. Different event sizes of all coincident events (mm w. e.). The right-hand axes show ERA5 snowfall events, the left-hand axes show AWS accumulation events and the x axes show CloudSat snowfall events. The r values are shown for correlations between CloudSat and ERA5 snowfall events and AWS positive accumulation events at the 99% significance level.
Remotesensing 11 01686 g004
Figure 5. Annual snowfall (mm w. e.) over the AIS from 1979 to 2018.
Remotesensing 11 01686 g005
Figure 6. (a) Change rates in annual snowfall (mm w. e. year−1) over the AIS from 1979 to 2018. The regions marked with dots are at the 90% significance level. Positive values indicate that there were increases in the annual snowfall. (b) Contribution of EPEs to the annual snowfall (%) over the AIS. Different colors indicate the percentage of annual snowfall coming from EPEs in each grid.
Remotesensing 11 01686 g006
Figure 7. Percentage of EPEs in the four seasons (%) over the AIS. Different colors indicate the percentage of the EPEs in each grid.
Remotesensing 11 01686 g007
Table 1. Locations, lengths of records and elevations of the AWSs. Snow accumulations at the five stations marked with an asterisk (*) were accumulated to a daily resolution and data from the other five stations were accumulated to a two-day resolution.
StationLongitudeLatitudeDateLength (year)RegionElevation (m)
Margaret *165.099° W79.981° S1 November 2008–31 March 20112.4RIS67
Mary *162.985° E79.305° S1 January 2008–31 March 20113.3RIS58
Elaine *174.285° E83.094° S1 February 2010–31 March 20111.2RIS58
Ferrell170.817° E77.803° S1 November 2008–31 March 20111.4RIS43
Windless Bight167.687° E77.725° S1 January 2008–31 March 20113.2RIS40
Willie Field166.947° E77.867° S1 February 2009–31 October 20101.7RIS12
Nascent178.498° E78.129° S1 January 2009–31 March 20112.2RIS30
AWS12 *35.633° E78.65° S1 March 2008–31 March 20113.1East Antarctica3620
Eagle77.024° E76.42° S1 February 2005–31 March 20116.2East Antarctica2830
Dome A *77.374° E80.367° S17 January 2005–31 March 20116.3East Antarctica4084
Table 2. Mean absolute error (MAE) (mm day−1) and root mean square error (RMSE) (mm day−1) of the magnitudes of daily CloudSat and ERA5 snowfall (and not the rates of change) for the ten AWS locations. Mean bias (MB) (mm year−1), percentage deviation (PD) and average CloudSat and ERA5 snowfall (SF-C and SF-E) (mm year−1) of the magnitudes of annual CloudSat and ERA5 snowfall for the ten AWS locations.
StationMAERMSEMBPDSF-CSF-E
(mm day−1)(mm day−1)(mm year−1)(%)(mm year−1)(mm year−1)
Margaret1.492.62−2.595.3%82.086.4
Mary1.883.46−5.56−9.5%179.6162.5
AWS 120.350.5214.11−29.2%17.912.7
Dome A0.140.201.577.2%12.313.2
Elaine0.671.07−0.21−0.6%12.812.8
Ferrell3.126.02−12.8926.0%116.6146.9
Windless Bight2.945.57−1.421.1%234.1236.7
Eagle0.541.498.3935.3%30.541.3
Nascent4.5411.980.11−6.8%61.357.1
Willie Field3.195.988.67−6.3%42.039.4
Table 3. Average and maximum wind speed (m s−1) and wind direction (°). The column “All days” shows the three factors for all days at each station. The column “ESE–positive” shows the three factors for the days that have both extreme snowfall events (ESEs) and positive snow accumulation; “non-ESE/non-positive” means the days have neither ESE nor positive accumulation. The column “ESE–wind” shows the percentage of ESEs (%) that were accompanied by stronger winds than usual.
StationAll DaysESE–positivenon-ESE/non-positiveESE–
avemaxdiravemaxdiravemaxdirwind
(m s−1)(m s−1)(°)(m s−1)(m s−1)(°)(m s−1)(m s−1)(°)(%)
Margaret4.55.7197.64.86.9234.47.69.6210.786.7
Mary5.46.481.69.911.2125.57.48.760.485.7
Ferrell4.26.1124.46.17.8125.38.411.546.960.0
Windless Bight2.84.2152.45.87.490.15.47.5193.680.0
AWS125.76.7177.26.98.6138.05.77.1154.580.0
Dome A5.46.7216.98.910.6115.67.710.0162.681.3
Eagle8.210.1241.48.911.5253.39.312.3227.978.6
Elaine4.85.7113.16.77.745.28.39.2254.761.5
Nascent6.28.5167.97.911.0235.37.810.8191.970.0
Wille Field2.94.4154.44.05.6272.25.16.6113.960.0
Table 4. Average and maximum wind speeds (m s−1) and wind direction (°) when extreme snow accumulation events (EAEs) occurred without snowfall. The column “EAE–none” (%) shows the percentage of EAEs that occurred without snowfall.
StationavemaxdirEAE–none
(m s−1)(m s−1)(°)(%)
Margaret3.64.8151.937.5
Mary5.56.789.253.8
AWS123.34.6104.253.3
Dome A4.86.220.637.5
Elaine5.77.1178.833.3
Ferrell6.17.1251.720.0
Windless Bight10.212.2259.810.0
Eagle5.16.172.433.3
Nascent2.94.064.414.3
Willie Field4.56.735.427.3
Table 5. Capture rate (CR) of ERA5 and CloudSat for ESEs and EAEs, respectively. CR-ERA5 shows the percentage of ERA5 that captured ESEs and CR-CloudSat shows the percentage of CloudSat that captured extreme snowfall events from ERA5 (EPEs).
StationCR-ERA5CR-CloudSat
Margaret63.2%51.1%
Mary64.8%57.8%
AWS1274.0%21.1%
Dome A56.3%23.7%
Elaine67.4%29.0%
Ferrell75.0%39.1%
Windless Bight74.5%41.3%
Eagle88.5%24.7%
Nascent84.5%40.0%
Willie Field66.7%43.4%

