Article

Validation of 7 Years in-Flight HY-2A Calibration Microwave Radiometer Products Using Numerical Weather Model and Radiosondes

1
School of Earth Sciences and Engineering, Hohai University, Nanjing 211100, China
2
First Institute of Oceanography (FIO), Ministry of Natural Resources (MNR), Qingdao 266061, China
3
Department of Geodesy, GeoForschungZentrum (GFZ), Telegrafenberg, 14473 Potsdam, Germany
4
Institute of Geodesy and Geoinformation Science, Technische Universitat Berlin, 10623 Berlin, Germany
*
Author to whom correspondence should be addressed.
Remote Sens. 2019, 11(13), 1616; https://doi.org/10.3390/rs11131616
Submission received: 13 May 2019 / Revised: 19 June 2019 / Accepted: 5 July 2019 / Published: 8 July 2019
(This article belongs to the Special Issue Global Navigation Satellite Systems for Earth Observing System)

Abstract

:
Haiyang-2A (HY-2A) has been working in-flight for over seven years, and the accuracy of HY-2A calibration microwave radiometer (CMR) data is extremely important for the wet troposphere delay correction (WTC) in sea surface height (SSH) determination. We present a comprehensive evaluation of the HY-2A CMR observation using the numerical weather model (NWM) for all the data available period from October 2011 to February 2018, including the WTC and the precipitable water vapor (PWV). The ERA(ECMWF Re-Analysis)-Interim products from European Centre for Medium-Range Weather Forecasts (ECMWF) are used for the validation of HY-2A WTC and PWV products. In general, a global agreement of root-mean-square (RMS) of 2.3 cm in WTC and 3.6 mm in PWV are demonstrated between HY-2A observation and ERA-Interim products. Systematic biases are revealed where before 2014 there was a positive WTC/PWV bias and after that, a negative one. Spatially, HY-2A CMR products show a larger bias in polar regions compared with mid-latitude regions and tropical regions and agree better in the Antarctic than in the Arctic with NWM. Moreover, HY-2A CMR products have larger biases in the coastal area, which are all caused by the brightness temperature (TB) contamination from land or sea ice. Temporally, the WTC/PWV biases increase from October 2011 to March 2014 with a systematic bias over 1 cm in WTC and 2 mm in PWV, and the maximum RMS values of 4.62 cm in WTC and 7.61 mm in PWV occur in August 2013, which is because of the unsuitable retrieval coefficients and systematic TB measurements biases from 37 GHz band. After April 2014, the TB bias is corrected, HY-2A CMR products agree very well with NWM from April 2014 to May 2017 with the average RMS of 1.68 cm in WTC and 2.65 mm in PWV. However, since June 2017, TB measurements from the 18.7 GHz band become unstable, which led to the huge differences between HY-2A CMR products and the NWM with an average RMS of 2.62 cm in WTC and 4.33 mm in PWV. HY-2A CMR shows high accuracy when three bands work normally and further calibration for HY-2A CMR is in urgent need. Furtherly, 137 global coastal radiosonde stations were used to validate HY-2A CMR. The validation based on radiosonde data shows the same variation trend in time of HY-2A CMR compared to the results from ECMWF, which verifies the results from ECMWF.

1. Introduction

Haiyang-2A (HY-2A) is the first marine dynamic environmental satellite of China, which was launched in August 2011. It is equipped with an altimeter, a calibration microwave radiometer (CMR), a microwave scatterometer, and a scanning microwave radiometer, which could measure ocean water vapor, sea surface wind field, sea surface height, and sea surface temperature, etc. [1,2,3]. The distance to the sea surface, i.e., altimeter range, is measured by an onboard dual-band (13.58 GHz and 5.2 GHz) radar altimeter (RA). An onboard CMR, across three bands (18.7 GHz, 23.8 GHz, and 37 GHz) is used for the correction of the wet part of excess path delay in altimeter range, i.e., wet tropospheric correction (WTC) [4]. WTC is caused by the water vapor and cloud water (precipitable water vapor, PWV) in the troposphere [5] and it is hard to model due to its high variation in space and time. Thus WTC is usually derived from the brightness temperature (TB) by the onboard CMR. The algorithm to calculate WTC and PWV from TB is usually developed before satellite launching and regular validation and calibration should be performed during the in-flight satellite period. Such kind of validation/calibration has been performed on other satellite altimetry missions. Ruf et al. [6] evaluated in-orbit TOPEX/POXSIDON microwave radiometer (TMR) with ground-based microwave radiometer, radiosondes and numerical weather model (NWM), and an accuracy of 1.1 cm for TMR WTC was demonstrated. The standard deviation of WTC of the Jason-1 microwave radiometer (JMR) was revealed to be over 1.2 cm and the system bias was 5 mm by comparing with radiosonde data [7]. The Jason-2 advanced microwave radiometer (AMR) data were compared with the European Centre for Medium-Range Weather Forecasts (ECMWF) data on the coastal area with a new retrieval method, which showed that the error was less than 0.8 cm for up to 15 km and less than 1.5 cm at the coastline [8].
The HY-2A WTC retrieval algorithm was first developed with the simulated TB and ECMWF product before launching, and an agreement of ~1 cm was achieved [9]. While the environment between laboratory and in-flight is quite different, Zhang et al. [10] retrieved WTC from the empirical models using Jason 1/2 data for the first two years of data with an accuracy of ~1.5 cm. Different empirical models, including log-linear regression, the genetic algorithm (GA) optimization, and the artificial neural networks (ANN) were evaluated with data from 2011 to 2013. The results showed the accuracy of HY-2A was ~1 cm compared with JMR and CMR and the accuracy variation from different retrieval models was 1–2 mm [5,11]. Using products of Jason-2 and Envisat, the first two years’ WTC of HY-2A was validated and an agreement of 1.5 cm was demonstrated [12].. However, a comprehensive evaluation of HY-2A for the past 7 years is not available for now, and a throughout validation of all the available data is still needed on the global scale. Moreover, the TB measurement and derived WTC/PWV suffer drift due to hardware aging. The drift has been shown in other altimetry satellites. The ENVISAT microwave radiometer shows a WTC drift of ~1mm/y for the first three years [13]; the JMR on Jason-1 exhibit 6 mm/y drift and AMR shows a drift of 1 mm/y [14].
HY-2A CMR played an important role in SSH and wave height measurements for the past 7 years after launching [2,15], but a comprehensive evaluation has not been conducted. As the accuracy of CMR WTC is extremely important for RA, such kind of validation is in need. The WTC/PWV observation problem, whether it exists or not, should also be investigated as it has had a direct impact on sea level rise estimation. Moreover, HY-2A CMR PWV products can further enrich marine water vapor observation and improve ocean water vapor monitoring. In this study, the WTC and PWV products of 7 years worth of HY-2A CMR data from October 2011 to February 2018 are evaluated using the ERA(ECMWF Re-Analysis)-Interim products from ECMWF. The overall agreement and spatial distribution are investigated, and the potential drift is also detected and two radiosonde sites are used to validate the calibration.
In the following, Section 2 introduces the HY-2A WTC/PWV data and ECMWF products. The results are presented in Section 3 with detailed discussions, including the general agreement, the distribution of biases in particular areas, the accuracy of observation over the 7 years. Section 4 describes the main achievements of this paper and future work. Finally, in Section 5, the conclusions are given together about HY-2A WTC/PWV validation.

2. Materials and Methods
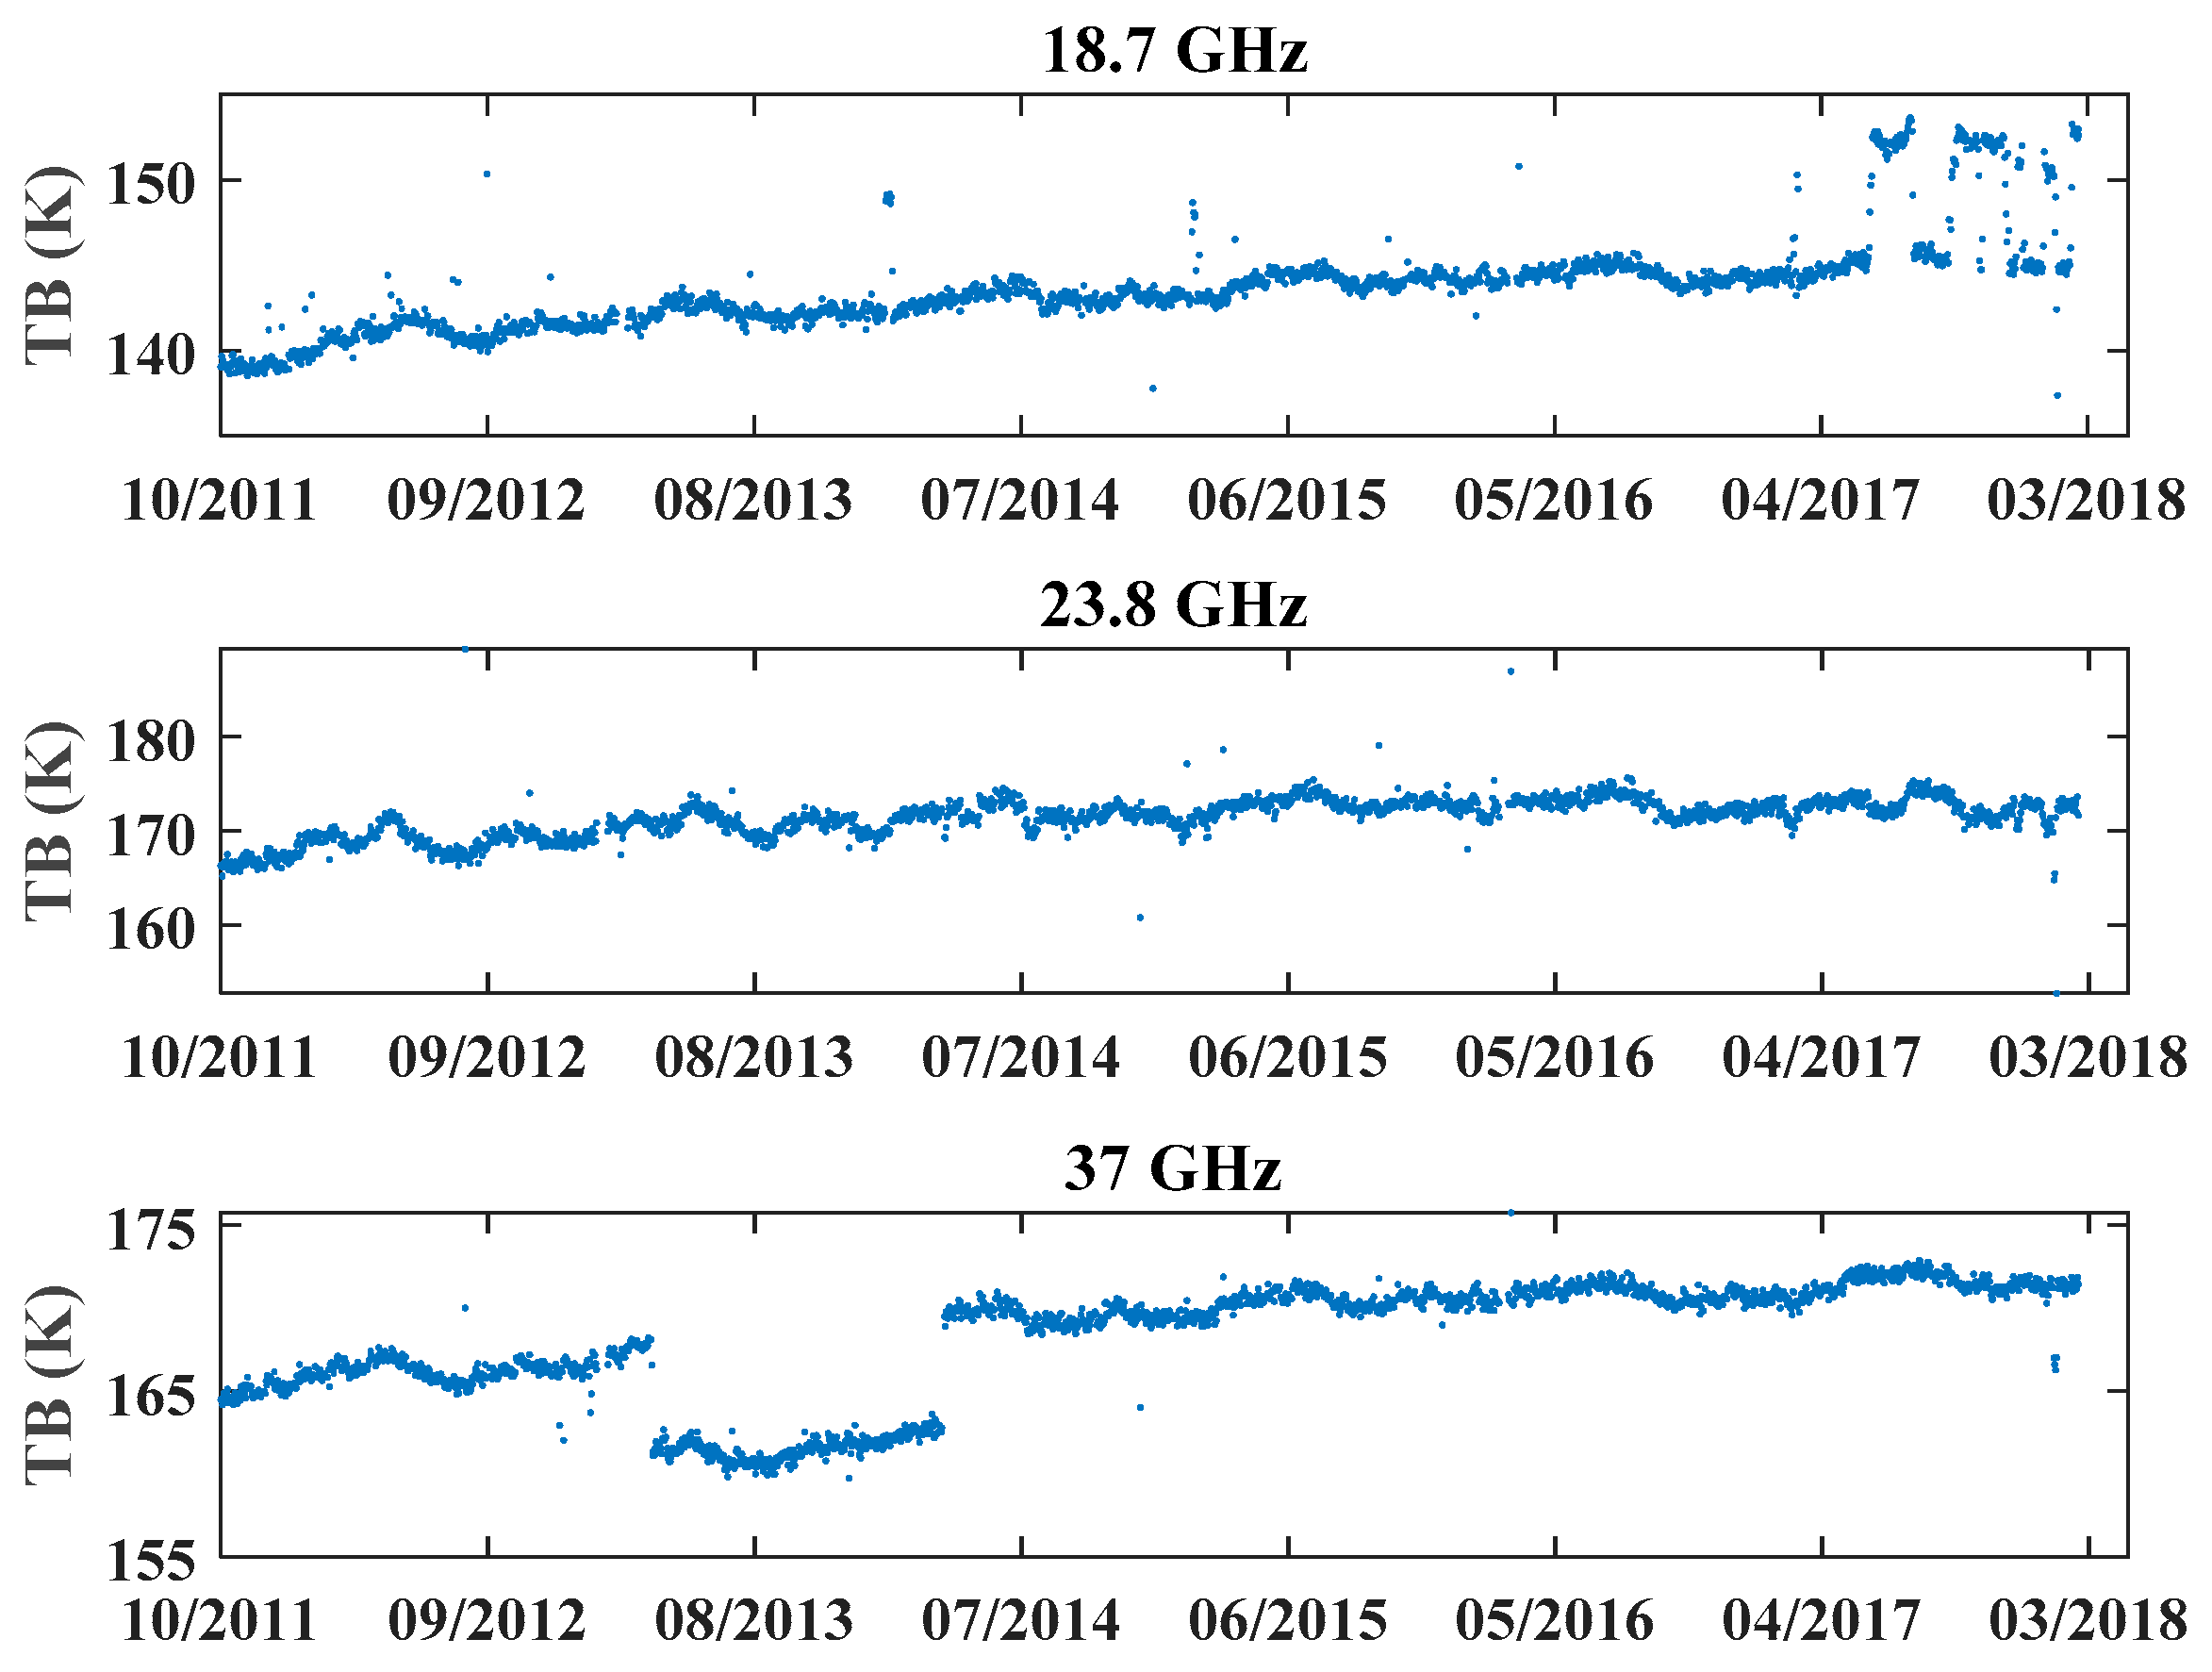
2.1. HY-2A CMR Data

HY-2A is a sun-synchronous orbit satellite and has two phases in orbit. Before March 2016, the HY-2A orbit height was 971 km and the revisiting time was 14 days. After that, the orbit height changed to 973 km and the revisiting time switched to 168 days [15]. HY-2A was firstly designed for 3 years, while it is still operating now. The subsequent HY-2 series satellite HY-2B was launched in October 2018 and HY-2 C/D are scheduled to launch on 2019 and 2020, respectively. HY-2A CMR is a three-band nadir-looking passive radiometer, the main performance indicators of HY-2A CMR are shown as Table 1 [1].
HY-2A CMR data processing mainly includes three steps, which are antenna temperature adjustment, TB calibration and CMR products retrieval, respectively. The WTC and PWV products of HY-2A CMR are derived from TB observations by empirical regression models [16], which includes a neural network algorithm and log-linear regression. TMR, JMR and AMR adopt log-linear regression and ENVISAT uses a neural network algorithm [12], while HY-2A CMR applies the log-linear regression model [17]. In the paper, the HY-2A CMR secondary products, i.e., the level-2B WTC/PWV from October 2011 to February 2018 (cycle 1 to cycle 122) were used. These products are provided by the National Ocean Satellite Application Service (NSOAS), Ministry of Natural Resources (MNR) of People’s Republic of China.

2.2. Introduction of Numerical Weather Model

The numerical weather model we used in the paper is ECMWF, which is an independent intergovernmental organization that operates the world’s largest archive of numerical weather prediction. ERA-Interim is a widely used atmosphere reanalysis data from ECMWF, with improved quality of the reanalysis product [18]. ERA-Interim surface product provides integrated vertical water vapor (IVWV) with a temporal resolution of 6 h, and the horizontal resolution of 0.25° × 0.25° was used in the study, which is demonstrated with an accuracy of 2~3 mm globally [19].
Vienna Mapping Functions 3 (VMF3) is the latest version of the troposphere products from Technische Universitat Wein [20]. Among which, VMF3 data on a global 1° × 1° grid derived from ERA-Interim NWM data in an epoch-wise format (6 h), i.e., the VMF3-EI product was used in this paper, including the tropospheric wet delay. The grid data resolution of the previous version (VMF1) was 2° × 2.5°, which is generated using the ERA-40. VMF1 is demonstrated with an accuracy of 1.2 cm in ZWD (zenith wet delay) [21]. As the successor of VMF1, the VMF3-EI with higher accuracy and better spatial resolution is suitable for the validation of HY-2A WTC in this study.
HY-2A CMR observes from the sea surface, and the grid height of ERA-Interim surface data is interpolated from a global digital elevation model Global 30 Arc-Second Elevation(GTOPO30) [22], which is the height over mean sea surface in meters (less than 10 m globally) [23]. VMF3-EI grid height is from a file with mean ellipsoidal heights (http://vmf.geo.tuwien.ac.at/station_coord_files/orography_ell_1x1. After adding the geoid undulation from the EGM96 (Earth Gravitational Model 96), the height difference between grid height and mean surface height is less than 10 m. Therefore, HY-2A CMR products can be compared with NWM directly. Bilinear interpolation is applied in the horizontal direction to obtain the WTC/PWV of HY-2A tracking points and cubic spline method is applied in temporal interpolation.

2.3. Radiosonde Data

In this paper, radiosonde data were used to validate the result from ECMWF. The daily observation times from radiosonde is relatively lower because most stations measure data less than four times each day. Therefore, to have enough crossover points to evaluate, in the paper the threshold is set as 200 km in space and 2 h in time. The distance is the range between radiosonde stations and HY-2A sub-satellite points. As shown in Figure 1, 137 radiosonde stations were selected.

3. Results

In this section, we present the validation results of the HY-2A WTC and PWV product using the NWM data. The global distribution of WTC and PWV are first presented briefly, as WTC and PWV usually suffer considerable noise and should be excluded when compared toNWM data. The data cleaning method and results are also presented. The detailed agreements between the WTC/PWV and NWM are investigated.

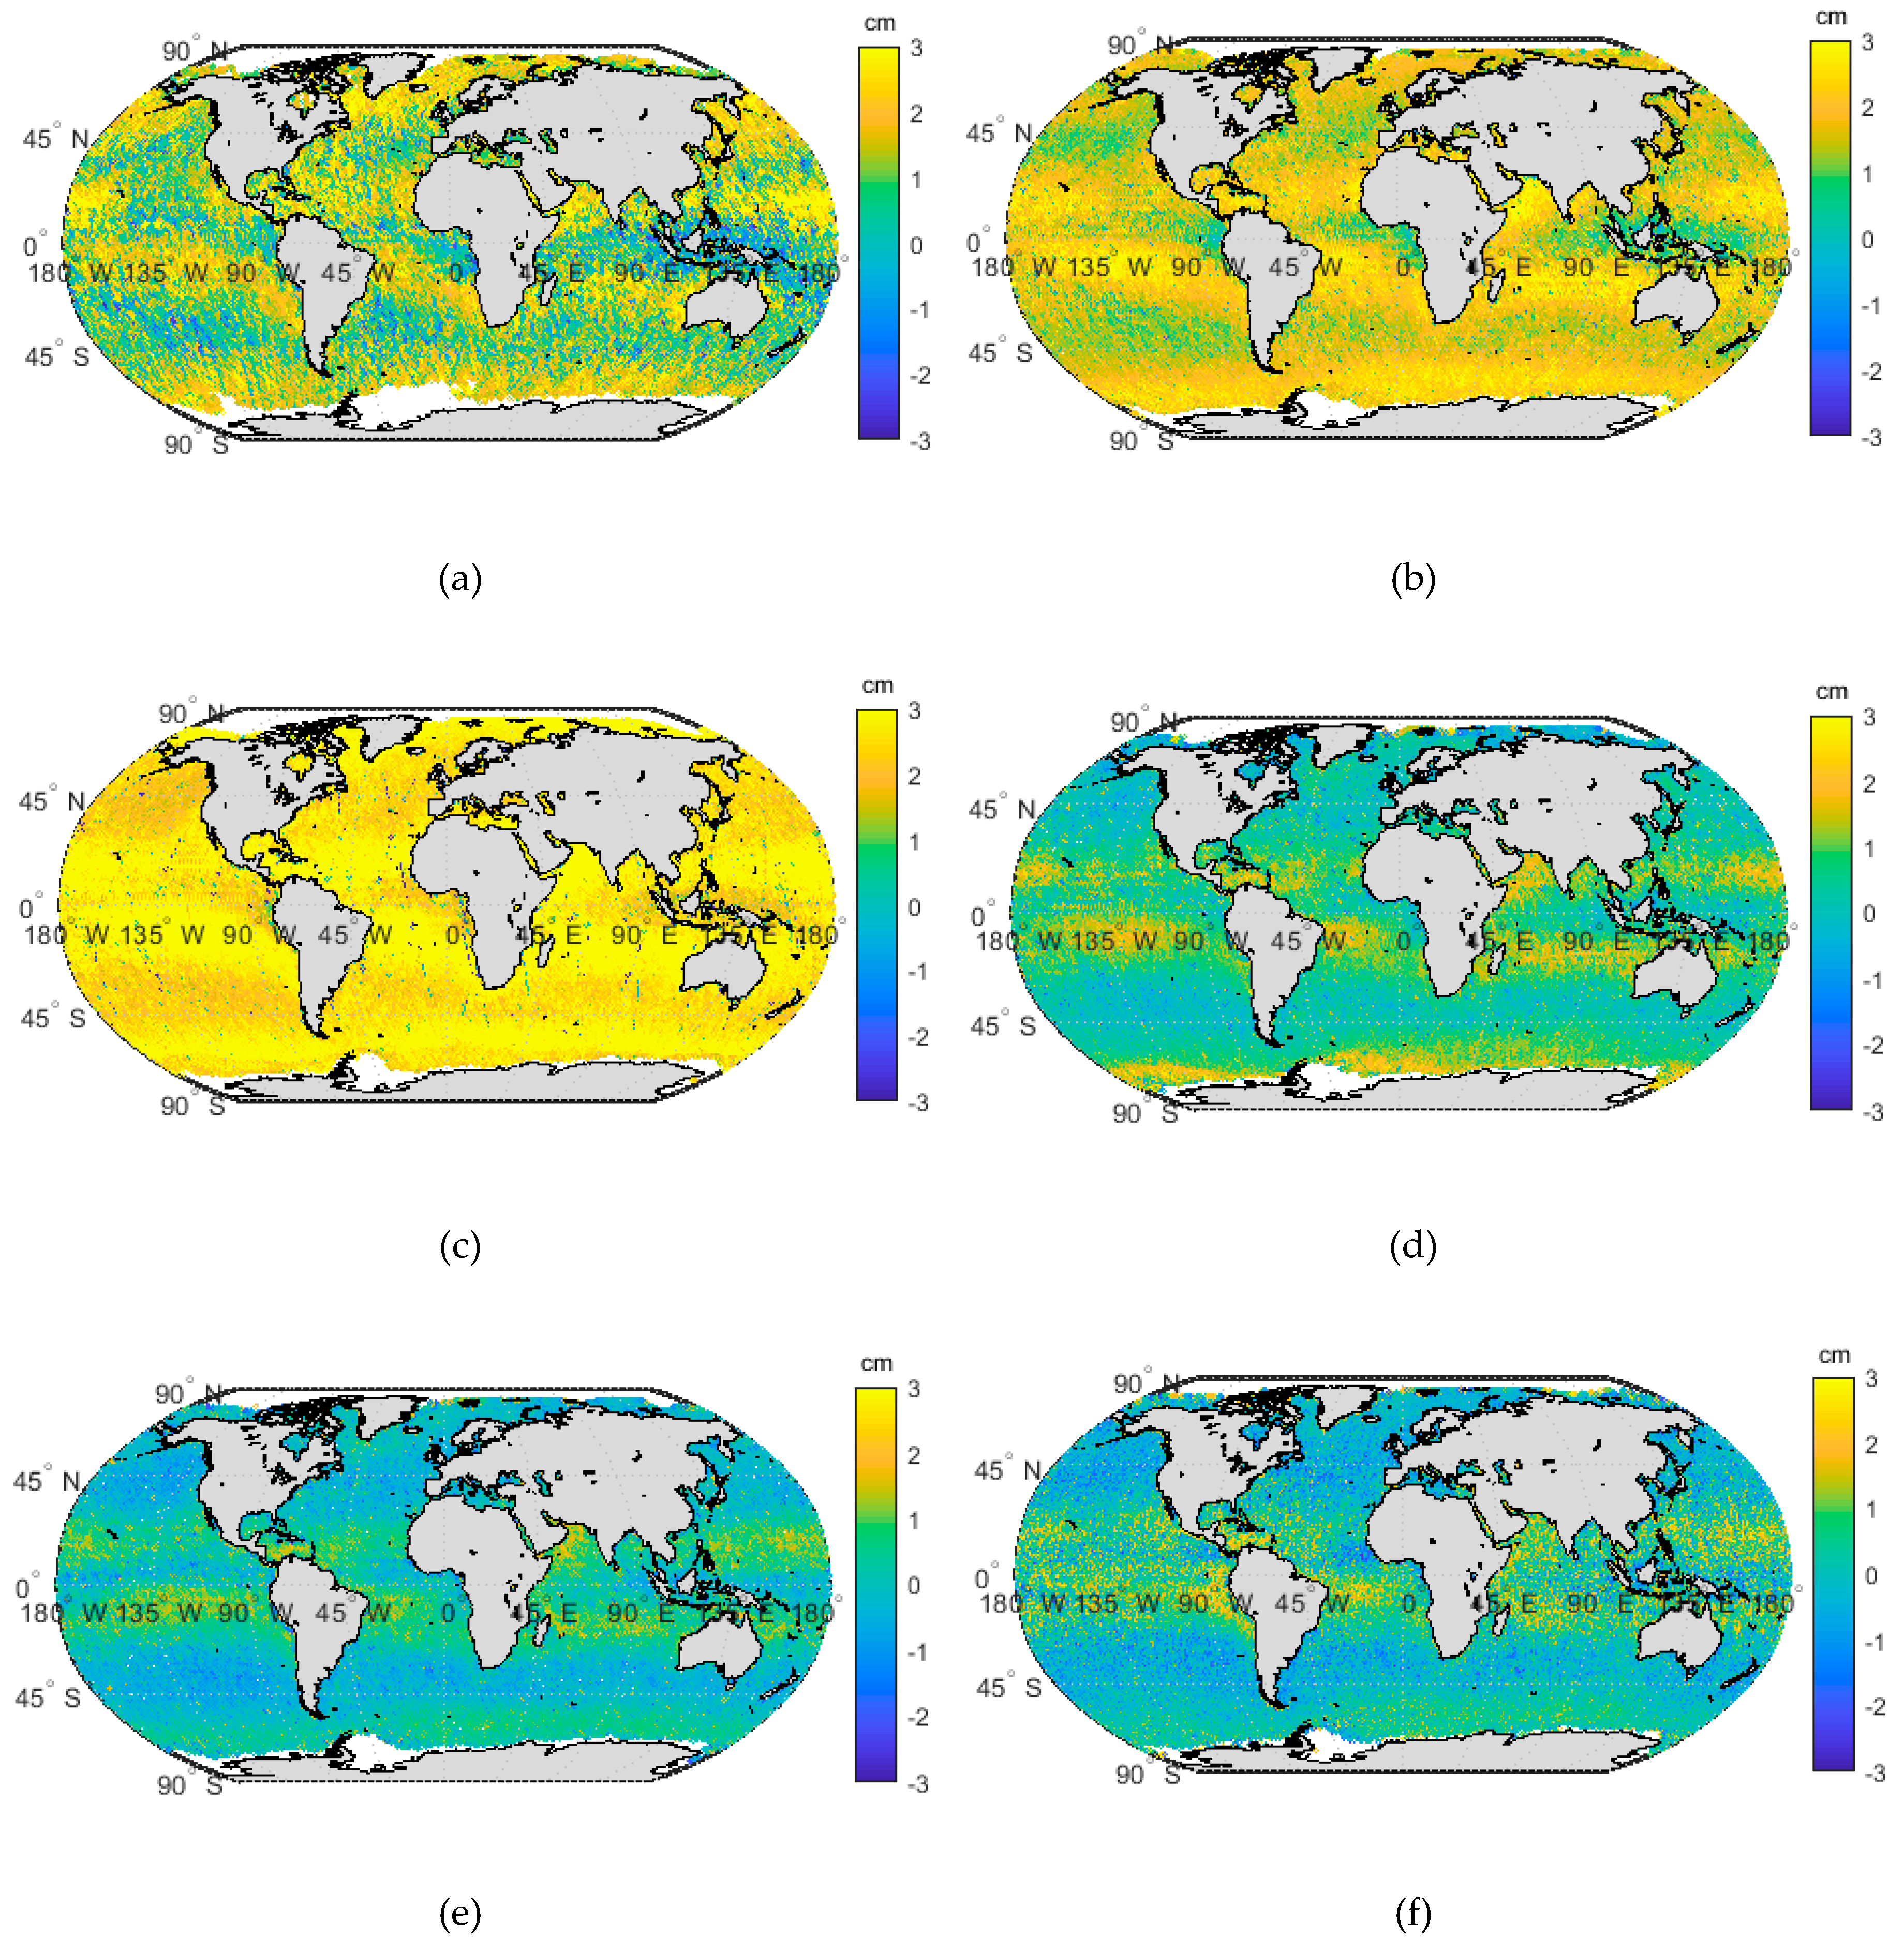
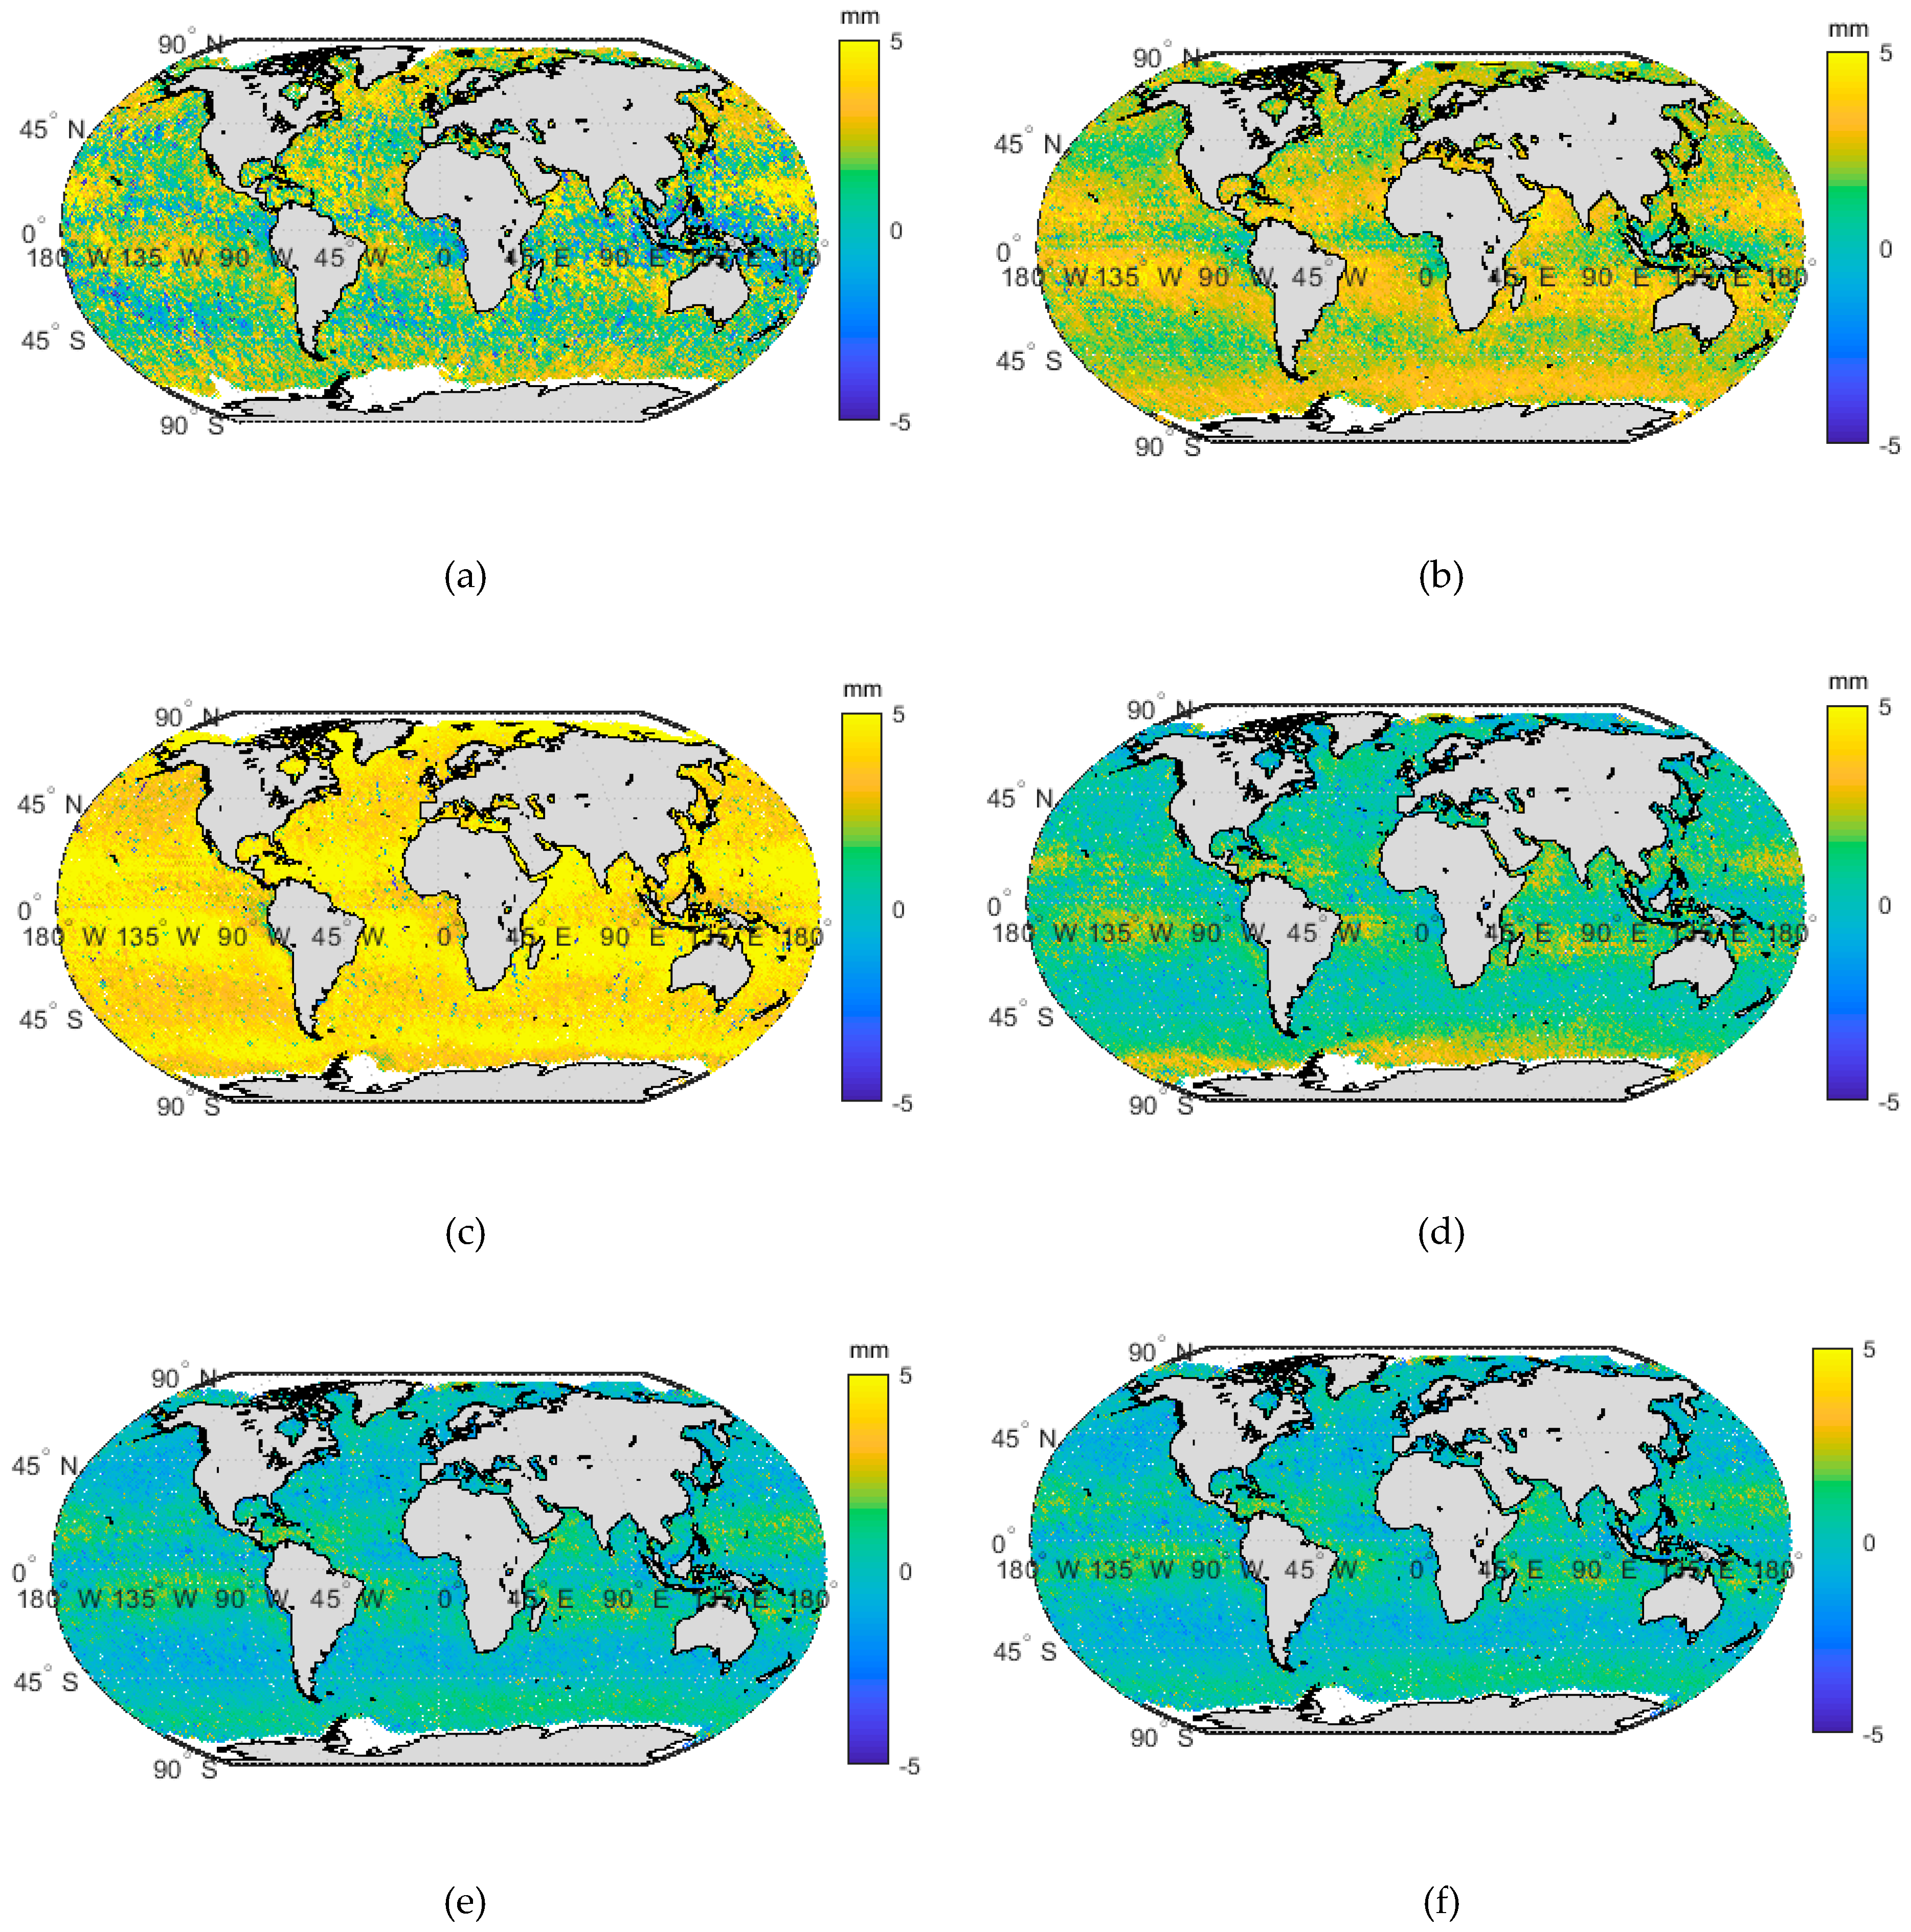
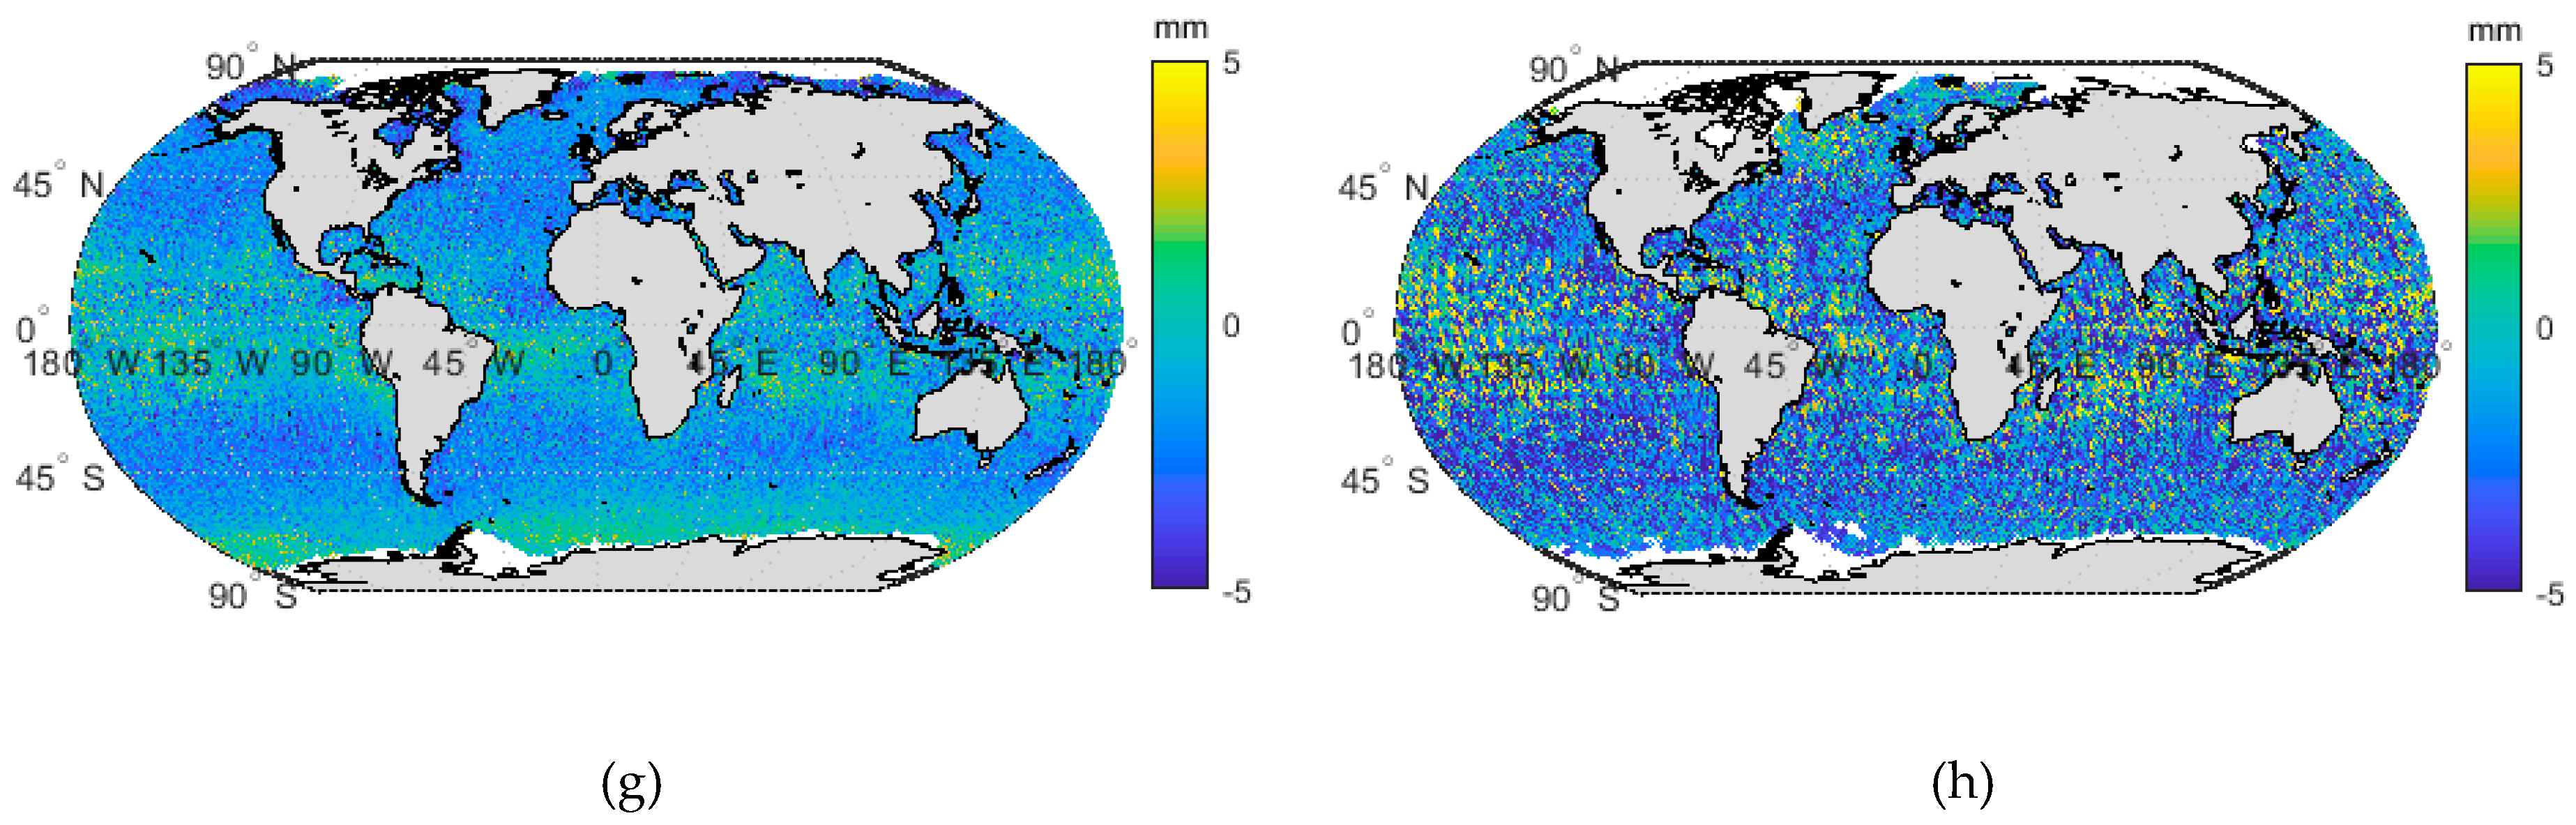
3.1. Gglobal Distribution of Wet Tropospheric Delay and Water Vapor

The global distribution of WTC/PWV is first presented, which provides a background for the spatial analysis of HY-2A CMR products. Here the average NWM values from 2011 to 2012 were used, which is shown as Figure 2. The WTC and PWV temporal changing rate (per hour) are also presented in Figure 2. WTC is mainly influenced by water vapor, therefore WTC and PWV had a very strong correlation with each other, and the distribution and changing rate of WTC and PWV were quite similar. Global WTC varied from less than 5 cm in the polar region to ~35 cm in tropical regions, and the average value was ~15 cm. The average PWV was ~20 mm and the peak value was ~60 mm. The global average changing rate was ~1.2 mm/h in WTC and ~0.25 mm/h in PWV. However, the changing rate shows a different distribution compared to the total amount. The most abundant PWV area, i.e., the tropical area, and the most scarce area, i.e., the polar area showed a lower changing rate than mid-high latitude area, and the most dramatic changing rate occurred in the mid-high latitude area around 45° with a changing rate of ~ 4 mm/h in WTC and ~0.7 mm/h in PWV, respectively.

3.2. HY-2A CMR Products Preprocessing

Before comparison, HY-2A raw data flagged as land, ice, and rain, were all removed. The total number of useful points of 7 years was about 95 million. However, there are still some obvious outlier points of HY-2A WTC/PWV with huge values. We applied a rough data cleaning procedure on the HY-2A products, where PWV larger than 500 mm and WTC larger than 3 m were excluded, which accounts for 0.066% of the original points. Figure 3 shows the temporal and spatial distribution of the excluded outlier points. As shown in Figure 3a, the outlier points are constant values with 3.277 m in both WTC and PWV. The distribution of the outlier points is not random, but usually appeared as a whole ascending or descending track, and the duration was relatively long. These outlier points appear only before 2014, indicated that HY-2A CMR data is not stable during the first three years.
Moreover, the points larger than the mean value over three-time standard deviation (STD) were excluded. Figure 4 shows the spatial distribution of the outlier points. Compared with Figure 2, the area with fewer outlier points is consistent with the region with lower PWV contents and a slower changing rate. Also, an outlier points band was formed around the North Pole and the South Pole, which is the edge of the observation, and the HY-2A CMR products were larger than the model values in the region with ~20 cm in WTC and ~20 mm in PWV. Moreover, many outlier points were found along with the coastal areas, which means that the accuracy of HY-2A CMR products in coastal areas and the polar area are relatively lower. Ice or land had different TB characteristics with ocean [24], and the footprint of HY-2A CMR was 40 km, which could contain the signal from ice or land and contaminate the TB measurements. Thus, the accuracy of HY-2A CMR products was influenced.

3.3. Comparison between HY-2A CMR and Numerical Weather Model

3.3.1. Overall Accuracy Assessment of HY-2A Calibration Microwave Radiometer

After applying the three-time STD criterion, the valid points were about 95 million. There were 877,577 points for WTC data which accounted for 0.93% of the original data, and 955,269 points for PWV data which accounted for 1.01% of the original data that were excluded. Figure 5 shows the scatter diagram of HY-2A WTC/PWV products and NWM with an accuracy assessment, respectively. In this paper, the differences were the HY-2A CMR values minus NWM values.
From the comparison results of 122 cycles in-flight data in Figure 5, HY-2A CMR WTC had a root-mean-square (RMS) of 2.29 cm with a systematic bias of 0.71 cm and the PWV in RMS was 3.59 mm with a systematic bias of 1 mm. HY-2A CMR data were larger than NWM during 7 years comparison. The linear fit line also reveals a systematic deviation between HY-2A WTC/PWV and NWM. The correlation coefficients between HY-2A WTC/PWV and ECMWF was higher than 97%, which means they had a high positive correlation. In summary, comparing with the NWM, the accuracy of HY-2A WTC was 2.29 cm, the PWV accuracy was 3.59 mm, while a systematic bias existed between HY-2A and NWM.

3.3.2. HY-2A CMR Products Spatial Analysis

HY-2A CMR products range from approximately 80° S to 80° N. To analyze the spatial distribution of HY-2A CMR products, the differences between HY-2A CMR products and NWM were divided by 10° from 80° S to 80° N. As shown in Figure 6, the accuracy assessment of each part was obtained, which included mean values, RMS, STD and the relative RMS error, i.e., the mean proportion of RMS in the original observation.
From Figure 6a, the ratio of HY-2A WTC reached the bottom at (8%) between 0–10° and the overall trend of the ratio increased with the latitude, the top appeared in the Arctic (43%). The WTC STD varied from ~1.5 cm to ~2.3 cm, which decreased with the increase of latitude and the peak value appeared between 0–10°. The trends of RMS and mean values were almost the same from 40°S to 40°N. The symmetry area of the northern and southern hemispheres was in the 0–10° range. In the 10–20° region, the mean value and RMS reached a top value of ~1.3 cm and ~2.8 cm, respectively. Afterward, the value of RMS reduced with the latitude, with a minimum value of ~2 cm in polar regions. The lowest mean value occurred between 30° and 40° latitude with a value of ~0.2 cm and the mean value increased with latitude after the latitude over 40°. The result of RMS and relative RMS error in the Antarctic region are better than the Arctic region, which means the accuracy of HY-2A WTC in the Antarctic region is better than the Arctic. The HY-2A PWV variation trend of the four kinds of evaluation parameters with respect to (w.r.t.) latitude in Figure 6b is almost the same as that of WTC except for the largest ratio RMS which is located in the Antarctic (48%). PWV accuracy coefficients symmetrically distribute roughly at 0° N to 10° N area. The PWV STD maximum value was 3.72 mm (0–10°N) and the minimum one (~2 mm) was in the Antarctic. The minimum mean value was ~0.5 mm (between 10–20°) and the maximum value was ~1.5 mm (30–40°). The RMS ranged from ~4 mm (10–20°) to ~2.5 mm (Antarctic).
Moreover, HY-2A data were divided into three parts, which includes polar area (>66.5°), mid-latitude area (23.5° to 66.5°) and tropical area (between −23.5°N and 23.5°S). The accuracy evaluation of each region is shown in Table 2. The accuracy of HY-2A WTC/PWV in the mid-latitude and polar areas are similar in value, while the ratio of RMS to observation at the polar area (~42%) is much larger than that in the mid-latitude region (~26%), which indicates HY-2A CMR agrees better with NWM in mid-latitude areas than polar area. In the tropical region, HY-2A products accuracy assessment values are much larger than the other two parts, while relative RMS error is much lower (~11%). Therefore, for the three climatic zones, it is noteworthy that HY-2A WTC/PWV data gets worse performance in the polar region, which may because of the ice in the polar area.
Furthermore, all the differences were resampled into a grid of 0.25° × 0.25°, which includes the STD and mean values at each grid. The spatial distribution of the difference values is shown in Figure 7.
As shown in Figure 7, the global mean value distribution of WTC and PWV was nearly unanimous. In most area of the tropics and polar region, HY-2A CMR data was larger than NWM, while in the mid-latitude area it was the exact opposite. When HY-2A CMR got closer to a higher latitude, the bias became larger, which led to the same conclusion as Section 3.2. While the STD of WTC/PWV distribution shows a different pattern, the STD in the polar region was small, which was caused by the low PWV content in the polar area. Moreover, the areas with abundant PWV contents and high changing rates displayed higher STD values. Among which, the west coast of Atlantic had lower mean values but a higher STD, which is mainly caused by the high changing rate of WTC/PWV. Moreover, the STD of WTC showed a higher bias in the southeast India Ocean compared to the STD of PWV, which indicated that the HY-2A PWV product was more stable than WTC in the area. Also, the agreement between HY-2A CMR products and NWM was not good in the coastal region. This is consistent with the results of Figure 4, which indicated that HY-2A nearshore data need further improvement.

3.3.3. HY-2A CMR Products Temporal Analysis

HY-2A CMR has been in orbit for more than 7 years, while due to the aging of hardware, the observation drift is inevitable because of the aging of equipment, which occurred at other microwave radiometers [13,14]. Here, data of each month were extracted separately to explore the accuracy of HY-2A CMR products. Figure 8 shows the comparison results between HY-2A products and NWM of each month. Meanwhile, since the observation target is the ocean, the global average TB of each day should be similar. Here the average TB from three bands every single day was achieved, which is shown as Figure 9. Moreover, to show the annual changing of HY-2A CMR products globally, the global distribution of the yearly average differences between HY-2A WTC/PWV and NWM from 2011 to 2018 were obtained, which are shown in Figure 10 and Figure 11.
Figure 8 shows that the accuracy of the WTC/PWV decreased dramatically during the first three years, the maximum biases were in August 2013 with an RMS of 4.8 cm in WTC and 7.6 mm in PWV. The lower accuracy before 2014 was caused by the systematic bias of TB measurements at 37 GHz band. As the TB bias at 37 GHz band was a systematic error, the STD of the WTC/PWV difference between the HY-2A CMR products and NWM remained relatively stable, and ranged from ~1.5 cm to ~2.0 cm in WTC and ranged ~2.0 mm to ~2.9 mm in PWV. Analyzing the annual average global time series, in the first three years from 2011–2013, the differences between HY-2A CMR WTC/PWV and NWM gradually increased. Among which, in 2013, most of the WTC exceeded more than 3 cm, and most of the PWV exceeded 5 mm.
From April 2014, the systematic bias of 37 GHz band was removed, therefore HY-2A CMR products show a very good agreement with NWM. The mean biases between HY-2A and NWM became very small with 0.03 cm in WTC and 0.01 mm in PWV from April 2014 to May 2017. In addition, the STD between HY-2A CMR and NWM also decreased. Globally, the accuracy of HY-2A CMR products in the Antarctic of 2014 was poor, especially for PWV products. The difference between HY-2A CMR PWV and NWM was more than 5 mm and WTC product biases were also more than 3 cm. The year 2015 was the year with the best data quality after the HY-2A satellite launched. The differences between the HY-2A and NWM in the Antarctic were reduced.
However, since June 2017, TB measurements at the 18.7 GHz band became unstable, which led to the biases between the two sets becoming very large again. The average bias between HY-2A and NWM reached −1.52 cm in WTC and –3.02 mm in PWV from June 2017 to February 2018, and the STD value also increased. In most parts of the world in 2017, the HY-2A product was obviously smaller than NWM. The WTC of HY-2A was smaller than the NWM with ~3 cm and in PWV it had reached 5 mm in the middle and higher latitudes. In 2018, only one and a half months of HY-2A data was available, hence the spatial resolution was relatively lower than in other years, which shows a similar distribution to last year. When the three bands were in good condition, HY-2A CMR products showed high accuracy with a RMS of 1.68 cm in WTC and 2.65 mm in PWV from April 2014 to May 2017, therefore, a new adjustment on the HY-2A CMR should be conducted and is in urgent need.

3.3.4. Validation of HY-2A CMR Products based on Radiosonde

Moreover, WTC/PWV data from 137 radiosonde stations were used to validate the products from HY-2A CMR, the results are shown as Figure 12. As shown in Figure 12, the monthly variation of WTC/PWV based on radiosonde data was similar to the result from ECMWF. Before April 2014, HY-2A CMR showed a relatively lower accuracy and the maximum bias was in August 2013. From April 2014 to May 2017, HY-2A showed a better agreement with RMS in WTC of 2.37 cm and in PWV of 3.9 mm. The agreement between HY-2A CMR and radiosonde was relatively worse than the result from ECMWF, which was because of the time gap (average gap ~49 min) and horizontal distance (average distance ~137 km) in the comparison crossovers. While since June 2017, the agreement became worse again. The validation results show the same trend in time, which verify the results based on ECMWF.

4. Discussion

WTC is the critical factor for high-precision altimetry products, therefore, the validation of CMR WTC is very important. HY-2A has been working in-orbit for over 7 years, while the comprehensive validation for HY-2A CMR has not been conducted. HY-2A CMR WTC is higher than NWM in the tropical area and lower than NWM in the mid-latitude area. The accuracy in the polar region is lower than the tropical area and mid-latitude area, and the accuracy of HY-2A CMR WTC is relatively lower in coastal areas, which are caused by TB contamination by land or sea ice. The improvement for HY-2A CMR products in these areas should be carried out. Previous studies have been done on improving the accuracy of altimeter data on other satellites [25,26] and it will also be covered by our future work on HY-2A CMR, which includes applying the existing method on HY-2A CMR and improving the algorithm furtherly.
During October 2011 to March 2014, a systematic bias was revealed because of the TB bias from the 37 GHz band. After April 2014, the TB from 37 GHz band became normal again. Since June 2017, TB measurements from the 18.7 GHz band became unstable, which make the HY-2A CMR data quality inaccurate again. Therefore, the calibration for HY-2A CMR is urgent, and if the 18.7 GHz band fails, the accuracy of HY-2A CMR products from dual-band should be discussed compared to three-band products. Moreover, the aging of hardware is inevitable, hence high temporal resolution monitoring method for HY-2A CMR data is also needed. The reanalysis NWM has three months delay and numerical weather forecast accuracy is not satisfactory [27]. The time resolution of radiosonde data is relatively low. Global wet delay and PWV data with high accuracy could be derived from the global navigation satellite system (GNSS) observations [28]. Moreover, ship-borne GNSS data could also supplement open-ocean validation [29,30]. Therefore, the calibration and validation model based on GNSS can monitor HY-2A CMR products with high temporal resolution and furtherly serve the application of HY-2A data in marine science, which is also the future work.

5. Conclusions

HY-2A CMR data is very important for the application of HY-2A altimetry data, therefore, the evaluation for HY-2A CMR data is necessary. Meanwhile, the high accuracy PWV product from HY-2A CMR can enrich the ocean PWV measurement method. This paper focused on the validation of HY-2A CMR products with 7 years of in-flight data with NWM. The RMS between HY-2A CMR and NWM in WTC was 2.29 cm with a system deviation of 0.71 cm and in PWV is 3.59 mm with the system deviation of ~1 mm. The accuracy of the northern and southern hemispheres were symmetrical in the range of 0–10 °N, STD and RMS were getting larger when closer to 0–10°N, while relative RMS error was getting smaller when closer to 0–10°N. HY-2A CMR WTC/PWV accuracy in the polar regions showed a worse agreement compared to the tropical area and mid-latitude area, and the differences between the HY-2A CMR products and NWM in the coastal area were also significant, which were all caused by land/ice TB contamination.
Temporally, the accuracy of HY-2A CMR products decreased from October 2011 to March 2014 and reached the top of RMS 4.62 cm in WTC and 7.61 mm in PWV in August 2013, which was caused by unsuitable retrieval coefficients and the TB measurement biases from the 37 GHz band. After April 2014, the TB bias corrected, the systematic bias between HY-2A CMR and NWM was eliminated, and STD was also reduced. However, the quality of HY-2A CMR products decreased after June 2017 because of the TB problem from the 18.7 GHz band. Overall, HY-2A showed high accuracy with RMS of 1.68 cm in WTC and 2.65 mm in PWV when the three bands were in good condition, and further calibration for HY-2A CMR should be conducted. Moreover, 137 global coastal radiosonde stations were used to validate HY-2A CMR, which shows the same variation trend in time of HY-2A CMR compared to the results from ECMWF, and thus proves the results from ECMWF.

Author Contributions

All authors have made a great contribution to this study and paper. Funding acquisition, Y.L. (Yanxiong Liu); methodology, Z.W. and Y.L. (Yang Liu); project administration, Y.L. (Yanxiong Liu); software, J.W.; validation, X.H.; writing—original draft, Z.W.; writing—review and editing, J.W., Y.L. (Yanxiong Liu), X.H., Y.L. (Yang Liu) and W.X.

Funding

This research was funded by the National Key R&D Program of China (2017YFC1405100) and the National Natural Science Foundation of China (41876106). Mr. Jungang Wang was financially supported by the China Scholarship Council (File No.201606260035).

Acknowledgments

We would like to thank NSOAS for HY-2A CMR data. ECMWF for ERA-Interim data. Technische Universitat Wien for VMF3 grid data.

Conflicts of Interest

The authors declare no conflict of interest.

References

  1. Chen, N.; Han, G.; Yang, J.; Chen, D. Hurricane sandy storm surges observed by hy-2a satellite altimetry and tide gauges. J. Geophys. Res. Ocean. 2014, 119, 4542–4548. [Google Scholar] [CrossRef]
  2. Cui, W.; Wang, W.; Jie, Z.; Yang, J.; Jia, Y. Improvement of sea surface height measurements of hy-2a satellite altimeter using jason-2. Mar. Geod. 2018, 41, 1–17. [Google Scholar] [CrossRef]
  3. Zheng, G.; Yang, J.; Li, X.; Zhou, L.; Ren, L.; Chen, P.; Zhang, H.; Lou, X. Using artificial neural network ensembles with crogging resampling technique to retrieve sea surface temperature from hy-2a scanning microwave radiometer data. IEEE Trans. Geosci. Remote Sens. 2018, 57, 985–1000. [Google Scholar] [CrossRef]
  4. Zhang, D.; Wang, Z.; Wang, H.; Zhao, J.; Li, Y. Acmr system description and performance. In Proceedings of the 2014 IEEE International Geoscience and Remote Sensing Symposium (IGARSS), Quebec City, QC, Canada, 13–18 July 2014; IEEE: Piscataway, NJ, USA, 2014; pp. 5179–5182. [Google Scholar]
  5. Zheng, G.; Yang, J.; Ren, L. Retrieval models of water vapor and wet tropospheric path delay for the hy-2a calibration microwave radiometer. J. Atmos. Ocean. Technol. 2014, 31, 1516–1528. [Google Scholar] [CrossRef]
  6. Ruf, C.S.; Keihm, S.J.; Subramanya, B.; Janssen, M.A. Topex/poseidon microwave radiometer performance and in-flight calibration. J. Geophys. Res. Ocean. 1994, 99, 24915–24926. [Google Scholar] [CrossRef]
  7. Obligis, E.; Tran, N.; Eymard, L. An assessment of jason-1 microwave radiometer measurements and products. Mar. Geod. 2004, 27, 255–277. [Google Scholar] [CrossRef]
  8. Brown, S. A novel near-land radiometer wet path-delay retrieval algorithm: Application to the jason-2/ostm advanced microwave radiometer. IEEE Trans. Geosci. Remote Sens. 2010, 48, 1986–1992. [Google Scholar] [CrossRef]
  9. Wang, J.; Zhang, J.; Fan, C.; Wang, J. Validation of the “hy-2” altimeter wet tropospheric path delay correction based on radiosonde data. Acta Oceanol. Sin. 2014, 33, 48–53. [Google Scholar] [CrossRef]
  10. Zhang, D.; Wang, Z.; Li, Y.; Zhao, J.; Liu, Y. Preliminary analysis of hy-2 acmr data. In Proceedings of the 2015 IEEE International Geoscience and Remote Sensing Symposium (IGARSS), Milan, Italy, 26–31 July 2015; IEEE: Piscataway, NJ, USA, 2015; pp. 177–180. [Google Scholar]
  11. Zheng, G.; Yang, J.; Ren, L.; Zhou, W.; Huang, L. The preliminary cross-calibration of the hy-2a calibration microwave radiometer with the jason-1/2 microwave radiometers. Int. J. Remote Sens. 2014, 35, 4515–4531. [Google Scholar] [CrossRef]
  12. Zhao, J.; Zhang, D.; Wang, Z.; Li, Y. Validation of hy-2a acmr retrieval algorithms and product. In Proceedings of the 2016 IEEE International Geoscience and Remote Sensing Symposium (IGARSS), Beijing, China, 10–15 July 2016; IEEE: Piscataway, NJ, USA, 2016; pp. 411–413. [Google Scholar]
  13. Obligis, E.; Eymard, L.; Tran, N.; Labroue, S.; Femenias, P. First three years of the microwave radiometer aboard envisat: In-flight calibration, processing, and validation of the geophysical products. J. Atmos. Ocean. Technol. 2006, 23, 802–814. [Google Scholar] [CrossRef]
  14. Brown, S. Maintaining the long-term calibration of the jason-2/ostm advanced microwave radiometer through intersatellite calibration. IEEE Trans. Geosci. Remote Sens. 2013, 51, 1531–1543. [Google Scholar] [CrossRef]
  15. Jiang, M.; Xu, K.; Liu, Y. Calibration and validation of reprocessed hy-2a altimeter wave height measurements using data from buoys, jason-2, cryosat-2, and saral/altika. J. Atmos. Ocean. Technol. 2018, 35, 1331–1352. [Google Scholar] [CrossRef]
  16. Robinson, I.S. Measuring the Oceans from Space: The Principles and Methods of Satellite Oceanography; Springer Science & Business Media: Berlin/Heidelberger, Germany, 2004. [Google Scholar]
  17. Wang, Z.; Zhang, D. Simulation on retrieving of atmospheric wet path delay by microwave radiometer on hy-2 satellite. In Proceedings of the 2008 China-Japan Joint Microwave Conference, Shanghai, China, 10–12 September 2008; IEEE: Piscataway, NJ, USA, 2009; pp. 665–668. [Google Scholar]
  18. Dee, D.P.; Uppala, S.M.; Simmons, A.; Berrisford, P.; Poli, P.; Kobayashi, S.; Andrae, U.; Balmaseda, M.; Balsamo, G.; Bauer, d.P. The era-interim reanalysis: Configuration and performance of the data assimilation system. Q. J. R. Meteorol. Soc. 2011, 137, 553–597. [Google Scholar] [CrossRef]
  19. Chen, B.; Liu, Z. Global water vapor variability and trend from the latest 36 year (1979 to 2014) data of ecmwf and ncep reanalyses, radiosonde, gps, and microwave satellite. J. Geophys. Res. Atmos. 2016, 121, 11–442. [Google Scholar] [CrossRef]
  20. Landskron, D.; Böhm, J. Vmf3/gpt3: Refined discrete and empirical troposphere mapping functions. J. Geod. 2018, 92, 349–360. [Google Scholar] [CrossRef] [PubMed]
  21. Kouba, J. Implementation and testing of the gridded vienna mapping function 1 (vmf1). J. Geod. 2008, 82, 193–205. [Google Scholar] [CrossRef]
  22. Karl Hennermann, P.B. Era-interim: Surface Elevation and Orography. Available online: https://confluence.ecmwf.int/pages/viewpage.action?pageId=79955800 (accessed on 15 March 2019).
  23. Gesch, D.; Greenlee, S. Gtopo30 Documentation; 12201 Sunrise Valley Dr.; US Department of the Interior US Geological Survey: Reston, VA, USA, 1996.
  24. Obligis, E.; Desportes, C.; Eymard, L.; Fernandes, M.; Lázaro, C.; Nunes, A. Tropospheric corrections for coastal altimetry. In Coastal Altimetry; Springer: Berlin/Heidelberger, Germany, 2011. [Google Scholar]
  25. Fernandes, M.J.; Bastos, L.; Antunes, M. Coastal satellite altimetry-methods for data recovery and validation. In Proceedings of the 3rd Meeting of the International Gravity and Geoid Commission “Gravity and Geoid; Thessaloniki, Greece, 26–30 August 2002, Citeseer: Princeton, NJ, USA, 2002; pp. 26–30. [Google Scholar]
  26. Fernandes, M.J.; Lázaro, C. Gpd+ wet tropospheric corrections for cryosat-2 and gfo altimetry missions. Remote Sens. 2016, 8, 851. [Google Scholar] [CrossRef]
  27. Bock, O.; Nuret, M. Verification of nwp model analyses and radiosonde humidity data with gps precipitable water vapor estimates during amma. Weather Forecast. 2009, 24, 1085–1101. [Google Scholar] [CrossRef]
  28. Lee, S.-W.; Kouba, J.; Schutz, B.; Kim, D.H.; Lee, Y.J. Monitoring precipitable water vapor in real-time using global navigation satellite systems. J. Geod. 2013, 87, 923–934. [Google Scholar] [CrossRef]
  29. Wang, J.; Wu, Z.; Maximilian, S.; Zus, F.; Gerland, S.; Ramatschi, M.; Ge, M.; Wickert, J.; Schuh, A.H. Retrieving precipitable water vapor from shipborne multi-gnss observations. Geophys. Res. Lett. 2019, 46, 5000–5008. [Google Scholar] [CrossRef]
  30. Liu, Y.; Liu, Y.; Chen, G.; Wu, Z. Evaluation of hy-2a satellite-borne water vapor radiometer with shipborne gps and glonass observations over the indian ocean. GPS Solut. 2019, 23, 87. [Google Scholar] [CrossRef]
Figure 1. Global Radiosonde stations distribution, the red triangles represent radiosonde stations.
Remotesensing 11 01616 g001
Figure 2. Global content and changing rate distribution of precipitable water vapor (PWV)/wet troposphere delay correction (WTC). (a) Global PWV distribution; (b) PWV changing rate; (c) global WTC distribution; (d) WTC changing rate.
Remotesensing 11 01616 g002
Figure 3. Figure 3. The distribution of HY-2A WTC/PWV outlier points in time (a), and space (b), the color in the bar of (b) represents the time of outlier points.
Remotesensing 11 01616 g003
Figure 4. Spatial distribution of HY-2A WTC/PWV outliers: (a) WTC; (b) PWV. The color represents the difference between HY-2A and the numerical weather model (NWM).
Remotesensing 11 01616 g004
Figure 5. Scatter diagrams of HY-2A and NWM: (a) WTC; (b) PWV. The red line is fitted line between HY-2A CMR products and NWM, the dotted red line represents simulated line y = x, the accuracy assessment is in the bottom-right and correlation of two sets in the up-left. The color from dark to light describes the absolute bias between HY-2A CMR and NWM.
Remotesensing 11 01616 g005
Figure 6. HY-2A CMR products accuracy assessment in latitude: (a) WTC; (b) PWV. The left axis is the average ratio of root-mean-square (RMS) and observation values, the blue line represents relative RMS error. The right axis is the mean values, standard deviation (STD) and RMS, whereas the solid red line describes mean values, the long dotted red line describes RMS and the short-dotted line represents STD.
Remotesensing 11 01616 g006
Figure 7. Global distribution of the WTC/PWV differences between HY-2A CMR products and NWM; (a,b) describe mean value and STD of WTC differences, respectively; (c,d) describe mean value and STD of PWV differences, respectively.
Remotesensing 11 01616 g007
Figure 8. HY-2A CMR products accuracy with respect to (w.r.t.) time: (a) WTC; and (b) PWV. The green circle represents the mean value, the purple hexagonal represents STD and dark pentagram represents RMS.
Remotesensing 11 01616 g008
Figure 9. Daily average brightness temperature (TB) of HY-2A CMR for the three bands: Upper: 18.7 GHz; middle: 23.8 GHz; bottom: 37 GHz.
Remotesensing 11 01616 g009
Figure 10. The global distribution of WTC differences between HY-2A CMR and NWM; (ah) from 2011 to 2018, respectively. Since there are less than three months in the years 2011 and 2018, the resolution is relatively lower.
Remotesensing 11 01616 g010aRemotesensing 11 01616 g010b
Figure 11. Global distribution of PWV differences between HY-2A CMR and NWM; (ah) from 2011 to 2018, respectively. The lower resolution of 2011 and 2018 is because of less data.
Remotesensing 11 01616 g011aRemotesensing 11 01616 g011b
Figure 12. Validation for HY-2A CMR based on radiosonde data: (a) WTC; (b) PWV.
Remotesensing 11 01616 g012
Table 1. Main Performance Indicators of Haiyang-2A (HY-2A) calibration microwave radiometer (CMR).
Main Performance IndicatorsChannel 1Channel 2Channel 3
Center Frequency18.7 GHz23.8 GHz37 GHz
Bandwidth250 MHz250 MHz500 MHz
Antenna Beamwidth1.4°1.1°0.6°
Integration Time200 ms200 ms200 ms
Calibrated Ground Footprint (from 965 km)24 km19 km 10 km
Sensitivity0.4 K0.4 K0.4 K
Calibration Accuracy 1 K1 K1 K
Table 2. HY-2A product accuracy of in different regions.
HY-2A ProductRegionMeanSTDRMS 1
WTC (cm)Global0.712.172.29 (22.3%)
Tropical1.072.332.56 (11.4%)
Mid-latitude0.512.062.12 (25.9%)
Polar Area0.521.982.05 (41.8%)
PWV (mm)Global1.043.443.48 (22.4%)
Tropical1.423.774.03 (11.3%)
Mid-latitude0.813.133.24 (26.3%)
Polar Area0.883.043.16 (42.1%)
1 Values in the parentheses are relative RMS errors.

