Article

Identification of Natural and Anthropogenic Drivers of Vegetation Change in the Beijing-Tianjin-Hebei Megacity Region

1
State Key Laboratory of Urban and Regional Ecology, Research Center for Eco-Environmental Sciences, Chinese Academy of Sciences, Beijing 100085, China
2
College of Tourism and Urban-Rural Planning, Chengdu University of Technology, Chengdu 610059, China
3
College of Resource Environment and Tourism, Capital Normal University, Beijing 100048, China
*
Author to whom correspondence should be addressed.
Remote Sens. 2019, 11(10), 1224; https://doi.org/10.3390/rs11101224
Submission received: 11 April 2019 / Revised: 15 May 2019 / Accepted: 20 May 2019 / Published: 23 May 2019
(This article belongs to the Special Issue Monitoring Vegetation Phenology: Trends and Anomalies)

Abstract

:
Identifying the natural and anthropogenic mechanisms of vegetation changes is the basis for adapting to climate change and optimizing human activities. The Beijing-Tianjin-Hebei megacity region, which is characterized by significant geomorphic gradients, was chosen as the case study area. The ordinary least squares (OLS) method was used to calculate the NDVI trends and related factors from 2000 to 2015. A geographic weighted regression (GWR) model of NDVI trends was constructed using 14 elements of seven categories. Combined with the GWR calculation results, the mechanisms of the effects of explanatory variables on NDVI changes were analyzed. The findings suggest that the overall vegetation displayed an increasing trend from 2000 to 2015, with an NDVI increase of ca. 0.005/year. Additionally, the NDVI fluctuations in individual years were closely related to precipitation and temperature anomalies. The spatial pattern of the NDVI change was highly consistent with the gradients of geomorphology, climate, and human activities, which have a tendency to gradually change from northwest to southeast. The dominant climate-driven area accounted for only 5.98% of the total study area. The vegetation improvement areas were regionally concentrated and had various driving factors, and vegetation degradation exhibited strong spatial heterogeneity. The vegetation degradation was mainly caused by human activities. Natural vegetation was improved because of natural factors and reductions in human activities. Moreover, cropland vegetation as well as urban and built-up area improvements were related to increased human actions and decreased natural effects. This study can assist in ecological restoration planning and ecological engineering implementation in the study area.

Graphical Abstract

1. Introduction

Under the combined effects of global climate change and regional socioeconomic activities, vegetation at different spatial scales is undergoing complex change processes [1,2]. Thus, rationally distinguishing the natural and anthropogenic drivers of vegetation change has become the basis for ecological restoration. The normalized difference vegetation index (NDVI) is an important parameter of the vegetation environment [3,4], and its spatial differentiation and dynamics have become important indicators for ecological environment monitoring [5]. Therefore, many researchers have applied different types and multi-temporal NDVI products [6,7,8] to study the patterns and driving forces of vegetation changes.
At a global scale, vegetation differentiation and trends are affected by various factors, such as climate [9,10], landforms [11,12], land cover types [13,14], and human activities [14,15,16,17]. For example, de Jong et al. [18] believed that global terrestrial vegetation activities had generally declined with climate change from 1982 to 2008. Strong ENSO events and volcanic activity made significant effects on dramatic changes in vegetation. Zhang et al. [19] found that global vegetation showed a remarkable greening trend from 2000 to 2015 based on MODIS-C6 vegetation index product, and stronger association between the climate and vegetation in the boreal and arid regions than other areas. Chen et al. [14] pointed out that global MODIS data revealed increasing leaf area of vegetation from 2000 to 2017, which is caused by human land-use management and climate change, CO2 fertilization, nitrogen deposition, and recovery from natural disturbances. Liu et al. [15] found that global NDVI increased from 1982 to 2012. However, it is unclear how natural and human factors together affect NDVI trends and how their effects evolve over time.
At the regional scale, especially in urban agglomerations, natural and anthropogenic factors are strongly coupled [20]. Researchers face the interaction of them [21], especially multidimensional and multivariant human activities [22], because various factors have different effects on NDVI differentiation and trends, such as convergence, divergence, nonlinearity, threshold, and feedback [23,24,25]. For example, Barrera and Henríquez [26] studied three urban agglomerations in Chile located in different climates found that urban expansion led to reduced vegetation from 1986 to 2015, and also promoted the improvement of vegetation inside the cities [26]. Zewdie et al. [27] monitored the NDVI dynamics in Northwestern Ethiopia from 2000 to 2014, which found that climate variables were not the main explaining factors, and the decline in vegetation was affected by the increasing pressure of human activities. Peng et al. [28] found the NDVI generally increased in Eastern China from 1999 to 2008 with complex differences driven by precipitation and temperature, and the impact of anthropogenic activities on vegetation dynamics had accumulative effects and a phase effect. Hu et al. [29] found that the NDVI overall improved from 2000 to 2016, which was influenced by climate change, topographic factors, afforestation, resident lifestyles, and economic development policies in the Pearl River Delta of China.
Previous research has revealed the differentiation pattern, change dynamics, and driving mechanism from various angles. However, there is no consensus on the types, strengths, spatial distributions, and time series evolution of natural and anthropogenic drivers of vegetation changes at the global or regional scale, and impacts such as geomorphic gradients and land cover types have not been fully considered. Can we solve these problems to a certain extent through reasonable geographic division and matching data selection and regional scale method application? We chose the Beijing-Tianjin-Hebei megacity region with significant geomorphic gradients as the research area, which is experiencing high-speed economic development and facing complex ecological problems. This study was performed to (i) detect the overall trend of the NDVI changes from 2000 to 2015, (ii) reveal the spatial differentiation characteristics of the NDVI trends, and (iii) distinguish the natural and anthropogenic drivers of NDVI trends in different land cover types and different geomorphic units.

2. Materials and Methods

2.1. Study Area

The Beijing-Tianjin-Hebei megacity region (abbreviated as BTH) is China’s political and cultural center and an important core area for the economy of Northern China (Figure 1a). The geographical scope (GCS_WGS_1984) is 113.457–119.8526°E, 36.0431–42.6216°N, which covers an area of approximately 218,000 km2. The region belongs to the continental semi-humid and semiarid monsoon climate zone, where the annual mean precipitation was 534 mm, and the average temperature was 9.87 ℃ from 1980–2015, according to the data from the Resources and Environmental Data Cloud Platform (http://www.resdc.cn). The types of vegetation in BTH include natural vegetation and crops, of which natural vegetation includes warm temperate deciduous broad-leaved forests and temperate grasslands, and crops mainly include wheat, corn, and cotton (Figure 1b). The study area was divided into three primary geomorphic units and 14 secondary geomorphic units (Figure 1c). Each geomorphic unit presents gradient changes from northwest to southeast in the spatial distribution of geographic elements such as precipitation, temperature, elevation, slope, vegetation, and human activity intensity (Table A1). Due to the policy of national economic development and environmental protection, the ecological environment of BTH has gradually improved [30].

2.2. Data Sources and Preprocessing

Monthly MODND1M China 500 m NDVI products were used as the most important remote sensing data and were downloaded from the Geospatial Data Cloud (http://www.gscloud.cn) and the International Scientific and Technical Data Mirror Site, Computer Network Information Center, Chinese Academy of Sciences. This data set was obtained from MODND1D data using the maximum synthesis method. The MODND1D data were processed by MOD09GA through splicing, cutting, projection conversion, unit conversion, and other processing. The MODND1M data have good reproducibility for MODIS NDVI 16-day synthetic data with 250 m spatial resolution [31]. The Savitzky-Golay filtering method was applied to control the impact of noise in nonphysical data [32]. April to October was identified as the growing season for the major crops [33] for the annual scale NDVI data synthesis. The maximum synthesis method was used to synthesize the NDVI data during the growing season.
To study the spatial differentiation characteristics of the NDVI and analyze the relationship between NDVI trends and different geographical elements, the index selection and processing methods of other researchers were referenced [34,35,36], and the geographic factors were grouped into seven categories and 14 variables (Table 1).
The annual precipitation data and annual average temperature data were collected from the Data Center for Resources and Environmental Sciences, the Chinese Academy of Sciences (RESDC). The data set with a 1-km spatial resolution was based on daily observation data from more than 2400 meteorological stations nationwide and was generated by collation, calculation, and spatial interpolation. The monthly temperature and precipitation point data were downloaded from the China Meteorological Data Network. Meteorological observation stations in the BTH and surrounding areas were selected. ANUSPLIN software [37] (Fenner School of Environment and Society at the Australian National University, Linnaeus Way, Acton ACT, Australia) was used to generate monthly raster data with a 1-km spatial resolution, and precipitation and temperature data were synthesized for the growing season.
The composition, distribution, and growth of vegetation are closely related to groundwater, especially shallow groundwater [38]. The Gravity Recovery And Climate Experiment (GRACE) satellite contributed to the information on the distribution of terrestrial water reserve changes by measuring the gravity fluctuations caused by mass anomalies in different regions of the world. This provided a new method for indirectly monitoring NDVI trends [39]. The GFZ GRACE Products (version RL05) (https://grace.jpl.nasa.gov/) from April 2002 to July 2016 were collected, and monthly data for 2003 to 2015 were selected to calculate the trend of the groundwater changes.
As a major indicator of temperature, humidity, and illuminance, ELEVATION was used to characterize the geomorphic gradient effect at the macroscopic scale [40]. SLOPE describes the degree of microscopic changes in surface morphology [25], which was used to reflect the stability of surface material and movement and retention of water.
The Defense Meteorological Satellite Program Operational Linescan System (DMSP/OLS) nighttime imagery data derived from the National Oceanic and Atmospheric Administration (NOAA) and the National Geophysical Data Center (NGDC) revealed information closely related to the distribution of factors such as population and urban area. When using DMSP/OLS light data, socioeconomic factors need not be considered separately [41]. Stable lighting data products were synthesized from 1992 to 2013 global nighttime light time series data. The NLIGHT from 2000 to 2013 was calculated and used as a substitute for the change in human activity intensity over the same period.
Water systems reflect the spatial distribution of surface water and groundwater and control the hydrological conditions of vegetation distribution. Roads indicate human disturbance to natural vegetation and the intensity of the control over artificial vegetation, such as croplands [42]. Data on agricultural facilities, water systems, and roads (including national roads, provincial highways, highways, railways, and urban roads) were collected from the National Catalogue Service for Geographic Information (http://www.webmap.cn). The Euclidean distance calculation method was used to generate DIST_RIV and DIST_ROAD.
Irrigation and fertilization are important for artificially planted crops, and both factors have an impact on crop growth [43]. Data on effective irrigated area and fertilizer use (quantity) from each county except the built-up area in Beijing from 2001 to 2016 were collected from the Economic Yearbook. The annual data were assigned to the administrative unit of each county or district and then converted from vector data into raster data.
Land cover types in BTH include woodland/shrubland, grassland, wetland, cropland, urban, and built-up areas, etc. The dataset was provided by the Research Center for Eco-Environmental Sciences of the Chinese Academy of Sciences (RCEES) (http://www.rcees.ac.cn). Changes in land cover type and the corresponding NDVI trends from 2000 to 2015 were detected, and a numerical reduction in the NDVI was defined as degraded, while an increase was defined as improved. Land cover change was assigned values from −5 to +5 at intervals of 1 depending on the intensity of the change.
The initial NDVI has important effects on the rate, trend, and persistence of NDVI changes, while the factors influencing the changes in the NDVI also have diversity and phase characteristics. The NDVI during the growing season of 2000 was taken as one of the factors influencing the NDVI trends.

2.3. NDVI Trend Detection

The ordinary least squares (OLS) method was used to detect the NDVI trend (θslope) [44] from 2000 to 2015, where θslop e > 0 represents NDVI improvement, θslope < 0 represents NDVI degradation, and θslope = 0 represents almost no change in the NDVI. To evaluate the consistency of the NDVI trend, a two-sided Student’s t-test for the θslope was calculated [45]. Two confidence levels (p < 0.05 and p < 0.01) were identified such as the null hypothesis H0: (θslope) = 0. When the confidence level was statistically significant, two types of significance were defined: significant (0.01 < p < 0.05) and extremely significant (p < 0.01).

2.4. Analysis of NDVI Trends Based on GWR

The geographic weighted regression (GWR) model was used to analyze the influence mechanisms of 14 explanatory variables on the NDVI trends. Brunsdon et al. [46] provided a detailed introduction to the principles of GWR, which is expressed in Equation (1).
y i = β i 0 ( u i , v i ) + k = 1 n β i k ( u i , v i ) x i k + ε i
where n is the size of the sample, ( u i , v i ) is the spatial position of the ith sample point, β i 0 ( u i , v i ) and β i k ( u i , v i ) x i k are the constant estimates of the ith sample point and the parameter estimate, and ε i (i = 1, 2, 3, …, n) is the random error of the ith sample point. The influence of the observations around the spatial position i on the parameter estimation of the i-point decreases with the increase of the distance, which is represented by the distance attenuation effect. The distance-weighted ordinary least squares method can be used to estimate the parameters below.
β ^ ( u i , v i ) = ( X T W ( u i , v i ) X ) 1 X T W ( u i , v i ) Y
where β ^ is the estimated value of the parameter β, which is a matrix composed of the independent variable observations. Y is the variable composed of the independent variable observations and W is the spatial weight matrix, which is generally determined by using the Gaussian distance weight method.
W ( u i , v i ) = e 1 2 ( d i j b ) 2
where W ( u i , v i ) is the spatial weight of the observation point j for the ith sample point, b is the baseband width of the kernel function, and d i j is the Euclidean distance from the regression point i to the observation point j. When there is no spatial difference between the dependent variable and the independent variable, the data has spatial stability. Brunsdon et al. [47] introduced a stationarity index to evaluate the data stationarity in a regression model.
S I = β G W R _ i q r 2 × G L M _ s e
where S I is the stationarity index, β G W R _ i q r is the interquartile range of the standard error of the x n coefficient, and G L M _ s e is the standard error based on the global ordinary least square regression. If S I 1 , the relationship between the dependent variable and the independent variable is stationary, and the smaller the value, the higher the stationarity. The significance test of the model and the spatial autocorrelation of the model error term is performed on the GWR model. AIC [48] was commonly used to test the significance of different models.
A I C = 2 n l n ( σ ^ ) + n l n ( 2 π ) + n [ n + t r ( S ) n 2 t r ( S ) ]
where n is the size of the sample, σ ^ is the standard deviation of the error term estimate, t r ( S ) is the trace of the projection matrix S of the GWR model, which is a function of the bandwidth, and the model with a smaller AIC value is better [49].
In the present study, the GWR model was implemented in the GWR4 software [35,50], which was developed at NCG (National Center for Geocomputation, National University of Ireland Maynooth) and Department of Geography, Ritsumeikan University, Japan (http://gwr.nuim.ie). The GWR4 software was used to complete the regression analysis of the NDVI trends and influencing factors. All the data involved in the calculation were resampled to raster data with a spatial resolution of 1 km, and a point file covering the study area was constructed with each data point controlling nine grids (3 km × 3 km), and the mean value of the nine grids was assigned to the center point. The NDVI change trend was defined as the independent variable, and it was divided into six scenarios: extremely significant decrease areas (abbreviated as NDVI-ESD), significant decrease areas (NDVI-SD), nonsignificant decrease areas (NDVI-ND), nonsignificant increase areas (NDVI-NI), significant increase areas (NDVI-SI), and extremely significant increase areas (NDVI-ESI). These six scenarios were assigned values of −3, −2, −1, 1, 2, and 3. Fourteen factors were defined as the dependent variables, in which the change trends of PRE_BT, TEM_BT, FERT, and IRRI exhibited significant differentiation patterns at the regional scale, so the NDVI trend classifications at the six levels were assigned by these factors. The change trends of GRACE and NLIGHT did not exhibit significant differentiation patterns in the BTH area, and their change trends were still used as dependent variables. In the GWR4 software, the local regression method was chosen, and the accuracy was controlled by optimizing the calculation bandwidth. The GWR-estimated coefficients of the 14 independent variables were used to assess the magnitudes of their influence on the NDVI trends.

2.5. Calculation of the Ratio of Human to Natural Factors

To distinguish the combined effects of different types of explanatory variables on the NDVI trends, the ratio of human to natural factors ( R a t i o h / n ) was constructed.
R a t i o n h / n = s u m _ h u m a n s u m _ n a t u r a l = Σ i = 1 n | e s t _ h u m a n i | Σ i = 1 m | e s t _ n a t u r a l i |
where n is the number of natural variables, s u m _ h u m a n is the sum of the absolute values of all estimated human variable coefficients, e s t _ n a t u r a l i is the estimated coefficient of the ith natural variable, m is the number of human variables, s u m _ n a t u r a l is the sum of the absolute values of all estimated natural variable coefficients, and e s t _ h u m a n i is the estimated coefficient of the ith human variable. The comprehensive result of both natural and human effects was 2000NDVI. Thus, it was not considered in this R a t i o h / n calculation.

3. Results

3.1. Spatial Characteristics of NDVI Trends

The average NDVI from 2000 to 2015 generally increased with a NDVI growth rate (abbreviated as NDVIGR) of approximately 0.005/yr in the BTH area. The area with high NDVI values remained unchanged or slightly increased, and the areas with relatively low and median NDVI values showed a constant or decreasing trend. The fastest NDVIGR in the primary geomorphic units occurred in the North China Mountains (0.006/yr), the slowest NDVIGR occurred in the North Plain (0.0044/yr), and the NDVIGR was 0.005/yr in the Inner Mongolia Plateau. In the edge and transition zones of geomorphic units, the improvement in the NDVI was relatively lower than that in the interior of geomorphic units. For example, the NDVIGR of the Alluvial-Proluvial Fan was only 0.0025/yr. Among the six types of land cover, the NDVIGR of grassland was 0.0072/yr, that of woodland/shrubland was 0.0057/yr, and that of cropland was 0.0053/yr. From 2000 to 2015, the average NDVI of BTH was positively correlated with PRE_MN (coefficient = 0.54, p-value = 0.03) and not significantly negatively correlated with TEM_MN (coefficient = −0.30, p-value = 0.25). NDVI showed a significant reduction when precipitation decreased and temperature increased, and this impact lasted until the following year. This scenario occurred in 2002, 2007, 2009, and 2014 (Figure 2).
The NDVI trends were divided into six scenarios (Figure 3), as shown in Section 2.4. The degraded vegetation area accounted for 8.96% of BTH, of which NDVI-ESD accounted for 0.02%, NDVI-SD accounted for 0.75%, and NDVI-ND accounted for 8.19%. The improvement area accounted for 91.04%, of which NDVI-NI accounted for 40.81%, NDVI-SI accounted for 45.94%, and NDVI-ESI accounted for 4.29%. The total area percentages of NDVI-SI and NDVI-ESI in various land cover types were woodland/shrubland (61.78%), grassland (59.16%), cropland (46.20%), other (39.30%), wetland (34.42%), and urban and built-up areas (31.31%). Meanwhile, the geomorphic gradient exhibited a significant differentiation effect on vegetation changes. NDVI degradation mainly occurred on urban and built-up areas and cropland, and high degradation rates in BTH occurred in the Marine Plain (2.91%), Alluvial-Proluvial Fan (2.12%), and Mountain Basin (2.10%) areas. The highest rates of nonsignificant changes in the NDVI occurred in the Alluvial-Proluvial Fan (73.30%), Hilly Taihang Section (71.98%), and High Plain (70.99%) areas, where the main land types were cropland and grassland. In general, the NDVI improvements at the edge and transition zones of geomorphic units were small, and the greatest improvements occurred inside geomorphic units, in which the Alluvial-Proluvial Fan with the highest population density and high intensity of human activity experienced the most complex changes in the NDVI.

3.2. Multivariate Regression of NDVI Trends

The results of GWR showed that each independent variable (Figure A1) had a clearly different interpretation effect (Figure 4). GWR estimated coefficients (abbreviated as GWRec) indicated the correlation of the independent variables with the NDVI changes. The larger the absolute value of GWRec was, the greater the influence was. In general, the initial NDVI had the greatest impact on the NDVI trends, which was followed by socioeconomic activities, geomorphic factors, climatic factors, groundwater, and agricultural activities, land cover changes, and accessibility factors. All independent variables in grassland, woodland/shrubland, and cropland were highly sensitive to NDVI changes.
To further characterize the influences of natural, human, and their integrated effects on NDVI trends, we calculated three combined parameters of s u m n a t u r a l , s u m h u m a n , and R a t i o h / n . The s u m n a t u r a l presented an overall east-west differentiation pattern and further showed a north-south difference (Figure 4o), with two high-value areas in Beijing-Zhangjiakou and Baoding-Cangzhou. The largest s u m n a t u r a l occurred in Inner Mongolia, and the value in the North China Plain was slightly larger than that in the North China Mountains. The s u m n a t u r a l values of each land cover type are ranked as follows: grassland (1.76), other (1.55), urban and built-up areas (1.51), cropland (1.50), woodland/shrubland (1.45), and wetland (1.41).
As shown in Figure 5a in the Inner Mongolia Plateau, the vegetation of all land cover types except for wetlands generally changed from degradation to vegetation improvement as the natural factors weakened. The vegetation in grasslands, woodlands/shrublands, and other land cover types had the largest response to s u m n a t u r a l , while the vegetation response was smallest in croplands and urban and built-up areas with the same changes. In the North China Mountains, except for woodland/shrubland and cropland, with the increase in s u m n a t u r a l , the NDVI of all other land cover types were more inclined to improve. The low s u m n a t u r a l in the woodland/shrubland was conducive to the improvement of vegetation. The NDVI improvements in croplands had high requirements for natural conditions even though the s u m n a t u r a l was significantly weaker than that in the significant improvement area. In the North China Plain, from the NDVI-ESD to NDVI-ESI, the s u m n a t u r a l of cropland and wetland increased slightly but decreased slightly after the NDVI-SI. The s u m n a t u r a l of urban and built-up areas showed a continuous state of small increases. The woodland/shrubland and other land cover types showed a monotonous decreasing trend. The s u m n a t u r a l of grassland first decreased and then increased. The NDVI-ESI had the highest value.
The s u m h u m a n showed an overall north-south differentiation pattern, followed by an east-west difference (Figure 4p). The high-value areas were mainly distributed in Tianjin and Shijiazhuang in the North China Plain, and the low-value areas were mainly located in the northern and northwestern areas of Zhangjiakou and Chengde. The s u m h u m a n values of the different land cover types were ranked as follows: urban and built-up areas and wetland (0.49), cropland (0.47), woodland/shrubland (0.43), other (0.42), and grassland (0.39). As shown in Figure 5b, from the Inner Mongolia Plateau to the North China Plain, the intensity of human activity increased to approximately 1.5 times that of the plateau. Compared with s u m n a t u r a l , the s u m h u m a n values of the six land cover types generally exhibited the same trends in the three primary geomorphic units, and the difference in s u m h u m a n was small. The vegetation easily improved with the increase in s u m h u m a n in the Inner Mongolia. However, the regions with less human activity were more prone to vegetation improvements in the North China Plain. In the North China Mountains, the vegetation remained unchanged when the intensity of human activity was high. The vegetation degraded with limited or low-intensity human activity, and the human activity was the weakest in the vegetation improvement area.
The R a t i o h / n value reflects the combined effects of human factors and natural factors and was generally characterized by an east-west differentiation pattern (Figure 4q), which has two high-value areas. The first high-value area occurred in the curved zone of Qinhuangdao-Tianjin-Langfang-Baoding, which forms a diamond-shaped enclosure with the North China Plain-North China Mountains boundary. The second high-value area was roughly parallel to the boundary with the North China Plain-North China Mountains and was distributed in the central and western regions of Shijiazhuang-Xingtai-Handan. The low-value areas were mainly distributed in Zhangjiakou, Beijing, and Northwestern Chengde. The average of R a t i o h / n with a distinct geomorphological gradient was 0.16 in the Inner Mongolia Plateau, 0.33 in the North China Mountains, and 0.37 in the North China Plain. The R a t i o h / n values of each land cover type were ranked as follows: wetland (0.38), urban and built-up areas (0.36), cropland (0.34), woodland/shrubland (0.32), other (0.30), and grassland (0.26).
As shown in Figure 5c, a relatively consistent upward trend of six land cover types occurred in the Mongolia Plateau from NDVI-SD to NDVI-ESI, where the grassland was most sensitive to the changes in R a t i o h / n . In the North China Mountains, the R a t i o h / n of each land cover type showed a decreasing trend from NDVI-ESD to NDVI-ESI even though the improvement of the woodland/shrubland revealed a high dependence of R a t i o h / n . In the North China Plain, the R a t i o h / n changes presented the most complex trend between the six land cover types. As the R a t i o h / n decreased, the vegetation in cropland, grassland, and urban and built-up areas easily improved. Vegetation in woodland/shrubland and other land cover types tended to improve when the R a t i o h / n increased. Degradation and invariance in wetland vegetation occurred at high R a t i o h / n values, whereas vegetation increased as R a t i o h / n increased with reasonably controllable human activities.

3.3. Regression Differences in Different Geomorphic Units

The Inner Mongolia Plateau exhibited the largest s u m n a t u r a l and the lowest R a t i o h / n in BTH, and the NDVI was easily improved when the R a t i o h / n was high. Due to the conversion of cropland and grassland to urban and built-up areas, NDVI-SD was scattered in the transition zone between the High Plain and the Plateau Hills. NDVI-ND was mainly distributed in the north-central part of this area where cropland was transformed to urban and built-up areas. NDVI-NI largely occurred in cropland and grassland areas and was especially high in the High Plain areas. It was mainly affected by elevation, temperature, precipitation, and agricultural activities. NDVI-SI was mainly distributed in the southeastern part of the Plateau Hills, and it was influenced by geomorphic effect, precipitation, human activities, and warming. The NDVI-ESI trends were generally consistent with that of the NDVI-SI and with the improvement of agricultural technology, and it was mainly distributed in the transition zone adjacent to the North China Mountains.
In the North China Mountains, vegetation changes were mainly driven by natural factors. NDVI-ESD and NDVI-SD were affected by urban-rural expansion and facility construction, and were mainly distributed in the Hilly Yanshan Section, mountain basins, and river valleys. NDVI-ND was mainly distributed in the transition zone of geomorphic units, and affected by urban expansion, infrastructure construction, and precipitation. NDVI-NI was highly correlated with annual mean precipitation and interannual temperature changes and mainly distributed in the Hilly Taihang Section. NDVI-SI was mainly affected by the initial NDVI, elevation, human activities (e.g., returning farmland to forests, small watershed management, ecological economy development), temperature, and precipitation. It was widely distributed in mountains and hills, which was the largest contiguous area of vegetation improvements in BTH and was also the main area of the Three-North Protection Forest Project and the Beijing-Tianjin Sand Source Control Program in BTH. NDVI-ESI occurred in the key area of the Three-North Shelterbelt and was mainly distributed in Chengde and Zhangjiakou. Compared with NDVI-SI, NDVI-ESI had a better combination of precipitation, groundwater volume change, and temperature. Human activities had a greater impact.
In the North China Plain, which had the strongest human activity and the largest R a t i o h / n , the high R a t i o h / n values corresponded to nonsignificant changes and degradation in vegetation, and the low values indicated vegetation improvement. The vegetation-degraded areas were mainly distributed in the marginal expansion areas of megacities. The NDVI-ND was mainly distributed in the east of the Alluvial-Proluvial Fan and the Marine Plain, where the initial NDVI, agricultural activities in cropland, construction activities in urban-rural areas, and precipitation mainly led to nonsignificant degradation in vegetation. Compared with the NDVI-ND, groundwater, slope, and temperature had prominent effects on the NDVI-NI, which was distributed over large areas of cropland, urban and built-up areas, and wetland. The NDVI-SI was mainly distributed in the eastern part of the Alluvial-Proluvial Fan, where the cropland was mainly traditional low-yield and medium-yield fields and influenced by the initial NDVI, socioeconomic activities, precipitation, temperature, groundwater, and fertilization. NDVI-ESI was mainly distributed in Eastern Hengshui, Southeastern Cangzhou, and Northern Handan. The roles of agricultural production and management technology in cropland and greening projects in urban and built-up areas were more prominent. The traditional low-medium-yield fields were transformed into medium-high-yield fields, which promoted the extremely significant increase in vegetation. In general, vegetation improvements exhibited the characteristics of regional concentration and convergence of driving factors and R a t i o h / n , while vegetation degradation had many influencing factors and strong heterogeneity in the North China Plain.

4. Discussion

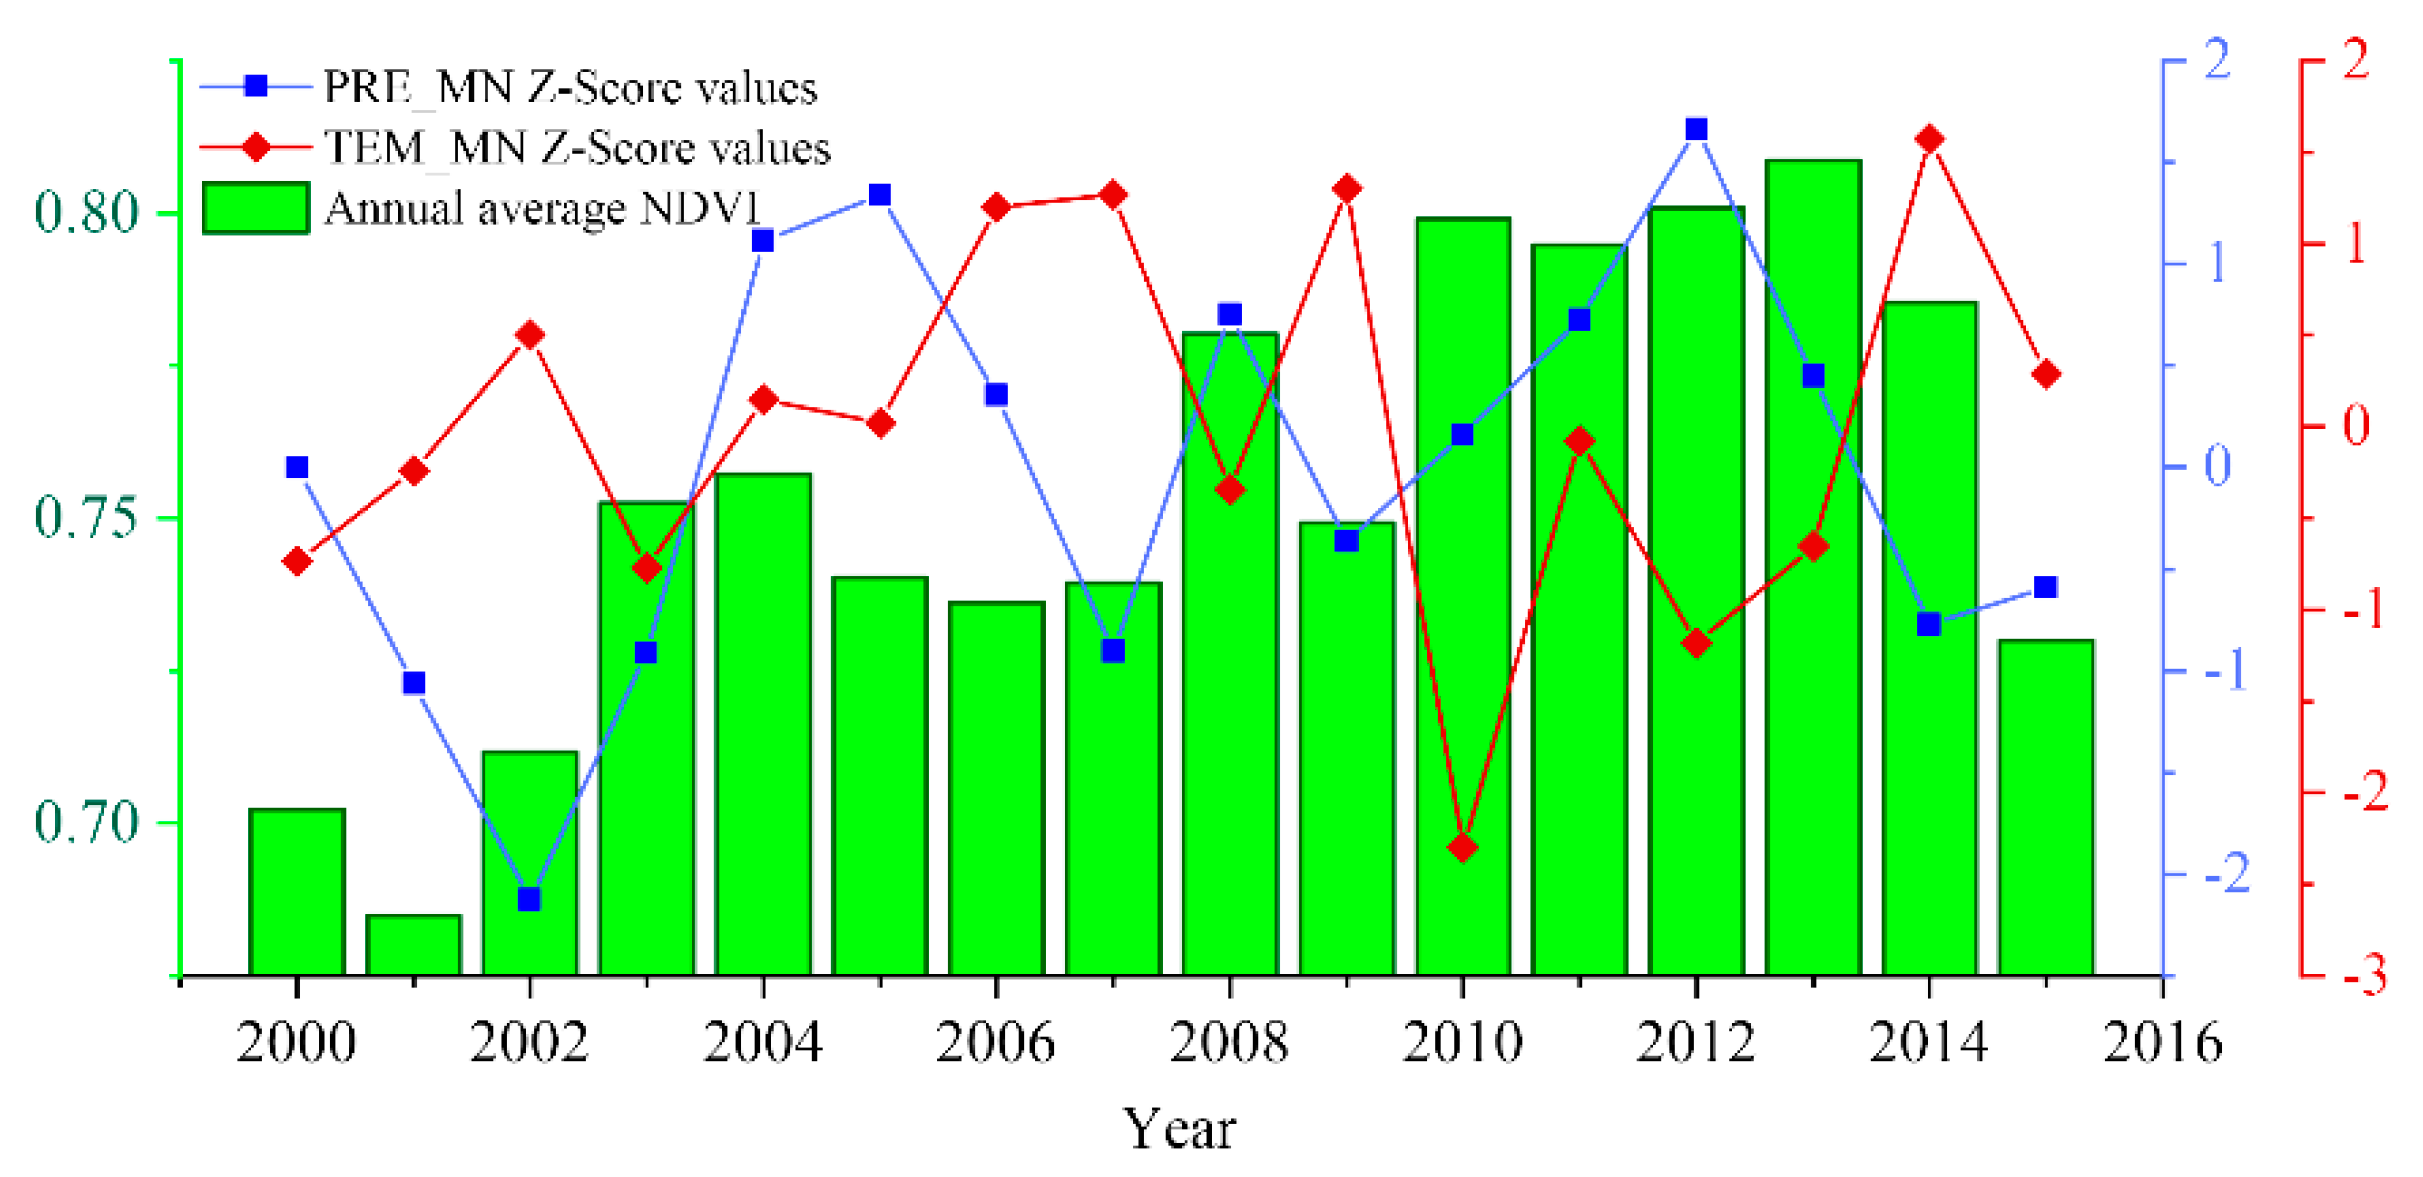
4.1. Impact of Climate on NDVI Trends

The NDVIGR of this study is 0.005/year, which is higher than the NOAA-GIMMS-NDVI in the area [51,52] and is basically consistent with the SPOT-VGT-NDVI [28,53] and previous findings using the MODIS NDVI [54,55]. The fluctuations in the NDVI throughout the region are closely related to meteorological events such as droughts. The sharp decline in the NDVI in 2009 was attributed to the impacts of the 2008 winter and 2009 drought [56]. The continuous decline in the NDVI from 2014 to 2015 was affected by drought events in the Northern Hemisphere in 2014 and 2015 [57,58].
Since climate factors have long-term and cumulative effects and are highly integrated with human activities, precipitation and temperature do not always have a decisive influence on the interpretation of the causes of NDVI changes. From 2000 to 2015, the sensitivity between NDVI trends and PRE_MN was stronger than that between NDVI trends and TEM_MN [55,59]. TEM_BT was more sensitive than PRE_BT. Except for the Mountain-Yinshan Eastern Section, the rest of the BTH area exhibited a warming pattern [60]. The sensitivity of TEM_MN to NDVI changes was great when TEM_BT was low, and there was a certain reconciliation between them [61]. Except for the Marine Plain, PRE_MN declined in each geomorphic unit. The correlation between the NDVI trends and precipitation and temperature exhibited significant spatial differences. The areas with large geomorphological gradients and climatic gradients, such as the low NDVI value areas in plateaus, plain croplands, and grasslands, were sensitive to climatic factors. The NDVI in mountainous forests was less sensitive to changes in climatic factors, such as the >600 mm curved rainy belts distributed on the windward slopes of the Yanshan and Taihang Mountains [62]. The NDVI in the north and northeast of the relatively humid mountainous area of BTH did not always respond directly and proportionally to precipitation changes. Although a nonlinear change in the soil water supply was caused by the increase in precipitation, the water utilization rate of vegetation changed with the changes in temperature and humidity [63]. In general, the NDVI trends were mainly positively and not significantly correlated with PRE_MN or TEM_MN, which accounts for 94.02% of the total area, while the significant and extremely significant positive correlations accounted for only 5.98% of the area, which were mainly distributed in mountain basins and depressions as well as the border area between the Mountain-Yinshan Eastern Section and the Mountain-Yanshan Section. The variation in effective groundwater depth exhibited coupling and hysteresis with precipitation. In the area with extensive groundwater exploitation in the North China Plain [64], especially in the funnel area, the influence of the change in groundwater depth on the NDVI trends correspondingly weakened [65]. Considering the comprehensive effects of climatic factors on NDVI trends, climatic factors had no significant or negative effects on NDVI, which indicates that climate change had a certain negative effect on vegetation changes [66], while human activities had a great impact.

4.2. Influences of Non-Climatic Factors on NDVI Trends

4.2.1. Geomorphology

Both macroscopic and microscopic geomorphology had important impacts on the distribution of soil and hydrothermal conditions, as well as strong coupling effects including the intensity of human activity, land cover, vegetation distribution patterns, and its changes [67]. Land use regulations under various slopes in the National Soil and Water Conservation Law directly affect the type of vegetation cover. High elevations and steep slopes (>25°) in the Inner Mongolia Plateau and North China Mountains are highly suitable for ecological conservation, such as the “Grain to Green Project” and the “Natural Forest Conservation Program” [2]. However, low altitudes (<20 m) correspond to improved water sources, and steep slopes (>4°) with better drainage conditions in the North China Plain are conducive to cropland and woodland vegetation improvements. The combined effect of elevation and slope on the NDVI trends would be further magnified when the internal geomorphic gradient increases, such as in the six land cover types of the High Plateau, the cropland and urban and built-up areas of the mountain basins in the North China Mountains, and the wetland in the depression of the North China Plain.

4.2.2. Land Use

Land use is one of the most important factors in explaining the regional differences in the NDVI attributes that were analyzed. The transformation of land cover type has a direct impact on NDVI [68] in only the occurrence area, and the influences are limited in the areas at the edge and outside of the boundaries. From 2000 to 2015, land cover type conversion occurred in 7.5% of BTH, with the highest sensitivity to land conversion in the plain wetlands. The degraded NDVI areas were mainly distributed within 200 to 500 m from the urban and built-up areas, and the improvement areas were distributed by 1 km or more from the urban and built-up areas. Within 1 km of the land cover type change area, the NDVI stability or improvement trends were suppressed, and the intensity of this influence was gradually attenuated outside 3 km. The NDVI improvements caused by land cover changes mostly occurred in mountainous and hilly areas, while, in plains and mountain basins, land cover transformation mainly led to nonsignificant changes in vegetation.

4.2.3. Accessibility

Roads and rivers reflect the different needs of people and farming. Vegetation degradation is concentrated in the residential areas near water and roads. The roads used in the present study are mainly high-grade roads, which mainly inhibit vegetation improvement, while low-grade roads closely related to cropland are not all involved in the calculation. The water system in BTH is highly influenced by human activities, such as the construction of reservoirs, water diversion, and river regulation. Thus, the morphological structure of the water system does not fully represent the water volume distribution. Urban and industrial production and agriculture have intensified water stress, especially during the growing season. Surface water irrigation and groundwater irrigation have become the main countermeasures in the North China Plain [69], which resulted in vegetation changes associated with off-site water and groundwater. Therefore, the impact of the water system on local vegetation changes is weakened. The water system distributed in the mountainous area is relatively closely related to the vegetation of the catchment basin, which is associated with terrain, elevation, slope, and aspect [70]. Vegetation near the water system can be easily improved even though the effect of the water system may also be weakened by the terrain effect [71].

4.2.4. Agricultural Production Technology

Cropland accounts for 42% of BTH, which is the largest land use type. The low GWRec associated with the irrigation and fertilization practices in cropland reflect the direct impact of agricultural activities on vegetation changes and reveal the indirect effects of other agricultural activities on vegetation changes, such as soil improvement, seed improvement, new technology use, and planting structure improvement. These activities are used to actively adapt to climate change and regional economic development and have become important factors affecting cropland vegetation [72]. In the medium-yield and low-yield fields, vegetation has been significantly increased through soil improvement, improving irrigation and fertilization efficiency, and using other technologies and management measures. Except for the Inner Mongolia Plateau and the Southeastern part of the North China Plain, the effects of irrigation and fertilization on increasing yields have been reduced, especially in the medium-high-yield fields [73].

4.2.5. Socioeconomic Activities

This variable is negatively correlated with NDVI trends, which suggests that activities such as urban-rural spatial expansion, spillover effects, and impervious surfaces may inhibit vegetation improvements [74]. The statistics also show that the growth rate of NLIGHT in the plain vegetation improvement area is only one-half or one-third of that in the vegetation degradation area, and the rate decreases in mountains and plateaus. However, in cropland, ecological project areas, and large cities, human activities can effectively promote vegetation improvement by addressing climate and geomorphological factors. For example, the government has implemented ecological economic development measures in forest and grassland and improved agricultural infrastructure in cropland. These measures have promoted the adjustment of urban-rural industrial structure, and more optimized human activities have accelerated the improvement of vegetation. The improvement of vegetation in megacities is affected by many effects, such as urban green space improvement, urban heat island effects, increased CO2 concentrations, and increased active nitrides, all of which are highly correlated with human activities [75]. However, the intensity of human activity may be affected by the saturation effect of DMSP/OLS light data, especially in the bright cores of urban centers [76].

4.2.6. Initial NDVI

The 2000NDVI represents the initial state of vegetation and constrains the derived information, such as the direction, strength, and reliability. The average estimated coefficient of BTH is approximately −0.36, which is roughly similar to geomorphology and human activity factors. The negative correlation between the 2000NDVI and NDVI trends reflects two points of information: first, there may be a saturation effect on NDVI data as well as DMSP/OLS lighting data, especially in the high NDVI value areas, and, second, the extremely low and very high-value regions of vegetation are inversely changed to some extent [77]. For example, low-coverage vegetation was improved, such as various land cover types in the Inner Mongolia Plateau, and high vegetation cover was degraded, such as woodland/shrubland and grassland in the North China Plain and woodland/shrubland in the North China Mountains.

4.3. Implications and Limitations

Following the gradient of climate and geomorphology, people should actively respond to changes in the natural environment as well as regulate and optimize the layout and intensity of human activities. The stability of vegetation in the North China Mountains should be maintained in the future. The intensity of human activities in the Inner Mongolia Plateau should be reasonably controlled and the planting structure and agglomerated woodland/shrubland should be optimized to effectively control the scale of negative effects from urban and built-up areas in the North China Plain. Based on functional ecological zoning, suitable ecological economic developments should be preferred in different functional zoning units and the impact of human activities on the ecological environment should be scientifically guided and controlled.
The spatial resolutions of the 14 interpretation factors used in this study are different and do not match the spatial resolution of NDVI, such as groundwater data, irrigation data, and fertilization data. Meanwhile, because of the saturation effect of NDVI, the maximum synthesis method may reduce data accuracy at the interannual scale, which leads to unsustainable or noncontinuous conditions in NDVI trends, especially those affecting the evaluation of the NDVI change trends. Although the impacts of human activities were characterized by using nighttime light intensity, roads, water systems, irrigation, fertilization, and other indicators, there is still a gap in the expression of diversity, complexity, and dynamics of human activities, especially in cropland areas. Although collinearity is generally evaluated, there may be individual factors in the interpretation of the GWR, which are repeated in the local space and lead to the repeated or amplified interpretation of certain factors.

5. Conclusions

This study shows that the overall vegetation in the BTH region has improved over the last 16 years, and NDVI fluctuations in individual years were closely related to climate events. Vegetation changes showed a northwest-southeast pattern, which was highly consistent with the geomorphic gradient. The main vegetation improvement areas were distributed in the North China Mountains where natural effects were pronounced, and the main vegetation invariance and degradation areas were distributed in the North China Plain where human effects were prevalent. Natural factors were generally more sensitive than human factors to vegetation changes, and the R a t i o h / n better reflected the combined effects of human and natural factors. The Inner Mongolia Plateau had the largest s u m n a t u r a l and the lowest R a t i o h / n in the BTH, and the vegetation was more inclined to improve in areas with high R a t i o h / n values. In the North China Mountains, the high R a t i o h / n corresponded to vegetation degradation and invariance, while the low values implied vegetation restoration due to the implementation of ecological engineering. The vegetation improvements had the characteristics of regional concentration and convergence of driving factors and R a t i o h / n , while vegetation degradation had many influencing factors and strong heterogeneity in the North China Plain. The results of this research can assist with ecological functional zoning and ecological economic development in BTH. Future related research should further refine the impacts of human activities, improve data accuracy, and reduce the saturation of NDVI data.

Author Contributions

Y.Z. wrote the paper with contributions from all co-authors. R.S. conceived and designed the research. Z.N. contributed to the data processing.

Funding

The National Key Research & Development Plan project (2016YFC0503001), the Beijing Postdoctoral Fund (No.2018-ZZ-096), the Capital Normal of University (No.011185404207), and the Young and Middle-aged Teacher Program of Chengdu University of Technology (2019JXGG01213) supported this work.

Acknowledgments

We are grateful to Liding Chen, a professor at the Research Center for Eco-Environmental Sciences, Chinese Academy of Sciences for his valuable guidance on the writing of this article.

Conflicts of Interest

The authors declare no conflicts of interest.

Appendix A. Supplementary data

Table A1. Basic information of each geomorphic unit.
Primary Geomorphic UnitSecondary Geomorphic UnitArea (km2)NDVIElevation (m)Slope (°)POPGDPPRETEM
Inner Mongolia PlateauPlateau Hills (I1)7,376 0.55 1,4555.35711444323.06
High Plain (I2)5,722 0.51 1,3724.05771564014.03
North China MountainsMountain-Yinshan Eastern Section (II11)24,192 0.67 1,27712.48912794944.63
Mountain-Yanshan Section (II12)29,313 0.79 83015.091194315797.01
Mountain-Taihang Section (II13)20,638 0.7694518.032047275498.42
Hilly Yanshan Section (II21)16,687 0.77 26211.013292,04561610.37
Hilly Taihang Section (II22)15,561 0.70 2388.224811,66649912.46
Mountain Basin (II3)6,930 0.61 5152.773662,2555159.80
North China PlainAlluvial-Proluvial Fan (III1)42,450 0.74 301.991,2007,69653313.09
Flood Plain (III2)16,643 0.74 132.196151,68252813.63
Yellow River Floodplain (III3)5,013 0.76 242.086951,59555313.93
Depression (III4)8,544 0.73111.586955,37153813.32
Alluvial and Coast Plain (III5)10,955 0.68 51.5110736,75655212.93
Marine Plain (III6)4,627 0.47 61.2779917,38955912.74
Notes: NDVI-average NDVI, POP-population density in 2015 (people/km2), GDP-gross domestic product density in 2015 (Yuan/km2), PRE_MN-annual precipitation (mm), and TEM_MN-annual average temperature (℃).
Figure A1. Fourteen explanatory variable distribution maps. (a) initial NDVI. (b) Land cover type change. (c) Elevation. (d) Slope. (e) Annual average precipitation. (f) Changes in precipitation during the growing season. (g) Annual average temperature. (h) Changes in temperature during the growing season. (i) GRACE changes. (j) NLIGHT changes. (k) River Euclidean distance. (l) Road Euclidean distance. (m) Irrigation change (n) and fertilization change.
Remotesensing 11 01224 g0a1

References

  1. Cramer, W.; Bondeau, A.; Woodward, F.I.; Prentice, I.C.; Betts, R.A.; Brovkin, V.; Cox, P.M.; Fisher, V.; Foley, J.A.; Friend, A.D.; et al. Global response of terrestrial ecosystem structure and function to CO2 and climate change: Results from six dynamic global vegetation models. Glob. Chang. Biol. 2001, 7, 357–373. [Google Scholar] [CrossRef]
  2. Wang, L.H.; Tian, F.; Wang, Y.H.; Wu, Z.D.; Schurgers, G.; Fensholt, R. Acceleration of global vegetation greenup from combined effects of climate change and human land management. Glob. Chang. Biol. 2018, 24, 5484–5499. [Google Scholar] [CrossRef] [PubMed]
  3. Friedl, M.A.; McIver, D.K.; Hodges, J.C.F.; Zhang, X.Y.; Muchoney, D.; Strahler, A.H.; Woodcock, C.E.; Gopal, S.; Schneider, A.; Cooper, A.; et al. Global land cover mapping from MODIS: Algorithms and early results. Remote Sens. Environ. 2002, 83, 287–302. [Google Scholar] [CrossRef]
  4. Carlson, T.N.; Ripley, D.A. On the relation between NDVI, fractional vegetation cover, and leaf area index. Remote Sens. Environ. 1997, 62, 241–252. [Google Scholar] [CrossRef]
  5. Pettorelli, N.; Vik, J.O.; Mysterud, A.; Gaillard, J.M.; Tucker, C.J.; Stenseth, N.C. Using the satellite-derived NDVI to assess ecological responses to environmental change. Trends Ecol. Evol. 2005, 20, 503–510. [Google Scholar] [CrossRef]
  6. Beck, H.E.; McVicar, T.R.; van Dijk, A.I.J.M.; Schellekens, J.; de Jeu, R.A.M.; Bruijnzeel, L.A. Global evaluation of four AVHRR-NDVI data sets: Intercomparison and assessment against Landsat imagery. Remote Sens. Environ. 2011, 115, 2547–2563. [Google Scholar] [CrossRef]
  7. Jarlan, L.; Mangiarotti, S.; Mougin, E.; Mazzega, P.; Hiernaux, P.; Le Dantec, V. Assimilation of SPOT/VEGETATION NDVI data into a sahelian vegetation dynamics model. Remote Sens. Environ. 2008, 112, 1381–1394. [Google Scholar] [CrossRef]
  8. Mancino, G.; Nole, A.; Ripullone, F.; Ferrara, A. Landsat TM imagery and NDVI differencing to detect vegetation change: Assessing natural forest expansion in Basilicata, southern Italy. iForest 2013, 7, 75–84. [Google Scholar] [CrossRef]
  9. Peng, D.L.; Zhang, B.; Liu, L.Y.; Fang, H.L.; Chen, D.M.; Hu, Y.; Liu, L.L. Characteristics and drivers of global NDVI-based FPAR from 1982 to 2006. Glob. Biogeochem. Cycle 2012, 26. [Google Scholar] [CrossRef]
  10. Gonzalez, P.; Neilson, R.P.; Lenihan, J.M.; Drapek, R.J. Global patterns in the vulnerability of ecosystems to vegetation shifts due to climate change. Glob. Ecol. Biogeogr. 2010, 19, 755–768. [Google Scholar] [CrossRef]
  11. Corenblit, D.; Steiger, J. Vegetation as a major conductor of geomorphic changes on the Earth surface: Toward evolutionary geomorphology. Earth Surf. Proc. Landf. 2009, 34, 891–896. [Google Scholar] [CrossRef]
  12. Yamaura, Y.; Amano, T.; Kusumoto, Y.; Nagata, H.; Okabe, K. Climate and topography drives macroscale biodiversity through land-use change in a human-dominated world. Oikos 2011, 120, 427–451. [Google Scholar] [CrossRef]
  13. Eastman, J.R.; Sangermano, F.; Machado, E.A.; Rogan, J.; Anyamba, A. Global Trends in Seasonality of Normalized Difference Vegetation Index (NDVI), 1982–2011. Remote Sens. 2013, 5, 4799–4818. [Google Scholar] [CrossRef]
  14. Chen, C.; Park, T.; Wang, X.; Piao, S.; Xu, B.; Chaturvedi, R.K.; Fuchs, R.; Brovkin, V.; Ciais, P.; Fensholt, R.; et al. China and India lead in greening of the world through land-use management. Nat. Sustain. 2019, 2, 122–129. [Google Scholar] [CrossRef] [PubMed]
  15. Liu, Y.; Li, Y.; Li, S.C.; Motesharrei, S. Spatial and Temporal Patterns of Global NDVI Trends: Correlations with Climate and Human Factors. Remote Sens. 2015, 7, 13233–13250. [Google Scholar] [CrossRef] [Green Version]
  16. Mueller, T.; Dressler, G.; Tucker, C.J.; Pinzon, J.E.; Leimgruber, P.; Dubayah, R.O.; Hurtt, G.C.; Bohning-Gaese, K.; Fagan, W.F. Human Land-Use Practices Lead to Global Long-Term Increases in Photosynthetic Capacity. Remote Sens. 2014, 6, 5717–5731. [Google Scholar] [CrossRef] [Green Version]
  17. Zhao, L.; Dai, A.G.; Dong, B. Changes in global vegetation activity and its driving factors during 1982–2013. Agric. For. Meteorol. 2018, 249, 198–209. [Google Scholar] [CrossRef]
  18. De Jong, R.; Verbesselt, J.; Schaepman, M.E.; de Bruin, S. Trend changes in global greening and browning: Contribution of short-term trends to longer-term change. Glob. Chang. Biol. 2012, 18, 642–655. [Google Scholar] [CrossRef]
  19. Zhang, Y.; Song, C.; Band, L.E.; Ge, S.; Li, J. Reanalysis of global terrestrial vegetation trends from MODIS products: Browning or greening? Remote Sens. Environ. 2017, 191, 145–155. [Google Scholar] [CrossRef] [Green Version]
  20. Wang, S.J.; Ma, H.T.; Zhao, Y.B. Exploring the relationship between urbanization and the eco-environment-A case study of Beijing-Tianjin-Hebei region. Ecol. Indic. 2014, 45, 171–183. [Google Scholar] [CrossRef]
  21. Liu, H.Y.; Zhang, M.Y.; Lin, Z.S.; Xu, X.J. Spatial heterogeneity of the relationship between vegetation dynamics and climate change and their driving forces at multiple time scales in Southwest China. Agric. For. Meteorol. 2018, 256, 10–21. [Google Scholar] [CrossRef]
  22. Guo, Q.; Fu, B.H.; Shi, P.L.; Cudahy, T.; Zhang, J.; Xu, H. Satellite Monitoring the Spatial-Temporal Dynamics of Desertification in Response to Climate Change and Human Activities across the Ordos Plateau, China. Remote Sens. 2017, 9. [Google Scholar] [CrossRef]
  23. Forkel, M.; Carvalhais, N.; Verbesselt, J.; Mahecha, M.D.; Neigh, C.S.R.; Reichstein, M. Trend Change Detection in NDVI Time Series: Effects of Inter-Annual Variability and Methodology. Remote Sens. 2013, 5, 2113–2144. [Google Scholar] [CrossRef] [Green Version]
  24. Piao, S.L.; Fang, J.Y.; Zhou, L.M.; Zhu, B.; Tan, K.; Tao, S. Changes in vegetation net primary productivity from 1982 to 1999 in China. Glob. Biogeochem. Cycle 2005, 19. [Google Scholar] [CrossRef]
  25. Marston, R.A. Geomorphology and vegetation on hillslopes: Interactions, dependencies, and feedback loops. Geomorphology 2010, 116, 206–217. [Google Scholar] [CrossRef]
  26. De la Barrera, F.; Henríquez, C. Vegetation cover change in growing urban agglomerations in Chile. Ecol. Indic. 2017, 81, 265–273. [Google Scholar] [CrossRef]
  27. Zewdie, W.; Csaplovics, E.; Inostroza, L. Monitoring ecosystem dynamics in northwestern Ethiopia using NDVI and climate variables to assess long term trends in dryland vegetation variability. Appl. Geogr. 2017, 79, 167–178. [Google Scholar] [CrossRef]
  28. Peng, J.; Li, Y.; Tian, L.; Liu, Y.X.; Wang, Y.L. Vegetation Dynamics and Associated Driving Forces in Eastern China during 1999–2008. Remote Sens. 2015, 7, 13641–13663. [Google Scholar] [CrossRef]
  29. Hu, M.M.; Xia, B.C. A significant increase in the normalized difference vegetation index during the rapid economic development in the Pearl River Delta of China. Land Degrad. Dev. 2019, 30, 359–370. [Google Scholar] [CrossRef]
  30. Duo, A.; Zhao, W.; Qu, X.; Jing, R.; Xiong, K. Spatio-temporal variation of vegetation coverage and its response to climate change in North China plain in the last 33 years. Int. J. Appl. Earth Obs. Geoinf. 2016, 53, 103–117. [Google Scholar]
  31. Hao, R.F.; Yu, D.Y.; Sun, Y.; Cao, Q.; Liu, Y.; Liu, Y.P. Integrating Multiple Source Data to Enhance Variation and Weaken the Blooming Effect of DMSP-OLS Light. Remote Sens. 2015, 7, 1422–1440. [Google Scholar] [CrossRef] [Green Version]
  32. Atkinson, P.M.; Jeganathan, C.; Dash, J.; Atzberger, C. Inter-comparison of four models for smoothing satellite sensor time-series data to estimate vegetation phenology. Remote Sens. Environ. 2012, 123, 400–417. [Google Scholar] [CrossRef]
  33. Piao, S.L.; Fang, J.Y.; Ji, W.; Guo, Q.H.; Ke, J.H.; Tao, S. Variation in a satellite-based vegetation index in relation to climate in China. J. Veg. Sci. 2004, 15, 219–226. [Google Scholar] [CrossRef]
  34. Peng, J.; Liu, Y.X.; Liu, Z.C.; Yang, Y. Mapping spatial non-stationarity of human-natural factors associated with agricultural landscape multifunctionality in Beijing-Tianjin-Hebei region, China. Agric. Ecosyst. Environ. 2017, 246, 221–233. [Google Scholar] [CrossRef]
  35. Zhao, Z.Q.; Gao, J.B.; Wang, Y.L.; Liu, J.G.; Li, S.C. Exploring spatially variable relationships between NDVI and climatic factors in a transition zone using geographically weighted regression. Theor. Appl. Climatol. 2015, 120, 507–519. [Google Scholar] [CrossRef]
  36. Leroux, L.; Bégué, A.; Lo Seen, D.; Jolivot, A.; Kayitakire, F. Driving forces of recent vegetation changes in the Sahel: Lessons learned from regional and local level analyses. Remote Sens. Environ. 2017, 191, 38–54. [Google Scholar] [CrossRef] [Green Version]
  37. Liu, Z.; Li, L.; Tim, R.M.; Vanniel, T.G.; Yang, Q.; Li, R. Introduction of the professional interpolation software for meteorology data: ANUSPLIN. Meteorol. Mon. 2008, 34, 92–100. [Google Scholar]
  38. Yang, J.F.; Wan, S.Q.; Deng, W.; Zhang, G.X. Water fluxes at a fluctuating water table and groundwater contributions to wheat water use in the lower Yellow River flood plain, China. Hydrol. Process. 2007, 21, 717–724. [Google Scholar] [CrossRef]
  39. Landerer, F.W.; Swenson, S.C. Accuracy of scaled GRACE terrestrial water storage estimates. Water Resour. Res. 2012, 48. [Google Scholar] [CrossRef]
  40. Drewa, P.B.; Platt, W.J.; Moser, E.B. Community structure along elevation gradients in headwater regions of longleaf pine savannas. Plant Ecol. 2002, 160, 61–78. [Google Scholar] [CrossRef]
  41. Ma, T.; Zhou, Y.K.; Zhou, C.H.; Haynie, S.; Pei, T.; Xu, T. Night-time light derived estimation of spatio-temporal characteristics of urbanization dynamics using DMSP/OLS satellite data. Remote Sens. Environ. 2015, 158, 453–464. [Google Scholar] [CrossRef]
  42. Li, J.; He, C.; Shi, P.; Chen, J.; Gu, Z.; Xu, W. Change Process of Cultivated Land and Its Driving Forces in Northern China during 1983–2001. Acta Geogr. Sin. 2004, 59, 274–282. [Google Scholar]
  43. Liu, C.Y.; Wang, K.; Meng, S.X.; Zheng, X.H.; Zhou, Z.X.; Han, S.H.; Chen, D.L.; Yang, Z.P. Effects of irrigation, fertilization and crop straw management on nitrous oxide and nitric oxide emissions from a wheat-maize rotation field in northern China. Agric. Ecosyst. Environ. 2011, 140, 226–233. [Google Scholar] [CrossRef]
  44. Beale, C.M.; Lennon, J.J.; Yearsley, J.M.; Brewer, M.J.; Elston, D.A. Regression analysis of spatial data. Ecol. Lett. 2010, 13, 246–264. [Google Scholar] [CrossRef] [PubMed]
  45. Zhang, S.; Yuan, J.G. Spatial and Temporal Change of Vegetation in Growing Seasons in Hebei Province Based on SPOT-VGT NDVI. In Proceedings of the 2014 Third International Workshop on Earth Observation and Remote Sensing Applications (EORSA), Changsha, China, 11–14 June 2014. [Google Scholar] [CrossRef]
  46. Brunsdon, C.; Fotheringham, A.S.; Charlton, M.E. Geographically Weighted Regression: A Method for Exploring Spatial Nonstationarity. Geogr. Anal. 2010, 28, 281–298. [Google Scholar] [CrossRef]
  47. Brunsdon, C.; Fotheringham, S.; Charlton, M. Geographically Weighted Regression-Modelling Spatial Non-Stationarity. J. R. Stat. Soc. 1998, 47, 431–443. [Google Scholar] [CrossRef]
  48. Leung, Y.; Mei, C.L.; Zhang, W.X. Statistical test for local patterns of spatial association. Environ. Plan. A 2003, 35, 725–744. [Google Scholar] [CrossRef]
  49. Han, Y.; Zhu, W.B.; Li, S.C. Modelling Relationship between NDVI and Climatic Factors in China Using Geographically Weighted Regression. Acta Sci. Nat. Univ. Pekin. 2016, 52, 1125–1133. [Google Scholar]
  50. Nakaya, T.; Fotheringham, A.S.; Brunsdon, C.; Charlton, M. Geographically weighted Poisson regression for disease association mapping. Stat. Med. 2005, 24, 2695–2717. [Google Scholar] [CrossRef] [Green Version]
  51. Liu, B.; Sun, Y.L.; Wang, Z.L.; Zhao, T.B. Analysis of the vegetation cover change and the relative role of its influencing factors in north china. J. Nat. Resour. 2015, 30, 12–23. [Google Scholar]
  52. Jiang, B.; Liang, S.L.; Yuan, W.P. Observational evidence for impacts of vegetation change on local surface climate over northern China using the Granger causality test. J. Geophys. Res.-Biogeosci. 2015, 120, 1–12. [Google Scholar] [CrossRef]
  53. Yang, Y.; Sun, Y.; Wang, Z. The spatial-temporal variations of vegetation cover in the Haihe river basin from 2000 to 2013. J. Arid Land Resour. Environ. 2016, 30, 65–70. [Google Scholar]
  54. Li, Z.; Sun, R.H.; Zhang, J.C.; Zhang, C. Temporal-spatial analysis of vegetation coverage dynamics in Beijing-Tianjin-Hebei metropolitan regions. Acta Ecol. Sin. 2017, 37, 7418–7426. [Google Scholar]
  55. Meng, D.; Li, X.J.; Gong, H.L.; Qu, Y.T. Analysis of Spatial-Temporal Change of NDVI and Its Climatic Driving Factors in Beijing-Tianjin-Hebei Metropolis Circle from 2001 to 2013. J. Geo-Inf. Sci. 2015, 17, 1001–1007. [Google Scholar]
  56. Chen, Q.L.; Hua, W.; Xiong, G.M.; Xu, H.; Liu, X.R. Analysis on the Causes of Severe Drought in North China in Winter of 2008–2009. Arid Zone Res. 2010, 27, 182–187. [Google Scholar] [CrossRef]
  57. World Meteorological Organization (WMO). The Global Climate in 2011–2015; WMO: Geneva, Switzerland, 2016; pp. 1–28. [Google Scholar]
  58. Li, Q.Q.; Wang, A.Q.; Zhou, B.; Liu, Y.J.; Sun, C.H.; Wang, D.Q.; Wang, P.L. Global Major Weather and Climate Events in 2014 and the Possible Causes. Meteorol. Mon. 2015, 41, 497–507. [Google Scholar]
  59. Wang, Y.C.; Sun, Y.L.; Wang, Z.L. Spatial-Temporal Change in Vegetation Cover and Climate Factor Drivers of Variation in the Haihe River Basin 1998–2011. Resour. Sci. 2014, 36, 594–602. [Google Scholar]
  60. Gong, Z.N.; Zhao, S.Y.; Gu, J.Z. Correlation analysis between vegetation coverage and climate drought conditions in North China during 2001–2013. J. Geogr. Sci. 2017, 27, 143–160. [Google Scholar] [CrossRef]
  61. Wu, X.C.; Liu, H.Y.; Li, X.Y.; Piao, S.L.; Ciais, P.; Guo, W.C.; Yin, Y.; Poulter, B.; Peng, C.H.; Viovy, N.; et al. Higher temperature variability reduces temperature sensitivity of vegetation growth in Northern Hemisphere. Geophys. Res. Lett. 2017, 44, 6173–6181. [Google Scholar] [CrossRef]
  62. Yan, D.H.; Xu, T.; Girma, A.; Yuan, Z.; Weng, B.S.; Qin, T.L.; Do, P.; Yuan, Y. Regional Correlation between Precipitation and Vegetation in the Huang-Huai-Hai River Basin, China. Water 2017, 9. [Google Scholar] [CrossRef]
  63. Rishmawi, K.; Prince, S.D.; Xue, Y.K. Vegetation Responses to Climate Variability in the Northern Arid to Sub-Humid Zones of Sub-Saharan Africa. Remote Sens. 2016, 8, 910. [Google Scholar] [CrossRef]
  64. Gong, H.L.; Pan, Y.; Zheng, L.Q.; Li, X.J.; Zhu, L.; Zhang, C.; Huang, Z.Y.; Li, Z.P.; Wang, H.G.; Zhou, C.F. Long-term groundwater storage changes and land subsidence development in the North China Plain (1971–2015). Hydrogeol. J. 2018, 26, 1417–1427. [Google Scholar] [CrossRef]
  65. Guo, H.P.; Zhang, Z.C.; Cheng, G.M.; Li, W.P.; Li, T.F.; Jiao, J.J. Groundwater-derived land subsidence in the North China Plain. Environ. Earth Sci. 2015, 74, 1415–1427. [Google Scholar] [CrossRef]
  66. Piao, S.L.; Yin, G.D.; Tan, J.G.; Cheng, L.; Huang, M.T.; Li, Y.; Liu, R.G.; Mao, J.F.; Myneni, R.B.; Peng, S.S.; et al. Detection and attribution of vegetation greening trend in China over the last 30 years. Glob. Chang. Biol. 2015, 21, 1601–1609. [Google Scholar] [CrossRef]
  67. Zhang, Y.S.; Lu, X.; Liu, B.Y.; Wu, D.T. Impacts of Urbanization and Associated Factors on Ecosystem Services in the Beijing-Tianjin-Hebei Urban Agglomeration, China: Implications for Land Use Policy. Sustainability 2018, 10, 4334. [Google Scholar] [CrossRef]
  68. Lunetta, R.S.; Knight, J.F.; Ediriwickrema, J.; Lyon, J.G.; Worthy, L.D. Land-cover change detection using multi-temporal MODIS NDVI data. Remote Sens. Environ. 2006, 105, 142–154. [Google Scholar] [CrossRef]
  69. Luo, J.M.; Shen, Y.J.; Qi, Y.Q.; Zhang, Y.C.; Xiao, D.P. Evaluating water conservation effects due to cropping system optimization on the Beijing-Tianjin-Hebei plain, China. Agric. Syst. 2018, 159, 32–41. [Google Scholar] [CrossRef]
  70. Zhang, J.T.; Xi, Y.; Li, J. The relationships between environment and plant communities in the middle part of Taihang Mountain Range, North China. Community Ecol. 2006, 7, 155–163. [Google Scholar] [CrossRef]
  71. Zhao, H.; Wang, Q.R.; Fan, W.; Song, G.H. The Relationship between Secondary Forest and Environmental Factors in the Southern Taihang Mountains. Sci. Rep. 2017, 7, 16431. [Google Scholar] [CrossRef] [PubMed]
  72. Li, K.; Xu, Y.L. Study on Adjustment of Agricultural Planting Structures in China for Adapting to Climate Change. J. Agric. Sci. Technol. 2017, 19, 8–17. [Google Scholar]
  73. Ji, Y.Z.; Yan, H.M.; Liu, J.Y.; Kuang, W.H.; Hu, Y.F. A MODIS data derived spatial distribution of high-, mediumand low-yield cropland in China. Acta Geogr. Sin. 2015, 70, 766–778. [Google Scholar]
  74. Seto, K.C.; Guneralp, B.; Hutyra, L.R. Global forecasts of urban expansion to 2030 and direct impacts on biodiversity and carbon pools. Proc. Natl. Acad. Sci. USA 2012, 109, 16083–16088. [Google Scholar] [CrossRef] [Green Version]
  75. Zhao, S.; Liu, S.; Zhou, D. Prevalent vegetation growth enhancement in urban environment. Proc. Natl. Acad. Sci. USA 2016, 113, 6313–6318. [Google Scholar] [CrossRef] [Green Version]
  76. Ma, L.; Wu, J.S.; Li, W.F.; Peng, J.; Liu, H. Evaluating Saturation Correction Methods for DMSP/OLS Nighttime Light Data: A Case Study from China’s Cities. Remote Sens. 2014, 6, 9853–9872. [Google Scholar] [CrossRef]
  77. Bao, G.; Qin, Z.H.; Bao, Y.H.; Zhou, Y.; Li, W.J.; Sanjjav, A. NDVI-Based Long-Term Vegetation Dynamics and Its Response to Climatic Change in the Mongolian Plateau. Remote Sens. 2014, 6, 8337–8358. [Google Scholar] [CrossRef] [Green Version]
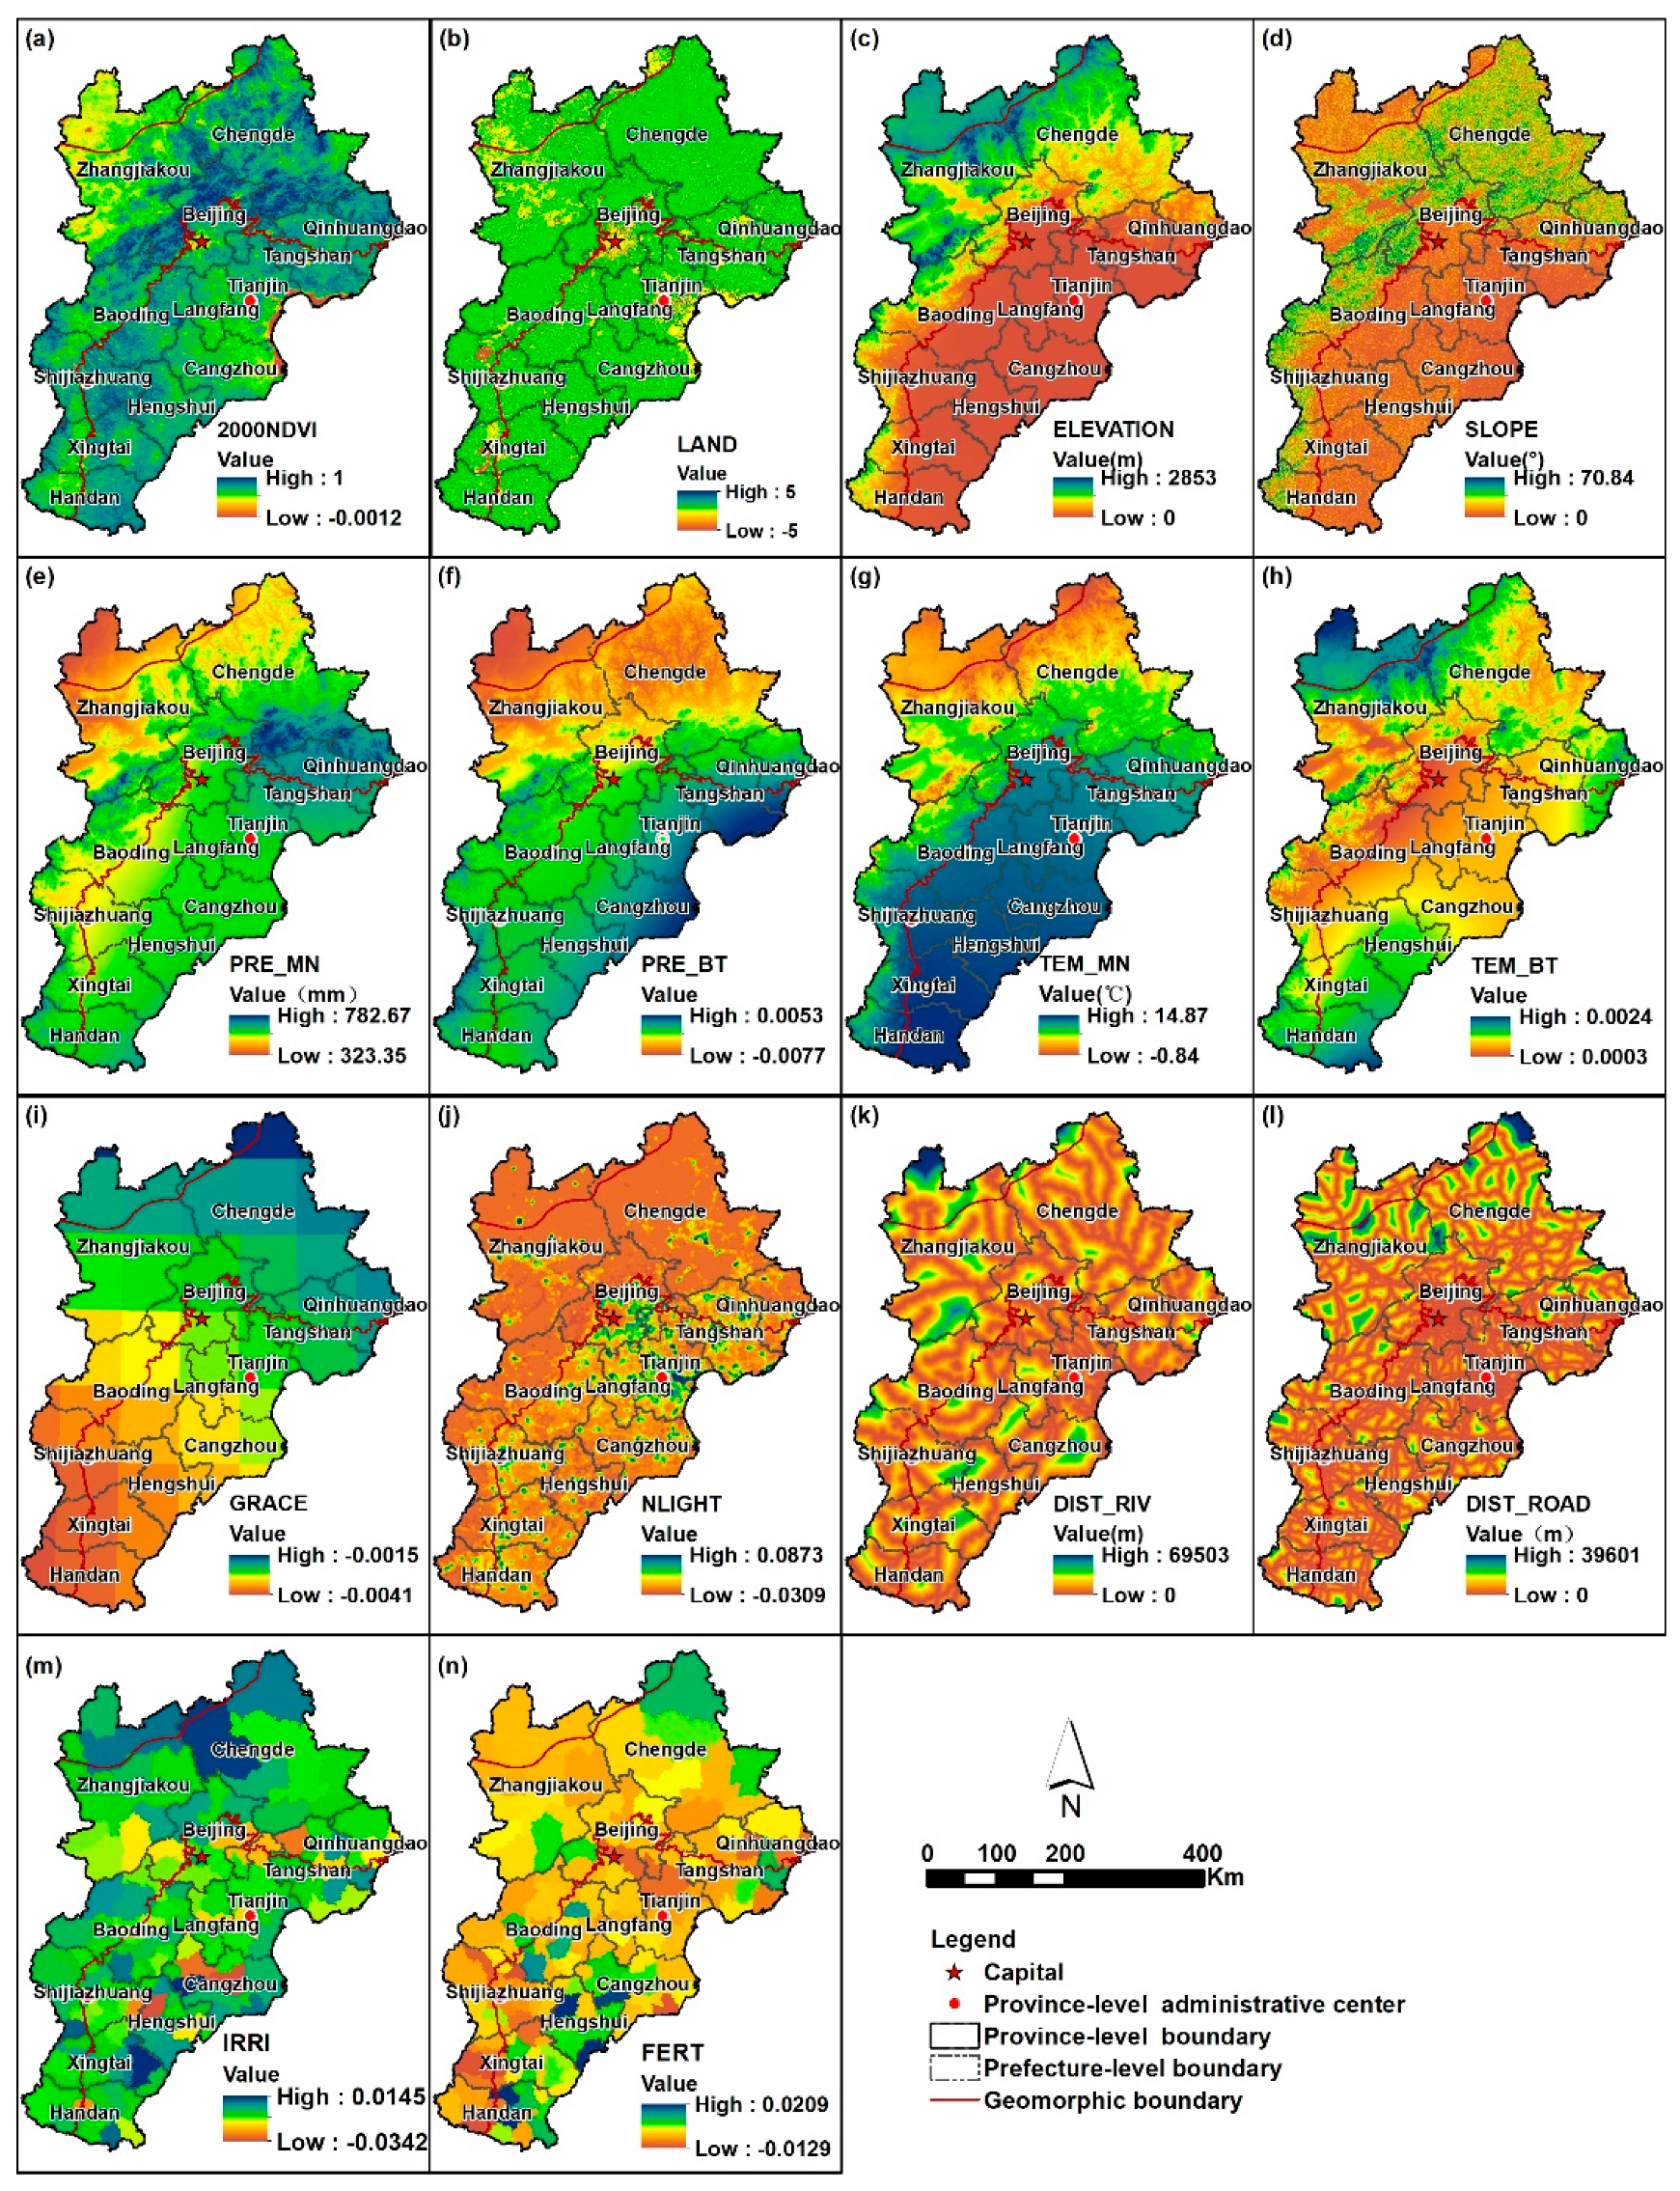
Figure 1. (a) Location and elevation map. (b) Land cover type map. (c) Geomorphic unit division, and secondary geomorphic units, including Plateau Hills (I1), High Plain (I2), Mountain-Yinshan Eastern Section (II11), Mountain-Yanshan Section (II12), Mountain-Taihang Section (II13), Hilly Yanshan Section (II21), Hilly Taihang Section (II22), Mountain Basin (II3), Alluvial-Proluvial Fan (III1), Flood Plain (III2), Yellow River Floodplain (III3), Depression (III4), Alluvial and Coastal Plain (III5), and Marine Plain (III6).
Remotesensing 11 01224 g001
Figure 2. Average NDVI, precipitation anomaly, and temperature anomaly from 2000 to 2015.
Remotesensing 11 01224 g002
Figure 3. Spatial distribution of the NDVI trends. NDVI-ESD represents an extremely significant decrease, NDVI-SD represents a significant decrease, NDVI-ND represents a nonsignificant decrease, NDVI-NI represents a nonsignificant increase, NDVI-SI represents a significant increase, and NDVI-ESI represents an extremely significant increase.
Remotesensing 11 01224 g003
Figure 4. (a) GWRec of initial NDVI. (b) GWRec of land cover type change. (c) GWRec of elevation. (d) GWRec of slope. (e) GWRec of annual average precipitation. (f) GWRec of changes in precipitation during the growing season. (g) GWRec of annual average temperature. (h) GWRec of changes in temperature during the growing season. (i) GWRec of GRACE changes. (j) GWRec of NLIGHT changes. (k) GWRec of river Euclidean distance. (l) GWRec of road Euclidean distance. (m) GWRec of irrigation change. (n) GWRec of fertilization change. (o) Sum of the absolute values of the GWRec of natural factors. (p) Sum of the absolute values of the GWRec of human factors, and (q) ratio of human to natural factors.
Remotesensing 11 01224 g004
Figure 5. (a) Sum of natural variables of different land cover types in each geomorphic-NDVItrend unit. (b) Sum of human variables of different land cover types in each geomorphic-NDVItrend unit. (c) Ratio of human to natural factors of different land cover types in each geomorphic-NDVItrend unit. The geomorphic-NDVItrend unit represents different NDVI trends in the primary geomorphic units, 1_ to 6_ represents NDVI-ESD to NDVI-ESI, IMP represents the Inner Mongolia Plateau, NCMs represents the North China Mountains, and NCP represents the North China Plain.
Remotesensing 11 01224 g005
Table 1. Factors used as explanatory variables for NDVI trends.
Variable ClassVariable NameDefinition and UnitsData SourceSpatial Resolution
Climatic and groundwaterPRE_MN*1 Annual mean precipitation 1980–2015 (mm/yr)Data Center for Resources and Environmental Sciences, Chinese Academy of Sciences a1 km
TEM_MN*1Annual mean temperature 1980–2015 (℃/yr)1 km
PRE_ BT*1t-test grading of precipitation trends (OLS) during the growing season 2000–2015China Meteorological Data Network b1 km
TEM_ BT*1t-test grading of temperature trends (OLS) during the growing season 2000–20151 km
GRACE*1Liquid water equivalent thickness trend (OLS) from GRACE 2003–2015 (cm)JPL/GRACE-TELLUS c
GeomorphicELEVATION*1Elevation represents macroscopic landform (m)Geospatial data cloud d30 m
SLOPE*1Slope represents microtopography (°)30 m
Socioeconomic activitiesNLIGHT*2Nighttime light intensity trend (OLS) from DMSP/OLS 2000–2013NOAA’s National Geophysical Data Center e1 km
AccessibilityDIST_RIV*1Euclidean distance from river (m)National Catalogue Service for Geographic Information fvector
DIST_ROAD*2Euclidean distance from main road (m)
Agricultural activitiesFERT*2t-test grading of fertilizer uses trend (OLS) 2000–2015Beijing Municipal Bureau of Statistics gvector
Tianjin Bureau of Statistics h
IRRI*2t-test grading of effective irrigated area trend (OLS) 2000–2015Hebei Provincial Bureau of Statistics i
Land cover changeLAND*2Land cover type change between 2000 and 2015 (6 classes)Research Center for Eco-Environmental Sciences, Chinese Academy of Sciences j30 m
Initial NDVI2000NDVI*3NDVI in the growing season of 2000Geospatial data cloud d500 m
*1 represents natural variables. *2 represents anthropogenic variables. *3 represents a variable with both natural and anthropogenic attributes. a http://www.resdc.cn. b http://data.cma.cn/. c http://upwell.pfeg.noaa.gov. d http://www.gscloud.cn. e https://www.ngdc.noaa.gov. f http://www.webmap.cn. g http://www.bjstats.gov.cn. h http://stats.tj.gov.cn. i http://www.hetj.gov.cn. j http://www.rcees.ac.cn.

