Studies of General Precipitation Features with TRMM PR Data: An Extensive Overview


1
CMA Key Laboratory for Aerosol-Cloud-Precipitation, School of Atmospheric Physics, Nanjing University of Information Science and Technology, Nanjing 210044, China
2
Laboratory of Straits Meteorology, Xiamen 361012, China
3
Shanghai Meteorological Sci-Tech Service Centre, Shanghai 200030
4
Department of Physics, The University of Auckland, Auckland 1142, New Zealand
*
Author to whom correspondence should be addressed.
Remote Sens. 2019, 11(1), 80; https://doi.org/10.3390/rs11010080
Submission received: 3 October 2018
/
Revised: 19 November 2018
/
Accepted: 14 December 2018
/
Published: 4 January 2019
(This article belongs to the Section Atmospheric Remote Sensing)
Abstract
:The Precipitation Radar (PR), the first space-borne precipitation radar onboard the Tropical Rainfall Measuring Mission (TRMM) satellite, could observe three-dimensional precipitation in global tropical regions and acquire continuous rainfall information with moderate temporal and high spatial resolutions. TRMM PR had carried out 17 years of observations and ended collecting data in April, 2015. So far, comprehensive and abundant research results related to the application of PR data have been analyzed in the current literature, but overall precipitation features are not yet identified, a gap that this review intends to fill. Studies on comparisons with ground-based radars and rain gauges are first introduced to summarize the reliability of PR observations or estimates. Then, this paper focuses on general precipitation features abstracted from about 130 studies, from 2000 to 2018, regarding lightning analysis, latent heat retrieval, and rainfall observation by PR data. Finally, we describe the existing problems and limitations as well as the future prospects of the space-borne precipitation radar data.

1. Introduction
Precipitation is any product of the condensation of atmospheric water vapor that falls under gravity to the earth surface. It plays an important role for dynamic analysis of weather process, numerical weather prediction, water balance, hydrological model and climate change. It also has a significant impact on the economy and people’s livelihood.
The tropical region accounts for 40% of the Earth’s surface and about half of the world’s population. However, tropical precipitation accounts for over two-thirds of the global precipitation. Most of the tropical regions are ocean, desert or rainforests where rain gauges and ground radars are rare, and this makes it difficult to implement conventional rainfall observation over much of the region.
1.1. The Tropical Rainfall Measuring Mission (TRMM)
As an important step in the measurement of tropical rainfall, TRMM was developed jointly by the National Aeronautics and Space Administration (NASA) of United States and the National Space Development Agency (NASDA) of Japan, and was launched on 27 November 1997 [1]. The TRMM satellite traveled around the Earth in about 92 minutes with an orbital inclination about 35° and there were 15 or 16 orbits in a day. In August 2001, the orbit height of the satellite was boosted to 402.5 km from 350 km at the launch in order to reduce power consumption and extend the life of the satellite. After over 17 years of data collecting, the instruments on TRMM were turned off on 8 April 2015. The spacecraft rushed into the Earth’s atmosphere over the South Indian Ocean on 15 June 2015 and most of the spacecraft was burned up.
1.2. The Precipitation Radar (PR)
TRMM satellite carried three primary instruments, Precipitation Radar (PR), TRMM Microwave Imager (TMI) and Visible and Infrared Scanner (VIRS). It also carried Lightning Imaging Sensor (LIS) and Clouds and the Earth’s Radiant Energy System (CERES).
PR was the first space-borne precipitation radar in the world [2,3,4,5]. It operated at a frequency of 13.8 GHz (Ku band) or a wavelength about 2.2 cm. PR scanned perpendicularly to the satellite orientation with a scanning angle of 17° and had an observation range between 36° S–36° N. The swath width was 247 km with a horizontal resolution at the ground 5 km after the boost while it was 215 km with 4.3 km at the launch. The vertical detection range was from the ground surface up to a height of about 20 km with a high range resolution of 250 m (Figure 1). PR had a minimum detectable equivalent reflectivity factor of 18 dBZ [6], and through rigorous calibrations, it had reflectivity error within 1 dBZ [3,7,8,9]. In addition, the PR system noise level was also quite stable with a periodic change less than 0.15 dB [10].
Due to the satellite platform, PR had a view of the whole tropical region from the space and did not suffer from surface constraints like the curvature of the earth and beam blocking for ground-based radars (GR). As an active remote sensing instrument, PR could achieve all-weather and all-day observation of rainfall with 3D high-resolution quantitative measurement. With these advantages, PR played a crucial role in TRMM’s goals such as measurements of precipitation and latent heating [2].
1.3. PR Products
The PR standard products can be classified into Level 1 (1B21, 1C21), Level 2 (2A21, 2A23, 2A25), and Level 3 (3A25, 3A26), in which Level 1 and Level 2 products are data in the instantaneous field of view (FOV) and Level 3 products are data of monthly statistical values for rain parameters (Table 1). Due to the TRMM boost from 350 km to 402.5 km in August 2001, major impacts on PR observations included the degradation of PR sensitivity, the increase of the footprint size, and the mismatch between transmission and reception angles for one pulse among onboard averaging pulses, leading to small changes in PR reflectivity and rainfall estimation [11,12]. Detailed descriptions of PR product algorithms and the changes between versions can be referred to Table 2 and the "Instruction Manual of TRMM PR Algorithm" at the website of Japan Aerospace Exploration Agency (JAXA) [13].
1.4. Existing Studies on Precipitation Features Using the PR Data
In addition to the two primary goals of determining surface rainfall patterns and latent heating profiles, the actual much longer life cycle of the TRMM was helpful for studies on characteristics of precipitation with enough samples in the tropics and subtropics, compared to the expected duration in orbit of about three years. In fact, most of the existing studies using the PR data were precipitation observations for a period of years, and some were studies on the physical phenomena during precipitation processes including latent heat and lightning. Although the TRMM and the PR had ended in 2015, related studies still continued using PR data storage.
The University of Utah Precipitation Measuring Missions (PMM) science group has accomplished a great deal studying precipitation features from the PR data. The group has established an event-based reanalysis database of precipitation feature from temporally and spatially collocated TRMM data and, afterwards, climatological descriptions of the identified features are generated [14]. Other research groups include the Houze group and the International Precipitation Working Group (IPWG) [15]. The Houze group interpolated and geolocated the PR data into a three-dimensional Cartesian grid, and from this stored dataset it is possible to identify structures of echoes that satisfy certain criteria [16]. The authors of this article have been paying attention to this field since 1997 [4,17] and especially in the last few years we have reviewed much of the literature with the support of a Commonwealth Industry Research Project.
1.5. The Goal of the Review
To the best of our knowledge, there is no paper that incorporates and integrates the specific research results to extract some general precipitation features from all existing studies. Therefore, the goal of this review is to seek an overall understanding of tropical precipitation by investigating common achievements among the isolated studies, and exploring the problems and future prospects in using the space-borne precipitation radar data.
In this review, we summarize features of precipitation and the related physical phenomena in existing studies mainly using the PR data. While introducing the selected studies, we lay emphasis on abstracting general and reliable conclusions, rather than presenting the research aims, processes or significances, regarding it being difficult to give full treatment and cover details of numerous studies in a usual review article. Although many studies used older versions of PR products, the revealing conclusions in them are independently meaningful. Nevertheless, we still give information of PR product versions, study periods, and study regions for reference.
The approach of this review is to identify categories of the mentioned contents in the studies, single out the agreement and disagreement, reveal general precipitation features that may come to light in the context of multiple studies, and analyze possible mechanisms yielding the conclusions. One advantage of this review is the aggregation of information leading to a higher statistical power and more robust conclusion than is possible from the specific measure derived from the individual studies, and provide useful reference and inspiration for studies relating to the next generation of space-borne precipitation radar.
In the remainder of the paper, the content is structured as follows. To illustrate the reliability of PR data, Section 2 introduces comparison studies between precipitation measures obtained by the PR with that observed by ground-based radars or rain gauges. Section 3, Section 4 and Section 5 elaborate the PR measures on, respectively, lightning analysis, latent heat retrieval and rainfall observation. In Section 6, the conclusion, existing problems, future prospects in using space-borne precipitation radar data as well as the review limitation are presented. A conceptual scheme of the paper is shown in Figure 2.
2. The Reliability Evaluation of PR Data by Comparisons with Ground-Based Instruments
In order to provide accurate rainfall measurements, PR needed to be evaluated or calibrated before the data can be used in further applications with confidence. A variety of studies have been carried out to address the issue through cross comparisons of PR and ground-based instruments. A fundamental difficulty with this sort of research is that all the measurement equipment including rain gauges and ground-based radars have different sampling spaces and time resolutions as well as their own systematic errors.
In fact, before the cross comparison could be performed, it should be considered that there are objective factors affecting PR measurements. First of all, attenuation correction should be taken into account for PR since it worked at the Ku band suffering extensively from rain attenuation [18,19]. Secondly, the non-uniform beam filling (NUBF) needed to be considered [18,20,21]. Additionally, non-Rayleigh scattering might frequently occur for PR because it operated at a short wavelength, inducing reflectivity differences compared with GR, particularly for rain containing large or solid drops. This difference needed to be corrected before the comparison of PR and GR [22,23,24]. Some of these issues had already been addressed in the products of PR data, such as corrections of attenuation and NUBF, but might be not satisfying.
2.1. Comparisons of Reflectivity with Ground-Based Radars
Both the PR and GR detected radar reflectivity of rainfall and hence could be compared with each other. Key information of the studies on reflectivity comparison of PR with GR is listed in Table 3.
There are four primary TRMM Ground Validation (GV) radar sites around the world: Houston, Texas, US (S-band), Melbourne, Florida, US (S-band), Kwajalein, Republic of the Marshall Islands (S-band), and Darwin, Australia (C-band). These famous GV radars had already been corrected and thus could be served as credible references for PR measurements [25,26]. Before the reflectivity comparison of PR and GR, spatial matching of measurements should be carried out since PR and GR had different view angles, scanning modes, and data resolutions. The matching approaches could be classified into two categories: grid-matching [27,28] and area-matching [29,30].
When the reflectivity of calibrated GR was used as the reference, PR reflectivity could be evaluated. It was shown that PR reflectivity generally agreed well with GR reflectivity, but a notable difference was that PR highly undersampled weak echoes below the detection sensitivity of PR [25,29]. Fortunately, this defect had no substantial effect on the total accumulated rainfall measurements because the weak echoes contributed little to the precipitation amounts. Most studies showed that the attenuation correction of PR performed quite well for stratiform rain but insufficiently for convective rain from studies comparing PR with GR for different rain types and different altitudes (Figure 3) [27,30,31]. An exception was a study indicating that the attenuation was accurately corrected for convective rain and was overcorrected for stratiform rain [28], but it was noted that the non-Rayleigh scattering was not taken into account before the comparison.
On the other hand, some scholars used the reliable PR reflectivity as the reference to evaluate or calibrate the GR reflectivity. Gabella et al. [32,33,34,35] designed range-dependent adjustment methods for the compensation of GR observations in consideration of the increasing sampling volume of the GR with range, and used this method to improve the rainfall estimation of the GR. Some recent studies made comparisons to evaluate the GR reflectivity in East Asia [36,37,38,39,40], in which stratiform precipitation was generally used to avoid uncertainties of PR products related to convective rain.
To analyze in detail the sources and magnitudes of discrepancies between PR and GR reflectivity, it is necessary to adopt more and further simulation studies or dual-polarimetric radar observations for various possible situations like rainfall types, intensities and space-time positions, phase states of drops, topography effect, etc. Early examples are studies of [20,23].
2.2. Comparisons of Quantitative Precipitation Estimation with Ground-Based Radars
Quantitative precipitation estimation (QPE) can be used as criteria to evaluate the measurement of PR or GR since the QPE derived from reflectivity is a straight application of radar detection. Key information about the studies on QPE comparison of PR with GR is listed in Table 4.
2.3. Comparisons of Rainfall Rate with Rain Gauges
Observations of rain gauges can be also used as references to compare with rainfall measurements of PR. Key information of the studies on comparisons of rainfall rate derived from PR with rain gauges is listed in Table 5.
In general, PR and the rain gauges gave consistent rainfall measurements on the whole, but discrepancies had been noted in early studies [32,47,48,49]. Recently, there were more studies on PR rainfall measurements by comparisons of TRMM Multi-satellite Precipitation Analysis (TMPA) products 3B42 or 3B43 with rain gauge data over different regions across the world. The results showed good agreement and high correlation between the two datasets, with some small differences. Most of the studies implied that there was overestimation for light rainfall and/or underestimation for heavy rainfall [50,51,52,53,54,55,56,57,58,59,60], but few of them gave an opposite conclusion [61]. Some studies concluded that the consistency between TMPA products and rain gauge measurements was related to the altitude and the topography [54,59,61,62,63,64,65].
More attention had been paid to statistics of the results in previous studies on rainfall measurements of PR and rain gauges. However, the QPE algorithms of PR should also be carefully analyzed under different situations, and this issue is worth studying before the usual comparisons. For instance, the drop size distribution (DSD) used in PR rainfall products might be not suitable for some regions, topography or seasons. Ioannidou et al. [66] used a 2D-video disdrometer to measure the DSD and establish the Z–R relationship in Crete island of Greece, and then they found the coefficients of the local Z–R power laws were different from the values used in PR algorithms and consequently there was an overestimation of rainfall rate by PR algorithms for light to moderate stratiform rain. In addition, the improvement of PR products may affect the results of QPE. Kirstetter et al. [46] analyzed the error structure of PR QPE products of version 6 and version 7 based on GR products, and the results indicated that version 7 was in closer agreement than version 6. The bias of the rain rate estimates was improved from an underestimation of −23% of version 6 to −18% of version 7.
2.4. Remarks on the Comparison Studies with Ground-Based Instruments
It was shown from the results of these comparison studies that PR observations or estimates agreed well with those of reliable ground-based instruments on the whole, but the difference attracted more attention. Besides small convective rainfall systems, edges of precipitation, and rainfall areas distant from PR where nonhomogeneous beam filling was likely to occur, PR tended to give larger echo area and weaker echo intensity due to a coarse horizontal resolution, and give stronger echo intensity due to non-Rayleigh scattering. PR captured most of the rainfall amount though light rain and rain area might be overlooked because of the low detection sensitivity. It seems that PR tended to give underestimation of rainfall amount for convective and heavy precipitation and give overestimation for light precipitation because of the incomplete attenuation correction of PR products and the coarse temporal and horizontally spatial resolution of PR measurements.
With new versions of PR products, further studies are necessary to quantitatively distinguish the roles of factors like grid and time resolution, rainfall types and amounts under different sampling time scales, the parameters in the Z–R relationship of PR algorithms, distribution density of rain gauges, etc. It had been noted that the peak of high correlation of PR and the rain gauge observations occurred for the near nadir cases and several minutes after the instantaneous PR observation because it took minutes for the raindrops to reach the ground surface [67].
3. Lightning Analysis of PR Data
Studies on lightning accompanied by rainfall are important for the analysis of microphysical processes and precipitation mechanisms. Some researchers investigated characteristics of the lightning activity using PR data of rain type, rainfall rate, and vertical reflectivity profile (Table 6).
3.1. Lightning Activity over Land and Oceans
Studies noted that lightning appeared more frequently over land than over oceans (Figure 4) [73,74,75,76,77,78]. It is well known that the charge separation mechanism requires collisions between graupel and small ice particles in the presence of supercooled liquid water [77,78]. The environmental differences over land and oceans could impact the precipitation height and thus the mixed-phase processes, leading to the significant difference of flash production. Although the difference of lightning occurrence over land and oceans was noticed, the reasons have not been firmly established. At present, there are two main theories accounting for the land–ocean contrast of lightning: ground-surface property and aerosol concentration [79,80]. In our view, the influence of water vapor availability could be also considered, but there were few related studies. When the water vapor availability over land was not as great as that over oceans, it might result in higher condensation altitudes and a greater possibility for the occurrence of solid or mixed phase particles. However, the relative humidity might play opposite roles in wet or dry regions with different magnitudes of water vapor content [81]. It would be worthwhile to give further analysis on aspects of all impact factors.
3.2. Lightning Activity Associated with Convective and Stratiform Rainfall
Unsurprisingly, the studies found that lightning occurred more frequently for convective rainfall than stratiform rainfall [82,83], and it was found that the absence of lightning could be explained by the stratiform nature of the precipitation patterns [76]. Meanwhile, flashes in stratiform rainfall accounted for a larger fraction of lightning over oceans than over land [77]. Convective rainfall usually had larger vertical velocities and developed at higher altitudes and thus had a greater possibility for the occurrence of lightning in comparison with stratiform rainfall.
3.3. Lightning Activity and the PR Reflectivity
Radar reflectivity was an index to the character of rainfall development and convection intensity, and it was noticed that lightning occurrence was accompanied by high radar reflectivity [74,75,76,82] and high rainfall rate [73,78,84]. Cecil et al. [75] and Cecil and Zipser [76] found that the possibility of lightning was a function of radar reflectivity and the depth of reflectivity for a given magnitude. Similarly, Liu et al. [78] found that the flash rate was a function of the maximum reflectivity and the area and volume of high reflectivity larger than 30 dBZ.
Lightning is more likely to occur in convective rainfall with strong updraft. Therefore, the accompanying precipitation often showed uniform vertical structure and the absence of the bright band. Toracinta et al. [74] and Kodama et al. [82] noticed that rainfall systems with lightning tended to have a smaller lapse rate of reflectivity with the height above the freezing level than those without lightning. Tadesse and Anagnostou [85] found that there were weak vertical reflectivity gradients and obscure bright bands at the growth stage of thunderstorms with high lightning density while strong vertical gradients and obvious bright bands at the dissipation stage of thunderstorms with lightning density decreasing rapidly to zero.
3.4. Remarks on the Studies of Lightning Accompanied by Rainfall
From the results of PR observations, it could be concluded that the lightning probability and high flash rates were more likely to occur over land for convective rainfall than over oceans for stratiform rainfall, and with higher radar reflectivity and weaker vertical reflectivity gradients. Nevertheless, due to the low sensitivity to weak precipitation and phase states of drops, the formation process of lightning was difficult to be analyzed by PR data alone. Spaceborne microwave radiometer, cloud-aerosol lidar and cloud radar are possible collaborative instruments as assistance to provide important information such as water vapor, aerosols and small drops.
4. Latent Heat Measurements of PR Data
The latent heat (LH) produced during the rainfall process accounts for three-fourths of all heat energy for the atmosphere and has a significant impact on water cycles of the Earth. Studies on structures of the LH could provide references for the diabatic control and the feedback of rainfall, the large scale circulation and its forecasting, and cloud parameterization schemes. It is meaningful to analyze the features of the LH measured by PR for a long time period and from a global view. Previous representative studies are listed in Table 7.
4.1. Retrieval Algorithms of the LH
Before the LH analysis was contemplated, algorithms needed to retrieve the LH from PR data. Commonly used retrieval algorithms included convective and stratiform heating (CSH) [86,87], spectral latent heating (SLH) [88,89], trained radiometer algorithm (TRN) [90,91], and precipitation radar heating (PRH) [92]. It was noted that some parameters played crucial roles in the algorithms like the surface rainfall rate and the proportion of stratiform rainfall, as well as the height of the echo top and the rainfall rate at the melting level.
4.2. Vertical Profiles of the LH over Land and Oceans
Because of the well-known land-sea difference, some systematic differences were revealed for vertical profiles and diurnal variations of the LH over land and over oceans. Two peaks were found at about 3 km and 7 km in LH profiles over oceans [93,94], while only one peak at about 7 km over land [94,95,96]. Hagos et al. [93] discovered that the upper peak was associated with a high precipitation rate and the lower peak was associated with a low precipitation rate. Liu et al. [94] noticed that the upper peak was associated with mesoscale convective systems (MCS) while the lower peak was associated with small shallow precipitation. Tao et al. [95] and Liu et al. [94] measured the difference in the fractional contribution of the LH at an altitude over different land areas including central Africa, South America and United States, and the difference might be attributed to differences in convection intensity and in the size of the MCSs (Figure 5). Regarding the diurnal cycles, the LH was much stronger in the late afternoon over land and was a little stronger in the early morning over oceans [94]. However, it was found that the LH showed higher values along the southern slopes of the Himalayas during the night and early morning than during the afternoon [96] and this exception might be attributable to the impact of the Himalayas on the latitudinal distribution of the LH.
4.3. The LH and the Climate Response
In the long run, the distribution of LH accompanying the rainfall modulated the large scale circulations and thus had an interaction with climate response such as the El Nino–Southern Oscillation (ENSO). The LH released during precipitation processes would change the heat budget and balance of the atmosphere, and the consequently adjusted atmosphere motions would in turn impact the water vapor evaporation and transportation and thus the precipitation distribution. This was a complex feedback effect and some studies made pioneering works and preliminary analysis by PR data. Schumacher et al. [97] calculated the four-dimensional distribution of the LH and modeled the response of the atmosphere by an idealized model with derived LH as initial values. Results showed that during El Nino years, the gradient in stratiform precipitation across the Pacific became more pronounced. This led to major changes in the LH field and the circulation response to the LH was stronger than the other years. Li et al. [98] and Wang and Huang [99] investigated the variation of the LH associated with the summer and the winter monsoon over the South China Sea (SCS). They found that the interannual variation of the LH over the SCS depended on El Nino or La Nina conditions, and the LH over the SCS was much smaller during El Nino years than during La Nina years. By contrast, Zuluaga et al. [100] indicated that the monsoonal interannual variation of the LH could not be explained by the ENSO when they examined the four-dimensional LH structure over the South Asian monsoon region.
The Madden–Julian oscillation (MJO) is a quasi-periodic variability in tropical atmosphere. It turns out to be the main intra-annual fluctuation that explains weather variations in the tropics and has significant impacts on the global climate including ENSO events. Some studies analyzed the MJO signal from the perspective of LH, and they found a double peak structure of LH profiles with peaks at about 3 km and 7 km and the largest amplitudes appeared over the Indian Ocean and over the western Pacific Ocean during MJO stages [101,102,103,104].
4.4. Remarks on Studies of Latent Heat Accompanied by Rainfall
Important characteristics of LH vertical profiles and the diurnal variations were yielded under a wide range of studies. By comparison, the long-term climate effects of the LH are not understood enough and more studies are needed in the future, in which atmosphere circulation theories and models would be inevitably participated. On the other hand, conclusions on climate effects of the LH should be carefully examined and need to be verified because complex climate dynamics were involved and there might be uncertainty in models and computations.
5. Rainfall Observation of PR Data
Compared with conventional observations, GR observations, and passive microwave observations, PR could provide high-resolution 3D data above the entire tropical region without occlusion. It was very beneficial to the studies on precipitation features including vertical structure, diurnal variation, and climate characteristics with the accumulated PR data.
5.1. Vertical Structure of Rainfall
PR detection could penetrate the precipitation from top to bottom and had a high vertical resolution of 250 m. Therefore, it was very suitable to investigate the vertical structure of rainfall with PR data. The maximum height to which the rainfall develops (hereinafter referred to as precipitation height or rainfall height) as well as the correspondence to the rainfall rate could be analyzed (Table 8).
5.1.1. Precipitation Height of Rainfall Systems
Studies found that there was a difference of rainfall height between convective and stratiform precipitation and between precipitation over land and over oceans. Most of them concluded that the height of convective precipitation was higher than stratiform precipitation [105,106,107], and the precipitation height was higher over land than over oceans [105,107,108,109,110,111]. These conclusions implied that stratiform and warm rain were more common over oceans than over land, while ice-based microphysics was more apparent over land than over oceans, especially for continental convection (Figure 6) [110,112]. A few studies noticed no significant height difference between stratiform precipitation over land and over oceans [106,108], and even that the height of stratiform precipitation over oceans was higher than that over land [113]. There was also precipitation height difference over different oceans or different land [114,115].
5.1.2. Precipitation Height and the Rainfall Rate
Most studies yielded that there was a high positive correlation between the precipitation height and the rainfall rate [106,116,117], but this might not demonstrate the necessary and sufficient condition for each other. Hamada et al. [118] found that an extreme amount of rainfall was characterized by less intense convection with strong radar echoes not extending to very high altitudes (around 8–9 km) compared with extreme convective cases with altitudes more than 10 km even 16–17 km. They indicated the importance of warm rain processes in producing high rainfall rates. Hu et al. [113] found that a high rainfall rate was associated with a deep rain system but a deep rain system was not always associated with a high rainfall rate. These results imply that the rainfall rate may not be simply related to the vertical extent of precipitation. Specific conditions of dynamic, thermodynamic and water vapor need to be taken into detailed consideration. For example, the rainfall of large vertical extention might need moderate water vapor because abundant water vapor would be condensed easily in low altitudes.
5.1.3. Vertical Profiles of Radar Reflectivity
Studies analyzed patterns of the vertical profile of reflectivity (VPR) and the influencing factors. On the whole, they revealed that, at low altitudes, VPR had a larger negative slope for convective precipitation over land than stratiform precipitation over oceans, while, at high altitudes, the decrease of reflectivity with the height was more slowly for convective precipitation over land than stratiform precipitation over oceans [109,119]. It was also noticed that the underlying surface and the terrain in different regions had significant impact on the VPR [105,107,119].
5.1.4. Remarks on the Vertical Structure of Rainfall
Differences in the vertical structure of precipitation and its variation lay in rainfall types, sea–land difference and regional differences, and had a correlation with the surface rain rate. These differences can be understood by different thermodynamical conditions between sea and land, between stratiform rainfall and convective rainfall, and between different regions. The convective rainfall had prominent instability conditions and thus it could ascend to higher altitudes than the stratiform rainfall. There was more moisture over oceans than over land and thus the moist air would be condensed more easily at lower altitudes over oceans than over land.
5.2. Diurnal Variation of Rainfall
The diurnal variation of precipitating systems is a reflection of insolation variation and also a reflection of differences in surfaces, boundary layers, microphysical processes, etc. Before the launch of TRMM, studies on diurnal variation of precipitation were limited by the lack of extensive datasets. During the past several decades, researchers have analyzed the diurnal variation of rainfall based on PR data (Table 9).
5.2.1. Diurnal Variation of Precipitation
Many statistical analyses showed that the precipitation over land had peaks at noon to late afternoon while the precipitation over oceans had peaks at midnight to early morning (Figure 7) [120,121,122,123,124,125,126,127,128,129,130], and some showed that the peaks over land had larger amplitudes than over oceans [120,122,126,128,129]. Over land, the peak in the afternoon for convective precipitation was more significant and about two hours earlier than that for stratiform precipitation [106,121,128,131]. Moreover, there was another peak in the evening for stratiform precipitation in addition to the one in the afternoon [106,125].
5.2.2. Remarks on the Diurnal Variation of Rainfall
The differences in the diurnal cycle in time and amplitude could be attributed to the differences in heat capacity and thermal inertia between land and oceans, and could account for the differences in the dynamic and thermal processes between stratiform and convective precipitation, where the longwave radiative cooling of clouds may also have influence on the diurnal cycle [133].
5.3. Climate Characteristics of Rainfall
PR had provided long-term, stable, reliable and uninterrupted data for a dozen years, and this made it convenient for studies on climate characteristics of rainfall over tropical regions (Table 10).
5.3.1. Rainfall in Monsoon Seasons
The temporal and spatial distribution of rainfall during monsoon seasons is an important issue in meteorology, and the change of rainfall distribution with the onset of the monsoon could be analyzed. Studies found that the stratiform precipitation and the convective precipitation evidently increased and occurred simultaneously in time and space after the monsoon onset [134,135,136]. It seemed that, in the total rainfall amounts, the convective precipitation contributed more than the stratiform precipitation for the United States Monsoon [137], the stratiform and the convective precipitation contributed almost equally for the Indian Monsoon [134], and the stratiform precipitation contributed more than the convective precipitation for the East Asian Monsoon [135,136].
5.3.2. Rainfall in Tropical Cyclones
PR could observe the large scale precipitation systems in a complete spatial view, and there were studies on rainfall properties in tropical cyclones, especially the contribution of stratiform and convective precipitation. They noticed that the stratiform precipitation dominated in the total areal coverage, and the largest proportion of stratiform precipitation area appeared in the inner rainband region while the largest proportion of convective precipitation area appeared in the outer rainband, but the convective precipitation made a comparable contribution to the total precipitation with the stratiform precipitation due to its large rainfall rate [138,139,140,141]. In addition, they noticed that the increase in occurrence and coverage of stratiform precipitation was accompanied by the intensification of tropical cyclones [140,141]. These results showed the importance of stratiform precipitation to tropical cyclones and may provide useful references for monitoring tropical cyclones.
5.3.3. Distributions of Convection
Several researchers studied common properties of convection from a global tropical perspective. They found that the intense convection or convective rainfall was more frequent over land than over oceans, and some of them occurred near the great mountain ranges (Figure 8) [111,142,143,144]. The continental mesoscale systems often had more intense embedded convection than oceanic systems, which could form very wide stratiform regions [143].
5.3.4. Mechanisms of Regional Rainfall
Formation mechanisms of regional rainfall were investigated when characteristics of rainfall structures were exhibited. Petersen et al. [145] analyzed the rainfall characteristics of Amazonian and subtropical South American convection for three separate wet seasons. They found that the variations of vertical structures, rainfall rates, and lightning activity were all associated with the low level easterly or westerly zonal wind at 850hPa. Mehta and Yang [146] analyzed the climatological features of mesoscale rainfall over the Mediterranean region. The analysis showed that, during the winter rainy season, the rainfall was larger over the western Mediterranean Sea than the eastern part and the mesoscale rainfall generally moved from west to east and from north to south, which indicated that the precipitation was associated with the mesoscale disturbances from mid-latitudes. Similarly, Nastos et al. [147] analyzed the extreme precipitation over the Mediterranean basin. They found that drought was mainly in the eastern regions of the Mediterranean basin while extreme precipitation was mainly on the western coasts of the continental regions. This phenomenon could be explained by the eastwards passing depression over the Mediterranean. Heiblum et al. [148] studied the spatial-temporal distribution of rainfall in the Eastern Mediterranean. Results showed that the low level convergence of land breeze and the synoptic wind near the sea–land interface had a significant effect on precipitation formation. Zhou et al. [149] analyzed the rainfall structure and the environment of extreme precipitation. The study proved the importance of dynamic conditions and high water vapor content for the occurrence of extreme precipitation. Rapp et al. [150] analyzed the precipitation characteristics in Costa Rica. They found that the stratiform rainfall was associated with the low level jet and the ITCZ (Intertropical Convergence Zone), and the convective rainfall was associated with the sea breeze. Yokoyama et al. [151] compared precipitation properties between southern and northern sides of the Baiu front. The results showed that convective rainfall ratios, rainfall intensity and rainfall height in the south were larger than those in the north. These differences might be related to the greater atmospheric stratification instability and the more tropical air in the southern region of the Baiu front. Olurotimi et al. [152] made statistics on the bright band height and the rainfall height in South Africa. They found that, in 2015, the bright band heights were higher than those of the other years and they attributed this phenomenon to the occurrence of El Nino in the southern part of Africa transiting over the South Africa.
5.3.5. Other Studies
A few other studies statistically analyzed rain types, warm rain systems, and rainfall morphology and some other aspects over the entire tropics. The conclusions of these individual works were expected to be verified by more studies and new versions of PR products.
Schumacher and Houze [153] calculated the fractions of stratiform and convective rainfall. There was an average of 40% for stratiform rainfall out of the total rainfall amounts, and the maximum stratiform rainfall fraction of about 60% occurred over the eastern-central Pacific while the minimum of about 25% occurred over the maritime continent. The stratiform rainfall fraction was generally larger over oceans than over land, and was generally larger with higher total rain amounts.
Liu and Zipser [154] analyzed the characteristics of the warm rain. They found that the warm rain contributed 20% of the total rainfall amount over tropical oceans and 7.5% over tropical land areas. Large amounts of warm rainfall occurred over oceans near windward coasts during winters. Most of the warm rain systems were of small size (<100 km2) and had weak radar echoes (with maximum reflectivity of about 23 dBZ).
Nesbitt et al. [155] analyzed the rainfall morphology. They found that the rainfall from oceanic systems was dominated by small and large horizontal extents while the rainfall from continental systems was dominated by a midsized horizontal extent. Continental rainfall systems were more vertically developed compared with oceanic rainfall systems.
Hamada et al. [156] defined a concept of regional extreme rainfall and analyzed its geographical distribution. The regional extreme rainfall tended to occur late at night and in the morning over oceans while tended to occur in the afternoon over land. The intense and extensive extreme rainfall was mainly over oceans near coastal areas, the intense but less extensive extreme rainfall was mainly over land, and the extensive but less intense extreme rainfall was almost over oceans.
Hirose et al. [157] investigated the high-resolution spatial variability of precipitation climatology and verified the relationship of rainfall features to orography and geography. They found that storm-scale precipitation was remarkable for the rainfall enhancement over small islands while large-scale precipitation resulted in more rainfall over the adjacent ocean.
6. Conclusions and Prospects
Numerous studies have been conducted for investigating the quality and the application of the PR data. This article selected about 130 studies and performs a comprehensive review to extract the general precipitation features of tropical rainfall among the existing individual studies. We firstly looked at the accuracy of PR data by comparison studies with respectively ground-based radars and rain gauges. We then investigated the overall features of lightning, latent heat and rainfall in tropical regions by generalization and summary. In this final section, we develop our conclusions, and explore some problems and future prospects in using space-borne precipitation radar data.
6.1. Summary of Precipitation Studies of PR Data
Precipitation measurements are fundamental to the understanding of weather and climate on the Earth. However, many countries are not equipped with high-quality instruments to continuously and accurately observe rainfall. In addition, 70% of the Earth’s surface is covered by oceans where there are not enough observation instruments. The space-borne radar provides a good way to observe continuously the precipitation in FOV with 3D views from a satellite platform. The Precipitation Radar on board the Tropical Rainfall Measuring Mission satellite, TRMM PR, had accumulated massive amount of data since the satellite was launched in late November 1997.
Through cross validation studies, it was proved that PR had the ability to provide accurate enough data for understanding rainfall processes. The use of PR data in more quantitative applications was possible although the derived rainfall products seemed to overestimate or underestimate the rainfall amount to a small extent when compared to ground-based observations.
The application studies of PR data could obtain many convincing relationships between variations of geographical, rainfall types, diurnal and climatological variables and the precipitation features, as generalized in this article from the existing studies, adding greatly to our understanding of rainfall processes in tropical regions that would not have been possible without PR. Some general precipitation features yielded from majority studies are listed as follows:
(1) Lightning was more likely to occur over land for convective rainfall than over oceans for stratiform rainfall, and more likely to be accompanied by intense rainfall. The related vertical structure of rainfall tended to be uniform with the absence of the bright band.
(2) The latent heat profiles of rainfall tended to have two slightly stronger peaks in the early morning over oceans while having one much stronger peak in the late afternoon over land.
(3) The precipitation height tended to be higher for convective rainfall over land than stratiform rainfall over oceans and there was a positive relationship between the precipitation height and the rainfall intensity. The vertical profiles of precipitation tended to have a larger negative slope at low altitudes but a small slope at high altitudes for convective rainfall over land than stratiform rainfall over oceans.
(4) The diurnal variation of rainfall tended to have peaks with larger amplitudes at afternoon over land while with smaller amplitudes at early morning over oceans. Over land, the peaks in the afternoon for convective precipitation were stronger and hours earlier than stratiform precipitation, and the stratiform precipitation could have other peaks in the evening.
(5) The monsoon onsets were accompanied by simultaneously increased stratiform and convective precipitation. The contribution of stratiform precipitation and convective precipitation to the rainfall amount had comparable differences for different monsoon regions.
(6) The stratiform precipitation played an important role in tropical cyclones with a larger proportion of areal coverage than the convective precipitation, while the two types of precipitation contributed almost equally to the rainfall amount.
These findings and the differences of precipitation features between rainfall types and underlying surfaces may identify crucial roles of water vapor content, vertical velocity and long-wave radiation in tropical rainfall processes. The water vapor abundance over land was less than that over oceans and the vertical velocity of convective rainfall was larger than stratiform rainfall so that the extension altitudes were higher for convective rainfall over land than stratiform rainfall over oceans. The thermal inertia of underlying surfaces and the longwave radiative cooling of clouds regulated the amplitude and the phase of diurnal cycles and made them larger and earlier over land than over oceans. Meanwhile, the smaller thermal inertia of land made atmosphere stratification instability more apparent over land and thus the stratiform rainfall had a remarkably larger proportion and areal coverage over oceans and over the global than the convective rainfall. Consequently, the convection activities were more frequent over land than over oceans while the rainfall systems over oceans like tropical cyclones were constituted largely by stratiform precipitation than convective precipitation.
However, we are aware of the limitations in this review due to the manner in which we searched literature (e.g., missing studies), and biases due to the classification of studies. In addition, due to the differences between the used methods and the products and the lack of detailed interpretation for quantitative analysis in the various studies, we did not derive higher accurate estimates or pooled distribution diagrams of precipitation features by analyzing the error or utilizing the weighted average from the individual studies. Furthermore, the reliability of quantitative conclusions in the literature could be also restrained by the uncertainty and limitations in PR data as described below.
6.2. Errors and Limitations of the PR Data
Although many qualitative conclusions were revealed, the quantitative analyses might be not very accurate due to uncertainty and errors in PR data. The quantitative calculation of rainfall rate yielded through the Z–R relationship depended on the accuracy of PR reflectivity and the estimated drop size distribution (DSD), rainfall types and drop phases. The inappropriate correction of PR reflectivity for the NUBF and the attenuation, and the discrimination error of rainfall types and drop phases would introduce errors of the rainfall rate. The estimation of the LH depended on the accuracy of rainfall rates and rainfall types of PR products. In addition, the physical processes simulated in the retrieval algorithm models might be inadequate, which could also influence the calculation accuracy of the LH. The low sensitivity of PR observation would underestimate the precipitation top, and thus gave underestimated height for lightning activity accompanied by rainfall.
Regarding the identification of rainfall types, PR product 2A23 determines the rainfall type of stratiform and convective based on the vertical profile and the horizontal pattern of PR reflectivity. A category ‘other’ is given when there is no signature of either stratiform or convective rainfall. However, there could be errors of the classification results due to some limitations of PR including low sensitivity for light rain and snow, single-frequency detection at Ku-band, and the coarse horizontal resolution above the ground. This problem has already been noticed [159,160], and could be improved by future algorithms and the next-generation space-borne precipitation radar [161,162,163,164].
On the other hand, there are limitations of PR measurements which restrict more comprehensive and detailed studies. First of all, TRMM was a non-geostationary satellite with a narrow FOV and thus it had a low temporal resolution for flying over a certain region with few passes per day. This caused temporal sampling error of rainfall observation and QPE [165]. Secondly, the attenuation by convective rain was significant since PR worked at the Ku band and it might not be totally addressed by attenuation correction algorithms [27]. Thirdly, radar beam broadening of PR was remarkable due to a high satellite altitude and there was a coarse resolution of 5 km at the nadir. This frequently caused the partial beam filling for rainfall observation, leading to uncertainties for reflectivity and precipitation products [166]. In addition, PR worked at the Ku band and had a minimum detectable reflectivity of 18 dBZ. It could not detect light rain or snow and non-precipitating cloud, and could not observe the formation of precipitation before the rainfall occured, which was unfavorable for the analysis, monitoring, and prediction of the precipitation. Moreover, PR could not provide information of shapes and phase states of raindrops, and thus could not observe microphysics of clouds and precipitation. Additionaly, PR could not observe rainfall over extratropical regions because TRMM had a small orbit inclination.
6.3. The Next-Generation Space-Borne Precipitation Radar
The weakness of PR observations can be overcome or partly overcome by the implementation of Global Precipitation Measurement (GPM) mission [167,168,169]. The GPM series of satellites take over TRMM satellite to observe the global rainfall. The Core Observatory satellite of GPM series was launched in late February, 2014 and it flies at an altitude of 407 kilometers in a non-Sun-synchronous orbit with an inclination 65°, covering most of the Earth’s surface except the polar regions. The Core Observatory carries a Dual-frequency Precipitation Radar (DPR) with a minimum detectable reflectivity of 12 dBZ and a GPM Microwave Imager (GMI) with 13 channels (Figure 9) [170]. The DPR consists of a Ku-band precipitation radar (KuPR, 13.6 GHz) and a Ka-band precipitation radar (KaPR, 35.5 GHz). The swath width is 245 km for KuPR and is 120 km for KaPR. The horizontal spatial resolution at the nadir is 5 km for both radars while the range resolution is 250 m for KuPR and 250/500 m for KaPR. The two radars detect rainfall from different views, which can give more accurate rainfall information and improve the ability to look at raindrop characteristics by using the differential observation between KuPR and KaPR. DPR can provide more accurate rain rate estimates, which in turn can be used to adjust the rain rate estimates of GMI onboard GPM Core and passive microwave (PMW) instruments onboard other satellites in the GPM constellation. Together with GMI, the size distribution of precipitation particles can be acquired and thus the accuracy of rainfall estimation can be improved. As a result, DPR can provide measurements of more accurate, extended coverage, and dynamic range. Compared with TRMM PR, the higher detection capability of GPM DPR will make an even greater contribution to scientific research and social service. There are many global meteorological targets that can be explored with the DPR observation, e.g., precipitation features in mid- and high-latitudes including light rain and snow, the global water cycle and related climate change, climate system variability and climate diagnostics, and data assimilation for numerical models.
Most recently, version 8 of TRMM PR products came out [171]. The new version of PR data is an improvement compared with the older versions and is compatible with GPM DPR products, which ensures that the space-borne radar has a consistent data suite of more than 20 years. The putting into use of the new generation space-borne radar and the new version data will bring new discoveries in future.
Author Contributions
N.L. summarized the general precipitation features from the existing studies and wrote the manuscript; Z.W. provided the idea of this review study; X.C. consulted some of the literature; G.A. offered some suggestions and polished the manuscript.
Funding
This research was funded by the National Natural Science Fundation of China (Grant No. 41675028), China Commonwealth Industry Research Project (Grant No. GYHY201306078), the National Key R&D Program on Monitoring, Early Warning and Prevention of Major Natural Disasters (Grant No. 2017YFC1501401), and U.S. Department of Health and Human Services (Grant No. H49MC00068).
Acknowledgments
The authors appreciate Professor Guo Wei for his editing.
Conflicts of Interest
The authors declare no conflict of interest.
References
- Available online: https://trmm.gsfc.nasa.gov/ (accessed on 1 January 2019).
- Simpson, J.; Adler, R.; North, G. A proposed Tropical Rainfall Measuring Mission (TRMM) satellite. Bull. Am. Meteorol. Soc. 1988, 69, 278–295. [Google Scholar] [CrossRef]
- Kummerow, C.; Simpson, J.; Thiele, O.; Barnes, W.; Chang, A.T.C.; Stocker, E.; Adler, R.F.; Hou, A.; Kakar, R.; Wentz, F.; et al. The Status of the Tropical Rainfall Measuring Mission (TRMM) after Two Years in Orbit. J. Appl. Meteorol. 2000, 39, 1965–1982. [Google Scholar] [CrossRef] [Green Version]
- Kawanishi, T.; Kuroiwa, H.; Kojima, M.; Oikawa, K.; Kozu, T.; Kumagai, H.; Okamoto, K.; Okumura, M.; Nakatsuka, H.; Nishikawa, K. TRMM Precipitation Radar. Adv. Space Res. 2000, 25, 969–972. [Google Scholar] [CrossRef]
- Wang, Z. A brief introduction to TRMM precipitation radar and a summary on the study of its applications. Sci. Meteorol. Sin. 2001, 21, 491–500. [Google Scholar]
- Kozu, T.; Kawanishi, T.; Kuroiwa, H.; Kojima, M.; Oikawa, K.; Kumagai, H.; Okamoto, K.; Okumura, M.; Nakatsuka, H.; Nishikawa, K. Development of precipitation radar onboard the Tropical Rainfall Measuring Mission (TRMM) satellite. IEEE Trans. Geosci. Remote Sens. 2001, 39, 102–116. [Google Scholar] [CrossRef]
- Shimizu, S.; Oki, R.; Igarashi, T. Ground validation of radar reflectivity and rain rate retrieved by the TRMM precipitation radar. Adv. Space Res. 2001, 28, 143–148. [Google Scholar] [CrossRef]
- Takahashi, N.; Kuroiwa, H.; Kawanishi, T. Four-year result of external calibration for Precipitation Radar (PR) of the Tropical Rainfall Measuring Mission (TRMM) satellite. IEEE Trans. Geosci. Remote Sens. 2003, 41, 2398–2403. [Google Scholar] [CrossRef]
- Takahashi, N.; Iguchi, T. Estimation and Correction of Beam Mismatch of the Precipitation Radar After an Orbit Boost of the Tropical Rainfall Measuring Mission Satellite. IEEE Trans. Geosci. Remote Sens. 2004, 42, 2362–2369. [Google Scholar] [CrossRef]
- Takahashi, N.; Iguchi, T. Characteristics of TRMM/PR System Noise and Their Application to the Rain Detection Algorithm. IEEE Trans. Geosci. Remote Sens. 2008, 46, 1697–1704. [Google Scholar] [CrossRef]
- Shimizu, S.; Oki, R.; Tagawa, T.; Iguchi, T.; Hirose, M. Evaluation of the Effects of the Orbit Boost of the TRMM Satellite on PR Rain Estimates. J. Meteorol. Soc. Jpn. 2009, 87, 83–92. [Google Scholar] [CrossRef] [Green Version]
- Short, D.; Nakamura, K. Effect of TRMM orbit boost on radar reflectivity distributions. J. Atmos. Ocean. Technol. 2010, 27, 1247–1254. [Google Scholar] [CrossRef]
- Available online: http://www.eorc.jaxa.jp/TRMM/documents/PR_algorithm_product_information/top_e.html (accessed on 1 January 2019).
- Available online: http://trmm.chpc.utah.edu/ (accessed on 1 January 2019).
- Available online: http://www.isac.cnr.it/~ipwg/ (accessed on 1 January 2019).
- Available online: http://trmm.atmos.washington.edu (accessed on 1 January 2019).
- Liu, C.; Wang, Z. A Rainfall Measuring program with a radar riding on satellites will soon be carried out. World Sci-Tech R D 1997, 19, 93–94. [Google Scholar]
- Iguchi, T.; Kozu, T.; Meneghini, R.; Awaka, J.; Okamoto, K. Rain-Profiling Algorithm for the TRMM Precipitation Radar. J. Appl. Meteorol. 2000, 39, 2038–2052. [Google Scholar] [CrossRef]
- Meneghini, R.; Iguchi, T.; Kozu, T.; Liao, L.; Okamoto, K.; Jones, J.; Kwiatkowski, J. Use of the Surface Reference Technique for Path Attenuation Estimates from the TRMM Precipitation Radar. J. Appl. Meteorol. 2000, 39, 2053–2070. [Google Scholar] [CrossRef]
- Liu, L. Simulation and analysis on observation errors of cloud intensity and structure with TRMM PR and ground-based radar. Acta Meteorol. Sin. 2002, 60, 568–574. [Google Scholar]
- Iguchi, T.; Kozu, T.; Kwiatkowski, J.; Meneghini, R.; Awaka, J.; Okamoto, K. Uncertainties in the Rain Profiling Algorithm for the TRMM Precipitation Radar. J. Meteorol. Soc. Jpn. 2009, 87, 1–30. [Google Scholar] [CrossRef] [Green Version]
- Liao, L.; Meneghini, R. Changes in the TRMM Version-5 and Version-6 Precipitation Radar Products Due to Orbit Boost. J. Meteorol. Soc. Jpn. 2009, 87, 93–107. [Google Scholar] [CrossRef] [Green Version]
- Wen, Y.; Hong, Y.; Zhang, G.; Schuur, T.; Gourley, J.; Flamig, Z.; Morris, K.; Cao, Q. Cross Validation of Spaceborne Radar and Ground Polarimetric Radar Aided by Polarimetric Echo Classification of Hydrometeor Types. J. Appl. Meteorol. Clim. 2011, 50, 1389–1402. [Google Scholar] [CrossRef]
- Cao, Q.; Hong, Y.; Qi, Y.; Wen, Y.; Zhang, J.; Gourley, J.; Liao, L. Empirical conversion of the vertical profile of reflectivity from Ku-band to S-band frequency. J. Geophys. Res. Atmos. 2013, 118, 1814–1825. [Google Scholar] [CrossRef] [Green Version]
- Schumacher, C.; Houze Jr, R. Comparison of Radar Data from the TRMM Satellite and Kwajalein Oceanic Validation Site. J. Appl. Meteorol. 2000, 39, 2151–2164. [Google Scholar] [CrossRef] [Green Version]
- Anagnostou, M.S.; Morales, C.A.; Dinku, T. The use of TRMM precipitation radar observations in determining ground radar calibration biases. J. Atmos. Ocean. Technol. 2001, 18, 616–628. [Google Scholar] [CrossRef]
- Liao, L.; Meneghini, R. Validation of TRMM Precipitation Radar through Comparison of Its Multiyear Measurements with Ground-Based Radar. J. Appl. Meteorol. Clim. 2009, 48, 804–817. [Google Scholar] [CrossRef] [Green Version]
- Wang, J.; Wolff, D. Comparisons of Reflectivities from the TRMM Precipitation Radar and Ground-Based Radars. J. Atmos. Ocean. Technol. 2009, 26, 857–875. [Google Scholar] [CrossRef] [Green Version]
- Bolen, S.; Chandrasekar, V. Quantitative Cross Validation of Space-Based and Ground-Based Radar Observations. J. Appl. Meteorol. 2000, 39, 2071–2079. [Google Scholar] [CrossRef]
- Schwaller, M.; Morris, K. A ground validation network for the global precipitation measurement mission Uncertainties in oceanic radar. J. Atmos. Ocean. Technol. 2011, 28, 301–319. [Google Scholar] [CrossRef]
- Liao, L.; Meneghini, R.; Iguchi, T. Comparisons of Rain Rate and Reflectivity Factor Derived from the TRMM Precipitation Radar and the WSR-88D over the Melbourne, Florida, Site. J. Atmos. Ocean. Technol. 2001, 18, 1959–1974. [Google Scholar] [CrossRef]
- Gabella, M.; Joss, J.; Perona, G.; Michaelides, S. Range Adjustment for Ground-Based Radar, Derived With the Spaceborne TRMM Precipitation Radar. IEEE Trans. Geosci. Remote Sens. 2006, 44, 126–133. [Google Scholar] [CrossRef]
- Gabella, M.; Morin, E.; Notarpietro, R. Using TRMM spaceborne radar as a reference for compensating ground-based radar range degradation: Methodology verification based on rain gauges in Israel. J. Geophys. Res. Atmos. 2011, 116, D02114. [Google Scholar] [CrossRef]
- Gabella, M.; Duque, D.; Notarpietro, R. Comparing meteorological spaceborne and ground-based radars: Optimal satellite overpass distance from a ground-based radar site. Int. J. Remote Sens. 2012, 33, 322–330. [Google Scholar] [CrossRef]
- Gabella, M.; Morin, E.; Notarpietro, R.; Michaelides, S. Winter precipitation fields in the Southeastern Mediterranean area as seen by the Ku-band spaceborne weather radar and two C-band ground-based radars. Atmos. Res. 2013, 119, 120–130. [Google Scholar] [CrossRef]
- Kim, J.; Ou, M.; Park, J.; Morris, K.R.; Schwaller, M.R.; Wolff, D.B. Global Precipitation Measurement (GPM) Ground Validation (GV) Prototype in the Korean Peninsula. J. Atmos. Ocean. Technol. 2014, 31, 1902–1921. [Google Scholar] [CrossRef]
- Park, S.; Jung, S.; Lee, G. Cross Validation of TRMM PR Reflectivity Profiles Using 3D Reflectivity Composite from the Ground-Based Radar Network over the Korean Peninsula. J. Hydrometeorol. 2015, 16, 668–687. [Google Scholar] [CrossRef]
- Wang, Z.; Li, S.; Dai, J.; Li, N. The Temporal-Spatial Matching between the Space-borne Radar and Ground-based Radar Data and Case Study by Comparative Analysis. Plateau Meteorol. 2015, 34, 804–814. [Google Scholar]
- Zhong, L.; Yang, R.; Wen, Y.; Chen, L.; Gou, Y.; Li, R.; Zhou, Q.; Hong, Y. Cross-evaluation of reflectivity from the space-borne precipitation radar and multi-type ground-based weather radar network in China. Atmos. Res. 2017, 196, 200–210. [Google Scholar] [CrossRef]
- Li, N.; Wang, Z.; Xu, F.; Chu, Z.; Zhu, Y.; Han, J. The Assessment of Ground-Based Weather Radar Data by Comparison with TRMM PR. IEEE Geosci.Remote S. 2017, 14, 72–76. [Google Scholar] [CrossRef]
- Wolff, D.; Marks, D.; Amitai, E.; Silberstein, D.; Fisher, B.; Tokay, A.; Wang, J.; Pippitt, J. Ground Validation for the Tropical Rainfall Measuring Mission (TRMM). J. Atmos. Ocean. Technol. 2005, 22, 365–380. [Google Scholar] [CrossRef]
- Gebremichael, M.; Over, T.; Krajewski, W. Comparison of the Scaling Characteristics of Rainfall Derived from Space-Based and Ground-Based Radar Observations. J. Hydrometeorol. 2006, 7, 1277–1294. [Google Scholar] [CrossRef]
- Wolff, D.; Fisher, B. Comparisons of Instantaneous TRMM Ground Validation and Satellite Rain-Rate Estimates at Different Spatial Scales. J. Appl. Meteorol. Clim. 2008, 47, 2215–2237. [Google Scholar] [CrossRef] [Green Version]
- Amitai, E.; Petersen, W.; Llort, X.; Vasiloff, S. Multiplatform Comparisons of Rain Intensity for Extreme Precipitation Events. IEEE Trans. Geosci. Remote Sens. 2012, 50, 675–686. [Google Scholar] [CrossRef]
- Kirstetter, P.; Hong, Y.; Gourley, J.J.; Chen, S.; Flamig, Z.; Zhang, J.; Schwaller, M.; Petersen, W.; Amitai, E. Toward a Framework for Systematic Error Modeling of Spaceborne Precipitation Radar with NOAA/NSSL Ground Radar-Based National Mosaic QPE. J. Hydrometeorol. 2012, 13, 1285–1300. [Google Scholar] [CrossRef]
- Kirstetter, P.; Hong, Y.; Gourley, J.J.; Schwaller, M.; Petersen, W.; Zhang, J. Comparison of TRMM 2A25 Products, Version 6 and Version 7, with NOAA/NSSL Ground Radar-Based National Mosaic QPE. J. Hydrometeorol. 2013, 14, 661–669. [Google Scholar] [CrossRef]
- Fisher, B. Climatological Validation of TRMM TMI and PR Monthly Rain Products over Oklahoma. J. Appl. Meteorol. 2004, 43, 519–535. [Google Scholar] [CrossRef]
- Demoss, J.; Bowman, K. Changes in TRMM Rainfall due to the Orbit Boost Estimated from Buoy Rain Gauge Data. J. Atmos. Ocean. Technol. 2007, 24, 1598–1607. [Google Scholar] [CrossRef] [Green Version]
- Liu, P.; Fu, Y.; Feng, S.; Cao, A.; Yang, Y.; Li, T.; Zi, Y. A comparison of the precipitation from rain gauge observations with from TRMM PR measurements in the southern China. Acta Meteorol. Sin. 2010, 68, 822–835. [Google Scholar]
- Prasetia, R.; As-syakur, A.; Osawa, T. Validation of TRMM Precipitation Radar satellite data over Indonesian region. Theor. Appl. Climatol. 2013, 112, 575–587. [Google Scholar] [CrossRef]
- Moazami, S.; Golian, S.; Kavianpour, M.; Hong, Y. Comparison of PERSIANN and V7 TRMM Multi-satellite Precipitation Analysis (TMPA) products with rain gauge data over Iran. Int. J. Remote Sens. 2013, 34, 8156–8171. [Google Scholar] [CrossRef]
- Teng, H.; Shi, Z.; Ma, Z.; Li, Y. Estimating spatially downscaled rainfall by regression kriging using TRMM precipitation and elevation in Zhejiang Province, southeast China. Int. J. Remote Sens. 2014, 35, 7775–7794. [Google Scholar] [CrossRef]
- Gebere, S.; Alamirew, T.; Merkel, B.; Melesse, A. Performance of High Resolution Satellite Rainfall Products over Data Scarce Parts of Eastern Ethiopia. Remote Sens. 2015, 7, 11639–11663. [Google Scholar] [CrossRef] [Green Version]
- Derin, Y.; Anagnostou, E.; Berne, A.; Borga, M.; Boudevillain, B.; Buytaert, W.; Chang, C.; Delrieu, G.; Hong, Y.; Hsu, Y.; et al. Multiregional Satellite Precipitation Products Evaluation over Complex Terrain. J. Hydrometeorol. 2016, 17, 1817–1836. [Google Scholar] [CrossRef]
- Fensterseifer, C.; Allasia, D.; Paz, A. Assessment of the TRMM 3B42 Precipitation Product in Southern Brazil. J. Am. Water. Resour. Assoc. 2016, 52, 367–375. [Google Scholar] [CrossRef]
- Darand, M.; Amanollahi, J.; Zandkarimi, S. Evaluation of the performance of TRMM Multi-satellite Precipitation Analysis (TMPA) estimation over Iran. Atmos. Res. 2017, 190, 121–127. [Google Scholar] [CrossRef]
- Wang, W.; Lu, H.; Zhao, T.; Jiang, L.; Shi, J. Evaluation and Comparison of Daily Rainfall From Latest GPM and TRMM Products Over the Mekong River Basin. IEEE J-Stars. 2017, 10, 2540–2549. [Google Scholar] [CrossRef]
- Terao, T.; Murata, F.; Yamane, Y.; Kiguchi, M.; Fukushima, A.; Tanoue, M.; Ahmed, S.; Choudhury, S.; Syiemlieh, H.; Cajee, L.; et al. Direct Validation of TRMM/PR Near Surface Rain over the Northeastern Indian Subcontinent Using a Tipping Bucket Raingauge Network. SOLA 2017, 13, 157–162. [Google Scholar] [CrossRef]
- Chen, C.; Chen, Q.; Duan, Z.; Zhang, J.; Mo, K.; Li, Z.; Tang, G. Multiscale Comparative Evaluation of the GPM IMERG v5 and TRMM 3B42 v7 Precipitation Products from 2015 to 2017 over a Climate Transition Area of China. Remote Sens. 2018, 10, 944. [Google Scholar] [CrossRef]
- Hur, J.; Raghavan, S.; Nguyen, N.; Liong, S. Are satellite products good proxies for gauge precipitation over Singapore? Theor. Appl. Climatol. 2018, 132, 921–932. [Google Scholar] [CrossRef]
- Zad, S.; Zulkafli, Z.; Muharram, F. Satellite Rainfall (TRMM 3B42-V7) Performance Assessment and Adjustment over Pahang River Basin, Malaysia. Remote Sens. 2018, 10, 388. [Google Scholar] [Green Version]
- Milewski, A.; Elkadiri, R.; Durham, M. Assessment and Comparison of TMPA Satellite Precipitation Products in Varying Climatic and Topographic Regimes in Morocco. Remote Sens. 2015, 7, 5697–5717. [Google Scholar] [CrossRef] [Green Version]
- Retalis, A.; Katsanos, D.; Michaelides, S. Precipitation climatology over the Mediterranean Basin-Validation over Cyprus. Atmos. Res. 2016, 169, 449–458. [Google Scholar] [CrossRef]
- Xu, R.; Tian, F.; Yang, L.; Hu, H.; Lu, H.; Hou, A. Ground validation of GPM IMERG and TRMM 3B42V7 rainfall products over southern Tibetan Plateau based on a high-density rain gauge network. J. Geophys. Res. Atmos. 2017, 122, 910–924. [Google Scholar] [CrossRef]
- Wehbea, Y.; Ghebreyesusa, D.; Temimia, M.; Milewskib, A.; Mandousc, A. Assessment of the consistency among global precipitation products over the United Arab Emirates. J. Hydrol. Reg. Stud. 2017, 12, 122–135. [Google Scholar] [CrossRef]
- Ioannidou, M.; Kalogiros, J.; Stavrakis, A. Comparison of the TRMM Precipitation Radar rainfall estimation with ground-based disdrometer and radar measurements in South Greece. Atmos. Res. 2016, 181, 172–185. [Google Scholar] [CrossRef]
- Amitai, E.; Unkrich, C.; Goodrich, D.; Habib, E.; Thill, B. Assessing Satellite-Based Rainfall Estimates in Semiarid Watersheds Using the USDA-ARS Walnut Gulch Gauge Network and TRMM PR. J. Hydrometeorol. 2012, 13, 1579–1588. [Google Scholar] [CrossRef]
- As-Syakur, A.; Tanaka, T.; Prasetia, R.; Swardika, I.; Kasa, I. Comparison of TRMM multisatellite precipitation analysis (TMPA) products and daily-monthly gauge data over Bali. Int. J. Remote Sens. 2011, 32, 8969–8982. [Google Scholar] [CrossRef]
- Nogueira, S.; Moreira, M.; Volpato, M. Evaluating Precipitation Estimates from Eta, TRMM and CHRIPS Data in the South-Southeast Region of Minas Gerais State—Brazil. Remote Sens. 2018, 10, 313. [Google Scholar] [CrossRef]
- dos Reis, J.; Rennó, C.; Lopes, E. Validation of Satellite Rainfall Products over a Mountainous Watershed in a Humid Subtropical Climate Region of Brazil. Remote Sens. 2017, 9, 1240. [Google Scholar] [CrossRef]
- Weiberlen, F.; Benítez, J. Assessment of satellite-based precipitation estimates over Paraguay. Acta Geophys. 2018, 66, 369–379. [Google Scholar] [CrossRef]
- Tan, M.; Chua, V.; Tan, K.; Brindha, K. Evaluation of TMPA 3B43 and NCEP-CFSR precipitation products in drought monitoring over Singapore. Int. J. Remote Sens. 2018, 39, 2089–2104. [Google Scholar] [CrossRef]
- Petersen, W.; Rutledge, S. Regional Variability in Tropical Convection: Observations from TRMM. J. Clim. 2001, 14, 3566–3586. [Google Scholar] [CrossRef] [Green Version]
- Toracinta, E.; Cecil, D.; Zipser, E.; Nesbitt, S. Radar, Passive Microwave, and Lightning Characteristics of Precipitating Systems in the Tropics. Mon. Weather Rev. 2002, 130, 802–824. [Google Scholar] [CrossRef] [Green Version]
- Cecil, J.; Zipser, E.; Nesbitt, S. Reflectivity, Ice Scattering, and Lightning Characteristics of Hurricane Eyewalls and Rainbands. Part I: Quantitative Description. Mon. Weather Rev. 2002, 130, 769–784. [Google Scholar] [CrossRef] [Green Version]
- Cecil, J.; Zipser, E. Reflectivity, Ice Scattering, and Lightning Characteristics of Hurricane Eyewalls and Rainbands. Part II: Intercomparison of Observations. Mon. Weather Rev. 2002, 130, 785–801. [Google Scholar] [CrossRef]
- Peterson, M.; Liu, C. Global statistics of lightning in anvil and stratiform regions over tropics and subtropics observed by TRMM. J. Geophys. Res. Atmos. 2011, 116, 23201. [Google Scholar] [CrossRef]
- Liu, C.; Cecil, D.; Zipser, E.J. Relationships between lightning flash rates and radar reflectivity vertical structures in thunderstorms over the tropics and subtropics. J. Geophys. Res. Atmos. 2012, 117, 6212. [Google Scholar] [CrossRef]
- Williams, E.; Chan, T.; Boccippio, D. Islands as miniature continents: Another look at the land-ocean lightning contrast. J. Geophys. Res. Atmos. 2004, 109, D16206. [Google Scholar] [CrossRef]
- Shi, Z.; Tan, Y.; Tang, H.; Sun, J.; Yang, Y.; Peng, L.; Guo, X. Aerosol effect on the land-ocean contrast in thunderstorm electrification and lightning frequency. Atmos. Res. 2015, 164, 131–141. [Google Scholar] [CrossRef]
- Xiong, Y.; Qie, X.; Zhou, Y.; Yuan, T.; Zhang, T. Regional Responses of Lightning Activities to Relative Humidity of the Surface. Chinese J. Geophys. 2006, 49, 311–318. [Google Scholar] [CrossRef]
- Kodama, Y.; Okabe, H.; Tomisaka, Y.; Kotono, K.; Kondo, Y.; Kasuya, H. Lightning Frequency and Microphysical Properties of Precipitating Clouds over the Western North Pacific during Winter as Derived from TRMM Multisensor Observations. Mon. Weather Rev. 2007, 135, 2226–2241. [Google Scholar] [CrossRef]
- Wang, N.; Gopalan, K.; Albrecht, R. Application of lightning to passive microwave convective and stratiform partitioning in passive microwave rainfall retrieval algorithm over land from TRMM. J. Geophys. Res. Atmos. 2012, 117, 23203. [Google Scholar] [CrossRef]
- Zhang, Y.; Wang, Z.; Xiao, W. Analysis of convective precipitation and lightning in Nanjing district by TRMM satellite. Sci. Meteorol. Sin. 2010, 30, 468–474. [Google Scholar]
- Tadesse, A.; Anagnostou, E. African convective system characteristics determined through tracking analysis. Atmos. Res. 2010, 98, 468–477. [Google Scholar] [CrossRef]
- Tao, W.; Lang, S.; Simpson, J.; Adler, R. Retrieval algorithms for estimating the vertical profiles of latent heat release: Their applications for TRMM. J. Meteorol. Soc. Jpn. 1993, 71, 685–700. [Google Scholar] [CrossRef]
- Tao, W.; Lang, S.; Zeng, X.; Shige, S.; Takayabu, Y. Relating convective and stratiform rain to latent heating. J. Clim. 2010, 23, 1874–1893. [Google Scholar] [CrossRef]
- Shige, S.; Takayabu, Y.; Tao, W.; Johnson, D. Spectral retrieval of latent heating profiles from TRMM PR data. Part I: Development of a model-based algorithm. J. Appl. Meteorol. 2004, 43, 1095–1113. [Google Scholar] [CrossRef]
- Shige, S.; Takayabu, Y.; Kida, S.; Tao, W.; Zeng, X.; Yokoyama, C.; L’Ecuyer, T. Spectral retrieval of latent heating profiles from TRMM PR data. Part IV: Comparisons of lookup tables from two- and three-dimensional cloud-resolving model simulations. J. Clim. 2009, 22, 5577–5594. [Google Scholar] [CrossRef]
- Grecu, M.; Olson, W. Bayesian estimation of precipitation from satellite passive microwave observations using combined radar–radiometer retrievals. J. Appl. Meteorol. Clim. 2006, 45, 416–433. [Google Scholar] [CrossRef]
- Grecu, M.; Olson, W.; Shie, C.; L’Ecuyer, T.; Tao, W. Combining satellite microwave radiometer and radar observations to estimate atmospheric latent heating profiles. J. Clim. 2009, 22, 6356–6376. [Google Scholar] [CrossRef]
- Kodama, Y.; Katsumata, M.; Mori, S.; Satoh, S.; Hirose, Y.; Ueda, H. Climatology of warm rain and associated latent heating derived from TRMM PR observations. J. Clim. 2009, 22, 4908–4929. [Google Scholar] [CrossRef]
- Hagos, S.; Zhang, C.; TAO, W.-K.; Lang, S.; Takayabu, Y.N.; Shige, S.; Katsumata, M.; Olson, B.; L’Ecuyer, T. Estimates of Tropical Diabatic Heating Profiles Commonalities and Uncertainties. J. Clim. 2010, 23, 542–558. [Google Scholar] [CrossRef]
- Liu, C.; Shige, S.; Takayabu, T.; Zipser, E.J. Latent heating contribution from precipitation systems with different sizes, depths, and intensities in tropics, large scale circulations in reanalysis datasets. J. Clim. 2015, 28, 186–203. [Google Scholar] [CrossRef]
- Tao, W.; Lang, S.; Olson, W.; Meneghini, R.; Yang, S.; Simpson, J.; Kummerow, C.; Smith, E.; Halverson, J. Retrieved Vertical Profiles of Latent Heat Release Using TRMM Rainfall Products for February 1988. J. Appl. Meteorol. 2001, 40, 957–982. [Google Scholar] [CrossRef]
- Magagi, R.; Barros, A. Estimation of Latent Heating of Rainfall during the Onset of the Indian Monsoon Using TRMM PR and Radiosonde Data. J. Appl. Meteorol. 2004, 43, 328–349. [Google Scholar] [CrossRef]
- Schumacher, C.; Houze, R., Jr.; Kraucunas, I. The Tropical Dynamical Response to Latent Heating Estimates Derived from the TRMM Precipitation Radar. J. Atmos. Sci. 2004, 61, 1341–1358. [Google Scholar] [CrossRef]
- Li, W.; Wang, D.; Lei, T.; Wang, H. Convective and stratiform rainfall and heating associated with the summer monsoon over the South China Sea based on TRMM data. Theor. Appl. Clim. 2009, 95, 157–163. [Google Scholar] [CrossRef]
- Wang, L.; Huang, K. Imprint of the ENSO on rainfall and latent heating variability over the Southern South China Sea from TRMM observations. J. Ocean Univ. China 2016, 15, 219–231. [Google Scholar] [CrossRef] [Green Version]
- Zuluaga, M.; Hoyos, C.; Webster, P. Spatial and Temporal Distribution of Latent Heating in the South Asian Monsoon Region. J. Clim. 2010, 23, 2010–2029. [Google Scholar] [CrossRef]
- Morita, J.; Takayabu, Y.; Shige, S.; Kodamac, Y. Analysis of rainfall characteristics of the Madden-Julian oscillation using TRMM satellite data. Dyn. Atmos. Oceans 2006, 42, 107–126. [Google Scholar] [CrossRef]
- Zhang, C.; Ling, J.; Hagos, S.; Tao, W.; Lang, S.; Takayabu, Y.N.; Shige, S.; Katsumata, M.; Olson, W.; L’Ecuyer, T. MJO Signals in Latent Heating: Results from TRMM Retrievals. J. Atmos. Sci. 2010, 67, 3488–3508. [Google Scholar] [CrossRef] [Green Version]
- Ling, J.; Zhang, C. Structural Evolution in Heating Profiles of the MJO in Global Reanalyses and TRMM Retrievals. J. Clim. 2011, 24, 825–842. [Google Scholar] [CrossRef]
- Barnes, H.; Zuluaga, M.; Houze, R. Latent heating characteristics of the MJO computed from TRMM Observations. J. Geophys. Res. Atmos. 2015, 120, 1322–1334. [Google Scholar] [CrossRef] [Green Version]
- Fu, Y.; Zhang, A.; Liu, Y.; Zheng, Y.; Hu, Y.; Feng, S.; Cao, A. Characteristics of seasonal scale convective and stratiform precipitation in Asia based on measurements by TRMM Precipitation Radar. Acta Meteorol. Sin. 2008, 66, 730–746. [Google Scholar]
- Fu, Y.; Cao, A.; Li, T.; Feng, S.; Zheng, Y.; Liu, Y.; Zhang, A. Climatic characteristics of the storm top altitude for the convective and stratiform precipitation in summer Asia based on measurements of the TRMM precipitation on radar. Acta Meteorol. Sin. 2012, 70, 436–451. [Google Scholar]
- Saikranthi, K.; Rao, T.; Radhakrishna, B.; Rao, S. Morphology of the vertical structure of precipitation over India and adjoining oceans based on long-term measurements of TRMM PR. J. Geophys. Res. Atmos. 2014, 119, 8433–8449. [Google Scholar] [CrossRef] [Green Version]
- Fuentes, J.; Geerts, B.; Dejene, T.; D’Odorico, P.; Joseph, E. Vertical attributes of precipitation systems in West Africa and adjacent Atlantic Ocean. Theor. Appl. Clim. 2008, 92, 181–193. [Google Scholar] [CrossRef]
- Liu, C.; Zipser, E.; Cecil, D.; Nesbitt, S.; Sherwood, S. A Cloud and Precipitation Feature Data base from Nine Years of TRMM Observations. J. Appl. Meteorol. Clim. 2008, 47, 2712–2728. [Google Scholar] [CrossRef]
- Guy, N.; Rutledge, S. Regional comparison of West African convective characteristics: A TRMM-based climatology. Quarterly J. R. Meteorol. Soc. 2012, 138, 1179–1195. [Google Scholar] [CrossRef]
- Kumar, S. Three dimensional characteristics of precipitating cloud systems observed during Indian summer monsoon. Adv. Space Res. 2016, 48, 1017–1032. [Google Scholar] [CrossRef]
- Xu, W.; Zipser, E. Properties of deep convection in tropical continental, monsoon, and oceanic rainfall regimes. Geophys. Res. Lett. 2012, 39, L07802. [Google Scholar] [CrossRef]
- Hu, L.; Li, Y.; Deng, D. An Investigation into the Relationship between Surface Rain Rate and Rain Depth over Southeast Asia. Adv. Atmos. Sci. 2013, 30, 142–152. [Google Scholar] [CrossRef]
- Berg, W.; Kummerow, C.; Morales, C. Differences between East and West Pacific Rainfall Systems. J. Clim. 2002, 15, 3659–3672. [Google Scholar] [CrossRef]
- Geerts, B.; Dejene, T. Regional and Diurnal Variability of the Vertical Structure of Precipitation Systems in Africa Based on Spaceborne Radar Data. J. Clim. 2005, 18, 893–916. [Google Scholar] [CrossRef]
- Short, D.; Nakamura, K. TRMM Radar Observations of Shallow Precipitation over the Tropical Oceans. J. Clim. 2000, 13, 4107–4124. [Google Scholar] [CrossRef]
- Cao, Q.; Qi, Y. The variability of vertical structure of precipitation in Huaihe River Basin of China: Implications from long-term spaceborne observations with TRMM precipitation radar. Water Resour. Res. 2014, 50, 3690–3705. [Google Scholar] [CrossRef] [Green Version]
- Hamada, A.; Takayabu, T.N.; Liu, C.; Zipser, E.J. Weak linkage between the heaviest rainfall and tallest storms. Nat. Commun. 2015, 6, 6213. [Google Scholar] [CrossRef] [PubMed] [Green Version]
- Cao, Q.; Hong, Y.; Gourley, J.; Qi, Y.; Zhang, J.; Wen, Y.; Kirstetter, P. Statistical and Physical Analysis of the Vertical Structure of Precipitation in the Mountainous West Region of the United States Using 11+ Years of Spaceborne Observations from TRMM Precipitation Radar. J. Appl. Meteorol. Clim. 2013, 52, 408–424. [Google Scholar] [CrossRef]
- Nesbitt, S.; Zipser, E. The Diurnal Cycle of Rainfall and Convective Intensity according to Three Years of TRMM Measurements. J. Clim. 2003, 16, 1456–1475. [Google Scholar] [CrossRef] [Green Version]
- Mori, S.; Jun-Ichi, H.; Tauhid, Y.; Yamanaka, M. Diurnal Land-Sea Rainfall Peak Migration over Sumatera Island, Indonesian Maritime Continent, Observed by TRMM Satellite and Intensive Rawinsonde Soundings. Mon. Weather Rev. 2004, 132, 2012–2039. [Google Scholar] [CrossRef]
- Bowman, K.; Collier, J.; North, G.; Wu, Q.; Ha, E. Diurnal cycle of tropical precipitation in Tropical Rainfall Measuring Mission (TRMM) satellite and ocean buoy rain gauge data. J. Geophys. Res. 2005, 110, D21104. [Google Scholar] [CrossRef]
- Sanderson, V.; Kidd, C.; McGregor, G. A Comparison of TRMM Microwave Techniques for Detecting the Diurnal Rainfall Cycle. J. Hydrometeorol. 2006, 7, 687–703. [Google Scholar] [CrossRef]
- Yang, S.; Smith, E. Mechanisms for Diurnal Variability of Global Tropical Rainfall Observed from TRMM. J. Clim. 2006, 19, 5190–5226. [Google Scholar] [CrossRef] [Green Version]
- Yang, S.; Smith, E. Convective-Stratiform Precipitation Variability at Seasonal Scale from 8 Yr of TRMM Observations Implications for Multiple Modes of Diurnal Variability. J. Clim. 2008, 21, 4087–4114. [Google Scholar] [CrossRef]
- Kikuchi, K.; Wang, B. Diurnal Precipitation Regimes in the Global Tropics. J. Clim. 2008, 21, 2680–2696. [Google Scholar] [CrossRef]
- Liu, C.; Zipser, E. Diurnal cycles of precipitation, clouds, and lightning in the tropics from 9 years of TRMM observations. Geophys. Res. Lett. 2008, 35, 125–141. [Google Scholar] [CrossRef]
- Hu, L.; Yang, S.; Li, Y.; Gao, S. Diurnal Variability of Precipitation Depth Over the Tibetan Plateau and Its Surrounding Regions. Adv. Atmos. Sci. 2010, 27, 115–122. [Google Scholar] [CrossRef]
- Wu, X.; Qie, X.; Yuan, T. Regional distribution and diurnal variation of deep convective systems over the Asian monsoon region. Sci. China 2013, 56, 843–854. [Google Scholar] [CrossRef]
- Rientjesa, T.; Haileb, A.; Fentac, A. Diurnal rainfall variability over the Upper Blue Nile Basin: A Remote Sensing based approach. Int. J. Appl. Earth Obs. Geoinform. 2013, 21, 311–325. [Google Scholar] [CrossRef]
- Liu, P.; Fu, Y. Climatic characteristics of summer convective and stratiform precipitation in southern China based on measurements by TRMM precipitation radar. Chinese J. Atmos. Sci. 2010, 34, 802–814. [Google Scholar]
- Ichikawa, H.; Yasunari, T. Time–space characteristics of diurnal rainfall over Borneo and surrounding oceans as observed by TRMM-PR. J. Clim. 2006, 19, 1238–1260. [Google Scholar] [CrossRef]
- Hall, T.; Vonder Haar, T. The Diurnal Cycle of West Pacific Deep Convection and Its Relation to the Spatial and Temporal Variation of Tropical MCSs. J. Atmos. Sci. 1999, 56, 3401–3415. [Google Scholar] [CrossRef]
- Pokhrel, S.; Sikka, D. Variability of the TRMM-PR total and convective and stratiform rain fractions over the Indian region during the summer monsoon. Clim. Dyn. 2013, 41, 21–44. [Google Scholar] [CrossRef]
- Hu, L.; Li, Y.; Yang, S.; Deng, D. Seasonal variability in tropical and subtropical convective and stratiform precipitation of the East Asian monsoon. Sci. China Earth Sci. 2011, 41, 1182–1191. [Google Scholar] [CrossRef]
- Li, Y.; Song, M.; Hu, L. A study on the precipitation characteristics over the South China Sea before and after the monsoon onset. J. Trop. Meteorol. 2012, 18. [Google Scholar] [CrossRef]
- Wall, C.; Zipser, E.; Liu, C. A Regional Climatology of Monsoonal Precipitation in the Southwestern United States Using TRMM. J. Hydrometeorol. 2012, 13, 310–323. [Google Scholar] [CrossRef]
- Yokoyama, C.; Takayabu, Y. A Statistical Study on Rain Characteristics of Tropical Cyclones Using TRMM Satellite Data. Mon. Weather Rev. 2008, 136, 3848–3862. [Google Scholar] [CrossRef]
- Fritz, C.; Wang, Z.; Nesbitt, S.W.; Dunkerton, T.J. Vertical structure and contribution of different types of precipitation during Atlantic tropical cyclone formation as revealed by TRMM PR. Geophys. Res. Lett. 2016, 43, 894–901. [Google Scholar] [CrossRef]
- Tao, C.; Jiang, H.; Zawislak, J. The Relative Importance of Stratiform and Convective Rainfall in Rapidly Intensifying Tropical Cyclones. Mon. Weather Rev. 2017, 145, 795–809. [Google Scholar] [CrossRef]
- Yang, Z.; Yuan, T.; Jiang, H.; Zhang, L.; Zhang, C. Stratiform and Convective Precipitation Properties of Tropical Cyclones in the Northwest Pacific. J. Geophys. Res. Atmos. 2018, 123, 3513–3529. [Google Scholar] [CrossRef]
- Liu, C.; Zipser, E. Global distribution of convection penetrating the tropical tropopause. J. Geophys. Res. Atmos. 2005, 110, 3219–3231. [Google Scholar] [CrossRef]
- Houze Jr, R.; Rasmussen, K.; Zuluaga, M.; Brodzik, S. The variable nature of convection in the tropics and subtropics: A legacy of 16 years of the Tropical Rainfall Measuring Mission satellite. Rev. Geophys. 2015, 53, 994–1021. [Google Scholar] [CrossRef]
- Kumar, S. A 10-year climatology of vertical properties of most active convective clouds over the Indian regions using TRMM PR. Theor. Appl. Clim. 2017, 127, 429–440. [Google Scholar] [CrossRef]
- Petersen, W.; Nesbitt, S.; Blakeslee, R.; Cifelli, R.; Hein, P.; Rutledge, S. TRMM Observations of Intraseasonal Variability in Convective Regimes over the Amazon. J. Clim. 2002, 15, 1278–1294. [Google Scholar] [CrossRef] [Green Version]
- Mehta, A.; Yang, S. Precipitation climatology over Mediterranean Basin from ten years of TRMM measurements. Adv. Geosci. 2008, 17, 87–91. [Google Scholar] [CrossRef] [Green Version]
- Nastos, P.; Kapsomenakis, J.; Douvis, K. Analysis of precipitation extremes based on satellite and high-resolution gridded data set over Mediterranean basin. Atmos. Res. 2013, 131, 46–59. [Google Scholar] [CrossRef]
- Heiblum, R.; Koren, I.; Altaratz, O. Analyzing coastal precipitation using TRMM observations. Atmos. Chem. Phys. 2011, 11, 13201–13217. [Google Scholar] [CrossRef] [Green Version]
- Zhou, Y.; Lau, W.; Liu, C. Rain characteristics and large-scale environments of precipitation objects with extreme rain volumes from TRMM observations. J. Geophys. Res. Atmos. 2013, 118, 9673–9689. [Google Scholar] [CrossRef] [Green Version]
- Rapp, A.; Peterson, A.; Frauenfeld, O.; Quiring, S.; Roark, E. Climatology of Storm Characteristics in Costa Rica using the TRMM Precipitation Radar. J. Hydrometeorol. 2014, 15, 2615–2633. [Google Scholar] [CrossRef]
- Yokoyama, C.; Takayabu, Y.; Kanada, S. A Contrast in Precipitation Characteristics across the Baiu Front near Japan. Part I: TRMM PR Observation. J. Clim. 2014, 27, 5872–5890. [Google Scholar] [CrossRef]
- Olurotimi, E.; Sokoya, O.; Ojo, J.; Owolawic, P. Observation of bright-band height data from TRMM-PR for satellite communication in South Africa. J. Atmos. Sol.-Terr. Phys. 2017, 160, 24–33. [Google Scholar] [CrossRef]
- Schumacher, C.; Houze, R., Jr. Stratiform Rain in the Tropics as Seen by the TRMM Precipitation Radar. J. Clim. 2003, 16, 1739–1756. [Google Scholar] [CrossRef]
- Liu, C.; Zipser, E. “Warm rain” in the tropics: Seasonal and regional distribution based on 9 years of TRMM data. J. Clim. 2009, 22, 767–779. [Google Scholar] [CrossRef]
- Nesbitt, S.; Cifelli, R.; Rutledge, S. Storm Morphology and Rainfall Characteristics of TRMM Precipitation Features. Mon. Weather Rev. 2006, 134, 2702–2721. [Google Scholar] [CrossRef]
- Hamada, A.; Murayama, Y.; Takayabu, Y.N. Regional Characteristics of Extreme Rainfall Extracted from TRMM PR Measurements. J. Clim. 2014, 27, 8151–8169. [Google Scholar] [CrossRef]
- Hirose, M.; Takayabu, Y.N.; Hamada, A.; Shige, S.; Yamamoto, M.K. Spatial contrast of geographically induced rainfall observed by TRMM PR. J. Clim. 2017, 30, 4165–4184. [Google Scholar] [CrossRef]
- Choudhury, H.; Roy, P.; Kalita, S.; Sharma, S. Spatio-temporal variability of the properties of mesoscale convective systems over a complex terrain as observed by TRMM sensors. Int. J. Clim. 2016, 36, 2615–2632. [Google Scholar] [CrossRef]
- Fu, Y.; Liu, G. Possible Misidentification of Rain Type by TRMM PR over Tibetan Plateau. J. Appl. Meteorol. Clim. 2007, 46, 667–672. [Google Scholar] [CrossRef]
- Kim, K.; Park, J.; Baik, J.; Choi, M. Evaluation of topographical and seasonal feature using GPM IMERG and TRMM 3B42 over Far-East Asia. Atmos. Res. 2017, 187, 95–105. [Google Scholar] [CrossRef]
- Le, M.; Chandrasekar, V. Precipitation type classification method for dual-frequency precipitation radar (DPR) onboard the GPM. IEEE Trans. Geosci. Remote Sens. 2013, 51, 1784–1790. [Google Scholar] [CrossRef]
- Battaglia, A.; Tanelli, S.; Mroz, K.; Tridon, F. Multiple scattering in observations of the GPM dual-frequency precipitation radar: Evidence and impact on retrievals. J. Geophys. Res. Atmos. 2015, 120, 4090–4101. [Google Scholar] [CrossRef] [PubMed] [Green Version]
- Awaka, J.; Le, M.; Chandrasekar, V.; Yoshida, N.; Higashiuwatoko, T.; Kubota, T.; Iguchi, T. Rain Type Classification Algorithm Module for GPM Dual-Frequency Precipitation Radar. J. Atmos. Ocean. Technol. 2016, 33, 1887–1898. [Google Scholar] [CrossRef]
- Gao, J.; Tang, G.; Hong, Y. Similarities and Improvements of GPM Dual-Frequency Precipitation Radar (DPR) upon TRMM Precipitation Radar (PR) in Global Precipitation Rate Estimation, Type Classification and Vertical Profiling. Remote Sens. 2017, 9, 1142. [Google Scholar] [CrossRef]
- Iida, Y.; Kubota, T.; Iguchi, T.; Oki, R. Evaluating sampling error in TRMM/PR rainfall products by the bootstrap method: Estimation of the sampling error and its application to a trend analysis. J. Geophys. Res. Atmos. 2010, 115, 1842–1851. [Google Scholar] [CrossRef]
- Kozu, T.; Iguchi, T.; Meneghini, R.; Awaka, J.; Okamoto, K. Preliminary test results of a rain rate profiling algorithm for the TRMM precipitation radar. Proc. SPIE 1998, 3503, 86–93. [Google Scholar]
- Tapiador, F.J.; Turk, F.J.; Petersen, W.; Hou, A.Y.; García-Ortega, E.; Machado, L.A.T.; Angelis, C.F.; Salio, P.; Kidd, C.; Huffman, G.J.; et al. Global precipitation measurement: Methods, datasets and applications. Atmos. Res. 2012, 104, 70–97. [Google Scholar] [CrossRef]
- Hou, A.Y.; Kakar, R.K.; Neeck, S.; Azarbarzin, A.A.; Kummerow, C.D.; Kojima, M.; Oki, R.; Nakamura, K.; Iguchi, T. The Global Precipitation Measurement Mission. Bull. Am. Meteorol. Soc. 2014, 95, 701–722. [Google Scholar] [CrossRef] [Green Version]
- Yong, B.; Liu, D.; Gourley, J.; Tian, Y.; Huffman, G.; Ren, L.; Hong, Y. Global View of Real-Time Trmm Multisatellite Precipitation Analysis: Implications for Its Successor Global Precipitation Measurement Mission. Bull. Am. Meteorol. Soc. 2015, 96, 283–296. [Google Scholar] [CrossRef]
- Available online: https://pmm.nasa.gov/GPM (accessed on 1 January 2019).
- Stocker, E.; Alquaied, F.; Bilanow, S.; Ji, Y.; Jones, L. TRMM Version 8 Reprocessing Improvements and Incorporation into the GPM Data Suite. J. Atmos. Ocean. Technol. 2018, 35, 1181–1199. [Google Scholar] [CrossRef]
Figure 1.
A schematic diagram of the detection of TRMM (Tropical Rainfall Measuring Mission) including PR (Precipitation Radar) [1].
Figure 1.
A schematic diagram of the detection of TRMM (Tropical Rainfall Measuring Mission) including PR (Precipitation Radar) [1].

Figure 2.
A conceptual scheme of the article.

Figure 3.
Scatterplots of radar reflectivity factors (top) and their probability density functions (bottom) at a height of 1.5 km derived from 210 TRMM overpasses over Melbourne for the period 1998-2007. "PRm" and "PR" refer to the PR-measured, and PR-corrected reflectivities, respectively. ([27] © American Meteorological Society. Used with permission.).

Figure 4.
Lightning flash densities observed by TRMM for December-February of 1998–2000 and June–August of 1998–1999. TRMM-PR analysis boxes are indicated. ([73] © American Meteorological Society. Used with permission.).
Figure 4.
Lightning flash densities observed by TRMM for December-February of 1998–2000 and June–August of 1998–1999. TRMM-PR analysis boxes are indicated. ([73] © American Meteorological Society. Used with permission.).

Figure 5.
Retrieved distribution of the mean unconditional LH at (a) 7–8 km; (b) 4–5 km; and (c) 2–3 km levels during 1998–2011. ([94] © American Meteorological Society. Used with permission.)
Figure 5.
Retrieved distribution of the mean unconditional LH at (a) 7–8 km; (b) 4–5 km; and (c) 2–3 km levels during 1998–2011. ([94] © American Meteorological Society. Used with permission.)

Figure 6.
Cumulative frequency of rainfall fraction categorized by (a) storm size; (b) echo top; (c) intense echo top; and (d) lightning. Red curves represent continental regimes (Congo (CONG), West Africa (WAFR), Argentina (ARGE), and Southeast US (SEUS)), green curves represent monsoon regimes (East Asian Summer Monsoon (EASM), Indian Summer Monsoon (ISM), Australia Summer Monsoon (ASM), and South American Summer Monsoon (SASM)), and blue curves represent oceanic regimes (Western Pacific warm pool (WPAC), Indian Ocean (INOC), GATE ocean (GATE), and East Pacific (EPAC)). Filled squares or circles represent a set of active and break monsoon periods [112].

Figure 7.
The unitless ratio of daytime to nighttime monthly rainfall given by PR algorithm 2A25. ([124] © American Meteorological Society. Used with permission.)
Figure 7.
The unitless ratio of daytime to nighttime monthly rainfall given by PR algorithm 2A25. ([124] © American Meteorological Society. Used with permission.)

Figure 8.
Location of identified overshooting precipitation features (PFs) at 20°N–20°S. The blue indicates overshooting distance greater than 2 km, and red indicates those greater than 3 km [142].
Figure 8.
Location of identified overshooting precipitation features (PFs) at 20°N–20°S. The blue indicates overshooting distance greater than 2 km, and red indicates those greater than 3 km [142].
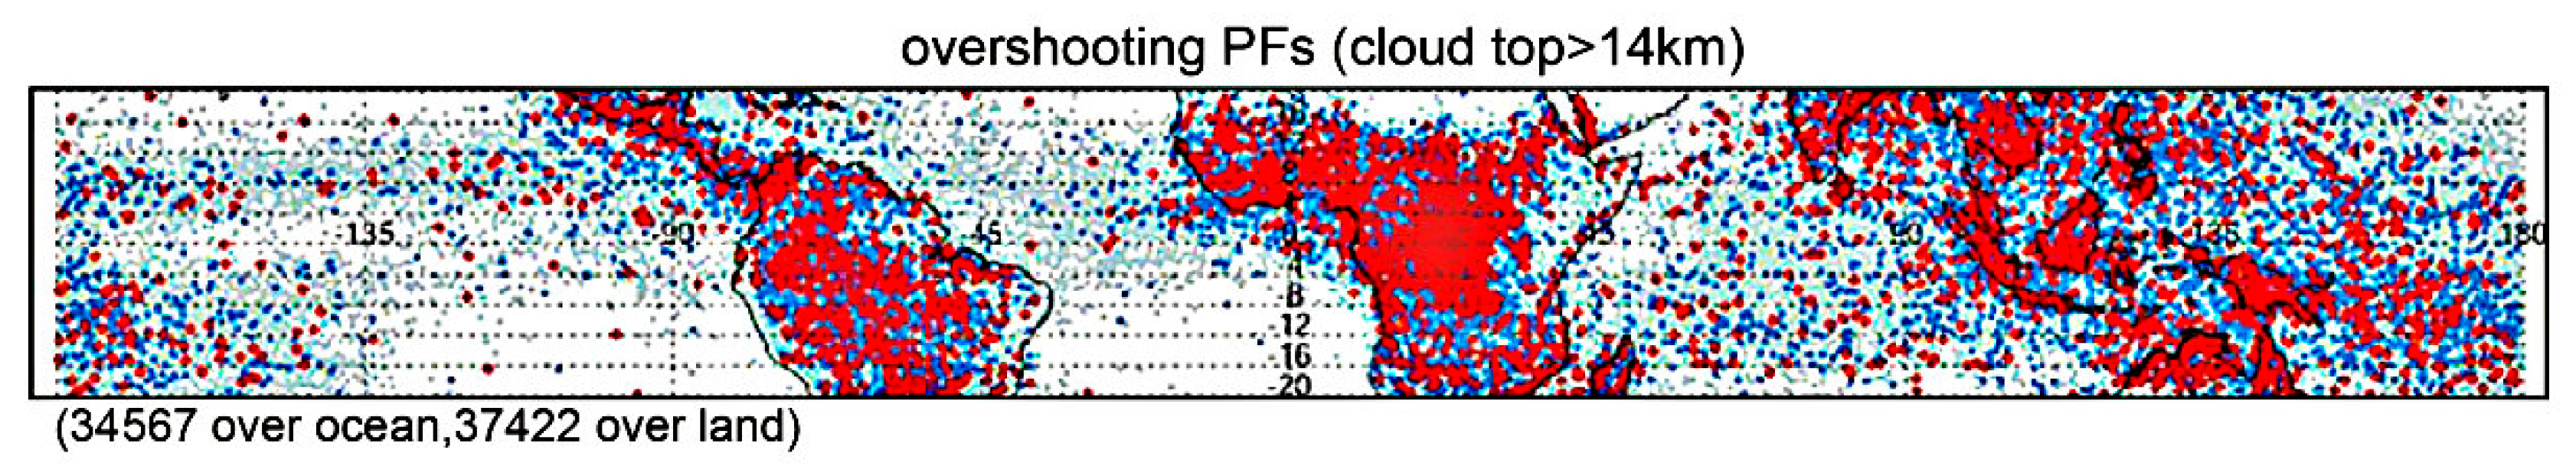
Figure 9.
A schematic diagram of the detection of GPM including DPR [170].
Figure 9.
A schematic diagram of the detection of GPM including DPR [170].


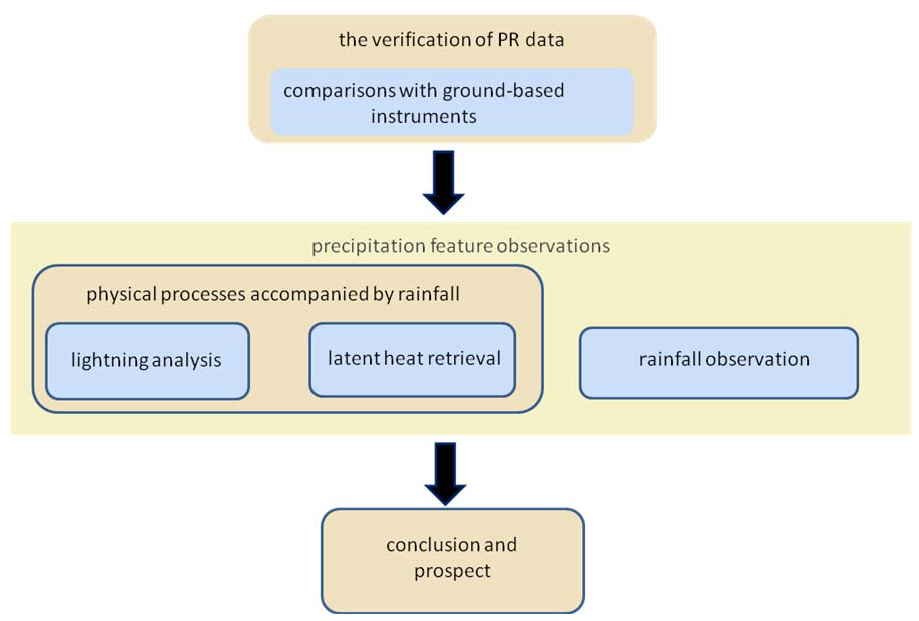
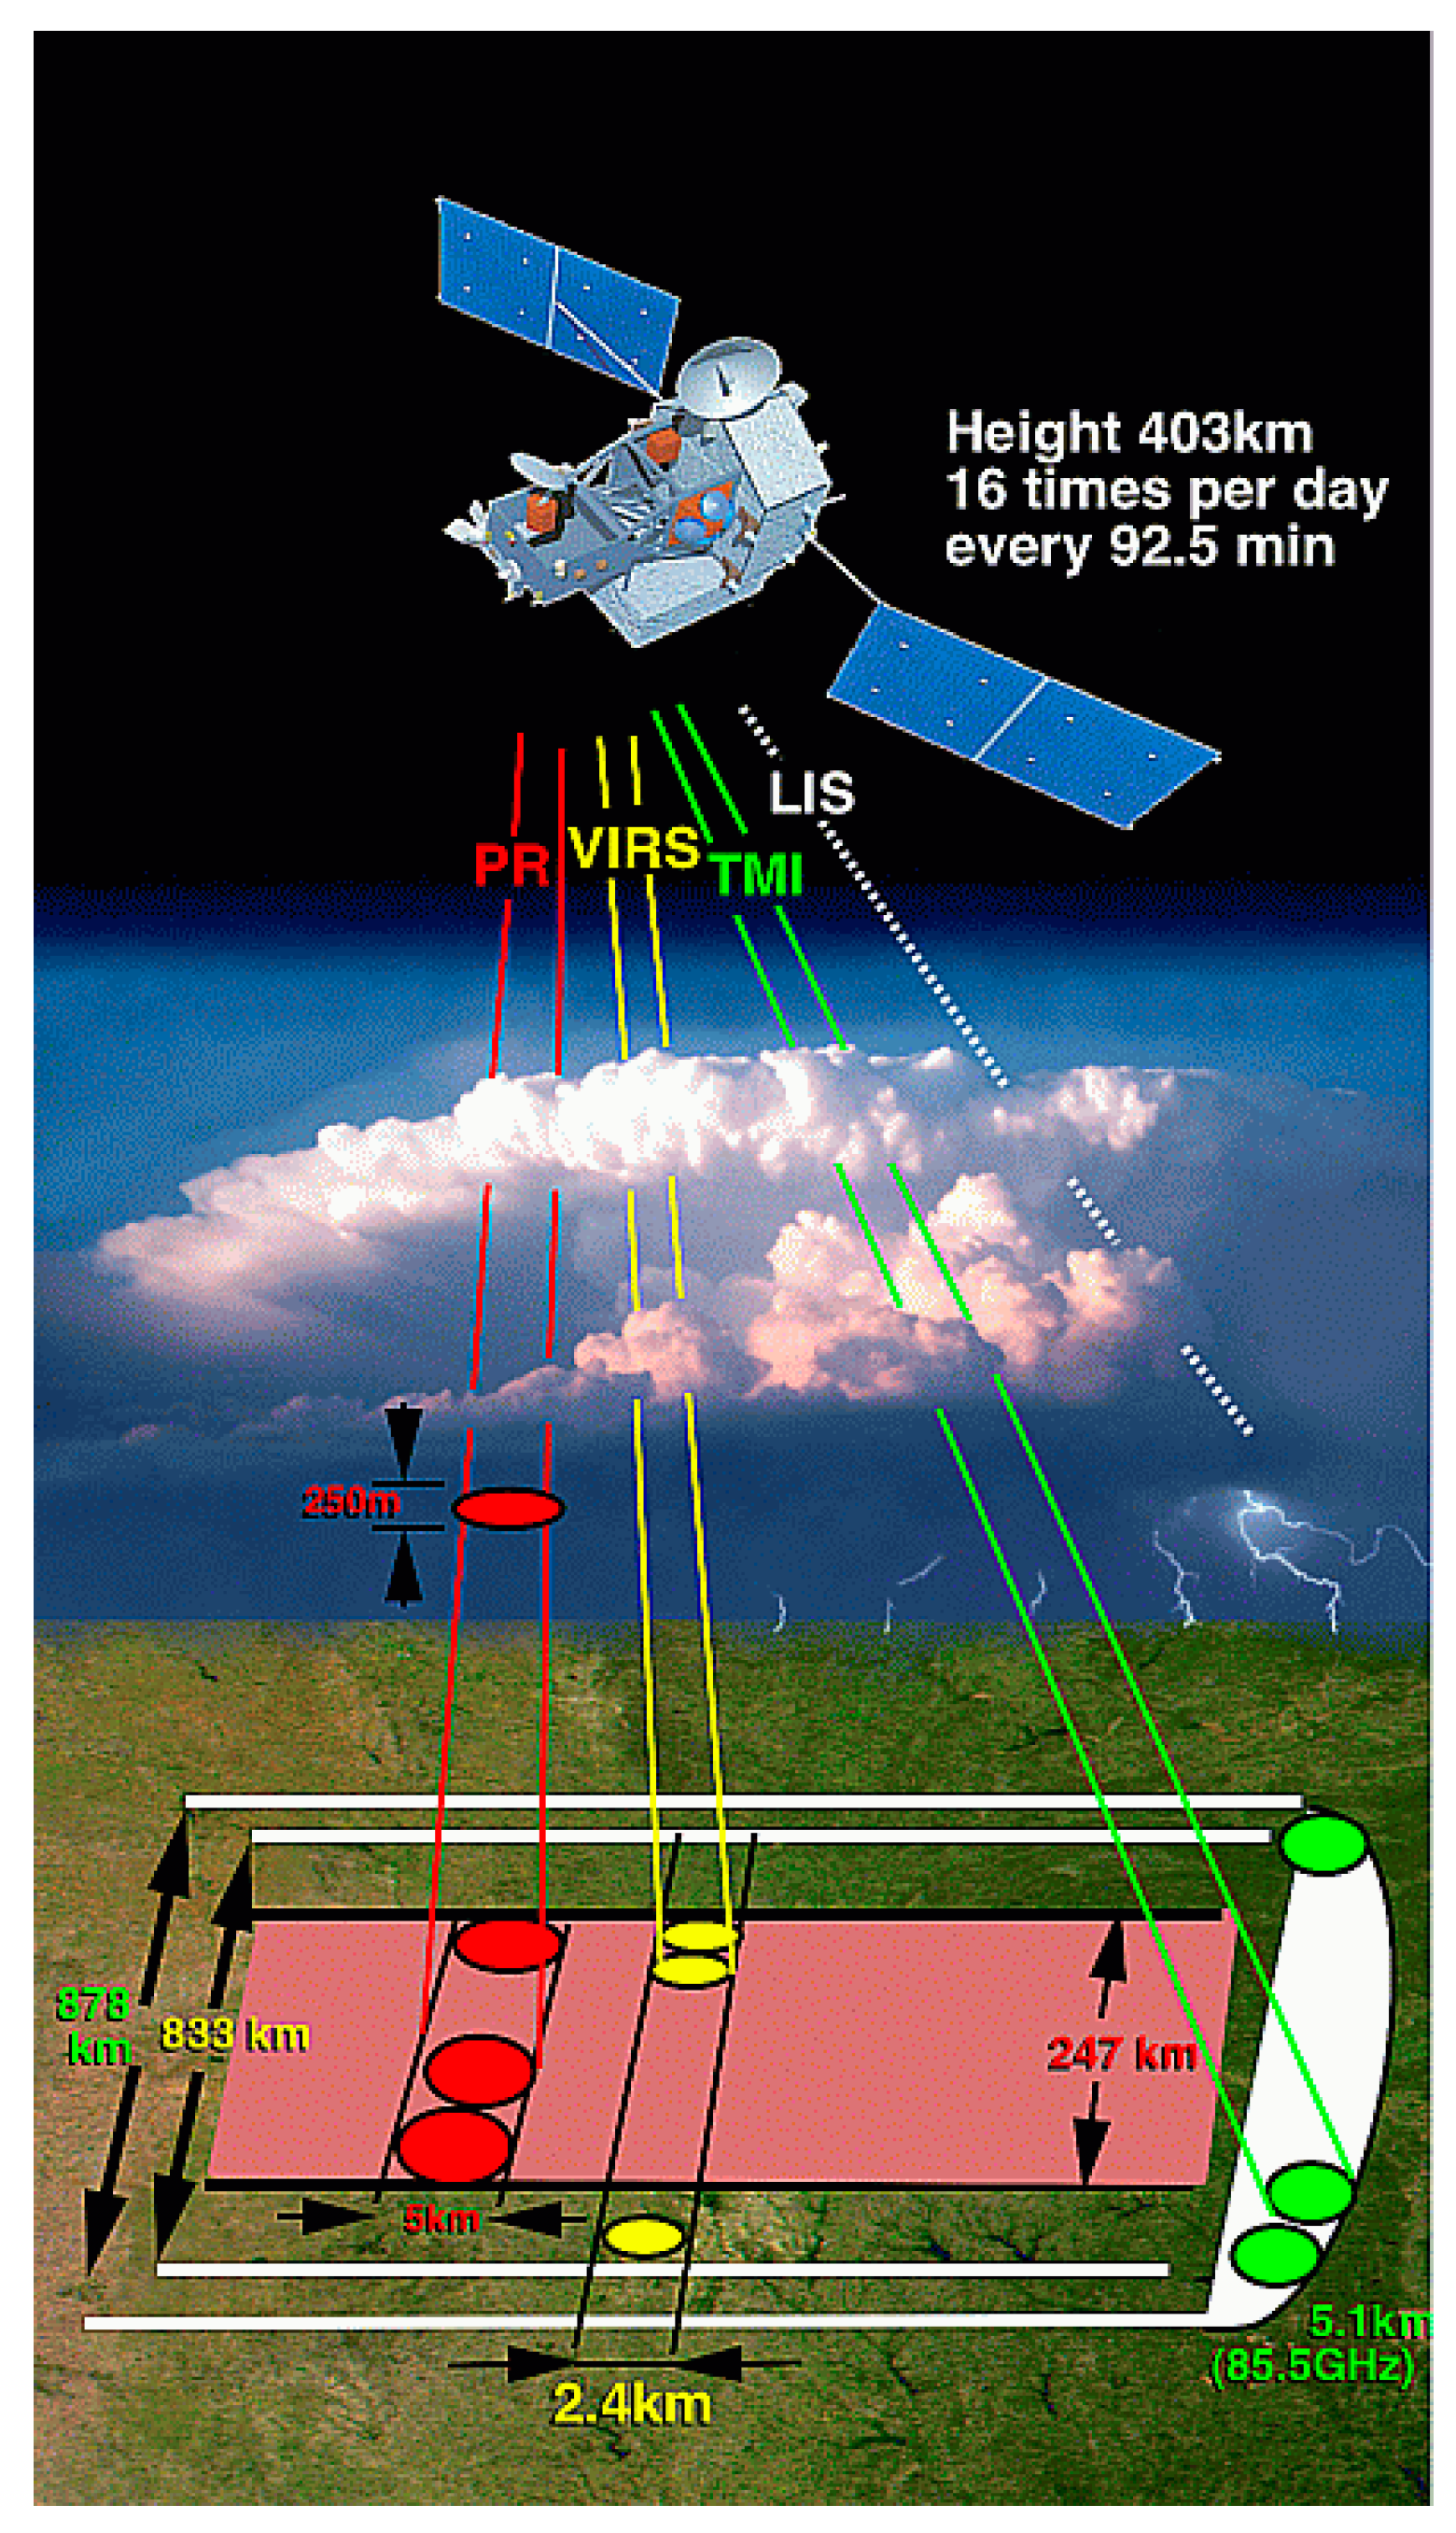
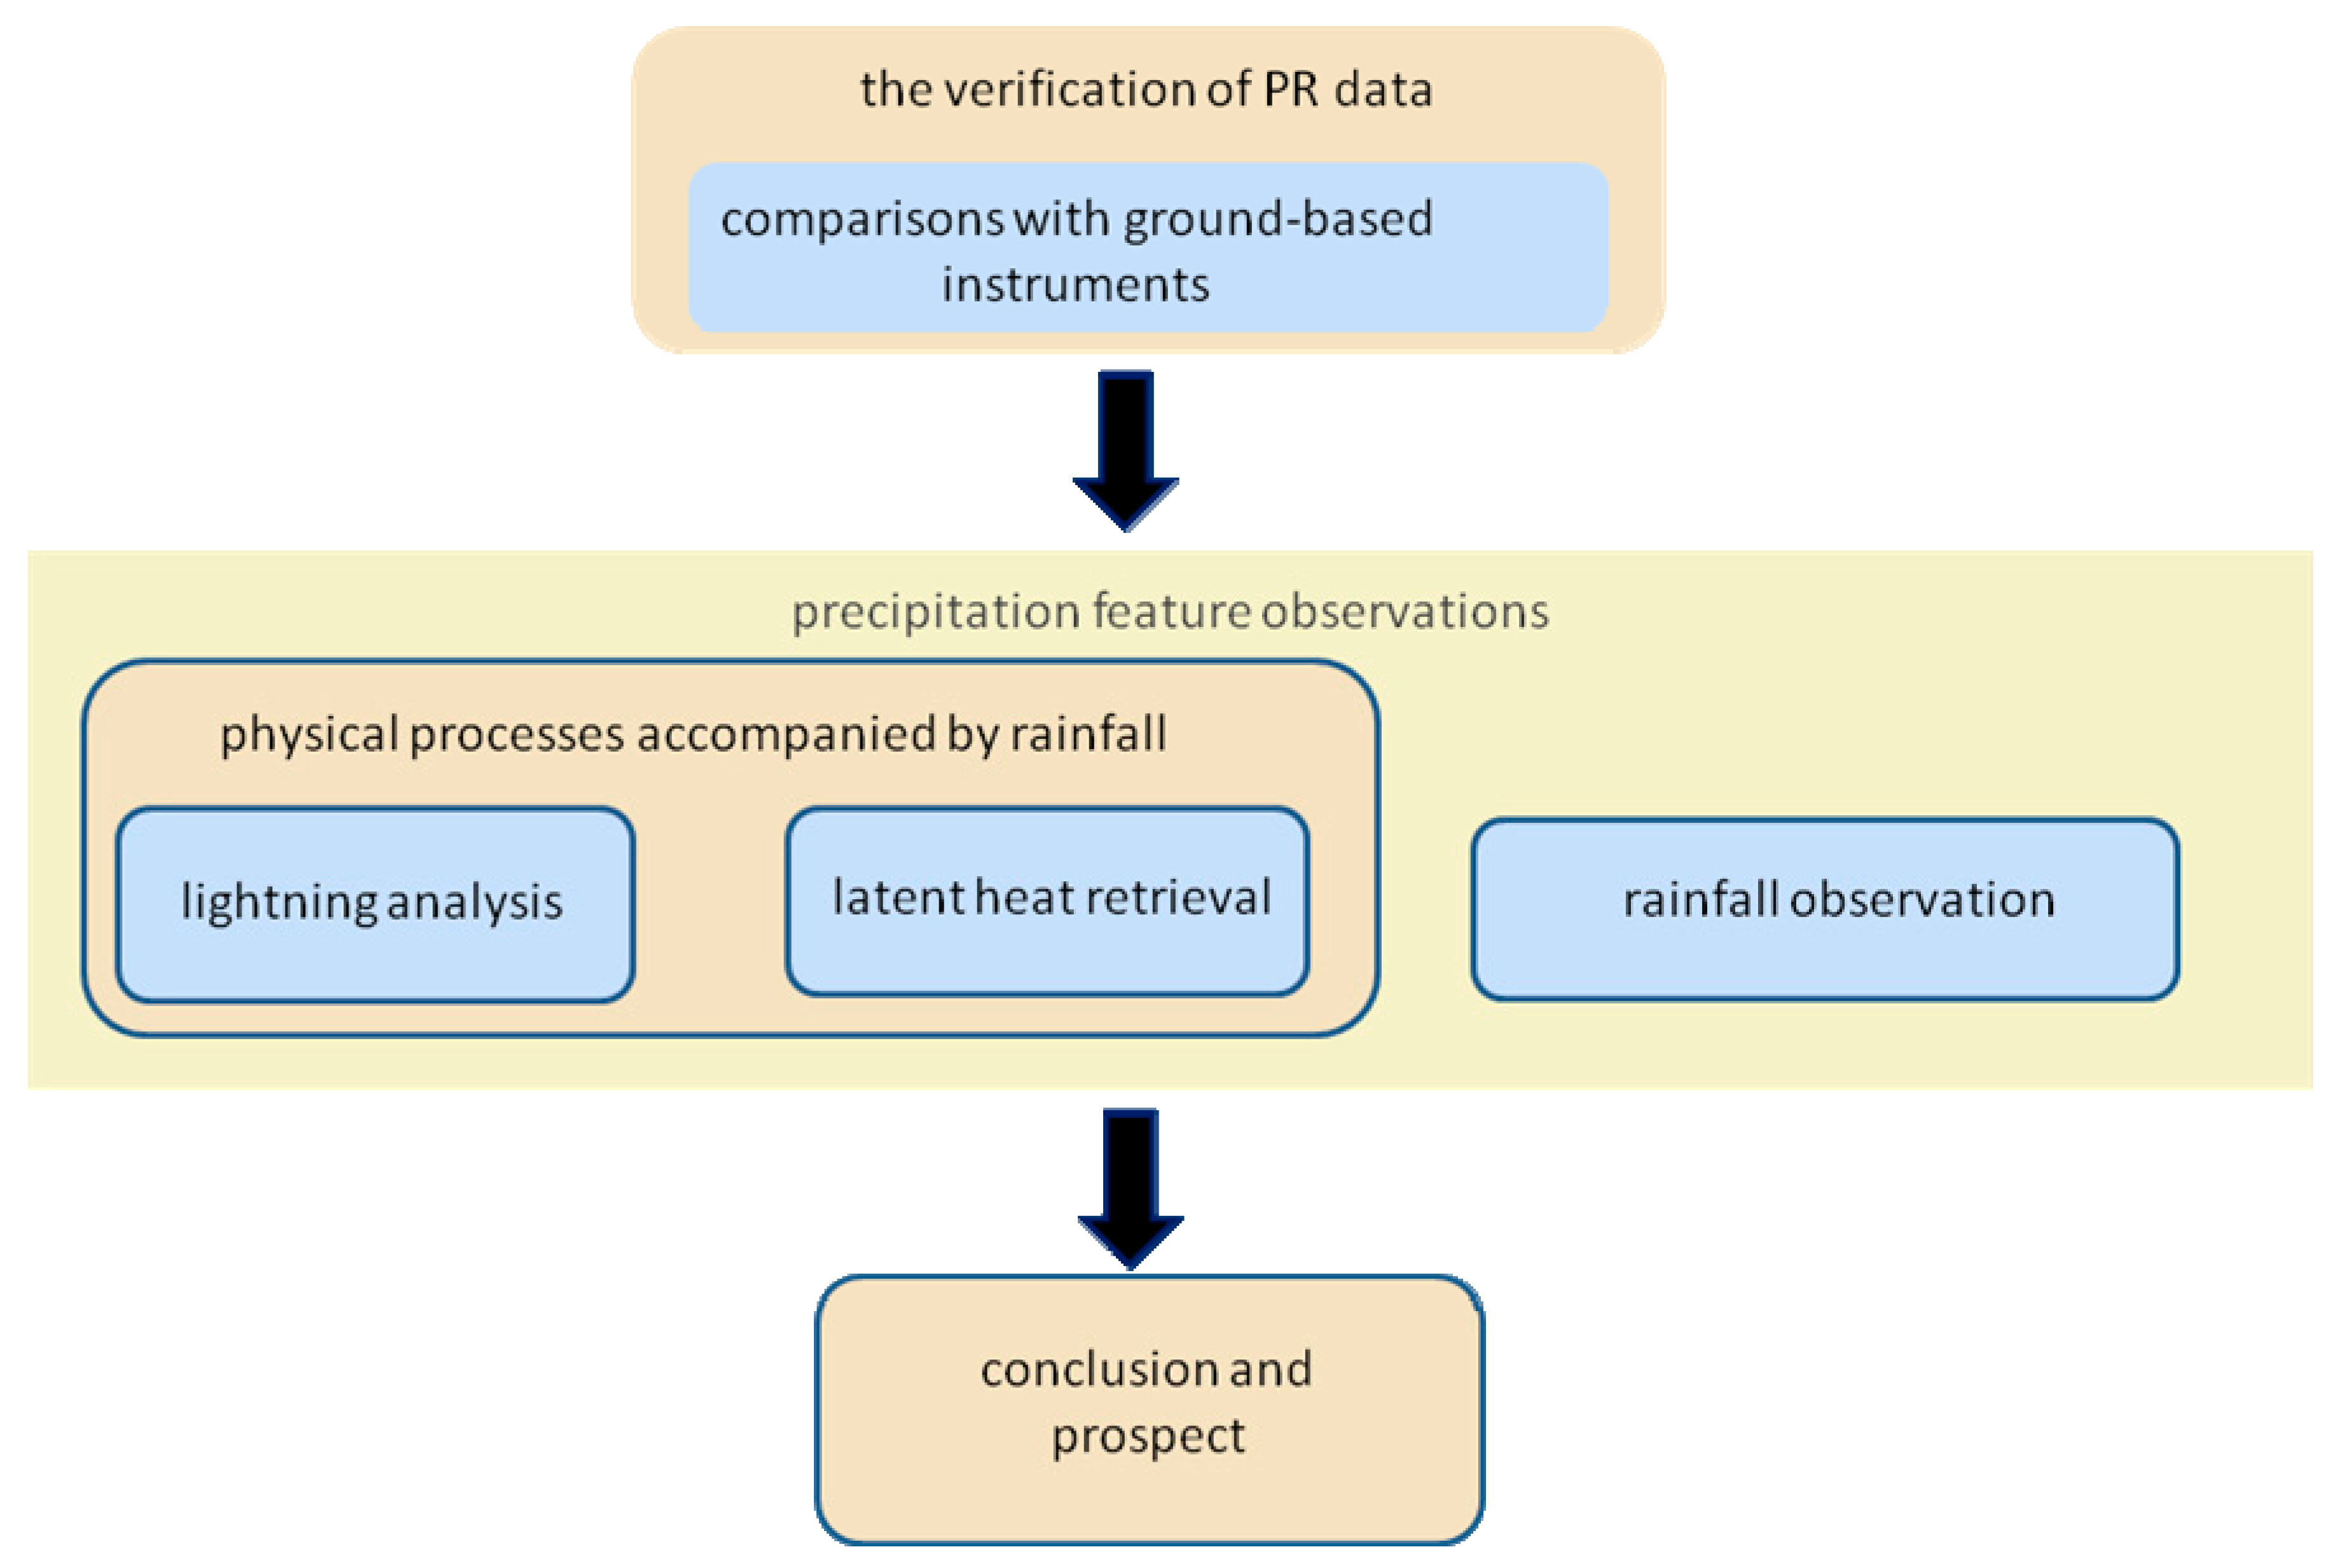
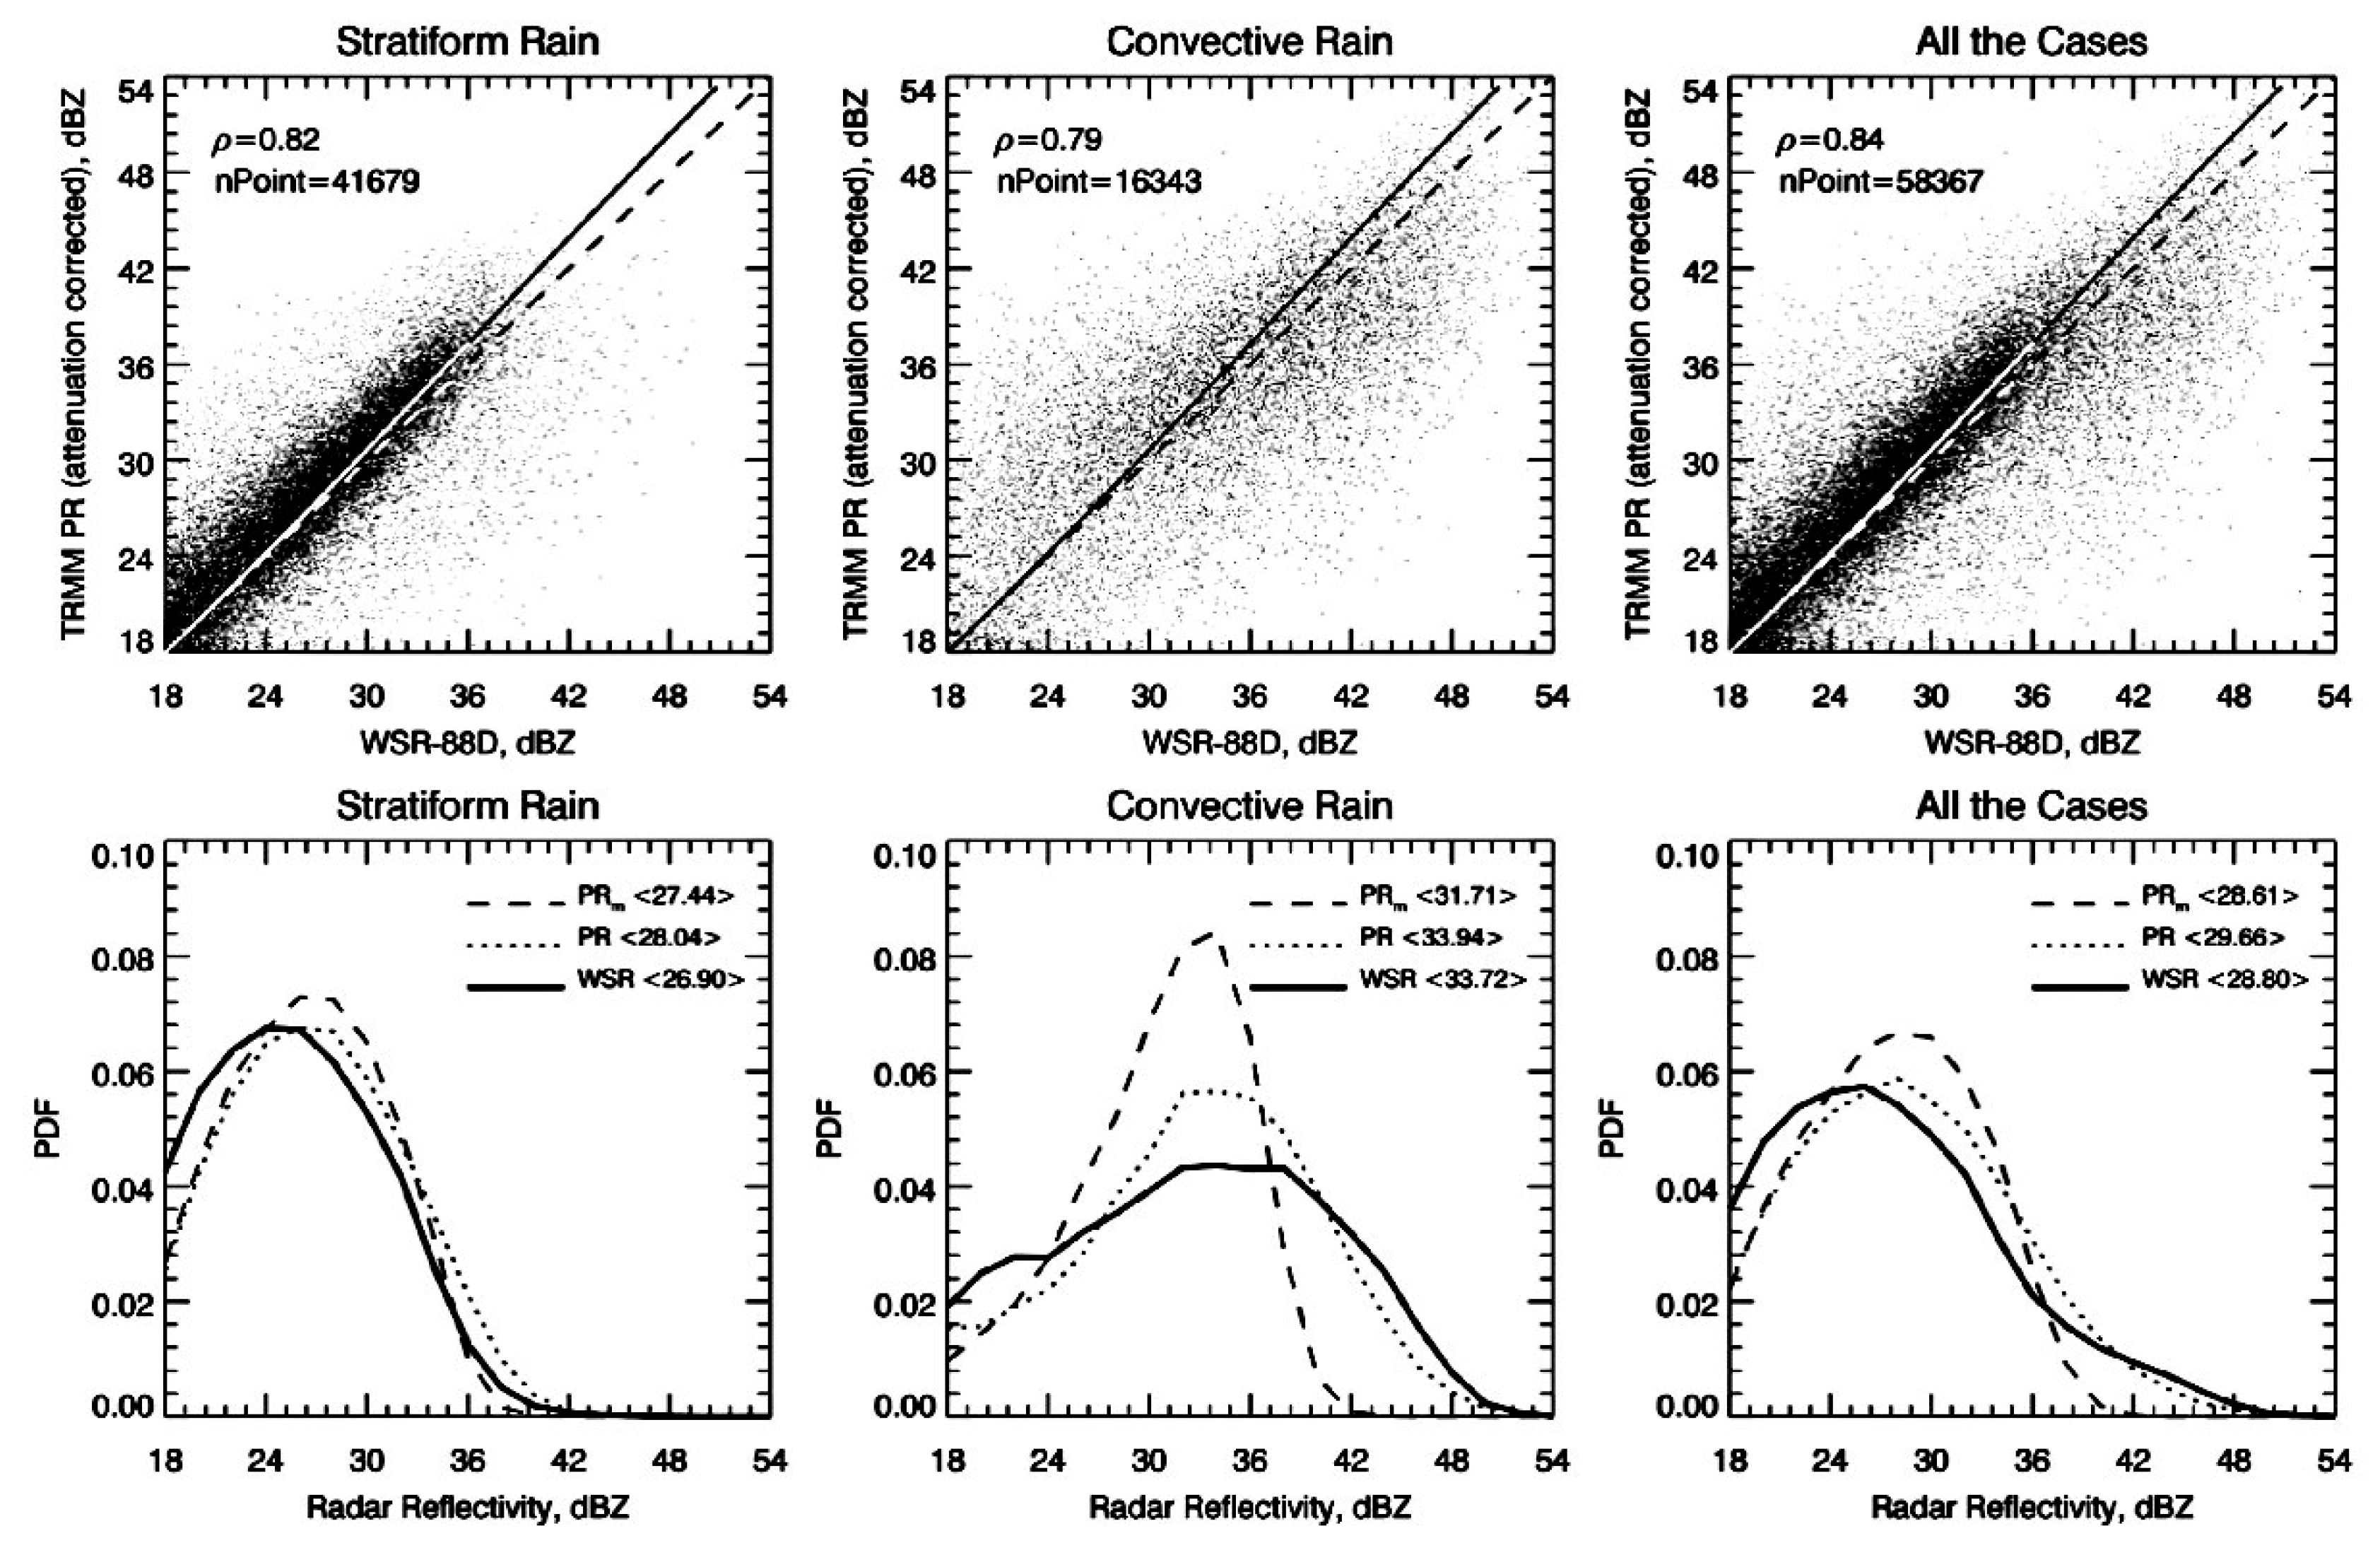
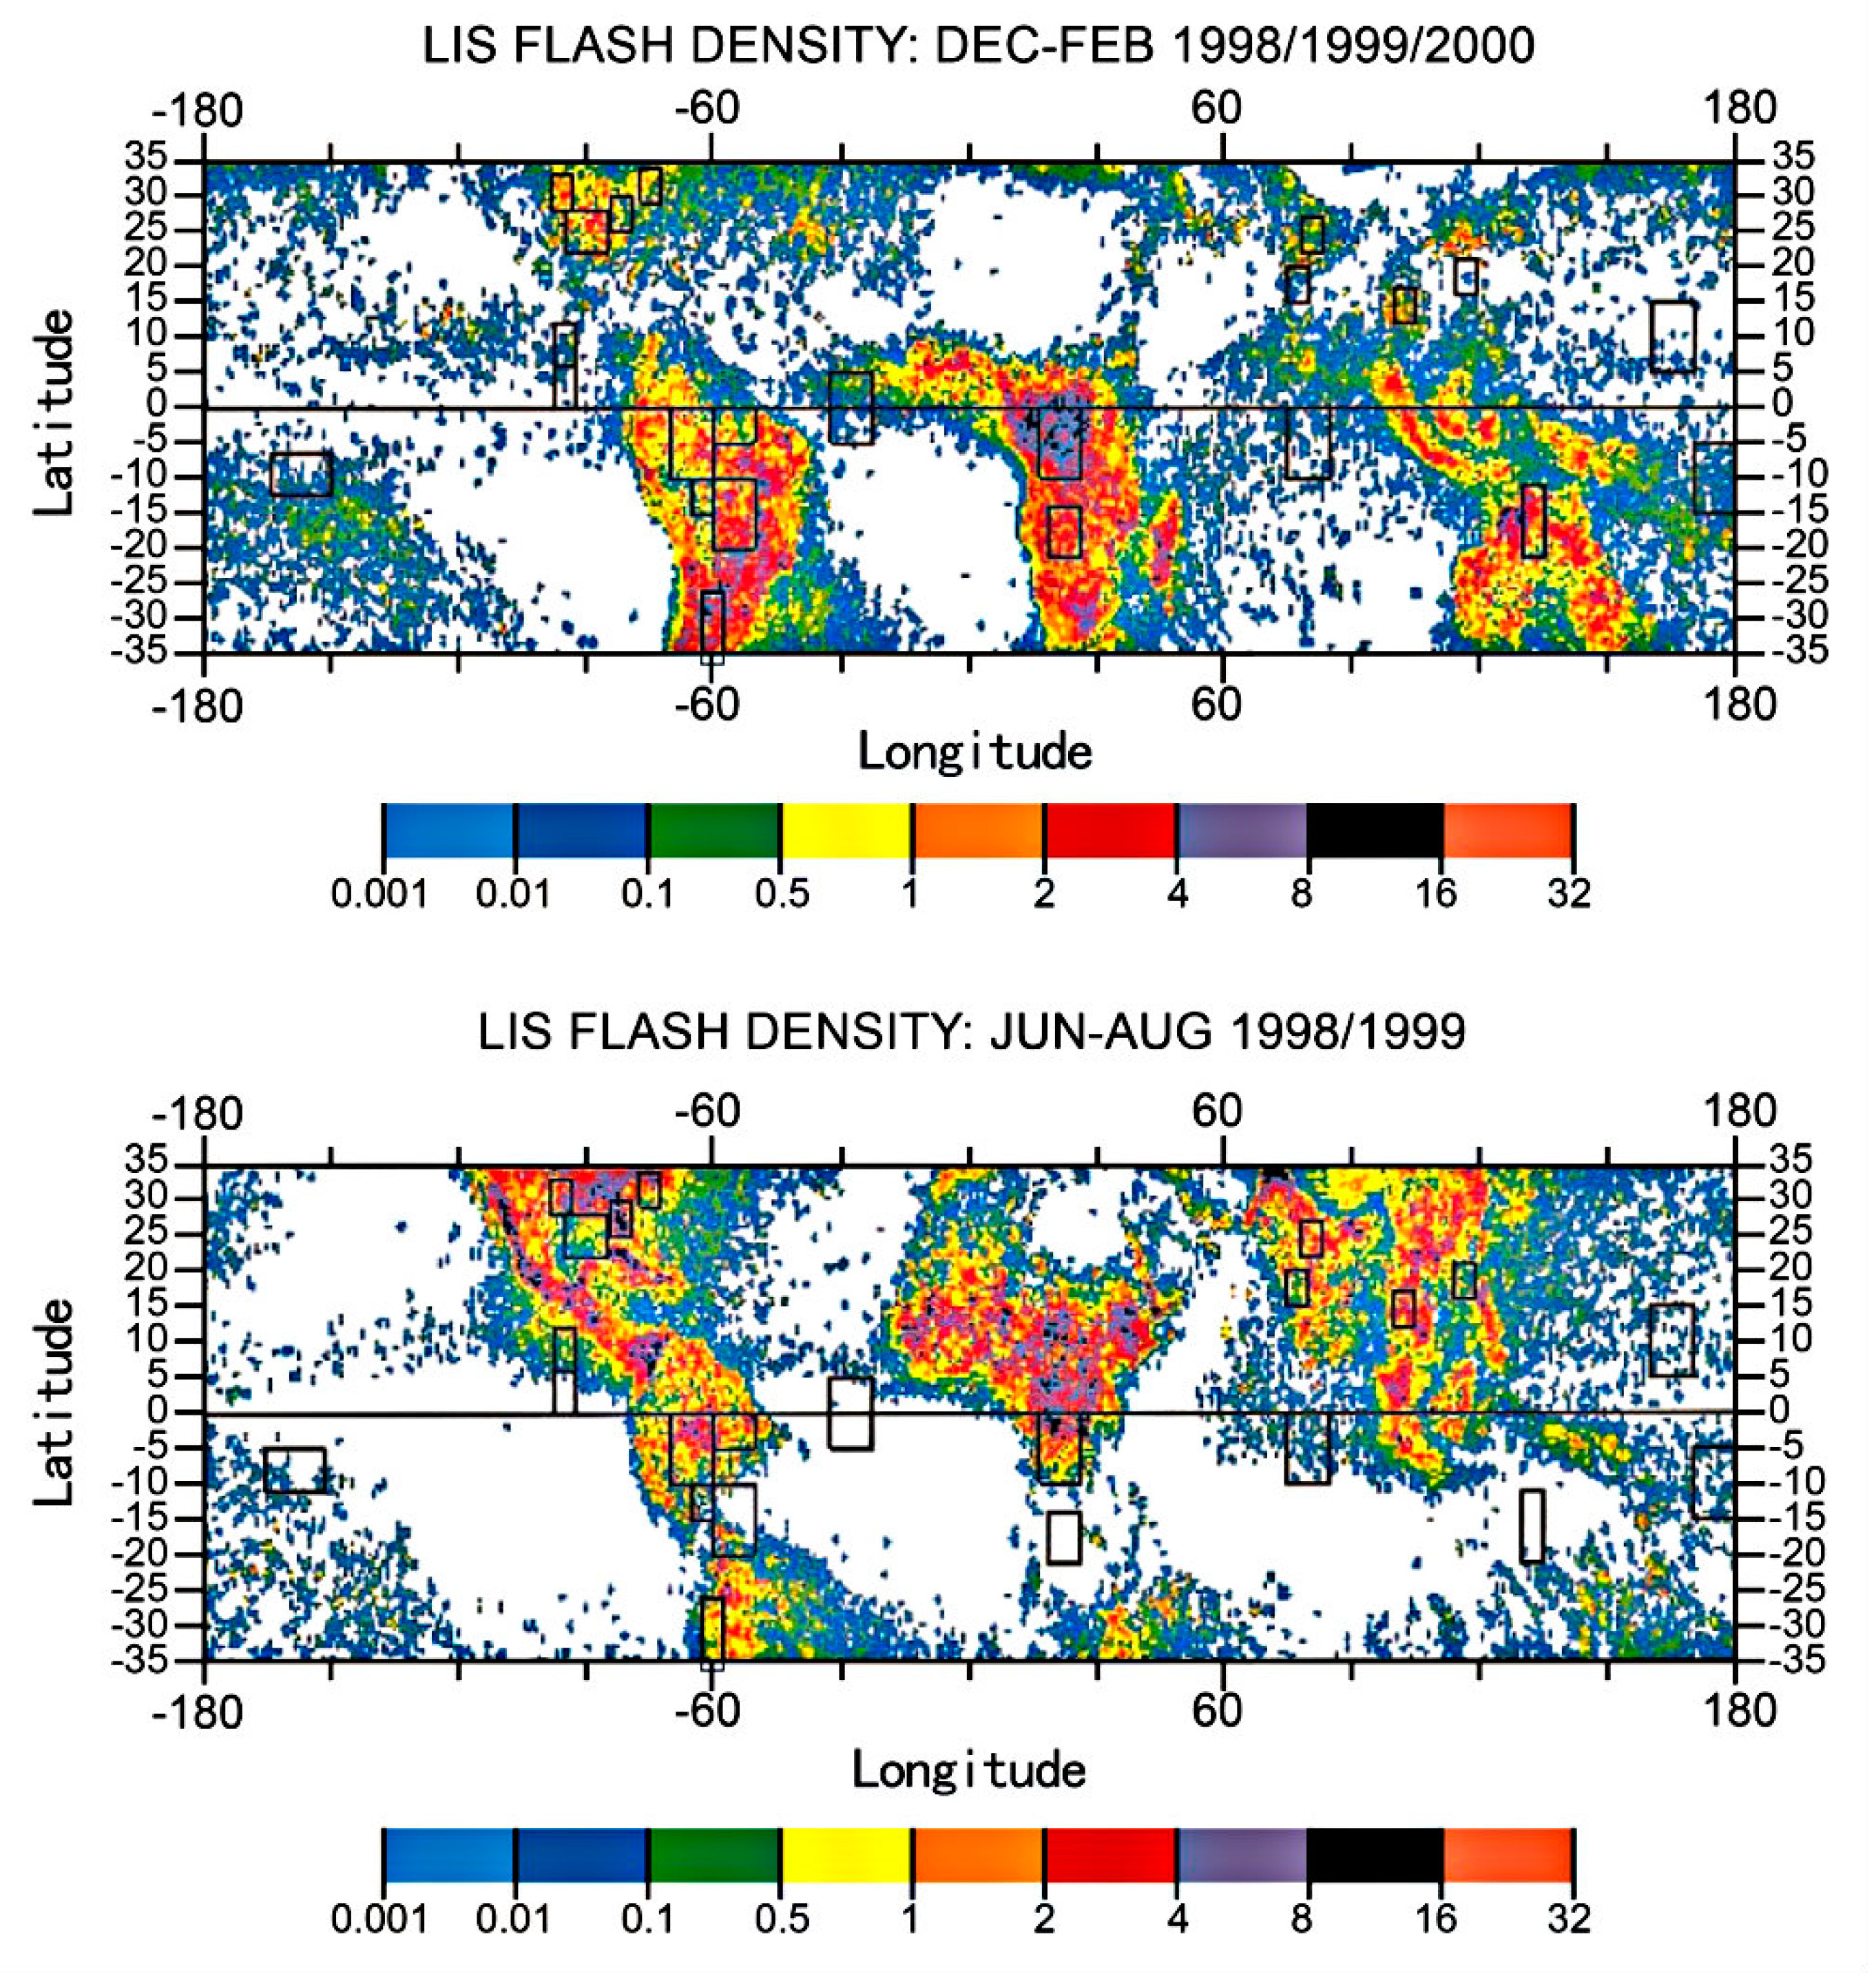
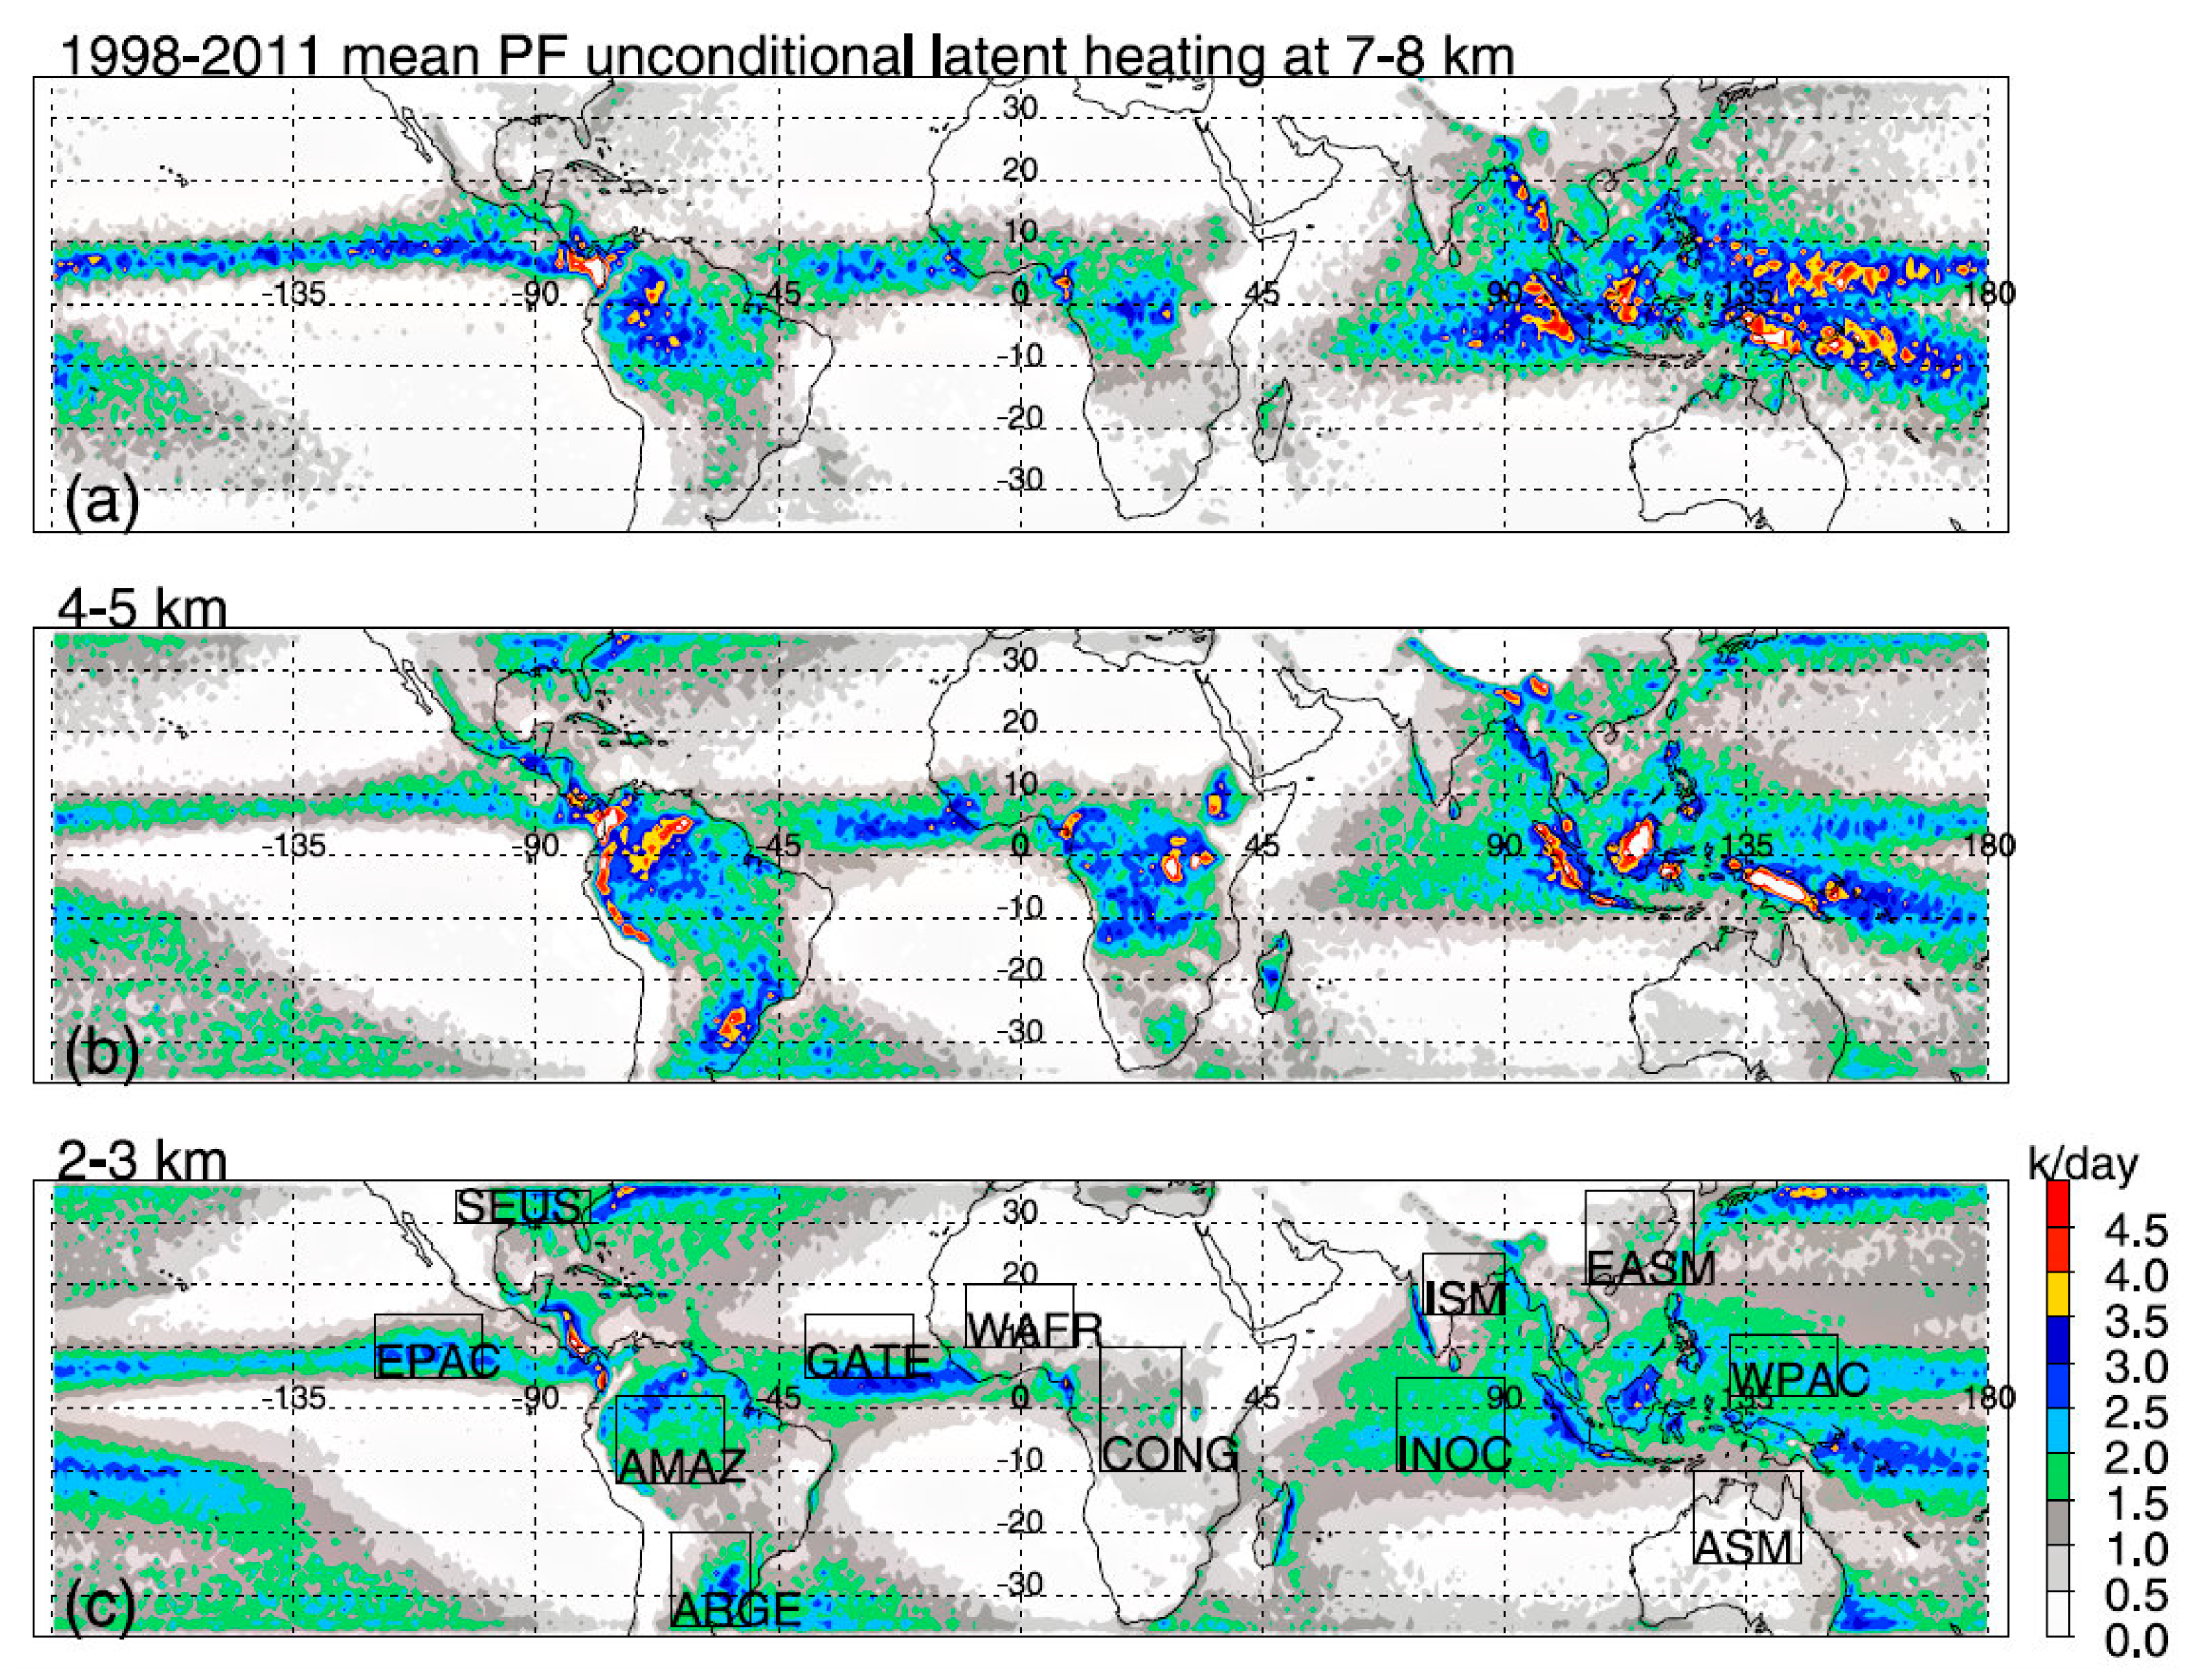
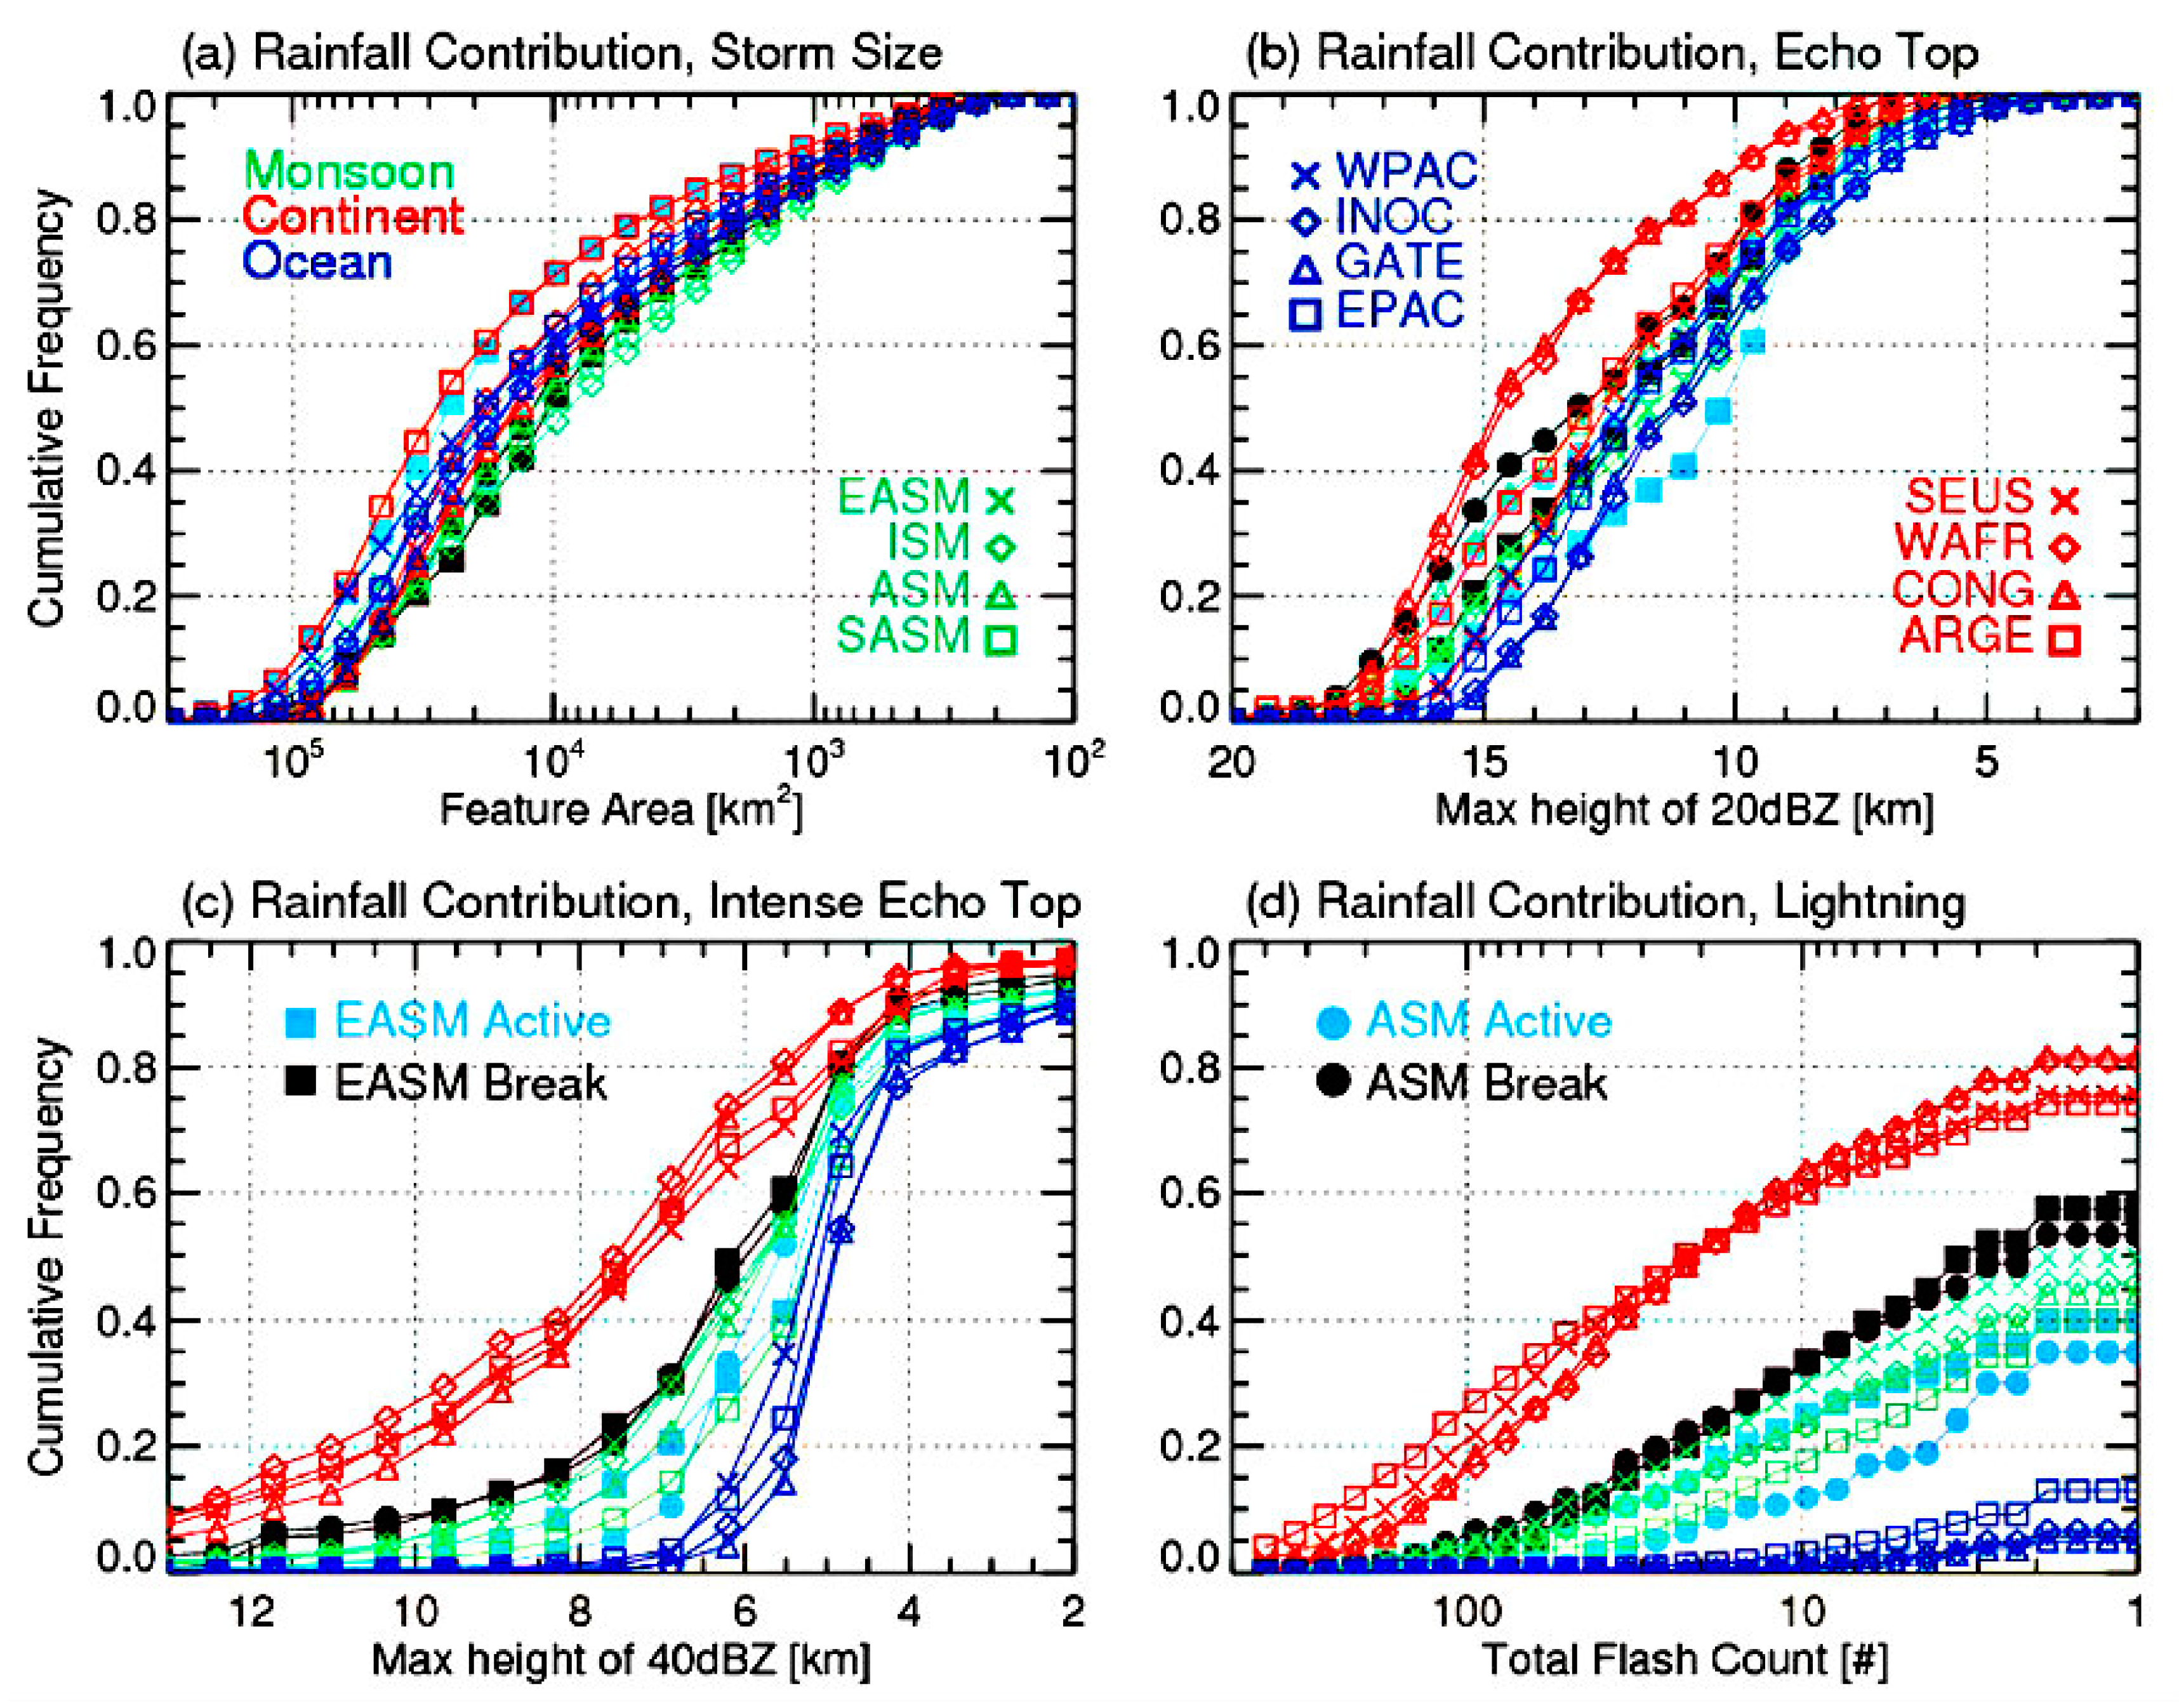
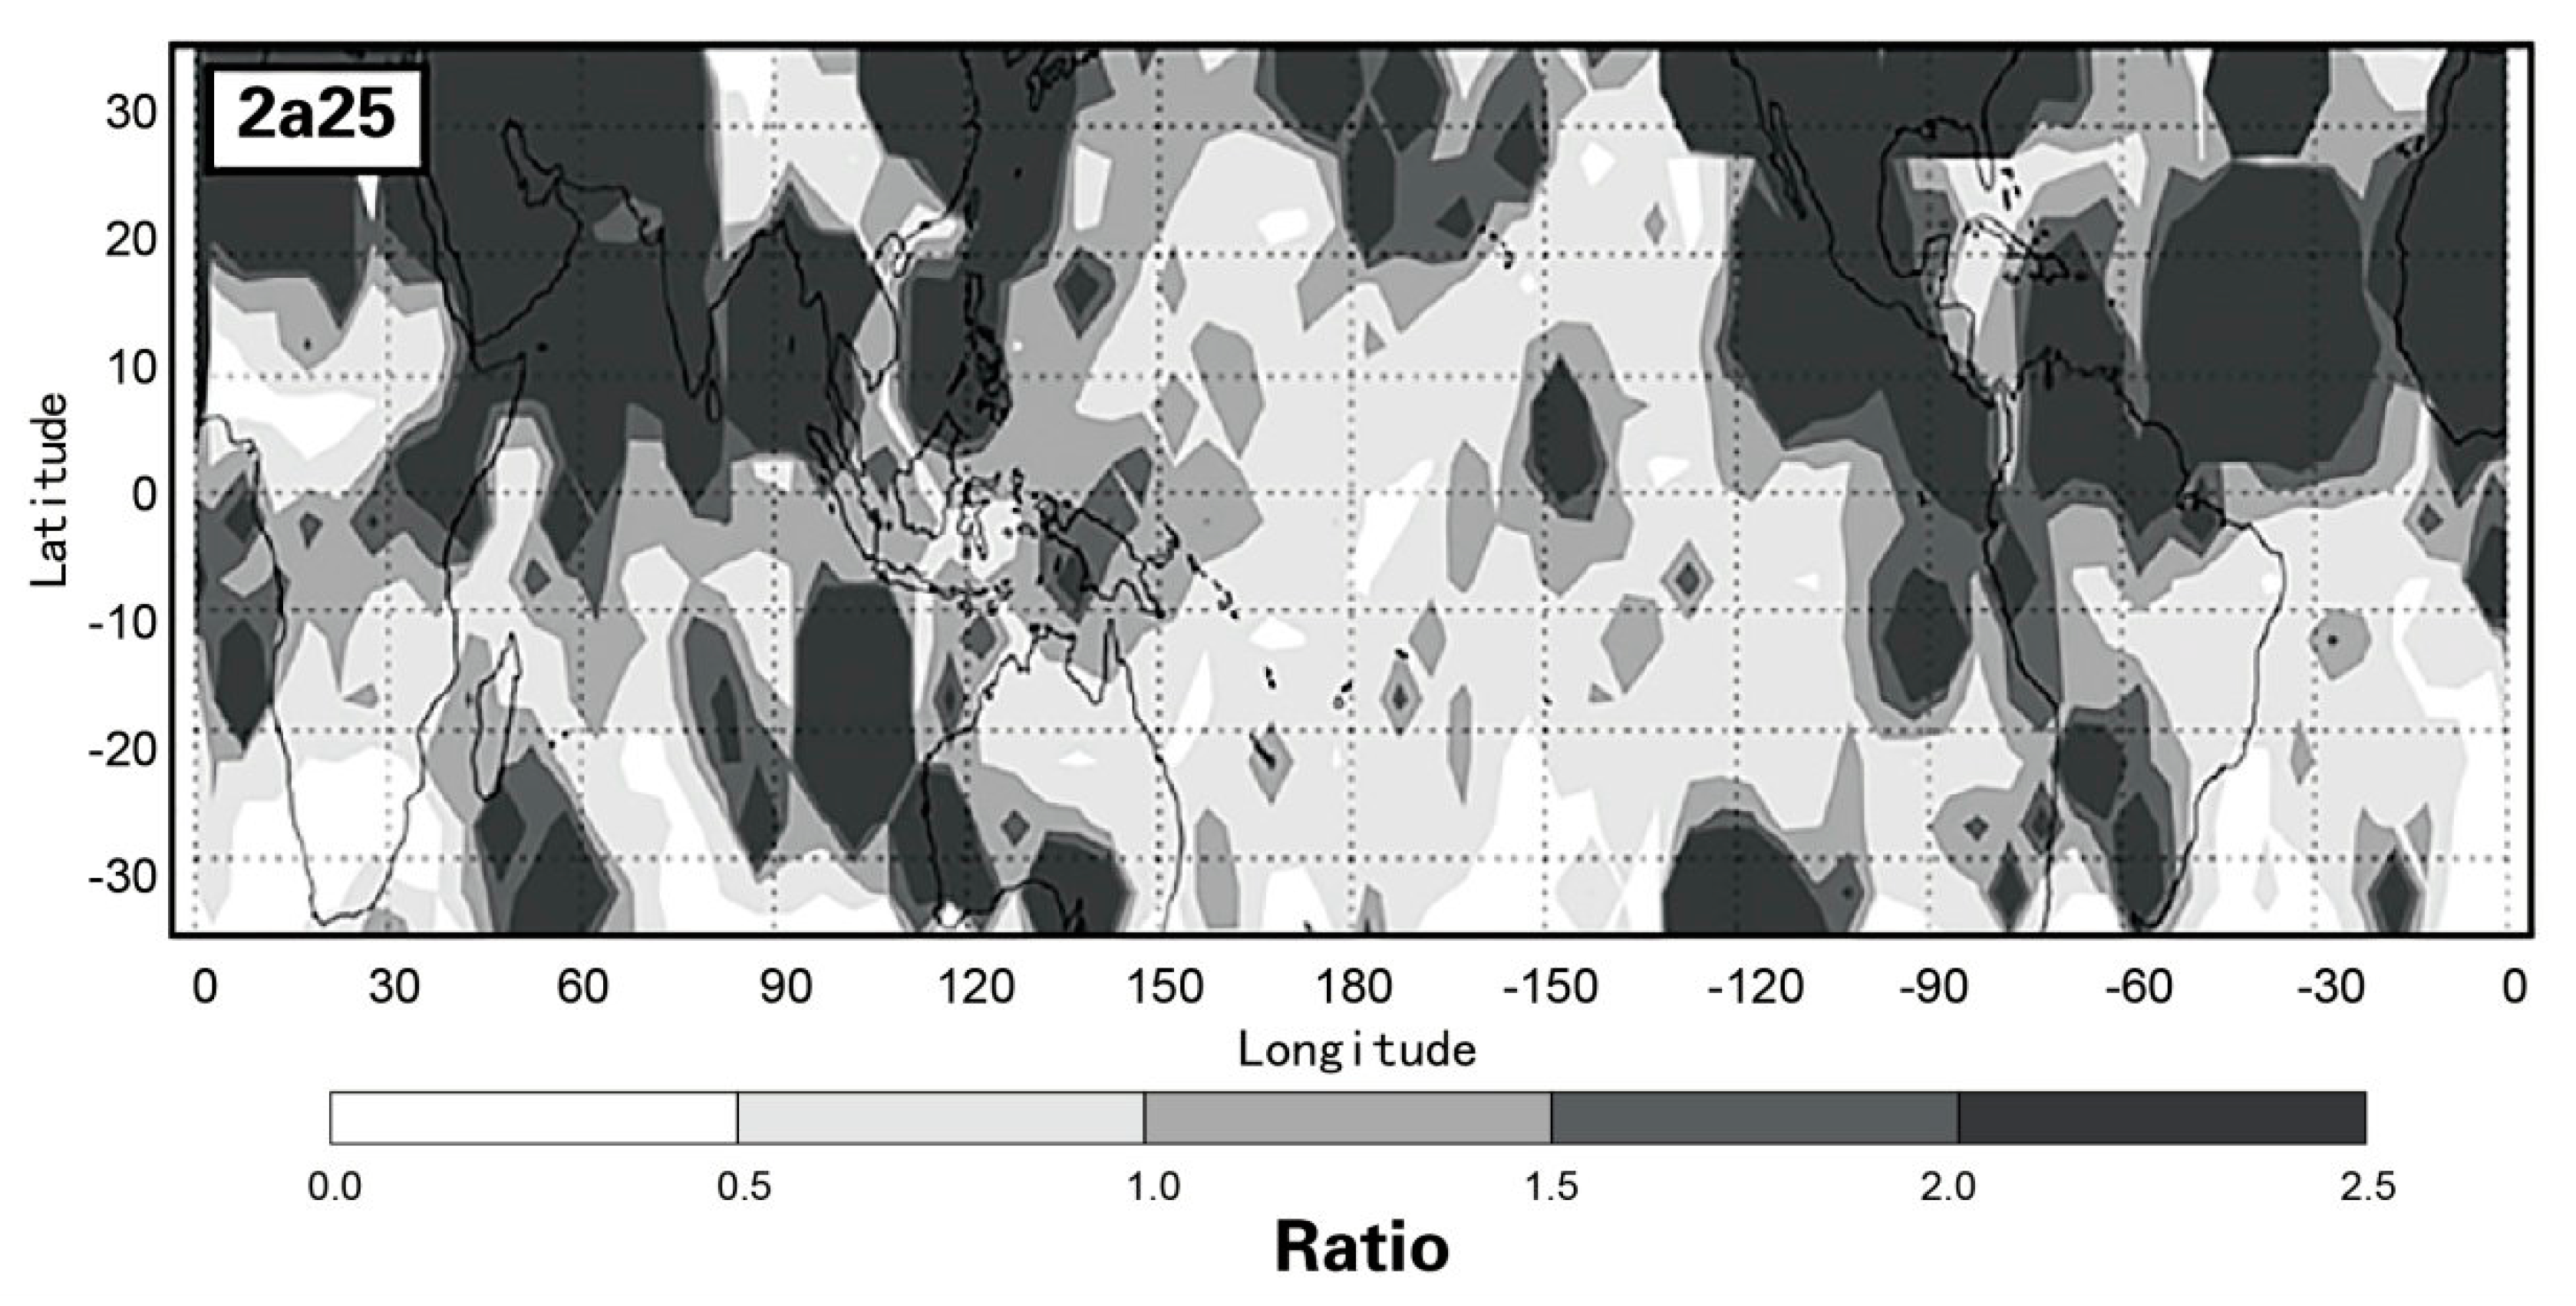
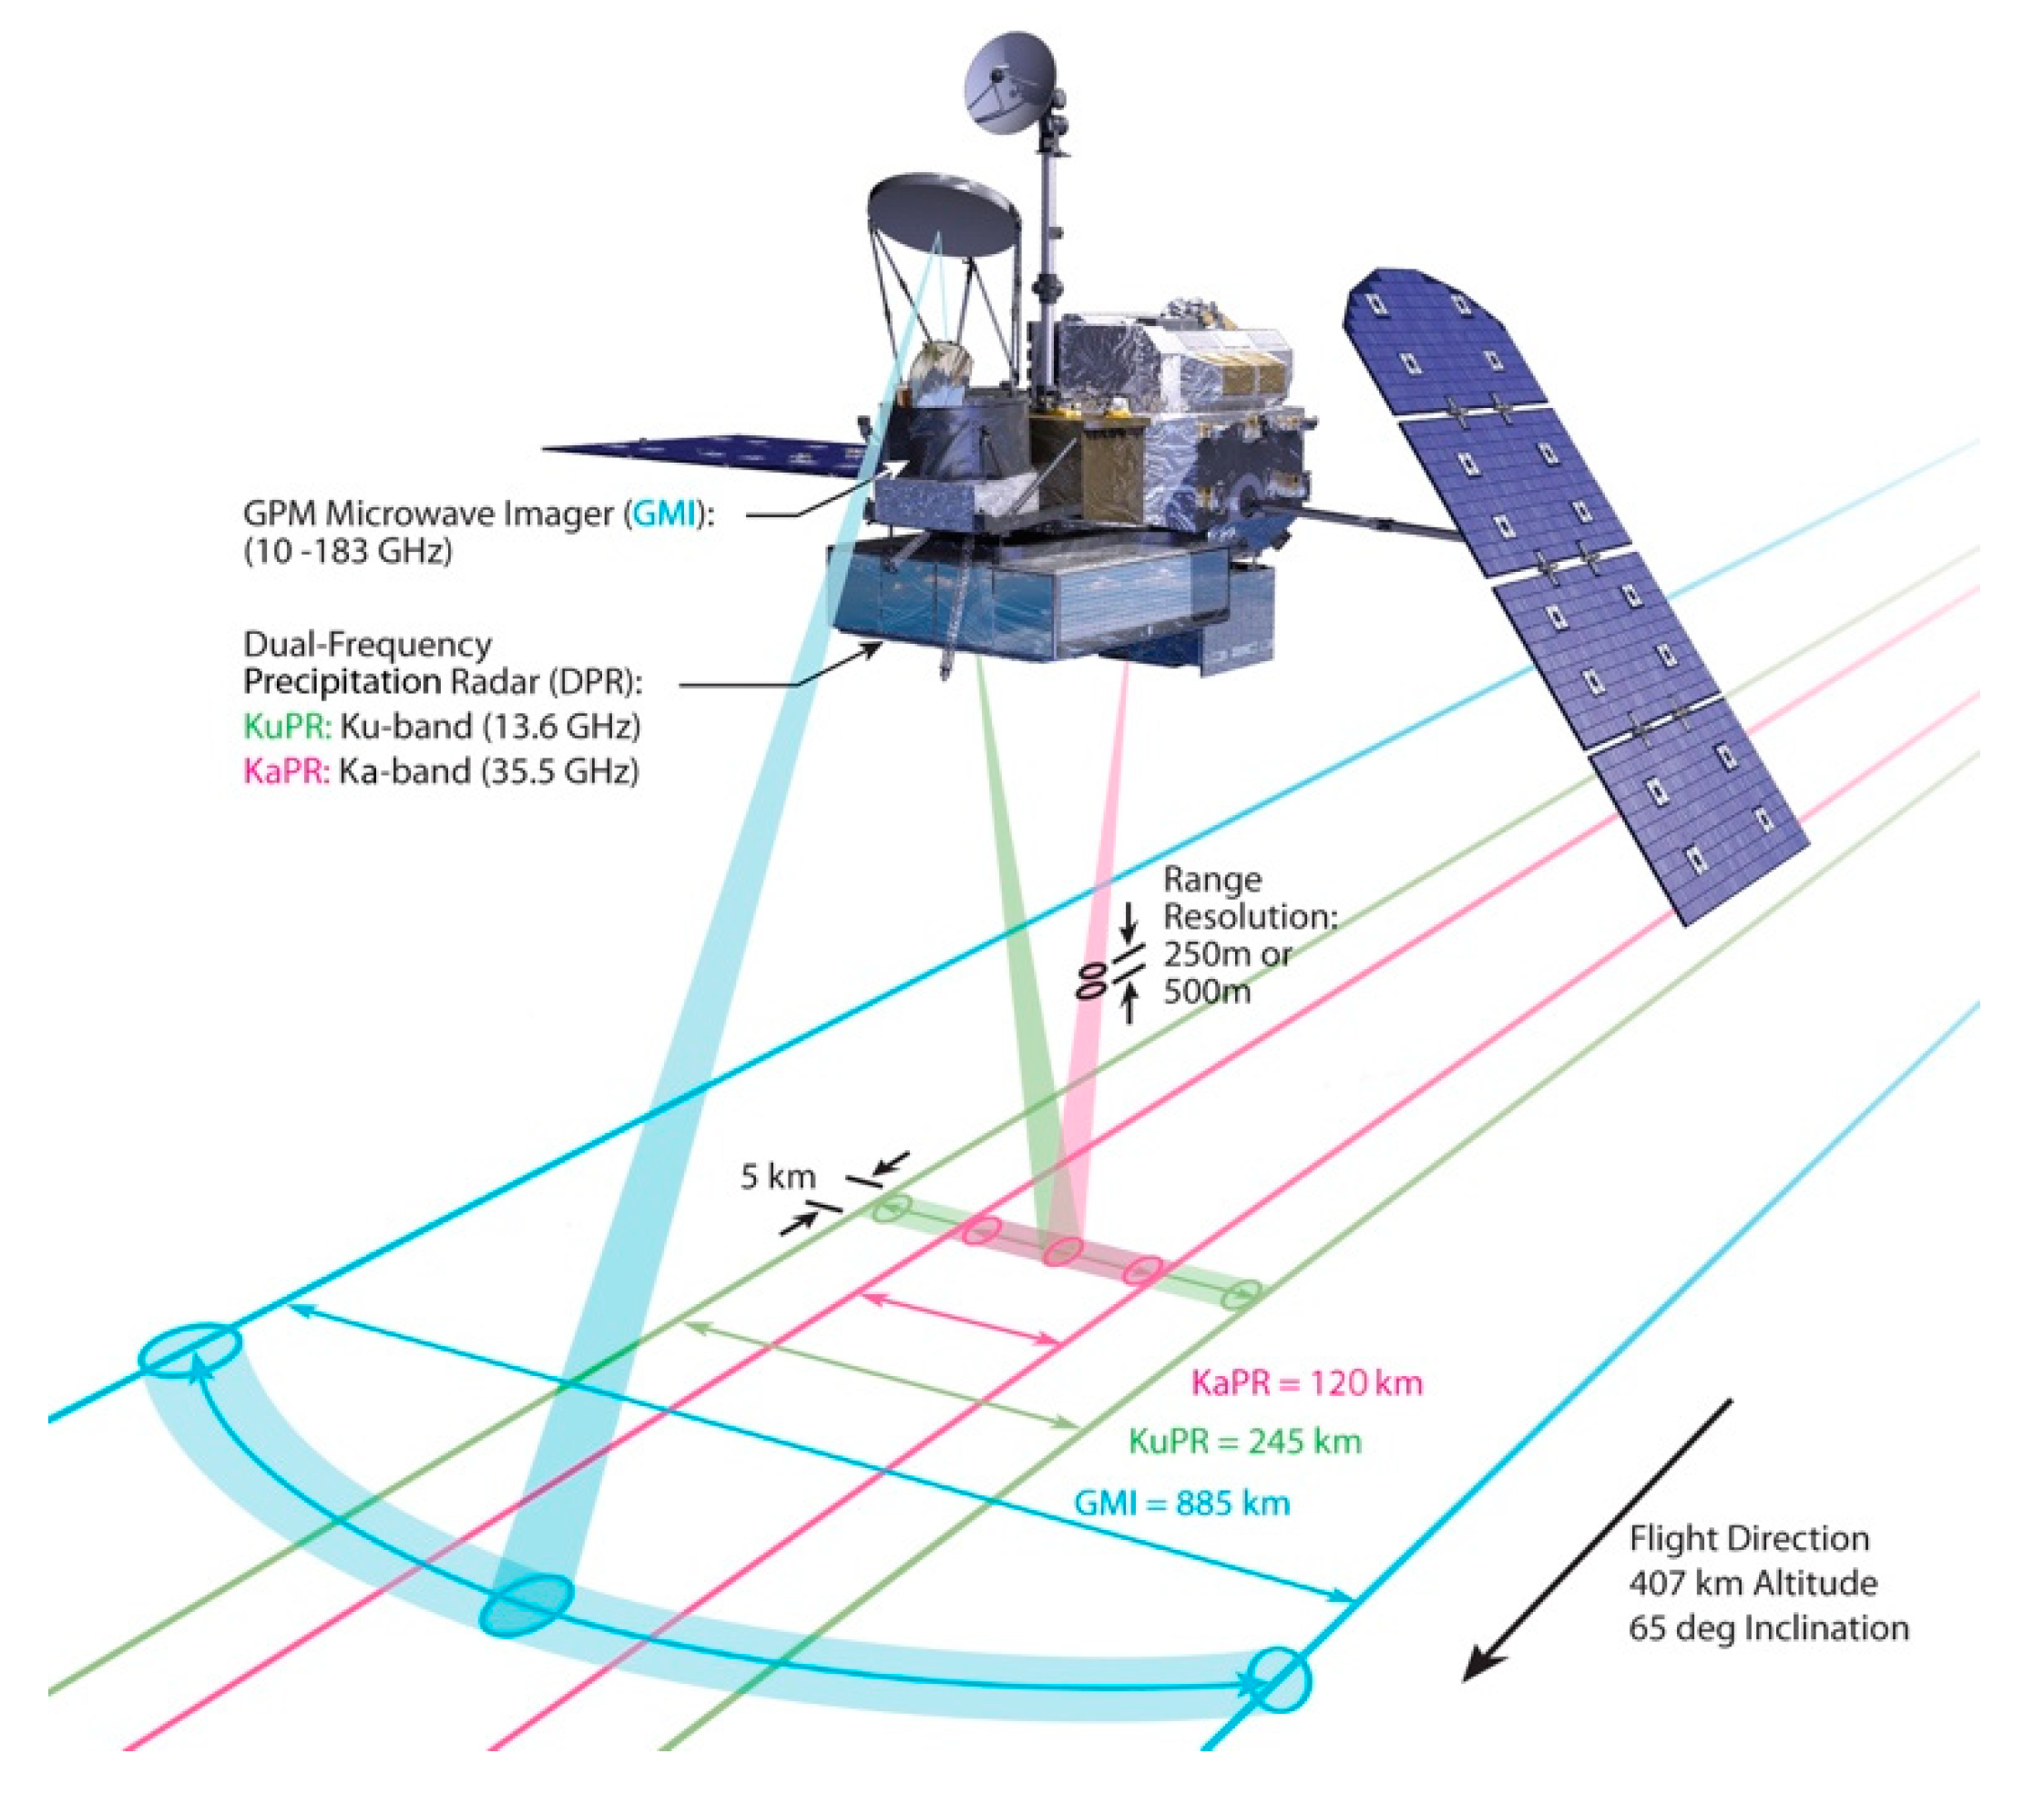
Table 1.
TRMM (Tropical Rainfall Measuring Mission) standard PR (Precipitation Radar) products.
| Products | Name | Brief Description | |
|---|---|---|---|
| Level 1 | 1B21 | PR Power | total received power and the noise level clutter contamination. |
| 1C21 | PR Reflectivity | radar reflectivity factors without attenuation correction. | |
| Level 2 | 2A21 | Surface Cross Section | the surface cross section and the path attenuation. |
| 2A23 | PR Qualitative | the detection of rain and the bright band, and the classification of rain types. | |
| 2A25 | PR Profile | vertical profiles of rainfall rates and the attenuation corrected radar reflectivity factors. | |
| Level 3 | 3A25 | PR Rainfall | monthly accumulations of 1C21, 2A21, 2A23 and 2A25 products at 5°×5° grid and 0.5° × 0.5° grid. |
| 3A26 | Surface Rain | monthly probability distribution of path-averaged rain rates and the rain rates on fixed heights at 5° × 5° grid. | |
Table 2.
Major changes of PR products from the previous version.
| Product Version | Major Changes from the Previous Version |
|---|---|
| Version 5 | modified definition of the reliability factor; subdivided rain type categories; modified drop size distribution (DSD) models; introduced new vertical rain structure model; modified weighting factor of the hybrid method for attenuation correction. |
| Version 6 | improved estimation rain rate in the range that is cluttered by the surface echo; introduced attenuation correction of gaseous; modified initial DSD model; modified calculation of reflectivity and rainfall rate in the attenuation correction; disabled non-uniform beam filling (NUBF) correction. |
| Version 7 | introduced new NUBF correction; defined new profiles of the phase state model of hydrometeors; modified default parameters in the attenuation correction and the rainfall estimation; introduced new error sources in the path integrated attenuation (PIA); estimated PIA to the rain bottom by the maximum likelihood method instead of the mean estimate. |
Table 3.
Key information on the studies of comparisons of PR with GRs (ground-based radars).
| Reference | Period | Ground-Based Radar | Products (Version) of PR | Preprocessing before Comparison | Matching Method | Study Region |
|---|---|---|---|---|---|---|
| Bolen and Chandrasekar [29] | Aug. 1998 | an S-band radar of National Center for Atmospheric Research (NCAR), US | PR data | non-Rayleigh scattering correction | grid-matching and area-matching | Melbourne, US |
| Gabella et al. [32] | 12 Feb. 2002 | a C-band radar in Kykkos, Cyprus | 2A25 | data removal in shielded or clutter areas | grid-matching | Cyprus |
| Gabella et al. [33] | 3 to 21 Mar. 2003 | a C-band radar at Shacham in Israel | 2A25 | / | grid-matching | southeast corner of the Mediterranean Sea |
| Gabella et al. [35] | Feb. 2002 and 2003 | two C-band radars at Kykkos in Cyprus and at Shacham in Israel | 2A25 | / | grid-matching | southeast corner of the Mediterranean Sea |
| Kim et al. [36] | Aug. 2006 to Aug. 2010 | S-band radars in Jindo, Pusan, Gosan and Seongsan, Korea | 2A25 (version6) | / | area-matching | Korean Peninsula and inshore areas |
| Li et al. [40] | 2003–2014 | an S-band radar in Nanjing, China | 2A25 (version6 and version7) | removal of precipitation boundaries; non-Rayleigh scattering correction | grid-matching | Nanjing, China |
| Liao et al. [31] | 1998 | the S-band radar in Melbourne, Florida, US | 2A25 | non-Rayleigh scattering correction | grid-matching | Melbourne, US |
| Liao and Meneghini [27] | 1998–2007 | the S-band radar in Melbourne, Florida, US | 2A25 (version6) | non-Rayleigh scattering correction | grid-matching | Melbourne, US |
| Park et al. [37] | Jun. to Aug. 2012 | 6 S-band radars in Korea | 2A25 (version7) | / | grid-matching | Korean Peninsula and inshore areas |
| Schumacher and Houze [25] | Aug. 1998 to Aug. 1999 | the S-band radar in Kwajalein, Republic of the Marshall Islands | 2A25 | / | grid-matching | Kwajalein, Marshall Islands |
| Schwaller and Morris [30] | Aug. 2006 to Mar. 2009 | 25 S-band and C-band radars | 2A25 (version6) | non-Rayleigh scattering correction | area-matching | southeastern US; Darwin, Australia; Gosan, Korea; Kwajalein, Marshall Islands |
| Wang and Wolff [28] | 1998–2007 | the S-band and C-band radars in Houston, Texas; Melbourne, Florida; Kwajalein, Republic of the Marshall Islands; Darwin, Australia | 2A25 (version6) | / | grid-matching | Houston and Melbourne, US; Kwajalein, Marshall Islands; Darwin, Australia |
| Wang et al. [38] | 2007 | an S-band radar in Shanghai, China | 2A25 (version6) | non-Rayleigh scattering correction | area-matching | Shanghai, China |
| Wen et al. [23] | 2005–2009 | an S-band polarimetric radar of National Severe Storms Laboratory (NSSL), US | 2A25 (version6) | non-Rayleigh scattering correction | area-matching | Norman, US |
| Zhong et al. [39] | Jun., Jul., and Aug. of 2011 and 2012 | 23 S-band radars in central and south China | 2A25 (version7) | / | grid-matching | China |
Table 4.
Key information on the studies of QPE (quantitative precipitation estimation) comparison of PR with GR.
Table 4.
Key information on the studies of QPE (quantitative precipitation estimation) comparison of PR with GR.
| Reference | Period | Ground-Based Radar | Products (Version) of PR | Spatial Scale | Conclusion | Study Region |
|---|---|---|---|---|---|---|
| Wolff et al. [41] | 1998–2002 | the S-band and C-band radars in Houston, Texas; Melbourne, Florida; Kwajalein, Republic of the Marshall Islands; Darwin, Australia | 3G68 (version6) | 0.5° × 0.5° | higher than GR at Kwajalein while lower than GR at Melbourne | Houston, and Melbourn, US; Kwajalein, Marshall Islands; Darwin, Australia |
| Gebremichael et al. [42] | 1998–2000 | the S-band radars in Houston, Texas; Melbourne, Florida; Kwajalein, Republic of the Marshall Islands | 2A25 (version5) | 4–64 km | PR missed the majority of light rains compared with GR | Houston, and Melbourn, US; Kwajalein, Marshall Islands; |
| Wolff and Fisher [43] | 1999–2004 | the S-band radars in Melbourne, Florida; Kwajalein, Republic of the Marshall Islands | 3G68 (version6) | 0.5° × 0.5° | lower than GR over land and coasts while higher than GR over oceans at Melbourne; lower than GR at Kwajalein | Melbourne, US; Kwajalein, Marshall Islands |
| Amitai et al. [44] | 2007–2010 | S-band Weather Surveillance Radar-1988Doppler (WSR-88D) network, US and a C-band dual polarimetric radar in Alabama, US | 2A25 (version6) | 0.04° × 0.04°5 km × 5 km | rain rate estimates show quite good agreement for rainfall accumulations while probability distribution of PR shifted toward lower rain rates for instantaneous rainfall estimates | southern US |
| Kirstetter et al. [45] | Mar. to May 2011 | S-band WSR-88D, network, US | 2A25 (version6) | 4.5km × 4.5km | PR missed majority of light rain, and probability distribution of PR shifted toward lower rain rates | southern US |
| Kirstetter et al. [46] | Mar. to May 2011 | S-band WSR-88D network, US | 2A25 (version6 and version 7) | 5km × 5 km | lower than GR | southern US |
Table 5.
Key information of the studies on QPE comparison of PR with rain gauges.
| Reference | Period | Sites | Products (Version) of PR | Temporal Scale | Conclusion | Study Region |
|---|---|---|---|---|---|---|
| Amitai et al. [67] | 1999–2010 | 88 gauges in network of the USDA-ARS (Agricultural Research Service of U.S. Department of Agriculture) Walnut Gulch Experimental Watershed with in southeastern Arizona, US | 2A25 (version7) | 1 minute | very good agreement with low bias values and high correlation coefficients | southeastern Arizona, US |
| As-Syakur et al. [68] | 1998–2002 | 3 rain gauges over the island of Bali | 3B42 and 3B43 | daily, monthly and seasonal | lower than the rain gauges | the island of Bali, Indonesia |
| Demoss and Bowman [48] | Jan.1998 to May 2005 | NOAA (National Oceanic and Atmospheric Administration) tropical ocean buoys | 3G68 (version6) | 6-hour mean | lower than the rain gauges | tropical Atlantic and Pacific Oceans |
| Fisher [47] | 1998–2001 | 66 high-resolution rain gauges from the Oklahoma Mesonet | 2A25 and 3A25 (version5) | monthly | overestimation for high precipitation months | Oklahoma, US |
| Gabella et al. [32] | Dec. 1997 to Nov. 2002 | 25 rain gauges in Cyprus | 3A25 (version5) | monthly | underestimation for Feb., Mar., Jun. and Jul while overestimation for Sep. and Oct. | southeastern Mediterranean area |
| Liu et al. [49] | 1998–2005 | 430 rain gauges in the southern China | 2A25 (version6) | annual and season mean | lower than the rain gauges | southern China |
| Nogueira et al. [69] | Jul.2009 to Jun. 2015 | 14 rain gauges in Minas Gerais state, Brazil | 3B42(version7) | daily | no significant difference | Minas Gerais state, Brazil |
| Retalis et al. [63] | 1998–2012 | 113 rain gauges | 3B43 (version7) | monthly and yearly | higher than the rain gauges in plain areas while lower in mountain areas | Cyprus |
| Prasetia et al. [50] | 2004–2008 | 20 standard manual and automatic rain gauges | 3A25 (version6) | monthly and seasonal | underestimation | Indonesian |
| Moazami et al. [51] | 2003–2006 | 940 rain gauges and 240 synoptic stations (1180 rain gauges) | 3B42 (version7) | daily | overestimate light rainfall and underestimate moderate and heavy rainfall | Iran |
| Teng et al. [52] | Jan. 2011 to Jul. 2012 | 1379 rain gauges in Zhejiang Province | 3B42 | daily | overestimation | Zhejiang Province, China |
| Gebere et al. [53] | 2003–2006 | 9 rain gauges | 3B42 (version7) | daily, monthly and seasonal | overestimation | eastern region of Ethiopia |
| Fensterseifer et al. [55] | 1998–2011 | 25 rain gauges | 3B42 (version 6 and version 7) | daily and monthly | underestimationfor V6 and slightly overestimation for V7 | Southern Brail |
| Hur et al. [60] | Dec. 2000 to Nov. 2010 | 4 mannedstations and 21 automatic stations | 3B42 (version7) | sub-daily, daily, monthly and seasonal | overestimationfor light rain and underestimation for heavy rain | Singapore |
| Zad et al. [61] | 1998–2014 | 32 rain gauges | 3B42 (version7) | daily | overestimation | Pahang, Malaysia |
| dos Reis et al. [70] | 2009–2014 | 11 rain gauges | 3B42 (version7) | daily, monthly and annual | overestimation | southeastern Brazil |
| Weiberlen and Benı´tez [71] | 1998–2012 | 22 conventional weather stations | 3B42 (version7) | daily | good agreement with slight overestimations or underestimations | Paraguay |
| Chen et al. [59] | 2015–2017 | 43 rain gauges | 3B42 (version7) | daily, monthly and annual | overestimation | Huaihe River basin of China |
| Tan et al. [72] | 1998–2014 | 22 rain gauges | 3B43 | monthly, seasonal and annual | underestimation | Singapore |
| Nogueira et al. [69] | Jul. 2009 to Jun. 2015 | 14 rain gauges | 3B42 (version7) | daily | overestimation | south-southeast region of Minas Gerais state, Brazil |
| Milewski et al. [62] | 1998–2012 | 125 rain gauges | 3B42 (version 6 and version7) | daily, monthly and annual | 3B42 V7 outperforms 3B42 V6 | Northern Morocco |
| Wehbea et al. [65] | 2000–2010 | 53 rain gauges | 3B42 (version7) | monthly | good agreement | United Arab Emirates |
| Darand et al. [56] | 1998–2013 | 157 synoptic stations | 3B42 and 3B43 (version7) | daily, monthly and annual | underestimation in rainy regions and overestimationin dry regions | Iran |
| Wang et al. [57] | Apr. 2014 to Jan. 2016 | 53 rain gauge stations | 3B42 (version7) | daily | underestimation for heavy rain and overestimationfor light rain | Mekong River Basin |
| Xu et al. [64] | May to Oct. 2014 | 194 rain gauges | 3B42 (version7) | daily and monthly | overestimation | southern Tibetan Plateau |
| Derin et al. [54] | 2000–2013 | 5-208 rain gauges | 3B42 (version7) | daily, monthly and annual | underestimation in wet season and overestimation in dry season | nine mountainous regions across the globe |
| Terao et al. [58] | 2004–2013 | 36 tipping bucket raingauges | 2A25 (version7) | instantaneous | underestimations during the monsoon season | northeastern Indian subcontinent |
Table 6.
Key information of the studies on lightning from PR data.
| Reference | Period | Location | Products (Version) of PR |
|---|---|---|---|
| Cecil et al. [75]; Cecil and Zipse [76] | Dec. 1997 to Dec. 1998 | tropics | 2A23 and 2A25 (version4) |
| Kodama et al. [82] | Jan. and Feb. of 1998–2003 | western North Pacific | 2A25 (version5) |
| Liu et al. [78] | 1998–2010 | tropics | the University of Utah precipitation feature database |
| Petersen and Rutledge [73] | Dec. 1997 to Feb. 2000 | tropics | 2A25 (version5) |
| Peterson and Liu [77] | 1998–2009 | tropics | 2A23 and 2A25 (version7) |
| Tadesse and Anagnostou [85] | Jul. to Dec. 2004 | African continent | PR precipitation products |
| Toracinta et al. [74] | Aug. to Oct. 1998 | Africa, South America, east Pacific, and west Pacific | 2A25 (version4) |
| Wang et al. [83] | 2002–2005 | tropics | 2A23 and 2A25 (version6) |
| Zhang, Y. et al. [84] | 2007–2008 | Nanjing area | 2A25 (version7) |
Table 7.
Key information of the studies on LH (latent heat) from PR data.
| Reference | Period | Location | Products (Version) of PR | Retrieval Algorithms of LH |
|---|---|---|---|---|
| Barnes et al. [104] | Feb. 1998 to 2012 | central Indian and West Pacific Oceans | 2A25 and 2H25 (version5) | SLH |
| Hagos et al. [93] | 1998–2007 | tropics | CSH etc | CSH |
| Li et al. [98] | 1998–2005 | South China Sea | CSH | CSH |
| Liu et al. [94] | 1998–2012 | tropics | 2H25 (version7) | SLH |
| Magagi and Barros [96] | Jun. of 1999–2001 | Indian subcontinent and Tibetan plateau | 2A25 (version 5) | a cloud physics parameterization and the thermodynamic equilibrium equation, a combination of radiosonde and the radar reflectivity and the rain-rate estimates. |
| Morita et al. [101] | Jan. 1998 to Jul. 2001 | 0–240°E and 20°N–20°S | 2A25 (version5) | SLH |
| Schumacher et al. [97] | 1998–2000 | tropics | 2A23 and 2A25 (version5) | similar to CSH but used rain types in 2A23 |
| Tao et al. [95] | Feb. 1998 | tropics | 2A25 | CSH |
| Wang and Huang [99] | 1998–2010 | South China Sea | CSH (version6) | CSH |
| Zhang, C. et al. [102]; Ling and Zhang [103] | 1998–2007 | 15°N–15°S. | 2A25 and 3G68 | CSH, SLH, PRH and TRN |
| Zuluaga et al. [100] | 1998–2006 | South Asia monsoon region | CSH | CSH |
Table 8.
Key information of the studies on vertical structure of rainfall from PR data.
| Reference | Period | Location | Products (Version) of PR |
|---|---|---|---|
| Berg et al. [114] | Dec. 1999 to Feb. 2000 | East and west Pacific | 2A25 (version5) |
| Cao et al. [119] | Jan. 2000 to Oct. 2011 | southern California, Arizona, and western New Mexico | 2A23 and 2A25 (version7) |
| Cao and Qi [117] | Dec. 1997 to Aug. 2012 | Huaihe River Basin (HRB) of China | 2A23 and 2A25 (version7) |
| Fu et al. [105] | 1998–2007 | Asia | 2A25 |
| Fu et al. [106] | 1998–2007 | Asia | 2A25 |
| Fuentes et al. [108] | Jun. to Sep. of 1998–2004 | West Africa | 2A25 (version6) |
| Geerts and Dejene [115] | 1998–2002 | Africa and Amazon | 2A25 |
| Guy and Rutledge [110] | 1998–2010 | West Africa | 2A25 |
| Hamada et al. [118] | Sep. 2001 to Aug. 2012 | tropics | 2A25 (version7) |
| Hu et al. [113] | 1998–2007 | Southeast Asia | 2A25 (version6) |
| Liu et al. [109] | 1998–2006 | tropics | the University of Utah precipitation feature database |
| Saikranthi et al. [107] | 1998–2012 | India and adjoining oceans | 2A23 and 2A25 (version7) |
| Short and Nakamura [116] | Jun. to Aug. 1998; Dec. 1997 to Feb. 1998 | tropics | 3A25 (version4) |
| Xu and Zipser [112] | 1998–2010 | tropics | 2A25 (version6) |
Table 9.
Key information of the studies on diurnal variation of rainfall from PR data.
| Reference | Period | Location | Products (Version) of PR |
|---|---|---|---|
| Bowman et al. [122] | Dec. 1997 to Mar. 2004 | tropics | 3G68 (version5) |
| Fu et al. [106] | Jun. to Aug. of 1998–2007 | Asia | 2A25 |
| Hu et al. [128] | 1998–2006 | Tibetan Plateau and surrounding regions | 2A25 (version6) |
| Ichikawa and Yasunari [132] | 1998–2002 | Borneo area | 2A23 and 2A25 (version5) |
| Kikuchi and Wang [126] | 1998–2006 | tropics | 3G68 |
| Liu and Zipser [127] | 1998–2006 | tropics | the University of Utah precipitation feature database |
| Liu and Fu [131] | Jun. to Aug. of 1998–2007 | southern China | 2A25 (version6) |
| Mori et al. [121] | 1998–2000 | Indonesian Maritime Continent | 3G68 |
| Nesbitt and Zipser [120] | Dec. 1997 to Nov. 2000 | tropics | 2A23 and 2A25 (version5) |
| Rientjesa et al. [130] | 2002–2008 | Upper Blue Nile basin | 2A25 |
| Sanderson et al. [123] | 1998–2000 | tropics | 3G68 (version5) |
| Wu et al. [129] | 1998–2009 | Asian monsoon region | the University of Utah precipitation feature database |
| Yang and Smith [124] | 1998 | tropics | 2A25 and 2B31 (version6) |
| Yang and Smith [125] | 1998–2005 | tropics | 2A25 and 2B31 (version6) |
Table 10.
Key information of the studies on climate characteristics of rainfall from PR data.
| Reference | Period | Location | Products (Version) of PR |
|---|---|---|---|
| Choudhury et al. [158] | 1998–2012 | northeastern regions of India along with the adjoining area | 3B42 (version7) |
| Fritz et al. [139] | 1998–2010 | tropical Atlantic | 2A25 (version7) |
| Hamada et al. [156] | Sep. 2001 to Aug. 2012 | tropics | 2A25 (version7) |
| Heiblum et al. [148] | Nov. to Mar. of 1998–2011 | East Mediterranean | 2A25 (version7) |
| Hirose et al. [157] | 1998–2013 | tropics | 2A25 (version7) |
| Houze et al. [143] | 1998–2013 | tropics | 2A23 and 2A25 |
| Hu et al. [135] | 1998–2007 | tropical and subtropical monsoon regions of East Asia | 2A25 |
| Kumar [111] | 2001–2010 | India | 2A25 (version6) |
| Kumar [144] | 2001–2010 | India | 2A25 (version6) |
| Li et al. [136] | Apr. to Jun. of 1998–2006 | South China Sea | 2A25 |
| Liu and Zipser [142] | 1998–2003 | tropics | the University of Utah precipitation feature database |
| Liu and Zipser [154] | 1998–2006 | tropics | the University of Utah precipitation feature database |
| Mehta and Yang [146] | Jan. 1998 to Jul. 2007 | the Mediterranean Region | 3B42 and 2A25 |
| Nastos et al. [147] | 2000–2011 | the Mediterranean basin | 3B42 |
| Nesbitt et al. [155] | 1998–2000 | tropics | the University of Utah precipitation feature database (version6) |
| Olurotimi et al. [152] | 2011–2015 | South Africa | 2A23 (version7) |
| Petersen et al. [145] | Dec. to Mar. of 1997–2000 | Amazon basin and subtropical South America | 2A25 |
| Pokhrel and Sikka [134] | Jun. to Sep. of 1998–2010 | Indian summer monsoon region | 3A25 (version6) |
| Rapp et al. [150] | 1998–2012 | Costa Rica | the University of Utah precipitation feature database |
| Schumacher and Houze [153] | 1998–2000 | tropics | 2A23 and 2A25 (version5) |
| Tao et al. [140] | 1998–2013 | tropics | the TRMM tropical cyclone precipitation feature (TCPF) |
| Wall et al. [137] | Jul. and Aug. of 1998–2010 | Southwestern United States | the University of Utah precipitation feature database |
| Yang et al. [141] | 1998–2013 | Northwest Pacific | the TRMM tropical cyclone precipitation feature (TCPF) |
| Yokoyama and Takayabu [138] | Dec. 1997 to Dec. 2003 | tropics | 2A25 (version5) |
| Yokoyama et al. [151] | Jun.and Jul. of 1998–2011 | Japan | 2A25 (version7) |
| Zhou et al. [149] | 1998–2011 | tropics | the University of Utah precipitation feature database (version7) |
© 2019 by the authors. Licensee MDPI, Basel, Switzerland. This article is an open access article distributed under the terms and conditions of the Creative Commons Attribution (CC BY) license (http://creativecommons.org/licenses/by/4.0/).
Share and Cite
MDPI and ACS Style
Li, N.; Wang, Z.; Chen, X.; Austin, G. Studies of General Precipitation Features with TRMM PR Data: An Extensive Overview. Remote Sens. 2019, 11, 80. https://doi.org/10.3390/rs11010080
AMA Style
Li N, Wang Z, Chen X, Austin G. Studies of General Precipitation Features with TRMM PR Data: An Extensive Overview. Remote Sensing. 2019; 11(1):80. https://doi.org/10.3390/rs11010080
Chicago/Turabian StyleLi, Nan, Zhenhui Wang, Xi Chen, and Geoffrey Austin. 2019. "Studies of General Precipitation Features with TRMM PR Data: An Extensive Overview" Remote Sensing 11, no. 1: 80. https://doi.org/10.3390/rs11010080
Note that from the first issue of 2016, this journal uses article numbers instead of page numbers. See further details here.