The Potential of Reflectance and Laser Induced Luminescence Spectroscopy for Near-Field Rare Earth Element Detection in Mineral Exploration

 , ,
, , 
Abstract
:1. Introduction
2. Previous Studies of REE Spectroscopy
2.1. NIR-SWIR Reflectance Spectroscopy
2.2. Laser Induced NIR Luminescence Spectroscopy
3. Materials and Methods
3.1. Analysed Samples & Mineral Chemistry
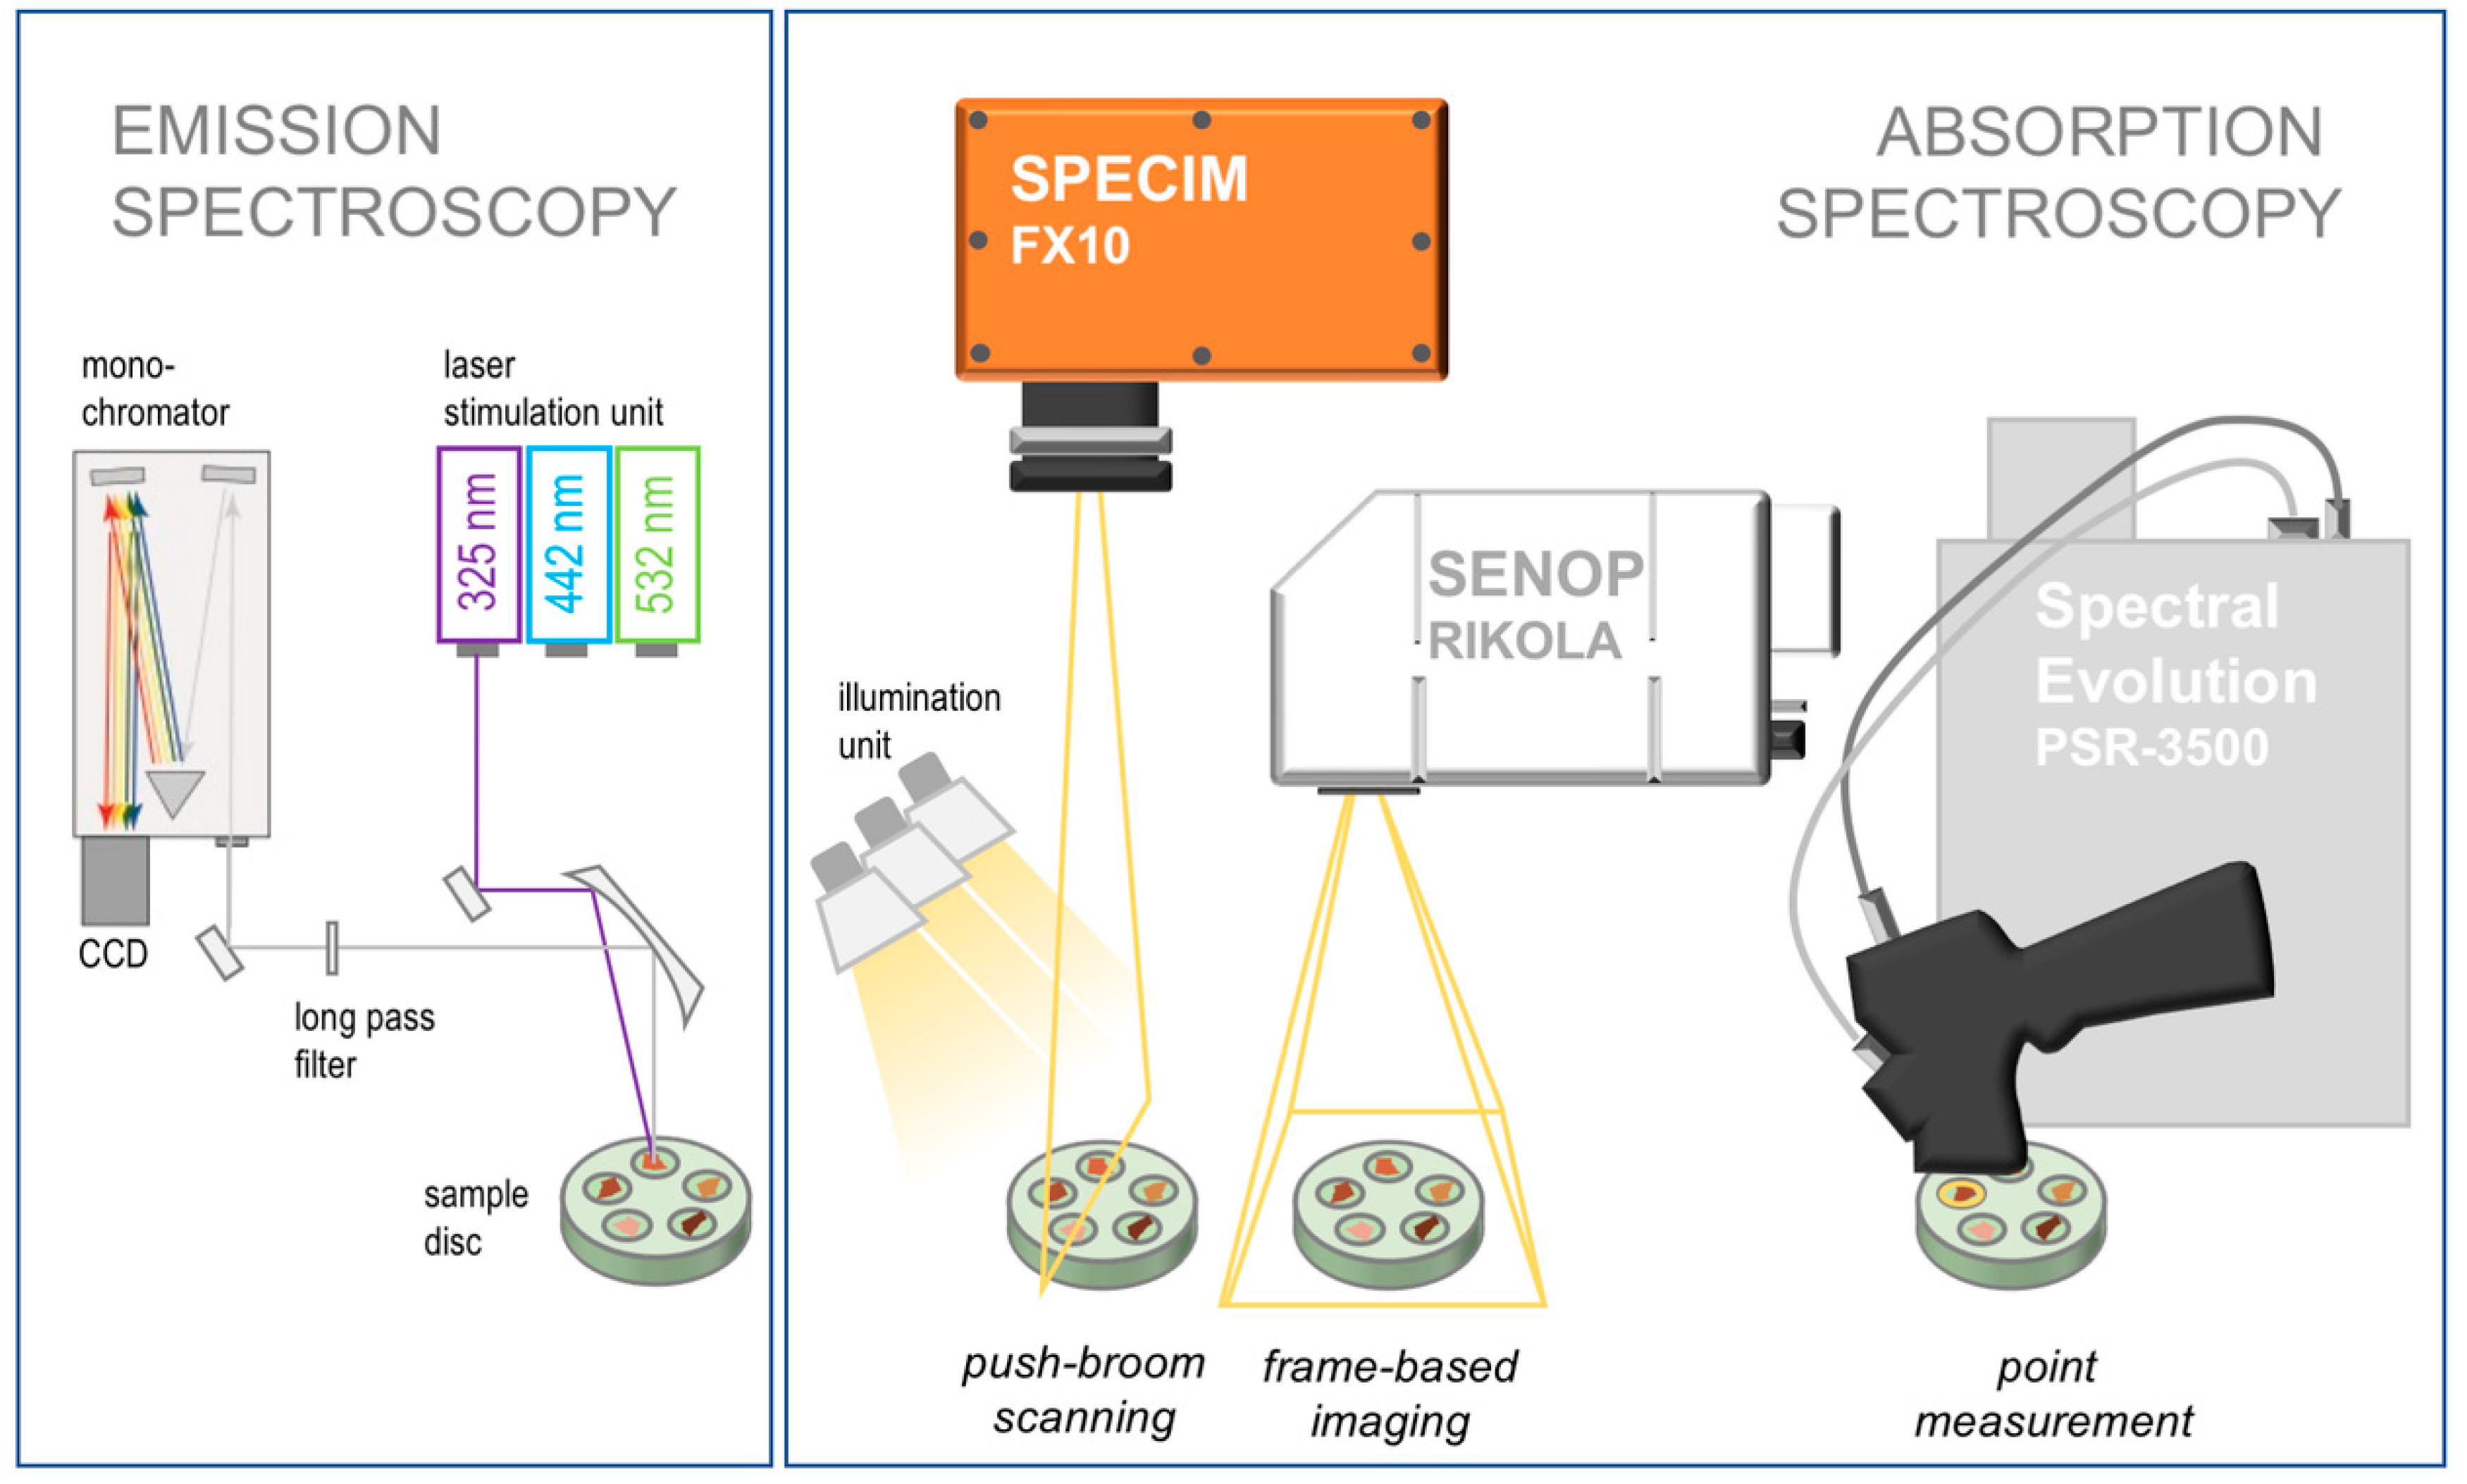
3.2. Reflectance Spectroscopy—Technical Setup and Implementation
3.3. PL Spectroscopy—Technical Setup & Implementation
4. Results
4.1. Reflectance Spectroscopy
4.2. PL Spectroscopy
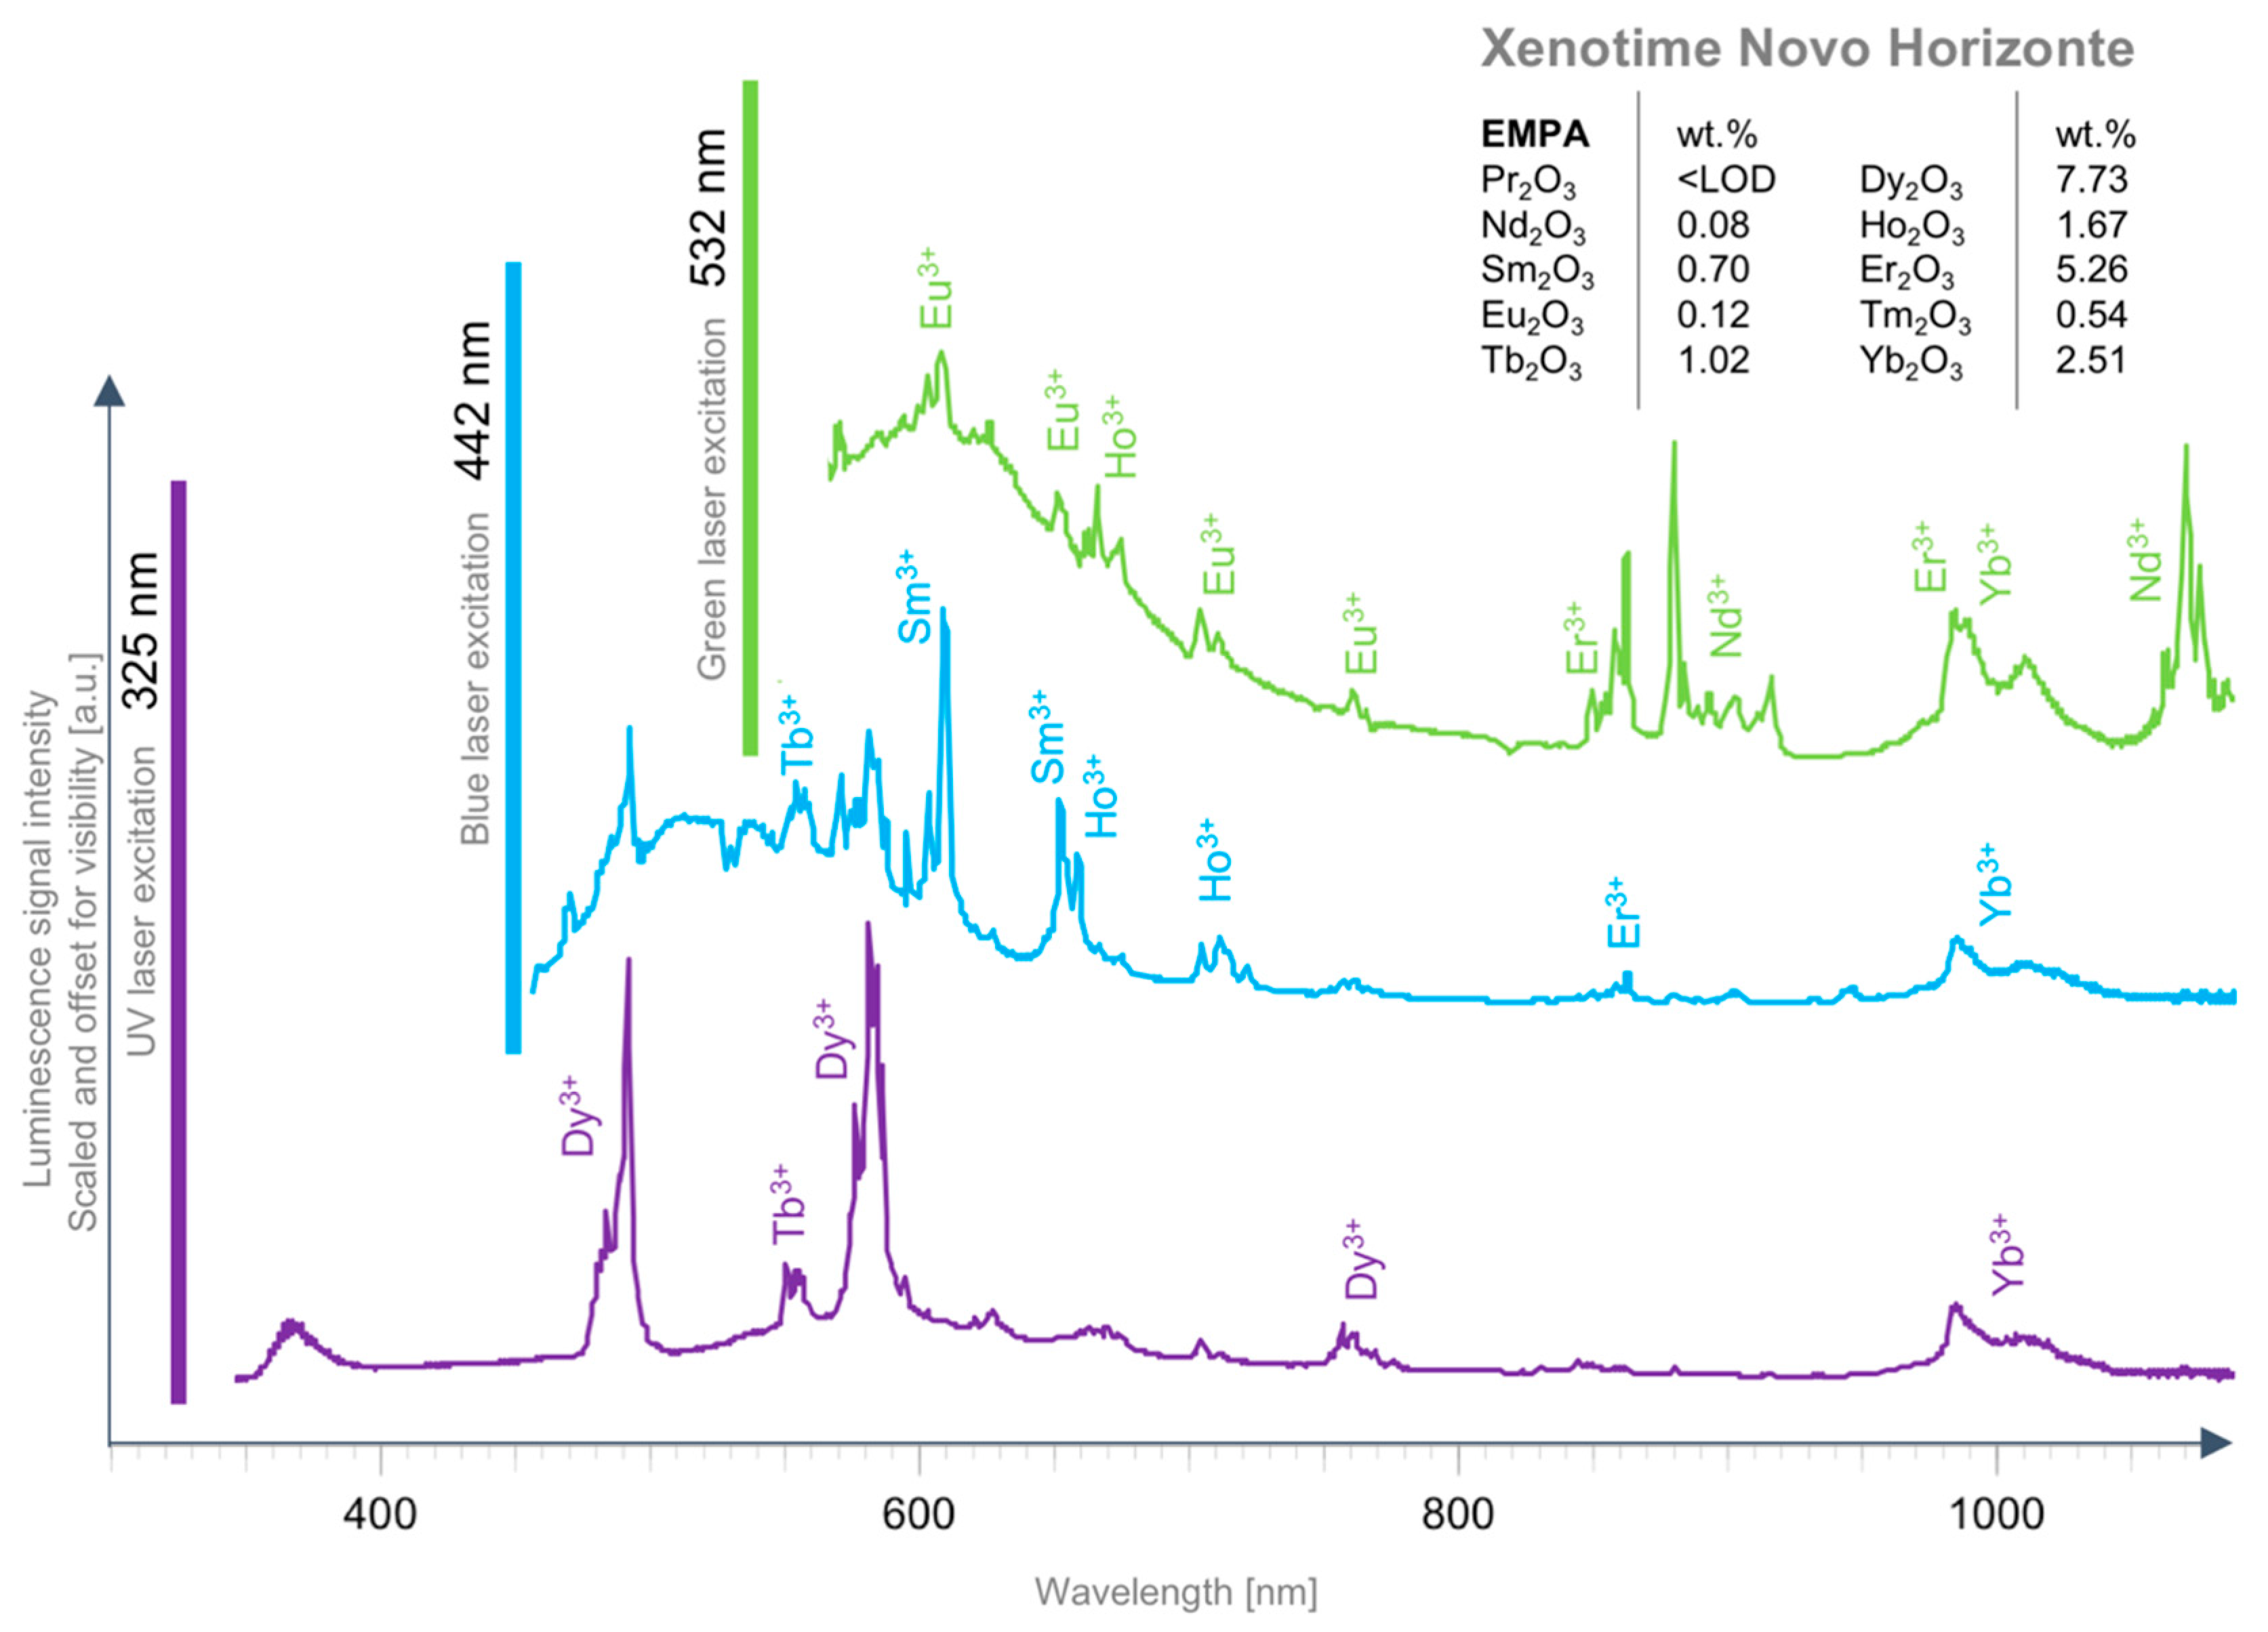
4.2.1. Influence of the Excitation Wavelength
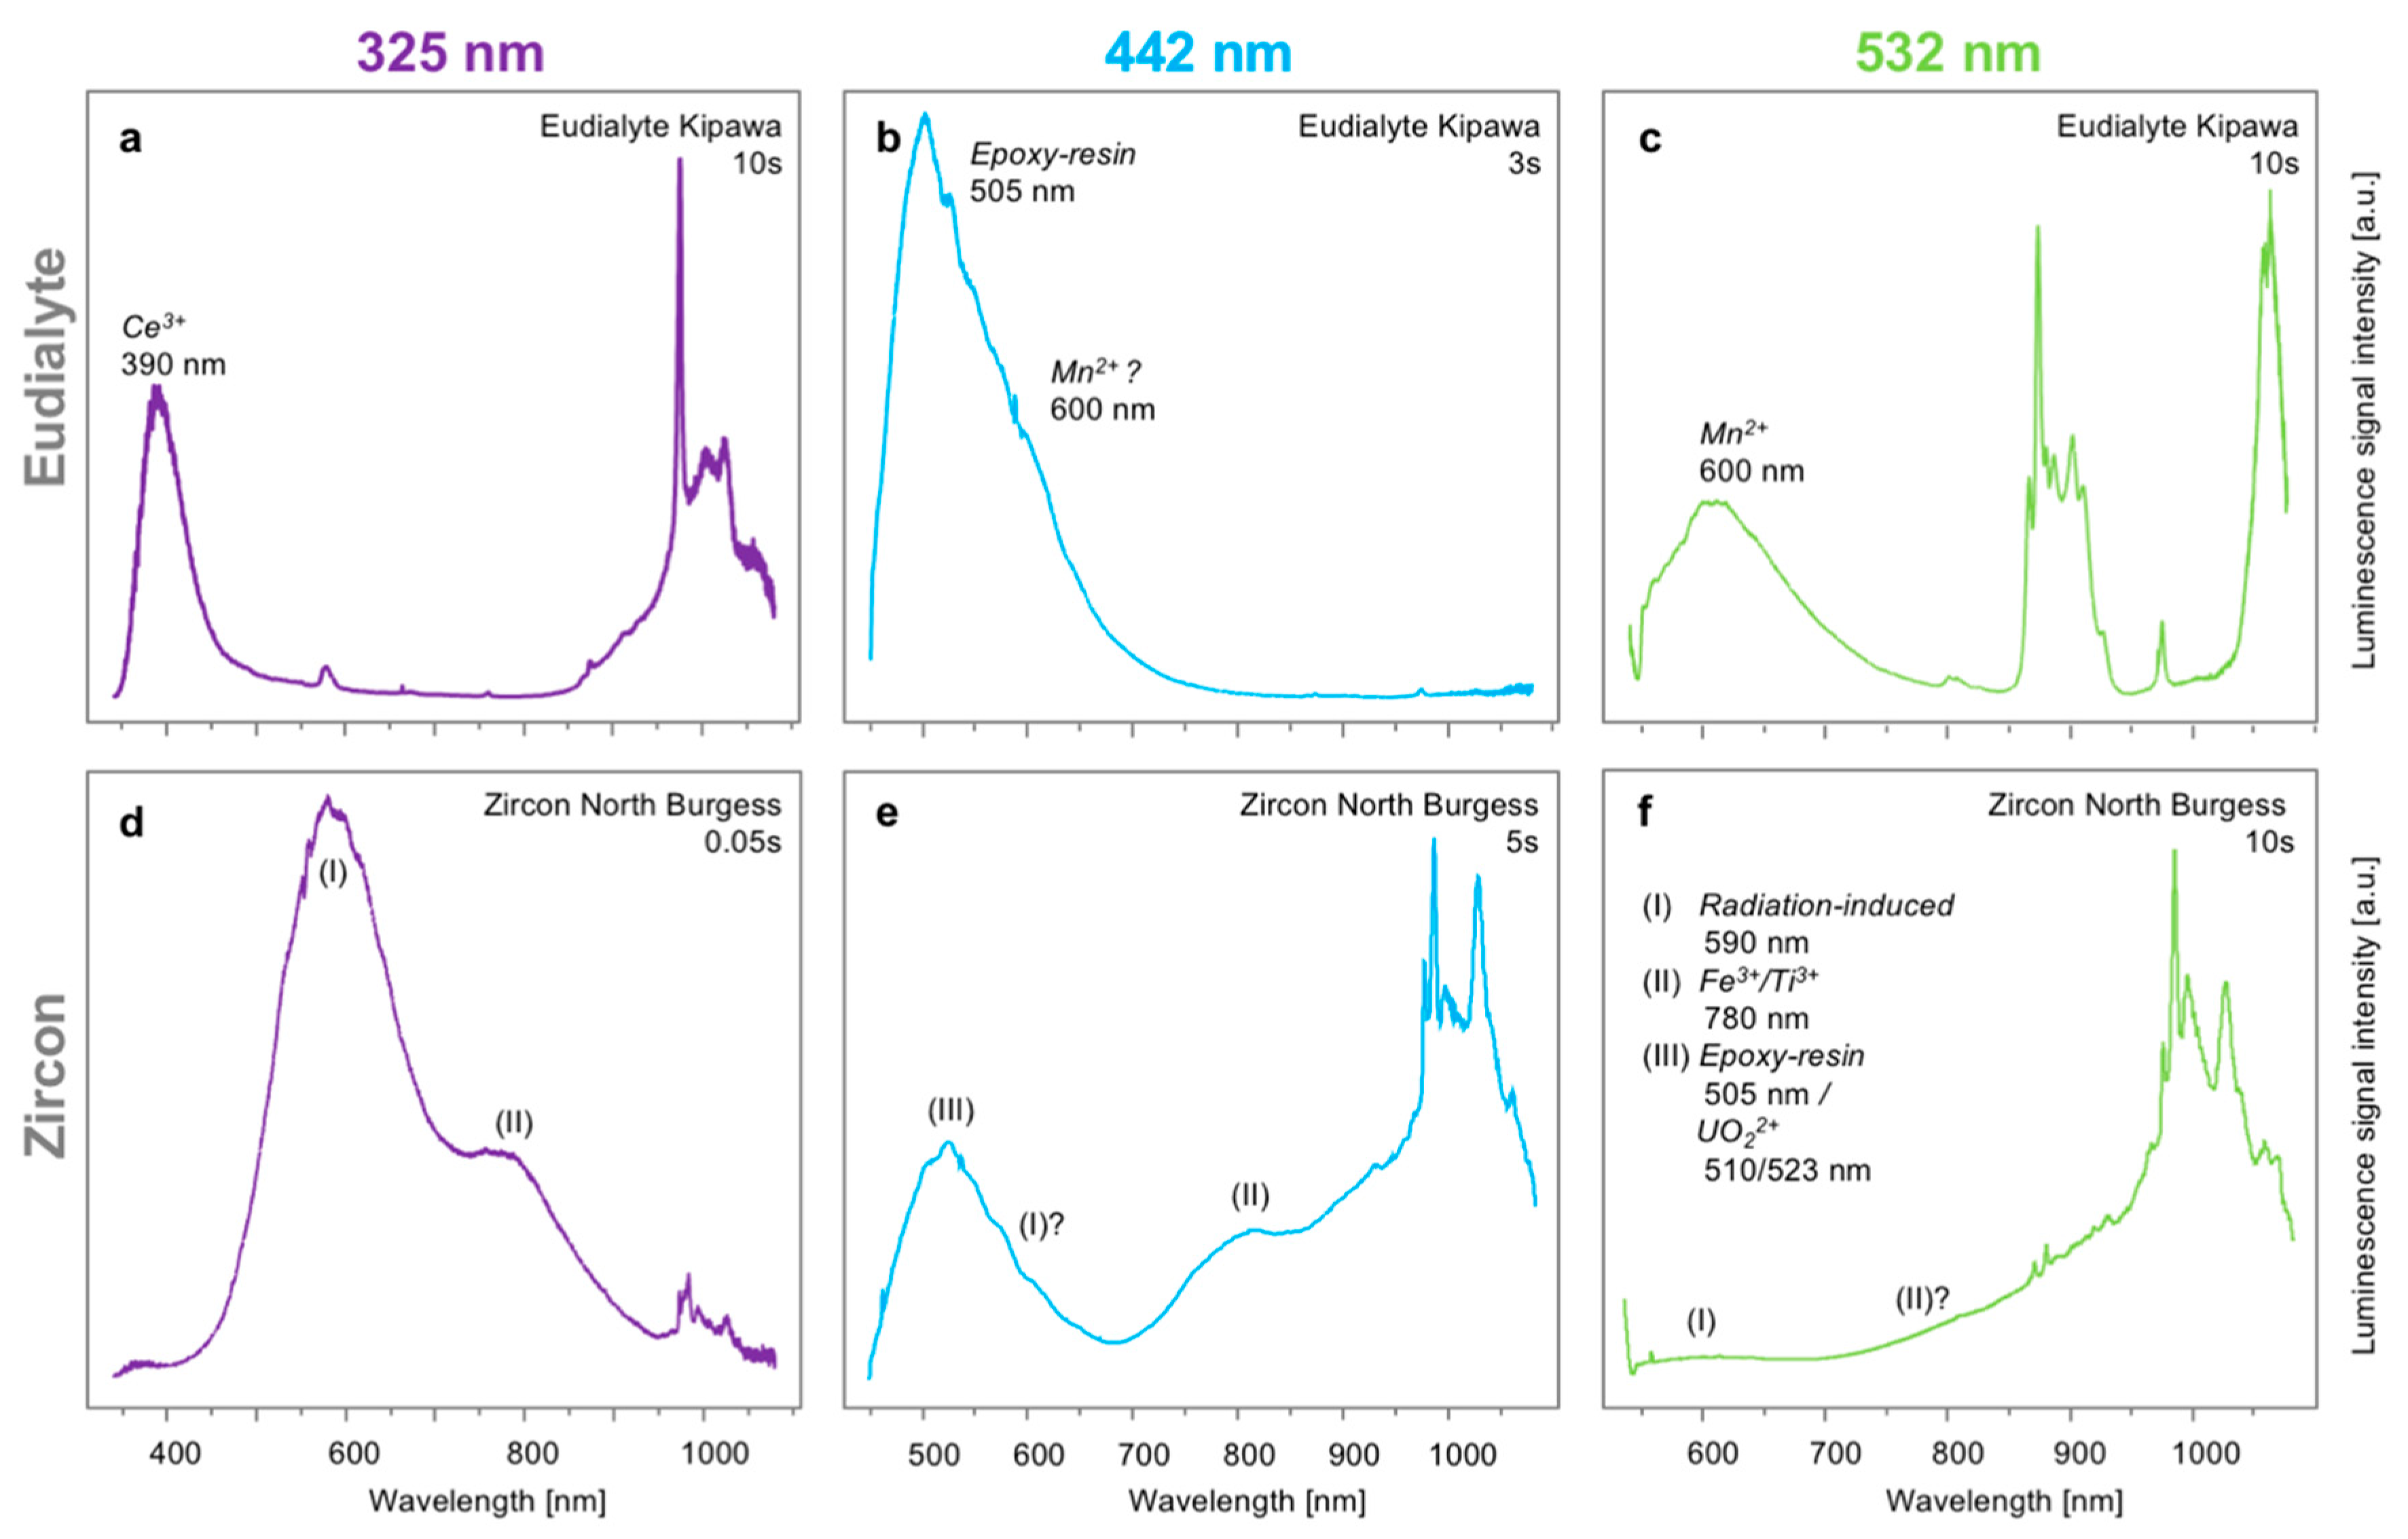
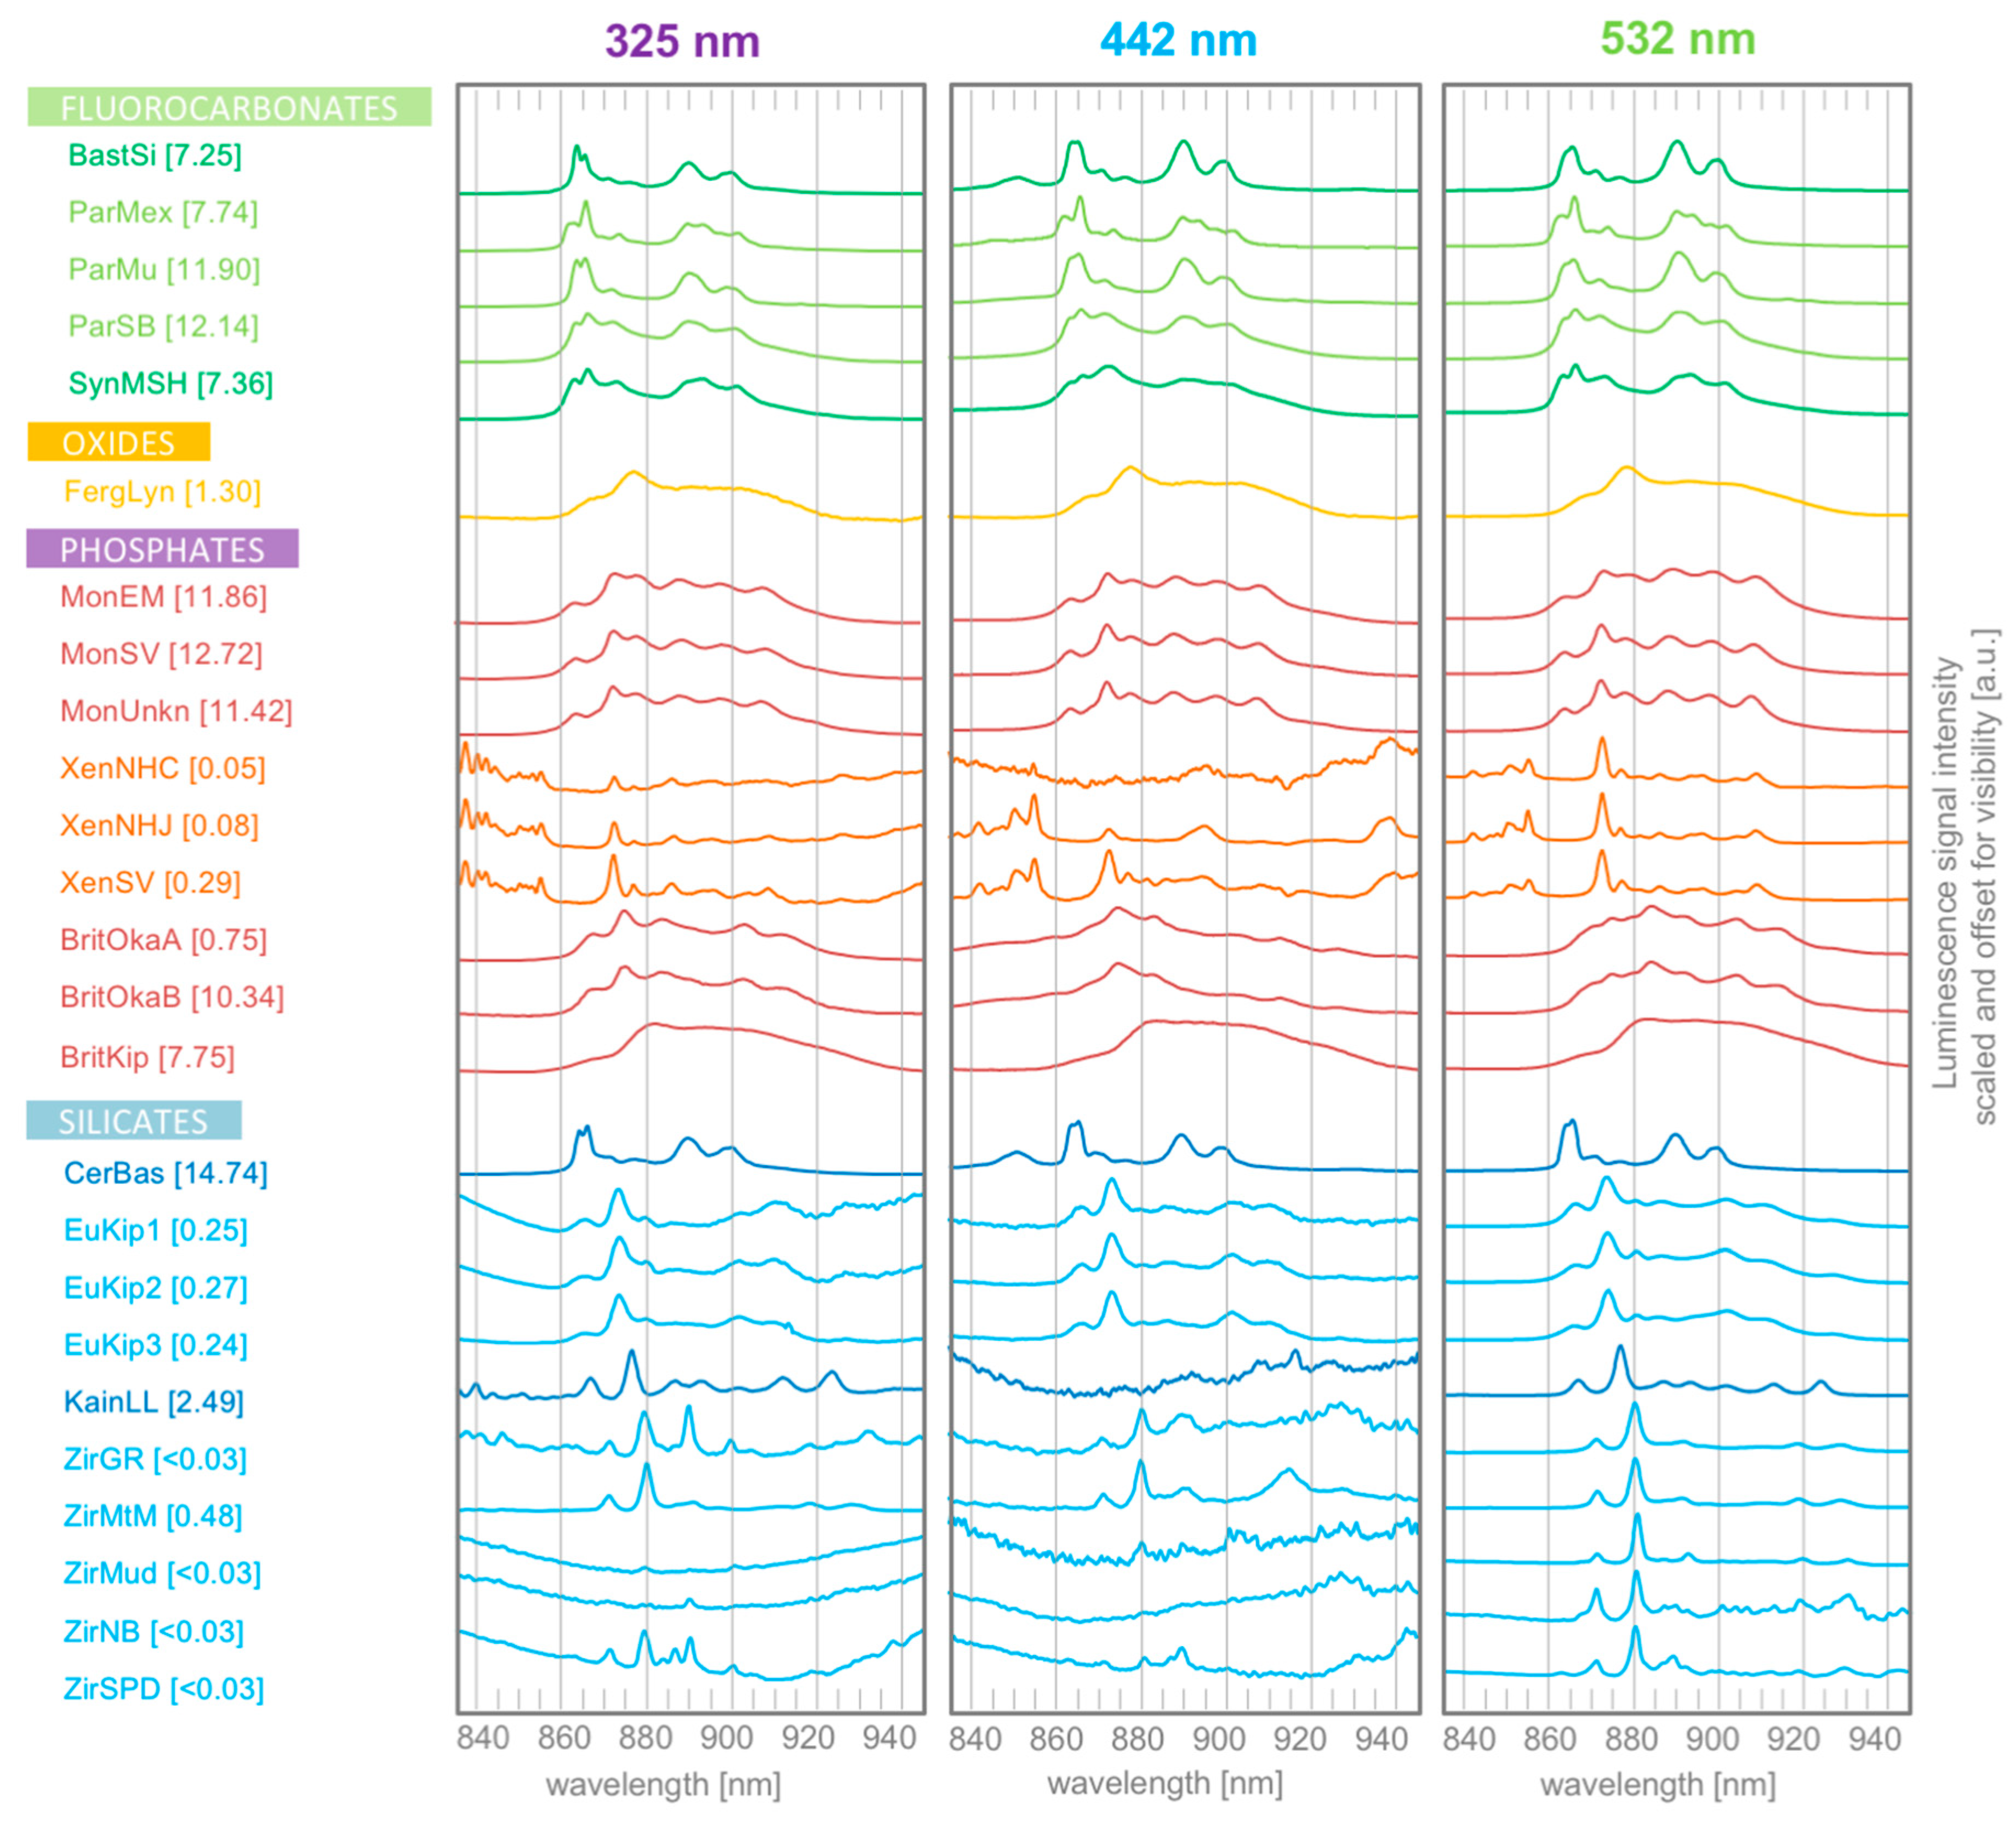
4.2.2. Influence of the Mineral Type
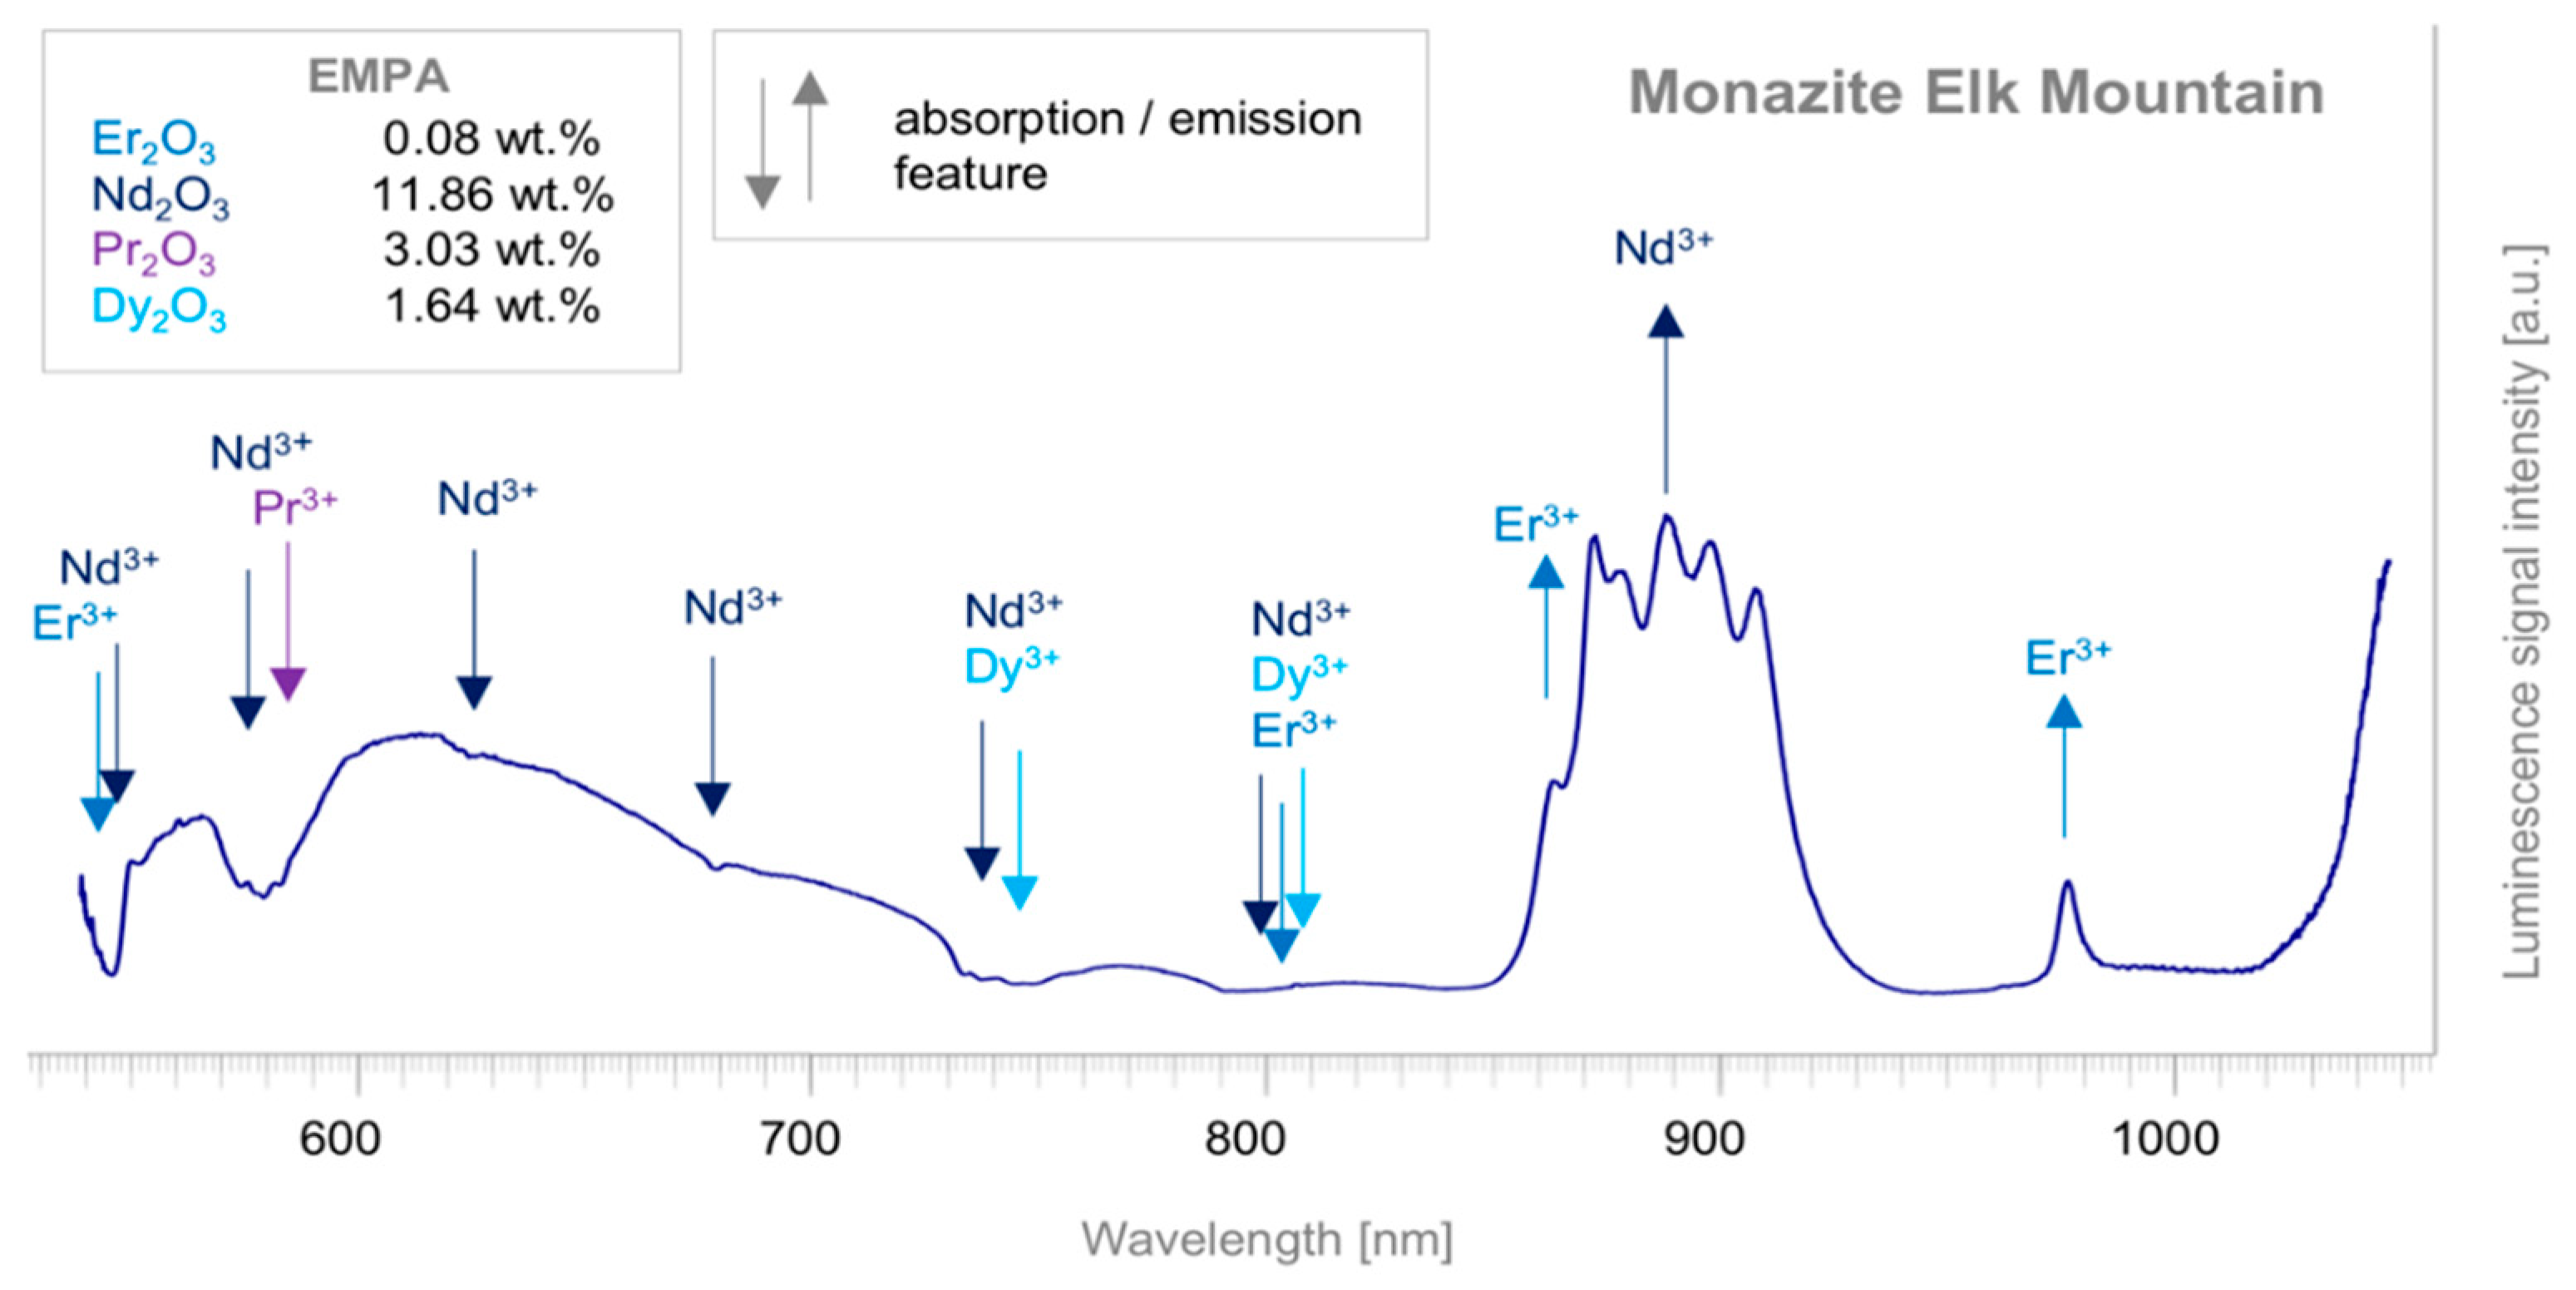
4.2.3. REE Absorption Effects in PL Spectra
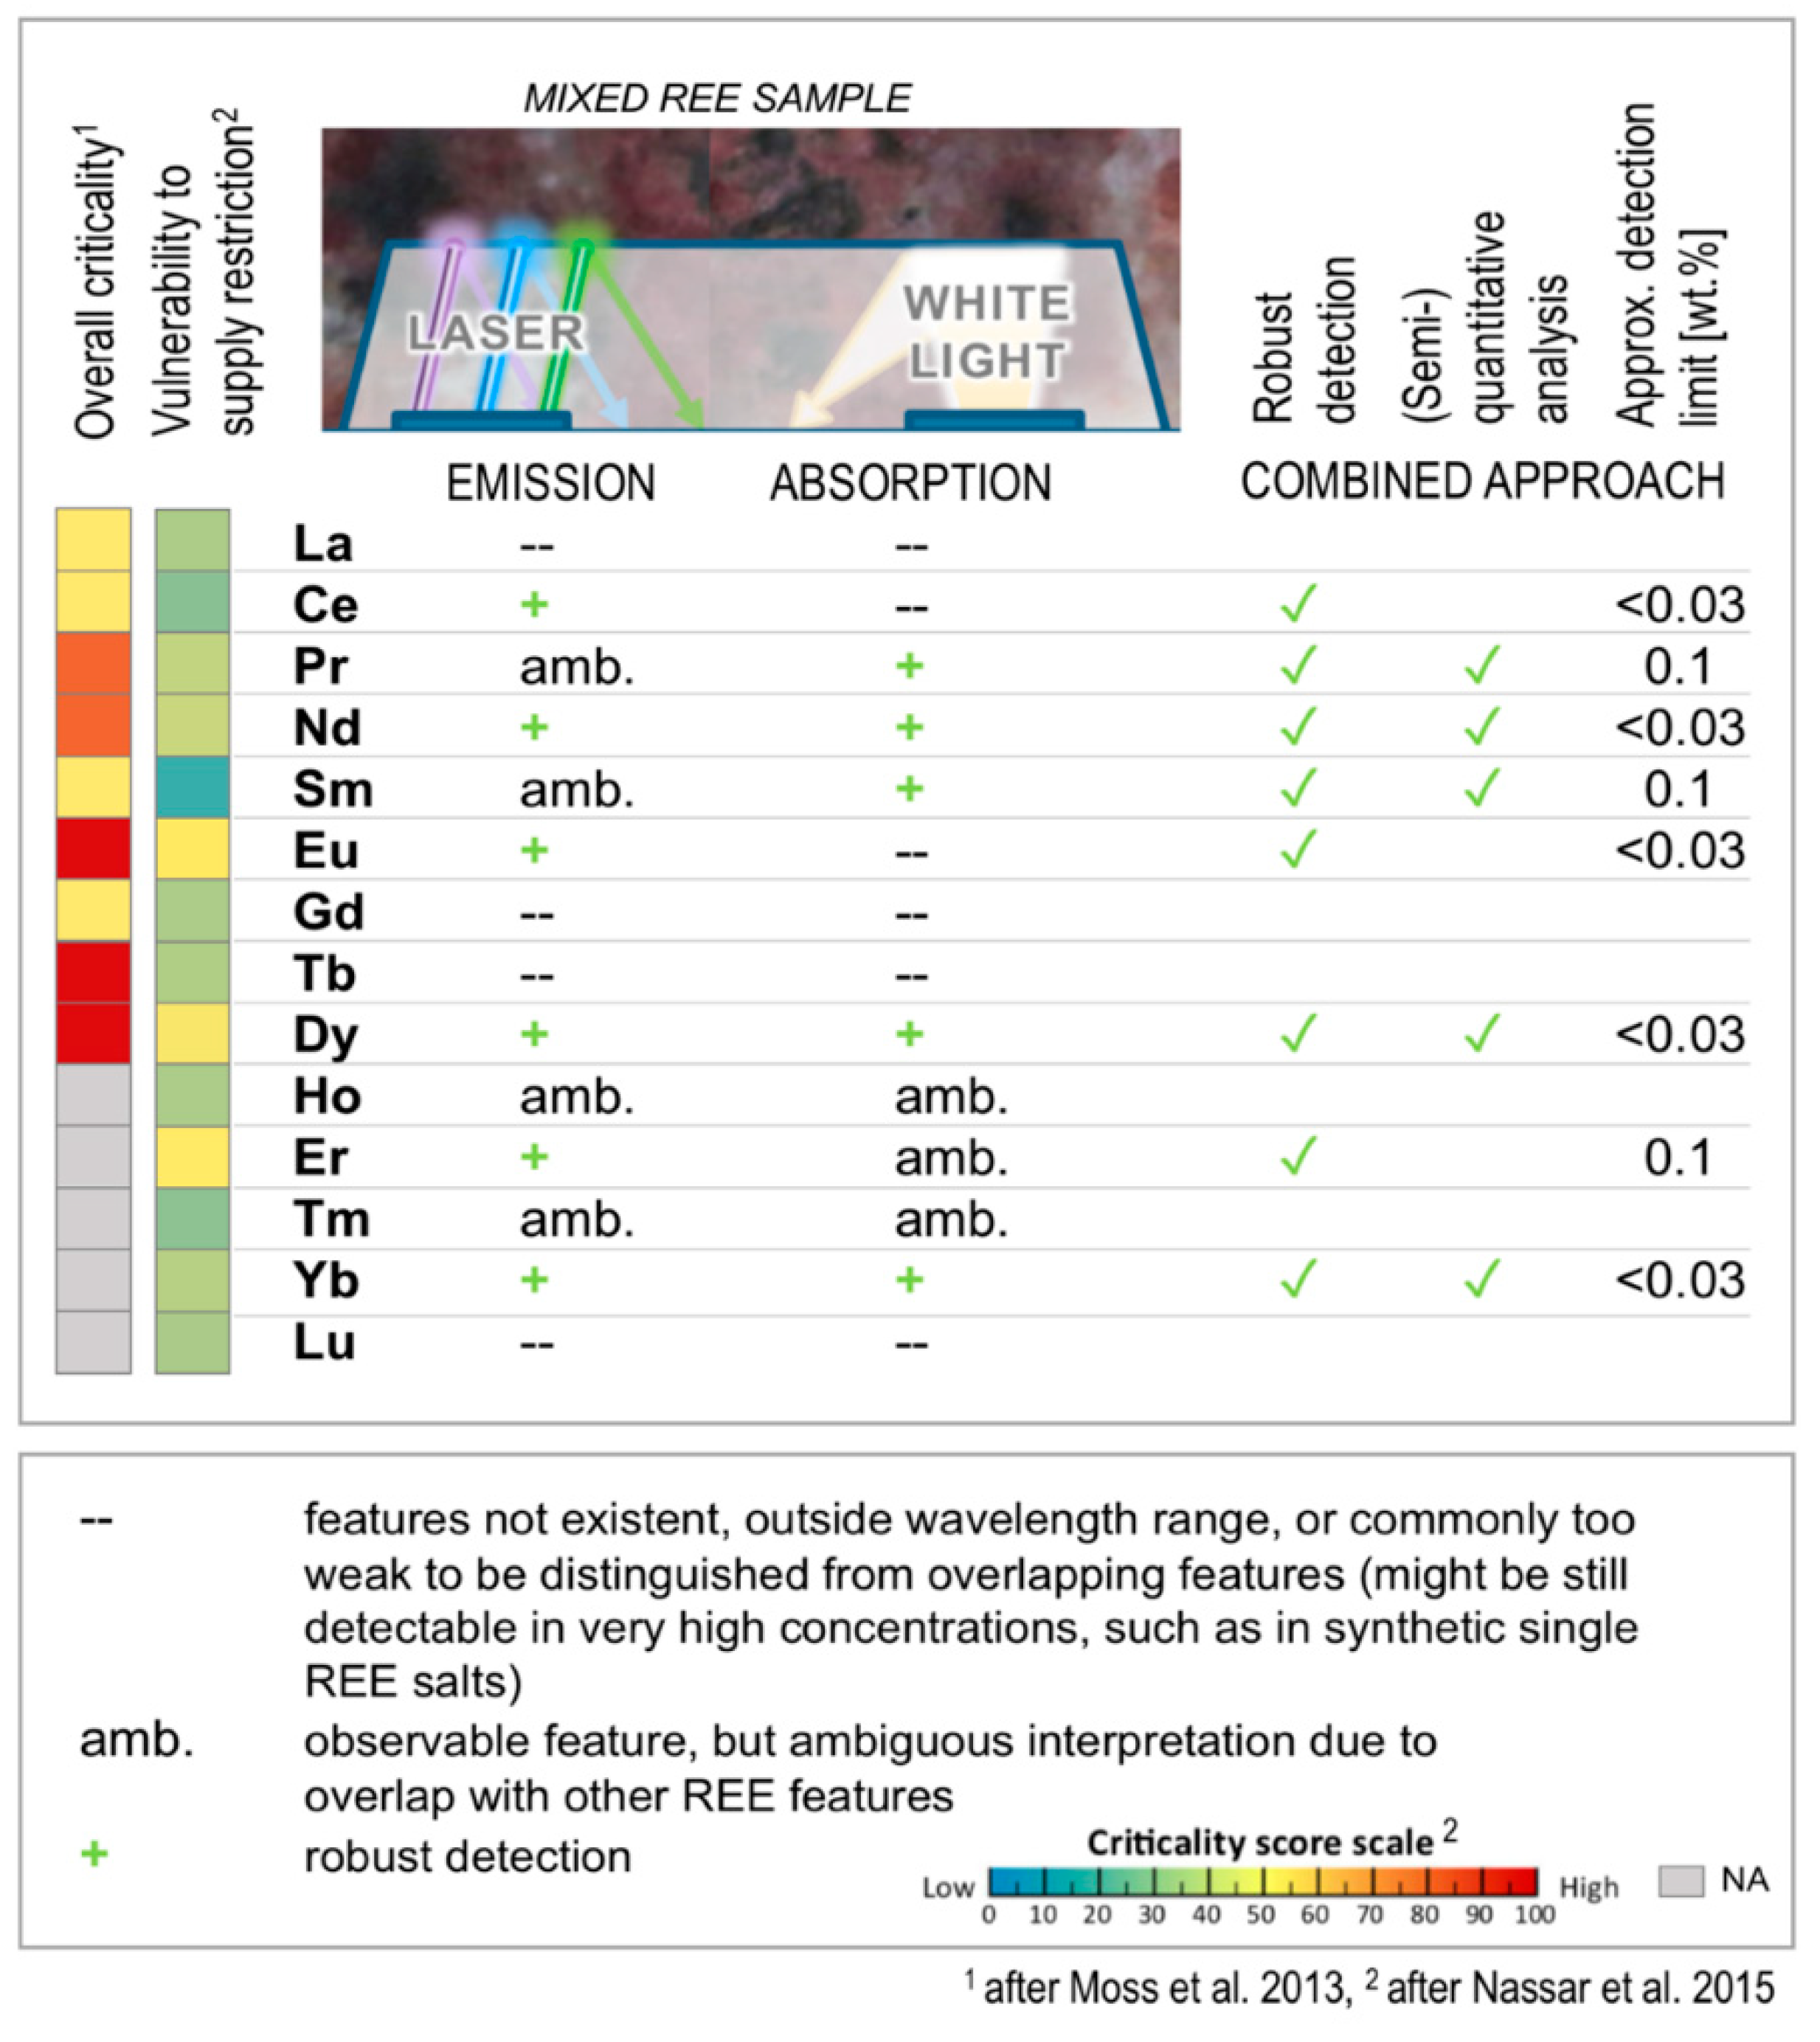
5. Discussion and Cross-Method Considerations
5.1. Qualitative REE Detection
5.2. Quantitative REE Detection and Detection Limits
5.3. Considerations on the Measurement Setup
5.3.1. Spatial Data Integration
5.3.2. Excitation Wavelength
5.3.3. Sample Size and Spatial Resolution
5.3.4. Sensor Calibration
6. Conclusions
Author Contributions
Funding
Acknowledgments
Conflicts of Interest
References
- European Commission. Communication from the Commission to the European Parliament, the Council, the European Economic and Social Committee and the Committee of the Regions; On the Review of the List of Critical Raw Materials for the EU and the Implementation of the Raw Materials Initiative; European Commission: Brussels, Belgium, 2014. [Google Scholar]
- European Commission. Communication from the Commission to the European Parliament, the Council, the European Economic and Social Committee and the Committee of the Regions on the 2017 List of Critical Raw Materials for the EU; European Commission: Brussels, Belgium, 2017. [Google Scholar]
- Bauer, D.; Diamond, D.; Li, J.; Sandalow, D.; Telleen, P.; Wanner, B. Critical Materials Strategy; U.S. Department of Energy: Washington, DC, USA, 2010; p. 166.
- Moss, R.; Tzimas, E.; Willis, P.; Arendorf, J.; Thompson, P.; Chapman, A.; Morley, N.; Sims, E.; Bryson, R.; Peason, J.; et al. Critical Metals in the Path towards the Decarbonisation of the EU Energy Sector: Assessing Rare Metals as Supply-Chain Bottlenecks in Low-Carbon Energy Technologies; European Commission: Brussels, Belgium, 2013; p. 242. [Google Scholar]
- Guyonnet, D.; Planchon, M.; Rollat, A.; Escalon, V.; Tuduri, J.; Charles, N.; Vaxelaire, S.; Dubois, D.; Fargier, H. Material flow analysis applied to rare earth elements in Europe. J. Clean. Prod. 2015, 107, 215–228. [Google Scholar] [CrossRef] [Green Version]
- Nassar, N.T.; Du, X.; Graedel, T.E. Criticality of the Rare Earth Elements. J. Ind. Ecol. 2015, 19, 1044–1054. [Google Scholar] [CrossRef]
- Rajendran, S.; Nasir, S.; Kusky, T.M.; Ghulam, A.; Gabr, S.; El-Ghali, M.A.K. Detection of hydrothermal mineralized zones associated with listwaenites in Central Oman using ASTER data. Ore Geol. Rev. 2013, 53, 470–488. [Google Scholar] [CrossRef]
- Zimmermann, R.; Brandmeier, M.; Andreani, L.; Mhopjeni, K.; Gloaguen, R. Remote Sensing Exploration of Nb-Ta-LREE-Enriched Carbonatite (Epembe/Namibia). Remote Sens. 2016, 8, 620. [Google Scholar] [CrossRef]
- Shavers, E.J.; Ghulam, A.; Encarnacion, J. Surface alteration of a melilitite-clan carbonatite and the potential for remote carbonatite detection. Ore Geol. Rev. 2018, 92, 19–28. [Google Scholar] [CrossRef]
- Turner, D.; Rivard, B.; Groat, L.A. Visible to shortwave infrared reflectance spectroscopy of rare earth element minerals. In British Columbia Geological Survey Paper; Simandl, G.J., Neetz, M., Eds.; British Columbia Ministry of Energy and Mines: Victoria, BC, USA, 2015; Volume 3, pp. 219–229. [Google Scholar]
- Friis, H. Luminescence Spectroscopy of Natural and Synthetic REE-bearing Minerals. Ph.D. Thesis, University of St. Andrews, St. Andrews, UK, 2009. [Google Scholar]
- Adams, J.W. The visible region absorption spectra of rare earth minerals. Am. Mineral. 1965, 50, 356–366. [Google Scholar]
- Dieke, G.H.; Crosswhite, H.M. The Spectra of the Doubly and Triply Ionized Rare Earths. Appl. Opt. 1963, 2, 675–686. [Google Scholar] [CrossRef]
- Jassie, L.B. Diffuse reflectance spectra of ten rare earths. Spectrochim. Acta 1964, 20, 169–177. [Google Scholar] [CrossRef]
- White, W.B. Diffuse-Reflectance Spectra of Rare-Earth Oxides. Appl. Spectrosc. 1967, 21, 167–171. [Google Scholar] [CrossRef]
- Ropp, R.C. Phosphors Based on Rare Earth Phosphates: II. Reflection Spectra of Rare Earth Phosphates. J. Electrochem. Soc. 1969, 116, 623–629. [Google Scholar] [CrossRef]
- Weidner, V.R.; Barnes, P.Y.; Eckerle, K.L. A wavelength standard for the near infrared based on the reflectance of rare-earth oxides. J. Res. Natl. Bur. Stand. 1986, 91, 243. [Google Scholar] [CrossRef]
- Rowan, L.C.; Kingston, M.J.; Crowley, J.K. Spectral reflectance of carbonatites and related alkalic igneous rocks; selected samples from four North American localities. Econ. Geol. 1986, 81, 857–871. [Google Scholar] [CrossRef]
- Turner, D. Reflectance spectroscopy and imaging spectroscopy of rare earth element-bearing mineral and rock samples. Ph.D. Thesis, University of British Columbia, Vancouver, BC, USA, 2015. [Google Scholar]
- Turner, D.J.; Rivard, B.; Groat, L.A. Visible and short-wave infrared reflectance spectroscopy of REE fluorocarbonates. Am. Mineral. 2014, 99, 1335–1346. [Google Scholar] [CrossRef]
- Turner, D.J.; Rivard, B.; Groat, L.A. Visible and short-wave infrared reflectance spectroscopy of selected REE-bearing silicate minerals. Am. Mineral. 2018, 103, 927–943. [Google Scholar] [CrossRef]
- Huntington, J.; Laukamp, C. Drill Core Reflectance Spectroscopy applied to the Carbonatite hosted REE deposit at Cummins Range (Australia). In Proceedings of the 13th SGA Biennal Meeting, Nancy, France, 24–27 August 2015; Volume 3, pp. 1017–1020. [Google Scholar]
- Turner, D.; Rivard, B.; Groat, L. Rare earth element ore grade estimation of mineralized drill core from hyperspectral imaging spectroscopy. In Proceedings of the 2014 IEEE Geoscience and Remote Sensing Symposium, Quebec City, QC, Canada, 13–18 July 2014; IEEE: Quebec City, QC, Canada, 2014; pp. 4612–4615. [Google Scholar]
- Bösche, N.K.; Rogaß, C.; Mielke, C.; Kaufmann, H. Hyperspectral digital image analysis and geochemical analysis of a rare earth elements mineralized intrusive complex (fen carbonatite complex in Telemarkregion, Norway). In Proceedings of the EARSeL 34th Symposium, Warsaw, Poland, 16–20 June 2014; Volume 13, pp. 1–6. [Google Scholar]
- Rowan, L.C.; Mars, J.C. Lithologic mapping in the Mountain Pass, California area using Advanced Spaceborne Thermal Emission and Reflection Radiometer (ASTER) data. Remote Sens. Environ. 2003, 84, 350–366. [Google Scholar] [CrossRef]
- Neave, D.A.; Black, M.; Riley, T.R.; Gibson, S.A.; Ferrier, G.; Wall, F.; Broom-Fendley, S. On the Feasibility of Imaging Carbonatite-Hosted Rare Earth Element Deposits Using Remote Sensing. Econ. Geol. 2016, 111, 641–665. [Google Scholar] [CrossRef] [Green Version]
- McDowell, M.L.; Kruse, F.A. Integrated visible to near infrared, short wave infrared and long wave infrared spectral analysis for surface composition mapping near Mountain Pass, California. In Proceedings of the Algorithms and Technologies for Multispectral and Ultraspectral Imagery XXI, Baltimore, MD, USA, 20–24 April 2015; Velez-Reyes, M., Kruse, F.A., Eds.; p. 94721C. [Google Scholar]
- Booysen, R.; Zimmermann, R.; Lorenz, S.; Gloaguen, R.; Nex, P.A.M. Multi-source hyperspectral imaging of carbonatite-hosted REE-Nb- Ta mineralization at Marinkas Quellen, Namibia. In Proceedings of the 9th IEEE Whispers Conference—Hyperspectral Image and Signal Processing Workshop, Amsterdam, The Netherlands, 23–26 September 2018. [Google Scholar]
- Lüthi, B. Crystal field effects in rare earth systems. J. Magn. Magn. Mater. 1980, 15–18, 1–8. [Google Scholar] [CrossRef]
- Lenz, C.; Talla, D.; Ruschel, K.; Škoda, R.; Götze, J.; Nasdala, L. Factors affecting the Nd3+ (REE3+) luminescence of minerals. Mineral. Petrol. 2013, 107, 415–428. [Google Scholar] [CrossRef] [Green Version]
- Gaft, M.; Shoval, S.; Panczer, G.; Nathan, Y.; Champagnon, B.; Garapon, C. Luminescence of uranium and rare-earth elements in apatite of fossil fish teeth. Palaeogeogr. Palaeoclimatol. Palaeoecol. 1996, 126, 187–193. [Google Scholar] [CrossRef]
- Gaft, M.; Reisfeld, R.; Panczer, G.; Blank, P.; Boulon, G. Laser-induced time-resolved luminescence of minerals. Spectrochim. Acta A Mol. Biomol. Spectrosc. 1998, 54, 2163–2175. [Google Scholar] [CrossRef]
- Gaft, M.; Reisfeld, R.; Panczer, G.; Uspensky, E.; Varrel, B.; Boulon, G. Luminescence of Pr3+ in minerals. Opt. Mater. 1999, 13, 71–79. [Google Scholar] [CrossRef]
- Gaft, M.; Reisfeld, R.; Panczer, G. Modern Luminescence Spectroscopy of Minerals and Materials; Springer: Berlin, Germany; New York, NY, USA, 2005; ISBN 978-3-540-21918-7. [Google Scholar]
- Fuchs, M.C.; Gloaguen, R.; Beyer, J.; Jakob, S.; Heitman, J. Emission spectroscopy for the identification of rare earth elements using laser-induced photoluminescence. In Proceedings of the 2016 8th Workshop on Hyperspectral Image and Signal Processing: Evolution in Remote Sensing (WHISPERS), Los Angeles, CA, USA, 21–24 August 2016; pp. 1–5. [Google Scholar]
- Lenz, C.; Nasdala, L.; Talla, D.; Hauzenberger, C.; Seitz, R.; Kolitsch, U. Laser-induced REE3+ photoluminescence of selected accessory minerals—An “advantageous artefact” in Raman spectroscopy. Chem. Geol. 2015, 415, 1–16. [Google Scholar] [CrossRef]
- Keizer, P.D.; Gordon, D.C., Jr. Detection of Trace Amounts of Oil in Sea Water by Fluorescence Spectroscopy. J. Fish. Res. Board Can. 1973, 30, 1039–1046. [Google Scholar] [CrossRef]
- Kim, H.H. New Algae Mapping Technique by the Use of an Airborne Laser Fluorosensor. Appl. Opt. 1973, 12, 1454–1459. [Google Scholar] [CrossRef] [PubMed]
- Rogers, S.R.; Webster, T.; Livingstone, W.; O’Driscoll, N.J. Airborne Laser-Induced Fluorescence (LIF) Light Detection and Ranging (LiDAR) for the Quantification of Dissolved Organic Matter Concentration in Natural Waters. Estuar. Coasts 2012, 35, 959–975. [Google Scholar] [CrossRef]
- Saito, Y.; Ichihara, K.; Morishita, K.; Uchiyama, K.; Kobayashi, F.; Tomida, T. Remote Detection of the Fluorescence Spectrum of Natural Pollens Floating in the Atmosphere Using a Laser-Induced-Fluorescence Spectrum (LIFS) Lidar. Remote Sens. 2018, 10, 1533. [Google Scholar] [CrossRef]
- Günther, K.P.; Dahn, H.-G.; Lüdeker, W. Remote sensing vegetation status by laser-induced fluorescence. Remote Sens. Environ. 1994, 47, 10–17. [Google Scholar] [CrossRef]
- Hoge, F.E.; Swift, R.N.; Yungel, J.K. Feasibility of airborne detection of laser-induced fluorescence emissions from green terrestrial plants. Appl. Opt. 1983, 22, 2991–3000. [Google Scholar] [CrossRef]
- Raimondi, V.; Cecchi, G.; Lognoli, D.; Palombi, L.; Grönlund, R.; Johansson, A.; Svanberg, S.; Barup, K.; Hällström, J. The fluorescence lidar technique for the remote sensing of photoautotrophic biodeteriogens in the outdoor cultural heritage: A decade of in situ experiments. Int. Biodeterior. Biodegrad. 2009, 63, 823–835. [Google Scholar] [CrossRef]
- Forget, S.; Chénais, S. Organic Solid-State Lasers; Springer Series in Optical Sciences; Springer: Berlin/Heidelberg, Germany, 2013. [Google Scholar]
- Nienhaus, K.; Bayer, A.K. Innovative Systems for Horizon Control of Mining Machines by Means of Laser Induced Fluorescence (LIF). In Proceedings of the International Symposium on Mine Planning and Equipment Selection, Kalgoorlie, WA, Australia, 23–25 April 2003; pp. 1–7. [Google Scholar]
- Broicher, H.F. Dilution control—Online and real-time recognition of ore and waste by LIF. In Proceedings of the SME Annual Meeting, Salt Lake City, UT, USA, 28 February–02 March 2005; Volume 05-66, pp. 1–5. [Google Scholar]
- Pollmanns, J. Identifikation von Mineralien und Schüttgütern mit Hilfe der laserinduzierten Fluoreszenz. Bergbau 2008, 7, 322–325. [Google Scholar]
- Baumann, N.; Arnold, T.; Foerstendorf, H.; Read, D. Spectroscopic Verification of the Mineralogy of an Ultrathin Mineral Film on Depleted Uranium. Environ. Sci. Technol. 2008, 42, 8266–8269. [Google Scholar] [CrossRef] [PubMed]
- Kauppinen, T.; Khajehzadeh, N.; Haavisto, O. Laser-induced fluorescence images and Raman spectroscopy studies on rapid scanning of rock drillcore samples. Int. J. Miner. Process. 2014, 132, 26–33. [Google Scholar] [CrossRef]
- Green, A.A.; Berman, M.; Switzer, P.; Craig, M.D. A transformation for ordering multispectral data in terms of image quality with implications for noise removal. IEEE Trans. Geosci. Remote Sens. 1988, 26, 65–74. [Google Scholar] [CrossRef] [Green Version]
- Bakker, W.H.; van Ruitenbeek, F.J.A.; van der Werff, H.M.A. Hyperspectral image mapping by automatic color coding of absorption features. In Proceedings of the 7th EARSEL Workshop of the Special Interest Group in Imaging Spectroscopy, Edinburgh, UK, 11–13 April 2011; pp. 56–57. [Google Scholar]
- Murphy, R.J.; Schneider, S.; Monteiro, S.T. Consistency of measurements of wavelength position from hyperspectral imagery: Use of the ferric iron crystal field absorption at ∼900 nm as an indicator of mineralogy. IEEE Trans. Geosci. Remote Sens. 2014, 52, 2843–2857. [Google Scholar] [CrossRef]
- Reisfeld, R.; Gaft, M.; Boulon, G.; Panczer, C.; Jørgensen, C.K. Laser-induced luminescence of rare-earth elements in natural fluor-apatites. J. Lumin. 1996, 69, 343–353. [Google Scholar] [CrossRef]
- Kim, S.; Rhee, S.J.; Li, X.; Coleman, J.J.; Bishop, S.G. Photoluminescence and photoluminescence excitation spectroscopy of multiple Nd 3 + sites in Nd-implanted GaN. Phys. Rev. B 1998, 57, 14588–14591. [Google Scholar] [CrossRef]
- Rastsvetaeva, R.K. Structural mineralogy of the eudialyte group: A review. Crystallogr. Rep. 2007, 52, 47–64. [Google Scholar] [CrossRef]
- Gaft, M. Application of thermal treatment of zircon for the interpretation of luminescence centers. J. Therm. Anal. 1992, 38, 2281–2290. [Google Scholar] [CrossRef]
- Gaft, M. Laser-Induced Time-Resolved Luminescence and Laser-Induced Breakdown Spectroscopy for Evaluation of Phosphates with High Dolomite Content. In Benefication of Phosphates, Fundamentals and Technology; SME: Littleton, CO, USA, 2002; pp. 145–152. [Google Scholar]
- Burns, R.G. Mineralogical Applications of Crystal Field Theory; Cambridge Topics in Mineral Physics and Chemistry; Cambridge University Press: Cambridge, UK, 1993. [Google Scholar]


| Mineral Group | Mineral Species | General Formula | Sample Origin | Total [REE+Y]2O3 [%] |
|---|---|---|---|---|
| Fluoro-carbonates | Bastnaesite | CeCO3F | Diao Lou Shan (Sichuan, CN) | 69.35 (LREE) |
| Parisite | CaCe2(CO3)3F2 | Muzo (Boyacá, CO) | 58.61 (LREE) | |
| Snowbird (Montana, US) | 58.99 (LREE) | |||
| Mexico | 48.44 (LREE) | |||
| Synchysite | CaCe(CO3)2F | Mt. St. Hilaire (Quebec, CA) | 48.54 (LREE) | |
| Oxides | Fergusonite | (Y,REE)NbO4 | Lyndoch Township (Ontario, CA) | 14.49 (HREE) |
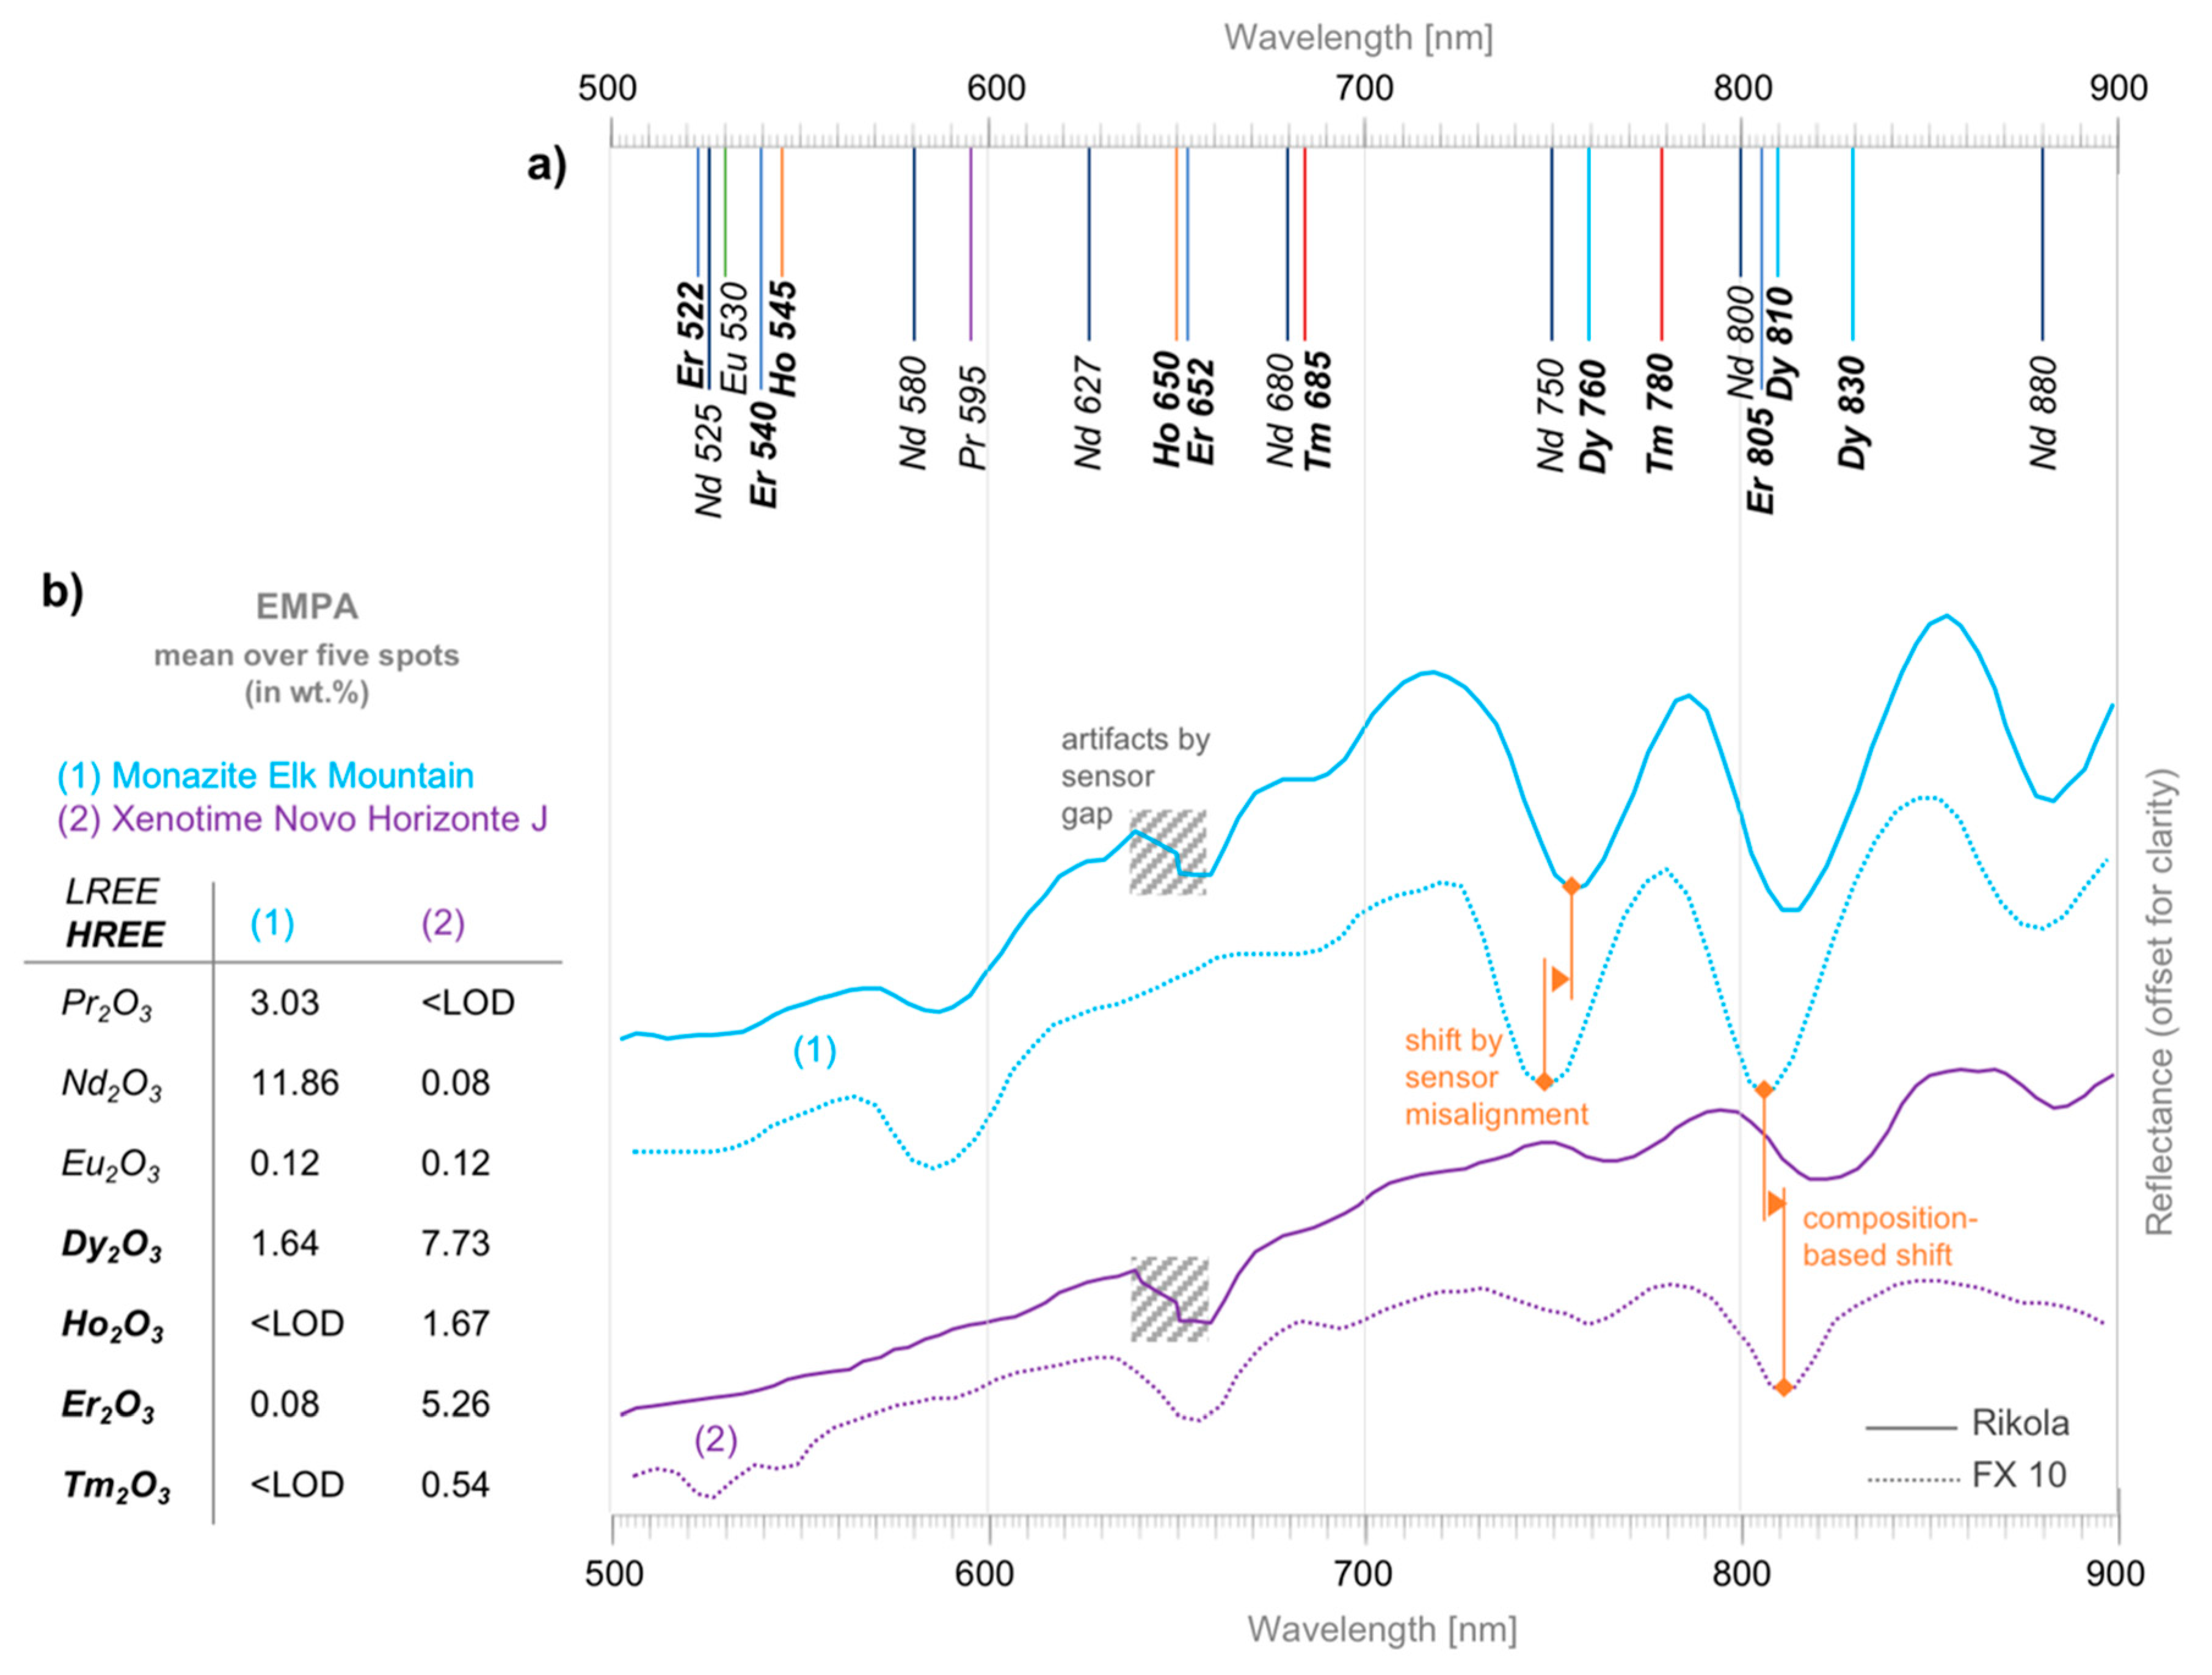
| Phosphates | Monazite | (Ce,La,Nd,Th)PO4 | Elk Mountain (Nebraska, US) | 59.00 (LREE) |
| Serra Verde (Para, BR) | 63.71 (LREE) | |||
| Unknown | 65.28 (LREE) | |||
| Xenotime | (Y,Yb)PO4 | Novo Horizonte (Bahia, BR) | 69.63 (HREE) | |
| Novo Horizonte (Bahia, BR) | 68.26 (HREE) | |||
| Serra Verde (Para, BR) | 66.55 (HREE) | |||
| Britholite | (Ce,Ca)5(SiO4,PO4)3(OH) | Oka (Quebec, CA) | 44.09 (LREE) | |
| Kipawa (Ontario, CA) | 53.58 (LREE) | |||
| Silicates | Cerite | (Ce,La,Ca)9(Mg,Fe)(SiO4)6 (SiO3OH)(OH)3 | Bastnas (Västmanland, SE) | 69.21 (LREE) |
| Eudialyte | Na15Ca6(Fe,Mn)3Zr3SiO (O,OH,H2O)3(Si3O9)2 (Si9O27)2(OH,Cl)2 | Kipawa (Ontario, CA) Kipawa (Ontario, CA) Kipawa (Ontario, CA) | 5.25 (HREE) 4.82 (HREE) 5.63 (HREE) | |
| Kainosite | Ca2Y2(SiO3)4(CO3)·H2O | Long Lake (New York, US) | 36.93 (HREE) | |
| Zircon | ZrSiO4 | Green River (Wyoming, US) | 0.32 (HREE) | |
| Mt. Malosa (Zomba, MW) | 4.83 (HREE) | |||
| Mudtank (Harts Range, AU) | 0.04 (HREE) | |||
| North Burgess (Ontario, CA) | 0.04 (HREE) | |||
| St. Peters Dome (Colorado, US) | 0.10 (HREE) |
| Spectral Evolution PSR-3500 | Senop Rikola | Specim FX 10 | |
|---|---|---|---|
| sensor type | portable field spectrometer | frame-based imager | push broom scanner |
| data dimension | 1 px | 1010 × 1010 px frame | 1024 px line |
| wavelength range | 350–2500 nm | 500–900 nm | 400–1000 nm |
| spectral resolution (FWHM*) | 3.5 nm (VNIR), 7–10 nm (SWIR) | 10 nm | 5.5 nm |
| estimated peak signal-to-noise ratio (SNR)** | 600:1 | 150:1 | 600:1 |
| spatial resolution (length of quadratic pixel) | 2 mm | distance dependent (here: 0.14 mm, slightly defocused) | distance dependent (here: 0.41 mm, focused) |
| spectral bands | 1024 | up to 380 | 224 |
| Laser Wavelength (Laser Type) | Beam Diameter | Power Density |
|---|---|---|
| 325 nm (Kimmon He-Cd-laser) | 185 µm | 14.58 W/cm2 |
| 442 nm (Kimmon He-Cd-laser) | 170 µm | 16.73 W/cm2 |
| 532 nm (diode-pumped frequency-doubled Nd:YAG) | 143 µm | 26.93 W/cm2 |
| Reflectance Spectroscopy | PL Spectroscopy (325/442/532 nm Excitation) | |
|---|---|---|
| Detectable REE in single-REE salts | Robust: Pr3+, Nd3+, Sm3+, Dy3+, Ho3+, Er3+, Tm3+, Yb3+ Weak: Eu3+ | Robust: Ce3+, Pr3+, Nd3+, Sm3+, Eu3+, Tb3+, Dy3+, Er3+, Yb3+ Weak: Ho3+, Tm3+ |
| Detectable REE in mixed-REE natural samples | Robust: Nd3+, Sm3+, Dy3+, Yb3+ Ambiguous (detectable by feature shift): Pr3+, Ho3+, Er3+, Tm3+ | Robust: Ce3+, Nd3+, Eu3+, Dy3+, Er3+, Yb3+ Ambiguous: Pr3+, Sm3+, Ho3+, |
| REE detection limit | down to ~0.10 wt.% | less than 0.03 wt.% |
| Acquisition time: Point measurements | ms-s | ms-s |
| Acquisition time: Mapping of 100 × 100 px | ms-s (commercial push broom and frame-based sensors available) | hours (x-y rastering of point measurements) |
| Quantitative analysis | semi-quantitative by correlation of absorption depth and position with REE grade | not yet applicable |
© 2018 by the authors. Licensee MDPI, Basel, Switzerland. This article is an open access article distributed under the terms and conditions of the Creative Commons Attribution (CC BY) license (http://creativecommons.org/licenses/by/4.0/).
Share and Cite
Lorenz, S.; Beyer, J.; Fuchs, M.; Seidel, P.; Turner, D.; Heitmann, J.; Gloaguen, R. The Potential of Reflectance and Laser Induced Luminescence Spectroscopy for Near-Field Rare Earth Element Detection in Mineral Exploration. Remote Sens. 2019, 11, 21. https://doi.org/10.3390/rs11010021
Lorenz S, Beyer J, Fuchs M, Seidel P, Turner D, Heitmann J, Gloaguen R. The Potential of Reflectance and Laser Induced Luminescence Spectroscopy for Near-Field Rare Earth Element Detection in Mineral Exploration. Remote Sensing. 2019; 11(1):21. https://doi.org/10.3390/rs11010021
Chicago/Turabian StyleLorenz, Sandra, Jan Beyer, Margret Fuchs, Peter Seidel, David Turner, Johannes Heitmann, and Richard Gloaguen. 2019. "The Potential of Reflectance and Laser Induced Luminescence Spectroscopy for Near-Field Rare Earth Element Detection in Mineral Exploration" Remote Sensing 11, no. 1: 21. https://doi.org/10.3390/rs11010021