1. Introduction
The city of Venice and its surrounding lagoon is presently one of the sites most sensitive to land subsidence worldwide. Even a few mm loss of ground elevations with respect to the mean sea level can significantly change the natural lagoon environments and threaten the city’s survival. Over the last century, land subsidence and climate change effects concurred to a relative sea level rise (RSLR) in Venice equal to 26 cm [
1], a situation that is expected to get dramatically worst if we consider the 53 cm sea level rise projected by the Intergovernmental Panel on Climate Change (IPCC) in 2100 according to the A1B scenario, which accounts for a future energy system balanced between fossil and non-fossil sources [
2]. RSLR has contributed to a seven-fold increase of flooding events in Venice over the last decades, causing large inconvenience for the population and enormous damage to the cultural heritage, with significant ecological and environmental impacts in the lagoon and coastland [
3]. To protect the city and the lagoon from increased flooding, a series of mobile barriers (MoSE) are under construction at the three inlets (Lido, Malamocco and Chioggia) connecting the Adriatic Sea to the inner water body.
The monitoring of land subsidence in the Venice area began in the 1960s using spirit leveling and over the last decades has been significantly improved using space-borne observation techniques based on synthetic aperture radar (SAR) interferometry. The subsidence monitoring network of the Venice coastland increased from a few hundreds of benchmarks measured by leveling [
3] to a few hundred thousand reflectors detected by SAR-based interferometry using ERS and ENVISAT satellites [
4]. This reduced the use of in-situ measurements to calibrate and validate interferometric products [
5]. The increased spatial coverage of the measured points by the C-band sensors provided a new image of the land subsidence in the Venice coastland. In particular, the high variability of land movements at both local and regional scales was unexpectedly revealed, with areas severely affected by subsidence formerly unknown.
The launch of the new generation X-band SAR sensors opened the challenge to further advance in the knowledge on land subsidence, with particular advantages for coastal areas where the loss of land elevation with respect of the mean sea level is one of the main environmental and geological hazards. Many scientific papers have been published over the last decade concerning the use of TerraSAR-X for measuring displacements in coastal zones, both at the regional scale and for specific infrastructures. For example, in Tianjin and Shanghai, which are two coastal areas in China where land subsidence has seriously threatened the infrastructure efficiency, environment conservation, and population safety, TerraSAR-X-based interferometry was used to quantify land movements at the city scale [
6,
7] or along the tract of high-speed trains [
8,
9]. Other coastal cities where land subsidence has been recently mapped by TerraSAR-X images are Jakarta, Indonesia [
10], Hanoi, Vietnam [
11], and New Orleans, Louisiana [
12]. SAR interferometry on TerraSAR-X acquisitions has also been applied in natural coastlands. In one of the most recent contribution, nine Single-Look Slant Range Complex (SSC) images taken between 7 June and 14 September 2013 have been processed Differential SAR interferometry to detect summer thaw subsidence over a yedoma (an organic-rich Pleistocene-age permafrost with ice content of 50–90% by volume) region of the Lena River Delta, Siberia [
13]. Concerning the Venice Lagoon, three projects have been carried out over the last decade under the umbrella of the DLR AOs: LAN0242 “Monitoring land subsidence in Venice”; COA0612 “Assessing vertical movements of natural tidal landforms and anthropogenic structures at the Venice Lagoon inlets”; and COA1800 “Ground surface dynamics in the Venice Lagoon: five years of monitoring of natural tidal landforms and anthropogenic structures by TerraSAR-X”. These projects have allowed testing the effectiveness of TerraSAR-X in quantifying land subsidence in the Venice coastland with the aim of improving the knowledge on natural and anthropogenic causes. The results of these projects have been published in various papers (e.g., [
14,
15,
16,
17,
18,
19,
20]).
The goal of this paper is to provide a review of the main results and advancements in the knowledge of land subsidence at the Venice coastland achieved by TerraSAR-X PSI over the last decade, updating the main outcomes obtained in the past years with the analyses recently carried out over the six-year period between 2008 and 2013.
2. TerraSAR-X Image Processing and Output Calibration
Stacks of TerraSAR-X stripmap HH polarization images characterized by a 28° incidence angle acquired with a regular 11-day revisiting time have been processed by IPTA (Interferometric Point Target Analysis) [
21,
22], one of the available PSI processing chains. A number of 30, 90 and 143 scenes acquired over the periods 2008–2009, 2008–2011 and 2008–2013, respectively, have been used.
Particular attention was paid to the calibration of the interferometric products as they are referred to an arbitrary reference and are affected by the so-called flattening problem, i.e., the slight phase tilt resulting from the inaccuracy in estimating the orbital baseline due to the imperfect knowledge of satellite positions. This latter can be important in regional-scale analyses. To reduce these biases, calibration and de-flattening were previously performed using correction planes modeled through ground-based data [
19] by: (i) defining a local reference frame based on a reference point located outside the study area and the subsiding coastland; and (ii) projecting the vertical velocities of the ground-truth data along the line of sight (LOS) of the satellites [
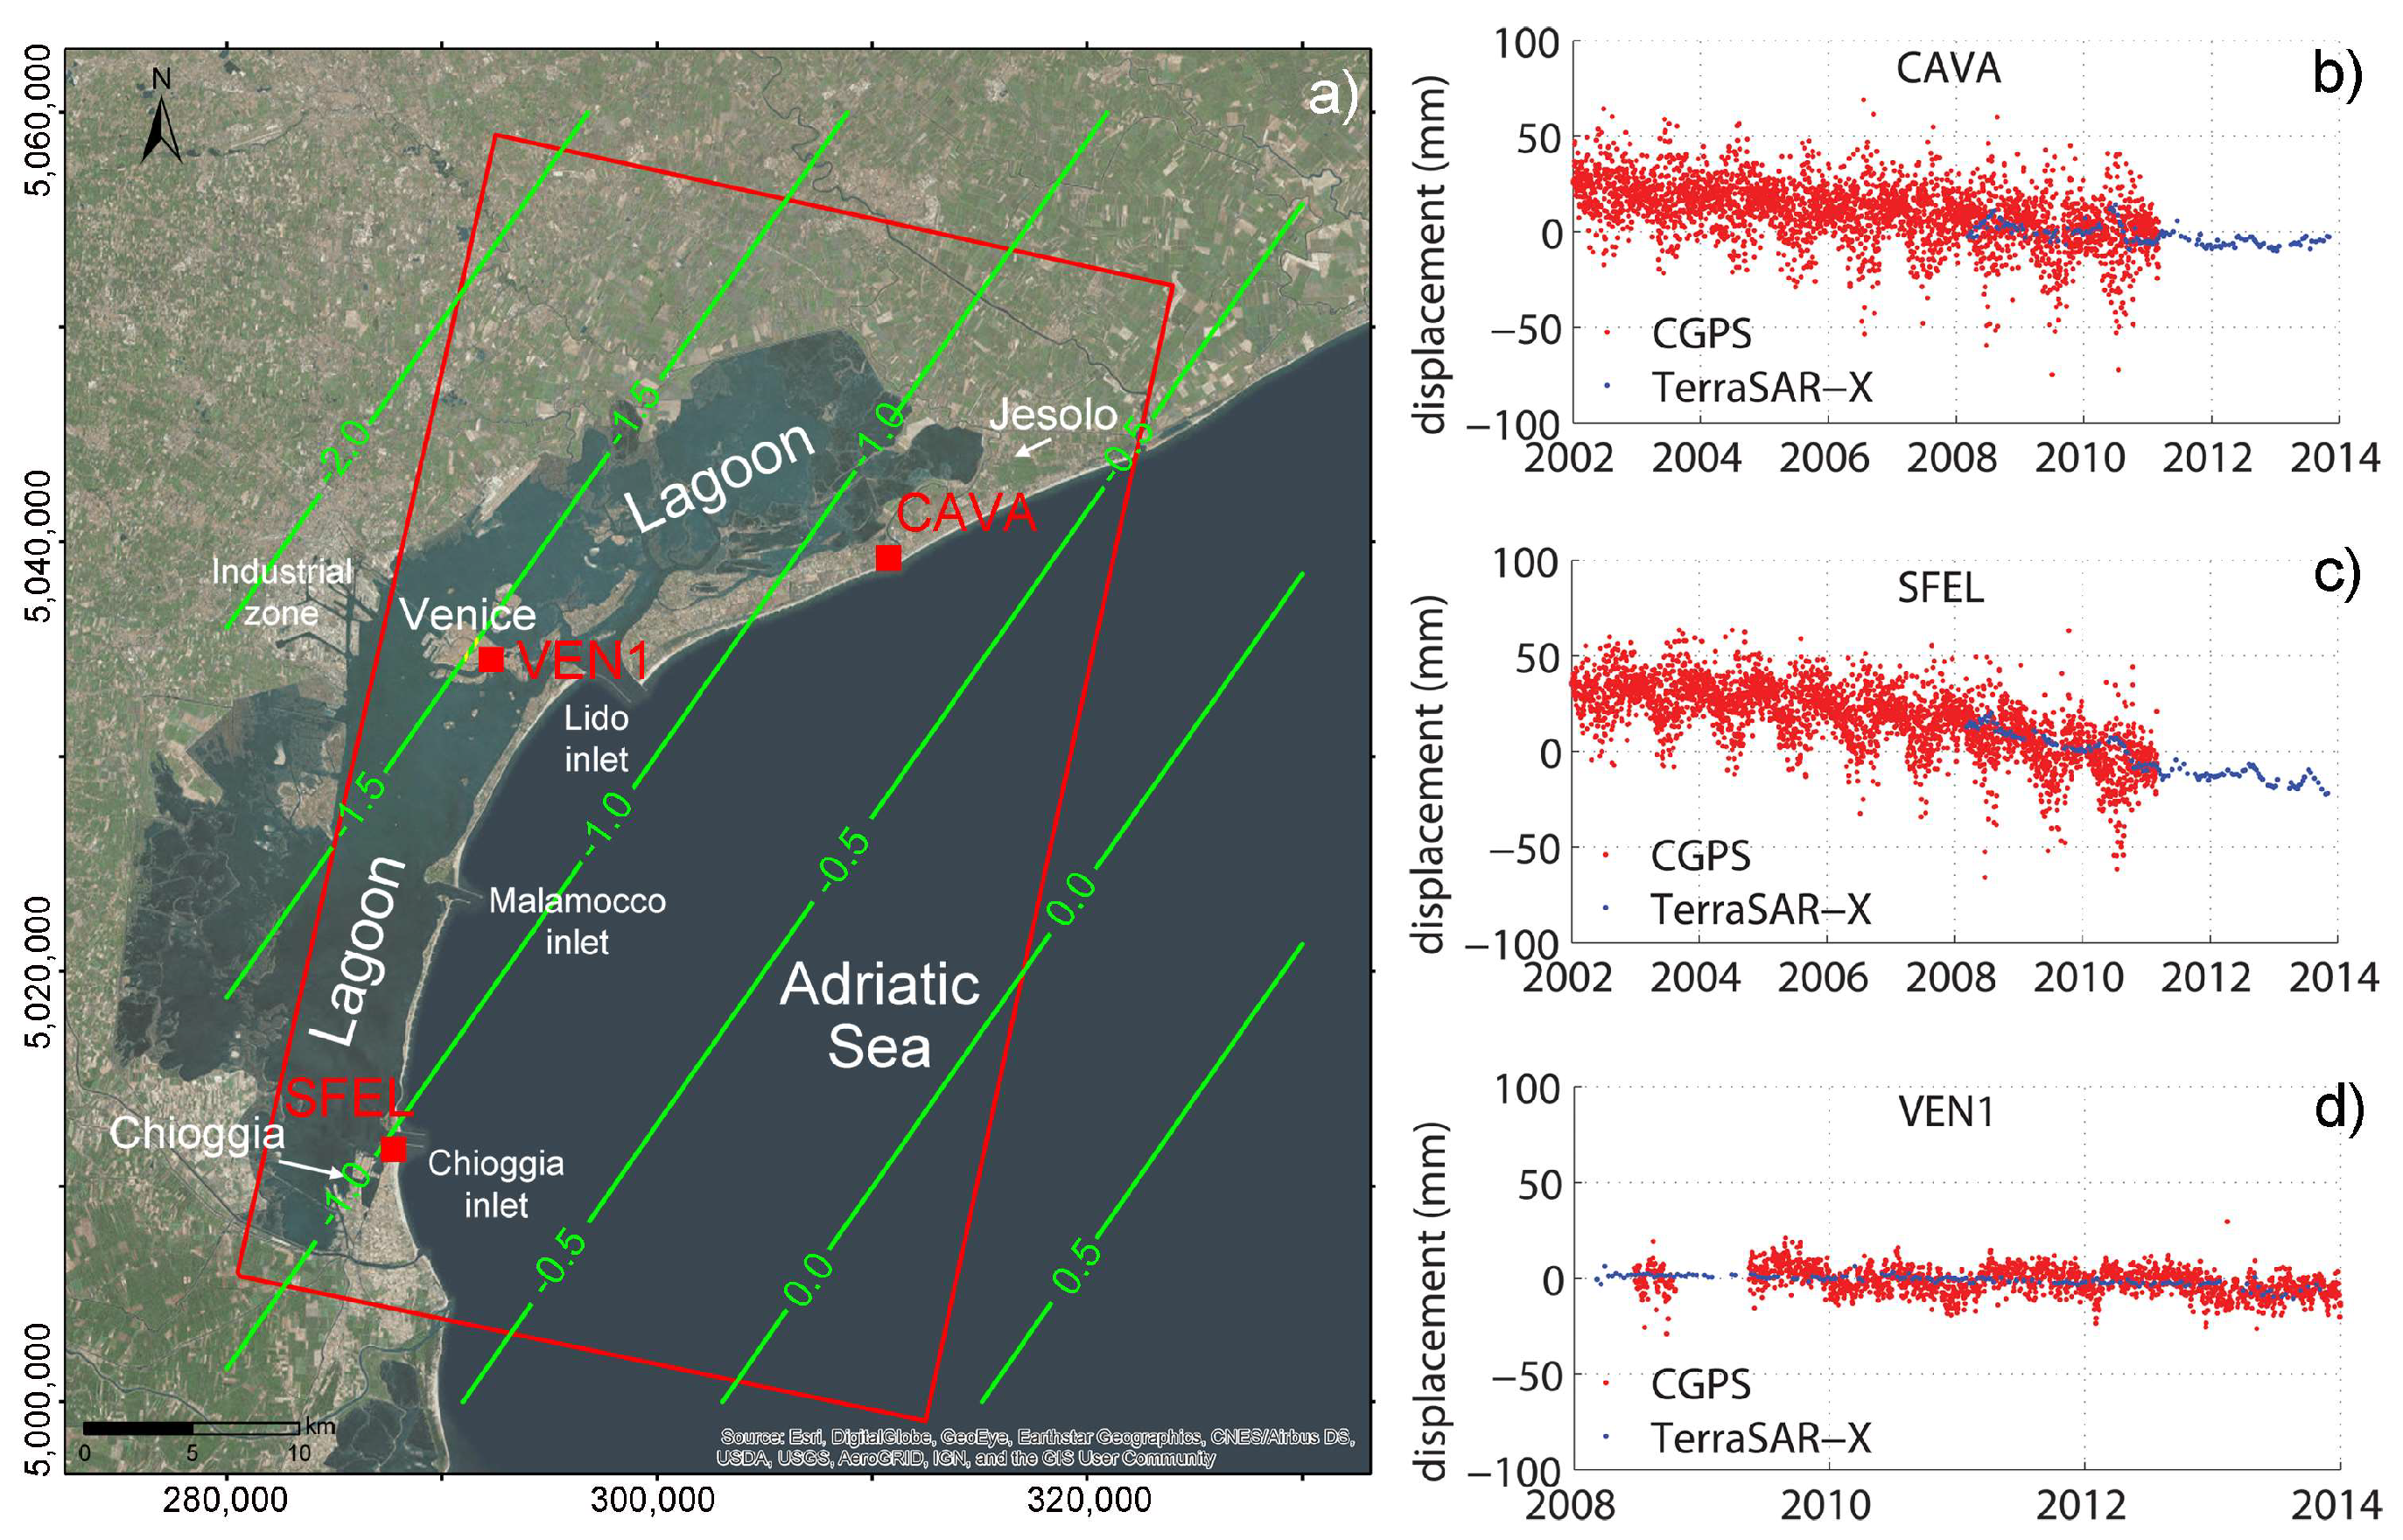
20]. Continuous GPS stations (CGPS) are used for calibration and de-flattening of the TerraSAR-X interferometric product: three stations are located inside the area and one, located just outside the SAR frames, is used to refer the horizontal movements. The three-dimensional CGPS velocity vectors were projected onto the SAR LOS using Equation (1):
where Δ
E and Δ
N are the local easting and northing components of the CGPS movement, computed by removing the E and N average velocities of the CGPS station located outside the SAR image frame, and
UP is the vertical component. θ and φ are the incidence angle and the ground track angle, respectively, at the CGPS locations. Notice that the Venice coastland is moving in the horizontal direction almost uniformly (18–20 mm/year northward and 15–17 mm/year eastward with reference to ITRF 2005) and therefore the errors in considering null the relative horizontal movements due to the tectonics at regional scale can be safely ignored. However, since we only used descending orbits, the decomposition of LOS velocity into vertical and East-West components is not possible and LOS velocities still include East-West motions due to local causes. Finally, the differences between the CGPS-LOS and the velocities of the PTs (Point Targets) averaged over a 20–200-m radius centered on the three CGPS stations were used to define the proper equation of tilting plane implemented to correct the interferometric products. Because of the relatively small area of interest and the proper distribution of the CGPS stations within the TerraSAR-X frame, a plane is assumed the most appropriate surface to de-flatten the SAR solution [
19,
23]. An example of calibration plane is shown in
Figure 1a.
A comparison between the CGPS displacements along the LOS direction and the calibrated TerraSAR-X dataset corresponding to the PT closest to the CGPS station is provided in
Figure 1b–d.
Table 1 provides a quantitative summary in term of LOS velocity. Notice that SFEL CGPS is characterized by a significantly nonlinear trend because of the MoSE-related works started in 2007. If the shorter period (2007–2011) is considered, the average CGPS LOS velocity amounts to −7.46 ± 0.28 mm/year, a value very close to the average SAR calibrated time series.
3. Ground Displacements at the Regional Scale
The ground displacements at the regional scale for the 2008–2011 period [
19] has been updated extending the time span to 2013. The 2008–2013 displacement map consists of more than 1,900,000 PTs (
Figure 2) and shows ground movement velocities ranging from localized gentle uplifts to large subsidence (up to 30 mm/year). The map highlights that this portion of the Northern Adriatic coastland is characterized by a large variability in terms of land subsidence.
Investigation of
Figure 2 reveals that the northwestern zone is characterized by general stability (average subsidence less than 1 mm/year). Relatively large displacements caused by human activities (e.g., groundwater pumping and development of new urban and industrial zones) affect only small areas. Conversely, the northern coastland is characterized by a quite uniform land subsidence on the order of 4–6 mm/year. The superposition of aquifer exploitation and land reclamation mainly contribute to the observed settlements. Concerning the lagoon basin, it shows the highest variability of the ground displacements, with rates ranging from −1 to −30 mm/year. The largely heterogeneous nature of the shallow Holocene deposits is strongly responsible for the high heterogeneity of the land movements: the lagoon sectors with the thicker unconsolidated deposits generally correspond to the areas experiencing the largest subsidence rates. In the northern lagoon, high sinking rates are often linked to the presence of stone embankments bounding the fish farms. The historical center of Venice and the central lagoon are relatively stable with an average land subsidence of 1–2 mm/year. Here, the compressible Holocene deposits are relatively thin and groundwater withdrawals have been precluded since the early 1970s. Southward, the city of Chioggia and its surroundings are almost stable (subsidence about 1 mm/year), whereas a high subsidence affects the mouths of the main rivers (the Brenta and Adige rivers) crossing the southernmost portion of the study area.
4. Ground Displacement at the Local-Scale
Specific analyses were carried out for peculiar portions of the Venice coastland. We report in the following the results obtained by PSI on the historical center of Venice, the lagoon salt marshes, the network of artificial reflectors established within the lagoon in 2007, the lagoon inlets where the MoSE-related infrastructures have been recently constructed, and new urbanizations developed in the tourist villages on the Adriatic coast.
4.1. Induced Ground Movements in the Historical Center of Venice
Understanding if Venice is affected also today by land subsidence due to anthropogenic activities, i.e., by components that can be removed or reduced, is of paramount importance for the city survival. However, land subsidence measurements generally provide the total movement of the land surface, including both the natural and man-induced components (e.g., [
24,
25]).
The anthropogenic land subsidence due to activities characterized by large scale and long term effects, e.g., groundwater pumping, ended in Venice a few decades ago [
26]. Today, the anthropogenic component of the land subsidence should be related to local and short-time interventions, such as restoration works and inherent deformations of historical structures.
Based on these considerations, it was tested to distinguish between the natural and anthropogenic components of the present land subsidence in the historical center of Venice by properly combining different PSI results [
18]. Specifically, a long-term analysis using the ERS/ENVISAT C-band dataset can be reasonably used to quantify the natural component and a short-term analysis of X-band dataset to highlight the anthropogenic displacements. The very high spatial resolution of the X-band satellites and their short revisiting time makes it possible to investigate urban settlements with sufficient measurement accuracy and a high level of space and time detail. Indeed, in Venice, the X-band PSI outcome showed a scatterer density one order of magnitude larger than that obtained by the C-band sensors. To this aim, the long-time 1992–2010 ERS/ENVISAT and short-time 2008–2009 TerraSAR-X images have been processed. Since the differences between the ERS/ENVISAT and TerraSAR-X incidence angles amounts to 5° only, the direct comparison of the two LOS solutions can be carried out introducing a negligible error. The statistical analysis of the displacement distributions pointed out that the average displacement rates detected in Venice by the two satellites are similar, i.e., about −1.0 mm/year. The frequency distribution of the measured displacements shows that 50% of the TerraSAR-X radar reflectors are characterized by movements between 0 and −1.5 mm/year and 25% range from −1.5 and −3.0 mm/year. Regarding the C-band, about 80–85% of the city displacements range between 0 and −1.5 mm/year and 15% from −1.5 to −3 mm/year. As C- and X-band analyses showed similar rates of the average displacement, i.e., mainly the natural component of the subsidence, it is reasonable to assume that the difference between the movements provided by ERS/ENVISAT and TerraSAR-X is likely representative of the effects caused by anthropogenic activities.
Therefore, the two datasets were interpolated by the Kriging method on the same regular grid covering the whole city [
18]. The comparison points out the uniformity (in the range between 0 and −1 mm/year) of the long-term displacement rates and the large variability of the short-term movements (
Figure 3b) that are superposed to a background velocity similar to that given by ERS/ENVISAT. By removing the C-band interpolated map from the X-band interpolated solution, an estimate of the man-induced displacements was obtained (
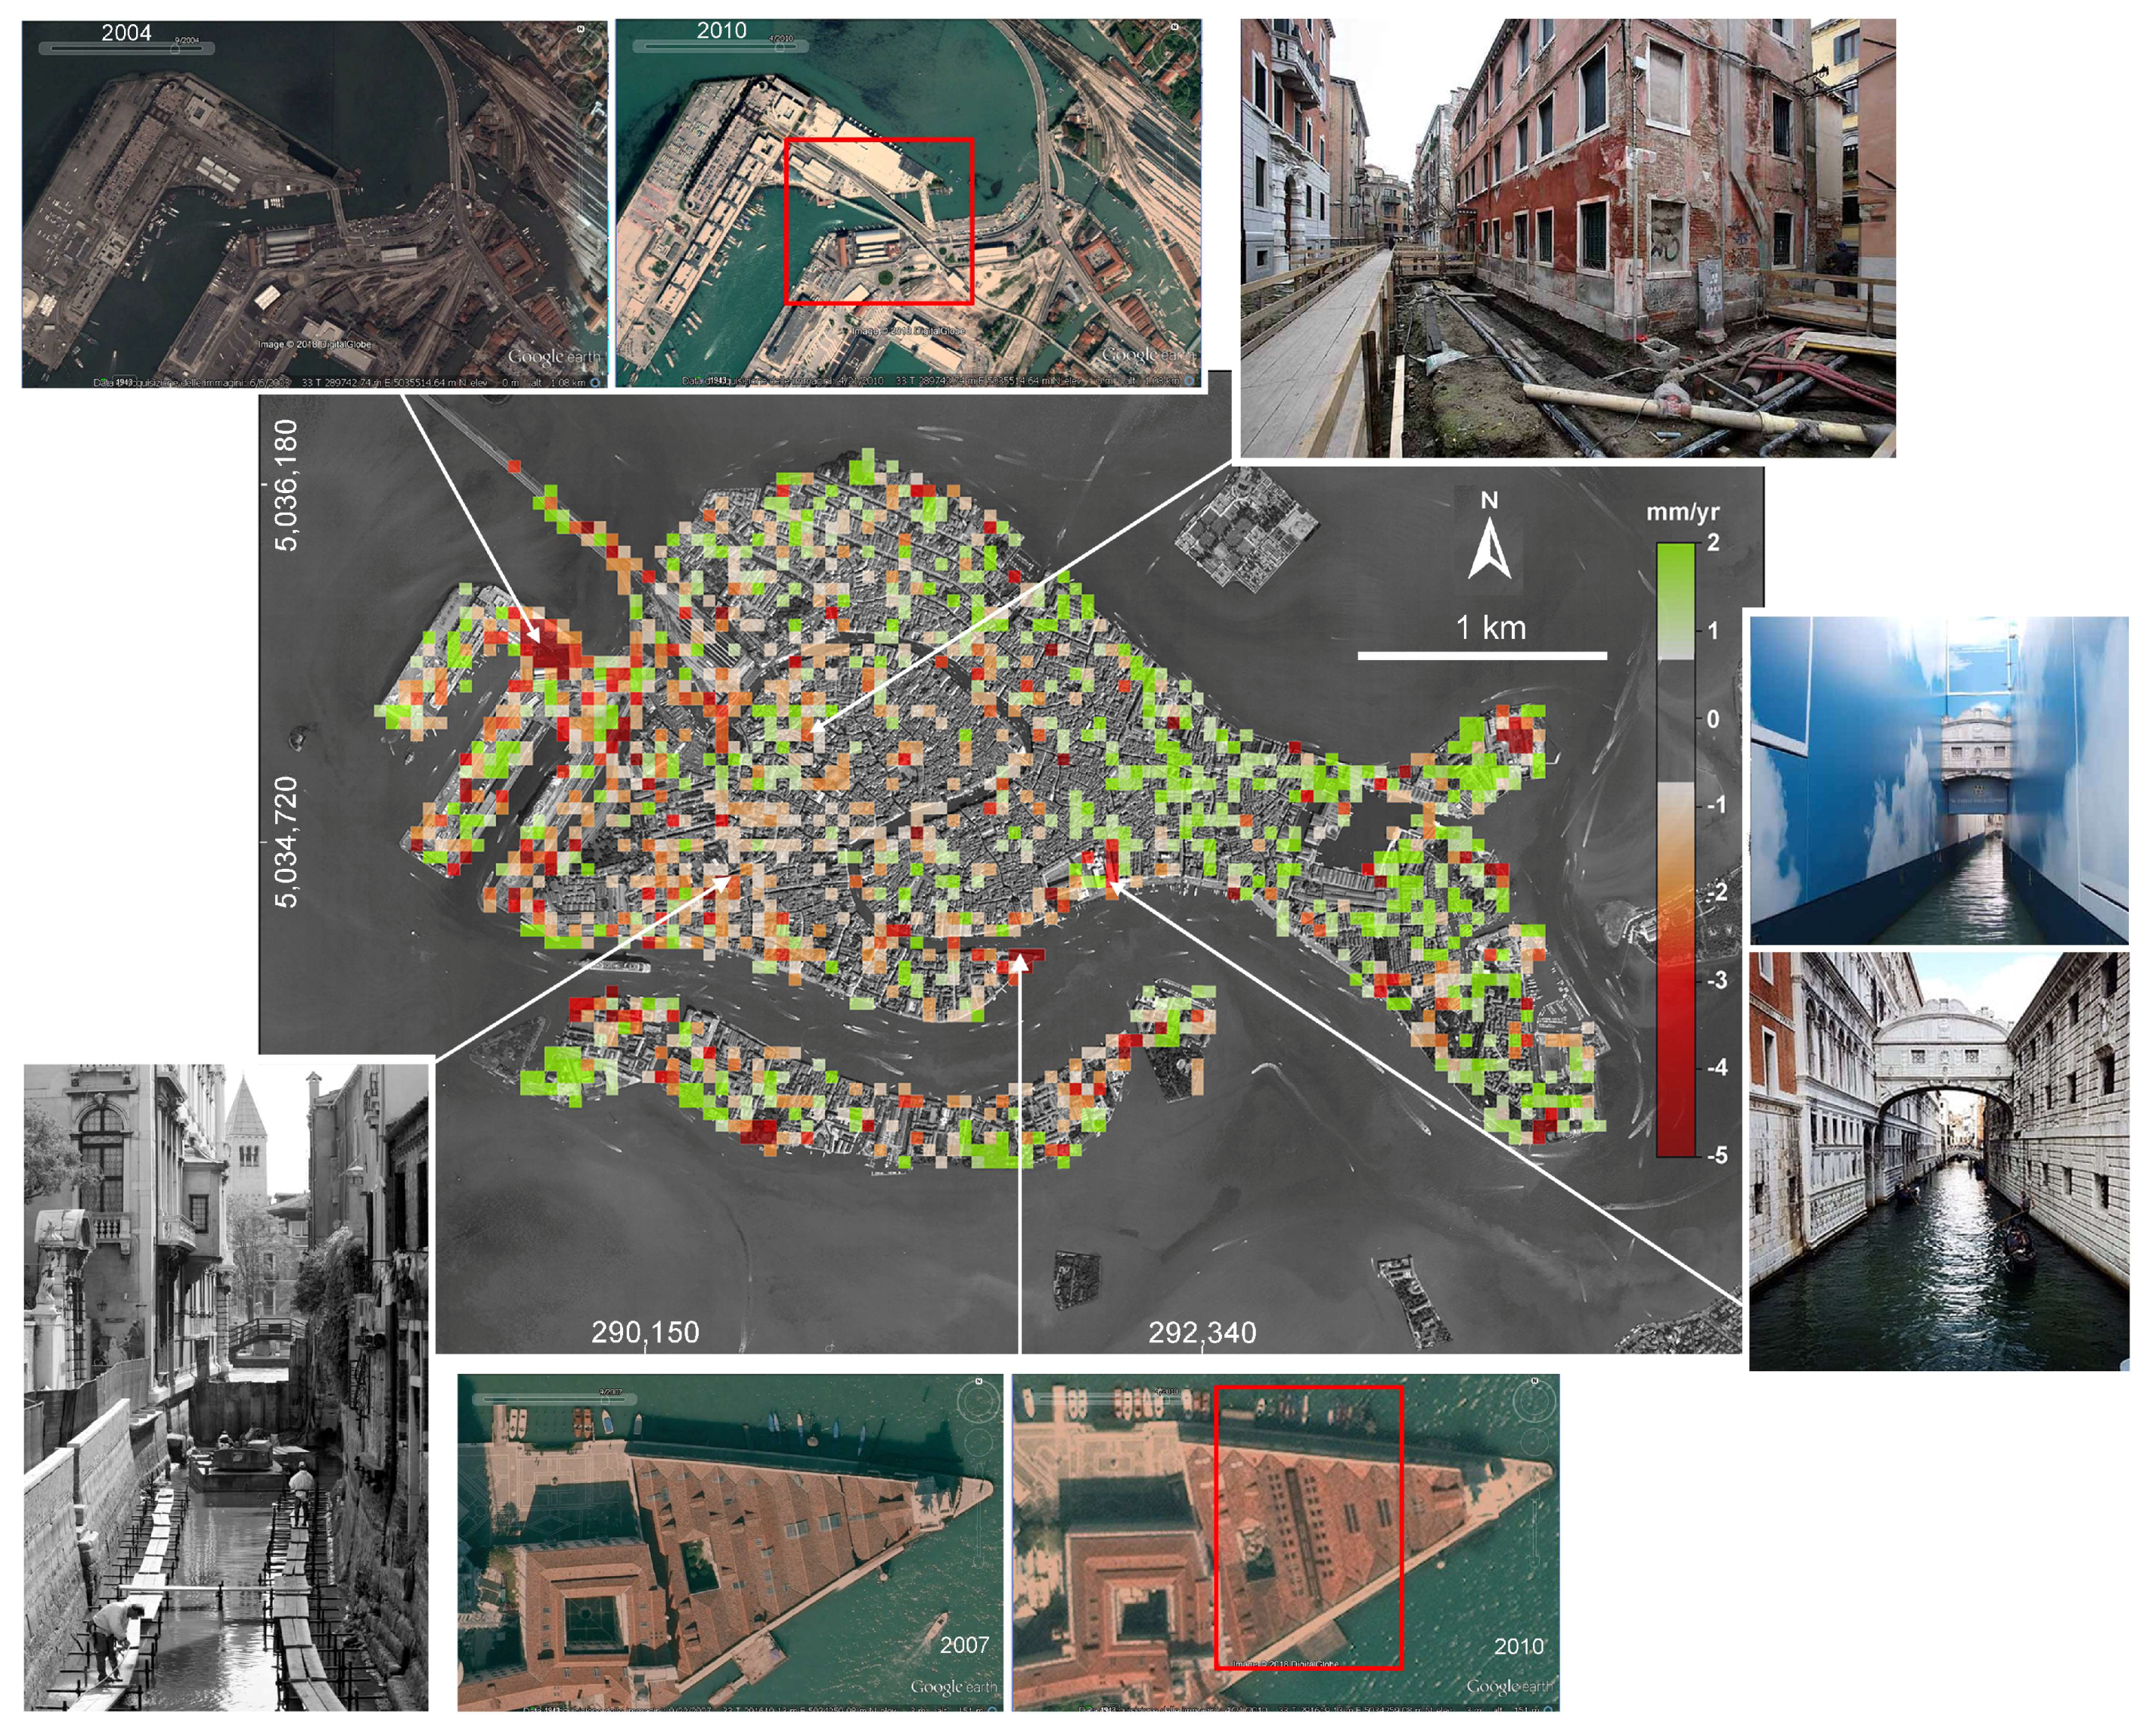
Figure 3). The map of the differences shows that most of the city is subsiding only due to natural components. However, about 25% of the city has experienced in 2008 some movements due to anthropogenic causes. They developed at local scale and their distribution correspond well with the sites affected by activities linked to the restoration of ancient buildings, consolidations, jet grouting, use of well-points (see the photos in
Figure 3), and likely to the ship and boat wave impact on the embankment walls. Generally, the man-induced activities contribute to a subsidence larger than the natural (15%) but there are some areas (10%) where the short-term sinking is smaller than the long-term subsidence.
Finally, notice that because of the intrinsic properties of the TerraSAR-X images and satellite revisiting time, a one-year image stack is sufficient to provide an interferometric product characterized by a sufficient (i.e., millimeter) accuracy. Indeed, the error of a single measurement on a radar scatterer can be computed as follows [
27]:
where
is the error related to the signal noise and
the atmospheric displacement error. The
is related to SCR (Signal-to-Clutter Ratio) and the sensor wavelength λ by [
28]:
By considering a SCR value of 10 dB, which is typical for TerraSAR-X scene,
= 1.7 mm. As it can be assumed in the case of TerraSAR-X a variance of the atmospheric residual on the order of π/4 [
19], this corresponds to an atmospheric displacement error
= 2.0 mm. From Equation (2), it results
≈ 2.2 mm. The error of the mean velocity estimated with
n = 30 TerraSAR-X images over a period of
t = 1 year is then
≈ 0.4 mm/year.
4.2. Salt Marshes Ground Dynamics
The existence of salt marshes and tidal morphologies is strictly connected to their elevation with respect to the mean sea level (e.g., [
29]). In view of the expected climate changes, quantifying land subsidence of these transitional environments is crucial to investigate their long-term possible survival.
However, monitoring with a certain accuracy their movements has always been challenging due to the peculiar features of these morphological forms [
30]. They have never been linked to traditional leveling and GPS networks, and also standard Interferometric SAR applications returned very poor results in terms of spatial and temporal coverage. In fact, they are environments difficult to access, submerged by the sea water twice a day, made of largely unconsolidated deposits, without anthropogenic structures, and relatively far from anthropogenic facilities.
IPTA was applied on a stack of 143 TerraSAR-X stripmap images acquired between 2008 and 2013 with a regular 11-day revisiting time [
20]. The regularity of the acquisitions, the short satellite revisiting time, the high image resolution (~3 m × 3 m), and the strategies used in the PSI application have allowed us to detect thousands of measurable PTs in the Venice Lagoon salt marshes. The results show that both natural and man-made salt marshes are characterized by a quite wide range of average velocities [
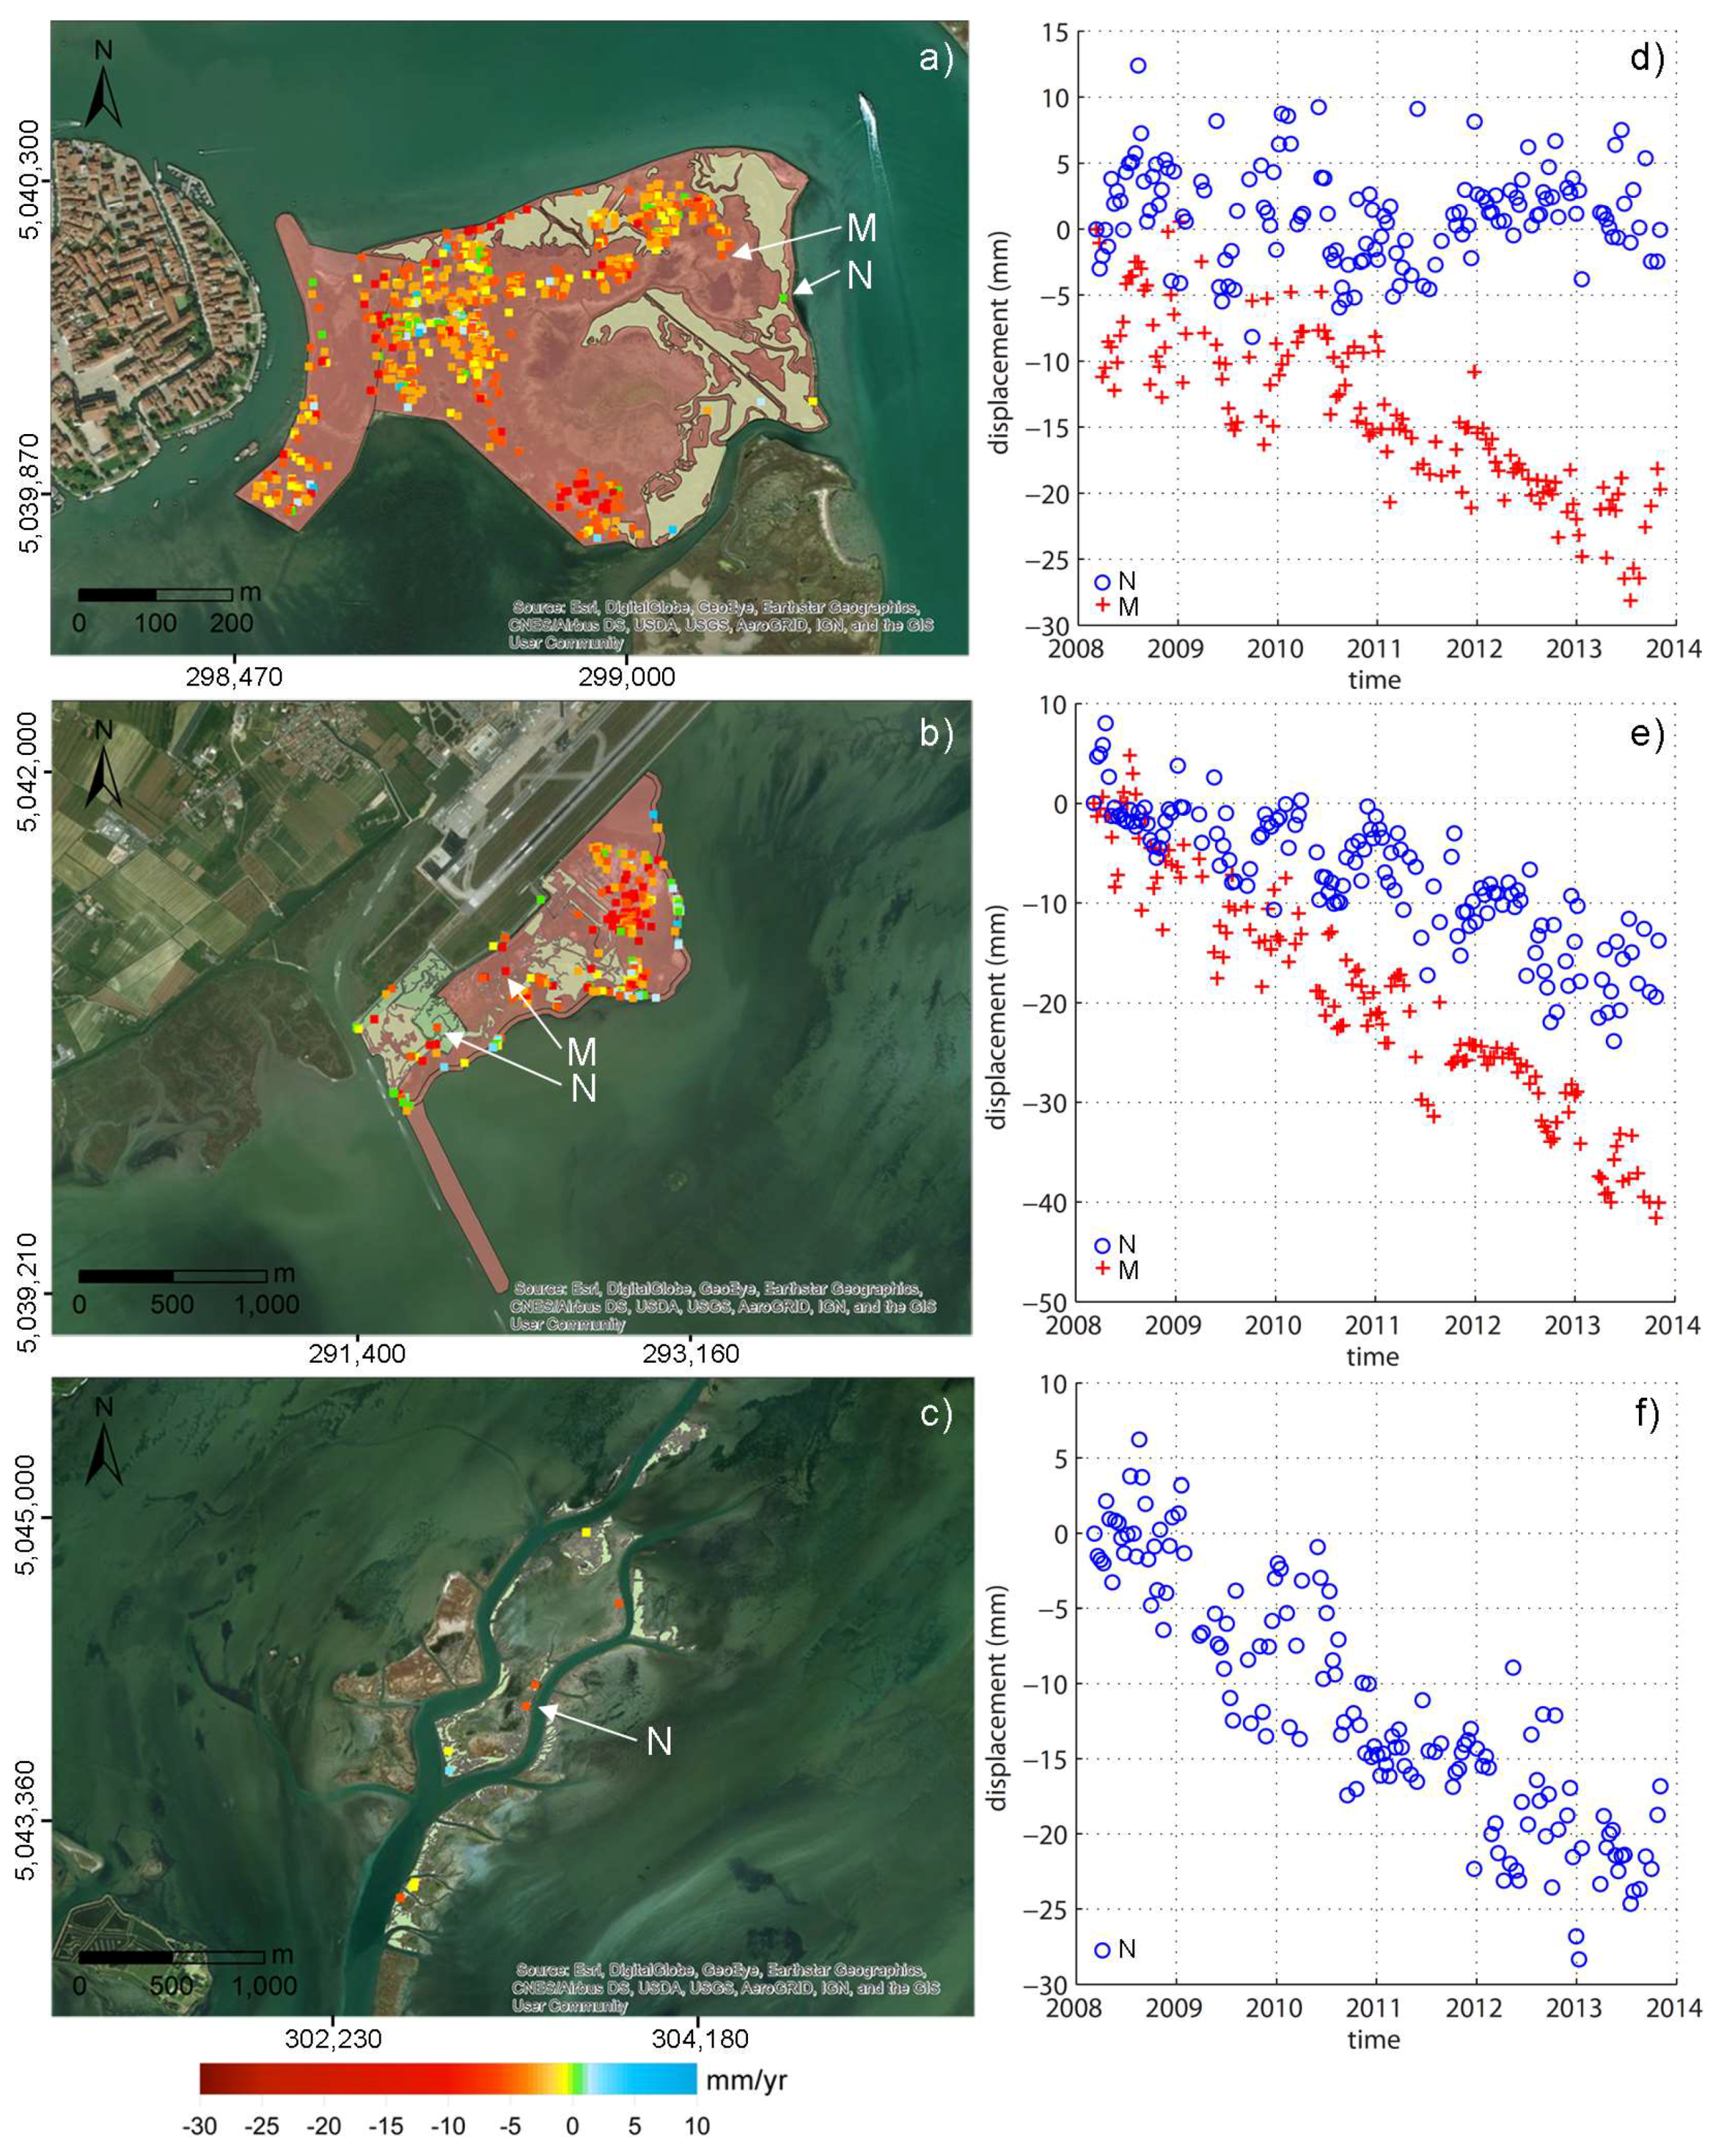
20]. Displacements range from small uplifts to subsidence rates of more than 20 mm/year. Generally, land subsidence is much larger on man-made than natural salt marshes, with a significant negative correlation with the marsh age (
Figure 4).
A subsidence trend that increases from the littoral strips toward the western lagoon margin characterized the natural portions of the salt marshes. This trend reflects the different geomorphological setting of the lagoon and salt marsh deposits, which are richer in sandy soils along the ancient beach ridges, whereas clayey silts, often rich in organic matter, fill the inter-distributary lowlands and back-barrier zones [
31,
32]. Land displacements at the man-made salt marshes are characterized by patches with even subsidence and significantly different values among the various zones (
Figure 4). This peculiar behavior is related to the type of construction methodology of the artificial salt marshes: coarse sediments are used initially along the marsh bound and then fine materials are used to fill the inner portions.
In addition, it has been observed that land subsidence in vegetated and bare parts of the marshes is significantly different. The comparison between the surface displacements with the presence/absence of halophytic vegetation species clearly reveals that the higher sinking rates occur on the unvegetated salt marshes [
20].
Figure 4d–f shows five examples of displacement time series of scatterers located on natural and man-made parts of salt marshes. The analysis of about six years of data regularly acquired every 11 days allows us to exclude significant effect of the tidal regime on the recorded displacements. On the other hand, this is an expected outcome as the tidal fluctuation in Venice is in the order of 1 m only, which is much smaller than the ocean tides to which significant land movements have been associated (e.g., [
33]).
Moreover, the scattered distribution of the ground movements for some PTs suggests that at least 3–4 years are required to derive a reliable quantification of the ground movement in salt marshes.
The formation age of the salt marshes also affects the subsidence values. The man-made salt marshes dated 2007–2008, 2002–2003 and 1992–1993 shows median subsidence rate amounting to 4.0, 2.8 and 1.3 mm/year, respectively. Natural salt marshes that are approximately 500–1000 year old are characterized by a median subsidence equal to 0.4 mm/year [
20].
4.3. Satellite Radar Interferometry on Artificial Reflectors
The key to the PSI approach is the identification and exploitation of time coherent radar reflectors. These scatterers are typically man-made structures within the landscape, such as buildings, utility poles, roadways, or natural features, such as rocks, deserts with little shifting sand, or saline soils. A potentially severe limitation of PSI use in wetlands is the difficulty of identifying stable targets (e.g., [
34]). In situ survey revealed that these features in the Venice Lagoon usually correspond to rich-shell silty deposits, construction remnants, woods, and wood posts together with stone-filled rolls (
Figure 4); these latter usually place along the marsh bounds to protect them from wave erosion
To improve the coverage of satellite SAR interferometry in salt marshes within the Venice Lagoon, TerraSAR-X and ENVISAT have been tested on a network of 57 Trihedral Corner Reflectors (TCRs) established in 2007 [
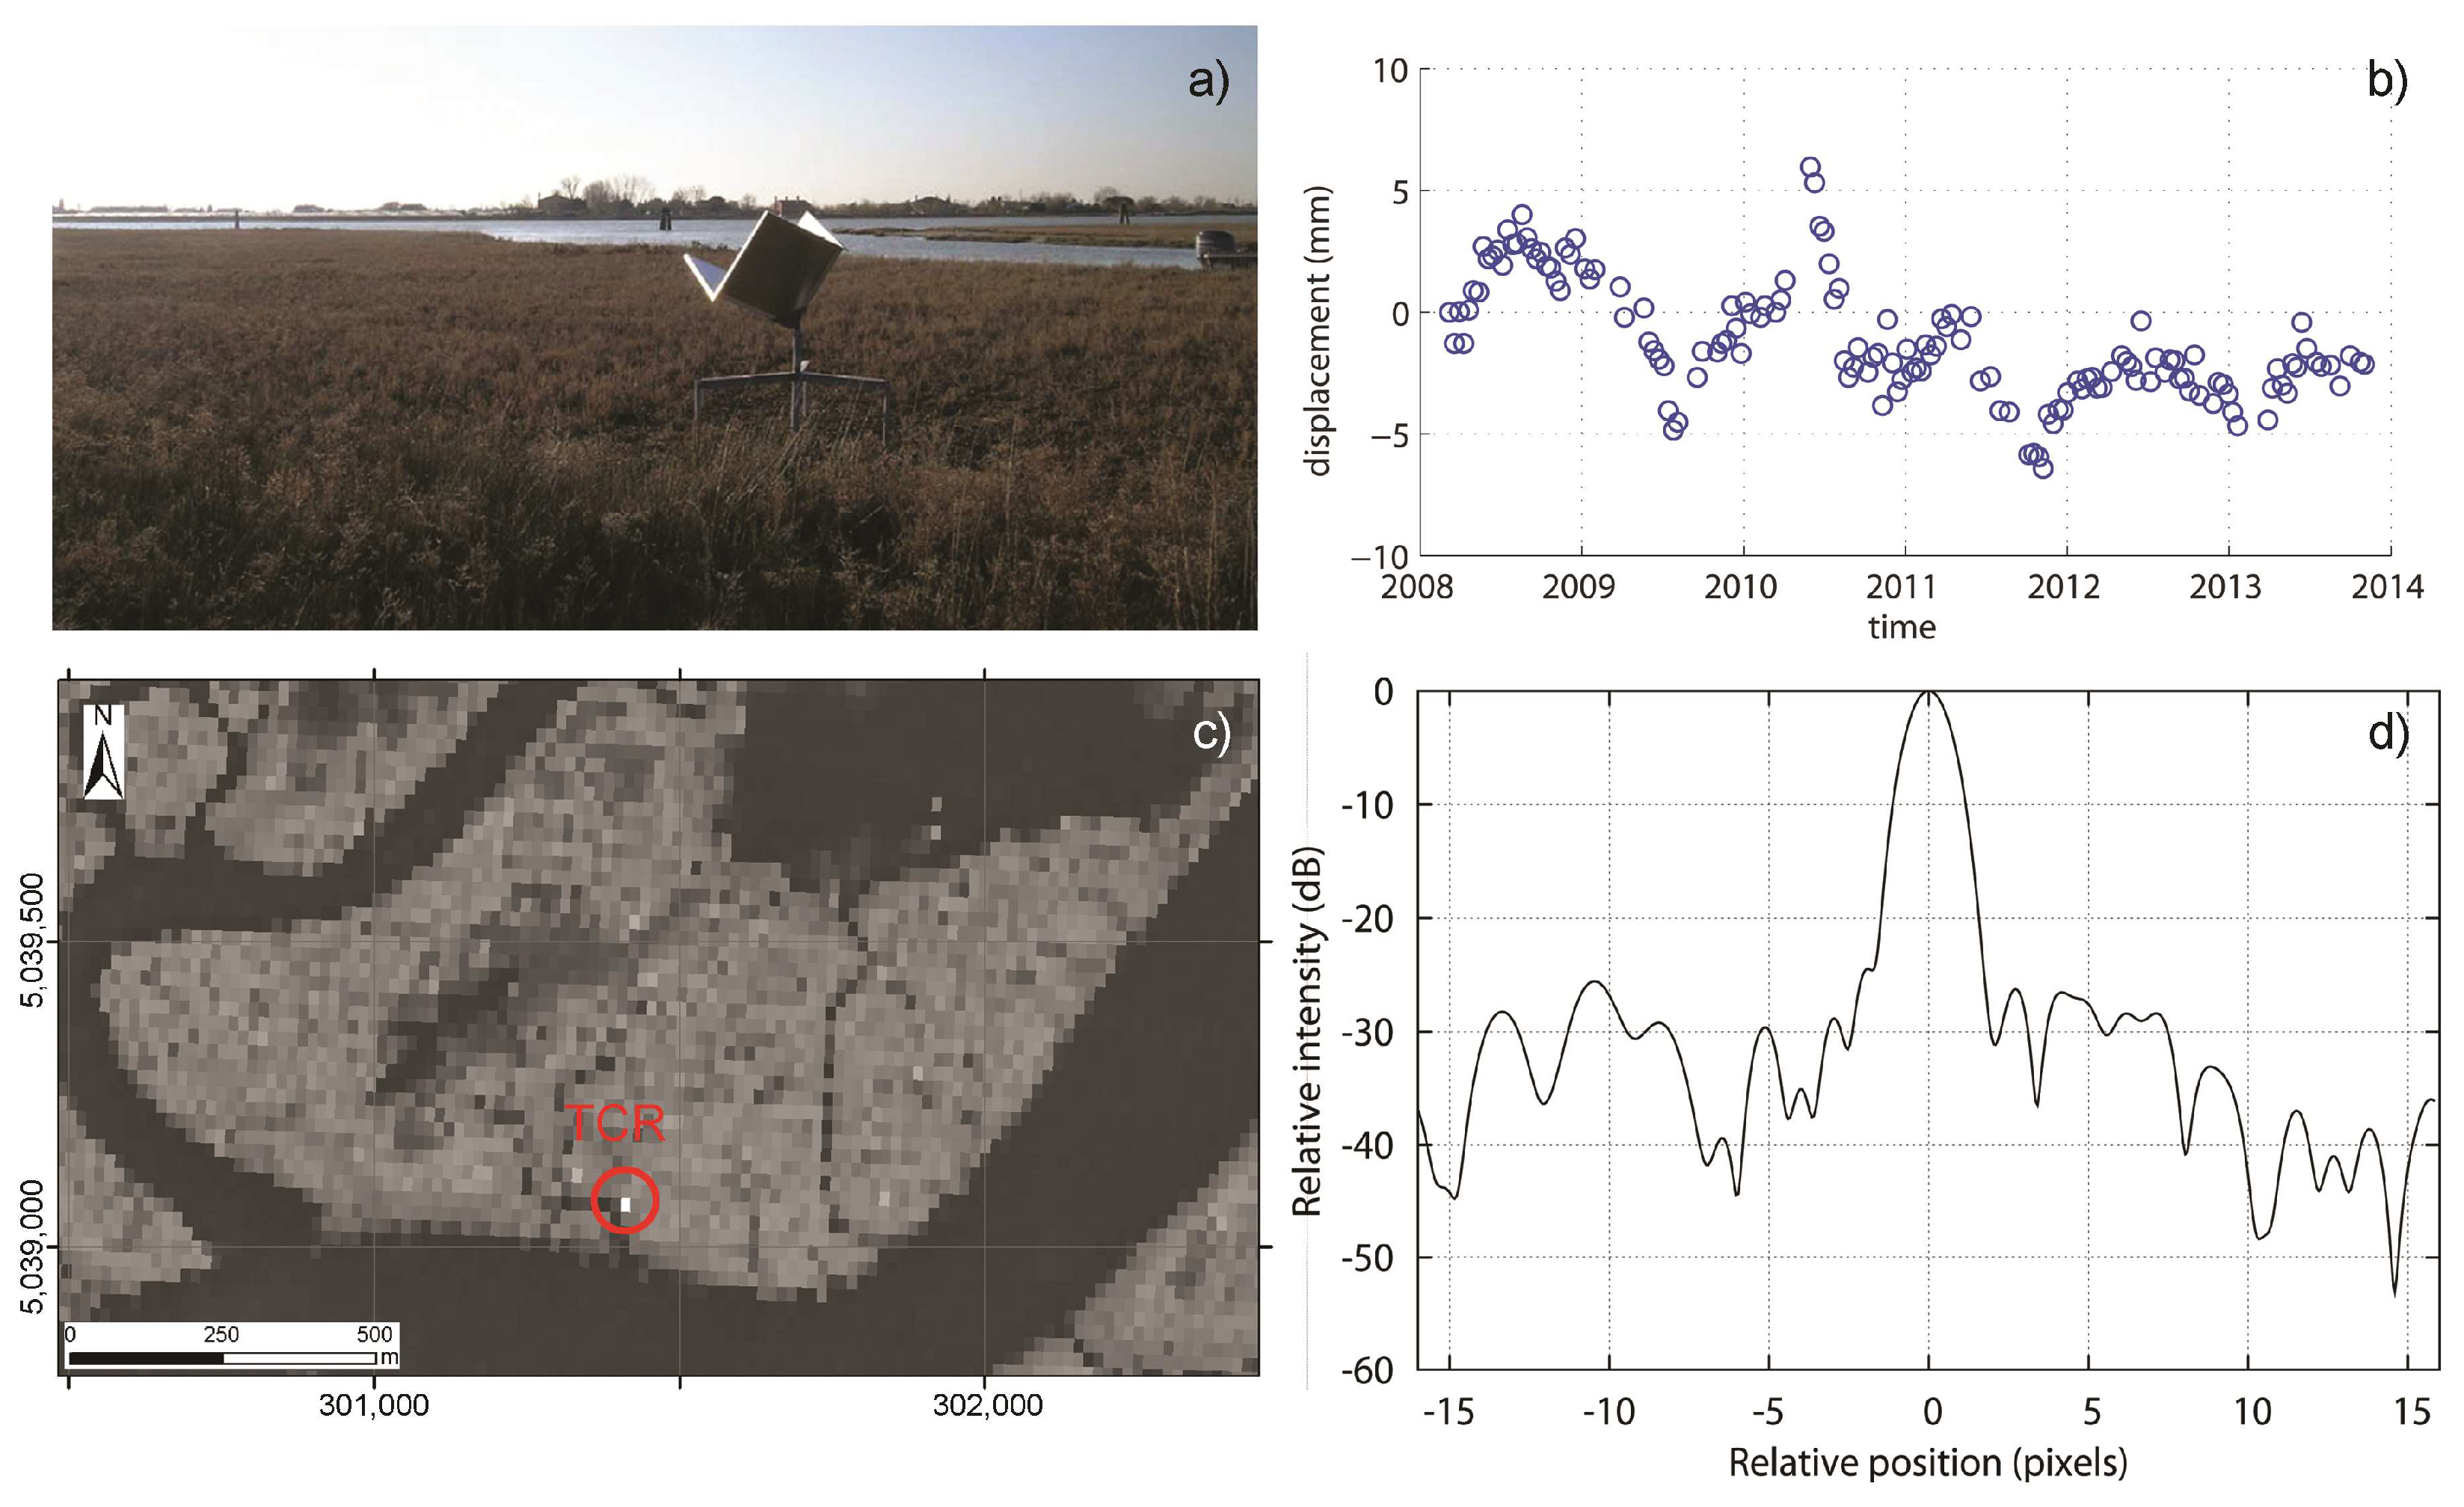
17]. The TCRs, placed in areas without any other strong scatterer, are characterized by a 60-cm long edge and installed with foundations ranging different depths and at the same height above ground in order to study the possible differences in their relative settlement. Because high tides flood salt marshes, the TCRs were installed at a height of 1 m above the mean sea level, i.e., constantly outside the water.
The experiment provided new information to improve the knowledge of the processes acting in the Venice Lagoon. We found that the northern basin of the lagoon is subsiding at a rate of about 3–4 mm/year, while the central and the southern lagoon regions are more stable [
17].
The comparison between the TCR displacements retrieved by TerraSAR-X and ENVISAT revealed that the noise in the time series is smaller with TerraSAR-X than with ENVISAT, because of the better SCR as a consequence of the shorter wavelength and smaller resolution cell in relationship to the size of the TCR [
17].
The TerraSAR-X analysis on the TCRs for 2008–2011 provided by Strozzi et al., 2013 [
17] has been here extended including till to 2013; an example is shown in
Figure 5. The longer period of analysis improved the quantification of the TCRs velocity and confirmed the general previous displacement behavior. The long monitoring interval has revealed an almost yearly fluctuation in the displacement behavior, whose occurrence is under investigation.
Such observations indicate that SAR interferometry on TerraSAR-X images using a large network of artificial reflectors is an effective and powerful methodology to monitor land subsidence in transitional and natural environments where the loss of coherence is a major problem is the use of PSI.
4.4. The MoSE Constructions at the Lagoon Inlets
The geomechanical characterization of coastal soils is of considerable interest to geotechnical and geo-environmental researchers in relation to the stability of large coastal structures, such as breakwaters, jetties, and wharfs [
35].
Starting from the mid-1990s, the jetties at the three inlets of Lido, Malamocco, and Chioggia were reinforced, and, since 2005, in the framework of the MoSE works (i.e., the project of mobile barriers for the temporarily closure of the lagoon to the sea), they have been strongly reshaped and supplemented by offshore breakwaters. The construction of the mobile barriers at the three inlets raised concerns about possible important settlements caused by: (i) the load of the complementary structures (e.g., jetties, breakwaters, locks, and an artificial island) on the Quaternary deposits; and (ii) the groundwater drainage required to developed the structures.
Presently, the works at the inlets are still ongoing and monitoring land displacements in these sectors has a double aim: (i) the evaluation of possible effects of the works on the littoral environment; and (ii) the quantification of the consolidation of the new coastal structures. The former issue can support the public authorities in monitoring the environmental impacts of these giant works, while the latter can help engineering companies building the MoSE to check the absolute and differential displacements that can threaten the integrity and efficiency of the structures. In the usual civil engineering practice, leveling, GPS and laser are used to measure the settlement of some selected benchmarks established at fixed intervals along the structure. These traditional methods give straightforward and accurate results, but their applications are restricted to discrete point measurements and sometimes impractical in the rugged ground condition.
The effectiveness of TerraSAR-X to detect ground movements induced by the activities in the MoSE yards has been tested by IPTA on 30 satellite radar images acquired between March 2008 and January 2009 [
15]. Significant local settlements up to 70 mm/year have been detected at the three inlets. Sinking rates less than 3 mm/year were measured in the parts of the jetties not affected by the restoration works; conversely, sinking rates up to 30 mm/year are detected in the newer structures. Similar rates have been measured also over the period August 2012–November 2013 (
Figure 6a).
The study revealed for the first time that only one year of TerraSAR-X acquisitions suffices to accurately and reliably detect the consolidation trend of large coastal structures. These results have been confirmed by the analyses carried out over the two longer periods, i.e., between 2008 and 2011 [
19], and from 2008 to 2013 (
Figure 6b,c).
An example of the updated analysis of the displacement history of four PTs detected at the Malamocco inlet is reported in
Figure 7. For two PTs, i.e., A and B in
Figure 7a, at the tip of the old jetties and in the new breakwater, respectively, the analysis also includes the displacements measured by ENVISAT (
Figure 7a). Notice the quite uniform trend of the settlement of the breakwater, which construction started in 2003. The displacements at the place where the mobile gates of the MoSE will be connected are shown in
Figure 7b.
4.5. The Newly Built-Up Areas
Over the last decades, newly built-up areas have been developed on the Venice coastland with residential, touristic and industrial purposes. The new urbanization is responsible for subsidence bowls spread all over the Venice coastland, wherein several urban suburbs and industrial/commercial sites have grown rapidly by changing farmland use. The new buildings exert heavy loads on relatively recent coastal deposits and lead to consolidation of the shallow subsoil below their foundations [
11,
36].
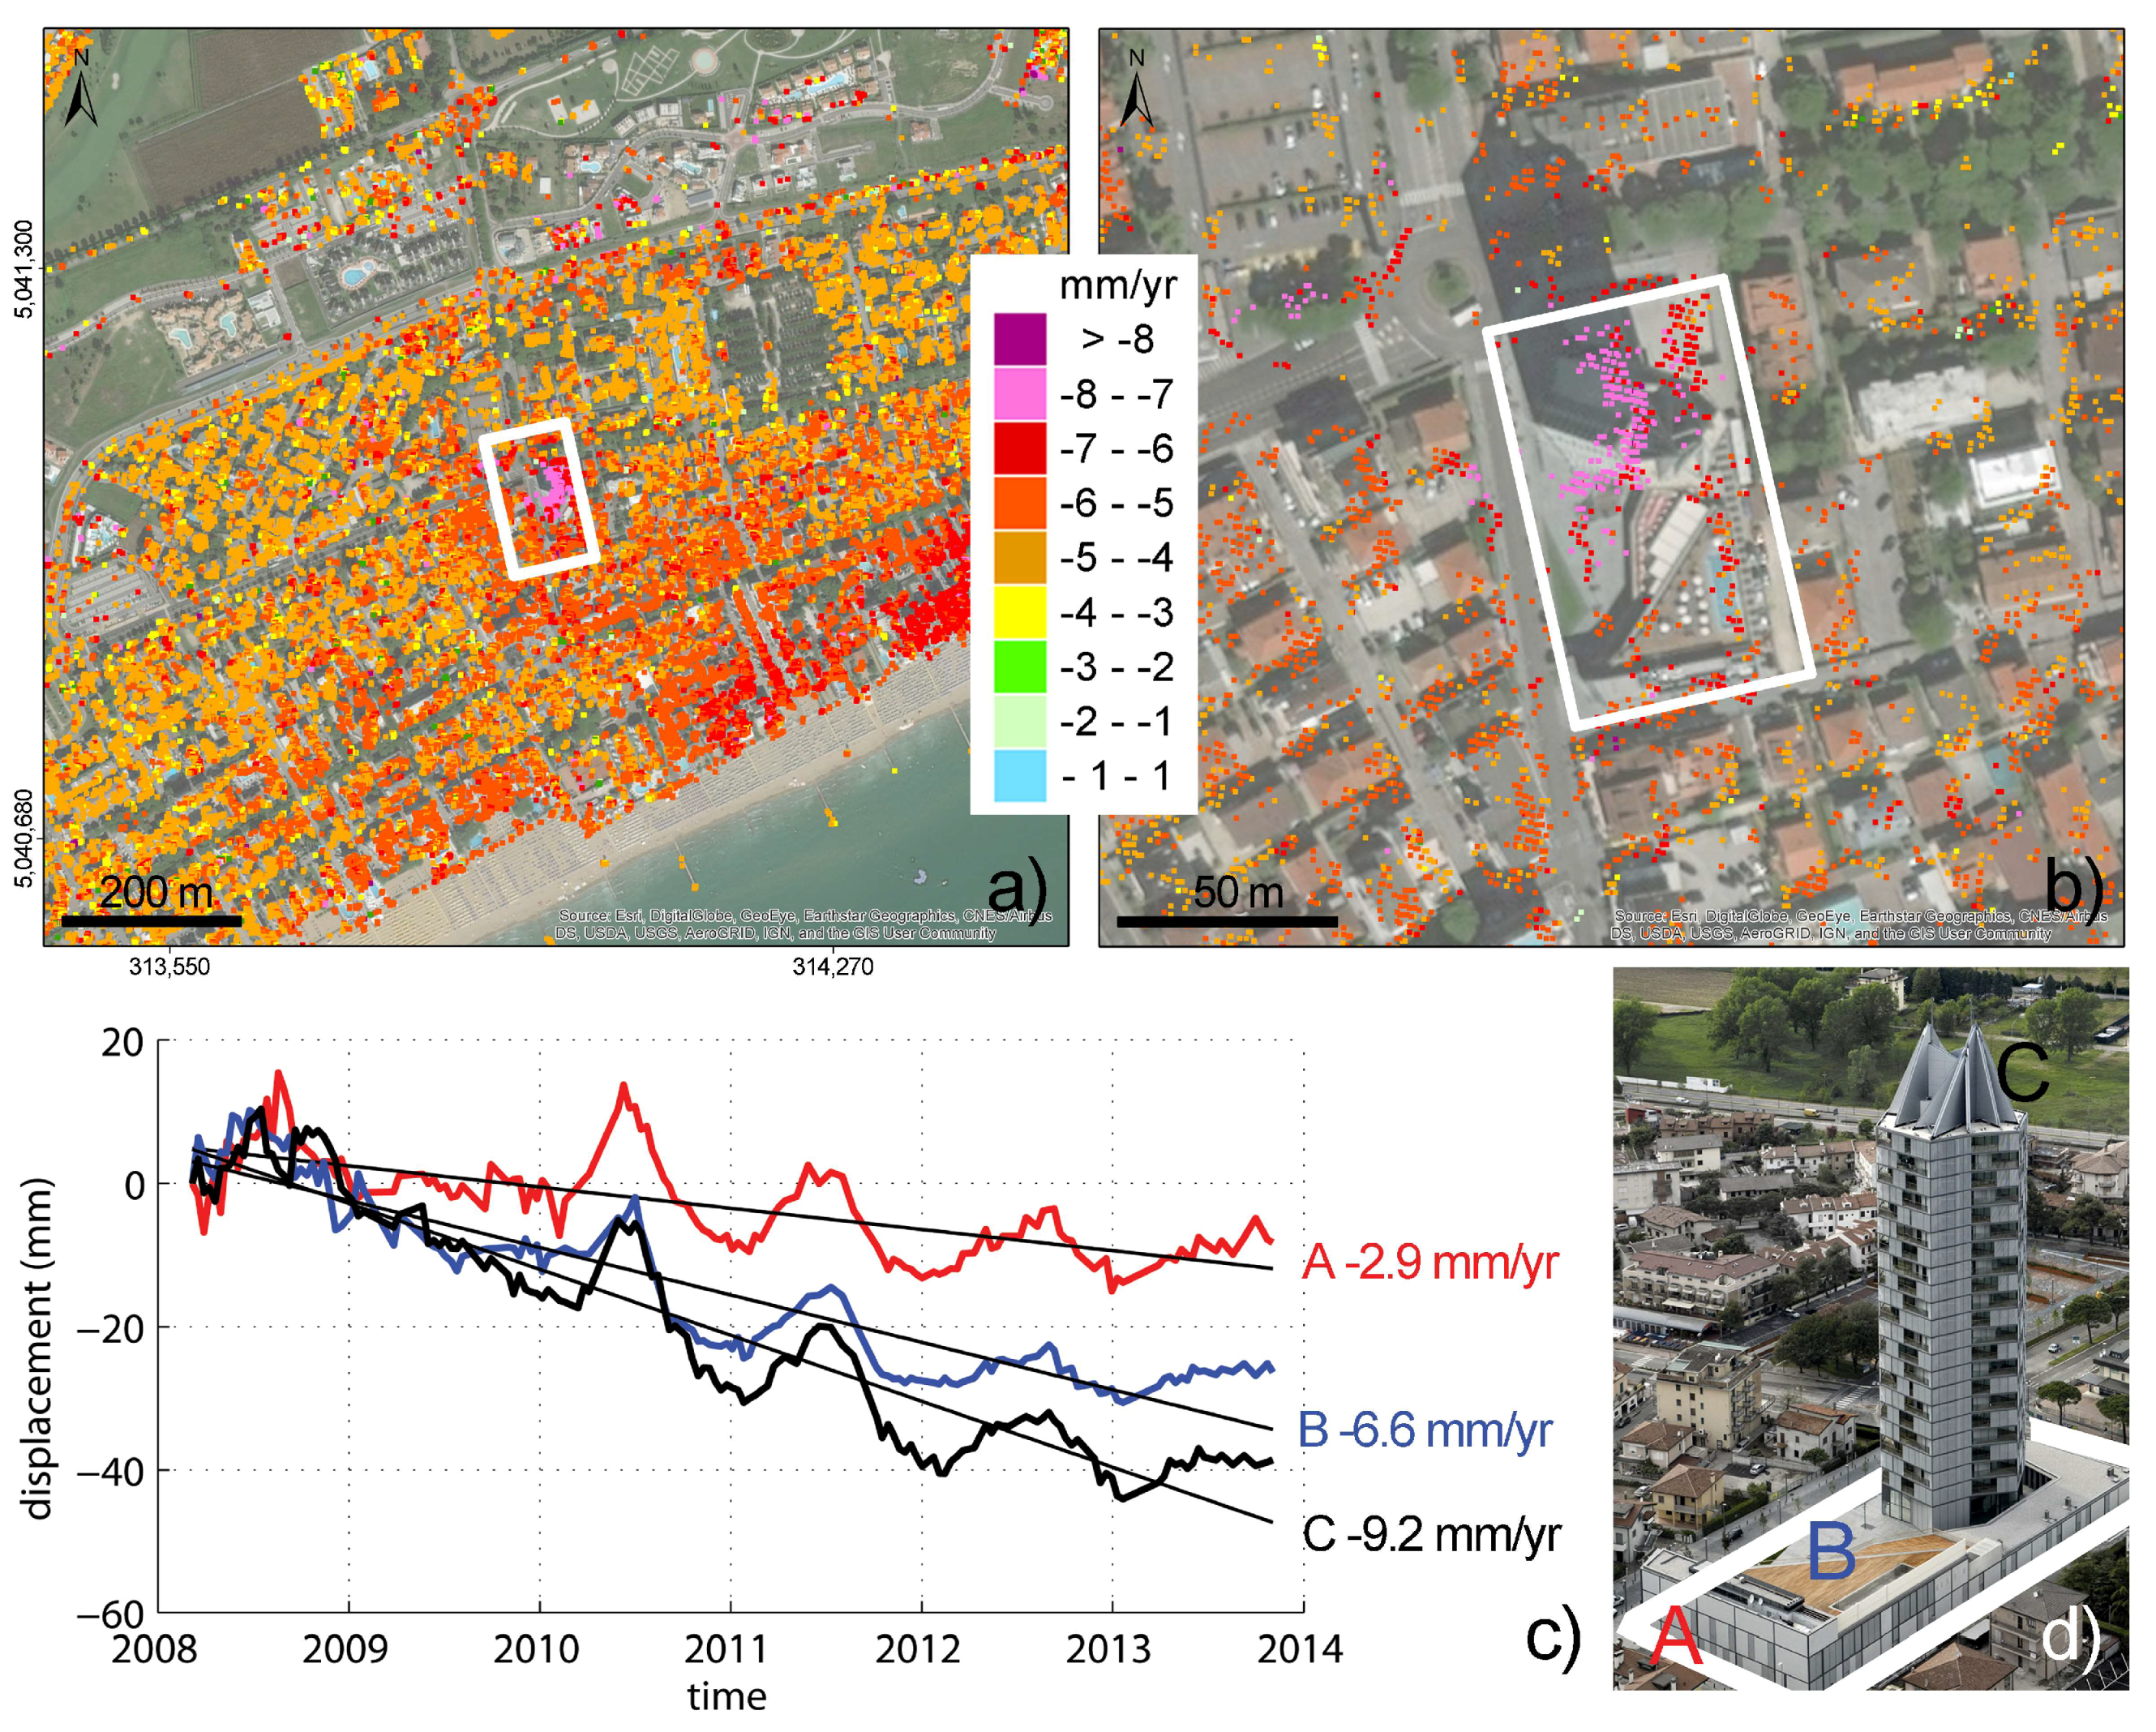
This process has been clearly revealed by TerraSAR-X over the 2008–2011 time span, both at the scale of single buildings (
Figure 8) as well as at the scale of villages or portion of small urban centers [
19].
Figure 8 shows an updated analysis using the 2008–2013 dataset of the displacement behavior recorded in the surroundings of the 73-m high Aquileia Tower, downtown Jesolo. The tower construction was completed in 2008 and significantly settled (totaling 4 cm) during the following years because of its load. The displacement profile of the PT termed as C in
Figure 8c exhibits the log behavior typical of an ongoing consolidation process, with a sinking rate that decreased from more than 10 mm/year over 2009 and 2010 to about 3–4 mm/year in 2012 and 2013, i.e., the subsidence value characterizing the whole area (
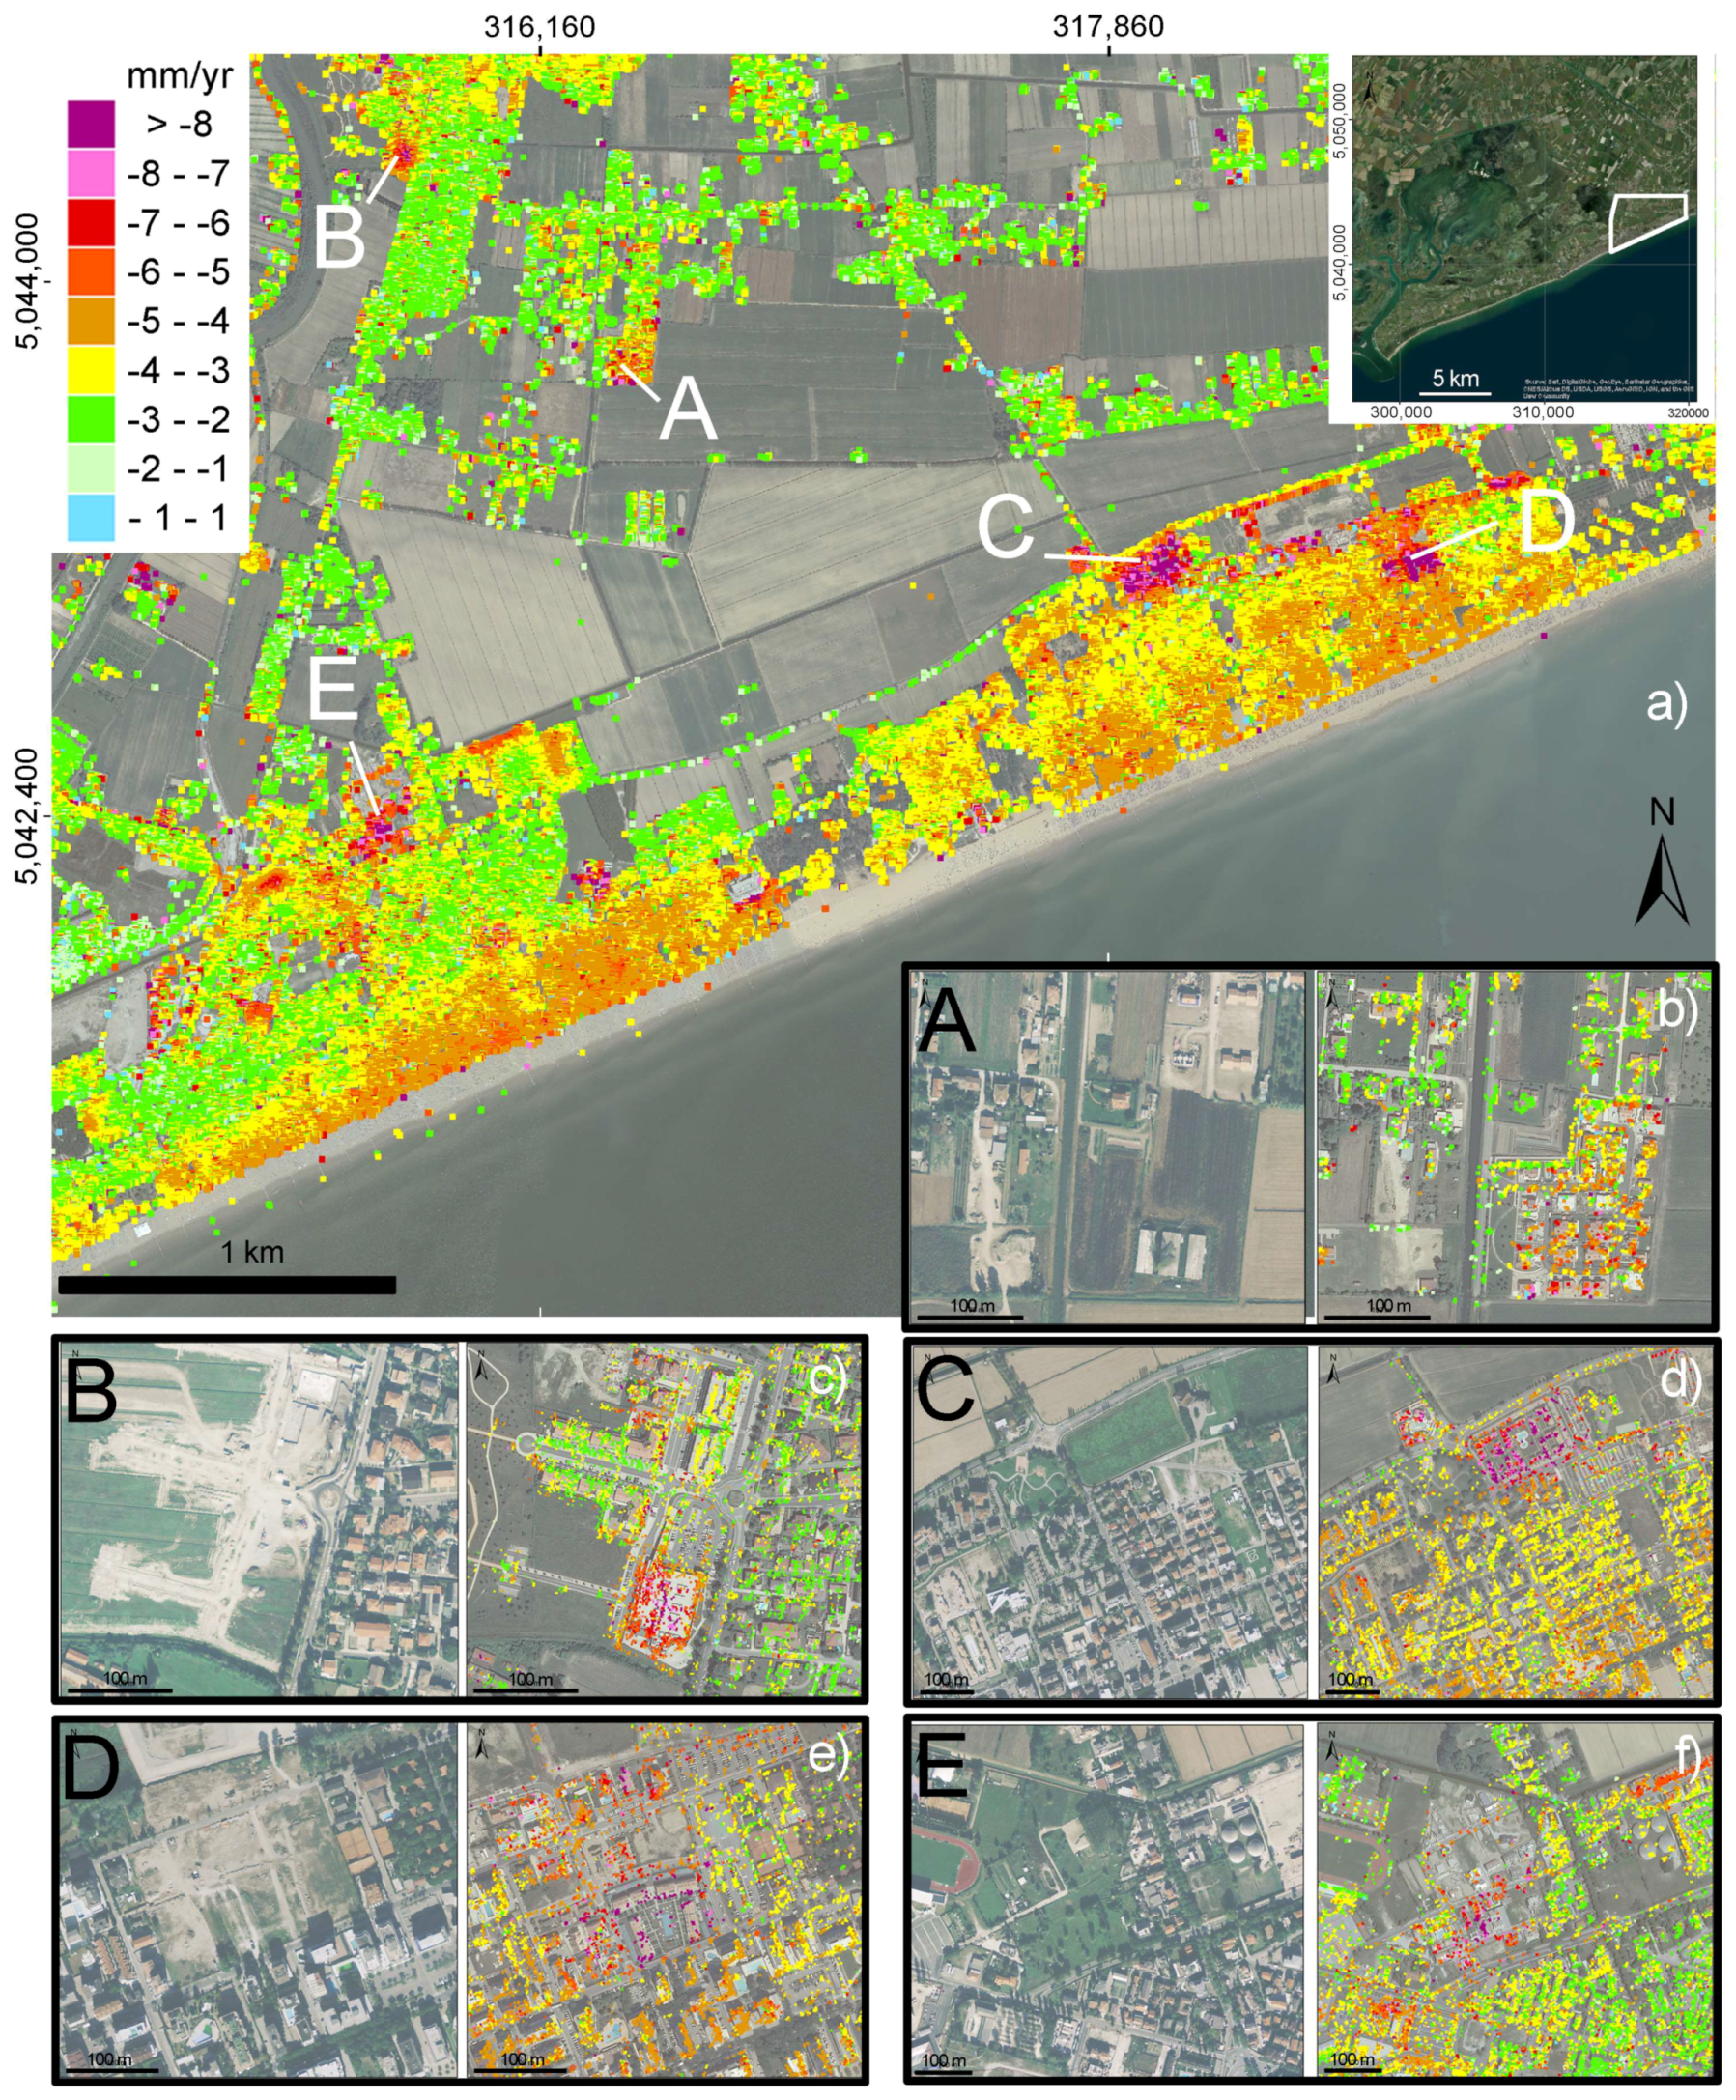
Figure 8a). Other significant movements due to the built-up of new districts in the tourist villages to the north of the Venice Lagoon are clearly visible in
Figure 9a. Local ground movements up to −8 mm/year are detected due to the load exerted by the new constructions, which were established over the period covered by the TerraSAR-X acquisitions (
Figure 9b–f) in areas recently reclaimed and therefore characterized by compressible shallow soils.
5. Conclusive Remarks
Over the last century, eustasy and land subsidence have produced a RSLR on the Northern Adriatic coastlands ranging from centimeters to meters. RSLR seriously increased the vulnerability and the geological hazard (e.g., river flooding, riverbank stability, seawater intrusion, and coastline regression) of low-lying environments such as deltas, lagoons, wetlands, and farmlands, a large portion of which lies 3–4 m below the mean sea level. The city of Venice and its lagoon represent extraordinary environments and human heritages susceptible to loss in surface elevation relative to the mean sea level. Natural processes and anthropogenic activities drive the ground dynamics at regional and local scale and at in the long and short term. Being land subsidence the main component of the RSLR, it has been monitored since the end of the 19th century. Over the new millennium, SAR-based interferometry has been effectively used to detect land displacements in the Venice coastland, leading to a significant improvement in both the spatial coverage and the knowledge on the land subsidence process. The use of TerraSAR-X allowed further advancements in monitor ground movements of single structures as well as at regional scale with millimetric precision and metric spatial resolution. The information on ground movements, from a few hundreds of leveling benchmarks measured in the last century increased to some millions of scatterers detected by TerraSAR-X images. The very high spatial resolution and the short repeat-time interval of TerraSAR-X acquisitions enable investigating land displacements with an unprecedented level of detail, opening new perspectives to geodynamic research and environmental studies. Civil engineering sectors also benefit from TerraSAR-X for the possibility to monitor large infrastructures.
A large experience has been acquired by the authors over the last decade in the use of PSI and the result interpretation in the Venice area. The comparison between PSI outcomes provided by TerraSAR-X and other X-, C-, and L-band SAR satellites over the same area has allowed us to point out the main strength factors of this satellite:
The short repeat-time interval of 11 days and the impressive regularity of image acquisition allow obtaining sub-millimeter accuracy just with 30 scenes, i.e., about one year only.
The 3 m spatial resolution allows capturing the high variability of the ground movements rates, revealing details on land subsidence never been obtained with other measuring techniques both at large and local scale analysis.
The regularity of the image acquisition allows using artificial trihedral corner reflectors to overcome the PSI limitation to detect ground movements in wetlands.
The main knowledge advances in understanding and interpretation of land subsidence in the Venice area are in the following:
The impressive dataset consisting of more 1,900,000 PS depicts a new image of the land subsidence pattern at the Venice coastland and reveals a very high heterogeneity of the ground dynamics both at the local and the regional scales.
Short-term local man-induced displacements have been revealed affecting the historical center of Venice. In 2008, about 25% of the city experienced some movements due to anthropogenic causes.
Natural and man-made salt marshes are characterized by a quite wide range of subsidence rates. Displacements range from small uplifts to subsidence rates of more than 20 mm/year and land subsidence is much larger on man-made than natural salt marshes, with a significant negative correlation with the marsh age.
The subsidence within the lagoon basin, quantified for the first time by a network of TCRs, is 3–4, 1–2 and 2–3 mm/year in the northern, central and southern portions, respectively.
Significant settlements of a few centimeters per year have been detected at the three inlets where new structures and restoration works were carried out.
Newly built-up areas induced local land subsidence with sinking rates up to three times higher than those characterizing the older urban areas.
In the Venice Lagoon, where only a few millimeters of further sinking would drastically enhance the environment deterioration and raise concern for the historical heritage, PSI on TerraSAR-X provides accurate data to study natural and anthropogenic land subsidence, as well as to monitor the settlement of structures and infrastructures, e.g., the mobile barrier works at the lagoon inlets. In addition, the integration of geotechnical, geological, morphological and environmental data with TerraSAR-X interferometric products will allow vulnerability and risk analyses for management plans aimed at a sustainable coastland use.
Author Contributions
L.T., C.D.L. and P.T. calibrated and validated the interferometric solutions by CGPS, processed and analyzed the outcomes, interpreted data and wrote the paper. T.S. performed the SAR processing by GAMMA Software.
Funding
This research received no external funding.
Acknowledgments
This work has been developed in the framework of the Flagship Project RITMARE—The Italian Research for the Sea—coordinated by the Italian National Research Council and funded by the Italian Ministry of Education, University and Research within the National Research Program 2011–2013. Data courtesy: (1) Project LAN0242, “Monitoring land subsidence in Venice”; (2) Project COA0612 © DLR, “Assessing vertical movements of natural tidal landforms and anthropogenic structures at the Venice Lagoon inlets”; and (3) Project COA1800©DLR, “Ground surface dynamics in the Venice Lagoon: five years of monitoring of natural tidal landforms and anthropogenic structures by TerraSAR-X”. CGPS Time series, Nevada Geodetic Laboratory (NGL). This work is a contribution to the International Geoscience Programme (IGCP) Project No. 663: “Impact, Mechanism, Monitoring of Land Subsidence in Coastal cities (IM2LSC)”.
Conflicts of Interest
The authors declare no conflict of interest.
References
- Trincardi, F.; Barbanti, A.; Bastianini, M.; Benetazzo, A.; Cavaleri, L.; Chiggiato, J.; Papa, A.; Pomaro, A.; Sclavo, M.; Tosi, L.; et al. The 1966 flooding of Venice: What time taught us for the future. Oceanography 2016, 29, 178–186. [Google Scholar] [CrossRef]
- Carbognin, L.; Teatini, P.; Tomasin, A.; Tosi, L. Global change and relative sea level rise at Venice: What impact in term of flooding. Clim. Dyn. 2010, 35, 1055–1063. [Google Scholar] [CrossRef]
- Carbognin, L.; Tosi, L. Interaction between Climate Changes, Eustacy and Land Subsidence in the North Adriatic Region, Italy. Mar. Ecol. 2002, 23, 38–50. [Google Scholar] [CrossRef]
- Teatini, P.; Strozzi, T.; Tosi, L.; Wegmüller, U.; Werner, C.; Carbognin, L. Assessing short- and long-time displacements in the Venice coastland by synthetic aperture radar interferometric point target analysis. J. Geophys. Res. Earth Surf. 2007, 112. [Google Scholar] [CrossRef] [Green Version]
- Tosi, L.; Teatini, P.; Strozzi, T.; Carbognin, L.; Brancolini, G.; Rizzetto, F. Ground surface dynamics in the northern Adriatic coastland over the last two decades. Rendiconti Lincei Sci. Fisiche e Nat. 2010, 21, 115–129. [Google Scholar] [CrossRef]
- Liu, G.; Jia, G.; Nie, Y.; Li, T.; Zhang, R.; Yu, B.; Li, Z. Detecting Subsidence in Coastal Areas by Ultrashort-Baseline TCPInSAR on the Time Series of High-Resolution TerraSAR-X Images. IEEE Trans. Geosci. Remote Sens. 2014, 52, 1911–1923. [Google Scholar]
- Yang, M.; Yang, T.; Zhang, L.; Lin, J.; Qin, X.; Liao, M. Spatio-Temporal Characterization of a Reclamation Settlement in the Shanghai Coastal Area with Time Series Analyses of X-, C-, and L-Band SAR Datasets. Remote Sens. 2018, 10, 329. [Google Scholar] [CrossRef]
- Wu, J.; Hu, F. Monitoring Ground Subsidence along the Shanghai Maglev Zone Using TerraSAR-X Images. IEEE Geosci. Remote Sens. Lett. 2017, 14, 117–121. [Google Scholar] [CrossRef]
- Luo, Q.; Zhou, G.; Perissin, D. Monitoring of Subsidence along Jingjin Inter-City Railway with High-Resolution TerraSAR-X MT-InSAR Analysis. Remote Sens. 2017, 9, 717. [Google Scholar] [CrossRef]
- Putri, R.F.; Bayuaji, L.; Sumantyo, J.T.S.; Kuze, H. TerraSAR-X DinSAR for land deformation detection in Jakarta Urban area, Indonesia. J. Urban Environ. Eng. 2013, 7, 195–205. [Google Scholar] [CrossRef]
- Le, T.S.; Chang, C.-P.; Nguyen, X.T.; Yhokha, A. TerraSAR-X Data for High-Precision Land Subsidence Monitoring: A Case Study in the Historical Centre of Hanoi, Vietnam. Remote Sens. 2016, 8, 338. [Google Scholar] [CrossRef]
- Kim, S.W.; Dixon, T.; Amelung, F.; Wdowinski, S. A time-series deformation analysis from TerraSAR-X SAR data over New Orleans, USA. In Proceedings of the 3rd International Asia- Pacific Conference on Synthetic Aperture Radar (APSAR), Seoul, Korea, 26–30 September 2011. [Google Scholar]
- Antonova, S.; Sudhaus, H.; Strozzi, T.; Zwieback, S.; Kääb, A.; Heim, B.; Langer, M.; Bornemann, N.; Boike, J. Thaw Subsidence of a Yedoma Landscape in Northern Siberia, Measured In Situ and Estimated from TerraSAR-X Interferometry. Remote Sens. 2018, 10, 494. [Google Scholar] [CrossRef]
- Gambolati, G.; Teatini, P.; Ferronato, M.; Strozzi, T.; Tosi, L.; Putti, M. On the uniformity of anthropogenic Venice uplift. Terra Nova 2009, 21, 467–473. [Google Scholar] [CrossRef]
- Strozzi, T.; Teatini, P.; Tosi, L. TerraSAR-X reveals the impact of the mobile barrier works on the Venice coastal stability. Remote Sens. Environ. 2009, 113, 2682–2688. [Google Scholar] [CrossRef]
- Tosi, L.; Teatini, P.; Bincoletto, L.; Simonini, P.; Strozzi, T. Integrating geotechnical and interferometric SAR measurements for secondary compressibility characterization of coastal soils. Surv. Geophys. 2012, 33, 907–926. [Google Scholar] [CrossRef]
- Strozzi, T.; Teatini, P.; Tosi, L.; Wegmüller, U.; Werner, C. Land subsidence of natural transitional environments by satellite radar interferometry on artificial reflectors. J. Geophys. Res. Earth Surf. 2013, 118, 1177–1191. [Google Scholar] [CrossRef] [Green Version]
- Tosi, L.; Teatini, P.; Strozzi, T. Natural versus anthropogenic subsidence of Venice. Sci. Rep. 2013, 3, 2710. [Google Scholar] [CrossRef] [PubMed]
- Tosi, L.; Strozzi, T.; Da Lio, C.; Teatini, P. Regional and local land subsidence at the Venice coastland by TerraSAR-X PSI. Proc. IAHS 2015, 372, 199–205. [Google Scholar] [CrossRef] [Green Version]
- Da Lio, C.; Teatini, P.; Strozzi, T.; Tosi, L. Understanding land subsidence in salt marshes of the Venice Lagoon from SAR Interferometry and ground-based investigations. Remote Sens. Environ. 2018, 205, 56–70. [Google Scholar] [CrossRef]
- Werner, C.; Wegmüller, U.; Strozzi, T.; Wiesmann, A. Interferometric Point Target Analysis for deformation mapping. In Proceedings of the Geoscience and Remote Sensing Symposium (IGARSS 2003), Toulouse, France, 21–25 July 2003; IEEE International: Piscataway, NJ, USA, 2003; Volume 7, pp. 4362–4364. [Google Scholar]
- Wegmüller, U.; Werner, C.; Strozzi, T.; Wiesmann, A. Monitoring mining induced surface deformation. In Proceedings of the IEEE International Geoscience and Remote Sensing Symposium (IGARSS 2004), Anchorage, AK, USA, 20–24 September 2004; Volume 3, pp. 1933–1935. [Google Scholar]
- Bock, Y.; Wdowinski, S.; Ferretti, A.; Novali, F.; Fumagalli, A. Recent subsidence of the Venice Lagoon from continuous GPS and interferometric synthetic aperture radar. Geochem. Geophys. Geosyst. 2012, 13, Q03023. [Google Scholar] [CrossRef]
- Lan, H.; Gao, X.; Liu, H.; Yang, Z.; Li, L. Integration of TerraSAR-X and PALSAR PSI for detecting ground deformation. Int. J. Remote Sens. 2013, 34, 5393–5408. [Google Scholar] [CrossRef]
- Ciavola, P.; Armaroli, C.; Chiggiato, J.; Valentini, A.; Deserti, M.; Perini, L.; Luciani, P. Impact of storms along the coastline of Emilia-Romagna: The morphological signature on the Ravenna coastline (Italy). J. Coast. Res. 2007, 540–544, 540–544. [Google Scholar] [CrossRef]
- Teatini, P.; Tosi, L.; Strozzi, T.; Carbognin, L.; Cecconi, G.; Rosselli, R.; Libardo, S. Resolving land subsidence within the Venice Lagoon by persistent scatterer SAR interferometry. Phys. Chem. Earth 2012, 40–41, 72–79. [Google Scholar] [CrossRef]
- Hanssen, R.; Feijt, A. A first quantitative evaluation of atmospheric effects on SAR interferometry. In Proceedings of the Fringe 96′ Workshop on ERS SAR Interferometry, Zurich, Switzerland, 30 September–2 October 1996; ESA SP-406. ESA Publications Division: Paris, France, 1997. [Google Scholar]
- Ketelaar, V.B.H.G. Satellite Radar Interferometry: Subsidence Monitoring Techniques; Springer: Berlin, Germany, 2009. [Google Scholar]
- Rizzetto, F.; Tosi, L. Aptitude of modern salt marshes to counteract relative sea-level rise, Venice Lagoon (Italy). Geology 2011, 39, 755–758. [Google Scholar] [CrossRef]
- Jankowski, K.L.; Törnqvist, T.E.; Fernandes, A.M. Vulnerability of Louisiana’s coastland wetlands to present-day rates of relative sea-level rise. Nat. Commun. 2017, 8. [Google Scholar] [CrossRef] [PubMed]
- Rizzetto, F.; Tosi, L.; Carbognin, L.; Bonardi, M.; Teatini, P. Geomorphic setting and related hydrogeological implications of the coastal plain south of the Venice Lagoon, Italy. Int. Assoc. Hydrol. Sci. 2003, 278, 463–470. [Google Scholar]
- Tosi, L.; Teatini, P.; Carbognin, L.; Brancolini, G. Using high resolution data to reveal depth-dependent mechanisms that drive land subsidence: The Venice coast, Italy. Tectonophysics 2009, 474, 271–284. [Google Scholar] [CrossRef]
- Biessy, G.; Moreau, F.; Dauteuil, O.; Bour, O. Surface deformation of an intraplate area from GPS time series. J. Geodyn. 2011, 52, 24–33. [Google Scholar] [CrossRef]
- Teatini, P.; Tosi, L.; Strozzi, T.; Carbognin, L.; Wegmüller, U.; Rizzetto, F. Mapping regional land displacements in the Venice coastland by an integrated monitoring system. Remote Sens. Environ. 2005, 98, 403–413. [Google Scholar] [CrossRef]
- Lv, X.; Yazici, B.; Bennett, V.; Zeghal, M.; Abdoun, T. Joint pixels InSAR for health assessment of levees in New Orleans. In Proceedings of the Geo-Congress: Stability and Performance of Slopes and Embankments III, Geotechnical Special Publication No. 231, San Diego, CA, USA, 3–6 March 2013; ASCE: Reston, VA, USA, 2013; pp. 179–288. [Google Scholar]
- Fiaschi, S.; Tessitore, S.; Bonì, R.; Di Martire, D.; Achilli, V.; Borgstrom, S.; Ibrahim, A.; Floris, M.; Meisina, C.; Ramondini, M.; et al. From ERS-1/2 to Sentinel-1: Two decades of subsidence monitored through A-DInSAR techniques in the Ravenna area (Italy). GISci. Remote Sens. 2016, 54, 305–328. [Google Scholar] [CrossRef]
Figure 1.
Example of PSI outcome calibration: (a) plane model (green isolines, mm/year) based on the Cavallino (CAVA), Chioggia (SFEL) and Venice (VEN1) CGPS displacements; and (b–d) comparison between the CGPS and the calibrated PSI time series. Red squares are the locations of the CGPS stations and the footprint of the TerraSAR-X frame (beam strip_006R) is represented by a red box.
Figure 2.
Ground movements at the regional scale. Average land displacements (mm/year) for the Venice coastland obtained by PSI on TerraSAR-X images acquired between March 2008 and November 2013. Positive values indicate uplift, negative values land subsidence. Base map source: Esri, DigitalGlobe, GeoEye, Earthstar Geographics, CNES/Airbus DS, USDA, USGS, AEX, Getmapping, Aerogrid, IGN, IGP, swisstopo, and the GIS User Community.
Figure 3.
Map of the recent anthropogenic land movements at Venice as obtained by subtracting the ERS-ENVISAT long-term ground movements from the TerraSAR-X short-term ground movements, resampling the PSI solutions on a regular 50 m grid [
18]. Negative and positive rates indicate areas where human activities are responsible for land settlements or reduce the natural subsidence, respectively. A few examples of human activities possibly influencing the subsidence values are shown in the photograph insets (available from
http://www.insula.it/ and Google Earth Images).
Figure 4.
Examples of average land displacement over the years 2008–2013 (mm/year) detected by PSI on the salt marshes: (
a) Burano; (
b) Tessera; and (
c) Cenesa. Salt marsh locations are indicated by white polygons in
Figure 2. Positive values indicate uplift, while negative values indicate land subsidence. In (
a-c) the natural portions of the salt marshes are shadowed in green, while man-made parts are shadowed in red. N and M refer to selected PTs on natural and man-made salt marsh, respectively, for which the displacement time series are provided in (
d–
f). Base map source: Esri, DigitalGlobe, GeoEye, Earthstar Geographics, CNES/Airbus DS, USDA, USGS, AEX, Getmapping, Aerogrid, IGN, IGP, swisstopo, and the GIS User Community.
Figure 5.
Example of displacement analysis of a TCR using TerraSAR-X images: (a) photograph of the TCR installed in a salt marsh located in the northern Venice lagoon; (b) time series of displacements obtained using TerraSAR-X data over the 2008–2013 period; (c) backscattering intensity image of the salt marsh highlighting the larger intensity (white pixel) in correspondence of the TCR; and (d) normalized intensity as a function of range for one for TerraSAR-X acquisition.
Figure 6.
Mean displacement rates from TerraSAR-X interferometry: between August 2012 and November 2013 at the Lido inlet (a); and between March 2008 and November 2013 at the Malamocco (b) and Chioggia (c) inlets. The backgrounds are Google earth images acquired in 2012. Movements are in the satellite line-of-sight direction, negative values indicate settlement and positive indicate uplift.
Figure 7.
Examples of displacement history in the LOS direction for four PTs (A-D), at the Malamocco inlet (see positions in
Figure 6b): (
a) ENVISAT PSI between April 2003 and November 2007 and TerraSAR-X between March 2008 and November 2013 (A and B); and (
b) TerraSAR-X PSI between March 2008 and November 2013 (C and D).
Figure 8.
Example of displacements induced by new urbanization at local scale. (a) Mean displacement rates between March 2008 and November 2013 from TerraSAR-X interferometry at Jesolo. Negative values indicate settlement and positive indicate uplift. (b) Enlargement of the displacement map in the Aquileia Tower area. (c) Displacement history in the satellite line-of-sight direction for three scatterers (A, B, C). (d) Photograph of Aquileia Tower, Jesolo, which is the cause of the largest movements. Base map source: Esri, DigitalGlobe, GeoEye, Earthstar Geographics, CNES/Airbus DS, USDA, USGS, AEX, Getmapping, Aerogrid, IGN, IGP, swisstopo, and the GIS User Community.
Figure 9.
(
a) Mean displacement rates from TerraSAR-X interferometry between March 2008 and November 2013 at the Jesolo coastland. A–E labels indicate local displacements induced by new urbanizations. (
b–
f) Blow ups of Areas A–E. Left and right background images are aerial photographs taken in 2006 and 2012, respectively. Base map source:
http://www.pcn.minambiente.it/mattm/en/view-service-wms/.
Table 1.
Comparison between CGPS and representative calibrated PSI average velocities obtained by TerraSAR-X (see
Figure 1b–d).
Table 1.
Comparison between CGPS and representative calibrated PSI average velocities obtained by TerraSAR-X (see
Figure 1b–d).
| CGPS Station | Time Span | CGPS LOS (mm/year) | PSI (mm/year) |
|---|
| CAVA | 2002–2011 | −2.83 ± 0.09 | −2.20 ± 0.20 |
| SFEL | 2000–2011 | −4.77 ± 0.09 | −6.58 ± 0.20 |
| VEN1 | 2000–2015 | −2.02 ± 0.07 | −2.10 ± 0.09 |
© 2018 by the authors. Licensee MDPI, Basel, Switzerland. This article is an open access article distributed under the terms and conditions of the Creative Commons Attribution (CC BY) license (http://creativecommons.org/licenses/by/4.0/).


