Article

Application of a Continuous Terrestrial Photogrammetric Measurement System for Plot Monitoring in the Beijing Songshan National Nature Reserve

1
Precision Forestry Key Laboratory of Beijing, Beijing Forestry University, Beijing 100083, China
2
China Unicom Software Research Institute, Beijing 100176, China
*
Author to whom correspondence should be addressed.
Remote Sens. 2018, 10(7), 1080; https://doi.org/10.3390/rs10071080
Submission received: 29 May 2018 / Revised: 29 June 2018 / Accepted: 5 July 2018 / Published: 6 July 2018
(This article belongs to the Special Issue Aerial and Near-Field Remote Sensing Developments in Forestry)

Abstract

:
Monitoring sample areas is the basis of ecological management. Songshan National Nature Reserve is one of the most important components of the ecosystem of the central metropolitan area of Beijing, and has fallen behind in its monitoring technology and methods. So, updating the existing equipment and technology is necessary. The current system suffers from high equipment costs and is not convenient to carry, so the work efficiency is low. Furthermore, the data cannot be visualized in three dimensions (3D), and complex terrain conditions cannot be measured. Therefore, this study researched and developed a continuous terrestrial photogrammetric measurement system that is theoretically based on the principles of photogrammetry, image processing technology, and dendrometry. The system applies a self-developed personal digital assistant (PDA) photogrammetry-based dendrometer and software to continuously evaluate stand sampling areas. Through experimental verification, the relative root mean square error (RMSE) of the trunk diameter measurements was found to be 5.59%, and the relative RMSE of hypsometrical measurements was 3.93%, which are both higher than the accuracy required for traditional forestry surveys. Furthermore, the advantages of this system include its low cost, lightweight equipment, easy operation, high measurement efficiency, 3D visualization, and applicability under complex terrain conditions. Since it is highly accurate and efficient, the continuous terrestrial photogrammetric system can be easily applied to monitor stand sampling areas in Songshan National Nature Reserve. In addition, it can be applied to second-class forest surveys in China, thus guaranteeing the monitoring of big data for the ecological environment of China.

Graphical Abstract

1. Introduction

The major content of forest surveys includes the individual tree diameter at breast height (DBH), individual tree height, stand average DBH, stand average height, stand volume, and stand density [1]. Plot measurement methods such as the visual survey method [2], point sampling method [3], stand volume method, angle gauge tree measurement method, average crown width method [4], and individual tree sampling method are commonly used in China and internationally. Since forested terrain can be complex and varied, and stand environments may be dark and damp, terrestrial field measurements [1] face many problems that challenge the use of measuring equipment. With advances in computerization, the use of better integrated, smarter, and more precise forest vegetation survey equipment has become a trend in forest resource monitoring [5]. The evolution of dendrometers has kept pace with improved technology and the development of better tree measurement principles [6].
Although Songshan National Nature Reserve is one of the core scenic areas near Beijing, the monitoring technologies and methods used in this area are relatively primitive from an international perspective. In establishing permanent sample plots, Songshan National Nature Reserve used measuring tapes and Newcon and Nikon rangefinders for distance measurements, but the measurement accuracy and efficiency of these methods is low [7,8,9]. Initially, Songshan National Nature Reserve used Barr Stroud dendrometers [2], optical dendrometers, telescoping measuring sticks [10], electronic angle gauges, and theodolite (forest) compasses for plot measurements to monitor forest resources, but these technologies usually only perform only one function with low precision, such as the measurement of height, angle, or azimuth. Later, the reserve attempted to use multipurpose precision instruments such electronic theodolites [11,12,13] and total stations [14,15]. These technologies have high precision in tree measurements, but the instruments are inconvenient to carry, and the measurement efficiency is low. Finally, Songshan National Nature Reserve used a portable miniature multifunctional smart station [15] and handheld digital multifunctional electronic forest measurement gun [16]. These instruments are easy to carry and have high precision, but 3D visualization analysis cannot be realized as with the previous technology. To resolve the problem of 3D forest stand visualization, a 3D laser scanner can model the tree trunks and canopy structure, as well as accurately calculate forest biomass [17]. Additionally, light detection and ranging (LiDAR) can be used for extensive and precise measurements in forests, and numerous studies have indicated that airborne radar measurements have strong parametric relationships with various measurement factors, such as the crown height, trunk basal area, and leaf area index [18,19,20,21]. Although advanced technologies such as 3D laser scanners, airborne LiDAR and airborne/spaceborne remote sensing have been extensively applied to forest resource surveys [22], they cannot yet supplant conventional field data-gathering methods due to issues such as high costs, complex technological operation, a lack of portability over complex terrain, and the inability to satisfy the requirements of large-scale data collection.
In view of the problems with the hardware of the existing monitoring system, such as the high cost of the measuring instruments, low measurement efficiency, inconvenient transport, and complicated operation, etc., a personal digital assistant (PDA) photogrammetric dendrometer system was researched and developed that is portable, easy to operate, and affordable. Related to the problems of poor effectiveness and low precision in the reconstruction of ground photogrammetric three-dimensional (3D) points, the new system employs an optimized adjustment algorithm for image correction, and stand plot continuous photogrammetric measurement software was developed. In combination with modeling software, this software can effectively reconstruct 3D point clouds. To address problems such as the difficulty of taking measurements in complex terrain and the loss of point clouds during the process of 3D reconstruction, an analytic algorithm and software for remote tree measurement were developed for the system. The software is embedded in a PDA photogrammetric dendrometer, and it can perform remote supplementary measurement of DBH and tree height in inaccessible or missed areas. Compared with existing systems, the advantages of this system include low cost, lightweight equipment, easy operation, high measurement efficiency, 3D visualization, and measurement under complex terrain conditions.

2. Materials and Methods

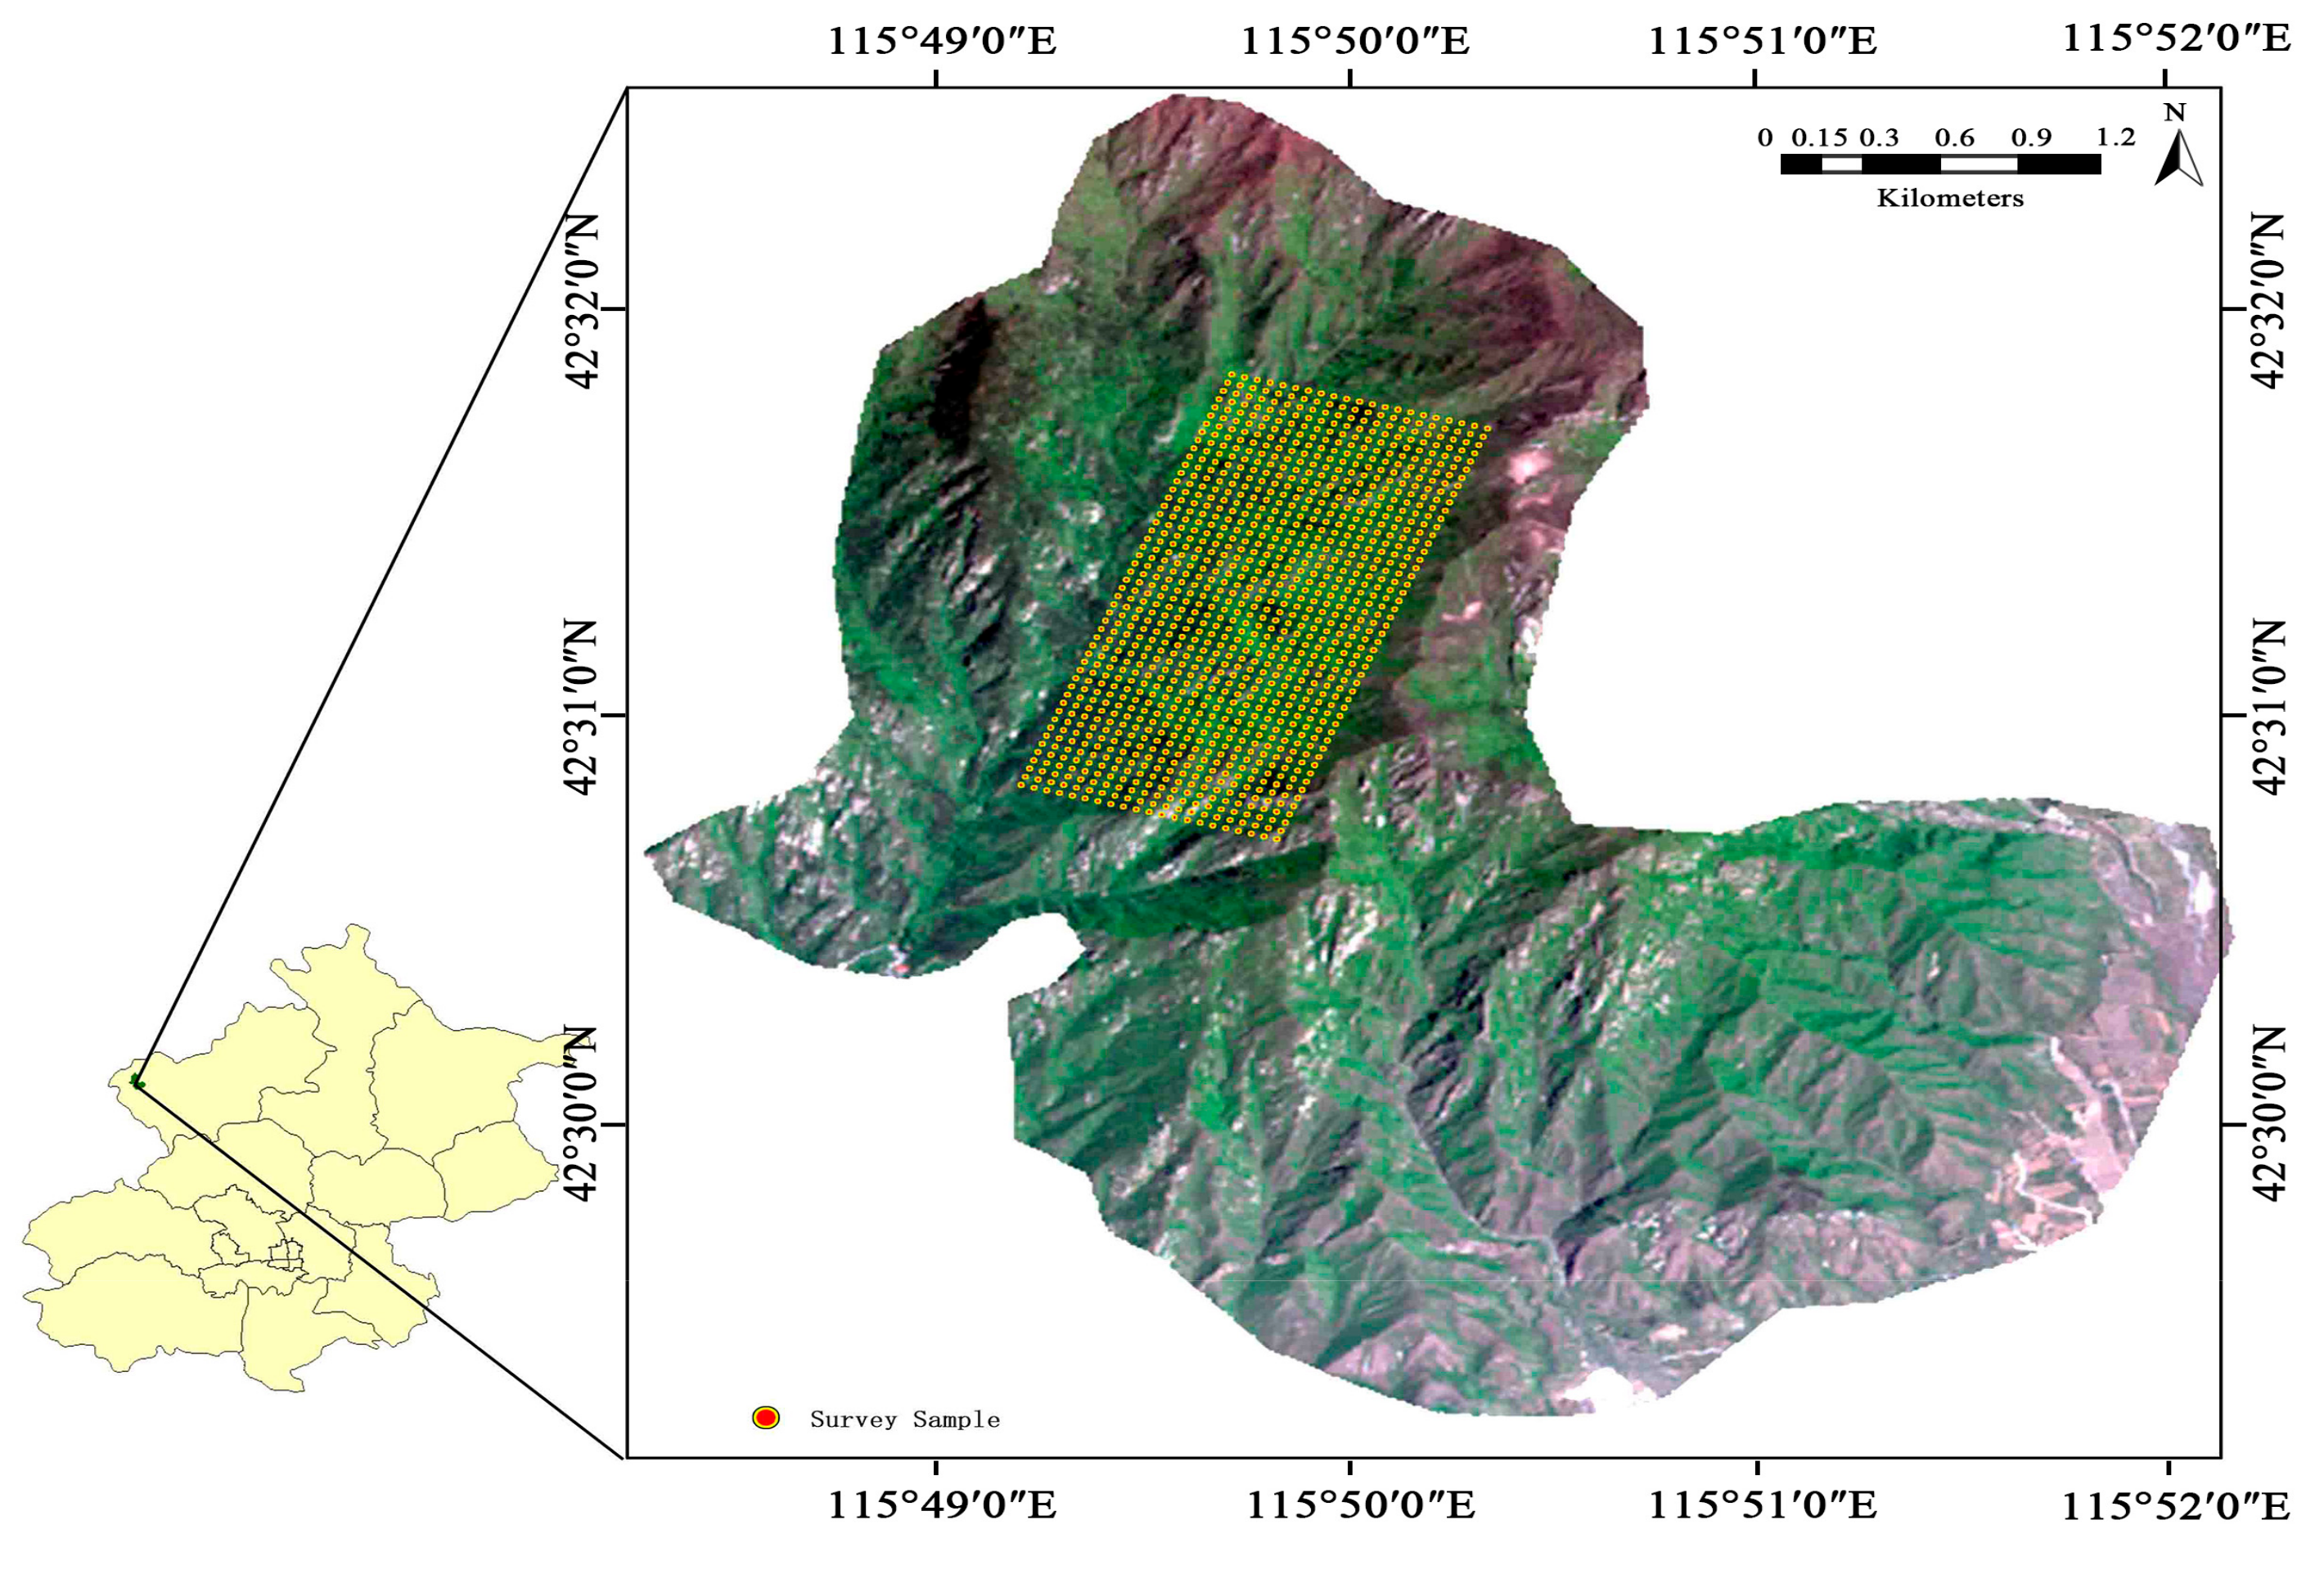
2.1. The Profile of the Study Sites

The Beijing Yanqing Songshan National Nature Reserve is located at the northwestern tip of Beijing’s Yanqing County, and has a total area of 4671 ha. The reserve is located 25 km from the county seat of Yanqing County and 90 km from urban Beijing. The eastern portion of the reserve is adjacent to Houhe Village, Yanqing County; its southern portion is adjacent to Foyukou Village and Shuiyu Village; its western boundary is adjacent to Huailai County, Hebei Province; and its northern boundary is adjacent to Chicheng County, Hebei Province. The reserve covers the area from 40°29′9″N to 40°33′35″N latitude and 115°43′44″E to 115°50′22″E longitude (Figure 1). The layout of permanent sample plot is given in Appendix A.

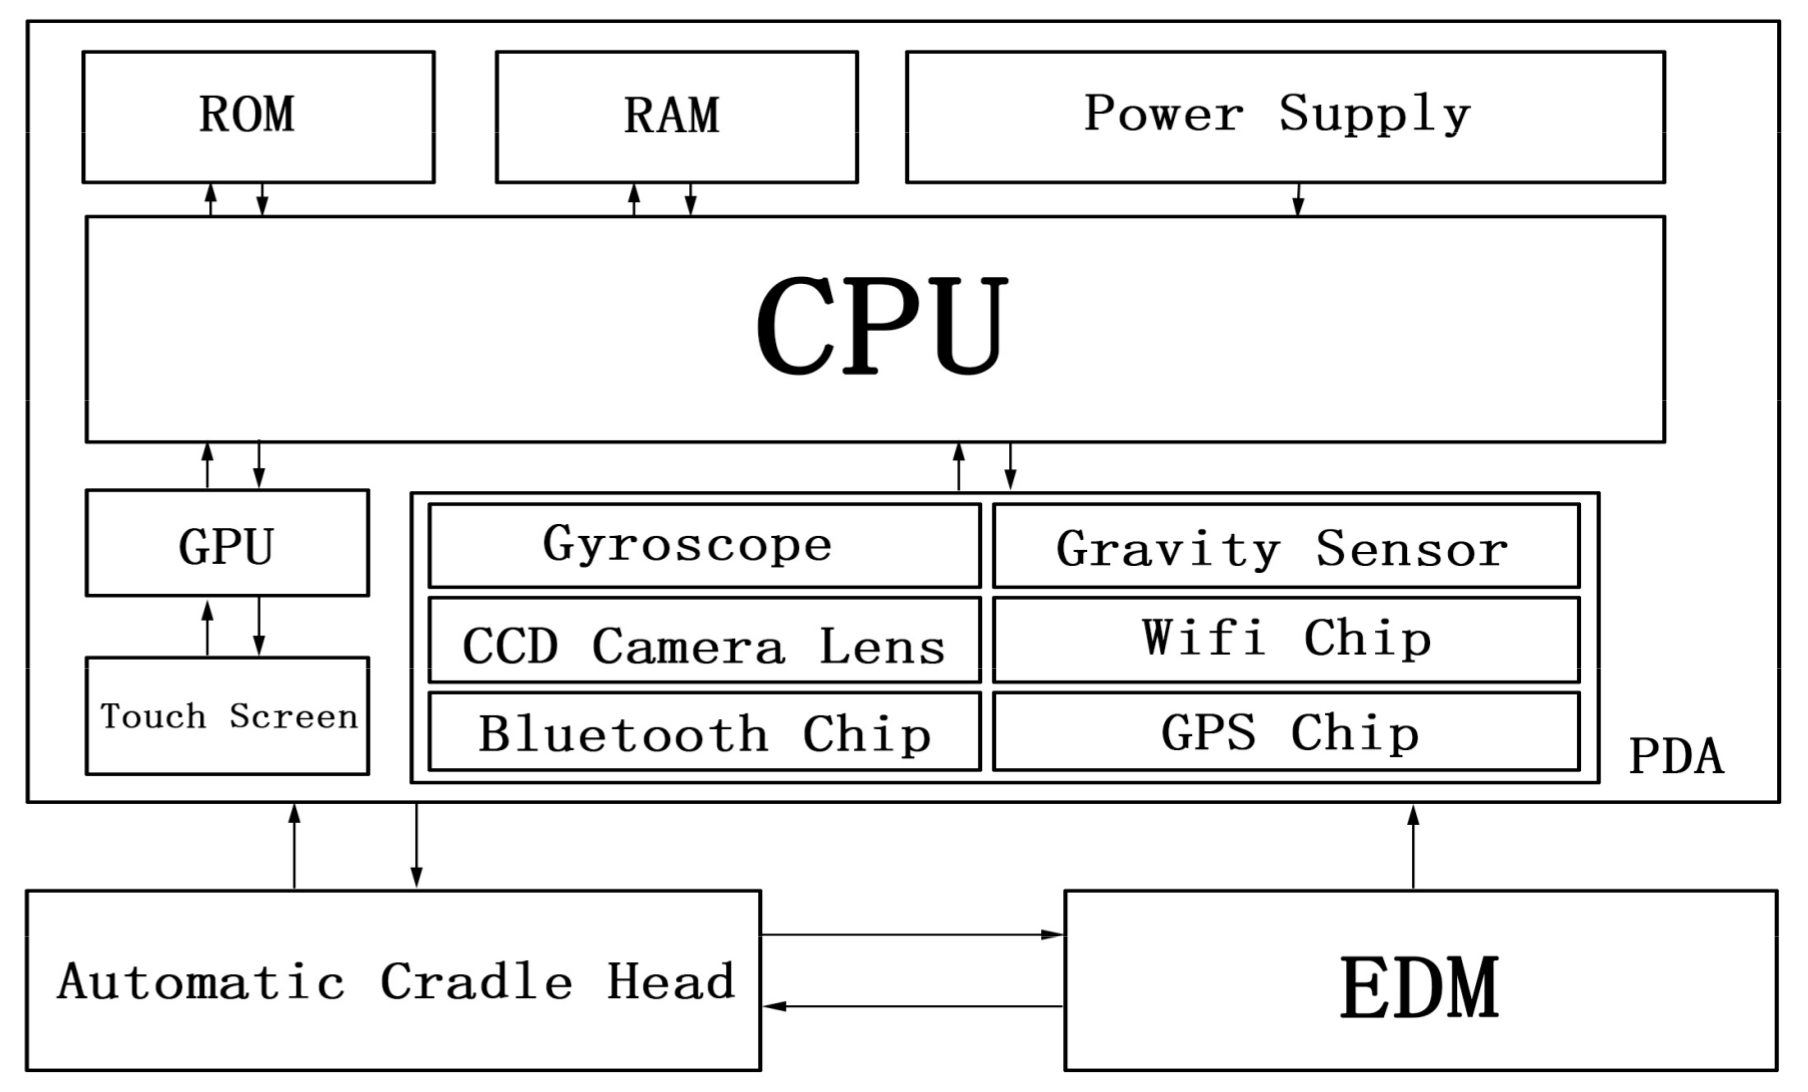
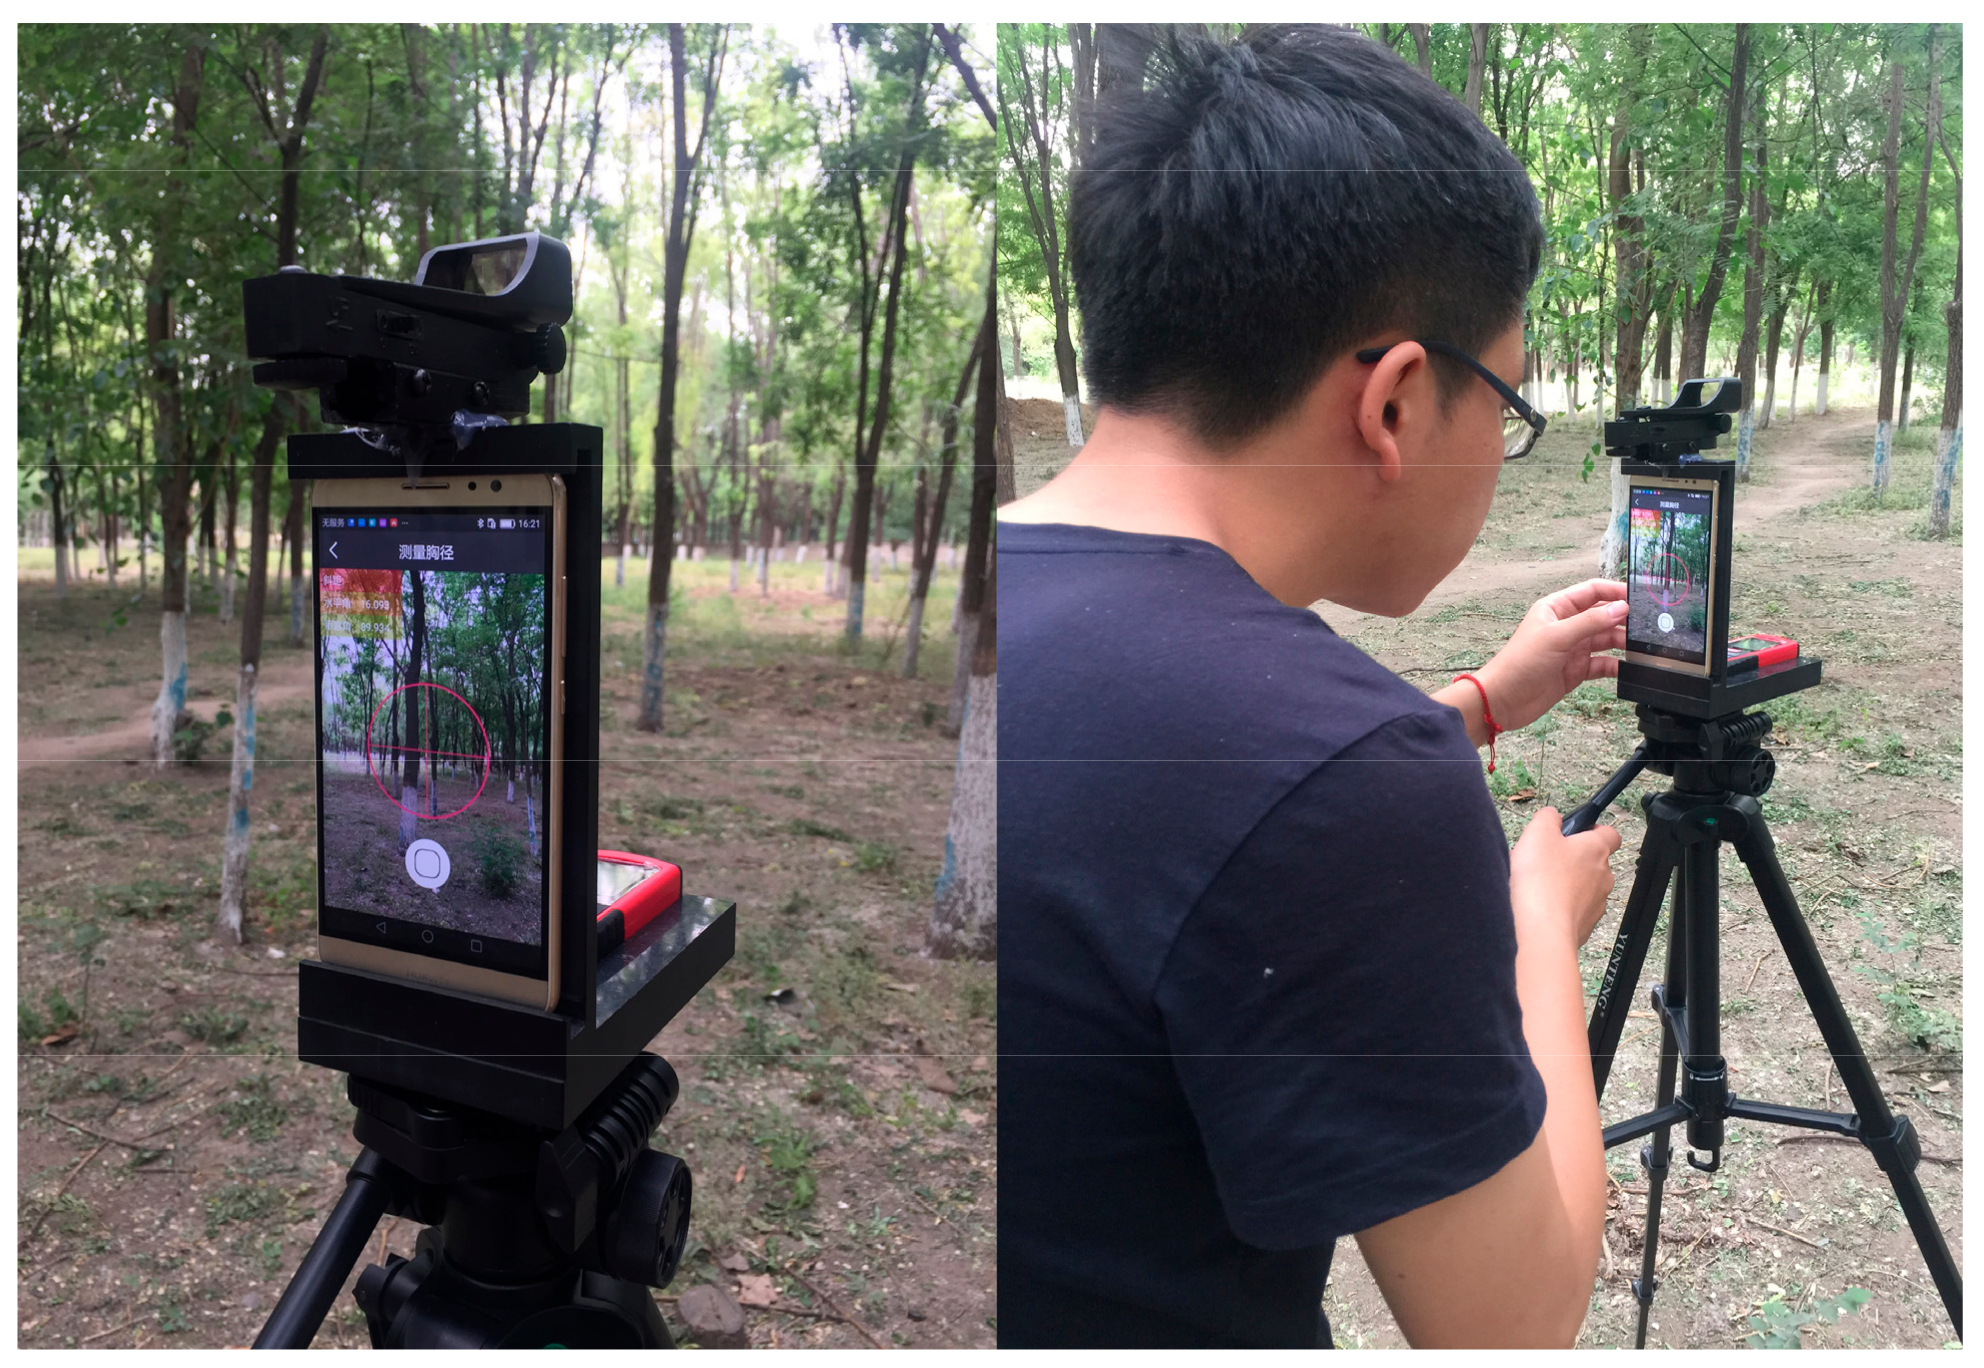
2.2. Development of the PDA Photogrammetry-Based Dendrometer

Due to the problems with the existing system, such as the high cost of the measuring instruments, low measurement efficiency, inconvenience of transporting the instruments, and complicated operation, the PDA photogrammetry-based dendrometer system was researched and developed. The hardware components of the smart PDA photogrammetry-based dendrometer include a PDA module (FAM5-PDA, manufactured by Precision Forestry Key Laboratory of Beijing, China), an electronic distance measurement (EDM) module (FAM5-EDM, manufactured by Precision Forestry Key Laboratory of Beijing, China) and a cloud platform that was developed during the project (Figure 2). The design of the hardware structure is shown in Appendix B.

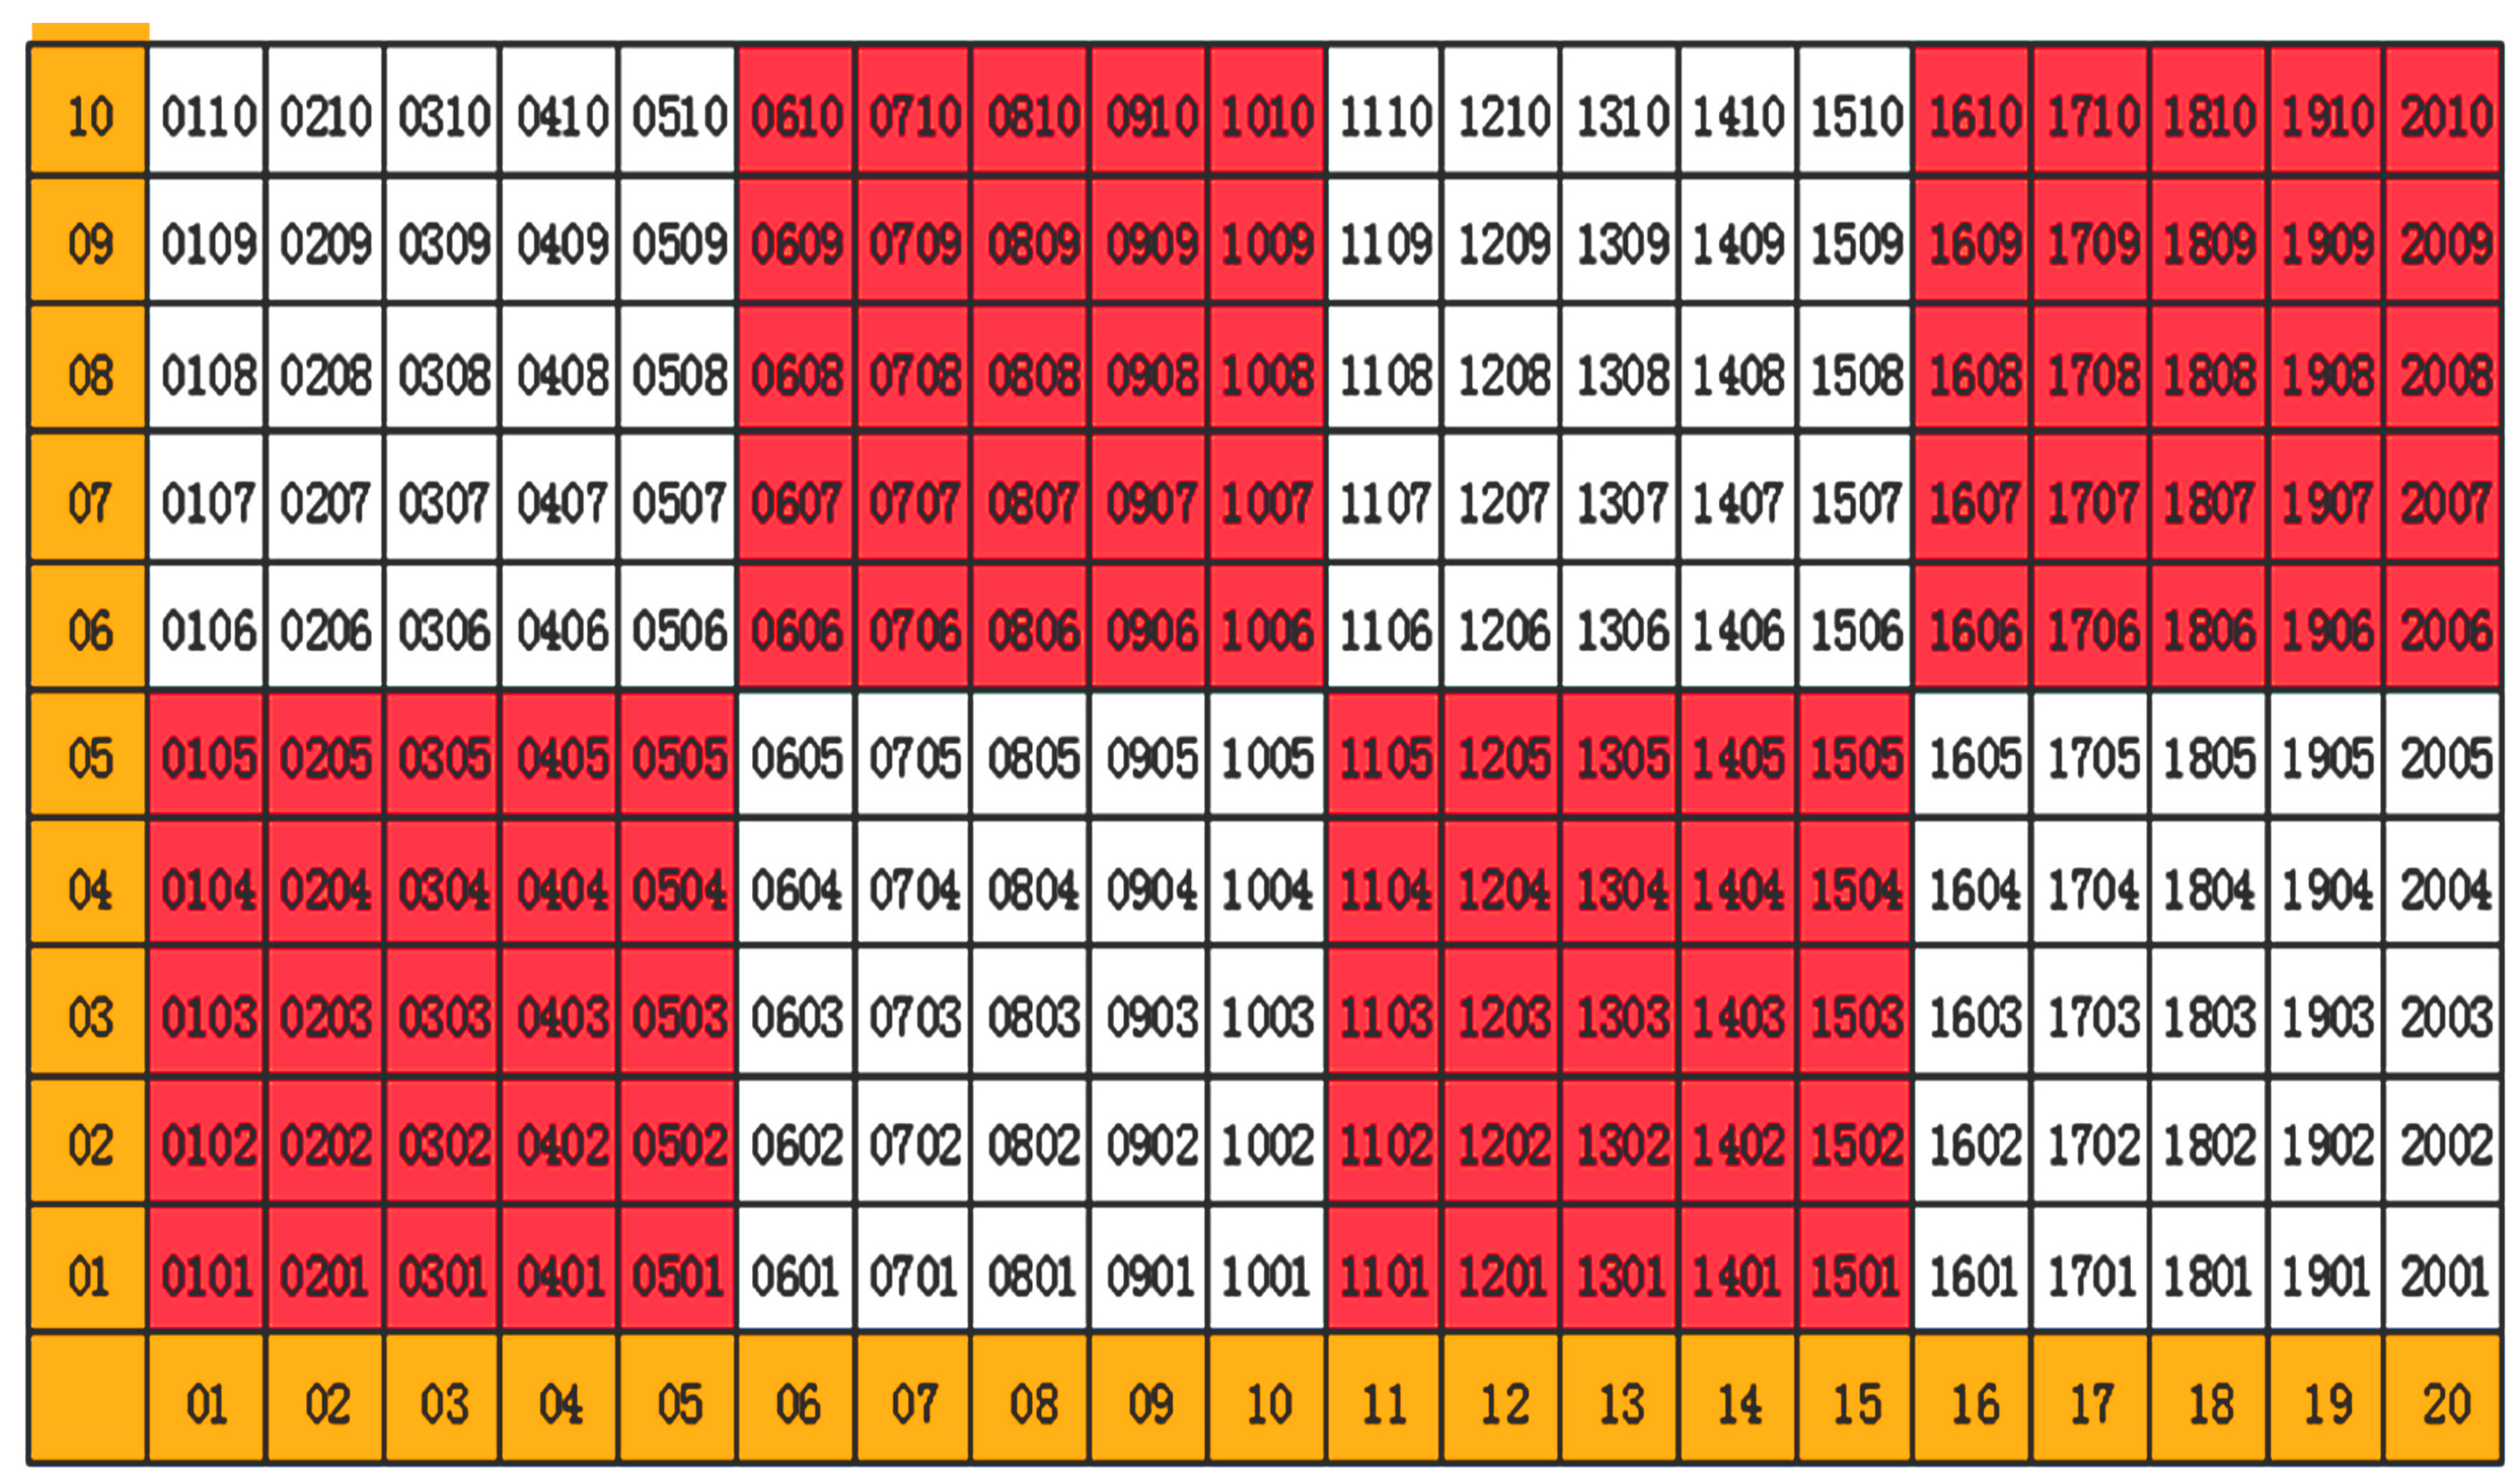
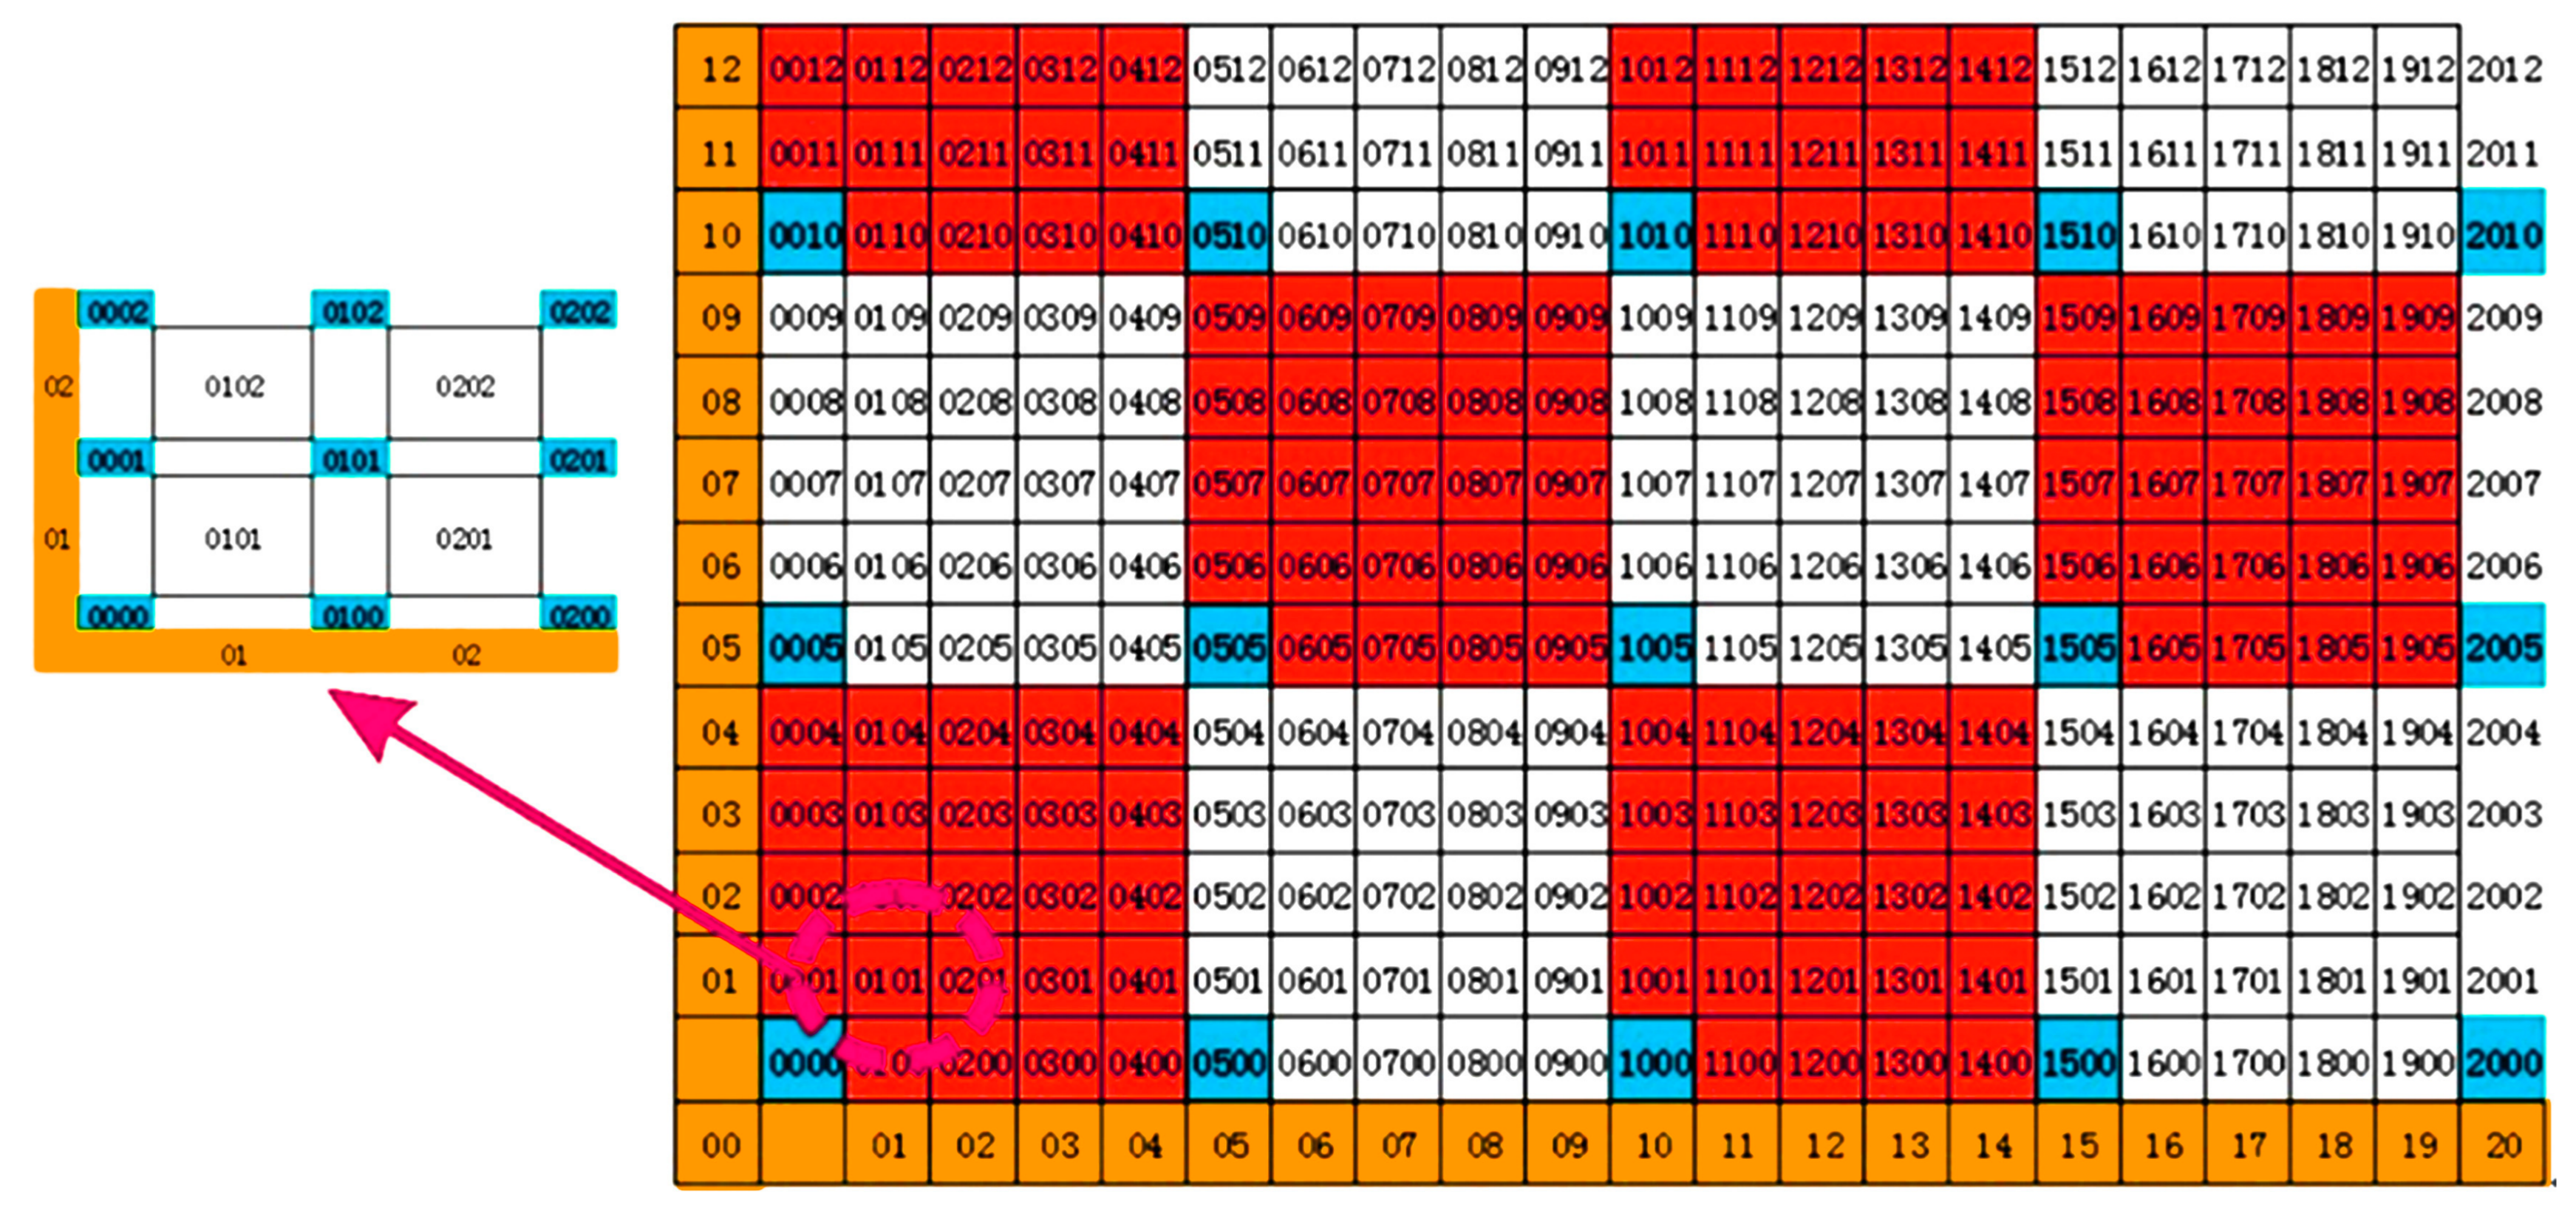
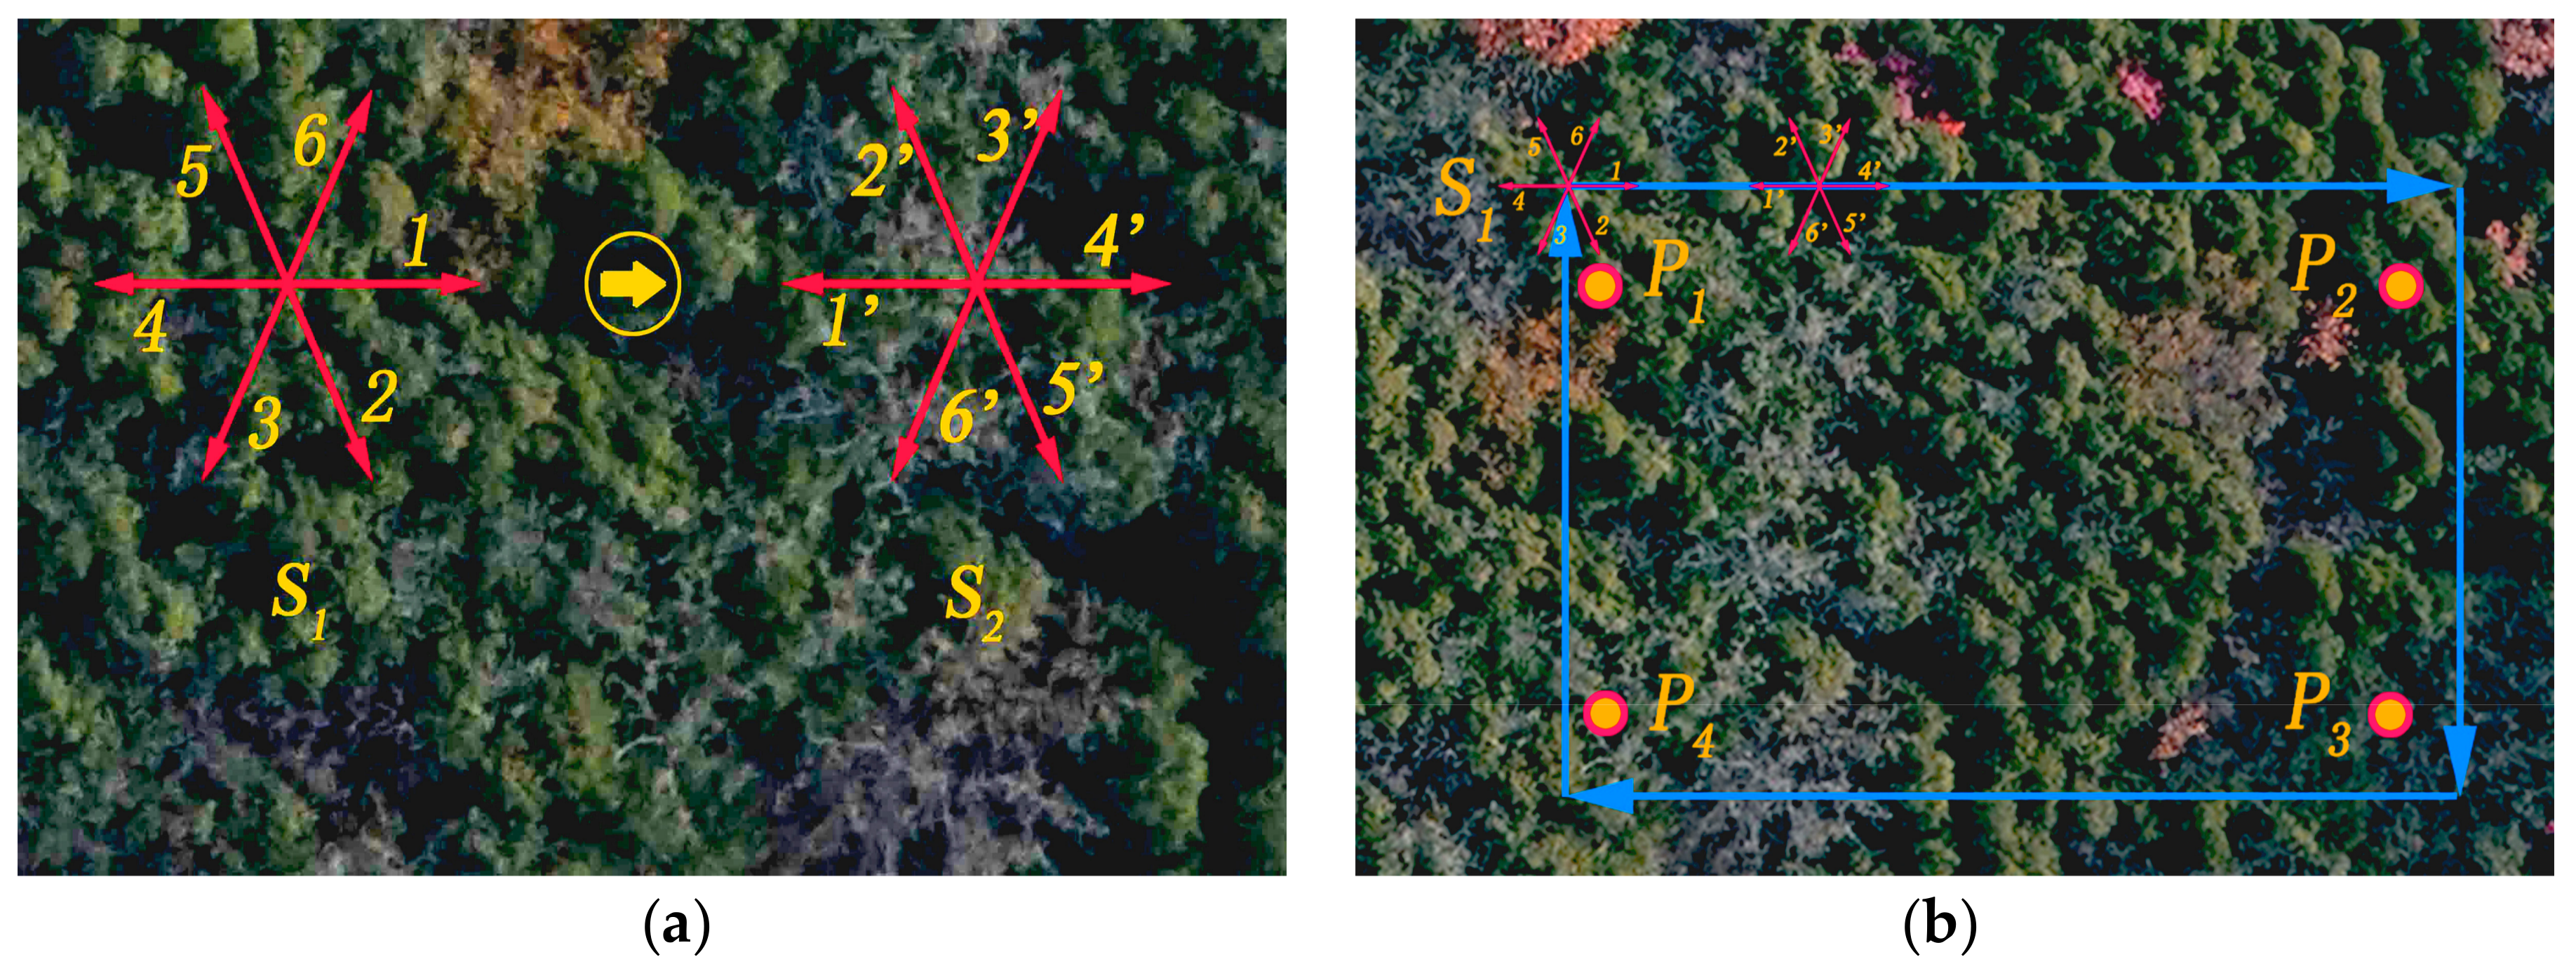
2.3. Continuous Terrestrial Photogrammetry in Stand Plots

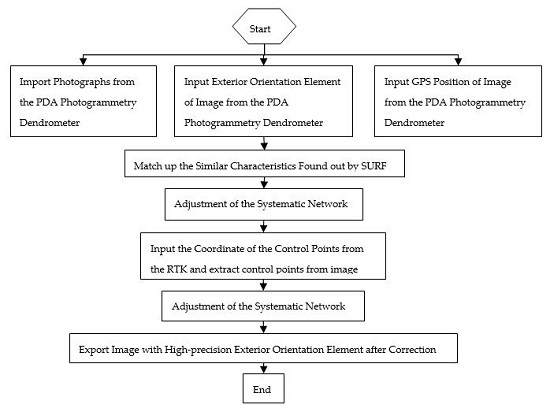
2.3.1. Adjustment Algorithm for Image Correction

In view of the problems of poor effectiveness and low precision in the reconstruction of ground photogrammetric 3D points, an optimized adjustment algorithm for image correction and software for stand plot continuous photogrammetric measurement were developed. The adjustment algorithm for image correction is given in Appendix C. Within the test area, photogrammetry was performed based on the polar coordinates of each station (Figure 3a), and the loop construction photogrammetric baseline approach was used to perform area measurements at each sequential station (Figure 3b). Four control points ( P 1 , P 2 , P 3 , P 4 ) were sequentially established at four corner points within the test area, and real-time kinematic (RTK) positioning was used to determine their coordinates. In the case of station S 1 , the first image was acquired “in the direction of flight” according to the angle of view of the camera. For each station, six images were typically acquired, which provided the necessary degree of overlap between adjacent images, by rotating the camera clockwise at a fixed angle until a complete circle had been made, which completed the photography at that station. In the case of station S 2 , the first image was acquired in the direction of the facing image from the previous station, and the subsequent images were taken while rotating in a clockwise direction until the circle was complete. Except for the first station, the first image taken at each station was always opposite the “direction of flight”. The image acquisition work proceeded sequentially from station to station until the entire test area had been photographed.

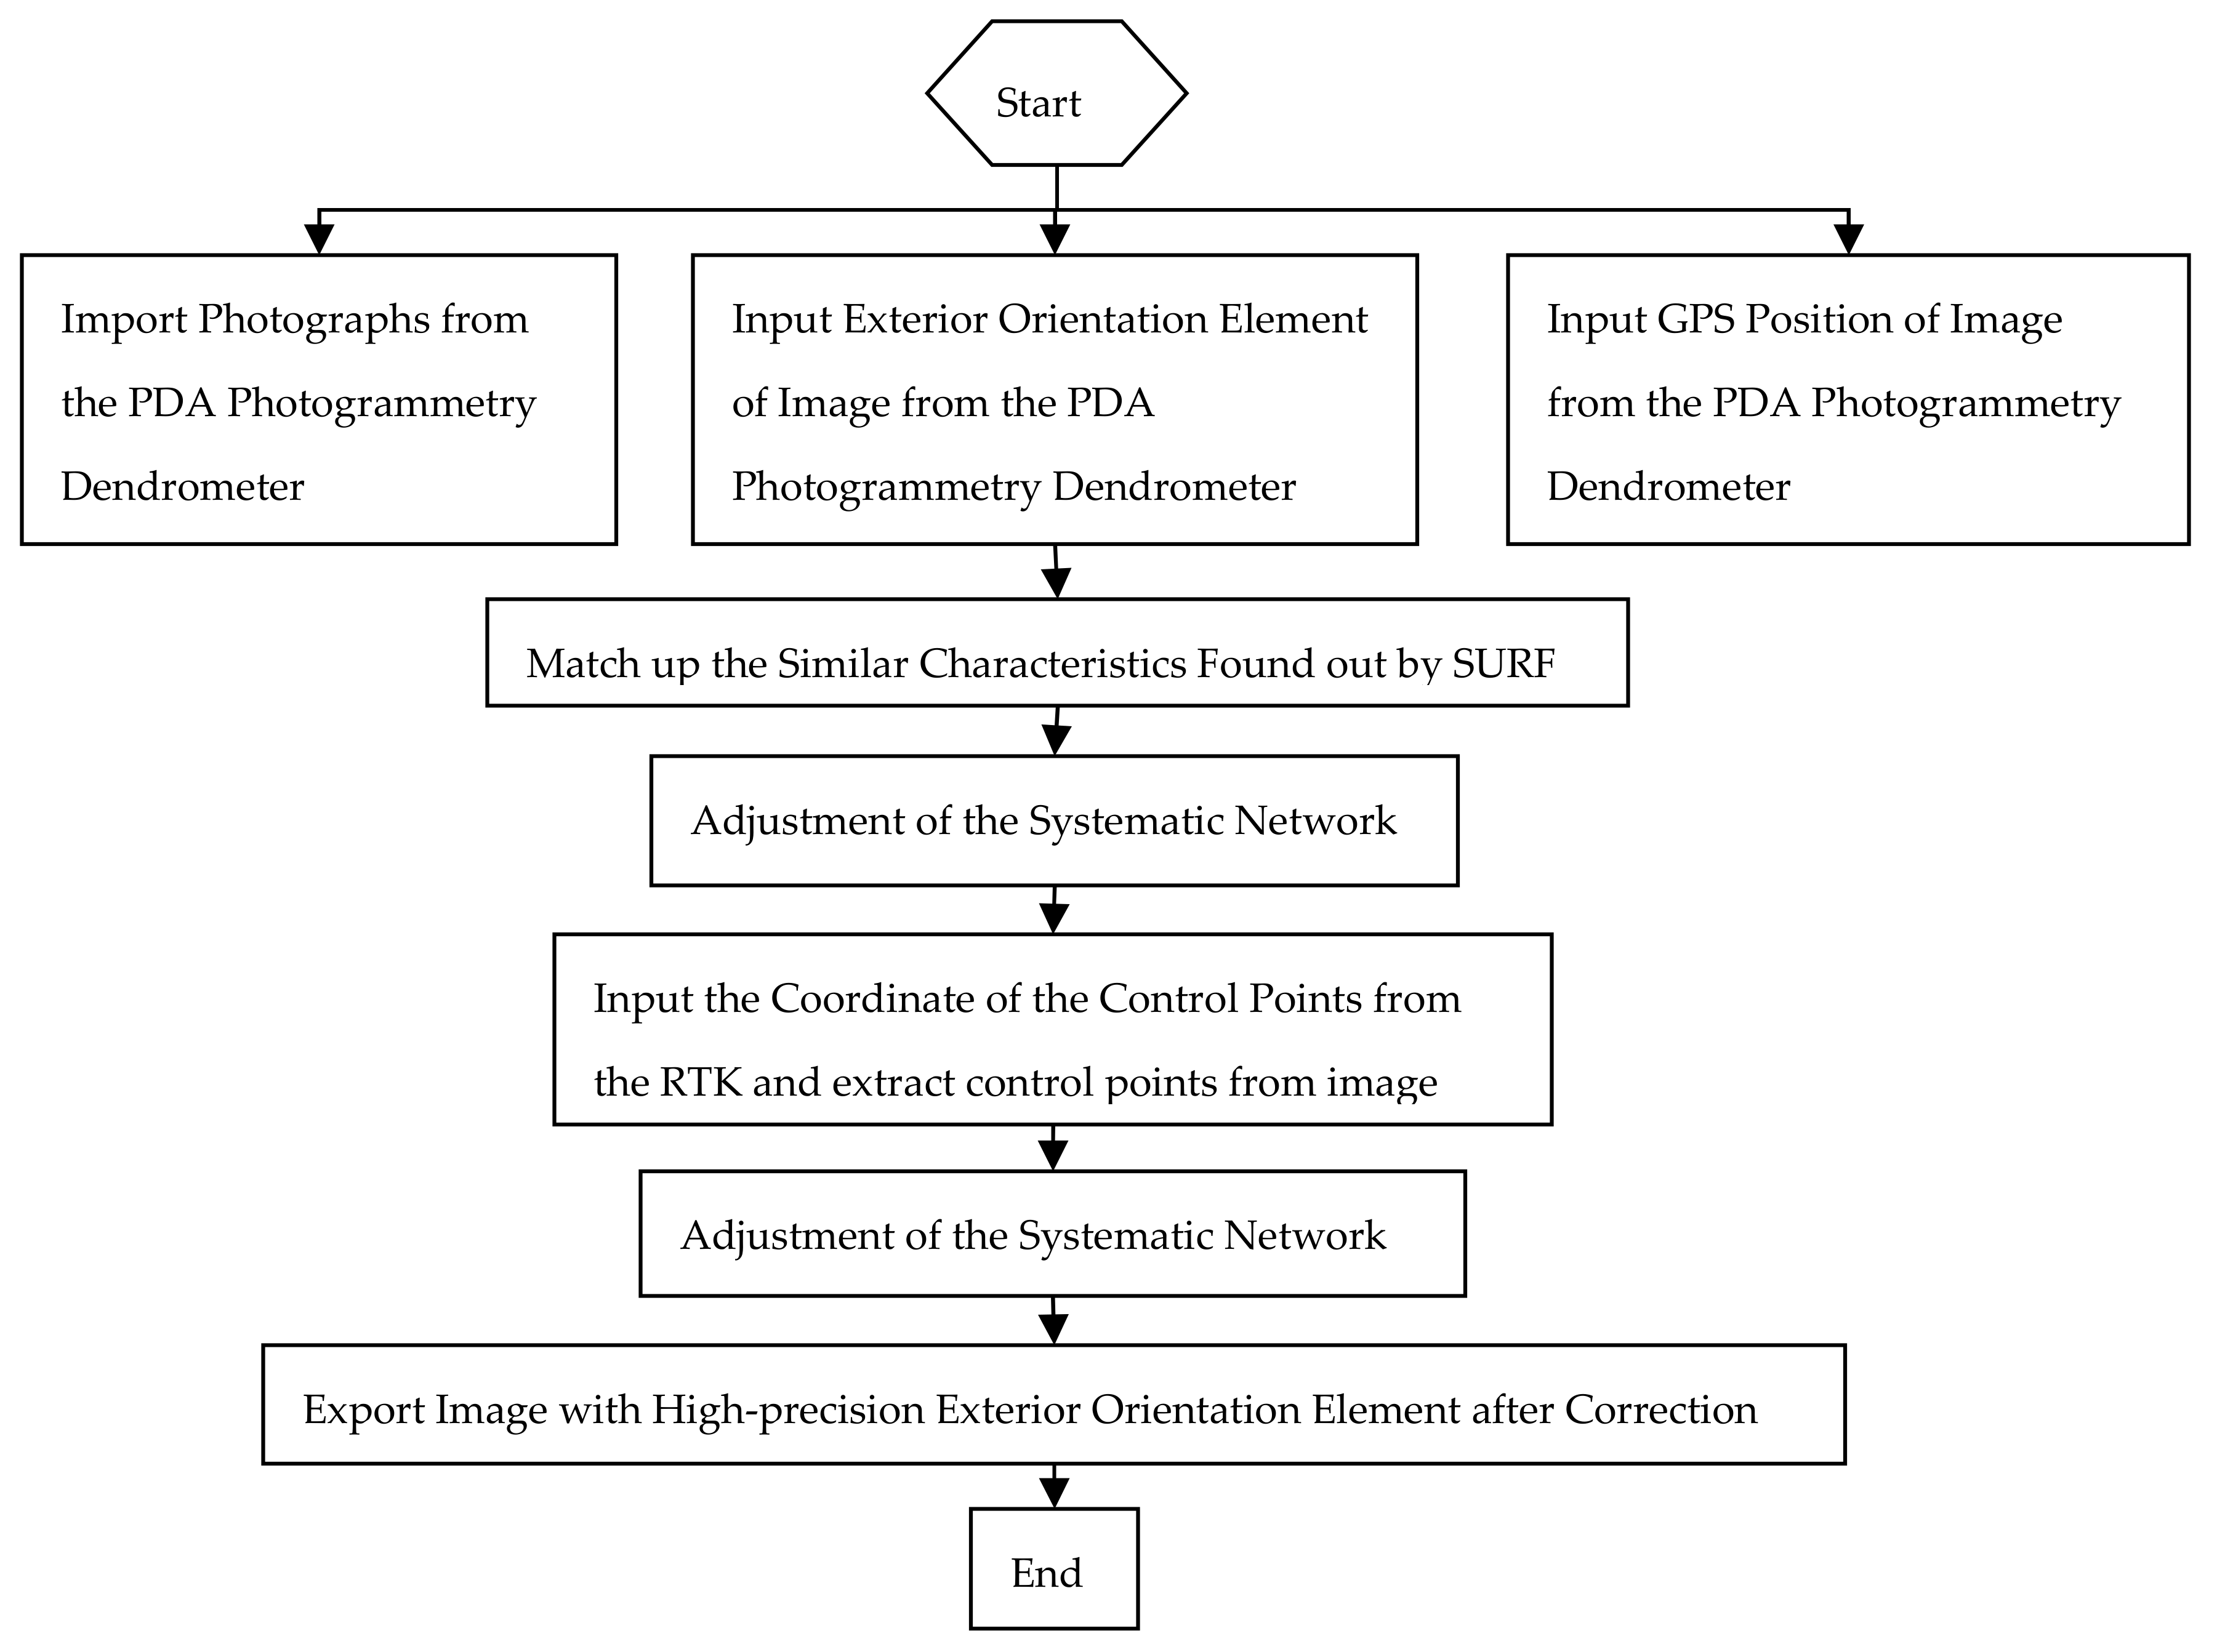
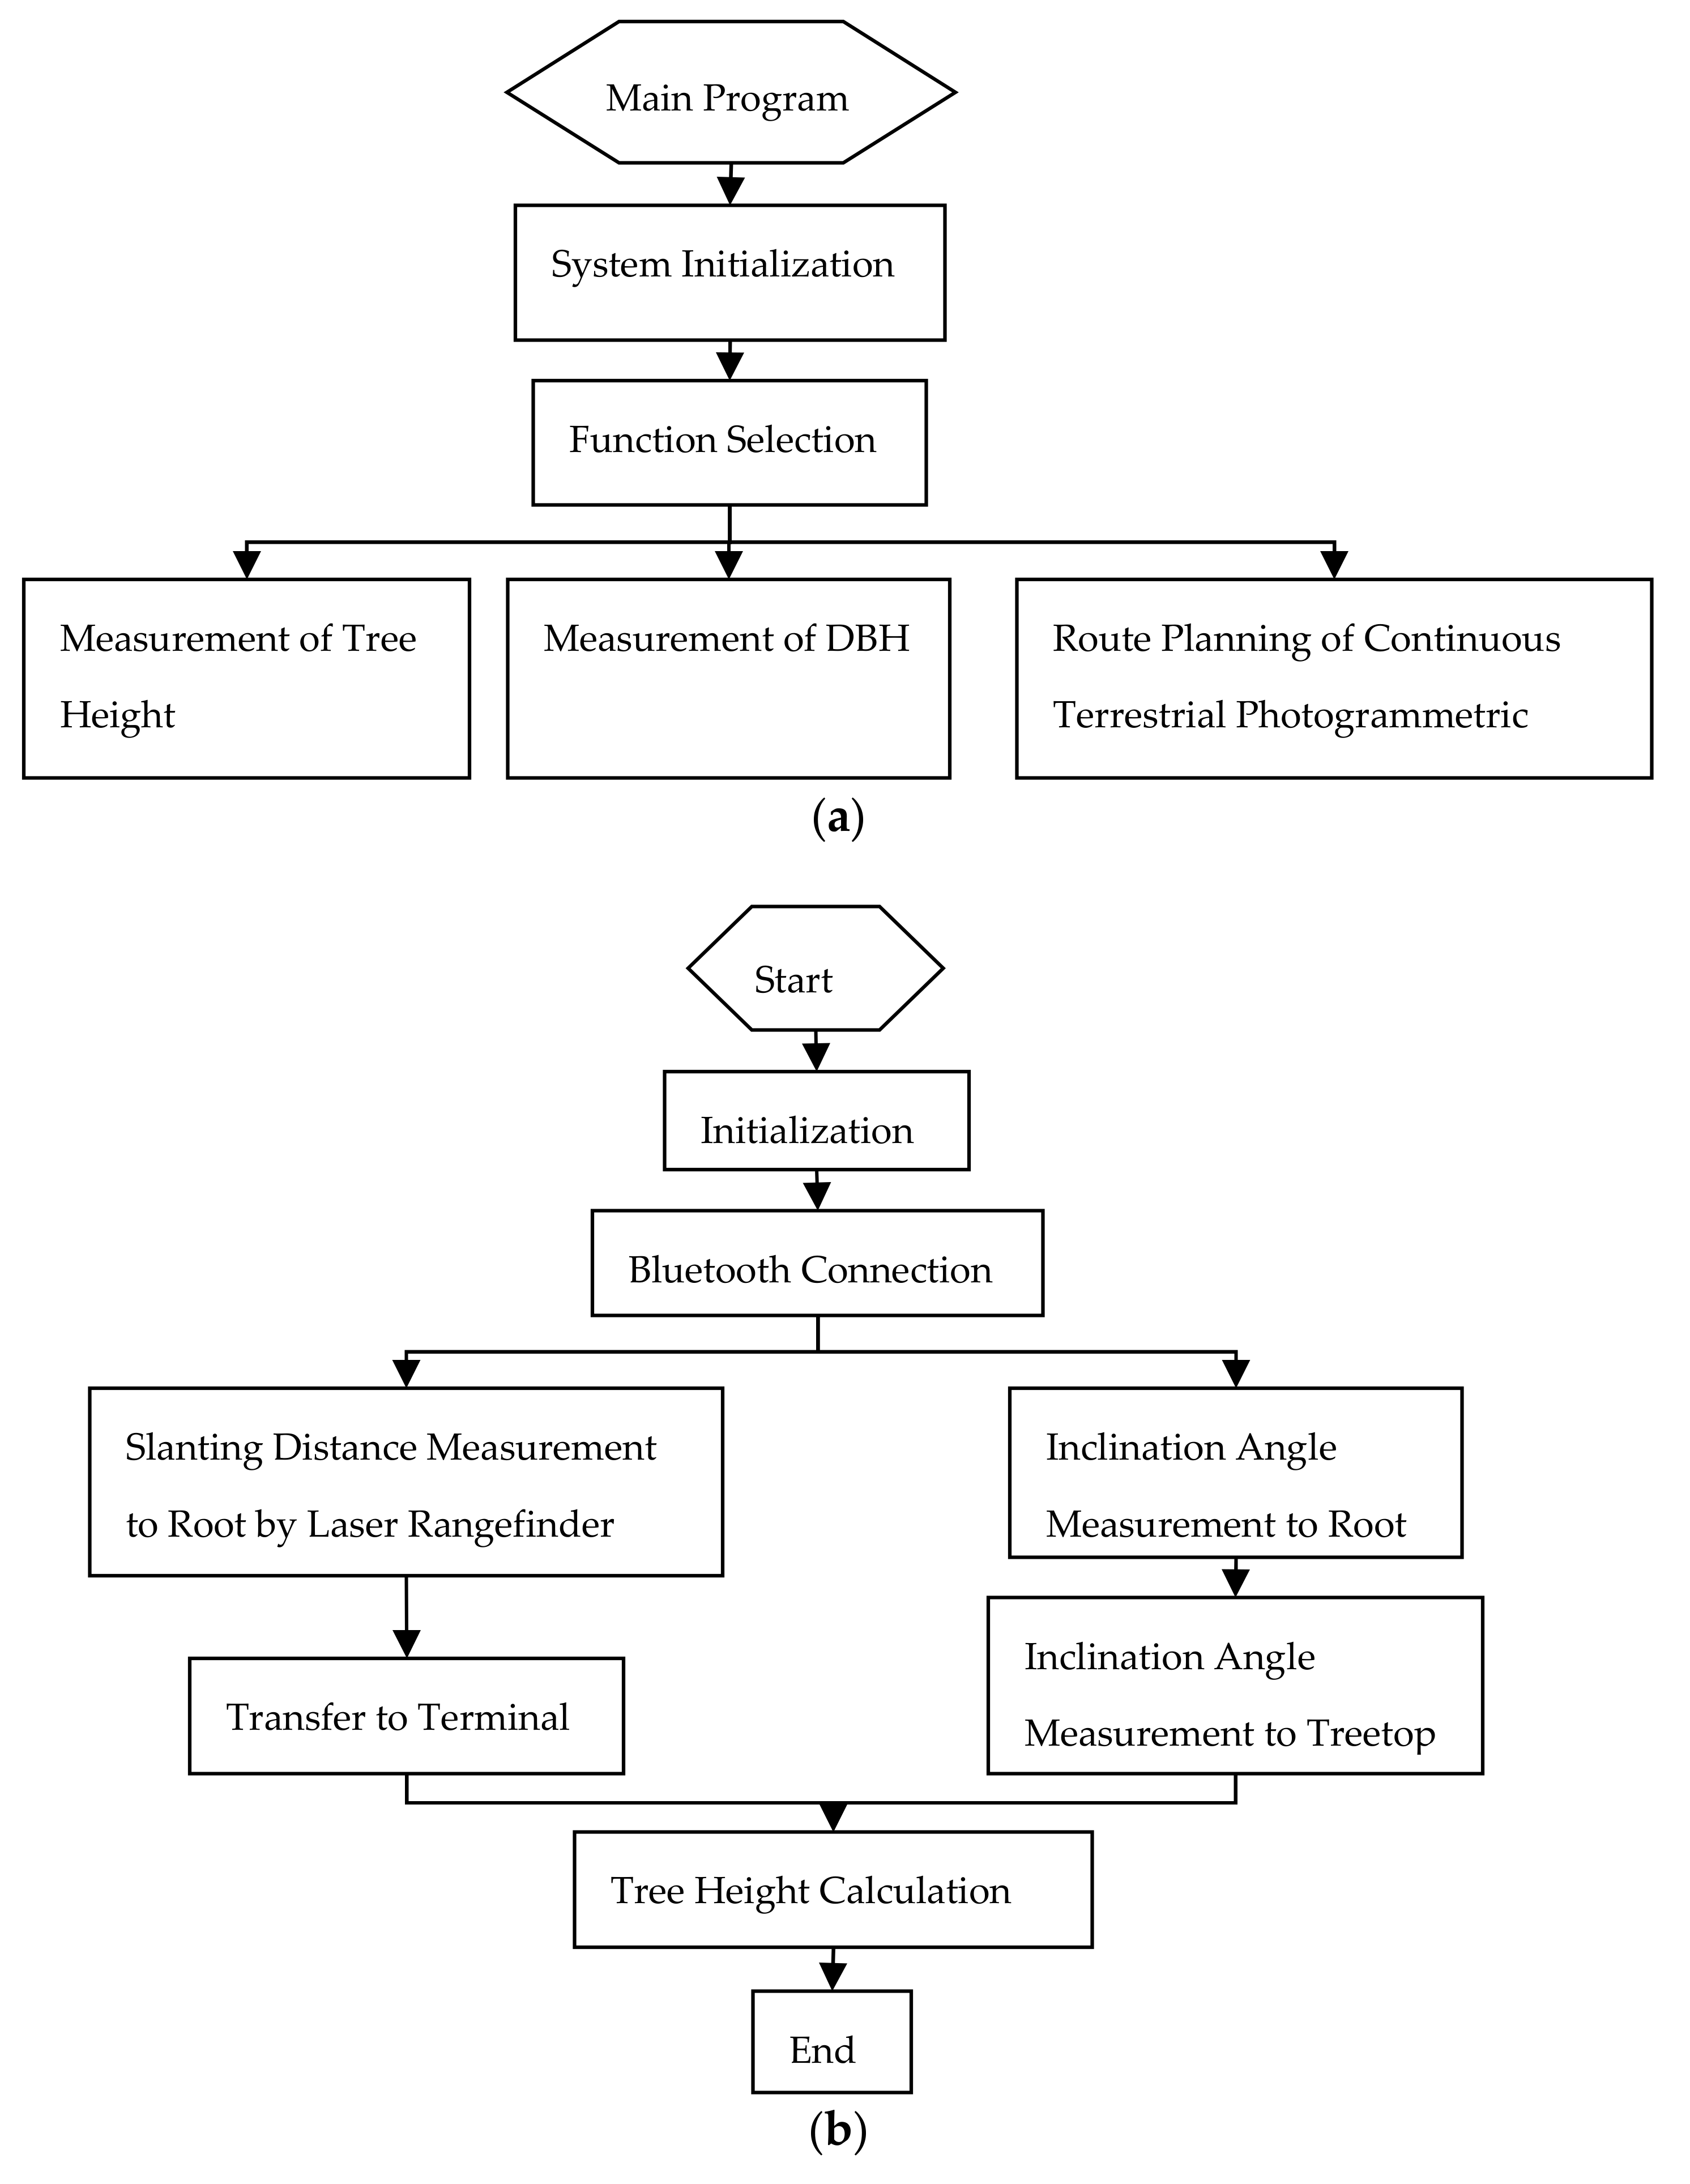
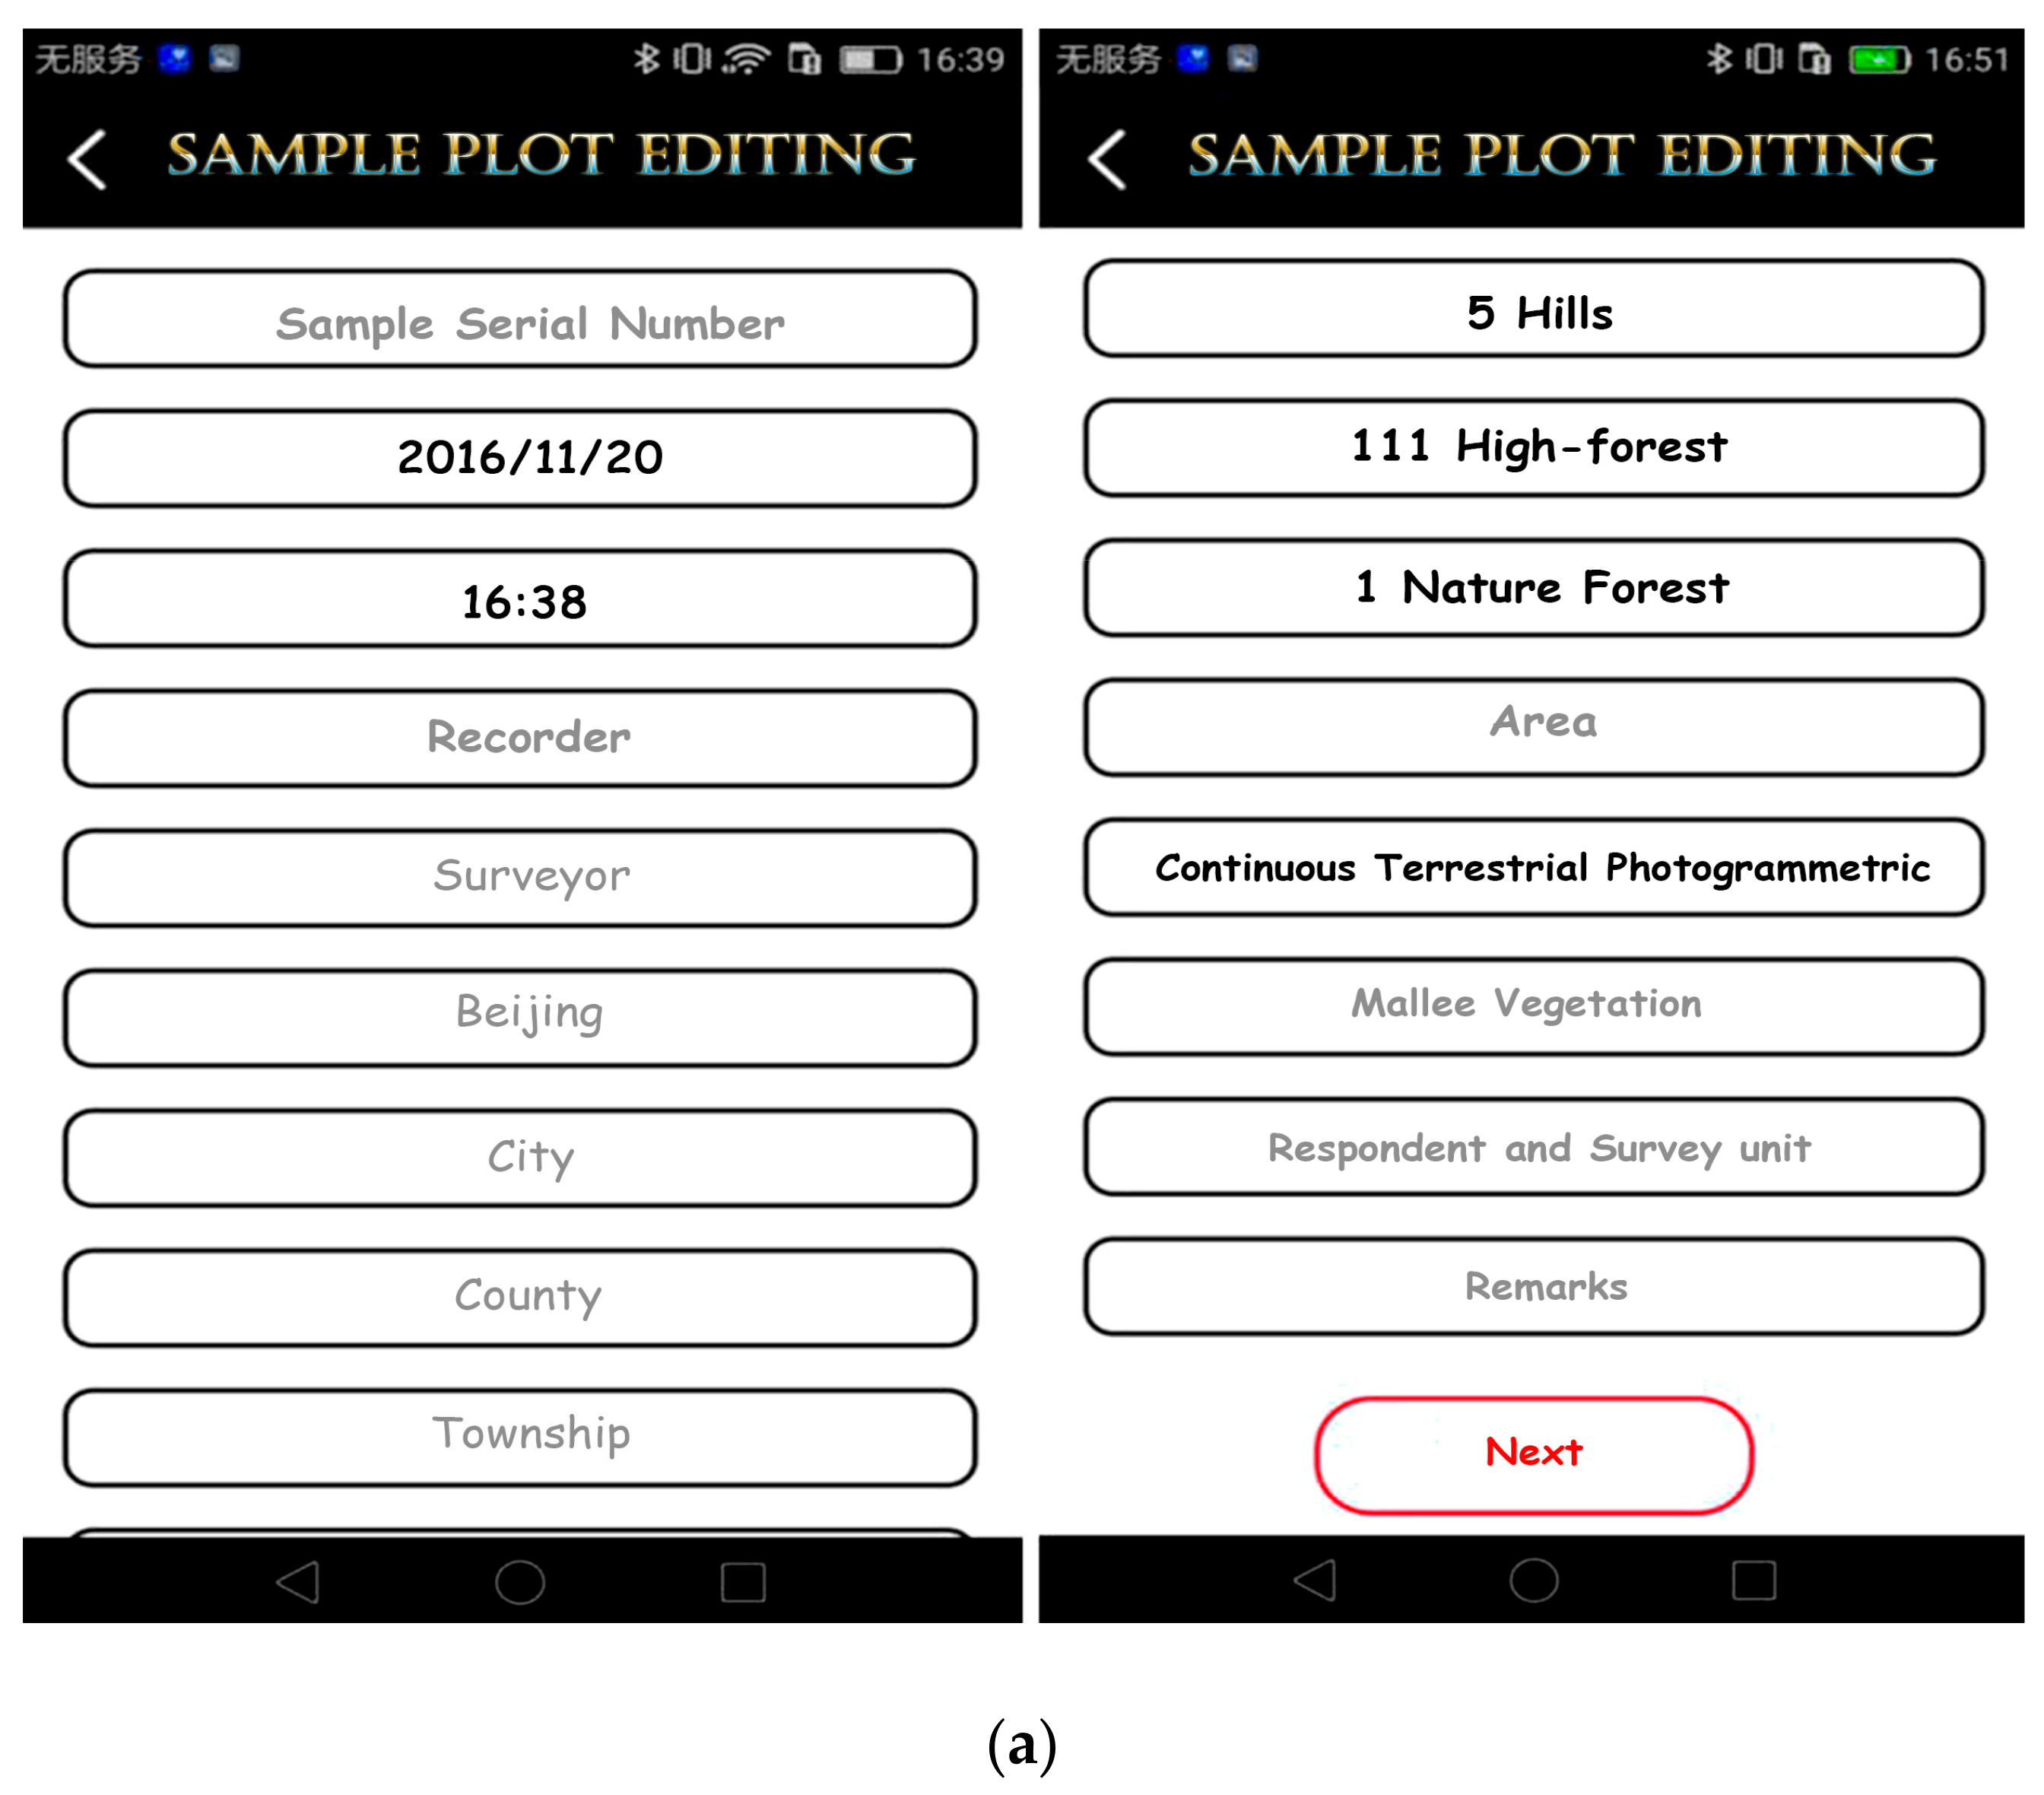
2.3.2. Development of Forest Sample Plot Continuous Photogrammetry Software

Since the corresponding points can be arbitrarily selected when performing image correction using the adjustment algorithm, the speeded-up robust features (SURF) algorithm in EmguCV could be used to find the corresponding points in adjacent images [23,24,25,26]. The SURF algorithm can be considered an improvement on the classical scale invariant feature transform (SIFT) algorithm in terms of implementation efficiency [27], and under ordinary conditions, real-time matching can generally be performed when processing adjacent images, which greatly enhances the program’s efficiency. The stand plot photogrammetry software was developed using the SURF algorithm and the adjustment algorithm in the C# programming language employing the .Net Framework 4.5. The software primarily relies on image matching and adjustment to obtain precise coordinates and orientation data from images. The software’s specific procedures are shown in Figure 4.
As shown in Figure 5a,b, the images are arranged by the external orientation elements measured by the PDA photogrammetry dendrometer. The red rays represent the external orientation elements measured by the PDA photogrammetry dendrometer. The blue rays represent the external orientation elements corrected by the software. Figure 5c shows that the partial images are matched with the corresponding points.

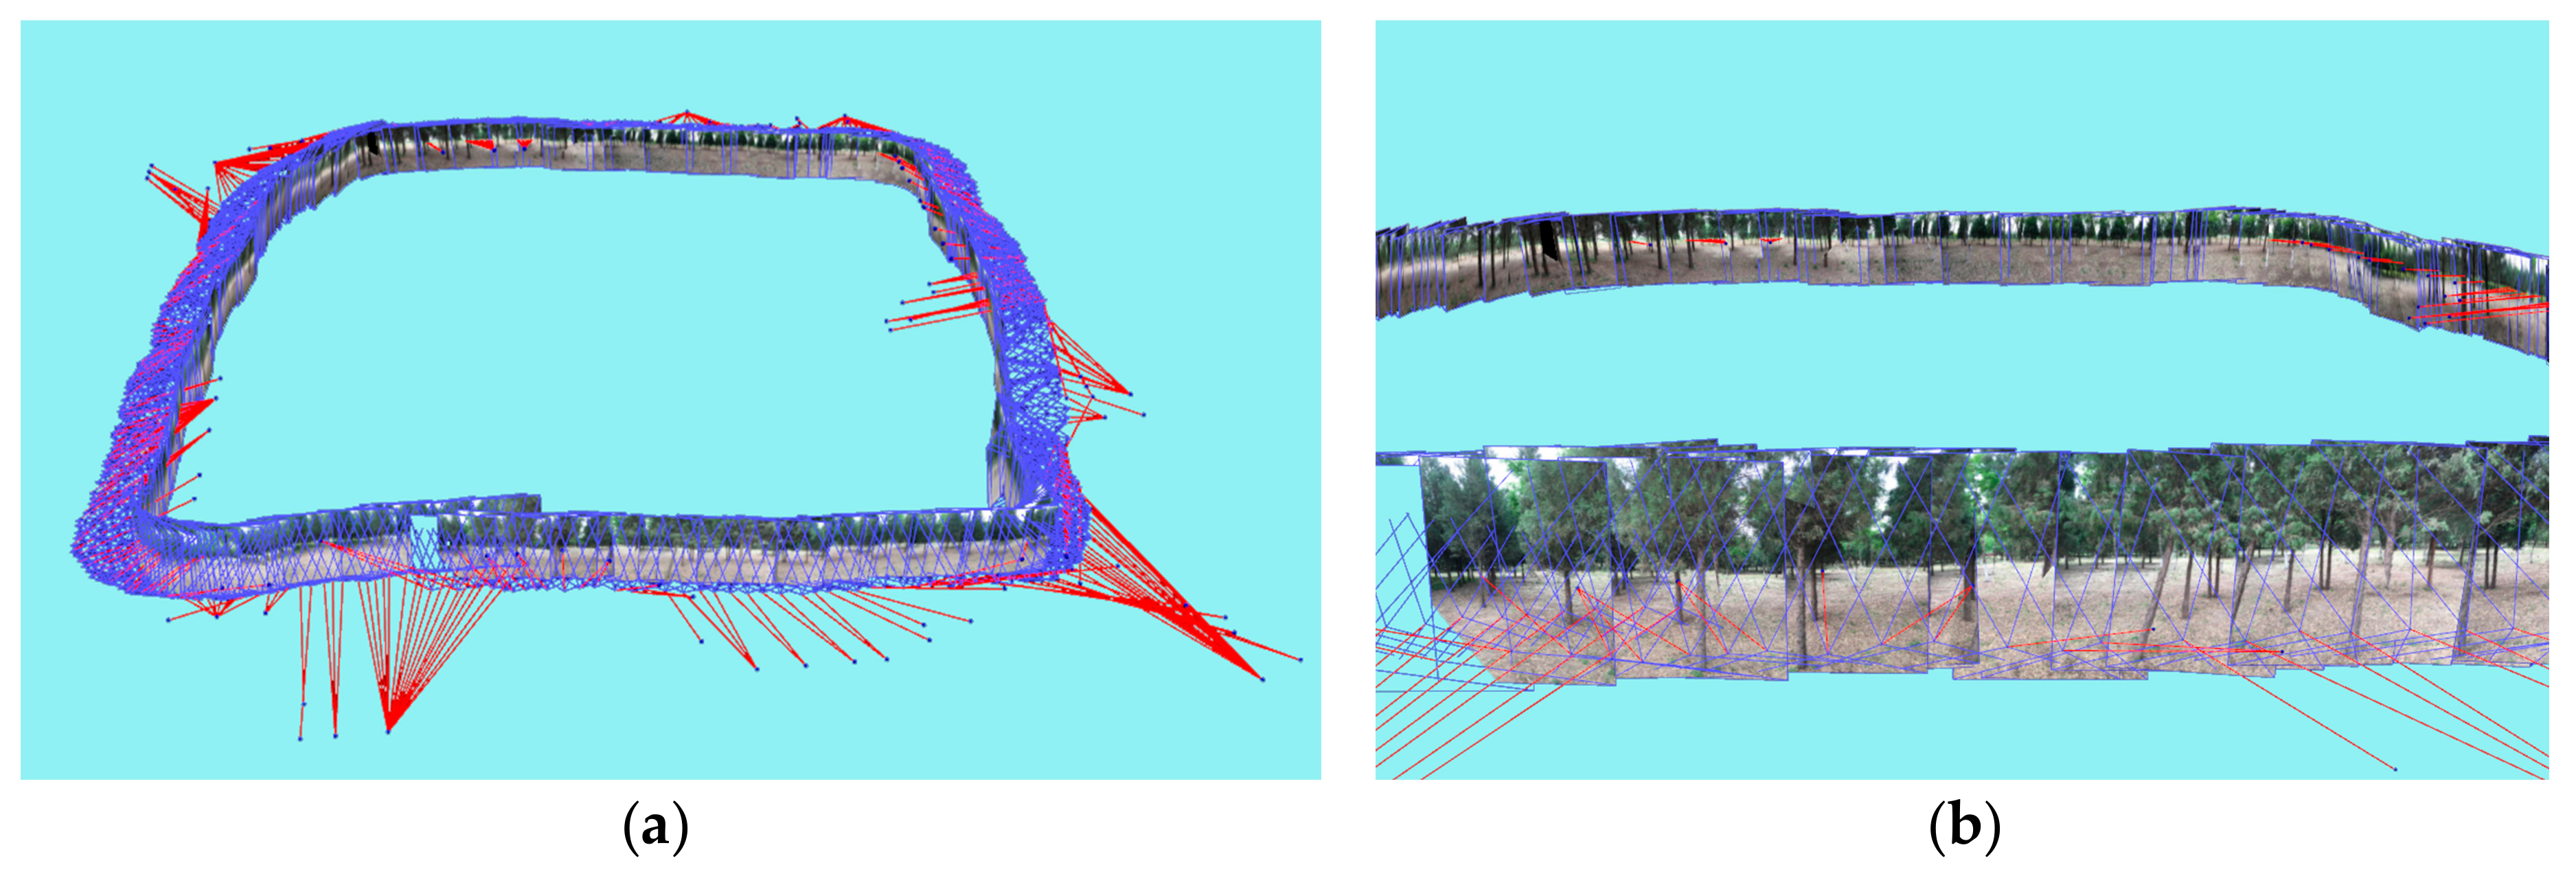
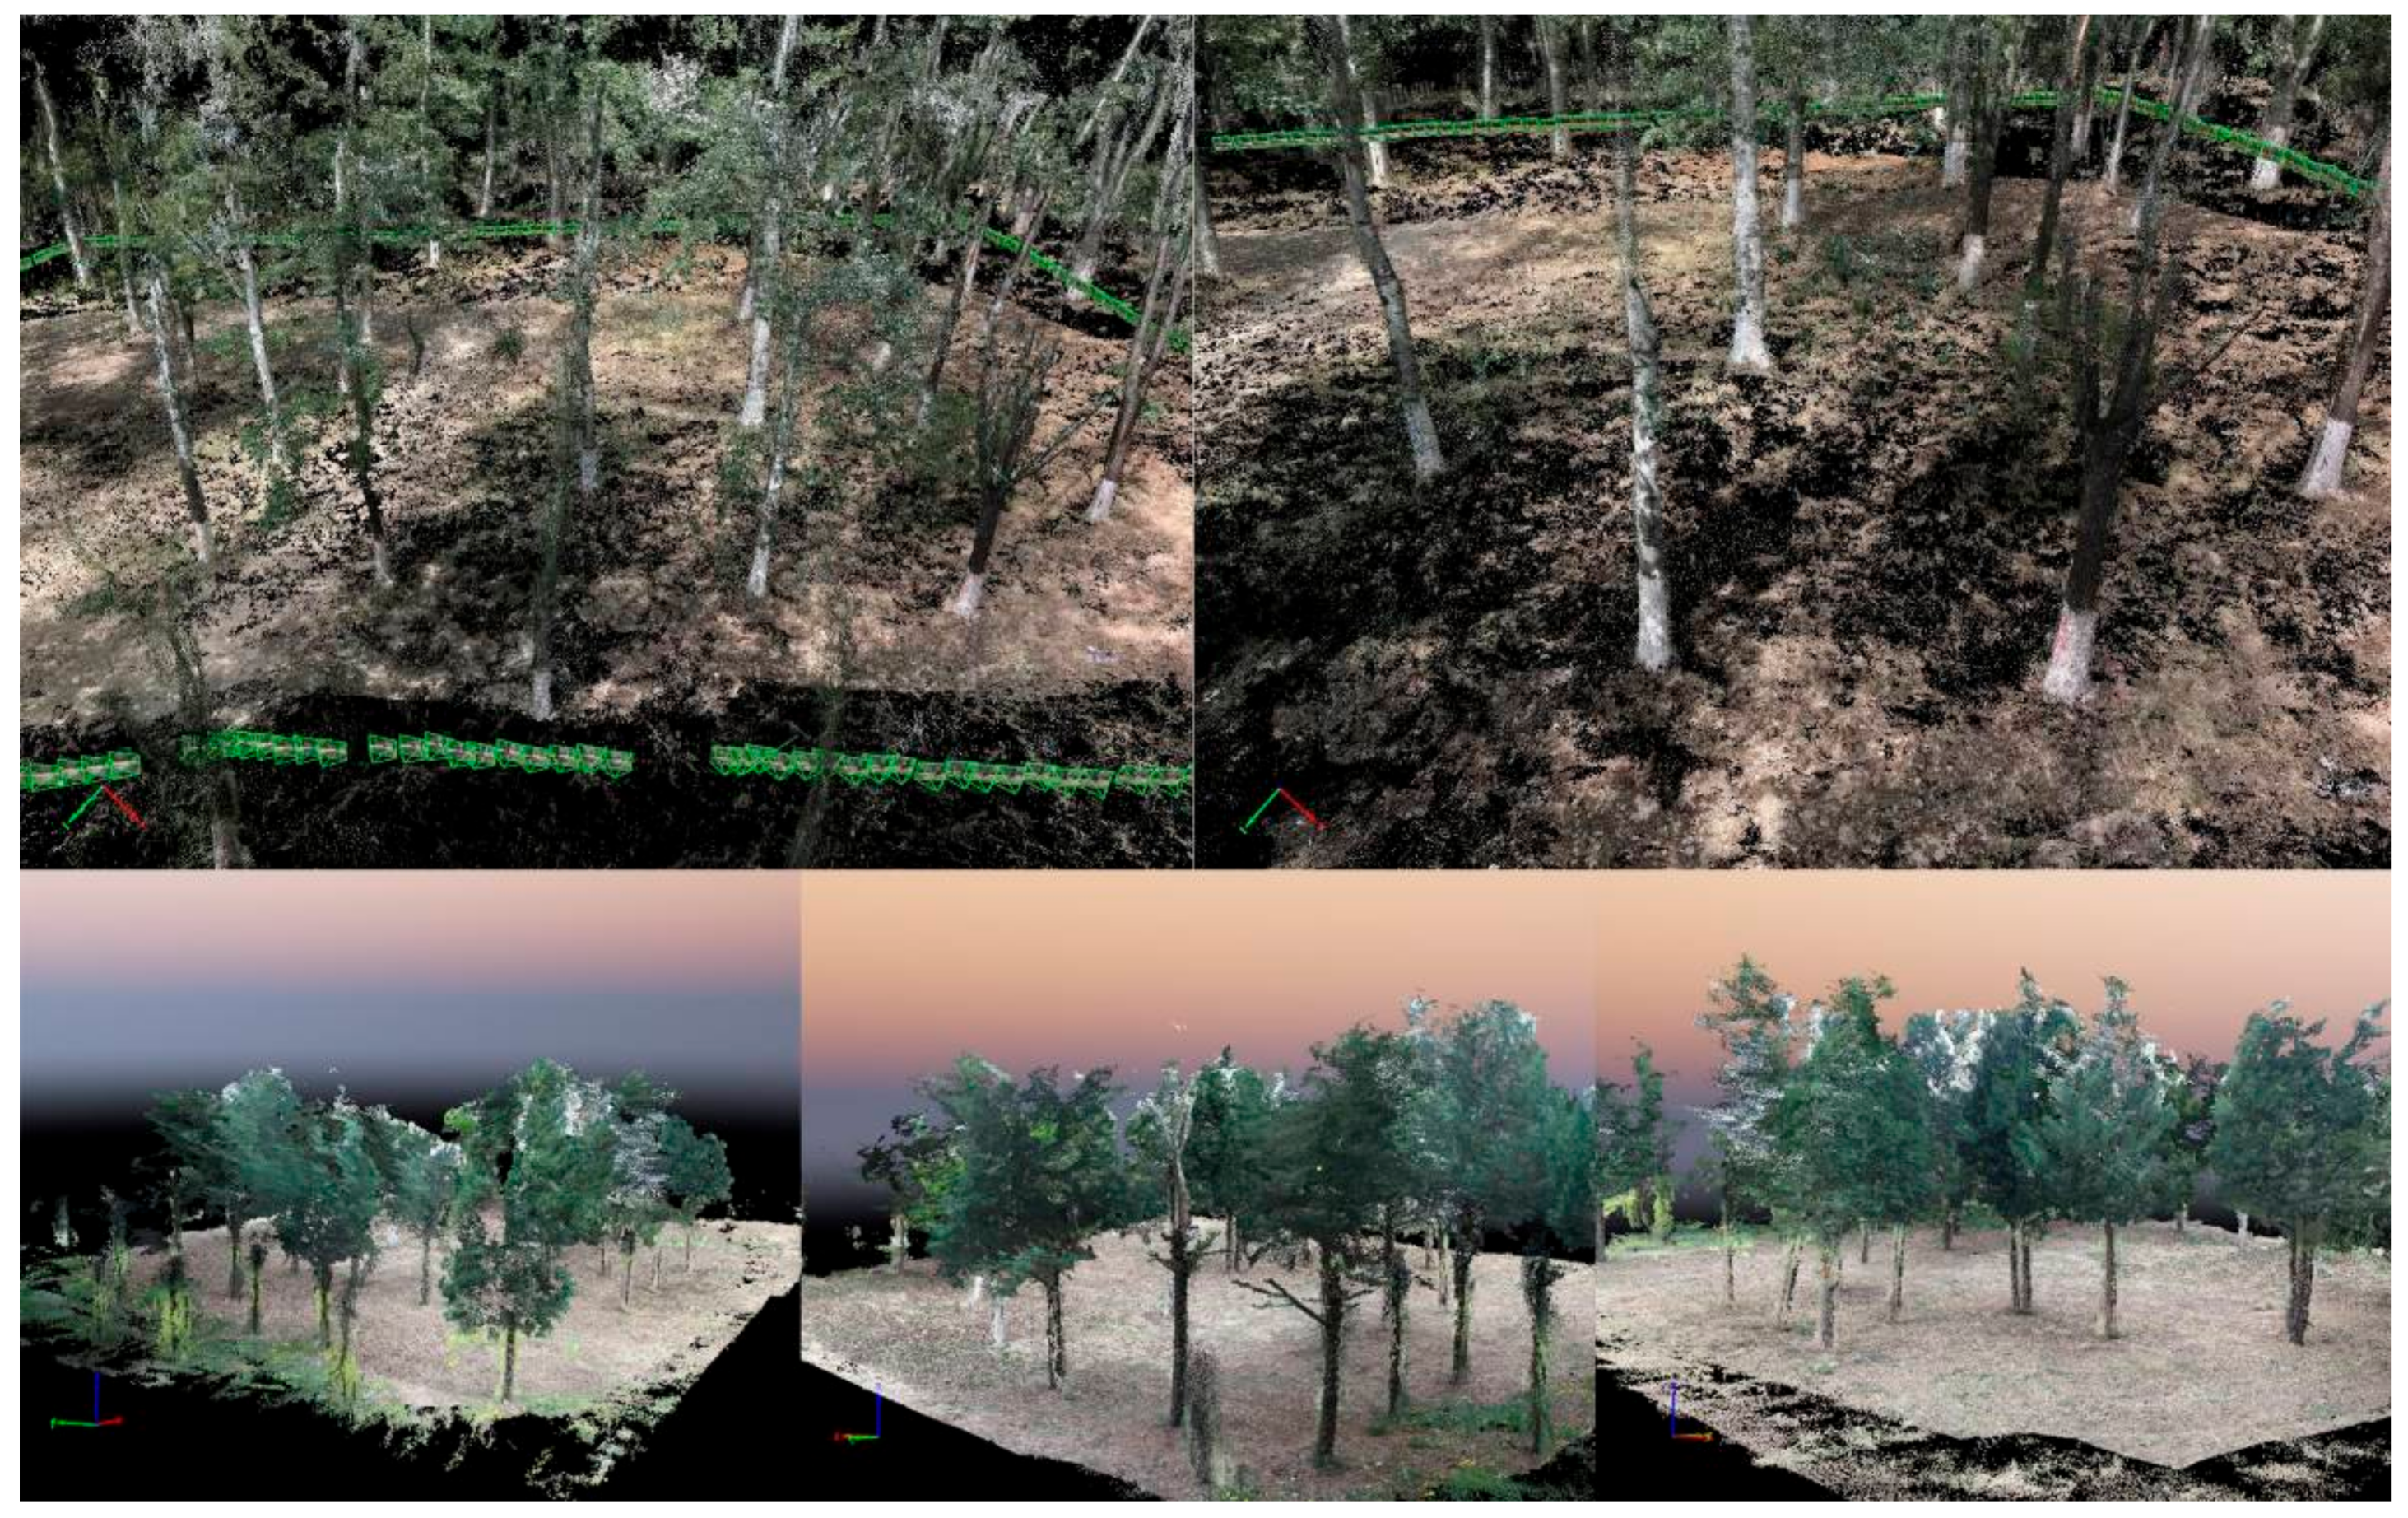
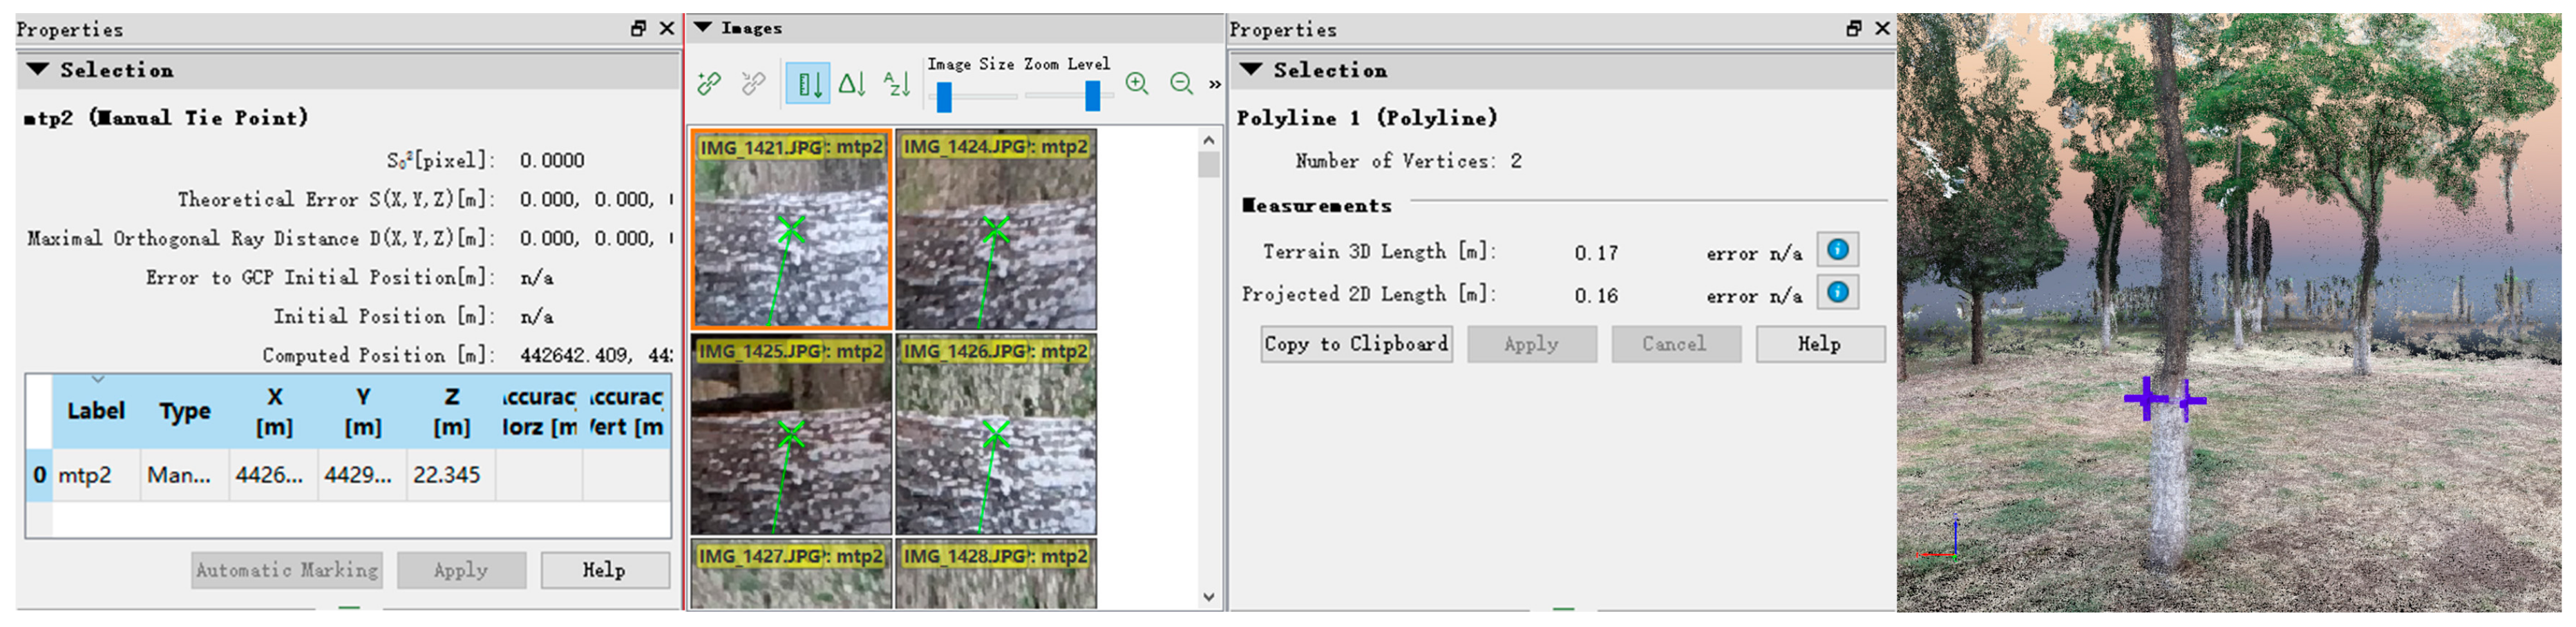
2.3.3. 3D Point Cloud Modeling and Measuring of Stand Plot

After the continuous photogrammetric measurement software developed in this project performed matching and correction of the images acquired by the PDA photogrammetry-based dendrometer, the images and the coordinate and orientation data were exported to a 3D modeling software for restoration of the three-dimensional point clouds of the stand plot (Figure 6).
The 3D modeling software’s measurement function (Figure 7) was also used to determine the trees’ three-dimensional coordinates, height, and DBH. The tree species were identified manually in reference to vegetation known to be present at Songshan, and tree numbers were assigned. The tree numbers, tree species, 3D tree coordinates, tree heights, and DBH values were entered into a database.

2.4. Additional Surveying of Individual Trees’ Height and DBH

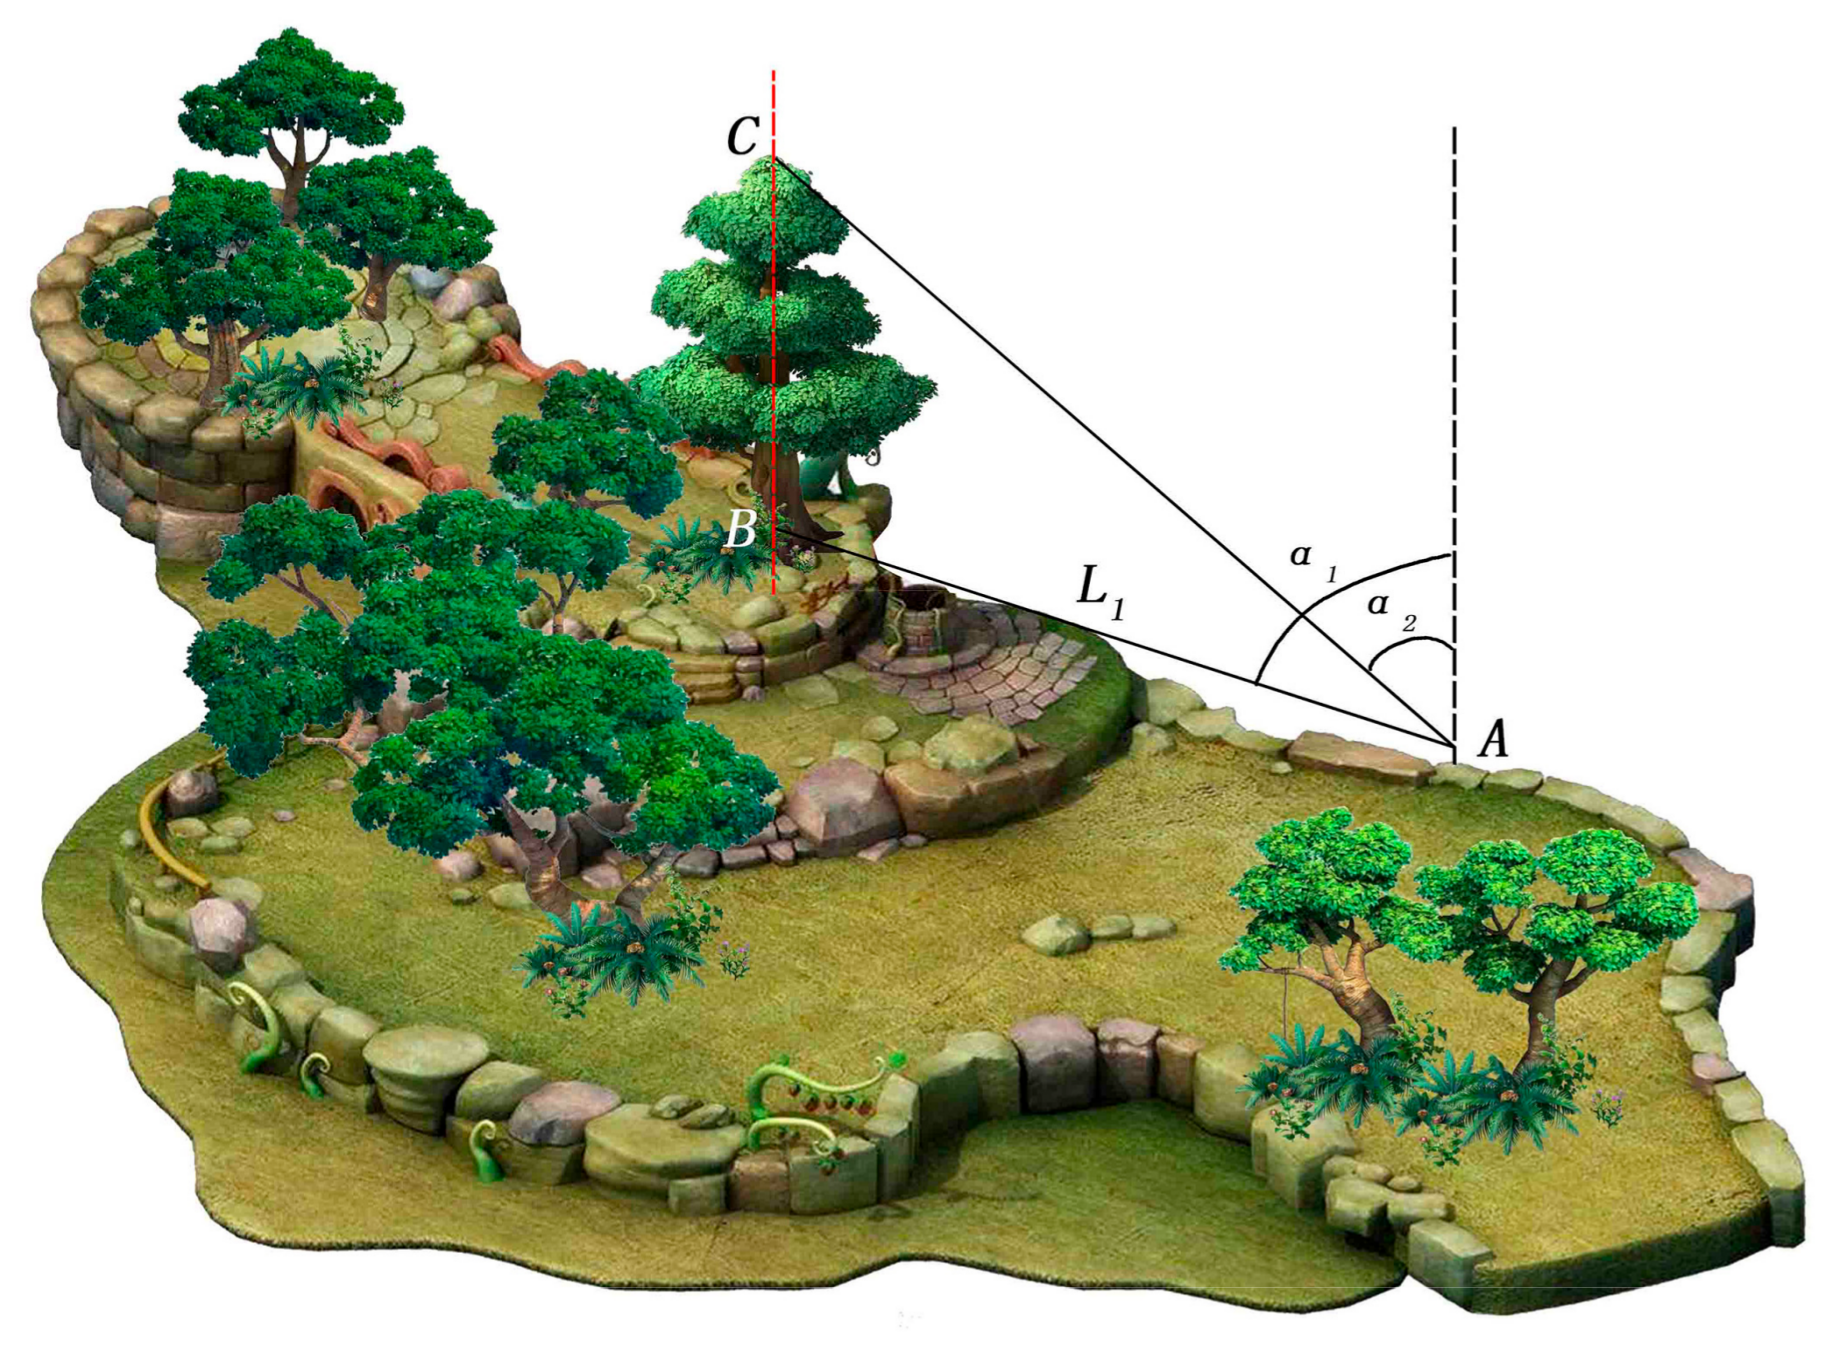
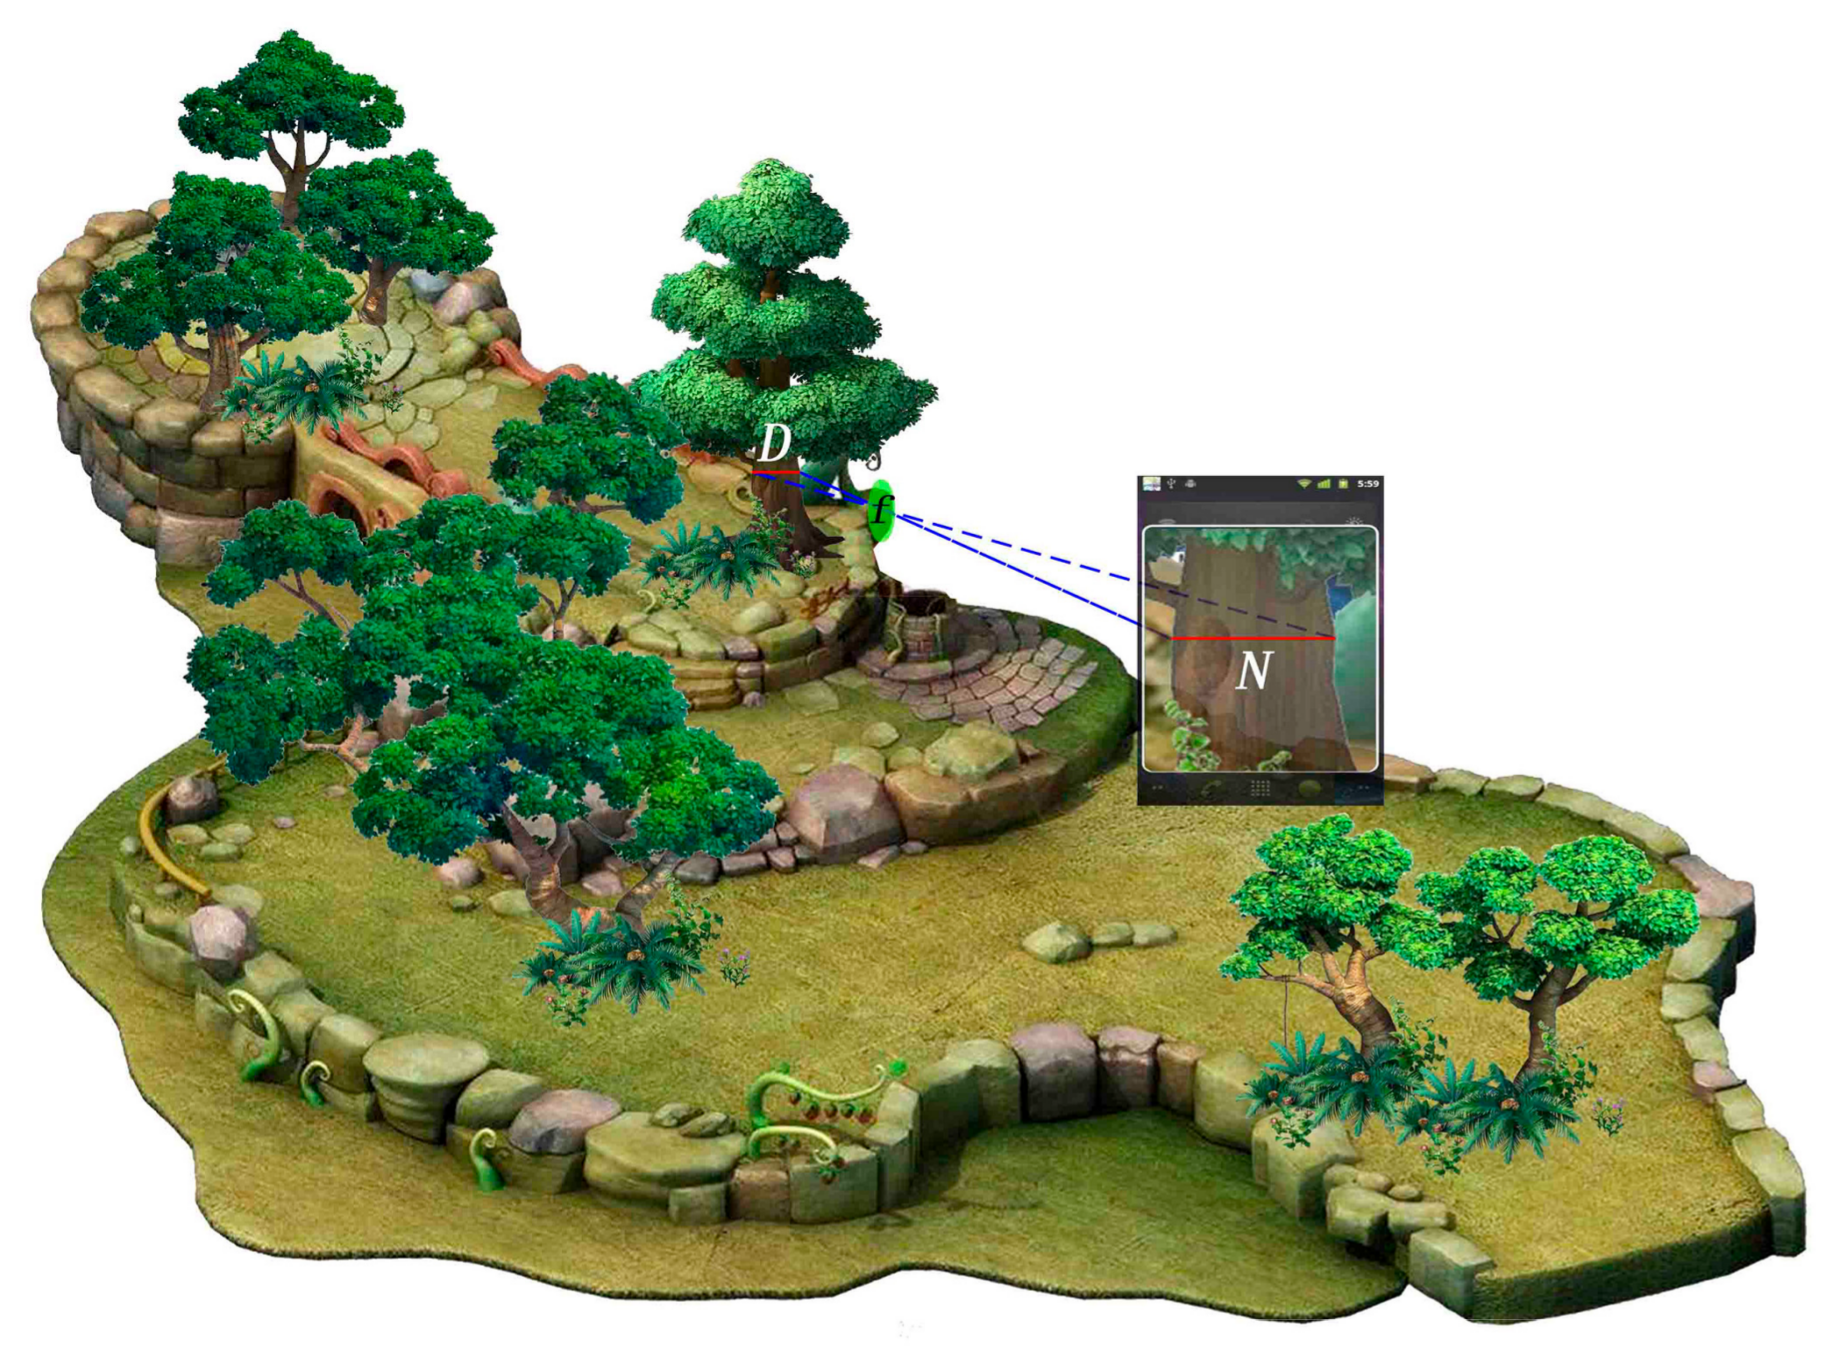
2.4.1. Analytic Algorithm for remote TREE Measurement

During the 3D modeling software’s stand plot 3D point cloud restoration process, many types of defects were inevitably present in the continuous photogrammetric data, including large-area data gaps, sudden changes in the point cloud density from area to area, and noise and aberrant points [28]. As a result, the PDA photogrammetry-based dendrometer had to be used to determine the heights and DBH values of individual trees. The topography at Songshan, which includes complex terrain, gorges, cliffs, and steep slopes, makes surveys difficult, and may prevent the measurement of visible trees. The PDA photogrammetry-based dendrometer performs non-contact measurements, and can readily resolve these problems. Measurement personnel using the dendrometer only had to walk to convenient locations near each plot, use the instrument to edit the plot data, and make remote measurements of individual trees’ height and DBH, which increased the measurement efficiency.
The tree height measurement method is shown in Figure 8. To obtain accurate tree heights, it is typically necessary to address the following aspects: (1) the horizontal distance should be as similar to the tree height as possible, which will minimize the height measurement error; (2) this instrument is not appropriate to use when the tree height is too small (less than 5 m), in which case the height can be measured directly using a long measuring rod; and (3) in the case of broadleaf trees, it is necessary to note the location of the top of the main trunk, which will ensure that the measured height is not too high or too low [29]. The principle of similar triangles was used to calculate the tree height:
H = L 1 sin ( α 1 α 2 ) sin α 2
Many tools are used to measure the DBH, the most common of which include calipers, a diameter measuring tape, and a hook gauge [30]. The instrument used in this study performed non-contact DBH measurements by employing image recognition technology, and the measurement results consisted of caliper measurements. The method used to measure the DBH is shown in Figure 9, where the cross on the screen was aimed at the center of a tree trunk to obtain trunk image data. Based on the CCD camera’s imaging principles, the diameter was:
D = N L 2 f

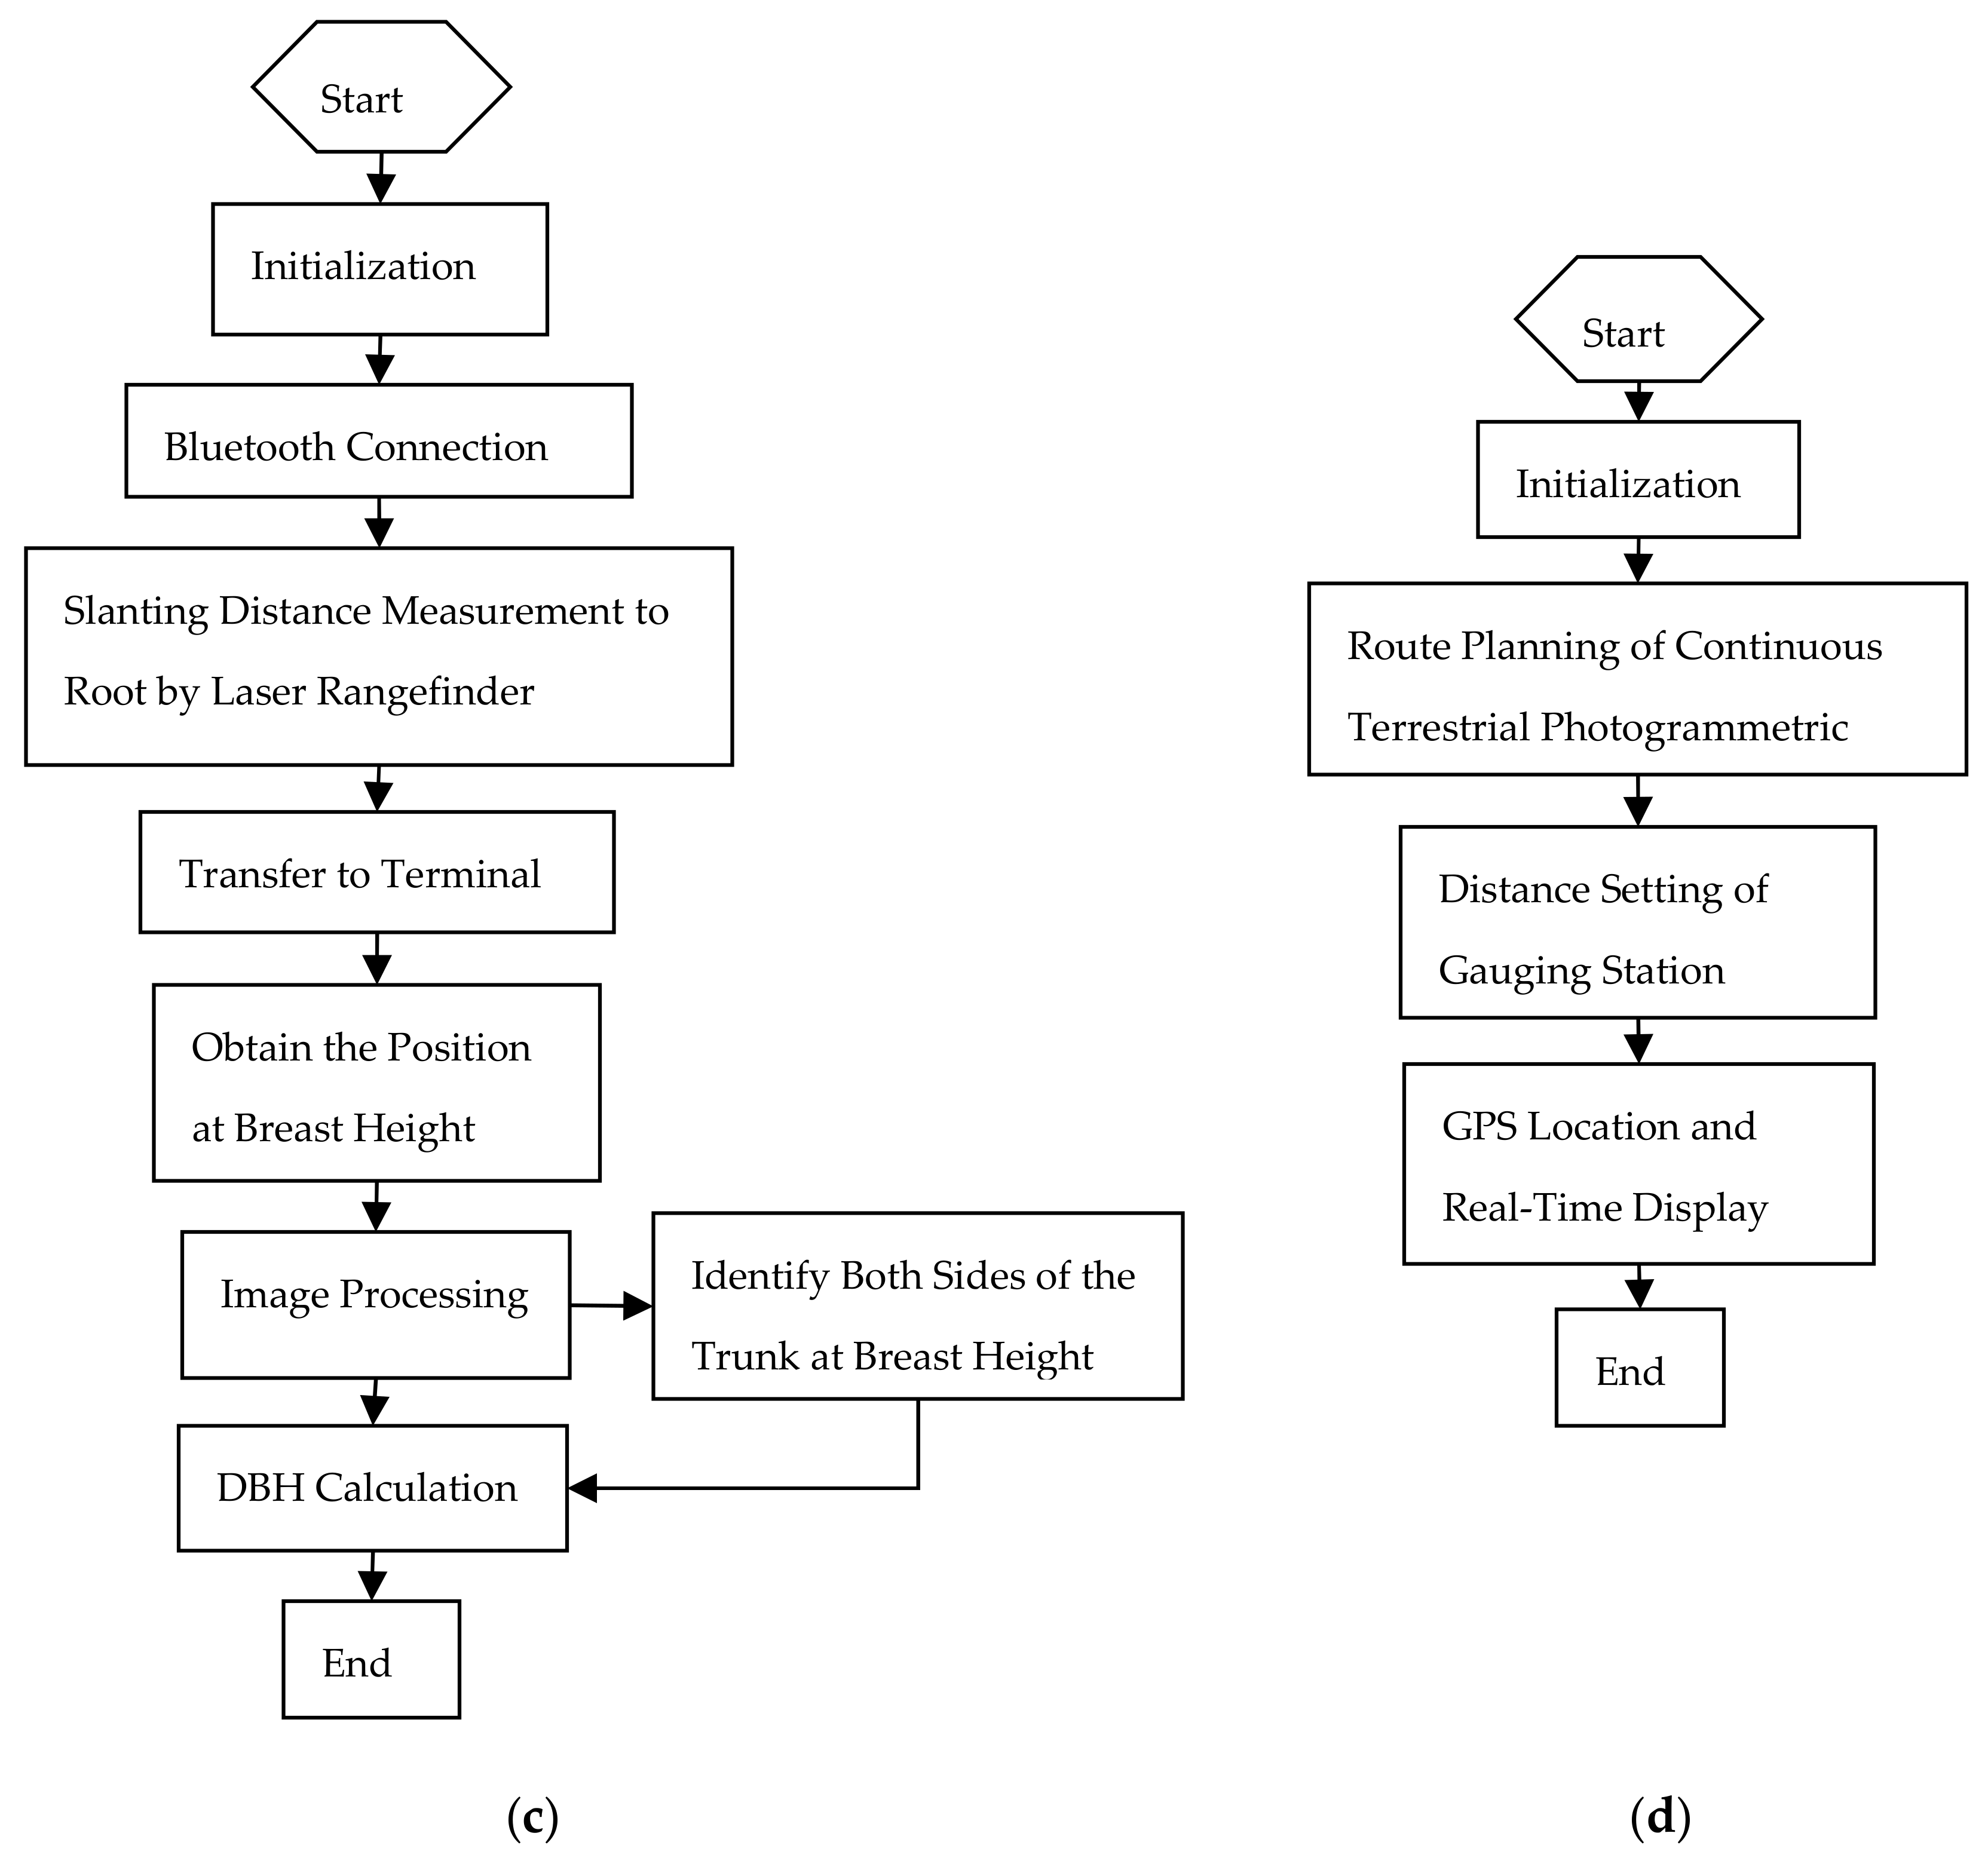
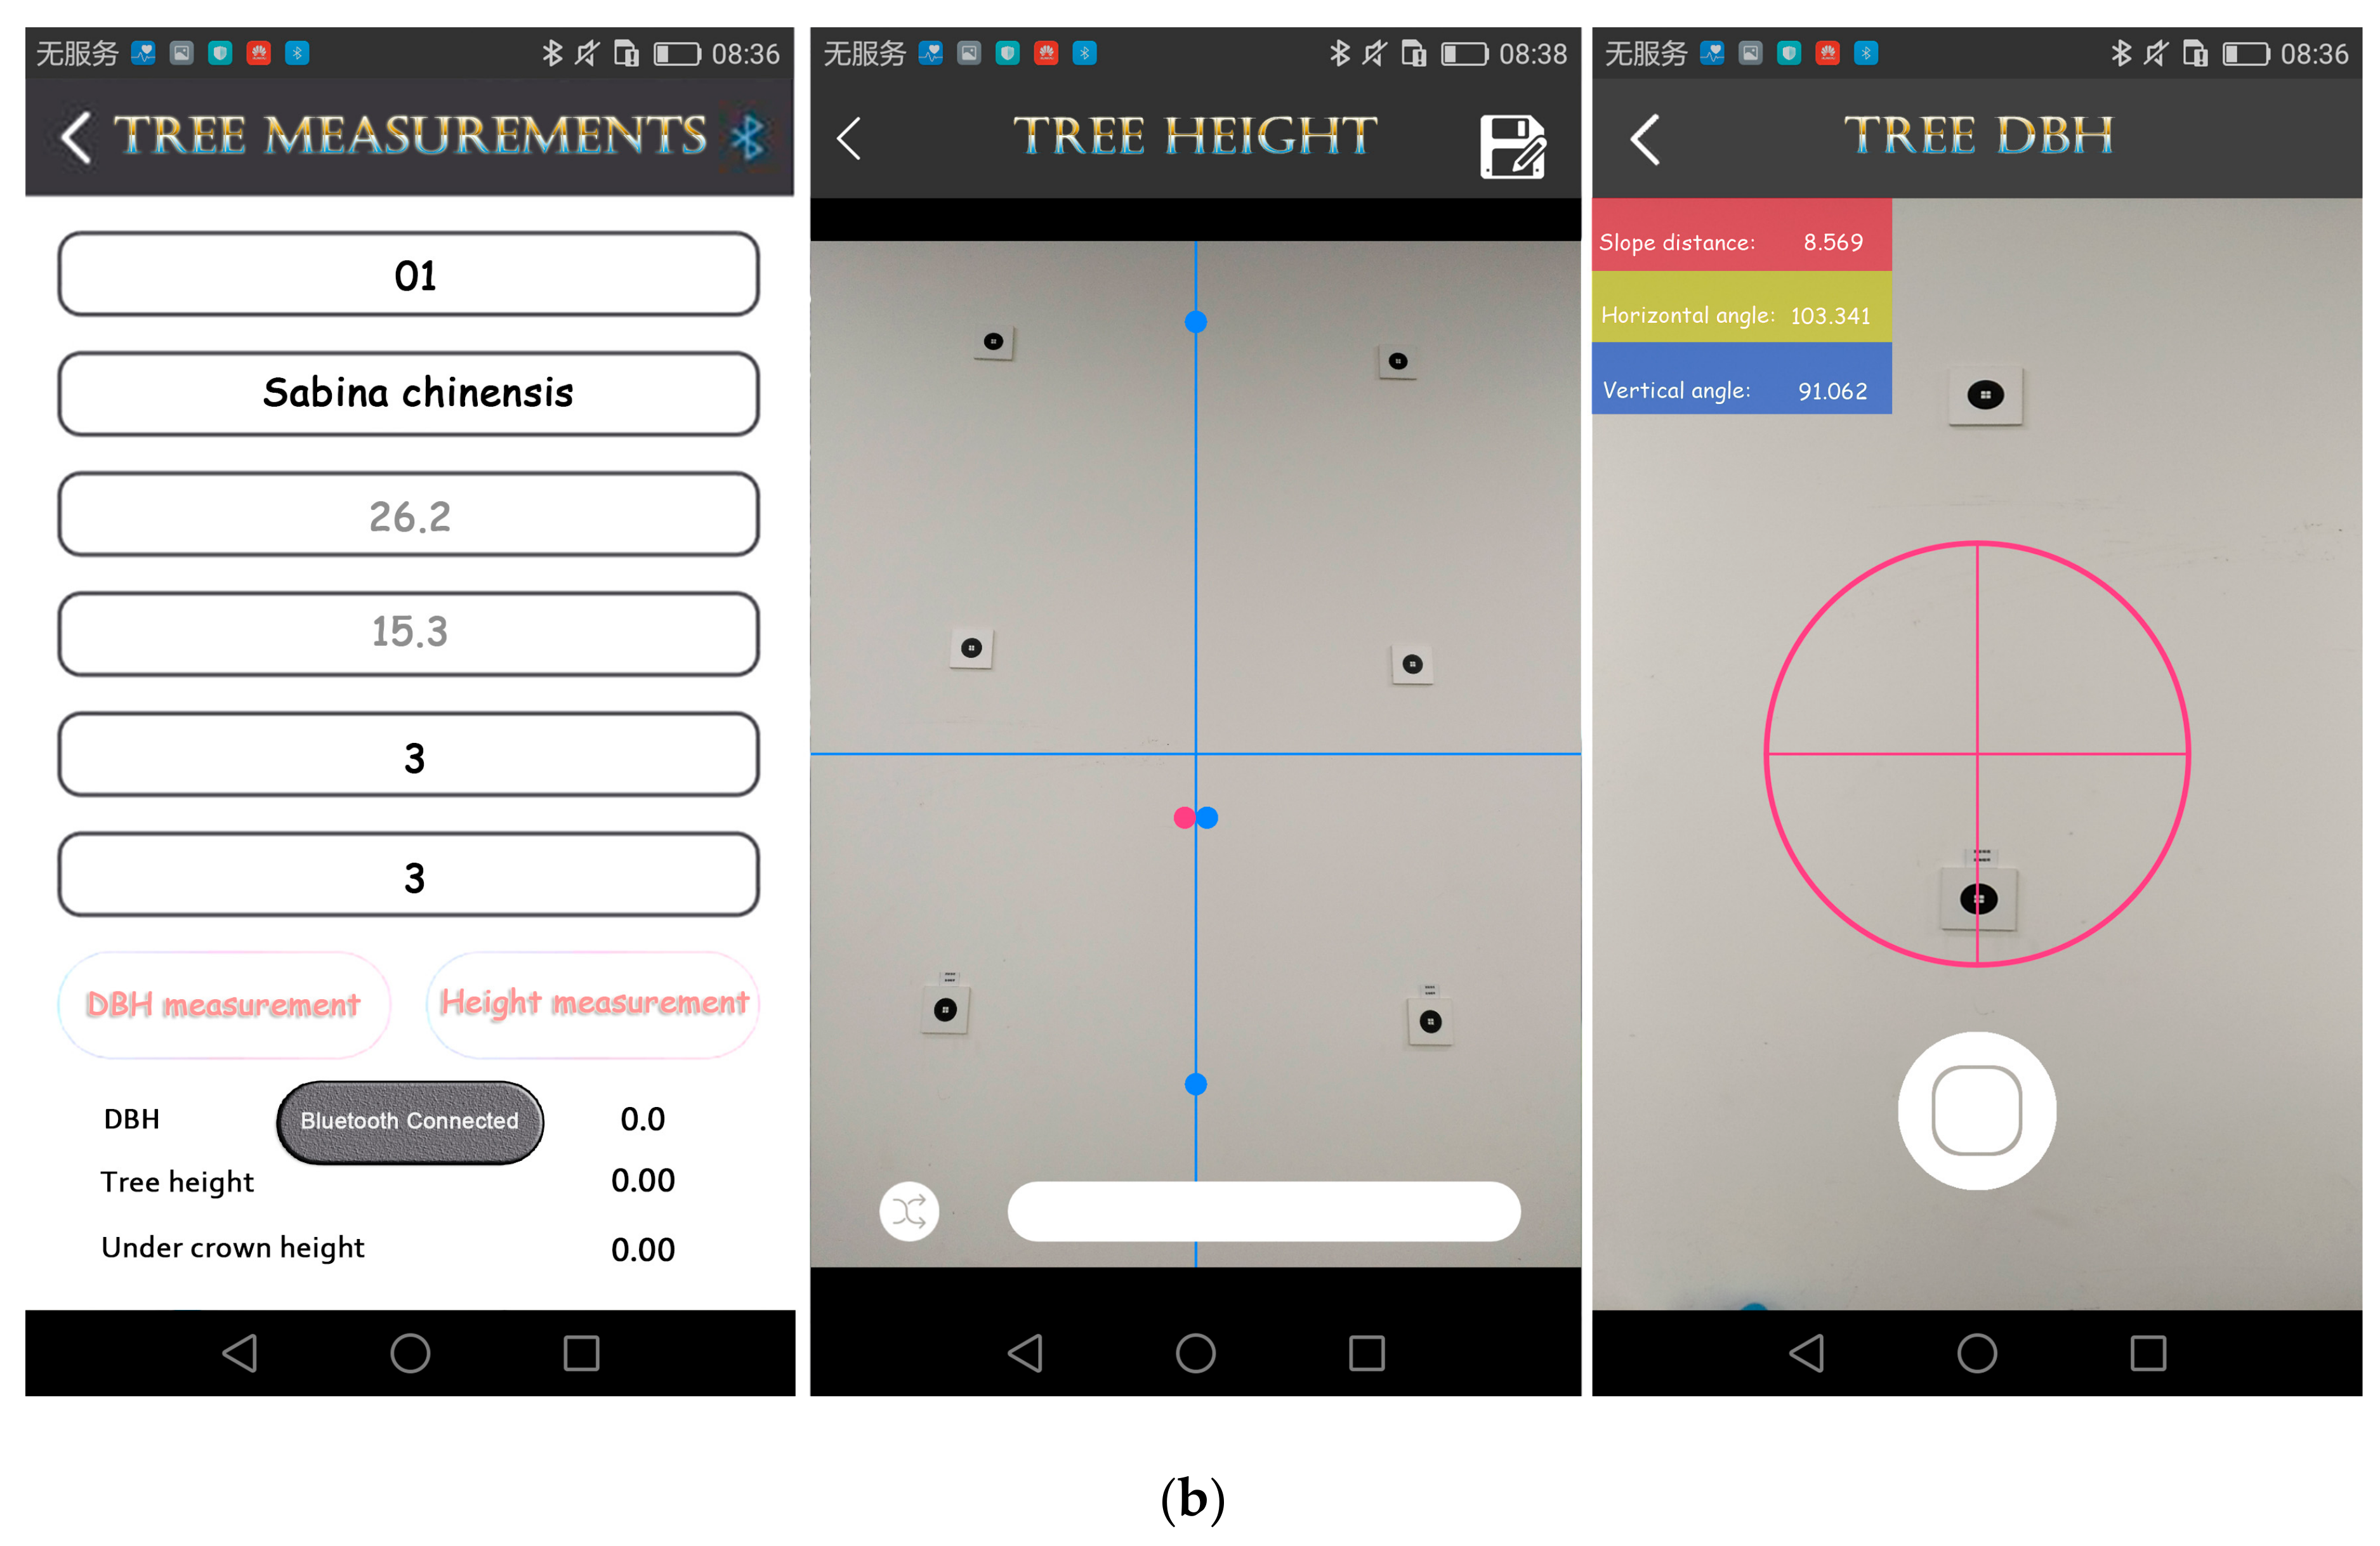
2.4.2. Development of Remote Tree Measurement Software

The remote tree measurement analysis algorithm software was developed on an Android system platform based on a Linux kernel and integrated in the Android Studio 2.1 development environment. The Java language was used to implement the software, which stored the data in an SQLite database and provided tree height measurements, DBH measurements, and loop construction for photogrammetry route-planning functions. As shown by the embedded main program flowchart in Figure 10a, the main program primarily consists of an initialization and function selection interface, which allows users to select and enter different functional modules. Figure 10b–d show program flowcharts for the three Android end functional modules.
Figure 11a,b show a schematic diagram of the program interface, which includes the main measurement parameters, including tree height and DBH, and auxiliary measurement parameters, such as image data, inclination, slope distance, and magnetic azimuth. The acquired data are stored internally in the form of text, and can be exported via a micro USB port.

3. Results and Discussion

3.1. Pre-Experiment Preparation

To verify the accuracy of the terrestrial continuous photogrammetric measurement system that was developed in this project, we performed separate verifications of the precision of the PDA photogrammetry-based dendrometer and the precision of the stand plot continuous photogrammetric measurements. We selected 59 plots with relatively flat topography from the 2000 plots at the Beijing Songshan National Nature Reserve to serve as an experimental area. This area contained 18 species of trees commonly found in the Beijing area, including Armeniaca sibirica, ash, black birch, Bunge hackberry, Chinese pine, elm, Juglans, Juglans mandshurica, jujube, Manchurian lilac, Mongolian oak, Populus davidiana, Shantung maple, Sorbus pohuashanensis, Ulmus pumila, and willow. Representative trees were selected as experimental targets, and had heights of more than 5 m and DBH values of more than 5 cm. An NTS-372R total-station instrument manufactured by the South Surveying & Mapping Instrument Co., Ltd., Guangzhou, China was used to measure the height of each tree within the experimental plots, and a DBH caliper was employed to measure the DBH of each tree. Since the theoretical precision of the total station instrument’s non-destructive measurements was much greater than the precision requirements of other types of forestry surveys [31], the tree height data obtained using the total station served as reference values, and the data obtained using the DBH caliper served as DBH reference values. The Table 1 displays the accuracy required for traditional forestry surveys.
The bias, root mean square error (RMSE), and relative bias were employed to verify the precision, and were calculated as follows [32]:
B i a s = 1 n i = 1 n e i = 1 n i = 1 n ( y i y r i )
R M S E = ( y i y r i ) 2 n
B i a s % = B i a s y r ¯ × 100 %
R M S E % = R M S E y r ¯ × 100 %
where y i is the ith estimation, y r i is the ith reference, y r ¯ is the mean of the reference values, and n is the number of estimations.

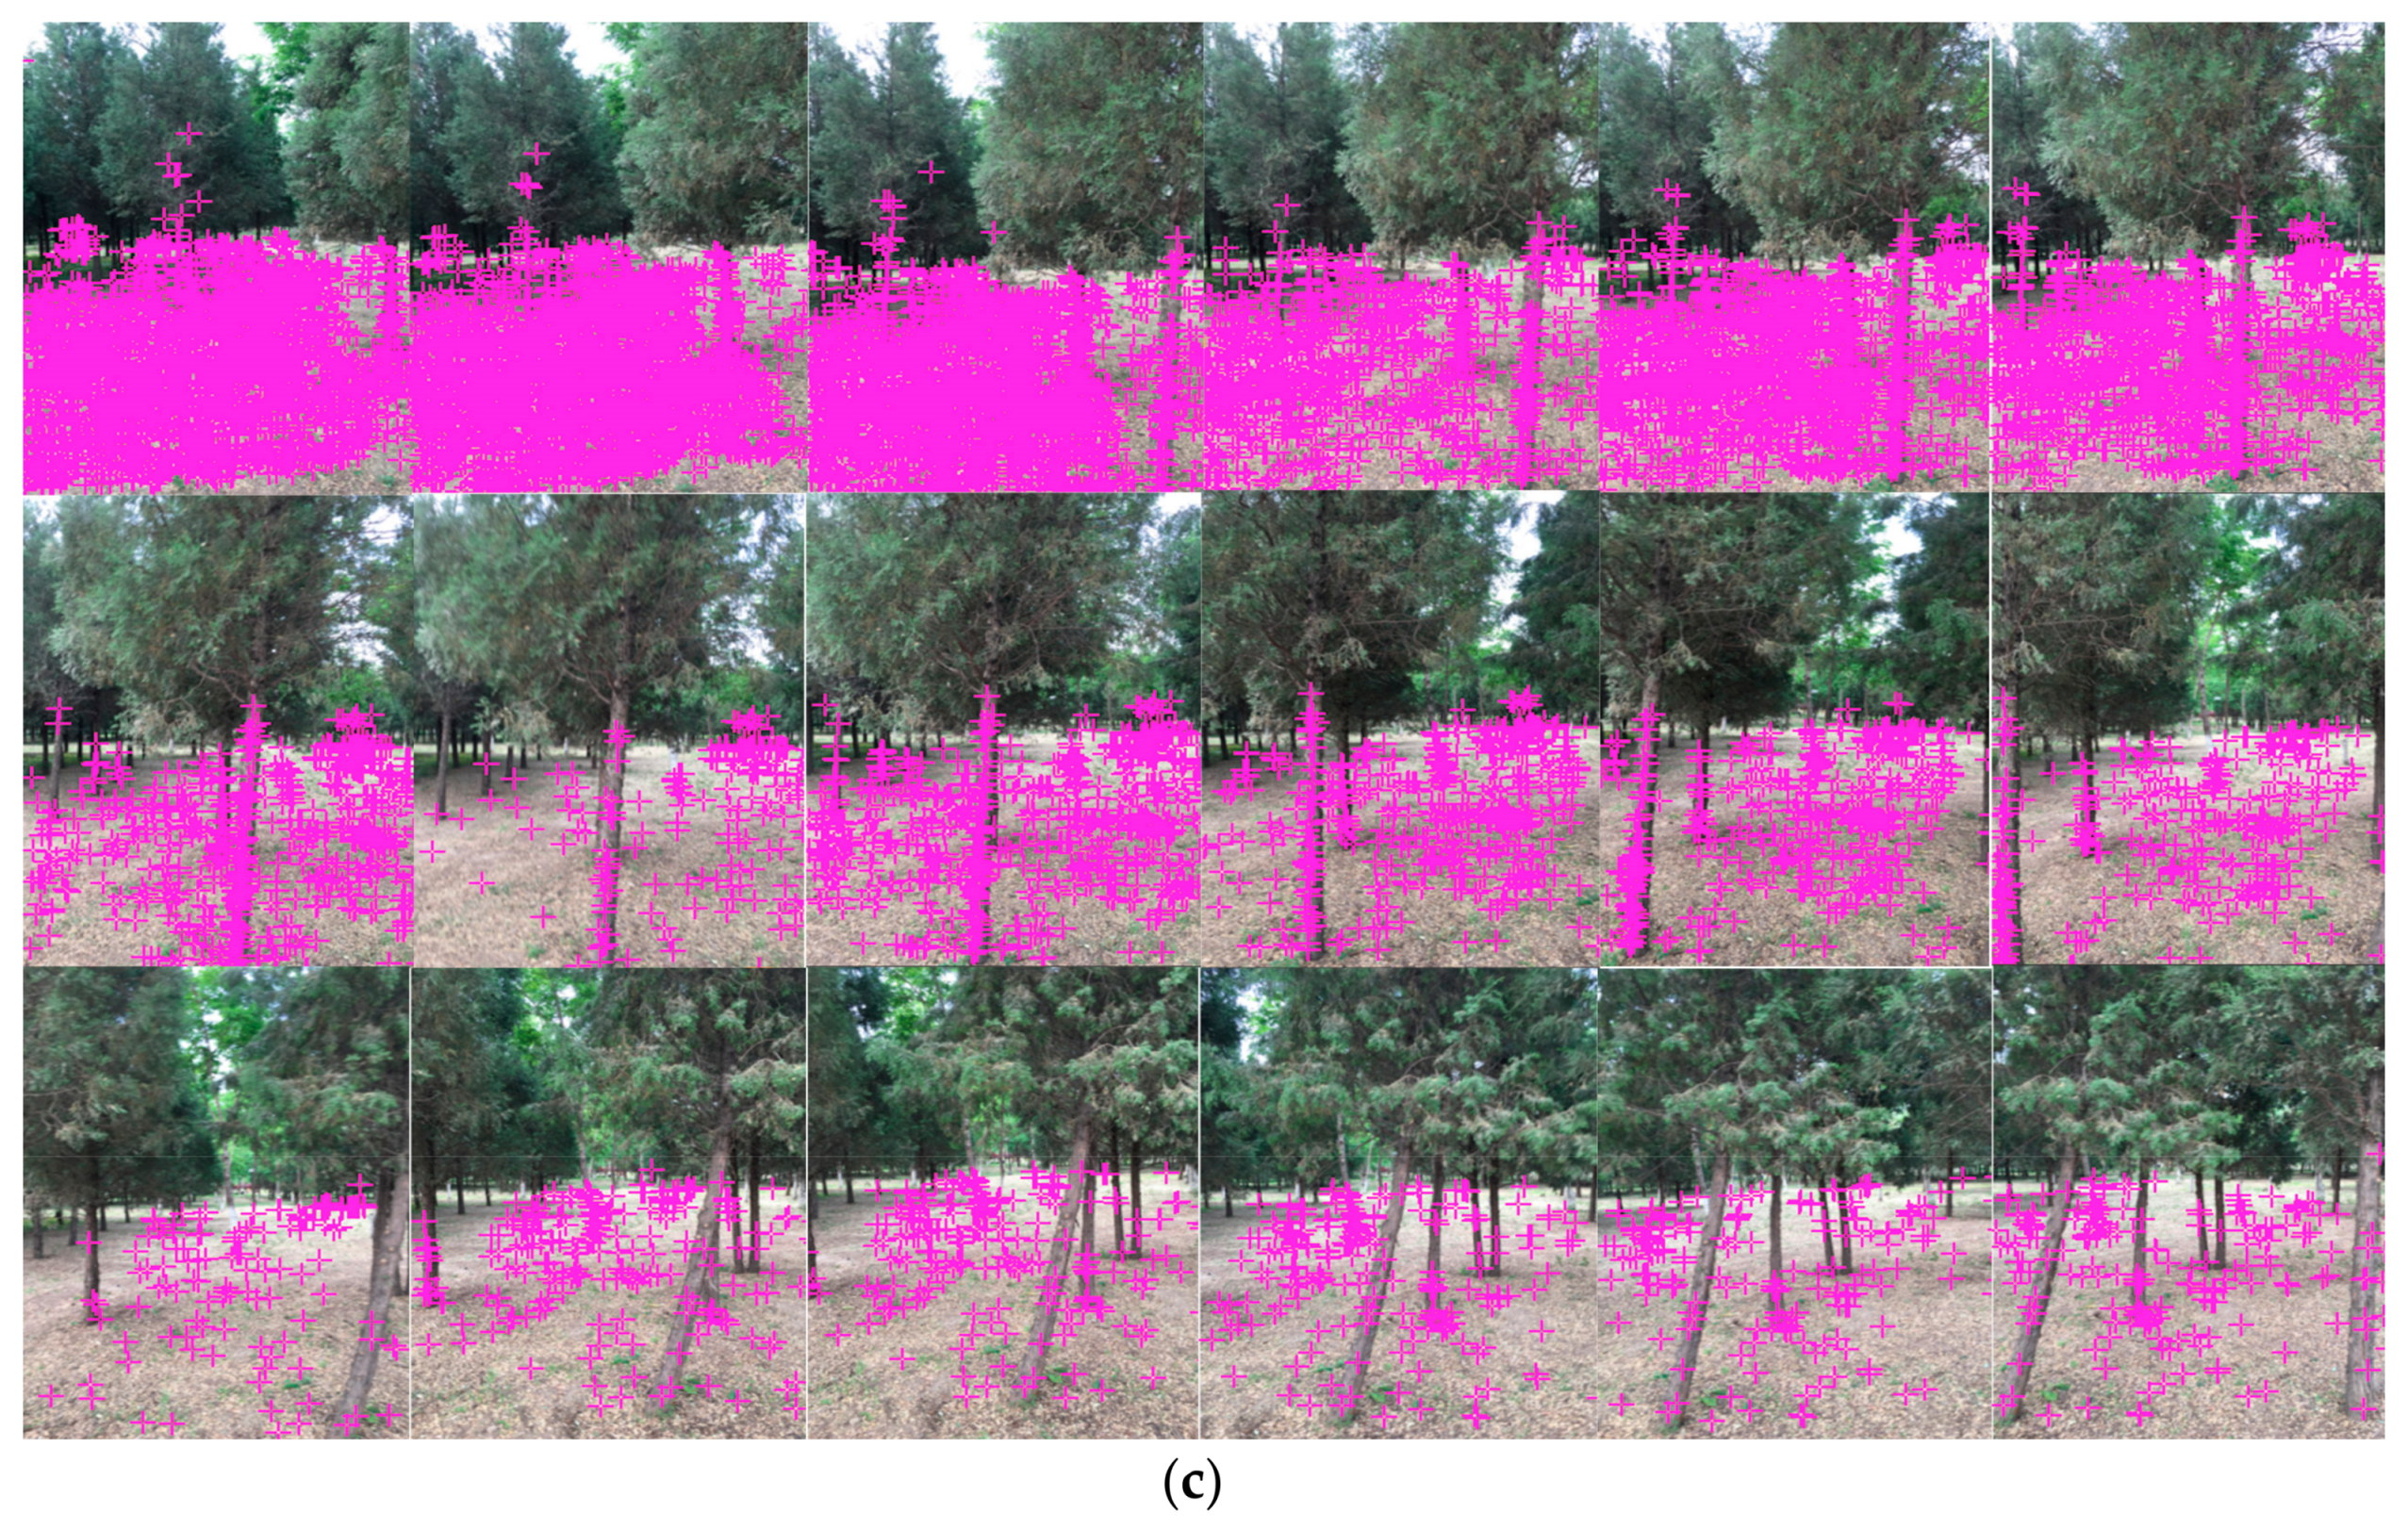
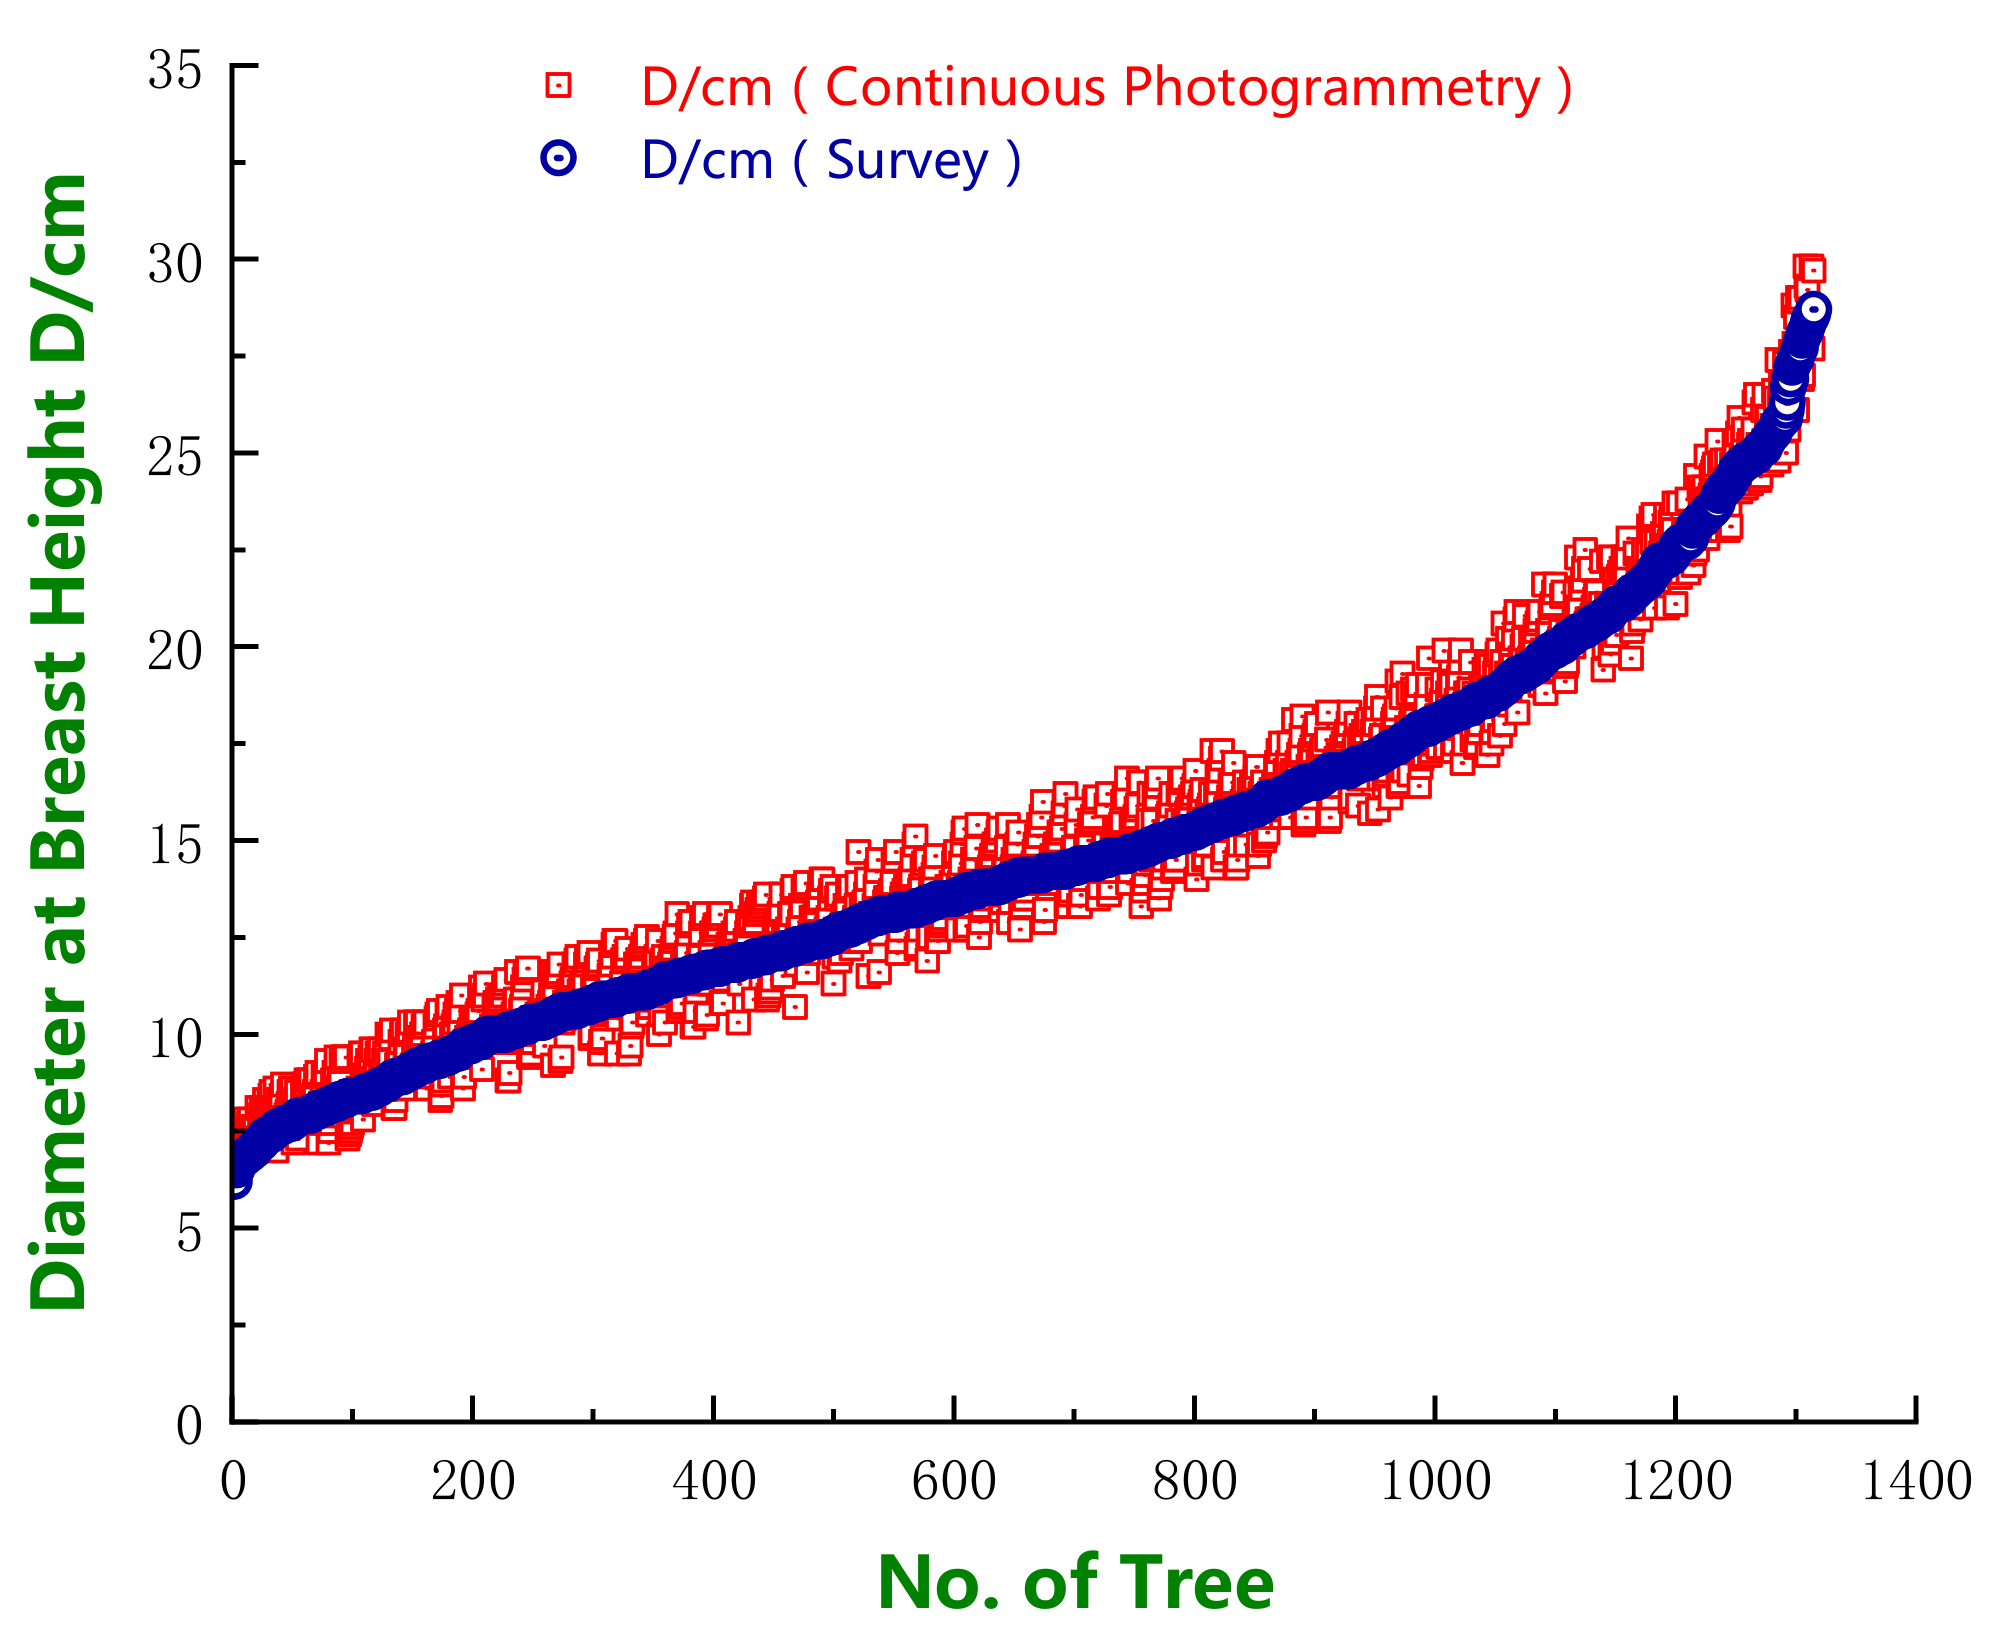
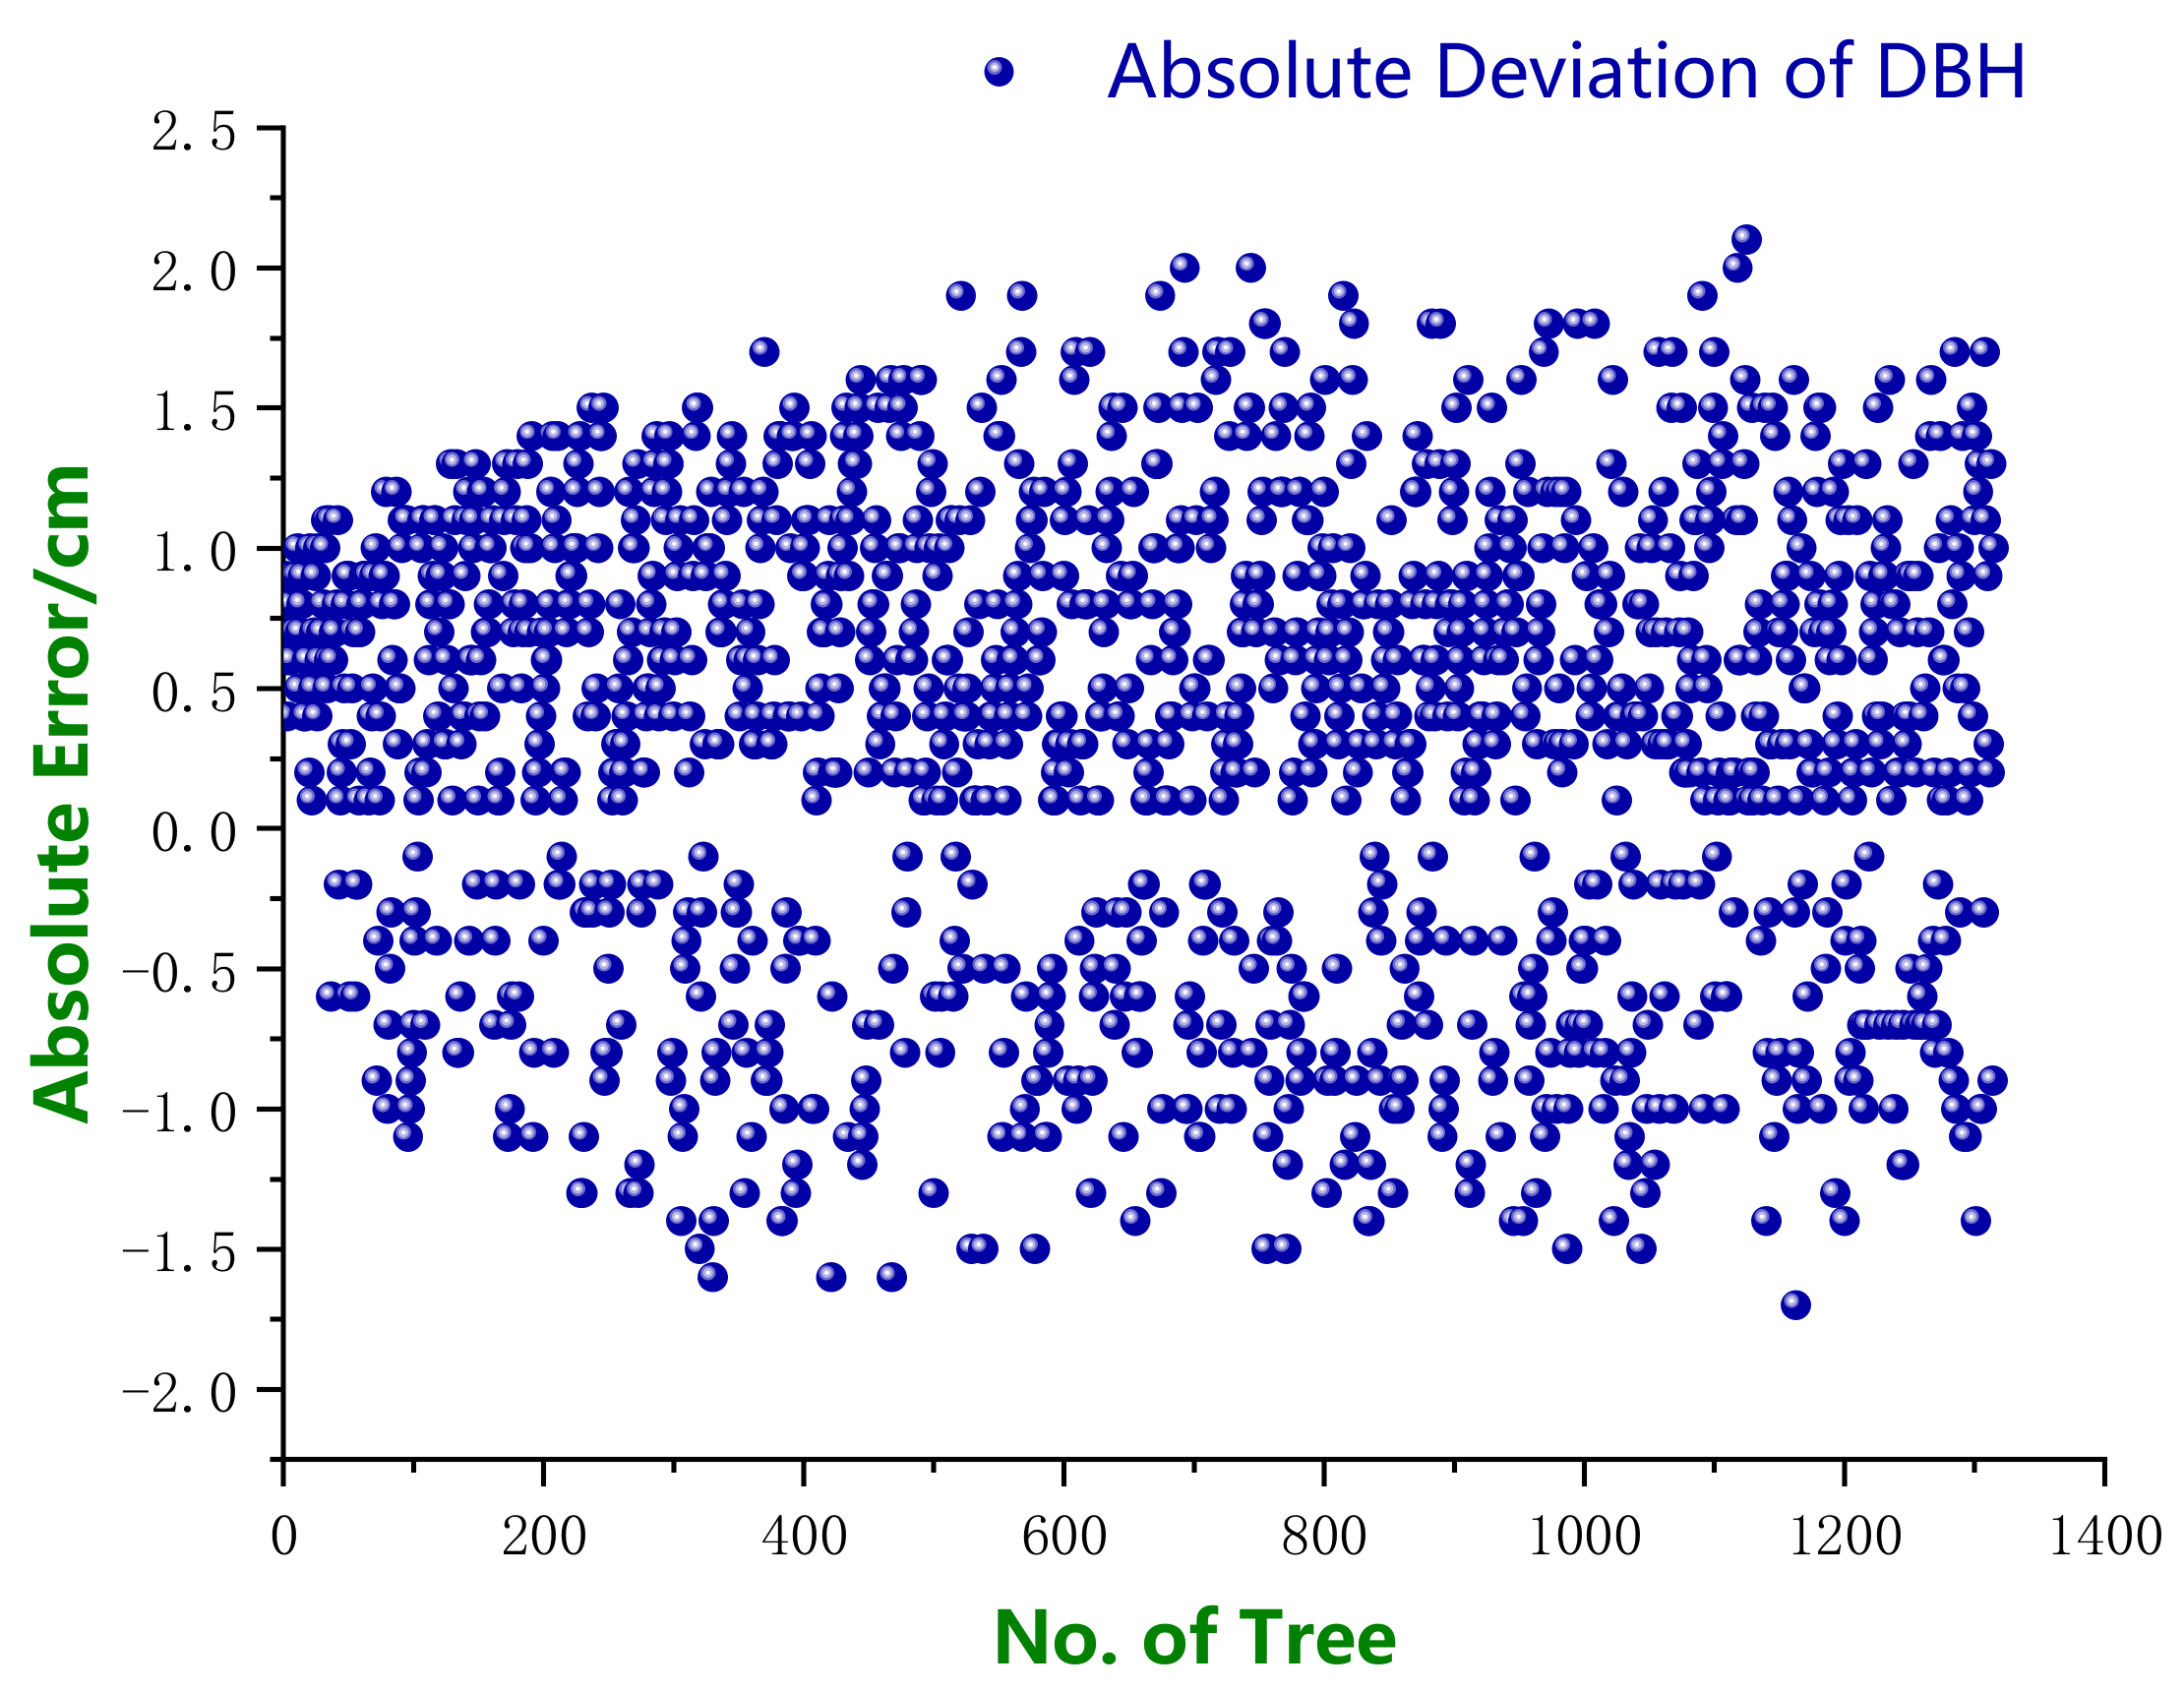
3.2. Experimental Analysis of Continuous Photogrammetry in Stand Plots

A DBH caliper was used to measure the DBH of each representative tree within the 59 plots, and continuous photogrammetric measurements of the stand plots were used to perform 3D point cloud restoration and measure the DBH values of the trees in the 59 plots. The trees were ranked in order of their DBH. Measurements were collected for 1315 trees, and the DBH values ranged from 6.2 cm to 28.7 cm (Figure 12). The values measured using the DBH caliper served as the reference values, and a plot of the absolute error distribution of the DBH values obtained using the stand plot continuous photogrammetric measurements was obtained (Figure 13).
The results indicated that most of the DBH values obtained via continuous photogrammetric measurements were larger than the values measured using the DBH caliper, and the DBH measurement errors measured by the continuous photogrammetric measurements were distributed on both sides of y = 0. The largest measurement error was 2.1 cm, and most of the errors were less than 1.5 cm, which accounted for 96% of the error. In Table 2, the relative RMSE of the DBH measurements made by the stand plot continuous photogrammetric measurements was 5.96%, which met the class-B error requirements for second-class forest surveys.
The total-station instrument was used to measure the height of every representative tree, and the stand plot continuous photogrammetric measurements were used to perform 3D point cloud restoration and measure the heights of the trees in the 59 plots. The trees were ranked in order of their height. Measurements were obtained for 1315 trees, and the tree heights ranged from 5.44 m to 17.99 m (Figure 14). The values measured using the total station served as the reference values, and a plot of the error distribution of the tree heights measured using the stand plot continuous photogrammetric measurements was obtained (Figure 15).
The results indicated that the errors of the continuous photogrammetric measurements of the tree height were distributed on both sides of y = 0. The largest measurement error was 1.16 m, and the errors were primarily less than 0.90 m, which accounted for 93% of the total error. In Table 3, the relative RMSE of the tree height measurements obtained by stand plot continuous photogrammetry was 5.96%, which met the class-B error requirements for second-class forest surveys.
Stand plot continuous photogrammetric measurements involve the acquisition of 3D coordinate and orientation data by an inertial measurement unit/differential global positioning system (GPS) (IMU/DGPS) system using a brief beam of light and calculating the external orientation elements of each image via a comprehensive data adjustment process. In addition, stand plot continuous photogrammetric measurements can obtain more precise external orientation elements by taking the external orientation elements obtained by the PDA photogrammetry-based dendrometer as known weighted observed values, performing a regional network adjustment, and further using the control points measured by RTK to perform a systematic network adjustment. This method involves a conversion between the coordinate system and the photogrammetry station’s coordinate system, which includes a conversion between the three orientation angles directly measured using the PDA photogrammetry-based dendrometer and the three angular elements of the external orientation elements, as well as a conversion between the 3D coordinates obtained directly by the PDA photogrammetry-based dendrometer and the coordinates of the external orientation elements.
Since this method may be influenced by many factors, many kinds of errors may be present:
(1)
The accelerometer in the PDA photogrammetry-based dendrometer is subject to dynamic errors, and gyroscopic drift will induce an orientation angle measurement error. In addition, the idiosyncrasies of the IMU will cause the navigation error to accumulate with time, which will have a negative impact on the navigation precision.
(2)
The PDA photogrammetry-based dendrometer’s GPS unit may encounter an unstable or interrupted satellite signal when in a moving vehicle, which will affect the positioning precision.
(3)
The stand plot continuous photogrammetric measurement system consists of an integrated PDA photogrammetry-based dendrometer accelerometer, gyroscope, IMU, and GPS. The system integration process and data processing will inevitably generate errors, and the fact that photogrammetry is influenced by the external environment will lead to eccentricity errors, time synchronization errors, and iteration errors in the data processing.
(4)
Although the PDA photogrammetry-based dendrometer’s internal orientation elements are assessed and tested, the internal orientation elements will vary slightly in a cyclic fashion with increasing time. Due to the differences between the field survey environments and the laboratory testing environment, the fixed errors of the internal orientation elements will directly affect the positioning precision.
(5)
Errors in the integration of the system’s different technologies will lead to some eccentricity between the PDA photogrammetry-based dendrometer’s four independent systems: namely, the accelerometer, gyroscope, IMU, and GPS. Angular eccentricity and eccentric components will exist in the three axial directions, and will directly impact the positioning precision; the angular eccentricity and eccentric components also must be corrected by a calibration facility, and the calibration facility’s fixed errors will further influence positioning results.

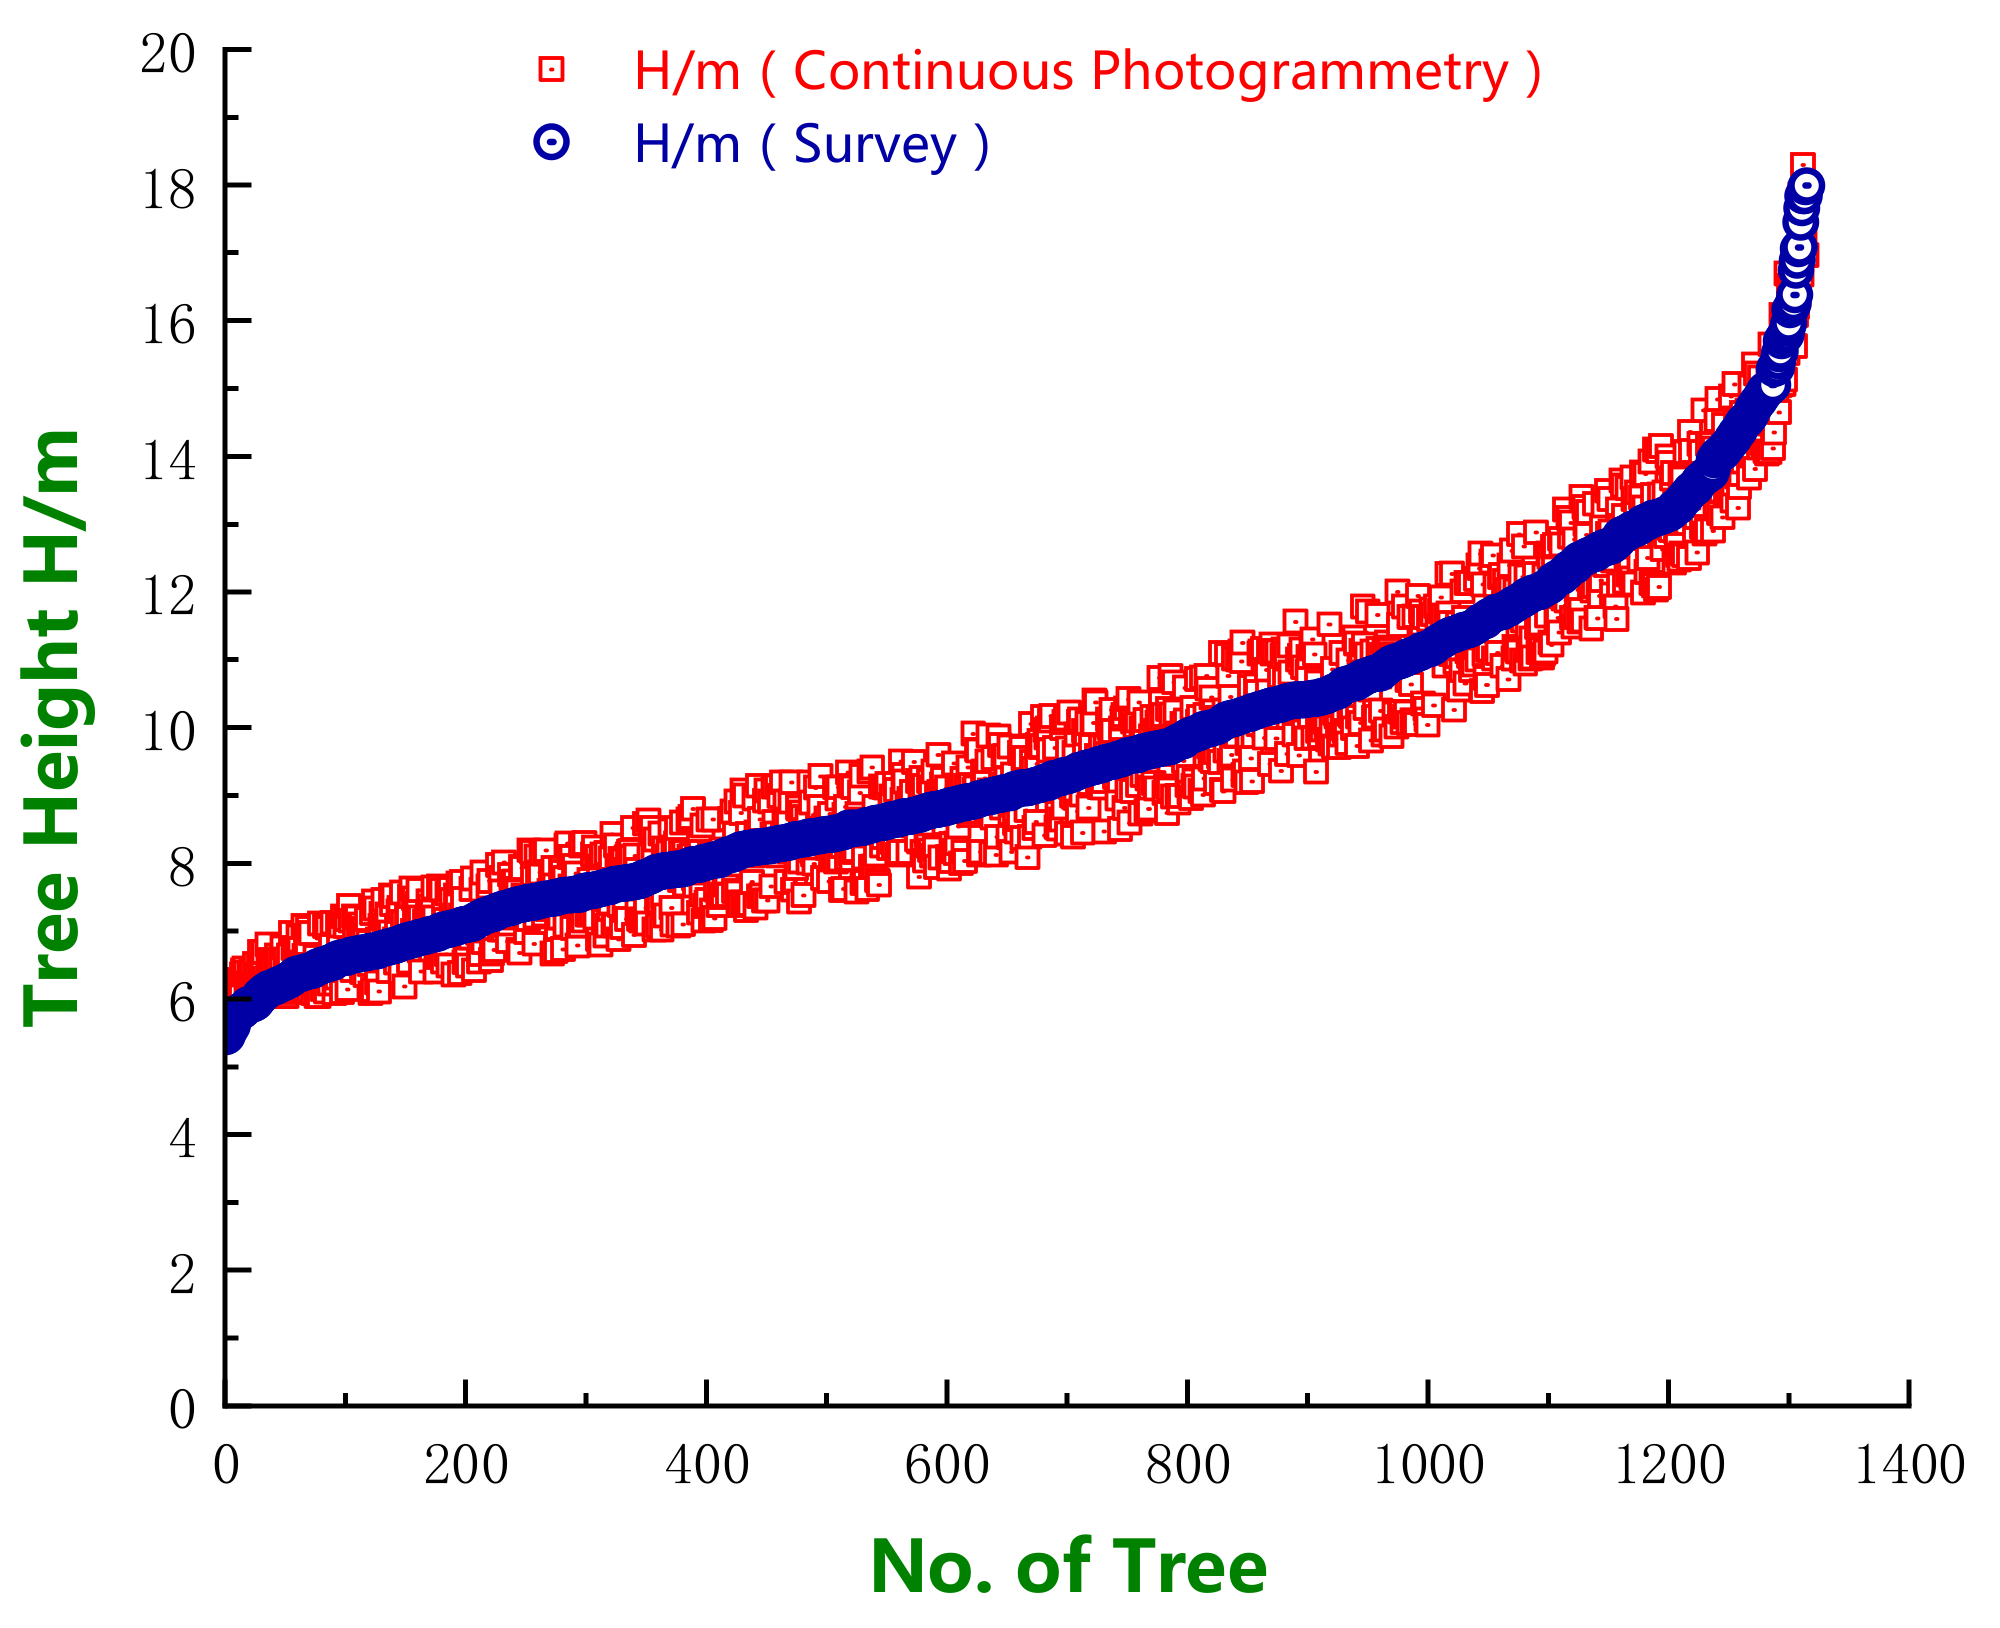
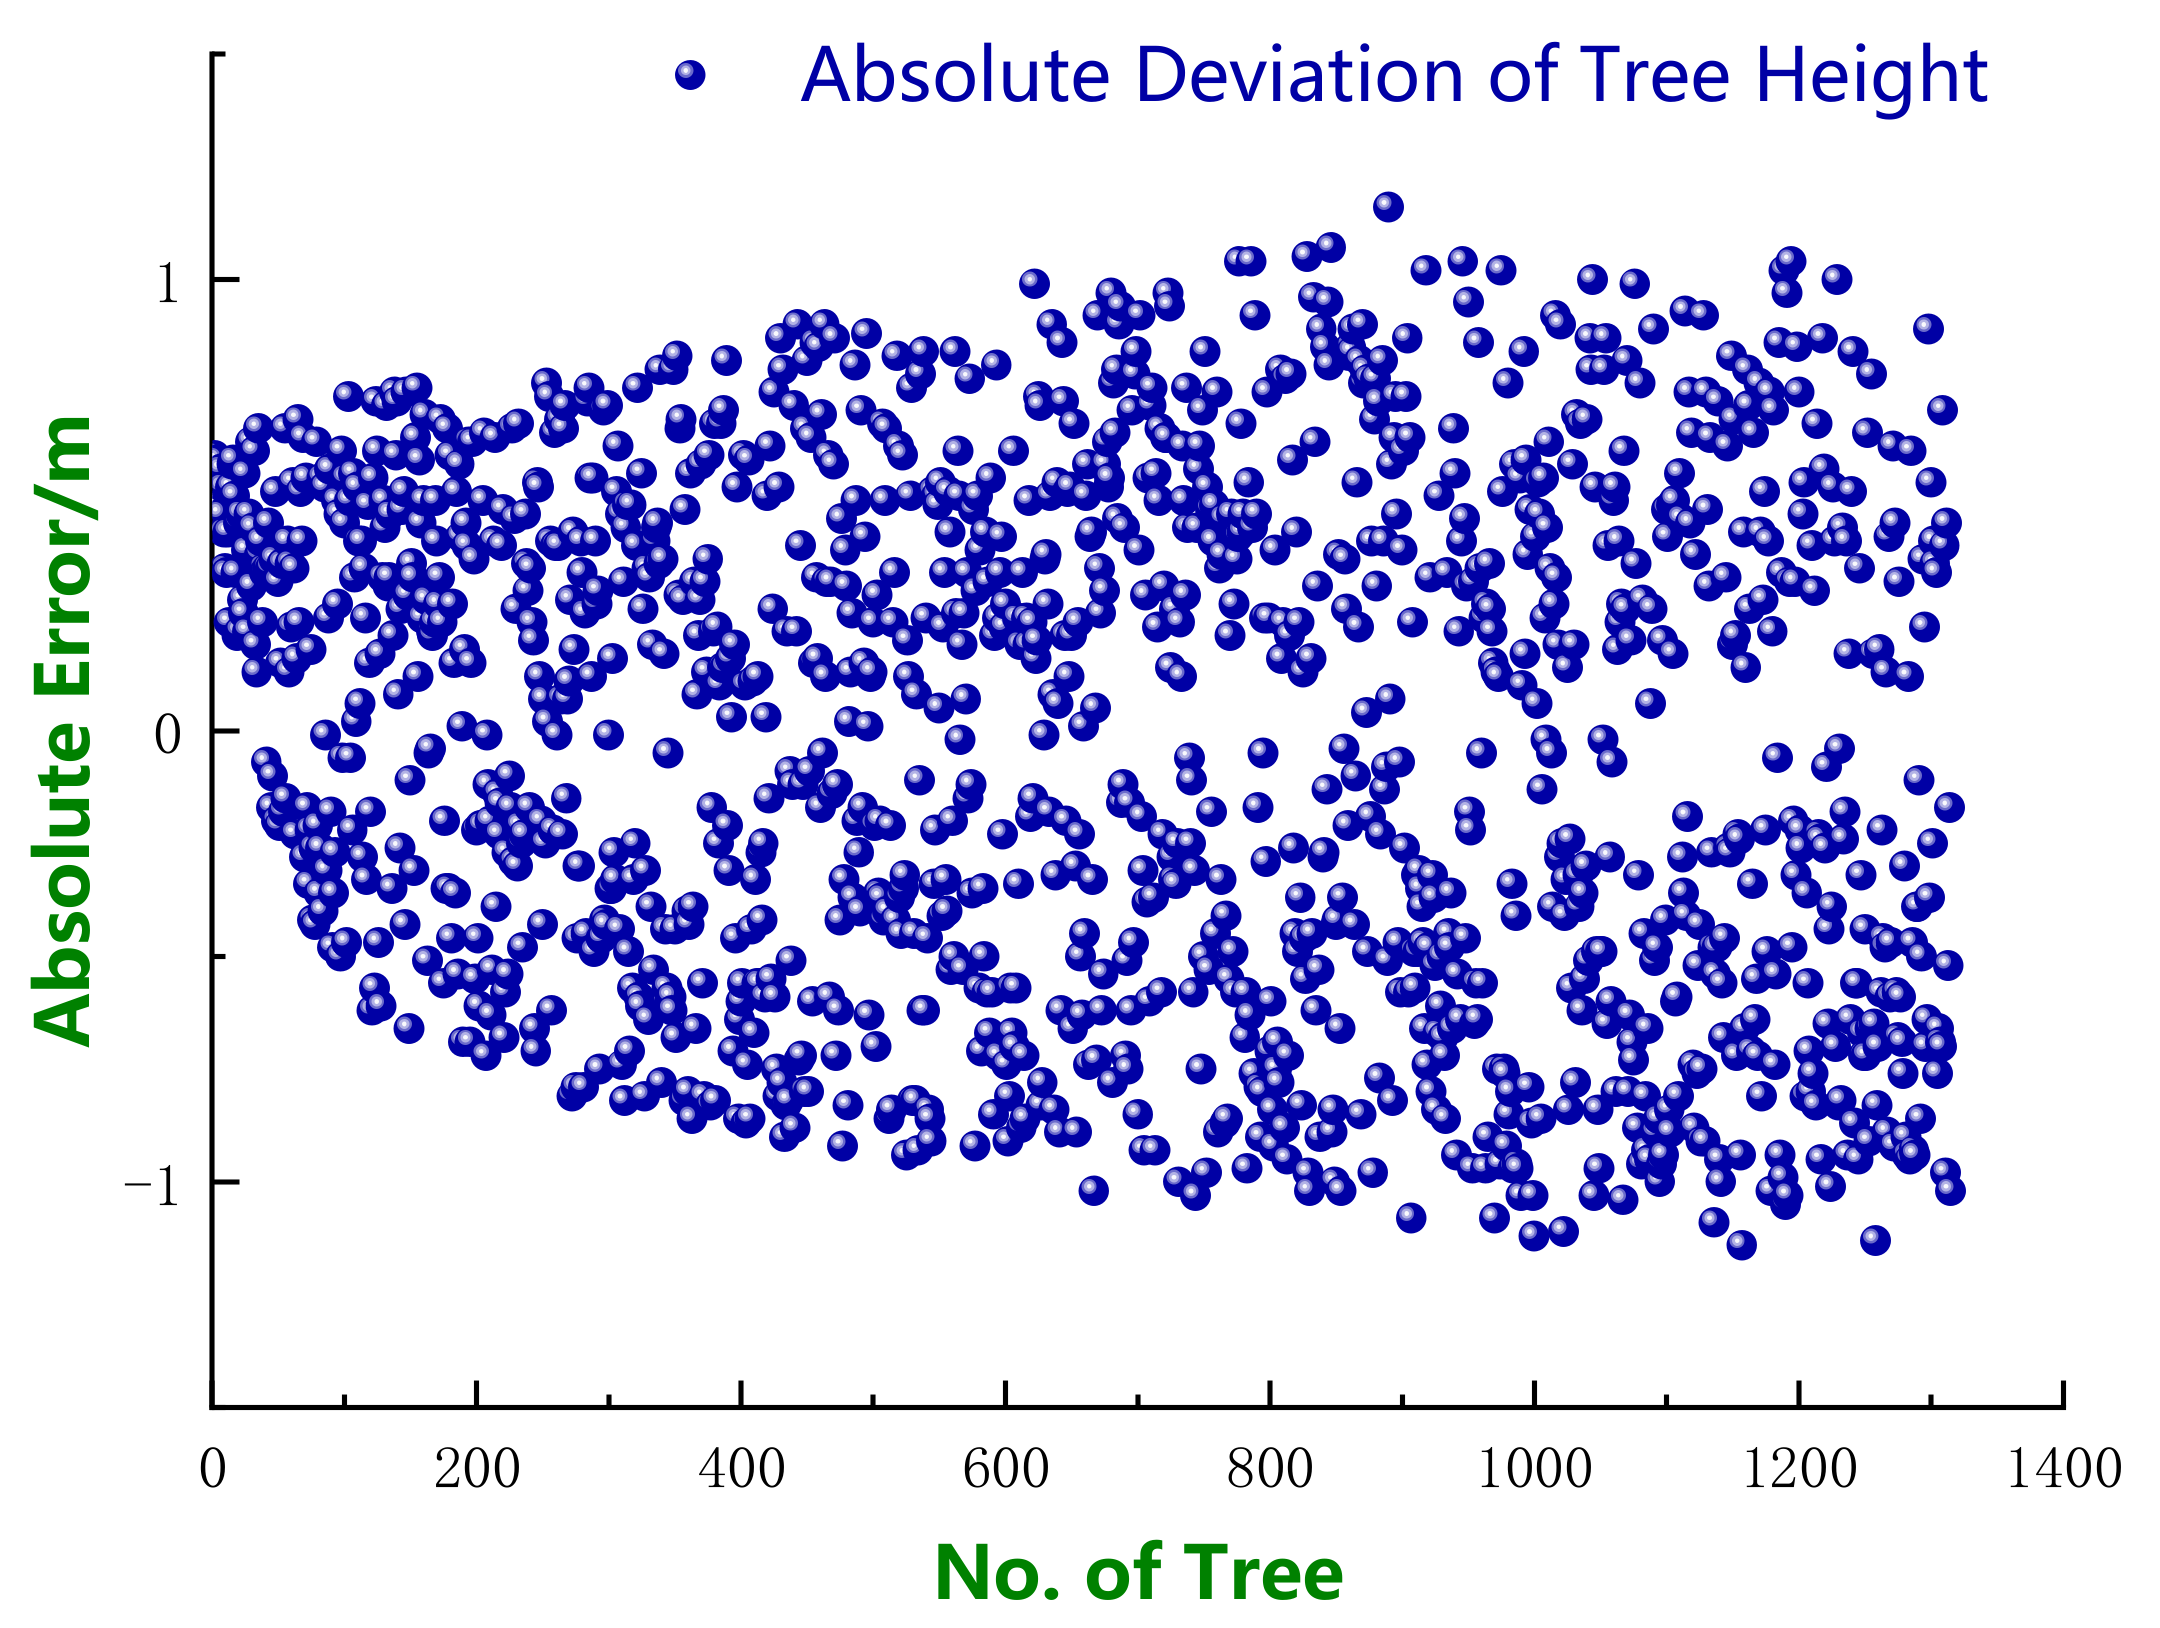
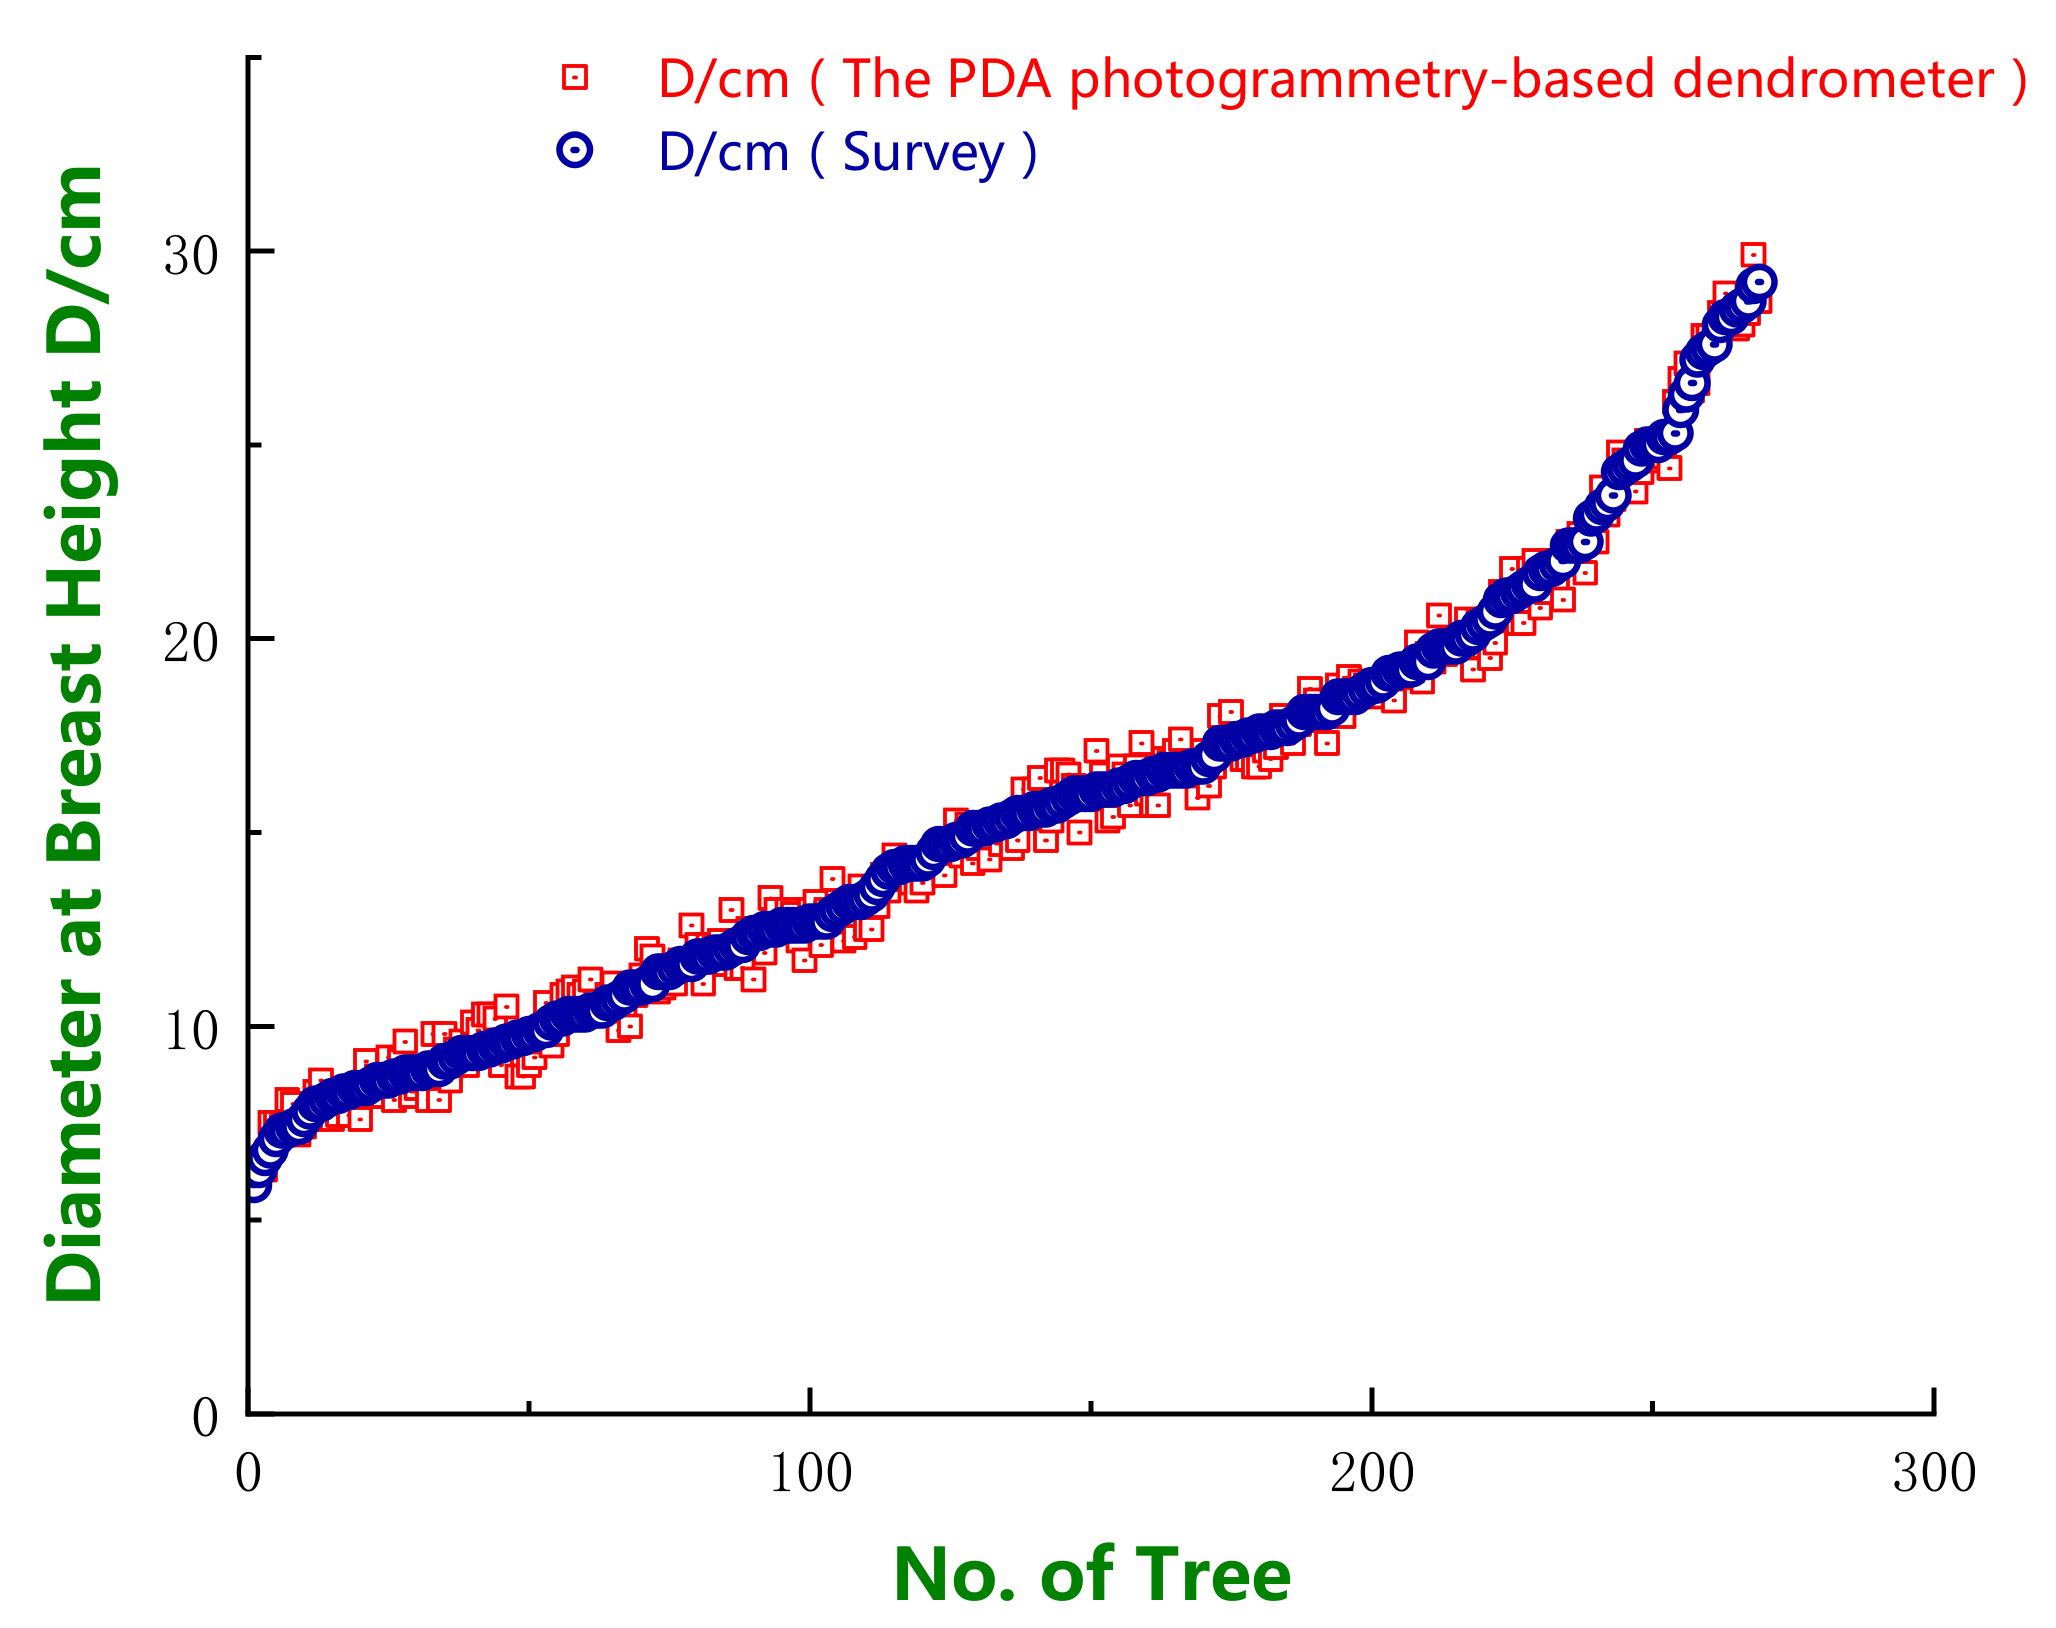
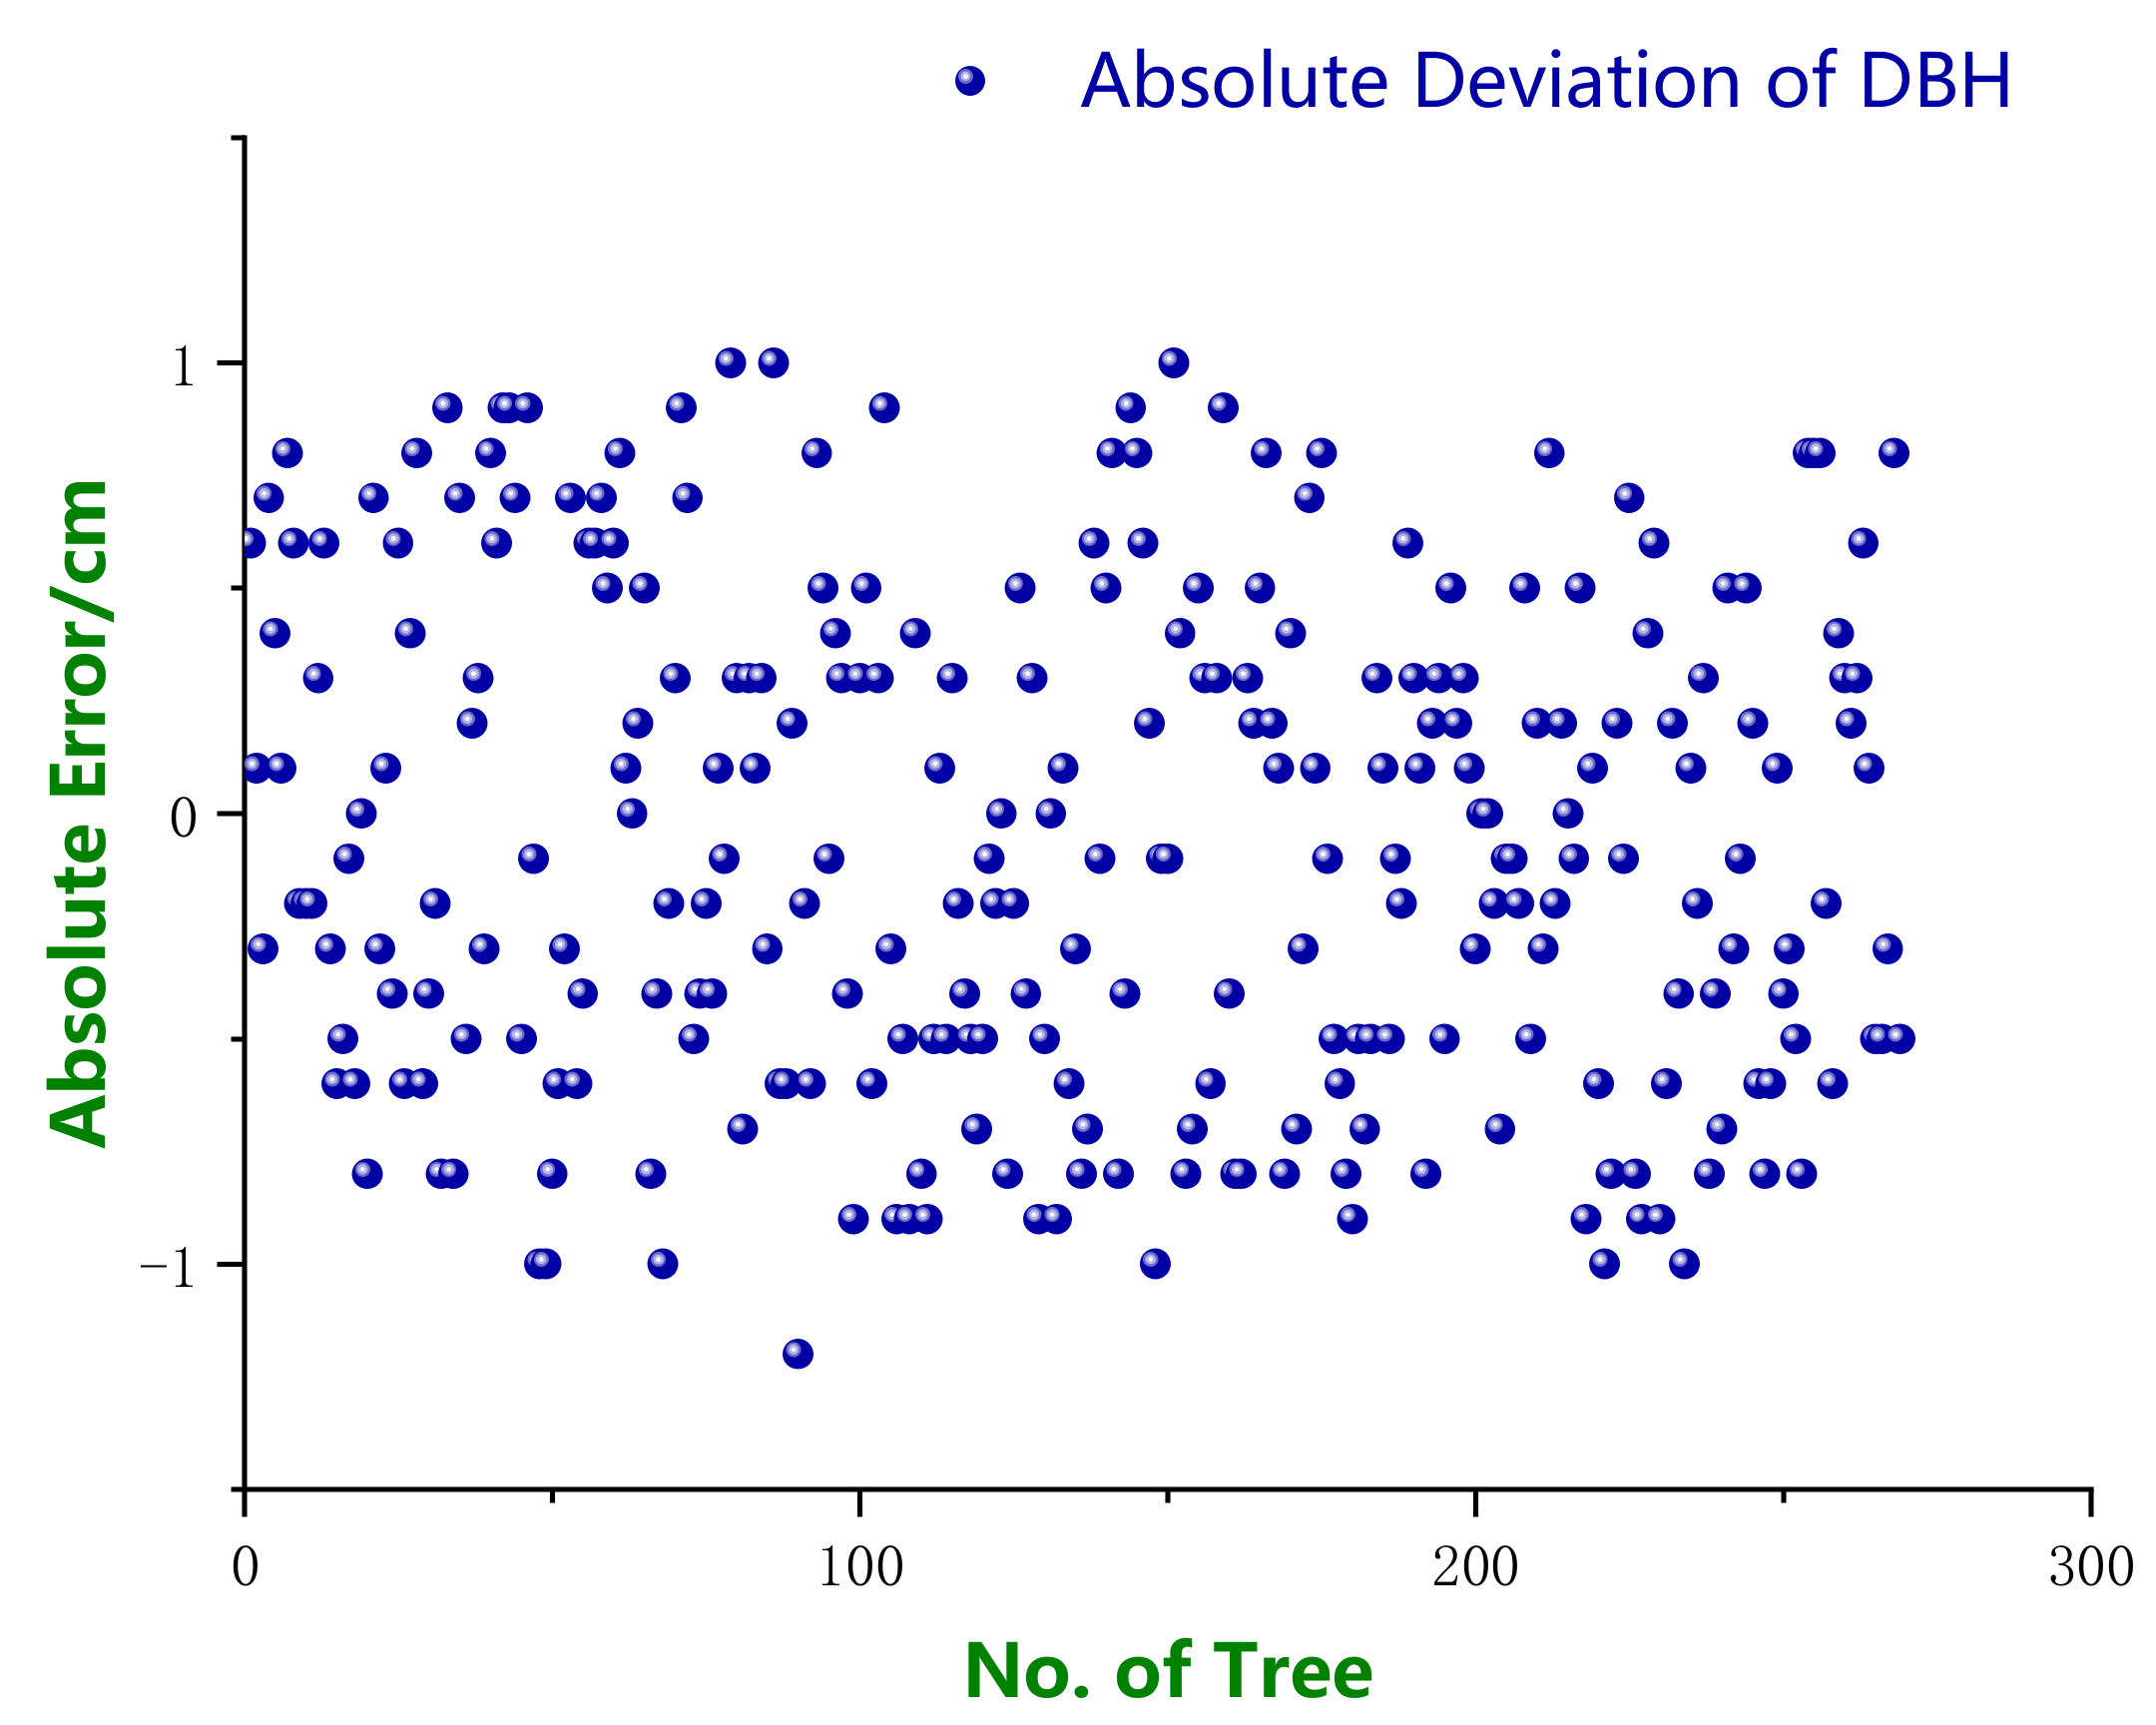
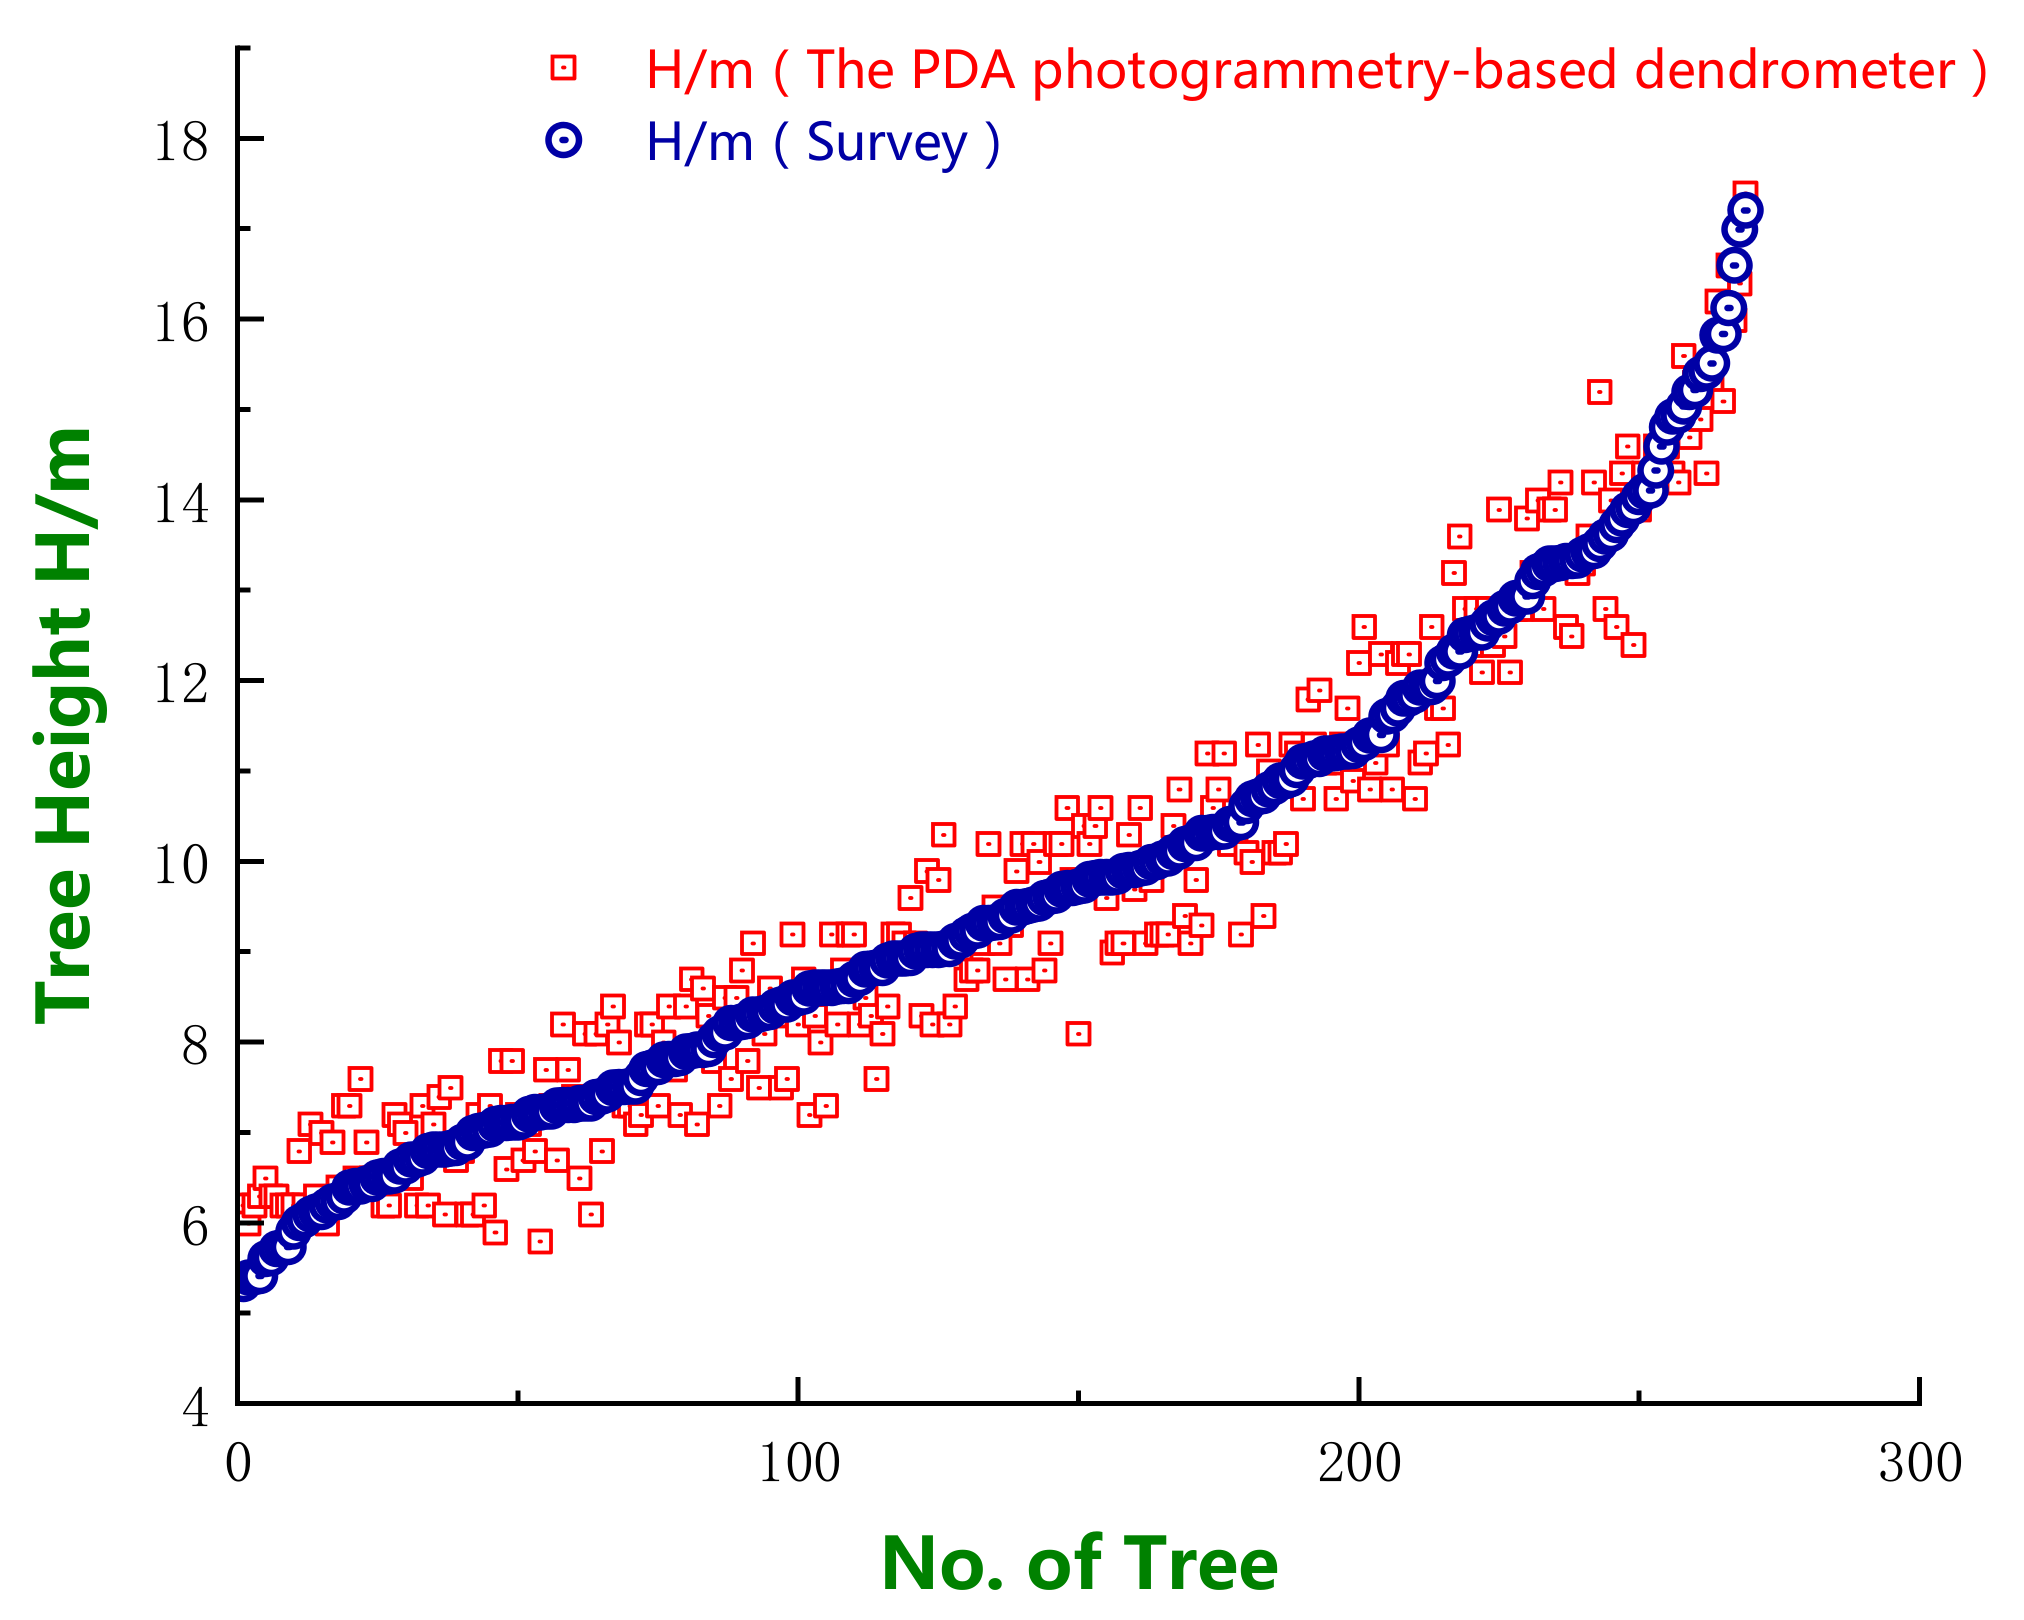
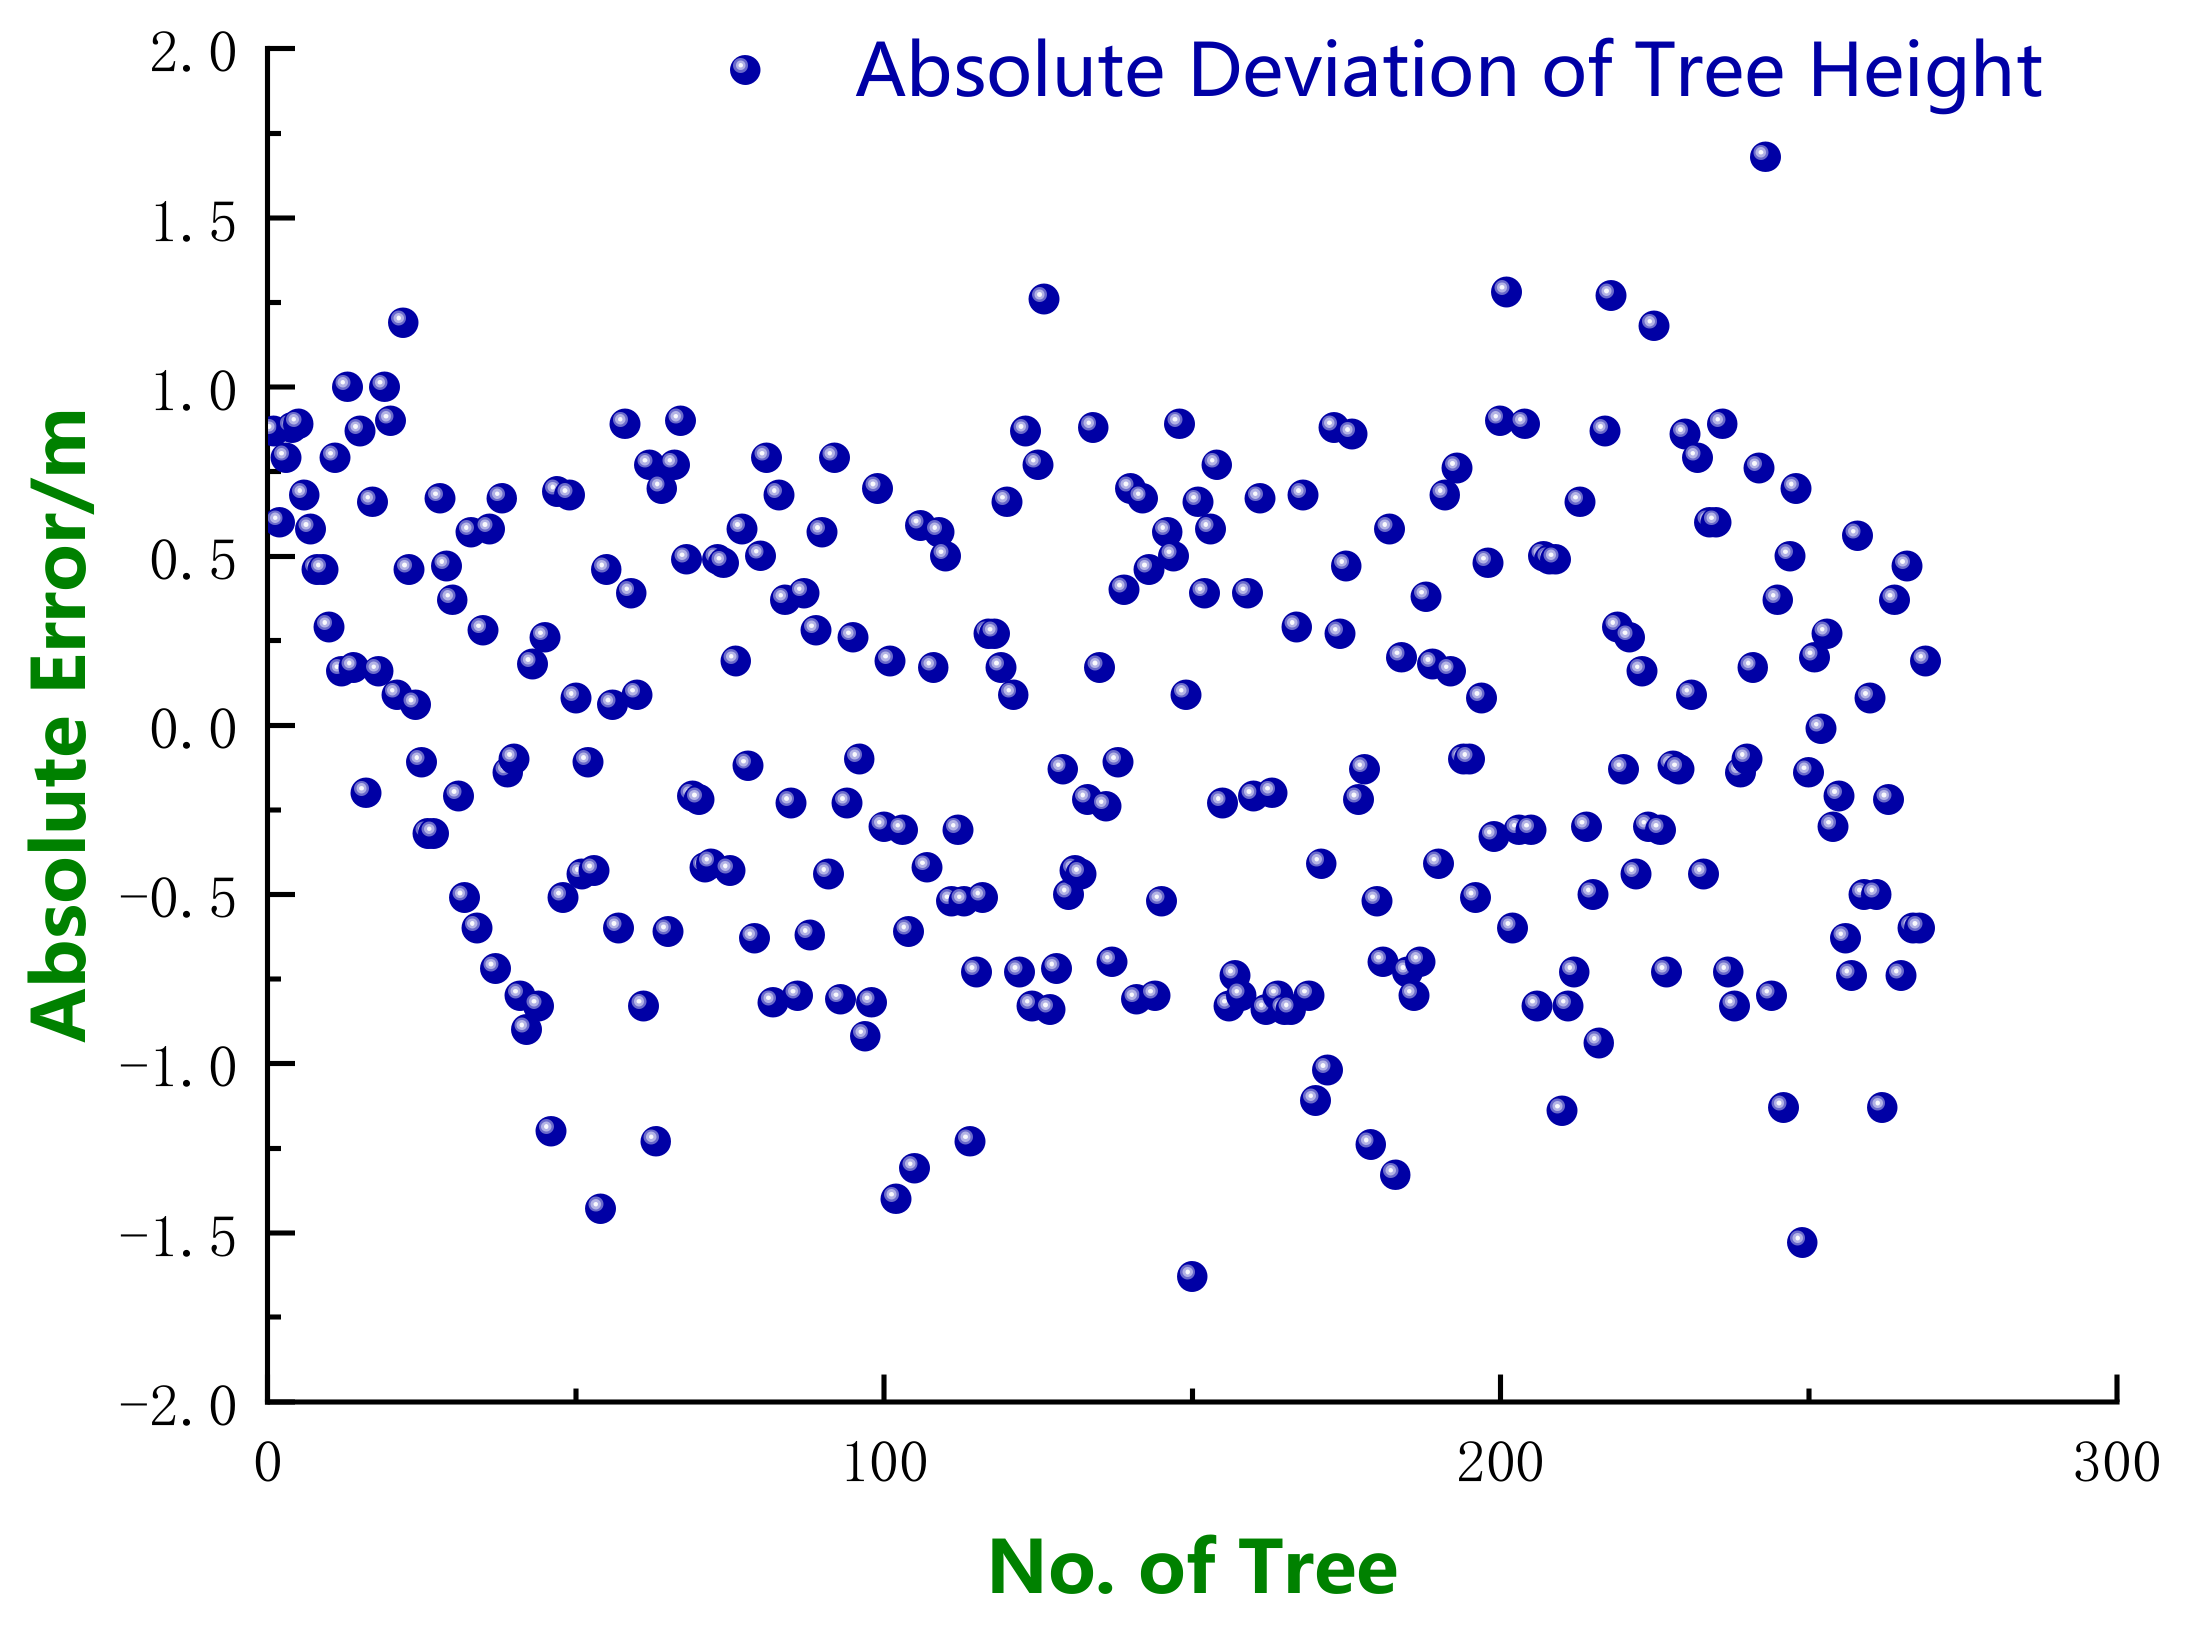
3.3. Experimental Analysis of Remote Tree Measurement

The PDA photogrammetry-based dendrometer and the DBH caliper were used to measure the DBH values of 269 trees within the 59 plots. The trees were ranked in order of their DBH. The PDA photogrammetry-based dendrometer was uniformly placed in the best observation locations, and the DBH values ranged from 5.9 cm to 29.2 cm (Figure 16). The data obtained using the DBH caliper served as reference values, which enabled obtaining the PDA photogrammetry-based dendrometer’s DBH measurement error distribution (Figure 17).
The experimental results indicated that the PDA photogrammetry-based dendrometer had a maximum error of −1.2 cm. Absolute values were adopted as the absolute errors, and a statistical analysis was performed on the number of tree measurement errors in each error range. The error was in the range of 0–0.3 cm for 104 trees, 0.3–0.6 cm for 86 trees, 0.6–0.9 cm for 69 trees, and greater than 0.9 cm for 10 trees. Therefore, the PDA photogrammetry-based dendrometer’s error was concentrated within 0.9 cm, and the error in this range accounted for 96% of the total error. In Table 4, the relative RMSE of the PDA photogrammetry-based dendrometer’s DBH measurements was 3.57%, which met the class-A error requirements for second-class forest surveys.
The analysis of the error in the PDA photogrammetry-based dendrometer’s DBH measurements is given in Appendix D. The error analysis results indicated that the primary sources of error in the PDA photogrammetry-based dendrometer’s diameter measurements included the pixel value error and distance error. As a result, the camera pixels and EDM distance measurement precision of the instrument must be improved to increase the DBH measurement precision of the PDA photogrammetry-based dendrometer.
The PDA photogrammetry-based dendrometer and the total-station instrument were used to measure the heights of 269 trees. The trees were ranked in order of their height. The measured tree heights ranged from 5.32 m to 17.20 m (Figure 18). The values measured using the total-station instrument served as reference values, and the absolute errors were obtained relative to the PDA photogrammetry-based dendrometer’s reference values, yielding an error distribution plot (Figure 19).
The experimental results indicated that the PDA photogrammetry-based dendrometer’s tree height errors were distributed on both sides of y = 0. The largest error in tree height measured by the PDA photogrammetry-based dendrometer was 1.68 m, and the errors were primarily less than 1.0 m, which accounted for 93% of the total error. In Table 5, the relative RMSE of the PDA photogrammetry-based dendrometer’s tree height measurements was 6.70%, which met the class-B error requirements for second-class forest surveys.
The analysis of the errors in the PDA photogrammetry-based dendrometer’s tree height measurements is given in Appendix E. The results of the error analysis indicated that the primary sources of error in the tree height measured by the PDA photogrammetry-based dendrometer included the distance error and inclination error. As a result, the EDM distance measurement precision and the gyroscope inclination measurement precision of the instrument must be improved to increase the tree height measurement precision of the PDA photogrammetry-based dendrometer.

4. Conclusions

To address the specific conditions in the Beijing Songshan National Nature Reserve, we designed a terrestrial continuous photogrammetric measurement system based on the principles of photogrammetry, image processing technology, and dendrometry. The system mainly resolves the following problems:
(1)
In response to the hardware problems of the existing system, such as the high cost of the measuring instruments, low measurement efficiency, inconvenience of transporting the instruments, and complicated operation, a PDA photogrammetric dendrometer system was researched and developed that is portable, easy to operate, and affordable. This instrument can obtain image, azimuth, and coordinates accurately and efficiently.
(2)
Related to the problems of poor effectiveness and low precision in the reconstruction of ground photogrammetric 3D points, an optimized adjustment algorithm for image correction and software for stand plot continuous photogrammetric measurement were developed. The software can correct, match, and optimize information such as the photograph, azimuth, and coordinates, and can import the optimized images into 3D modeling software to reconstruct 3D stand point clouds.
(3)
To address problems such as the difficulty of taking measurements under complex terrain conditions and the loss of point clouds during the 3D reconstruction process, an analytic algorithm and software for remote tree measurement were developed. The software is embedded in the PDA photogrammetric dendrometer, so it can perform remote supplementary measurements of DBH and tree height in inaccessible or missed areas.
Experimental investigation showed that the relative RMSE of trunk diameter measurements is 5.59%, and the relative RMSE of hypsometrical measurements is 3.93%, both of which are higher than the accuracy required for traditional forestry surveys. Compared with the existing system, the advantages of this new system include its low cost, lightweight equipment, easy operation, high measurement efficiency, 3D visualization, and measurement under complex terrain conditions. The scope of this research was to divide monitoring plots into smaller plots, but for large-area plot monitoring, continuous ground photogrammetry can be performed that follows an aerial photogrammetry route, and the improved adjustment algorithm for image correction in Appendix C makes the system more efficient. In conclusion, the system can meet the plot monitoring needs of the Songshan National Nature Reserve, and it can be openly used and improved by the scientific community.

Author Contributions

Z.Q. and Z.F. conceived and designed the experiments; Z.Q. and J.J. performed the experiments; Z.Q. and Y.L. analyzed the data; Z.Q. and S.X. wrote the main manuscript. All authors contributed in writing and discussing the paper.

Funding

This work was supported by the National Natural Science Foundation of China (Grant number U1710123) and Beijing Municipal Natural Science Foundation (Grant number 6161001).

Conflicts of Interest

The authors declare no conflict of interest.

Appendix A

The plot layout required the positioning of the plot edges and corner points, and RTK was used to divide each plot into smaller 20 m × 20 m plots (Figure A1). A base point was established every 20 m, and polyvinyl chloride (PVC) tubes were inserted to mark those spots (Figure A2).
Figure A1. Sample Serial Number Setting.
Remotesensing 10 01080 g0a1
Figure A2. Sample Stake Mark Setting.
Remotesensing 10 01080 g0a2
After each fixed plot was measured, the PVC tubes marking each base point were replaced with 8 cm × 8 cm × 70 cm cement pilings to facilitate long-term use. After marking 2000 small plots, some were surrounded with string. The small-scale plot surveys were completed by collecting continuous photogrammetric measurements.

Appendix B

The highly integrated PDA module primarily consisted of a central processing unit (CPU), random access memory (RAM), read-only memory (ROM), a graphics processing unit (GPU), a touch-control screen, a charge-coupled device (CCD) camera, a gravity sensor, a gyroscope, a global positioning system (GPS) chip, a Bluetooth chip, a WiFi chip, and a power source, which were housed in an aluminum alloy case. The components included: (1) a Qualcomm Snapdragon 625 CPU with a frequency of 2.0 GHz (higher-frequency quad core) and an 8-core processor, which was used to interpret commands and process data; (2) a Qualcomm Adreno 506 GPU (64 bits) used to process acquired image data; (3) RAM with an LPDDR3 storage framework design, a capacity of 4 GB, and a maximum frequency of 2133 MHz; (4) ROM consisting of C8051F410 chips with an internal flash design, a capacity of 64 GB, a maximum sustained speed of 80 m/s, and a Class 10 speed grade; (5) a CCD camera consisting of an optical camera with a fixed focal length of 4 mm, 16 MP, an light emitting diode (LED) supplementary lamp, and f/2.2 for image data acquirement; (6) a gravity sensor consisting of a LIS331DLH triaxial acceleration transducer, which was used to determine the angle of inclination between the measurement instrument and the target; (7) a gyroscope consisting of a GY-26 integrated circuit chip, which was used to determine the magnetic azimuth from the measurement instrument to the target; (8) a GPS chip used to receive GPS signals, a Bluetooth chip used to receive data acquired by the EDM module, and a WiFi chip used to transmit image data and connect to the Internet; and (9) a power source employing a TPS 61020 integrated circuit chip as the power supply to the various elements (Figure A3).
Figure A3. Hardware Structure Design of the PDA Photogrammetry-Based Dendrometer.
Remotesensing 10 01080 g0a3

Appendix C

(1) Adjustment of free networks
If the internal orientation elements ( x 0 , y 0 , f ) of the ith image are known, the initial values of the external orientation elements can be expressed as ( X i , Y i , Z i , φ i , ω i , κ i ) , and if the i + 1th image and previous image are adjacent images, the external orientation elements can be expressed as ( X i + 1 , Y i + 1 , Z i + 1 , φ i + 1 , ω i + 1 , κ i + 1 ) . The jth corresponding points of two images satisfy:
( X j Y j Z j ) = ( X i Y i Z i ) + λ j R i ( u j f v j )
( X j Y j Z j ) = ( X i + 1 Y i + 1 Z i + 1 ) + λ j R i + 1 ( u j f v j )
where ( u j , v j )   and   ( u j + 1 , v j + 1 ) are the planar coordinates of the jth corresponding image points of the ith and i + 1th images, respectively, λ j   and   λ j are the scale parameters of the ith and i + 1th images, respectively, and R i   and   R i + 1 are the rotation matrices composed of the three orientation angles of the ith and i + 1th images, respectively.
Subtracting the previous equations yields:
( 0 0 0 ) = ( X i + 1 X i Y i + 1 Y i Z i + 1 Z i ) + λ j R i + 1 ( u j f v j ) λ j R i ( u j f v j )
Substituting the external orientation elements in the previous equation as the initial values and corresponding image points gives:
( t 1 t 2 t 3 ) = ( X i + 1 0 X i 0 Y i + 1 0 Y i 0 Z i + 1 0 Z i 0 ) + λ j 0 R i + 1 0 ( u j f v j ) λ j 0 R i 0 ( u j f v j )
Simplifying into A X = B form yields:
( ( a 1 0 u j + a 2 0 f + a 3 0 v j ) a 1 0 u j + a 2 0 f + a 3 0 v j ( b 1 0 u j + b 2 0 f + b 3 0 v j ) b 1 0 u j + b 2 0 f + b 3 0 v j ( c 1 0 u j + c 2 0 f + c 3 0 v j ) c 1 0 u j + c 2 0 f + c 3 0 v j ) ( λ j 0 λ j 0 ) = ( t 1 X i + 1 0 + X i 0 t 2 Y i + 1 0 + Y i 0 t 3 Z i + 1 0 + Z i 0 )
After substituting three selected sets of corresponding points and solving, because the equation quantities are greater than the unknown overdetermined equations, the solution requires ( λ j 0 λ j 0 )   and   ( t 1 t 2 t 3 ) to be obtained using the method of least squares:
( t 1 t 2 t 3 ) = ( X i + 1 Y i + 1 Z i + 1 ) + λ j R i + 1 0 ( u j f v j ) + λ j 0 R i + 1 ( u j f v j ) λ j 0 R i + 1 0 ( u j f v j )
where R i + 1 = ( 1 φ i + 1 κ i + 1 φ i + 1 1 ω i + 1 κ i + 1 ω i + 1 1 ) , R i + 1 0 = ( 1 0 0 0 1 0 0 0 1 ) .
In the case of images taken at a single station, because the camera was only rotated and not moved, the result of ( X i + 1 X i Y i + 1 Y i Z i + 1 Z i ) was 0, and facing images taken at different stations could be used to determine the slope distance D. The data adjustment involves the following two situations:
(a) The distance D between the known stations, where there is the following constraining condition:
D 2 = Δ X 2 + Δ Y 2 + Δ Z 2
We now find the components in all directions in accordance with the rotation matrix:
( Δ X 0 Δ Y 0 Δ Z 0 ) = D R φ 0 R ω 0 R κ 0
After substituting ( Δ X 0 Δ Y 0 Δ Z 0 ) and the three corresponding points into Formula (A5) and using the least squares method to resolve the overdetermined equations, we obtain ( λ j 0 λ j 0 )   and   ( t 1 t 2 t 3 ) for the three sets of equations. Substituting the three corresponding image points into Formula (A6) and expanding yields:
( 1 0 0 0 1 0 0 0 1 λ 1 0 f 0 λ 1 0 v 1 λ 1 0 u 1 λ 1 0 v 1 0 0 λ 1 0 f λ 1 0 u 1 u 1 0 0 f 0 0 v 1 0 0 1 0 0 0 1 0 0 0 1 λ 2 0 f 0 λ 2 0 v 2 λ 2 0 u 2 λ 2 0 v 2 0 0 λ 2 0 f λ 2 0 u 2 0 u 2 0 0 f 0 0 v 2 0 1 0 0 0 1 0 0 0 1 λ 3 0 f 0 λ 3 0 v 3 λ 3 0 u 3 λ 3 0 v 3 0 0 λ 3 0 f λ 3 0 u 3 0 0 u 3 0 0 f 0 0 v 3 ) ( Δ X i , i + 1 Δ Y i , i + 1 Δ Z i , i + 1 Δ φ i + 1 Δ ω i + 1 Δ κ i + 1 Δ λ 1 Δ λ 2 Δ λ 3 ) = ( t 1 , 1 t 1 , 2 t 1 , 3 t 2 , 1 t 2 , 2 t 2 , 3 t 3 , 1 t 3 , 2 t 3 , 3 )
where ( Δ X i , i + 1 Δ Y i , i + 1 Δ Z i , i + 1 ) = ( X i + 1 X i Y i + 1 Y i Z i + 1 Z i ) .
Therefore:
( X i + 1 Y i + 1 Z i , i + 1 φ i + 1 ω i + 1 κ i + 1 ) = ( X i 0 Y i 0 Z i 0 φ i 0 ω i 0 κ i 0 ) + ( Δ X i , i + 1 Δ Y i , i + 1 Δ Z i , i + 1 Δ φ i + 1 Δ ω i + 1 Δ κ i + 1 )
(b) When adjusting adjacent images from the same station, because there is no displacement of the linear image elements, only the angle elements need to be calculated, and Formula (A5) can be rewritten as:
( ( a 1 0 u j + a 2 0 f + a 3 0 v j ) a 1 0 u j + a 2 0 f + a 3 0 v j ( b 1 0 u j + b 2 0 f + b 3 0 v j ) b 1 0 u j + b 2 0 f + b 3 0 v j ( c 1 0 u j + c 2 0 f + c 3 0 v j ) c 1 0 u j + c 2 0 f + c 3 0 v j ) ( λ j 0 λ j 0 ) = ( t 1 t 2 t 3 )
When substituting the two corresponding points and using the least squares method to resolve for ( λ j 0 λ j 0 )   and   ( t 1 t 2 t 3 ) , we again substitute the two corresponding image points into Formula (A6) and expand to obtain:
( λ 1 0 f 0 λ 1 0 u 1 λ 1 0 v 1 0 λ 1 0 f λ 1 0 v 1 u 1 0 f λ 1 0 u 1 v 1 0 0 0 λ 2 0 f 0 λ 2 0 u 2 λ 2 0 v 2 0 λ 2 0 f λ 2 0 v 2 0 0 0 λ 2 0 u 2 0 u 2 f v 2 ) ( Δ φ i + 1 Δ ω i + 1 Δ κ i + 1 Δ λ 1 Δ λ 2 ) = ( t 1 , 1 t 1 , 2 t 1 , 3 t 2 , 1 t 2 , 2 t 2 , 3 )
and then obtain:
( φ i + 1 ω i + 1 κ i + 1 ) = ( φ i 0 ω i 0 κ i 0 ) + ( Δ φ i + 1 Δ ω i + 1 Δ κ i + 1 )
(2) Adjustment of the systematic network
Assuming that the first image constitutes a reference point and that X 1 = X 1 0 , Y 1 = Y 1 0 ,   Z 1 = Z 1 0 ,   φ 1 = φ 1 0 ,   ω 1 = ω 1 0 , κ 1 = κ 1 0 , the external orientation elements of the ith (i = 1, 2, …, n) image can be expressed as:
{ X i = X 1 0 + i = 1 n Δ X i Y i = Y 1 0 + i = 1 n Δ Y i Z i = Z 1 0 + i = 1 n Δ Z i
The four control points P 1 , P 2 , P 3 , P 4 were established within the test area, and real-time kinematic (RTK) was used for positioning, which yielded the coordinates X P m , Y P m , Z P m of the mth point. The coordinates of the control point pixels in the images were determined, and the adjusted values were used to resolve the three-dimensional coordinates X P m , Y P m , Z P m . The coordinates of the control points were then substituted into the following equation:
( X P m Y P m Z P m ) = ( Δ X Δ Y Δ Z ) + λ R ( X P m Y P m Z P m )
where ( Δ X , Δ Y , Δ Z ) T is the linear deviation of the test area system, λ is the scale parameter of the test area system, and R is the rotation matrix of the image correction coefficient and geodetic coordinates.
The four control points were then substituted into the equation, and the least squares method was used to resolve for ( Δ X , Δ Y , Δ Z , λ , Δ φ , Δ ω , Δ κ ) T . Finally, the coordinate system as a whole was subjected to rotational translation, which yielded:
( X Y Z ) = ( Δ X Δ Y Δ Z ) + λ R ( X i Y i Z i )

Appendix D

The image formula employing the focal length f , the camera-to-subject distance L , and the image distance u is:
1 L 2 + 1 u = 1 f
This can be combined with Formula (2) to obtain:
D = N f L 2 f
The total differential of this equation yields:
d D = L 2 f f d N + N f d L 2
Since the pixel value N and the slope distance L 2 are mutually independent, the formula can be obtained in accordance with the error propagation law:
σ D 2 = ( L 2 f ) 2 f 2 σ N 2 + N 2 f 2 σ L 2 2
where σ D ,   σ N ,   σ L represent the errors in the diameter D , pixel value N , and distance L 2 , respectively.

Appendix E

The total differential of Formula (1) yields:
d H = ( sin α 1 cot α 2 cos α 1 ) d L 1 + ( L 1 cos α 1 cot α 2 + L 1 sin α 1 ) d α 1 L 1 sin α 1 csc 2 α 2 d α 2
Since the slope distance L 1 and the zenith distance α 1 ,   α 2 are mutually independent, the formula can be obtained in accordance with the error propagation law:
σ H 2 = ( sin α 1 cot α 2 cos α 1 ) 2 σ L 1 2 + ( L 1 cos α 1 cot α 2 + L 1 sin α 1 ) 2 ( σ α 1 ρ ) 2 + ( L 1 sin α 1 csc 2 α 2 ) 2 ( σ α 2 ρ ) 2
where σ H ,   σ L 1 ,   σ α 1 ,   σ α 2 represent the errors in the tree height H , slope distance L 1 , and zenith distance α 1   and   α 2 , respectively, and ρ is the conversion coefficient between radians and degrees, where ρ = ( 180 π ) ° × 60 × 60 = 206,264.80624 , which was taken as 206,265 .

References

  1. McRoberts, R.E.; Tomppo, E.O.; Schadauer, K.; Ståhl, G. Harmonizing national forest inventories. For. Sci. 2012, 58, 189–190. [Google Scholar] [CrossRef]
  2. Božić, M.; Čavlović, J.; Lukić, N.; Teslak, K.; Kos, D. Efficiency of ultrasonic vertex iii hypsometer compared to the most commonly used hypsometers in croatian forestry. Croat. J. For. Eng. 2005, 26, 91–99. [Google Scholar]
  3. Avery, T.E.; Burkhart, H.E. Forest Measurements; Waveland Press: Long Grove, IL, USA, 2015. [Google Scholar]
  4. Rivas, J.C.; Gonzalez, J.A.; Aguirre, O.; Hernández, F. The effect of competition on individual tree basal area growth in mature stands of pinus cooperi blanco in Durango (Mexico). Eur. J. For. Res. 2005, 124, 133–142. [Google Scholar] [CrossRef]
  5. Feng, Z.; Yan, F.; Ullah, M.R.; Dang, Y. Developing a volume model using south nts-372r total station without tree felling in a populus canadensis moench plantation in Beijing, China. Croat. J. For. Eng. 2017, 38, 141–150. [Google Scholar]
  6. Yan, F.; Ullah, M.R.; Gong, Y.; Feng, Z.; Chowdury, Y.; Wu, L. Use of a no prism total station for field measurements in pinus tabulaeformis carr. Stands in china. Biosyst. Eng. 2012, 113, 259–265. [Google Scholar] [CrossRef]
  7. Stas, S.M.; Rutishauser, E.; Chave, J.; Anten, N.P.; Laumonier, Y. Estimating the aboveground biomass in an old secondary forest on limestone in the moluccas, indonesia: Comparing locally developed versus existing allometric models. For. Ecol. Manag. 2017, 389, 27–34. [Google Scholar] [CrossRef]
  8. Shen, H.; Zhang, K.; Nejati, A. A noncontact positioning measuring system based on distributed wireless networks. Peer-to-Peer Netw. Appl. 2017, 10, 823–832. [Google Scholar] [CrossRef]
  9. Yu, L.; Zhou, K. A dynamic local path planning method for outdoor robot based on characteristics extraction of laser rangefinder and extended support vector machine. Int. J. Pattern Recognit. Artif. Intell. 2016, 30, 1659004. [Google Scholar] [CrossRef]
  10. Newnham, G.J.; Armston, J.D.; Calders, K.; Disney, M.I.; Lovell, J.L.; Schaaf, C.B.; Strahler, A.H.; Danson, F.M. Terrestrial laser scanning for plot-scale forest measurement. Curr. For. Rep. 2015, 1, 239–251. [Google Scholar] [CrossRef]
  11. Zhong, C.; Yicheng, G.; Zhongke, F. Error analysis on standing tree volume measurement by using electronic theodolites. Trans. Chin. Soc. Agric. Mach. 2015, 46, 292–298. [Google Scholar]
  12. Xiang, G.; Zhongke, F.; Zhichao, W. Study on stem form index based on non-destructive precision measurement through electronic theodolite. Trans. Chin. Soc. Agric. Mach. 2015, 46, 299–305. [Google Scholar]
  13. He, C.; Hong, X.; Liu, K.; Zhang, S.; Wang, Q. An improved technique for non-destructive measurement of the stem volume of standing wood. South. For. J. For. Sci. 2016, 78, 53–60. [Google Scholar] [CrossRef]
  14. Xu, W.; Su, Z.; Feng, Z.; Xu, H.; Jiao, Y.; Yan, F. Comparison of conventional measurement and lidar-based measurement for crown structures. Comput. Electron. Agric. 2013, 98, 242–251. [Google Scholar] [CrossRef]
  15. Huang, X.; Feng, Z.; Xie, M.; Chen, J.; Liu, J. Developing and accuracy analysis of portable device for automatically measuring diameter at breast height and tree height. Trans. Chin. Soc. Agric. Eng. 2015, 31, 92–99. [Google Scholar]
  16. Xu, W.; Feng, Z.; Su, Z.; Xu, H.; Jiao, Y.; Fan, J. Development and experiment of handheld digitalized and multi-functional forest measurement gun. Trans. Chin. Soc. Agric. Eng. 2013, 29, 90–99. [Google Scholar]
  17. Zhongmou, F.; Zhongke, F.; Jun, Z. An establishment of tree crown volume calculation and prediction model using cubic lattice method. Trans. Chin. Soc. Agric. Mach. 2015, 3, 320–327. [Google Scholar]
  18. Maltamo, M.; Bollandsås, O.; Gobakken, T.; Næsset, E. Large-scale prediction of aboveground biomass in heterogeneous mountain forests by means of airborne laser scanning. Can. J. For. Res. 2016, 46, 1138–1144. [Google Scholar] [CrossRef]
  19. Ene, L.T.; Næsset, E.; Gobakken, T.; Mauya, E.W.; Bollandsås, O.M.; Gregoire, T.G.; Ståhl, G.; Zahabu, E. Large-scale estimation of aboveground biomass in miombo woodlands using airborne laser scanning and national forest inventory data. Remote Sens. Environ. 2016, 186, 626–636. [Google Scholar] [CrossRef]
  20. Andersen, H.-E.; Reutebuch, S.E.; McGaughey, R.J. A rigorous assessment of tree height measurements obtained using airborne lidar and conventional field methods. Can. J. Remote Sens. 2006, 32, 355–366. [Google Scholar] [CrossRef]
  21. Dechesne, C.; Mallet, C.; Le Bris, A.; Gouet-Brunet, V. Semantic segmentation of forest stands of pure species combining airborne lidar data and very high resolution multispectral imagery. ISPRS J. Photogramm. Remote Sens. 2017, 126, 129–145. [Google Scholar] [CrossRef]
  22. Goldbergs, G.; Levick, S.R.; Lawes, M.; Edwards, A. Hierarchical integration of individual tree and area-based approaches for savanna biomass uncertainty estimation from airborne lidar. Remote Sens. Environ. 2018, 205, 141–150. [Google Scholar] [CrossRef]
  23. Huang, L.; Chen, C.; Shen, H.; He, B. Adaptive registration algorithm of color images based on surf. Measurement 2015, 66, 118–124. [Google Scholar] [CrossRef]
  24. Kang, T.-K.; Choi, I.-H.; Lim, M.-T. Mdghm-surf: A robust local image descriptor based on modified discrete gaussian–hermite moment. Pattern Recognit. 2015, 48, 670–684. [Google Scholar] [CrossRef]
  25. Lee, Y.-H.; Kim, Y. Efficient image retrieval using advanced surf and dcd on mobile platform. Multimed. Tools Appl. 2015, 74, 2289–2299. [Google Scholar] [CrossRef]
  26. Wu, M.; Li, X.; Liu, C.; Liu, M.; Zhao, N.; Wang, J.; Wan, X.; Rao, Z.; Zhu, L. Robust global motion estimation for video security based on improved k-means clustering. J. Ambient Intell. Humaniz. Comput. 2017, 3, 1–10. [Google Scholar] [CrossRef]
  27. Valgren, C.; Lilienthal, A.J. Sift, surf & seasons: Appearance-based long-term localization in outdoor environments. Robot. Auton. Syst. 2010, 58, 149–156. [Google Scholar]
  28. Liang, X.; Wang, Y.; Jaakkola, A.; Kukko, A.; Kaartinen, H.; Hyyppä, J.; Honkavaara, E.; Liu, J. Forest data collection using terrestrial image-based point clouds from a handheld camera compared to terrestrial and personal laser scanning. IEEE Trans. Geosci. Remote Sens. 2015, 53, 5117–5132. [Google Scholar] [CrossRef]
  29. Morgenroth, J.; Gómez, C. Assessment of tree structure using a 3d image analysis technique—A proof of concept. Urban For. Urban Green. 2014, 13, 198–203. [Google Scholar] [CrossRef]
  30. Lin, W.; Meng, Y.; Qiu, Z.; Zhang, S.; Wu, J. Measurement and calculation of crown projection area and crown volume of individual trees based on 3d laser-scanned point-cloud data. Int. J. Remote Sens. 2017, 38, 1083–1100. [Google Scholar] [CrossRef]
  31. Yu, D.; Feng, Z.; Cao, Z.; Jiang, J. Error analysis of measuring diameter at breast height and tree height and volume of standing tree by total station. Trans. Chin. Soc. Agric. Eng. 2016, 32, 160–167. [Google Scholar]
  32. Liang, X.; Hyyppä, J.; Kukko, A.; Kaartinen, H.; Jaakkola, A.; Yu, X. The use of a mobile laser scanning system for mapping large forest plots. IEEE Geosci. Remote Sens. Lett. 2014, 11, 1504–1508. [Google Scholar] [CrossRef]
Figure 1. Layout of Research Area and Sample Plot.
Remotesensing 10 01080 g001
Figure 2. The Measurement Method for the Personal Digital Assistant (PDA) Photogrammetry-Based Dendrometer in the Stand Sample Plot.
Remotesensing 10 01080 g002
Figure 3. Continuous Photogrammetry of Stand Plot. (a) Single-station polar coordinate photography; (b) loop construction photogrammetry baseline photography method.
Remotesensing 10 01080 g003
Figure 4. Specific Software Processes.
Remotesensing 10 01080 g004
Figure 5. Software Interface of Standing Forest Plot Sample Photogrammetry.
Remotesensing 10 01080 g005aRemotesensing 10 01080 g005b
Figure 6. Three-Dimensional (3D) Modeling Software Reconstruction of 3D Point Cloud in Stand Sample Plot.
Remotesensing 10 01080 g006
Figure 7. Measurement Function of 3D Modeling Software.
Remotesensing 10 01080 g007
Figure 8. The Tree Height Measurement Method. A represents the test station, B represents the root of the tree, C represents the treetops, L 1 indicates the slant-range (m) from the test station to the root of the tree, H indicates the tree height (m), and α 1 and α 2 indicates the zenith distances to aim at the roots and treetops of the tree; the dip angles α 1 and α 2 are between 0 and ~180 degrees.
Remotesensing 10 01080 g008
Figure 9. Method of Measuring Diameter at Breast Height (DBH). f represents the calibration (dpi) of a charge-coupled device (CCD) fixed focus lens, L 2 indicates the slant range between the measured site and DBH, N indicates the pixel value of the chest diameter (dpi) in the image, and D represents the DBH (cm).
Remotesensing 10 01080 g009
Figure 10. The Main Program and Two Functional Modules.
Remotesensing 10 01080 g010aRemotesensing 10 01080 g010b
Figure 11. Software Program Interface.
Remotesensing 10 01080 g011aRemotesensing 10 01080 g011b
Figure 12. Measurement Distribution of DBH and Reference Values with Continuous Photogrammetry in Standing Forest Sample Plots.
Remotesensing 10 01080 g012
Figure 13. Absolute Error Distribution of DBH and Reference Values with Continuous Photogrammetry in Standing Forest Sample Plots.
Remotesensing 10 01080 g013
Figure 14. Measurement Distribution of Tree Height and Reference Values with Continuous Photogrammetry in Standing Forest Sample Plots.
Remotesensing 10 01080 g014
Figure 15. Absolute Error Distribution of Tree Height and Reference Values with Continuous Photogrammetry in Standing Forest Sample Plots.
Remotesensing 10 01080 g015
Figure 16. Measurement Distribution of DBH and Reference Values for the PDA Photogrammetry-Based Dendrometer.
Remotesensing 10 01080 g016
Figure 17. Absolute Error Distribution of DBH Measurements for the PDA Photogrammetry-Based Dendrometer.
Remotesensing 10 01080 g017
Figure 18. Measurement Distribution of Tree Height and Reference Values for the PDA Photogrammetry-Based Dendrometer.
Remotesensing 10 01080 g018
Figure 19. Absolute Error Distribution of Tree Height Measurements for the PDA Photogrammetry-Based Dendrometer.
Remotesensing 10 01080 g019
Table 1. Permissible Error Rating Table of Main Investigation Factors in Forest Inventory.
Investigation FactorA-Level ErrorB-Level ErrorC-Level Error
Sub-compartment area555
Tree species composition51020
Tree height51015
DBH51015
Age101520
Canopy density51015
Sectional area per hectare51015
Volume per hectare152025
Number of tree per hectare51015
Table 2. Accuracies of the DBH estimation using the stand plot continuous photogrammetric measurements.
BiasBias%RMSERSME%
DBH (cm)0.35310.87842.39425.9563
Table 3. Accuracies of Tree Height Estimation Using the Stand Plot Continuous Photogrammetric Measurements. RMSE: root mean square error.
BiasBias%RMSERSME%
Tree Height (m)−0.01900.5704−0.19885.9634
Table 4. Accuracies of the DBH Estimation Using the PDA Photogrammetry-Based Dendrometer.
BiasBias%RMSERSME%
DBH (cm)−0.06360.5545−0.40973.5736
Table 5. Accuracies of Tree Height Estimation Using the PDA Photogrammetry-Based Dendrometer.
BiasBias%RMSERSME%
Tree Height (m)−0.01390.6507−0.14356.6971

