Investigation of TLS Intensity Data and Distance Measurement Errors from Target Specular Reflections

1
State Key Laboratory of Estuarine and Coastal Research, East China Normal University, NO. 3663, North Zhongshan Road, Shanghai 200062, China
2
College of Surveying and Geo-Informatics, Tongji University, NO. 1239, Siping Road, Shanghai 200092, China
*
Author to whom correspondence should be addressed.
Remote Sens. 2018, 10(7), 1077; https://doi.org/10.3390/rs10071077
Submission received: 17 May 2018
/
Revised: 12 June 2018
/
Accepted: 5 July 2018
/
Published: 6 July 2018
Abstract
:Terrestrial laser scanners (TLSs) can provide accurate and high-resolution data by measuring the distances (ranges) between the scanned points and the scanner center using time-of-flight or phase-shift-based methods. Distance measurement accuracy is of vital importance in TLSs and mainly influenced by instrument mechanism, atmospheric conditions, scanning geometry, and target surface properties. In general, existing commercial TLSs can achieve millimeter precision. However, significant errors (centimeter and even decimeter levels) beyond the instruments’ nominal accuracy exist in distance observations for targets with highly reflective surfaces whose specular reflections are dominant because these reflections can increase the backscattered laser signal power considerably and cause further disorder in the echo detection and recognition by TLS photodetectors. Apart from distance, the intensity value derived from the backscattered signal and influenced by the same factors as that of the distance measurement errors is recorded by TLSs. A certain link exists between the two instrumental observations. In this study, the anomalous distance measurement errors caused by target specular reflections are explored. The different planar reflective targets scanned by a Faro Focus3D 120 terrestrial scanner are used to experimentally investigate the relationship between the original intensity values and the distance measurement errors. Results imply that the distance measurement errors caused by specular reflections are not as erratic as they ostensibly seem. On the contrary, distance measurement errors are strongly related to the original intensity values. A polynomial can be established to empirically model the relationship between the original intensity data and the distance measurement errors. With use of the original intensity to compensate for the measured distance observations, the point cloud data accuracy can be improved by approximately 55.52%.
1. Introduction
Terrestrial laser scanning (TLS) is an outstanding technology for spatial and geographical data acquisition and has been widely used in various fields. The advantage of TLS over other surveying techniques is that it can provide accurate and dense sets of 3D coordinates of scanned objects in a fast and noninvasive manner by firing monochromatic beams of light to obtain the distances (ranges) between the scanned points and the scanner center. The achievable distance precision is highly important in deciding whether TLS is suitable for a task or not [1]. Achievable distance precision determines the accuracy and reliability of the point cloud and the performance of the instrument. Consequently, distance measurement unit is a core component of TLSs. The investigation of distance measurement error sources and solutions is of vital importance to the improvement of TLS data accuracy and quality and has attracted widespread attention from manufacturers, users, and researchers in the past two decades [2,3,4,5,6,7,8,9].
Theoretically, the distance measurement accuracy of TLS is influenced by instrument mechanism, atmospheric conditions, scanning geometry (i.e., distance and incidence angle), and target surface properties [2]. Only the acquisition configuration and the target surface properties must be considered for the compensation of distance measurement errors because the atmospheric conditions near the surface of the Earth are relatively stable and the instrument mechanism is usually unchanged during one campaign. The effects of distance and incidence angle on distance measurement accuracy have been extensively studied, whereas research about distance measurement errors caused by target properties is relatively rare. The reflectorless nature of TLS rangefinders increases the possibility of distance measurement errors due to the pulse attenuation by the reflecting surfaces [1,6]. The distance errors caused by the properties of rough and dull surfaces usually measure a few millimeters. However, these errors can significantly increase to centimeter and even decimeter levels [8,10] for smooth surfaces because diffuse and specular reflections exist in all-natural surfaces and the type of reflection affects the direction and strength of backscattered light. For targets with a relatively smooth or glossy surface (e.g., water [11,12,13], fresh ice [14,15,16], foliage/leaves [17,18], metal [19], porcelain, and plastic [20,21]), specular reflections are dominant over diffuse reflections. For a generally smooth surface of multiple facets with different orientations, specular reflections are distributed in the surroundings of the reflection angle direction [22]. The target specular reflections can significantly change the amplitude, width, or shape of the backscattered signal, especially in the case of small incidence angles that are close to zero due to the coincidence of the emitter and receiver [19,23]. A deformed signal influences the scanner system’s determination of the arrival time of the backscattered echo or the phase comparison between the emitted and received signals. Thus, target specular reflections can lead to errors in distance observations and even in the saturation effect [10,19,20,21,23,24] of photodetectors due to the extremely high amplitude of returned pulses.
As stated above, distance measurement errors for a certain TLS are influenced by the target surface properties, range, and incidence angle. A direct solution is to consider these factors individually. While this is feasible for the distance, the surface properties for individual points are usually unknown [1]. The incidence angles for single points can be computed using neighborhood points, but they are vulnerable to local point density and noise [1]. Therefore, considering distance, incidence angle, and target surface properties separately is not practical for modeling distance errors because most of them are unavailable or unreliable.
In addition to discrete topography measurements, nearly all current TLS instruments simultaneously measure the power of the backscattered laser signal of each point and record it as an intensity value [25,26,27]. Backscattered optical power is internally converted to voltage, amplified in the system, and finally transformed into a digital number, i.e., a scaled integer value called “intensity” [28]. Intensity, which is insensitive to ambient light and shadowing, is initially used to improve point cloud separability [29,30]. Apart from visualization purposes, various object-based studies can adopt intensity data as a major or complementary data source [31,32,33,34,35]. Intensity and distance are two types of data in TLS, one for physical and the other for geometry. No connection seems to exist between these data. However, the intensity detected by a TLS system is also mainly affected by target scattering characteristics, range, and incidence angle [36,37,38,39,40], which are nearly the same as those of the distance measurement errors [1]. Additionally, when the backscattered signal reaches the TLS, the receiver distance measurement unit calculates the distance based on the features of the backscattered signal. Synchronously, the TLS system obtains the intensity value according to the amplitude of the backscattered signal. Therefore, both distance and intensity are derived from the features of the backscattered signal. Thus, a certain link exists between the intensity value and the distance error, and this connection is the theoretical basis for this study. Instead of investigating the influencing factors individually, the intensity value can be solely used to interpret the anomalous distance measurement phenomena caused by target specular reflections and establish a distance error correction model.
The anomalies in distance measurements of retro-reflective targets were first investigated in Pesci et al. [10]. However, only some qualitative/semi-quantitative results and conclusions were obtained. Wujanz et al. [1] first attempted to experimentally establish a TLS intensity-based stochastic distance model for the diffuse reflections of scanned targets. A strong relationship between intensity and distance errors, albeit measuring several millimeters only, was reported in Wujanz et al [1]. On the contrary, this study specifically aims to investigate the relationship between intensity and distance errors caused by target specular reflection characteristics. The major contribution and innovation of this study are (i) a new method for determining the distance measurement errors caused by specular reflections directly from the original point cloud data and (ii) an intensity-based model for correcting the distance measurement errors from target specular reflections. The rest of this paper is organized as follows. The principles and methodology for correcting distance errors using intensity data are reviewed in Section 2. Section 3 outlines the materials and experiments. Section 4 presents the results and validation of the proposed method, and the discussions and conclusions are presented in Section 5 and Section 6, respectively.
2. Principles and Methodology
2.1. Principles of Phase-Shift-Based Distance Measurement
The TLS distance value is usually observed by the electro-optic distance measurement (EDM) unit using two methods [8]. As shown in Equation (1), the time-of-flight method measures the time delay between the emitted and received signals to obtain the distance. Meanwhile, the phase difference is measured by the phase-shift-based method. Thus, the distance measurement quality is directly related to the accuracy of time delay or phase difference measurement. Both methods calculate the distance by analyzing the waveform or features of the received signals. Different algorithms can be used in the analysis process, such as peak estimator/discriminator, leading edge detection, and average (center of mass/gravity determination) [23,41].
where is the velocity of light, is the pulse round trip time, is the modulation wavelength, is the number of full wavelengths (cycle ambiguity), is the fractional part of the phase difference between the emitted and received signals, and are the two-way distances, and is the one-way distance between the scanned point and the center of the scanner.
Phase-shift-based scanners adopt a continuous wave laser, with the intensity modulated at a series of frequencies [8]. Distance is accurately calculated by measuring the phase shift in the waves of infrared light. Only the fractional part of the phase difference () is obtained from the phase comparison between the emitted and received signals. Cycle ambiguity () is resolved using multiple measurement modulation wavelengths [8,29]. The accuracy of distance measurement is influenced by the length of the cycle periodicity and by the wavelength itself, which introduces ambiguity in the range estimation. Thus, several frequencies are used (multi-frequency-ranging), the higher ones for calculating the range and the lower ones for eliminating ambiguity [29]. Target specular reflections can change the features of the backscattered signal significantly. A deformed signal influences the scanner system’s measurement of the phase difference. Consequently, target specular reflections can lead to errors in distance observations. Manufacturers do not normally disclose optical and electronic TLS instrument details. Thus, performing an increasingly in-depth analysis about the influence of target specular reflections on phase difference estimation is difficult. The instrument (Faro Focus3D 120, FARO Technologies, Orlando, FL, USA) used in this study is a phase-shift-based scanner. Therefore, only the principles of phase-shift-based scanners are presented in detail. In terms of time-of-flight scanners, the deformed backscattered signal caused by specular reflections will disturb the scanner system’s accurate determination of the time delay, thereby leading to errors in the distance observations.
2.2. Estimation of Distance Measurement Errors from Target Specular Reflections
Diffuse and specular reflections generally exist in all-natural targets. However, compared with the distance measurement errors from specular reflections, those caused by diffuse reflections are minor and negligible. To obtain the relationship between intensity and distance measurement errors, the accurate errors from target specular reflections should be determined first. In this study, a new method for estimating the distance measurement errors from the original point cloud data directly using planar targets is proposed. The principles are as follows.
In TLS, angle encoders are used to measure the vertical and horizontal rotations. These angles are encoded simultaneously with the distance measurement. For a certain point in an ideal plane (Figure 1), the measured and true coordinates are assumed as and , respectively. Based on the geometric relations in Figure 1, the measured coordinates satisfy
where is the measured distance; and and are the measured vertical and horizontal angles, respectively. Similarly, the true coordinates of point satisfy
where is the true distance; and and are the true vertical and horizontal angles, respectively.
Specular reflections influence only the distance measurement. The vertical and horizontal angles are measured by the angle measurement unit, which is independent of the distance measurement unit and not influenced by the specular reflections. Thus, a reasonable hypothesis is that the angle measurements have no errors even though distance measurement errors exist, i.e., and . From Equations (2) and (3), we can obtain
The equation of the plane where point lies satisfies
where , , and are the parameters of the plane. It should be noted that the intercept form of the plane equation is adopted to simplify the estimation of the parameters since the distance between the plane and the center of the scanner is not zero. The parameters are estimated using the points assumed to have no distance errors (yellow parts in Figure 1), using least squares adjustments. By substituting Equation (4) into Equation (5), the true distance value can be obtained.
Therefore, the distance measurement error is
Equation (7) indicates that the distance measurement errors can be calculated directly using the measured point coordinates and the parameters of the theoretical plane.
2.3. Distance Measurement Errors and Intensity
Distance and intensity are derived from the backscattered signal. The intensity value and distance error are theoretically linked. The distance measurement errors of TLS are influenced by target reflectance, incidence angle, and distance and can be expressed by Equation (8).
where , , and are the functions of target reflectance , incidence angle , and distance , respectively. The intensity data obtained by a TLS system are also influenced by target reflectance, incidence angle, and distance (Equation (9)) [39,40].
where , , and are the functions of target reflectance, incidence angle, and distance, respectively. According to Equations (8) and (9), a certain relation exists between intensity and distance errors, as shown by Equation (10).
where is a function of intensity, i.e., the distance errors caused by target specular reflections can be expressed by the original intensity data. The theoretical form of is unknown and may vary across different scanners. Different functions can be used to substitute . In this study, a polynomial function is empirically used to approximate , as shown by Equation (11).
where and are polynomial parameters. With the sampling of a series of points from different targets, the original intensity data can be obtained, and the distance errors can be calculated using Equation (7). Then, the polynomial parameters can be estimated by Equation (11) using least squares adjustment.
3. Materials and Experiments
The scanner adopted in this study was a Faro Focus3D 120, which is an amplitude modulation continuous wave TLS. Faro Focus3D 120 emits a laser beam from a rotating mirror toward the area being scanned. Then, the unit distributes the laser beam at a vertical range of 305° and a horizontal range of 360°. The laser beam is then reflected to the scanner by objects in its path. Together with the relative vertical and horizontal angles, the distance to the objects was calculated using the phase modulation technique. To measure the distance, Faro Focus3D 120 uses phase shift technology, in which constant waves of infrared light of varying lengths are projected outward from the scanner [8,29]. In the phase-measuring technique used to measure distances, the output laser beam is split, and the amplitude is modulated to operate at three different wavelengths (i.e., 76, 9.6, and 1.2 m) [42]. The distance from the scanner to the object is accurately determined by measuring the phase shift in the waves of the infrared light. The longest modulation wavelength defines the uniqueness range, and the shortest modulation wavelength defines the precision that can be obtained [29]. The distance scale is 0.6–120 m indoors or outdoors, with low ambient light and normal incidence to a 90% reflective surface, and the distance error at 25 m is approximately 2 mm. The circular beam diameter at the exit is 3 mm, and the beam divergence was 0.16 mrad. Apart from the distance observations, the reflectivity of the captured surfaces is determined by the Faro Focus3D 120 by measuring the intensity of the received laser beam. This reflectivity value, which is the intensity value, is recorded in 11 bits [0, 2048] for each single point.
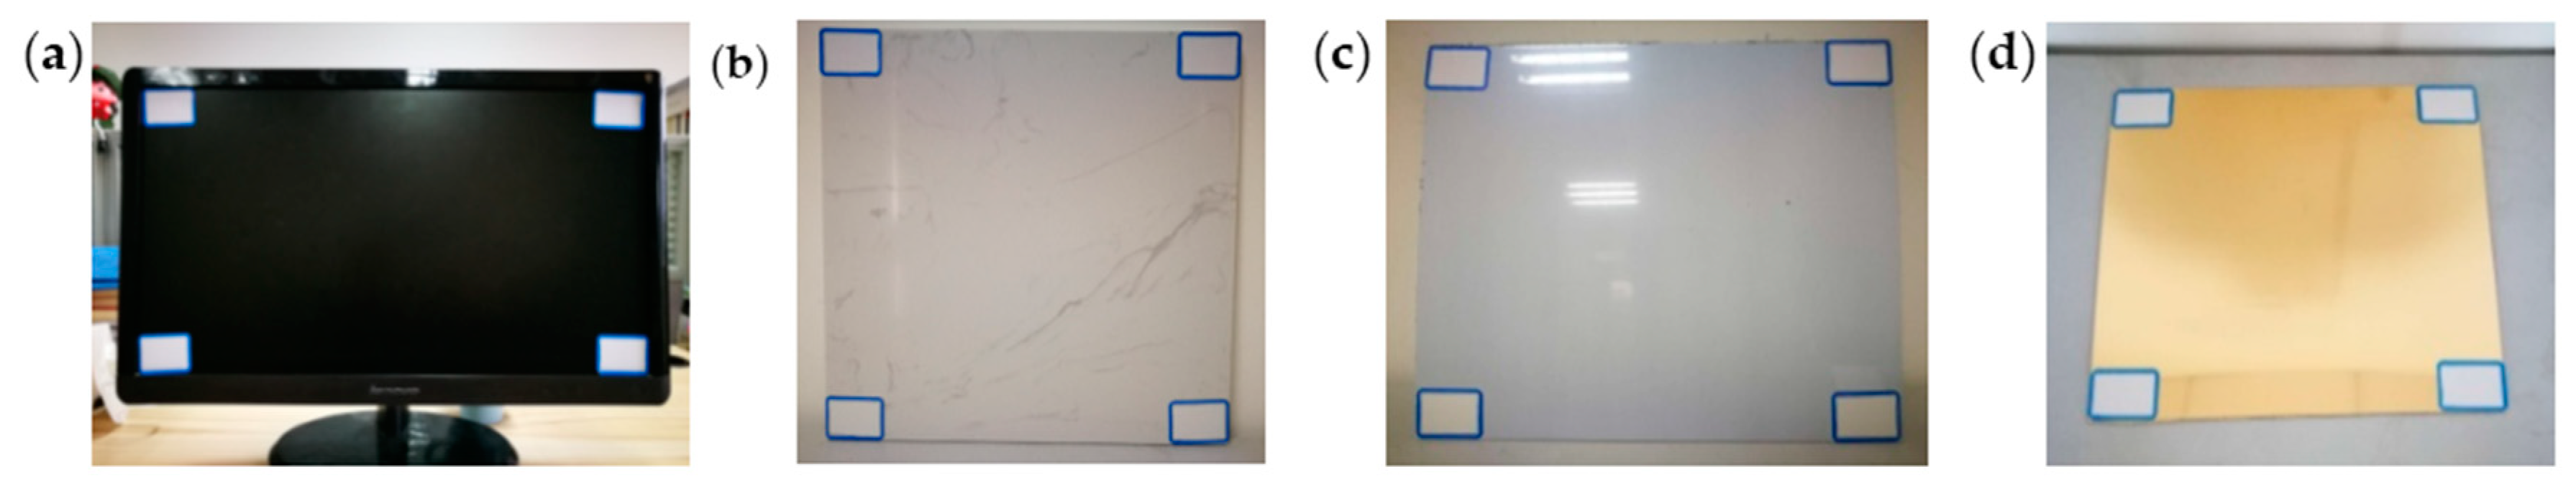
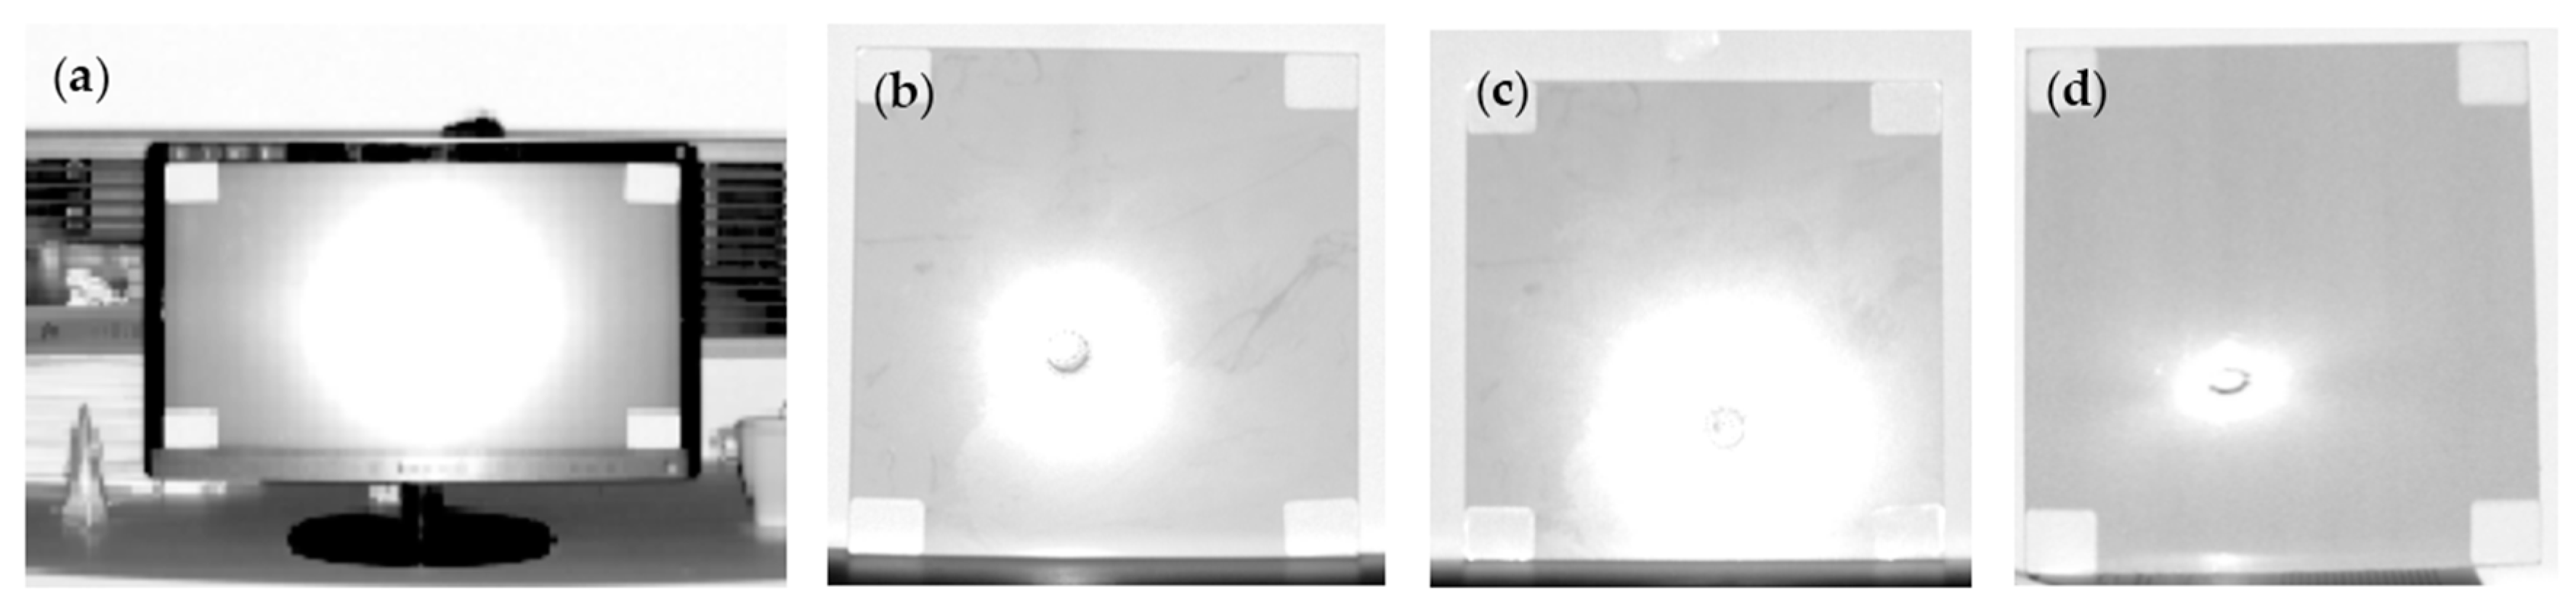
To estimate the polynomial parameters and validate our proposed method, planar targets were used in this study. (i) The incidence angles of all points on the planar target were nearly near zero when the target was placed perpendicular to the scanner; thus, the influence of target specular reflections on the distance measurements could be explored well; (ii) The distance measurement errors of the planar targets could be easily and accurately determined using the method in Section 2, and the true distance could be used to validate the prediction of the intensity-based model. The four reflective targets were made of different materials (Figure 2): a desktop computer liquid crystal display screen (35 × 24 cm2), a white ceramic tile (33 × 33 cm2), an iron sheet coated with white paint (35 × 30 cm2), and a gold-coated polyethylene panel (30 × 27 cm2). Visually, the surfaces of these four targets were radiometrically homogeneous and geometrically smooth. The flatness was better than 2 mm. Four white sheets of note paper with size of 3 × 5 cm2 were attached to the four corners of each surface. The surfaces of the paper sheets were relatively rough, and their specular reflections can be ignored. The distance measurement errors of the points of the paper sheets were subtle. Hence, the paper sheets could be used to determine the theoretical plane in a specific acquisition configuration. Given that the influence of the target specular reflections on intensity data are particularly strong at small incidence angles near zero, the four reflective planar targets were all scanned by the Faro Focus3D 120 approximately at a normal incidence angle indoors. In the four scanning campaigns, the computer screen was placed on a table and the three other targets were fixed on a wall. The scanner was placed perpendicular to the center of the scanned target in all scanning campaigns. During the campaigns, the scan quality and resolution of the Faro Focus3D 120 were set to 4 and 1/4, respectively. The distances from the scanner to the four targets were approximately 3, 10, 7, and 15 m. The points were manually sampled as fully as possible and exported to. xyz format in the standard software Faro SCENE 4.8 (FARO Technologies, Orlando, FL, USA). The surface data of the targets and paper sheets were separately exported. Then, the proposed method was tested and run in the MATLAB programming language.
4. Results
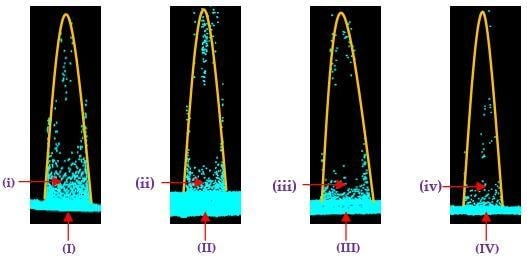
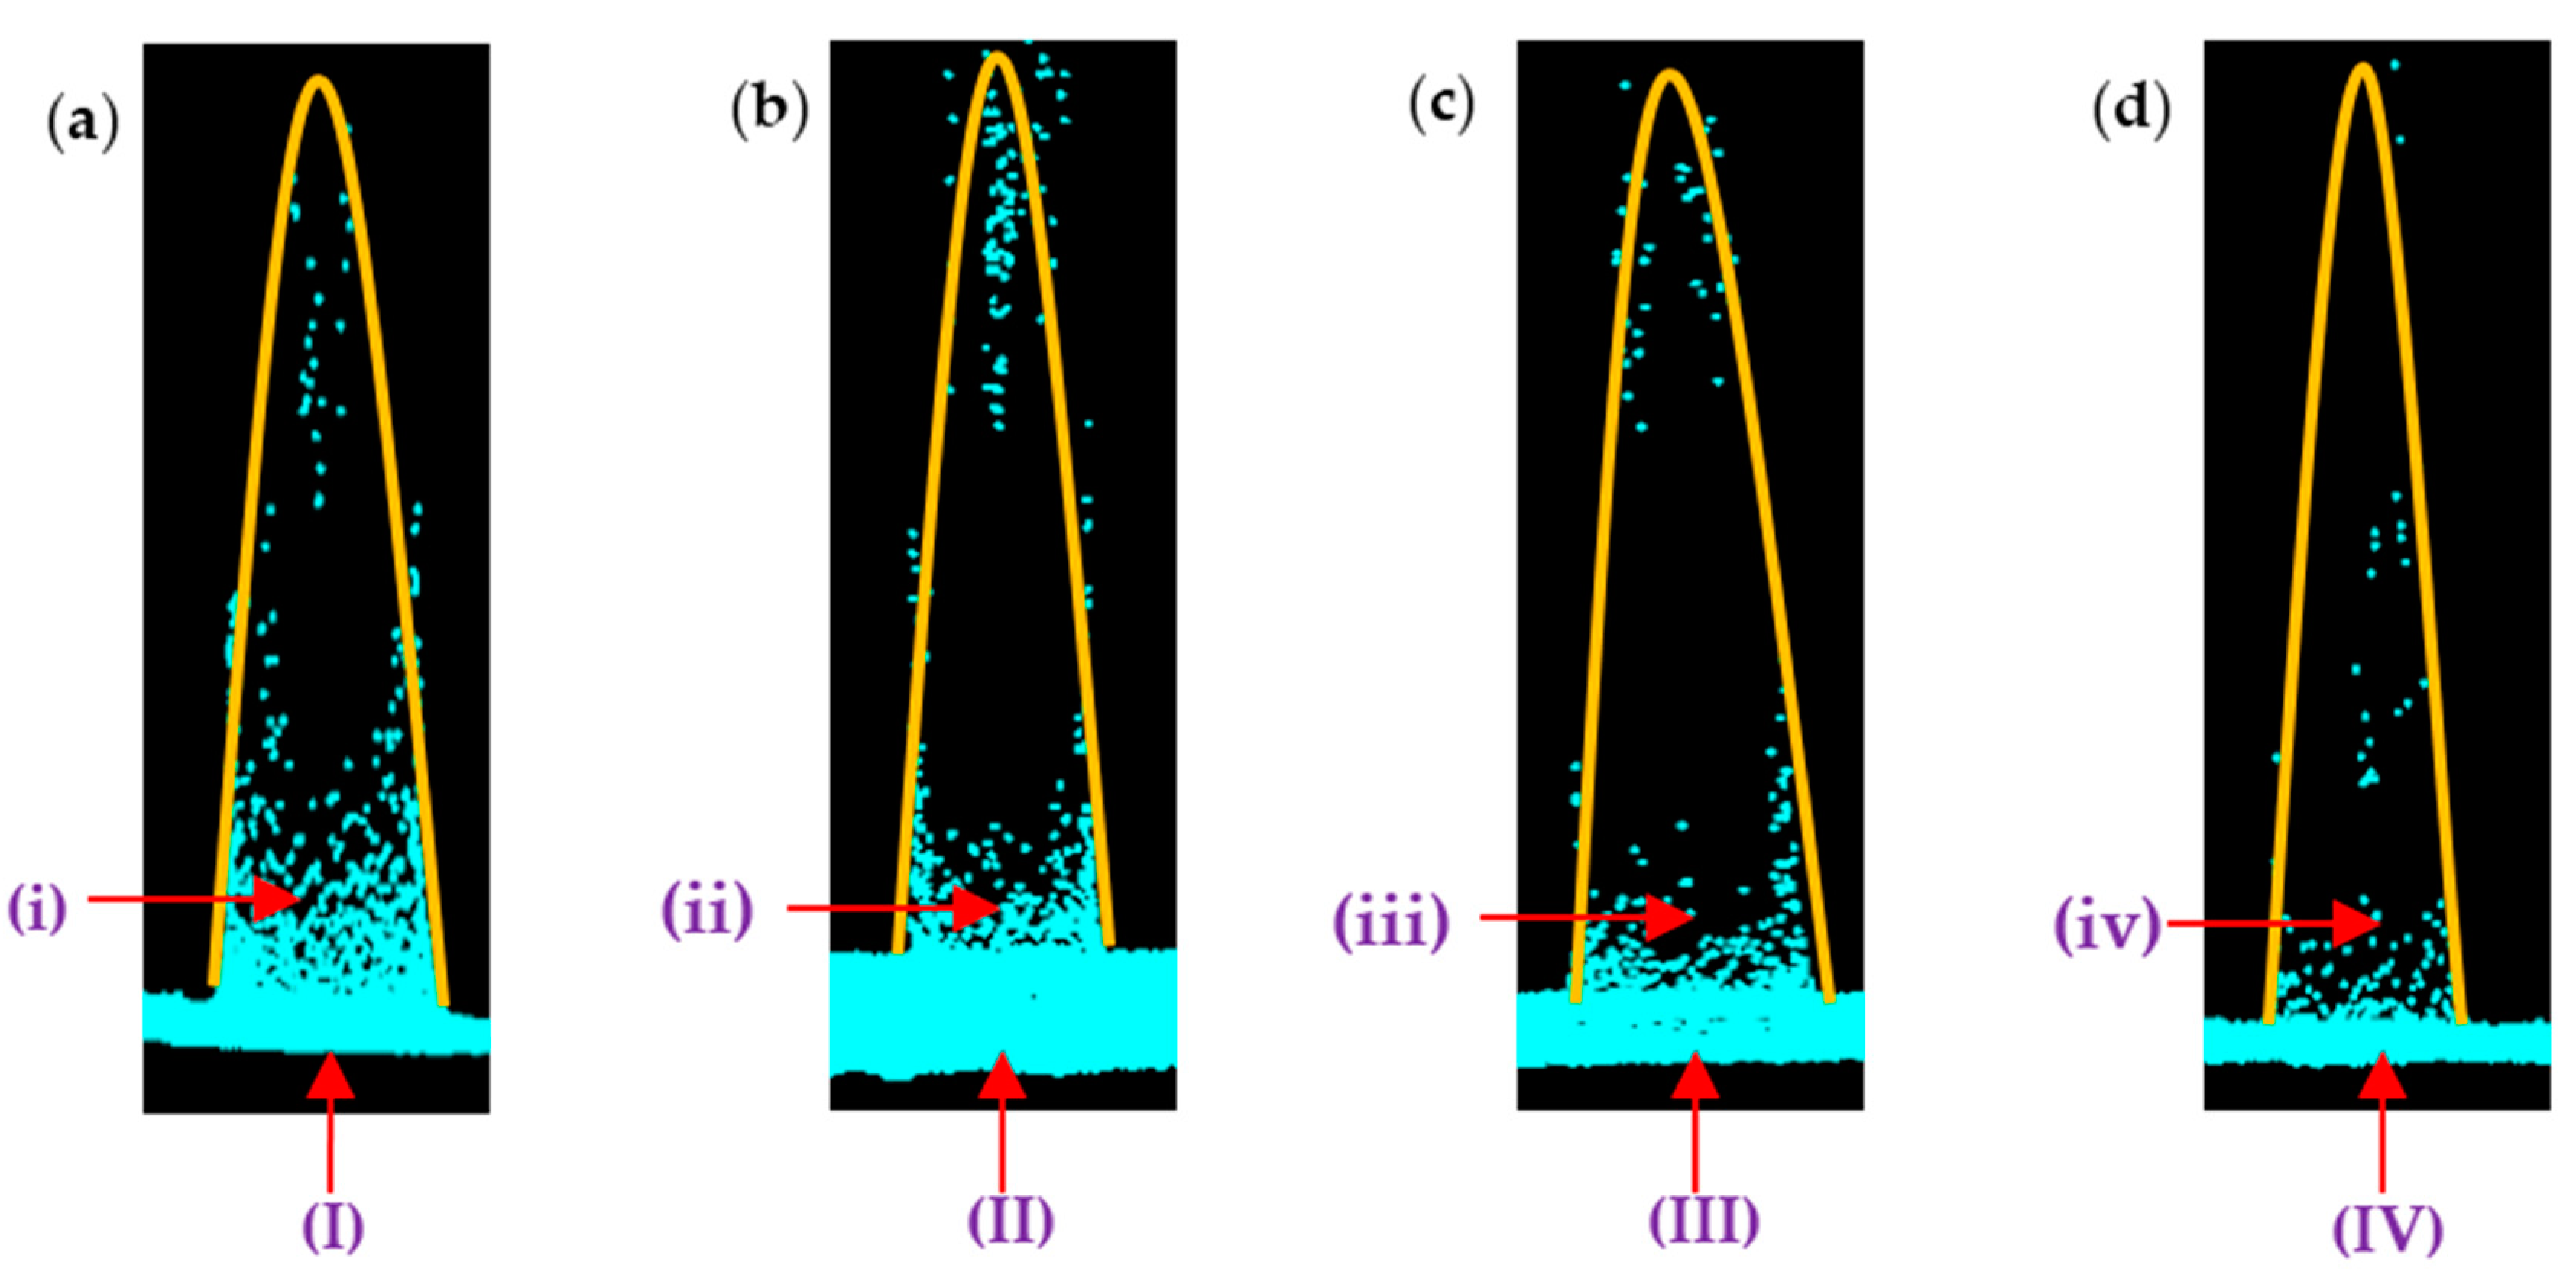
The original intensity images of the four targets created by Faro SCENE 4.8 are presented in Figure 3. Bright regions exist at the centers of all the intensity images because specular reflections can cause highlight phenomena at normal incidence angles; i.e., the intensity data of the bright regions are higher than that of the rest of the parts although they belong to the same target and have the same reflectance characteristics. This result is highly consistent with the findings in Tan et al. [22], and additional details about the principles of specular highlight phenomena can be found in Tan et al. [22]. To analyze the distance measurement errors, the point cloud of the highlighted regions was manually selected and exported. A 3D visualization of the selected points is shown in Figure 4. The points of the bright regions deviate significantly from the theoretical plane. The closer a point to the center of the bright regions, the greater the distance deviation. The distance errors of the bright regions are not randomly distributed but have a specific behavior, as shown by the yellow fitting curves (cone) in Figure 4. Additionally, some parts of the bright regions have no points because the extremely high amplitude of the backscattered signal causes a saturation effect of the photodetector. The saturation effect is related to the internal instrument mechanism and thus not discussed in this study. We can conclude that target specular reflections can simultaneously lead to intensity highlight phenomena, large distance measurement errors, and even the loss of point cloud.
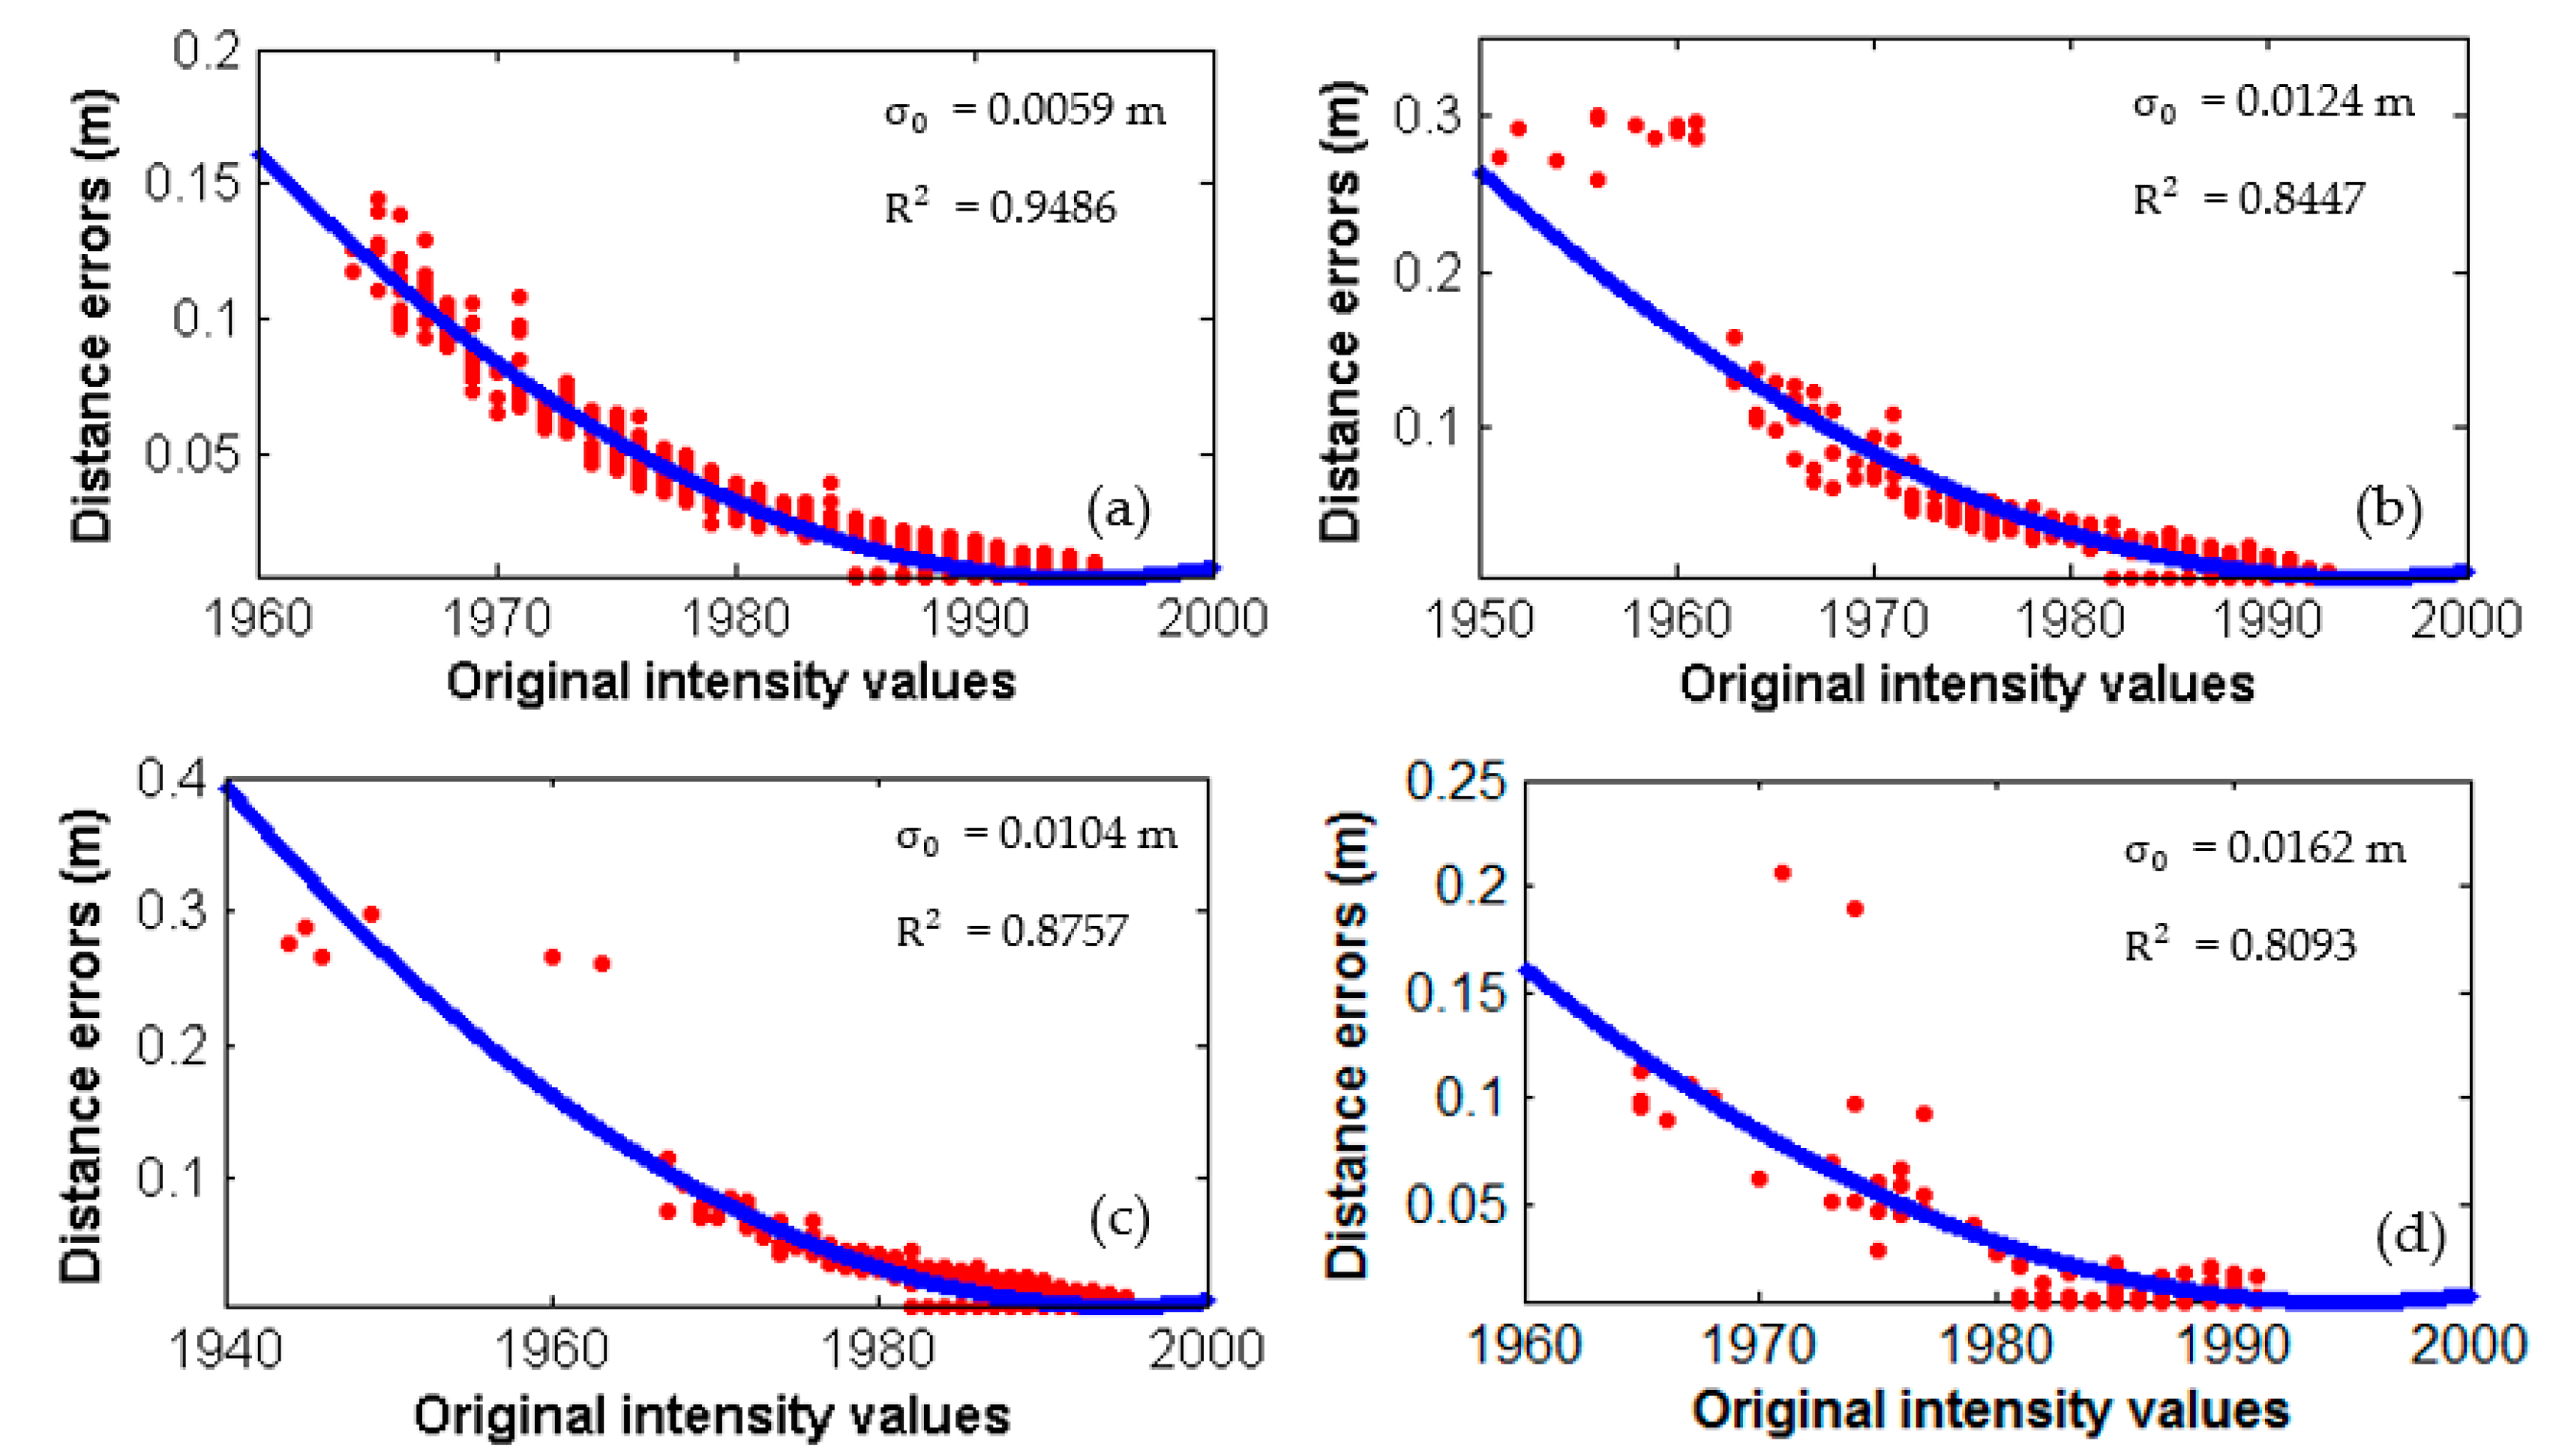
To analyze the relationship between intensity and distance data quantitatively, the distance errors of all the points of the four targets are calculated according to Equation (7), where , , and are estimated by least squares adjustment using the points of the paper sheets (Table 1).
The distance error at 25 m is approximately 2 mm for Faro Focus3D 120, and the flatness of all the planar targets is less than 2 mm. Considering other scanning noises, distance errors larger than 5 mm are empirically assumed abnormal and caused by the target specular reflections. A scatter plot between intensity data and distance errors (≥5 mm) is shown in Figure 5. Unexpectedly, the largest distance measurement errors reach approximately 150, 300, 300, and 200 mm for the four targets; these errors exceed the scanner’s nominal accuracy. Furthermore, the distance errors decrease significantly from 400 mm to 5 mm with an increase in intensity data from 1940 to 2000. A visually strong relationship exists between the distance errors and the original intensity data. Notably, the relationship between the distance errors and the intensity of the four targets follow the same trend, regardless of target material and scanning geometry. With a test of the different orders of the polynomial and comparison of the fitting mean error , where is the residual vector and is the number of points participating in the least squares adjustment, the cubic polynomial is proven the most suitable and accurate for the relationship between the intensity and distance errors, i.e., = 3. With the data in Figure 5, the polynomial parameters are then estimated as shown in Table 2. The curves of the polynomial are shown in Figure 5. The values of are 0.0059, 0.0124, 0.0104, and 0.0162 for Figure 5a–d, respectively. The determination coefficients () are 0.9486, 0.8447, 0.8757, and 0.8093. The values of and indicate that the cubic curve fits the points well. The fitting results prove that there is indeed a mathematical relationship between the original intensity and the distance measurement errors and the original intensity can be used to compensate for the distance measurement errors.
5. Discussion and Validation
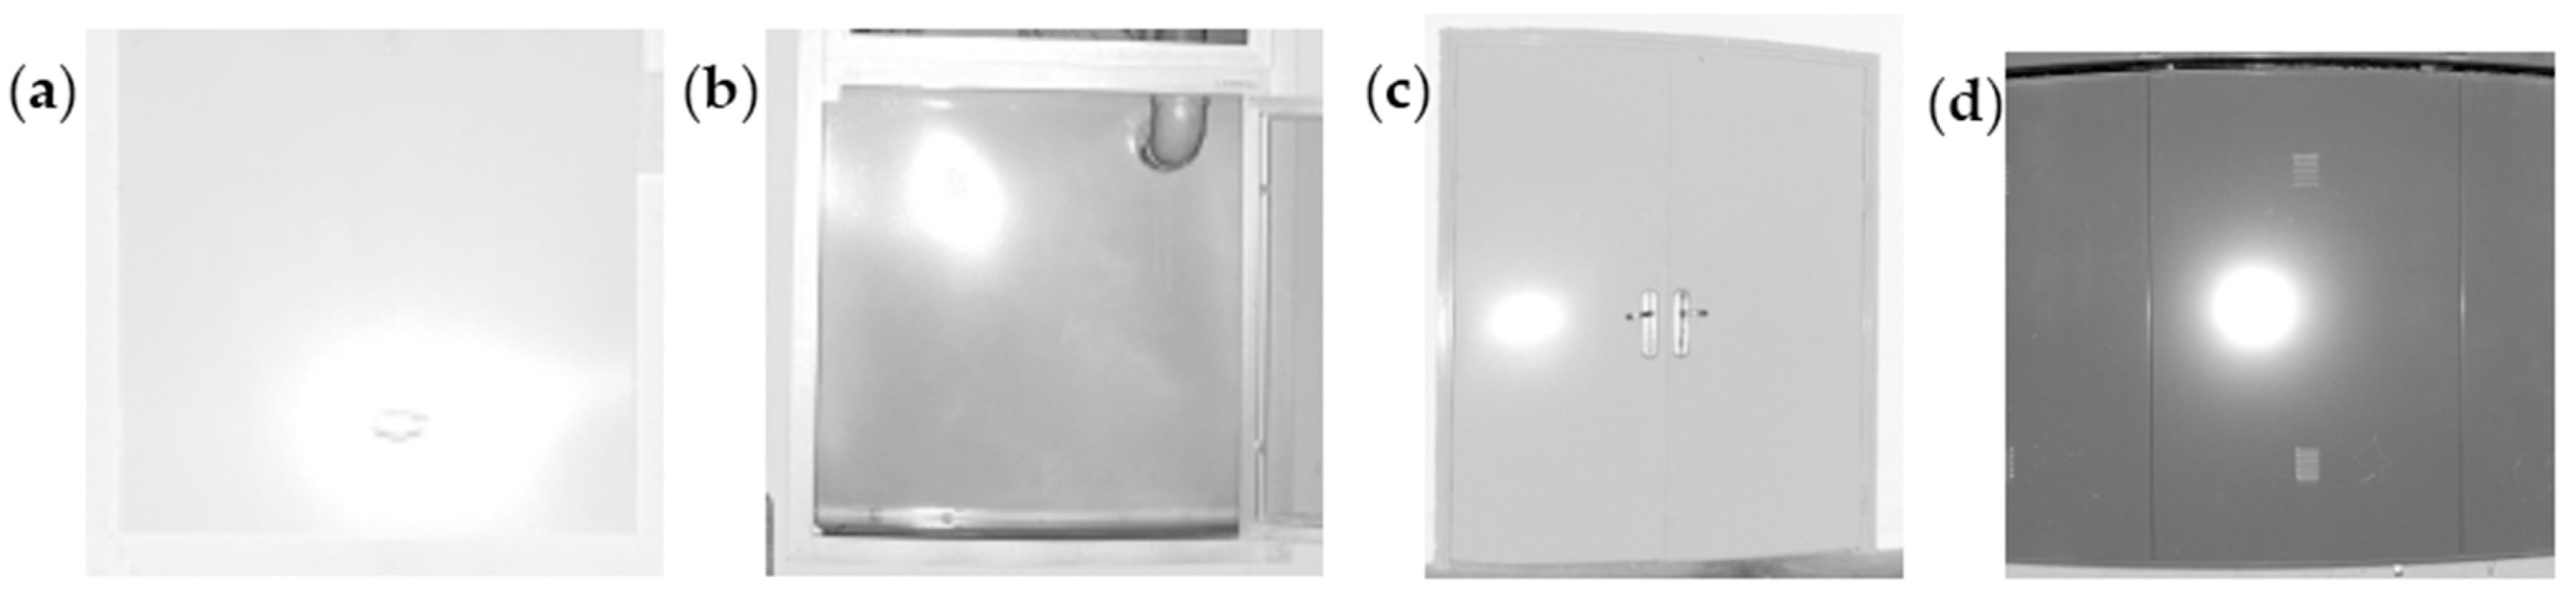
After the parameters in Table 2 is obtained, Equation (11) could be used to compensate for the distance observations of other targets according to the intensity data. To validate the proposed method and the application to other surfaces further, four other planar targets were scanned by the Faro Focus3D 120. These four targets were as follows: a polyvinyl chloride (PVC) sheet (35 × 35 cm2), a paint steel plate (40 × 40 cm2), a polished aluminum alloy door (200 × 180 cm2), and a rubber advertising board (250 × 100 cm2). The visual check of these four surfaces was materially homogeneous and geometrically planar. Similarly, the scanner was placed perpendicular to the center of the scanned target. The distances from the scanner to the four targets were approximately 6, 2, 15, and 18 m, respectively. The setting parameters of the scanner and the data processing method were the same as stated in Section 3. The original intensity images of these four targets are shown in Figure 6. Apparently, the phenomena of intensity highlight also occurred for these four surfaces.
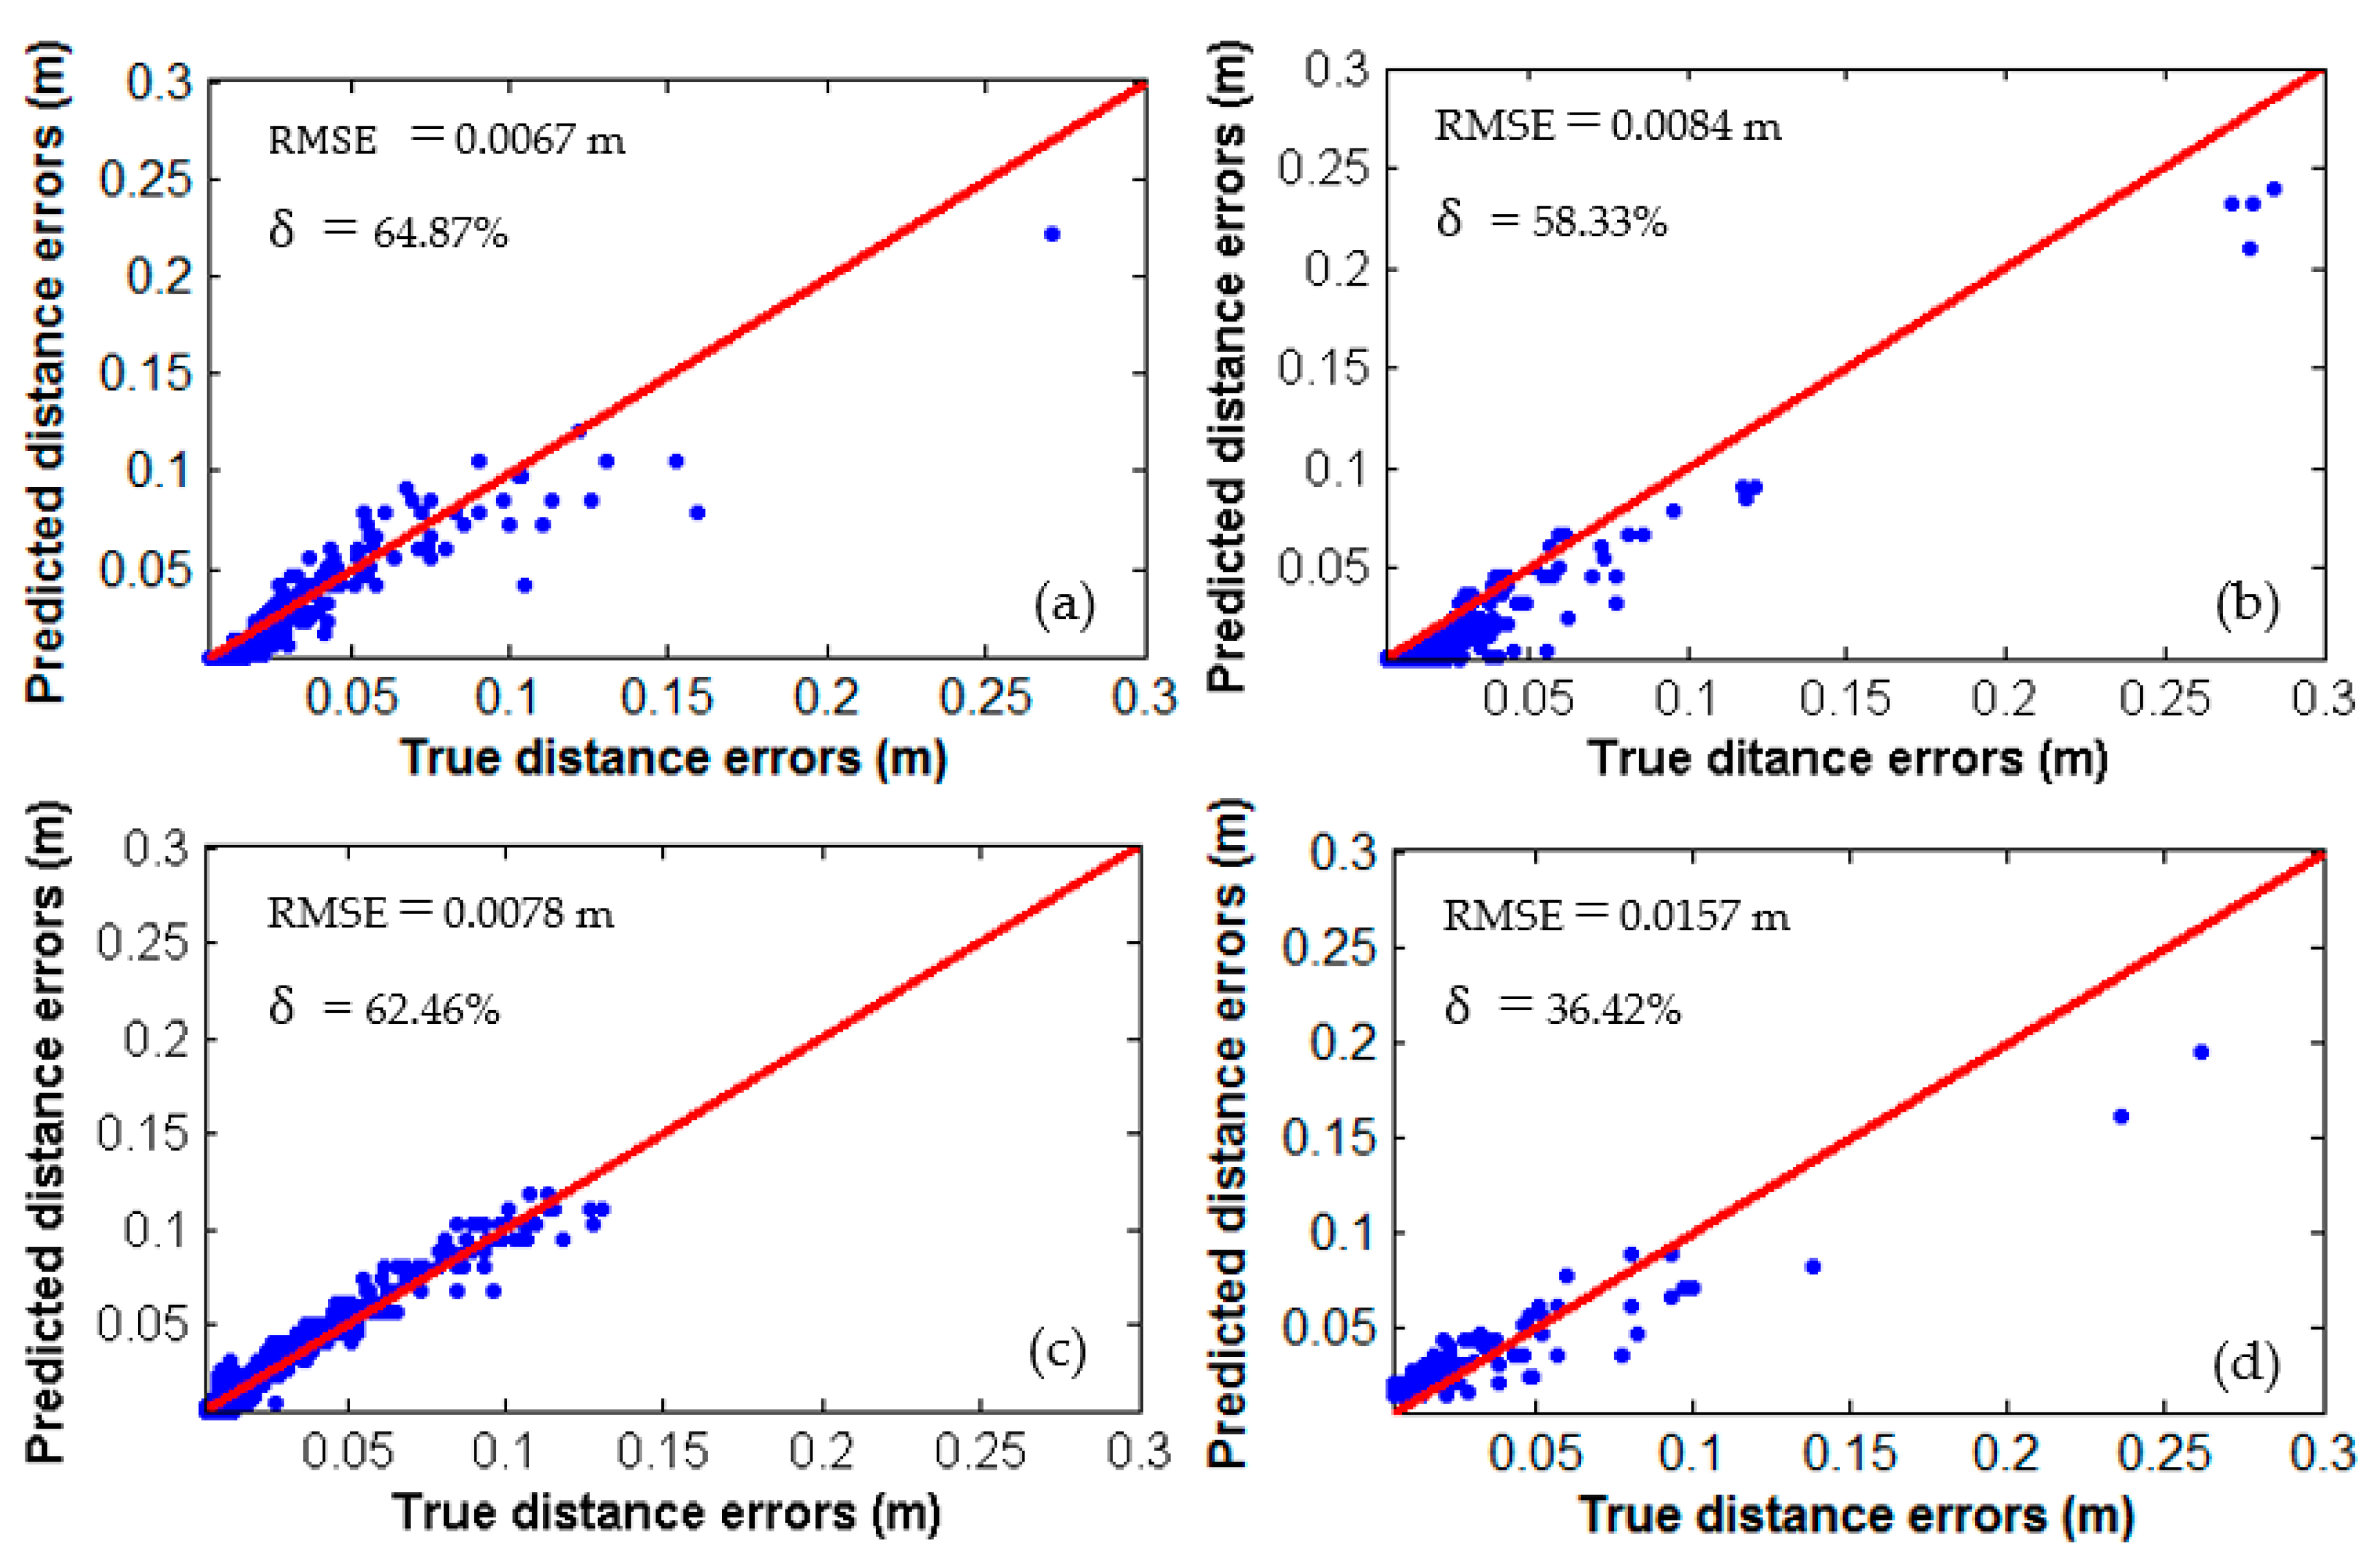
The true distance measurement errors of these four targets could be calculated using Equation (7). Simultaneously, the distance error could be predicted by the original intensity and the estimated parameters in Table 2 using Equation (11). The proposed method could be validated further by comparing the true and predicted distance errors. Similarly, the distance errors larger than 5 mm were deemed caused by the target specular reflections. The relationship between the true and predicted distance errors are shown in Figure 7. Visually, the points are all distributed around the red lines (). This result means that the distance measurement errors predicted by the original intensity data were approximately equal to the true distance errors.
To evaluate the difference between the true and predicted distance errors quantitatively, the root mean square error (RMSE) was used, as shown by Equation (12). A small RMSE indicated a minor difference between the true and predicted distance errors, i.e., the original intensity could be used to predict the distance errors caused by the target specular reflections. The values of the RMSE were 0.0067, 0.0084, 0.0078, and 0.0157 for Figure 7a–d, respectively. The mean value of the RMSE was 0.0097, which indicated that only small differences existed between the predicted and true distance errors.
where is the true distance error of point , is the predicted distance errors of point , and is the total number of points.
After the predicted distance errors were obtained through the original intensity, a corrected distance () could be obtained by . Consequently, the distance measurement accuracy could be improved. To evaluate the degree of accuracy improvement quantitatively, parameter could be calculated for each point as shown by Equation (13). The mean values of were 64.87%, 58.33%, 62.46%, and 36.42% for the points in Figure 7a–d, respectively. This result indicated that the proposed method could improve the distance measurement accuracy by approximately 55.52%, i.e., a significant improvement of distance measurement could be obtained through the original intensity data.
Notably, shortened and lengthened effects occurred for the retro-reflective targets scanned by the Optech ILRIS 3D (Toronto, ON, Canada) terrestrial laser scanner in Pesci et al. [10]. This result meant that the measured distance may be shorter or longer than the true distance due to the target specular reflections. However, the measured distances were all larger than the true distances in our study; i.e., only a lengthened effect was observed, possibly because the target specular reflections increased the fractional part of the phase difference () measurement, thus lengthening the distance observations. The shortened and lengthened effects are related to the waveform features of the backscattered signal and the algorithms adopted to calculate distance, which may vary by scanners. The specific reasons were unavailable due to the undisclosed instrument details and should be further investigated in future studies.
The targets were all scanned approximately at normal incidence angles in this study, which aimed to maximize the effect of target specular reflections on TLS intensity data and distance measurement errors. However, it should be noted that the specular reflections can also be received by the sensor at small incidence angles (≤45°) as reported by Tan et al. [22]. We checked the results of the computer screen scanned at other four incidence angles, i.e., 8°, 15°, 52°, and 68°. Expectably, it was found that distance measurement errors still existed at small incidence angles (8° and 15°) but not as large as that at the normal incidence angle. On the contrary, no obvious distance measurement errors were observed for highly inclined incidence angles (52° and 68°). More comprehensive experiments and analysis need to be carried out on different targets scanned at various incidence angles in the future work.
Additionally, planar targets were used in this study to derive the relationship between distance errors and intensity. Theoretically, the derived relationship between intensity and distance errors is independent of the target shape and can be applied to irregular surfaces. However, the true distances of the scanned points on irregular surfaces are unavailable and hence the validation of the proposed method is difficult. Extensive experiments and analysis on irregular surfaces should be conducted in future studies to further validate the feasibility of the proposed method.
The Faro Focus3D 120 adopted in this study is a phase-shift-based scanner. In terms of time-of-fight scanners, the two-way time of flight is measured. Specular reflections will influence the system’s accurate measuring of the time delay, thereby causing distance measurement errors. The major difference between phase-shift-based and time-of-flight scanners is the method for distance measuring. Theoretically, the intensity data of the time-of-flight TLSs are also related to the distance measurement errors and can be used to eliminate the distance measurement errors. However, the application of the proposed method to time-of-fight scanners, particularly long-range ones, should be further tested and analyzed individually.
6. Conclusions
This study presents an intensity-based method for correcting the distance measurement errors caused by target specular reflections, thereby establishing a connection between the two types of data in TLS. Eight representative targets with different materials and surface characteristics scanned by the Faro Focus3D 120 were selected to test the proposed method. Considering distance, incidence angle, and target characteristics individually is infeasible for modeling the distance errors. Therefore, the use of the intensity value is proposed for quantitatively modeling the distance errors based on the foundation that distance and intensity data are directly derived from the features of the backscattered signals. The most significant advantage of the proposed method is that no prior knowledge about the reflectance of the scanned target, scanning geometry, and instrument mechanism is required. The effects of distance, incidence angle, and target reflectance on distance measurement errors can be substituted by one original observation, i.e., intensity. Results indicate that the distance measurement accuracy can be improved significantly after establishing the function between intensity and distance errors, which is of great importance to TLS data quality, reliability, and subsequent processing. Additionally, target specular reflections can lead to intensity highlight phenomena [19,22]. The proposed method can provide accurate distance information for the estimation of the incidence angle. Thus, the effects of distance and incidence angle on the intensity highlight phenomena can be accurately eliminated for target classification, segmentation, and feature extraction. Given that specular reflections are dominant in many targets, such as fresh ice, water, foliage, mineral rocks, subway pipelines, transportation facilities, and building materials [20,21], the proposed method has great potential for improving data quality and accuracy in TLS. Although good results were obtained for the selected targets in this study, extensive testing should be carried out along with the analysis of the sensitivity on target material, scanning geometry, and other factors that may influence the proposed method to draw some generalizing conclusions.
Instrument details of TLS often remain undisclosed by manufacturers. Thus, a polynomial is used to approximate the relationship between intensity and distance measurement errors in this study. The proposed method can be improved if additional optical and electronic details are available. Furthermore, we empirically consider that distance errors larger than 5 mm are caused by specular reflections. An increasingly accurate isolation of the distance errors caused by specular reflections is required in future studies. Apart from the intensity highlight phenomena and the distance measurement errors, target specular reflections can lead to photodetector saturation and point cloud data loss because the extremely high amplitude of the backscattered signals exceeds the threshold of the photodetector and invalidates the measurements. No data exist when saturation occurs. Additionally, the shortened and lengthened distance measurement effects should be investigated by a physical analysis of the specific algorithms adopted to calculate distance. These topics are not discussed in this paper and need further investigation.
Author Contributions
All the authors of the present work contributed to the results and discussion of the results. K.T. proposed the method and derived the formulas; K.T. and W.Z. conceived, designed, and performed the experiments; K.T. and F.S. analyzed the data; W.Z. and F.S. contributed materials and analysis tools; and K.T. and X.C. wrote the paper.
Funding
This work is sponsored by the Shanghai Sailing Program under Grant 18YF1406800, China Postdoctoral Science Foundation under Grant 2017M620141, State Key Laboratory of Estuarine and Coastal Research (East China Normal University) under Grant 2017RCDW06, and National Natural Science Foundation of China under Grant 41671449.
Acknowledgments
We thank College of Surveying and Geo-Informatics, Tongji University, for providing the instrument, and thank the anonymous reviewers for the valuable suggestions and comments.
Conflicts of Interest
The authors declare no conflict of interest.
References
- Wujanz, D.; Burger, M.; Mettenleiter, M.; Neitzel, F. An intensity-based stochastic model for terrestrial laser scanners. ISPRS J. Photogramm. Remote Sens. 2017, 125, 146–155. [Google Scholar] [CrossRef]
- Soudarissanane, S.; Lindenbergh, R.; Menenti, M.; Teunissen, P. Scanning geometry: Influencing factor on the quality of terrestrial laser scanning points. ISPRS J. Photogramm. Remote Sens. 2011, 66, 389–399. [Google Scholar] [CrossRef]
- Lichti, D.D.; Gordon, S.J.; Tipdecho, T. Error models and propagation in directly georeferenced terrestrial laser scanner networks. J. Surv. Eng. 2005, 131, 135–142. [Google Scholar] [CrossRef]
- Lichti, D.D. Error modelling, calibration and analysis of an AM–CW terrestrial laser scanner system. ISPRS J. Photogramm. Remote Sens. 2007, 61, 307–324. [Google Scholar] [CrossRef]
- Zámečníková, M.; Wieser, A.; Woschitz, H.; Ressl, C. Influence of surface reflectivity on reflectorless electronic distance measurement and terrestrial laser scanning. J. Appl. Geodes. 2014, 8, 311–326. [Google Scholar] [CrossRef]
- Voegtle, T.; Wakaluk, S. Effects on the measurements of the terrestrial laser scanner HDS 6000 (Leica) caused by different object materials. Int. Arch. Photogramm. Remote Sens. Spat. Inf. Sci. 2009, 38, 68–74. [Google Scholar]
- Voegtle, T.; Schwab, I.; Landes, T. Influences of different materials on the measurements of a terrestrial laser scanner (TLS). Proc. XXI Congr. Int. Soc. Photogramm. Remote Sens. ISPRS 2008, 37, 1061–1066. [Google Scholar]
- Dorninger, P.; Nothegger, C.; Pfeifer, N.; Molnár, G. On-the-job detection and correction of systematic cyclic distance measurement errors of terrestrial laser scanners. J. Appl. Geodes. 2008, 2, 191–204. [Google Scholar] [CrossRef]
- Boehler, W.; Vicent, M.B.; Marbs, A. Investigating laser scanner accuracy. Int. Arch. Photogramm. Remote Sens. Spat. Inf. Sci. 2003, 34, 696–701. [Google Scholar]
- Pesci, A.; Teza, G. Terrestrial laser scanner and retro-reflective targets: An experiment for anomalous effects investigation. Int. J. Remote Sens. 2008, 29, 5749–5765. [Google Scholar] [CrossRef]
- Ding, Q.; Chen, W.; King, B.; Liu, Y.; Liu, G. Combination of overlap-driven adjustment and Phong model for LiDAR intensity correction. ISPRS J. Photogramm. Remote Sens. 2013, 75, 40–47. [Google Scholar] [CrossRef]
- Höfle, B.; Vetter, M.; Pfeifer, N.; Mandlburger, G.; Stötter, J. Water surface mapping from airborne laser scanning using signal intensity and elevation data. Earth Surf. Process. Landf. 2009, 34, 1635–1649. [Google Scholar] [CrossRef]
- Zhao, J.; Zhao, X.; Zhang, H.; Zhou, F. Shallow water measurements using a single green laser corrected by building a near water surface penetration model. Remote Sens. 2017, 9, 426. [Google Scholar] [CrossRef]
- Joerg, P.C.; Weyermann, J.; Morsdorf, F.; Zemp, M.; Schaepman, M.E. Computation of a distributed glacier surface albedo proxy using airborne laser scanning intensity data and in-situ spectro-radiometric measurements. Remote Sens. Environ. 2015, 160, 31–42. [Google Scholar] [CrossRef]
- Avian, M.; Kellerer-Pirklbauer, A.; Lieb, G.K. Geomorphic consequences of rapid deglaciation at Pasterze Glacier, Hohe Tauern Range, Austria, between 2010 and 2013 based on repeated terrestrial laser scanning data. Geomorphology 2018, 310, 1–14. [Google Scholar] [CrossRef]
- Deems, J.S.; Painter, T.H.; Finnegan, D.C. Lidar measurement of snow depth: A review. J. Glaciol. 2013, 59, 467–479. [Google Scholar] [CrossRef]
- Zhu, X.; Wang, T.; Darvishzadeh, R.; Skidmore, A.K.; Niemann, K.O. 3D leaf water content mapping using terrestrial laser scanner backscatter intensity with radiometric correction. ISPRS J. Photogramm. Remote Sens. 2015, 110, 14–23. [Google Scholar] [CrossRef]
- Hancock, S.; Gaulton, R.; Danson, F.M. Angular reflectance of leaves with a dual-wavelength terrestrial Lidar and its implications for leaf-bark separation and leaf moisture estimation. IEEE Trans. Geosci. Remote Sens. 2017, 55, 3084–3090. [Google Scholar] [CrossRef]
- Sun, X.; Liu, Y.; Yu, X.; Wu, H.; Zhang, N. Three-dimensional measurement for specular reflection surface based on reflection component separation and priority region filling theory. Sensors 2017, 17, 215. [Google Scholar] [CrossRef] [PubMed]
- Czesław, S.; Jacek, K. An example of harnessing Terrestrial Laser Scanner for remote sensing of saturation of chosen building materials. Constr. Build. Mater. 2016, 122, 400–405. [Google Scholar]
- Czesław, S.; Jacek, K.; Jacek, R. Terrestrial laser scanner as a tool for assessment of saturation and moisture movement in building materials. Period. Polytech. Civ. Eng. 2018, 62, 694–699. [Google Scholar]
- Tan, K.; Cheng, X. Specular reflection effects elimination in terrestrial laser scanning intensity data using Phong model. Remote Sens. 2017, 9, 853. [Google Scholar] [CrossRef]
- Chua, S.Y.; Guo, N.; Tan, C.S.; Wang, X. Improved range estimation model for three-dimensional (3D) range gated reconstruction. Sensors 2017, 17, 2031. [Google Scholar] [CrossRef] [PubMed]
- Costantino, D.; Angelini, M.G. Qualitative and quantitative evaluation of the luminance of laser scanner radiation for the classification of materials. ISPRS Int. Arch. Photogramm. Remote Sens. Spat. Inf. Sci. 2013, 40, 207–212. [Google Scholar] [CrossRef]
- Tan, K.; Cheng, X. Correction of incidence angle and distance effects on TLS intensity data based on reference targets. Remote Sens. 2016, 8, 251. [Google Scholar] [CrossRef]
- Yan, W.Y.; Shaker, A.; El-Ashmawy, N. Urban land cover classification using airborne LiDAR data: A review. Remote Sens. Environ. 2015, 158, 295–310. [Google Scholar] [CrossRef]
- Kashani, A.G.; Olsen, M.J.; Parrish, C.E.; Wilson, N. A Review of LiDAR radiometric processing: From Ad Hoc intensity correction to rigorous radiometric calibration. Sensors 2015, 15, 28099–28128. [Google Scholar] [CrossRef] [PubMed]
- Höfle, B.; Pfeifer, N. Correction of laser scanning intensity data: Data and model-driven approaches. ISPRS J. Photogramm. Remote Sens. 2007, 62, 415–433. [Google Scholar] [CrossRef]
- Pfeifer, N.; Briese, C. Laser scanning—Principles and applications. GeoSib.-Int. Exhib. Sci. Congr. 2007. [Google Scholar] [CrossRef]
- Carrea, D.; Abellan, A.; Humair, F.; Matasci, B.; Derron, M.H.; Jaboyedoff, M. Correction of terrestrial LiDAR intensity channel using Oren–Nayar reflectance model: An application to lithological differentiation. ISPRS J. Photogramm. Remote Sens. 2016, 113, 17–29. [Google Scholar] [CrossRef]
- Crommelinck, S. Simulating an autonomously operating low-cost static terrestrial LiDAR for multitemporal maize crop height measurements. Remote Sens. 2016, 8, 205. [Google Scholar] [CrossRef]
- Koenig, K.; Höfle, B.; Hämmerle, M.; Jarmer, T.; Siegmann, B.; Lilienthal, H. Comparative classification analysis of post-harvest growth detection from terrestrial LiDAR point clouds in precision agriculture. ISPRS J. Photogramm. Remote Sens. 2015, 104, 112–125. [Google Scholar] [CrossRef]
- Höfle, B. Radiometric correction of terrestrial LiDAR point cloud data for individual maize plant detection. IEEE Geosci. Remote Sens. Lett. 2014, 11, 94–98. [Google Scholar] [CrossRef]
- Thers, H.; Brunbjerg, A.K.; Læssøe, T.; Ejrnæs, R.; Bøcher, P.K.; Svenning, J.C. Lidar-derived variables as a proxy for fungal species richness and composition in temperate Northern Europe. Remote Sens. Environ. 2017, 200, 102–113. [Google Scholar] [CrossRef]
- Fabbri, S.; Giambastiani, B.M.S.; Sistilli, F.; Scarelli, F.; Gabbianelli, G. Geomorphological analysis and classification of foredune ridges based on Terrestrial Laser Scanning (TLS) technology. Geomorphology 2017, 295, 436–451. [Google Scholar] [CrossRef]
- Kaasalainen, S.; Jaakkola, A.; Kaasalainen, M.; Krooks, A.; Kukko, A. Analysis of incidence angle and distance effects on terrestrial laser scanner intensity: Search for correction methods. Remote Sens. 2011, 3, 2207–2221. [Google Scholar] [CrossRef]
- Kaasalainen, S.; Vain, A.; Krooks, A.; Kukko, A. Topographic and distance effects in laser scanner intensity correction. Int. Arch. Photogramm. Remote Sens. Spat. Inf. Sci. 2009, 38, 219–223. [Google Scholar]
- Fang, W.; Huang, X.; Zhang, F.; Li, D. Intensity correction of terrestrial laser scanning data by estimating laser transmission function. IEEE Trans. Geosci. Remote Sens. 2015, 53, 942–951. [Google Scholar] [CrossRef]
- Tan, K.; Cheng, X. Intensity data correction based on incidence angle and distance for terrestrial laser scanner. J. Appl. Remote Sens. 2015, 9, 094094. [Google Scholar] [CrossRef]
- Tan, K.; Cheng, X.; Ding, X.; Zhang, Q. Intensity data correction for the distance effect in terrestrial laser scanners. IEEE J-STARS 2016, 9, 304–312. [Google Scholar] [CrossRef]
- Jutzi, B.; Stilla, U. Simulation and analysis of full-waveform laser data of urban objects. In Proceedings of the 2007 Urban Remote Sensing Joint Event, Paris, France, 11–13 April 2007; pp. 1–5. [Google Scholar]
- Shan, J.; Toth, C. Topographic Laser Ranging and Scanning; CRC Press: Boca Raton, FL, USA, 2007. [Google Scholar]
Figure 1.
Geometric relations of the measured and true coordinates of point
and the theoretical plane. is the center of the TLS. The four yellow parts are used to determine the theoretical plane. The surface of the four yellow parts is rough, and their specular reflections are subtle. Compared with the distance errors caused by specular reflection, those of the four parts can be ignored.

Figure 2.
Smooth experimental planar targets: (a) computer screen; (b) ceramic tile; (c) iron sheet; (d) polyethylene panel. Four white sheets of paper are attached to each target.
Figure 2.
Smooth experimental planar targets: (a) computer screen; (b) ceramic tile; (c) iron sheet; (d) polyethylene panel. Four white sheets of paper are attached to each target.

Figure 3.
Original intensity images created by Faro SCENE 4.8: (a) computer screen; (b) ceramic tile; (c) iron sheet; (d) polyethylene panel. Specular highlight phenomena (bright regions) are present on all targets.
Figure 3.
Original intensity images created by Faro SCENE 4.8: (a) computer screen; (b) ceramic tile; (c) iron sheet; (d) polyethylene panel. Specular highlight phenomena (bright regions) are present on all targets.

Figure 4.
3D visualization of the point cloud of the bright regions in Figure 3 by FugroViewer™ 3.0 (Fugro N.V., Leidschendam, the Netherlands), where (i), (ii), (iii), and (iv) are the points of the bright regions and (I), (II), (III), and (IV) are the points of the target planes. (a) Computer screen; (b) ceramic tile; (c) iron sheet; (d) polyethylene panel. The points of the centers of the bright regions in Figure 3 deviate significantly from the theoretical plane and can be approximately fitted by a cone (yellow curves).

Figure 5.
Relationship between original intensity and distance measurement errors (red points) and the fitted cubic polynomial (blue lines): (a) computer screen; (b) ceramic tile; (c) iron sheet; (d) polyethylene panel. and are the fitting mean error and determination coefficient, respectively.
Figure 5.
Relationship between original intensity and distance measurement errors (red points) and the fitted cubic polynomial (blue lines): (a) computer screen; (b) ceramic tile; (c) iron sheet; (d) polyethylene panel. and are the fitting mean error and determination coefficient, respectively.

Figure 6.
Original intensity images: (a) polyvinyl chloride sheet; (b) paint steel plate; (c) polished aluminum alloy door; (d) rubber advertising board.
Figure 6.
Original intensity images: (a) polyvinyl chloride sheet; (b) paint steel plate; (c) polished aluminum alloy door; (d) rubber advertising board.

Figure 7.
Predicted and true distance errors: (a) polyvinyl chloride sheet; (b) paint steel plate; (c) polished aluminum alloy door; (d) rubber advertising board. The equation of the red lines is . RMSE is the root mean square error and is a parameter that indicates the degree of distance measurement accuracy improvement.


Table 1.
Parameters of the theoretical plane derived by the points of the paper sheets.
| computer screen | −0.8044 | −0.3056 | 0.1275 |
| ceramic tile | 0.2137 | 0.6798 | 0.0443 |
| iron sheet | 0.0081 | 0.3724 | 0.0157 |
| polyethylene panel | −0.0370 | 0.6958 | 0.0897 |
Table 2.
Parameters of the cubic polynomial.
| 3 | 340.7487 | 2.2926 × 10⁻⁸ | −5.8300 × 10⁻⁶ | −0.2504 |
© 2018 by the authors. Licensee MDPI, Basel, Switzerland. This article is an open access article distributed under the terms and conditions of the Creative Commons Attribution (CC BY) license (http://creativecommons.org/licenses/by/4.0/).
Share and Cite
MDPI and ACS Style
Tan, K.; Zhang, W.; Shen, F.; Cheng, X. Investigation of TLS Intensity Data and Distance Measurement Errors from Target Specular Reflections. Remote Sens. 2018, 10, 1077. https://doi.org/10.3390/rs10071077
AMA Style
Tan K, Zhang W, Shen F, Cheng X. Investigation of TLS Intensity Data and Distance Measurement Errors from Target Specular Reflections. Remote Sensing. 2018; 10(7):1077. https://doi.org/10.3390/rs10071077
Chicago/Turabian StyleTan, Kai, Weiguo Zhang, Fang Shen, and Xiaojun Cheng. 2018. "Investigation of TLS Intensity Data and Distance Measurement Errors from Target Specular Reflections" Remote Sensing 10, no. 7: 1077. https://doi.org/10.3390/rs10071077
Note that from the first issue of 2016, this journal uses article numbers instead of page numbers. See further details here.