Article

Urban Development in West Africa—Monitoring and Intensity Analysis of Slum Growth in Lagos: Linking Pattern and Process

1
Center for Development Research, University of Bonn, Genscherallee 3, D-53113 Bonn, Germany
2
Department of Geography, University of Bonn, Meckenheimer Allee 166, 53115 Bonn, Germany
3
Department of Geography, Ruhr-University Bochum, Universitätsstr. 104/Building UNI 104, D-44799 Bochum, Germany
*
Author to whom correspondence should be addressed.
Remote Sens. 2018, 10(7), 1044; https://doi.org/10.3390/rs10071044
Submission received: 5 May 2018 / Revised: 24 June 2018 / Accepted: 29 June 2018 / Published: 2 July 2018

Abstract

:
Upgrading all slums in Lagos by 2030 will an ambitious task, given that more than 70% of its residents resides in slums. Furthermore, there is no recent study identifying neither the slums nor their temporal growth/development pattern in Lagos that can backstop any slum management initiative. This study aims to contribute by applying object-based image analysis and intensity analysis to map and link patterns and processes of slum growth in Lagos. RapidEye imagery from 2009 and 2015 were used to create maps for each time point for six land use categories (water, vegetated area, open space, road, slum, and other urban). Intensity analysis was applied to quantify the annual intensity of changes at the category and transition level. An overall accuracy (and kappa coefficient) of 94% (0.9) and 89% (0.86) were achieved for the 2009 and 2015 land use and land cover maps, respectively. This study showed that slums in Lagos have increased spatially during the time interval studied, with a total net gain of 9.18 square kilometers, influenced by the increase in population, mainly due to in-migration to Lagos. However, this study also revealed that slums were actively losing and gaining land area between 2009 and 2015, with an annual gain and loss intensity of 10.08 and 6.41, respectively, compared to the uniform intensity of 3.15. The gain was due to poor maintenance of buildings and encroachment onto available spaces (water and open space), while the loss was attributed to gentrification and demolition processes. A systematic process of transition was observed between slums and other urban (and open space) areas in the interval studied, and this process was mainly influenced by the Lagos state government. This analysis is crucial for designing policy interventions to manage slum growth in Lagos.

Graphical Abstract

1. Introduction

Rapid urbanization with limited development has led to slum proliferation in many Sub-Saharan African cities [1,2,3,4]. Slums are part of the city where the housing and resulting social arrangements diverge from the general growth of the city [5]. Slums emerge due to the interaction of forces which give rise to communities with a devalued physical and social image [6]. Thus, slums are seen as a manifestation of urban decay, poverty, crime, and unemployment in developing countries [7,8,9]. Although the negativity attributed to slums is very high, nevertheless, they provide shelter at low cost for the poor, especially when the city government is unable to plan and provide affordable housing [10,11]. In addition, ([1], p. 28) refers to slums as “a solution to warehouse the twenty-first century surplus humanity, especially in the global south where housing is limited”. Similarly, informal settlements arise due to the need for shelter by migrants, who migrate into the cities for better opportunities [12]. Therefore, slums have roles in cities [13] and may continue to grow if their functionality is not considered during urban planning process.
Slums are unique in terms of their history, growth and development, opportunities, and challenges, but often similar in their characteristics and physical manifestations [6,14]. Experts find it difficult to reach an agreement on what criteria to use in defining slums [15], resulting in many slums being invisible to the world [16]. Furthermore, understanding the intricacies of slum dynamics will require linking historical trends of slum patterns with their underlying process [17]. This starts by identifying and mapping existing slums and their temporal changes. Mapping/identifying slums is very important to assist governments in providing the necessary services, such as housing, health, infrastructural facilities, etc. [18]. However, slums are, in many cases, not recognized as an integral part of the city or in the overall growth of the urban economy, because many urban planners tend to overlook its growth during urban planning process [19,20,21]. In addition, many donors or non-governmental organizations interested in slum management are only interested in slum improvement and not in their mapping [22].
Like other land use types, slums have distinct spatial characteristics that can be identified and mapped with Earth observation technology [19,23,24]. While mapping of slums is important, their multi-temporal dimension is also necessary to understand their evolution and observe their general growth trends [25]. This would then be used to support planning policies, to improve the existing slums or prevent new ones from springing up. Although, Kuffer, M., et al. [26] showed that there are several studies that have utilized remote sensing to identify and map slums, studies on slum temporal dynamics are few [27,28,29,30]. This is due to the high cost of high-resolution temporal satellite imagery, and the imperfection of automated slum identification methods [30]. Additionally, most of the sensors with high-resolution imagery were established around the year 2000, the reason why identifying slums before that time proved to be a challenge due to the nonexistence or limited availability of spatial data, especially in Sub-Saharan Africa.
The interaction between humans and the biophysical environment has been pointed out as the main driver of land use and land cover changes [31,32,33], nevertheless, it is important to link the patterns of land use and land cover changes (LULCC) with their underlying processes, and bridging the gap between social science and remote sensing [34]. Further, quantification of land use and land cover changes (LULCC) entails computation of a land cover/use transition matrix. However, this matrix does not provide sufficient information on the quantitative and systematic signals of land use and land cover changes [35]. In many cases, the transition matrix is analyzed at a broad level and may fail to reveal the total change on the landscape; for instance, zero net change due to simultaneous gain and loss within the landscape [36]. Additionally, discriminating significant signals during land use shifts is important in LULCC [37] and it is difficult to establish from a transition matrix. Purposefully, Aldwaik, S.Z., et al. [38] developed the intensity analysis, a type of change detection, to quantitatively analyze changes in different land use categories from time to time for a single site, by utilizing cross-tabulation matrices to summarize changes for each time interval. Although intensity analysis is sensitive to domain selection and the size of land use categories [39], it has been successfully utilized to integrate patterns with processes of land use and land cover changes [33,40,41].
Lagos developed from a small farming and fishing village in the fifteenth century to become one of the fastest growing cities in the world [42]. Lagos Bureau of Statistics [43] projected the population of Lagos metropolitan area as 21,324,114 in 2015. Lagos is projected to be the ninth most populous city by 2030 [44], and its population is expected to double by 2050 [45]. Amidst these projections is a city where more than 70% of its resident resides in slums [46,47,48]. Furthermore, Benjamin, M., et al. [49] observed that slum growth accounts for most of the urban growth experienced in Nigerian cities. In the past, scant attention was paid to urban planning in Lagos, but change in the government in 1999 led to the development of new reforms, including new policies to curb slum growth in Lagos through slum upgrading and redevelopment [42]. Yet, there is still need for improvement if the city hopes to be “free of slums by 2030”, such as utilizing remote sensing techniques to improve our understanding on the spatial and temporal dynamics of slum in Lagos; this can then be used to create knowledge repositories of these slums. These repositories can provide important information on the existing situation and also assist to devise a tailored slum management approach (either proactive or adaptive) for the city of Lagos. Presently, there is no study identifying slums or their growth patterns in Lagos. Hence, this study aims to contribute by applying remote sensing techniques and intensity analysis, to map and link patterns and processes of slum growth in Lagos from 2009 to 2015. The objectives of this study are:
  • To delineate slums from other land use types in Lagos;
  • To determine how slums in Lagos developed over time;
  • To quantify the patterns of change observed between 2009 and 2015; and
  • To identify the underlying processes leading to the observed change.
This paper is structured as follows: Section 1 gives the rationale and objective of this study; Section 2 discusses the study area and data utilized for this study; Section 3 gives the methodology utilized; Section 4 gives the result; Section 5 gives the discussion; while Section 6 gives the conclusion.

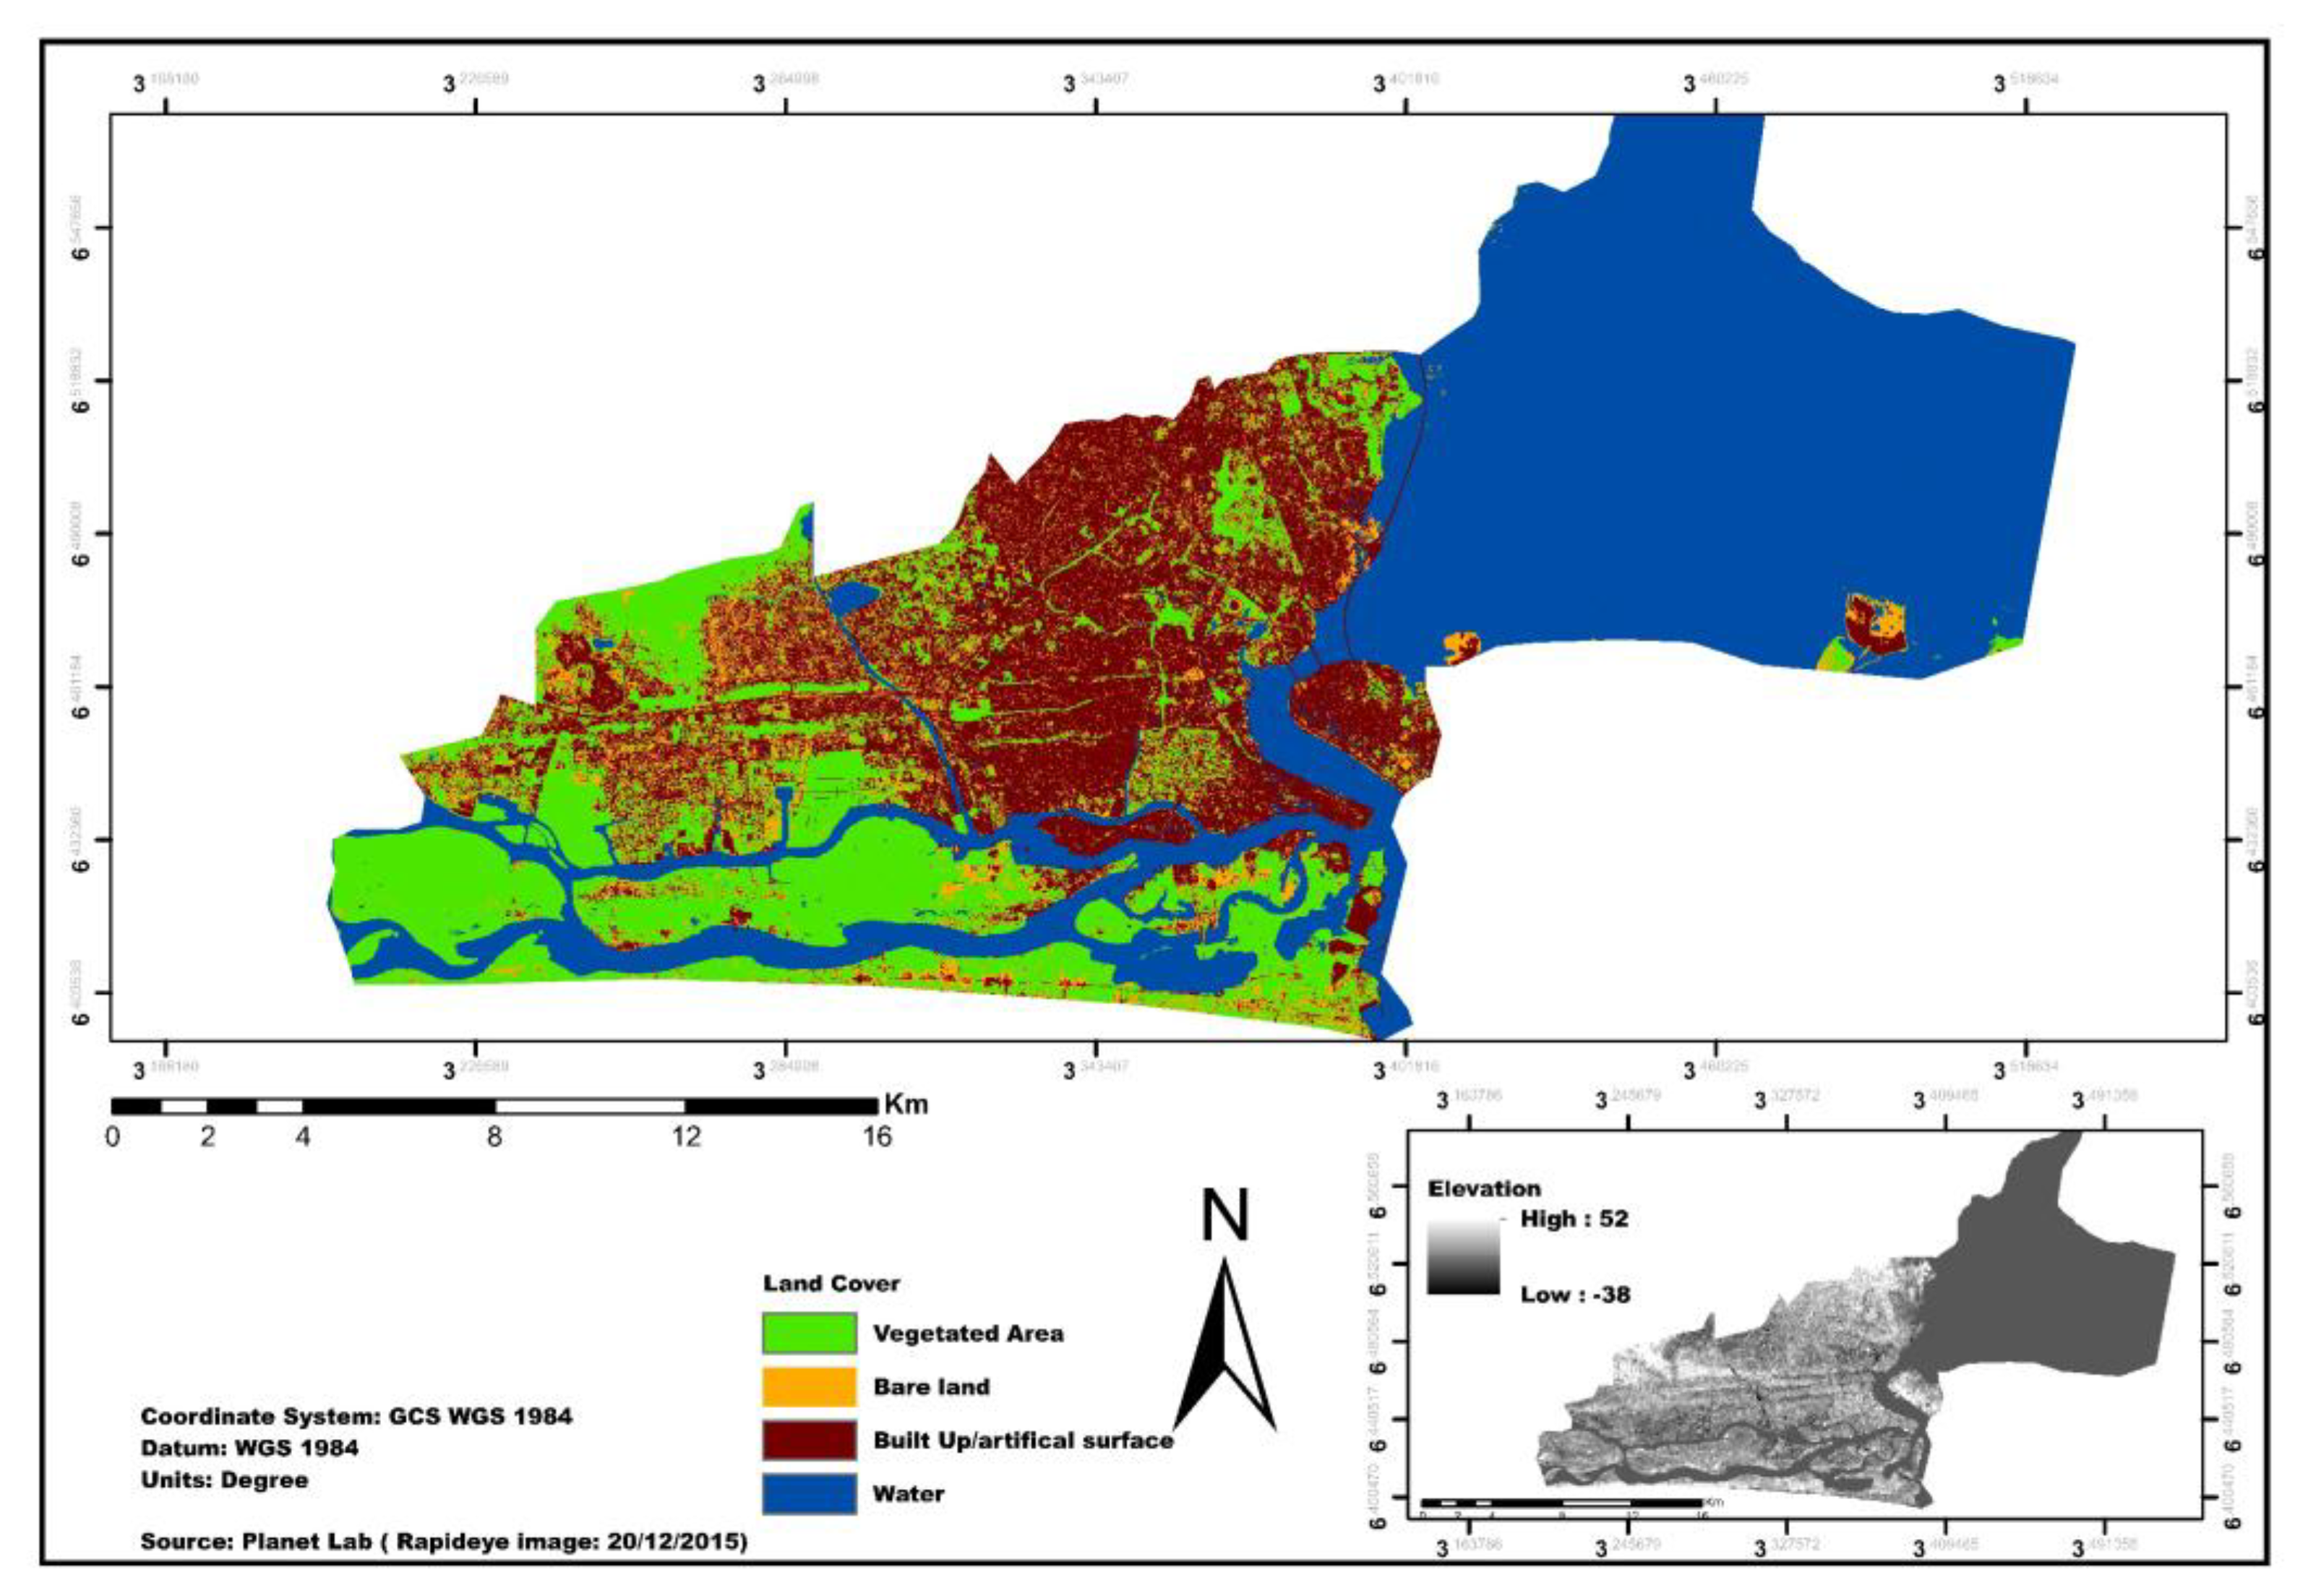
2. Study Area and Data

2.1. Study Area

The study was conducted in six local government areas (Apapa, Ajeromi-Ifelodun, Amuwo-odofin, Surulere, Lagos Island, and Lagos Mainland) of Lagos metropolis, constituting a section of the older part of the city. The population densities per square kilometer of Apapa, Ajeromi-Ifelodun, Amuwo-odofin, Surulere, Lagos Island, and Lagos Mainland was projected to be 18,016; 137,102; 3892; 62,552; 123,290; and 42,598, respectively in 2015 [43] (Figure 1). Most of the unplanned settlements (slums and squatters) are located within this area because of its proximity to Lagos lagoon and the central business district [47].
The study area covers approximately 395 square kilometers. It lies approximately between 3°12′E and 3°24′E longitude and 6°24′N and 6°31′N latitude. The elevation of the study area ranged from 38 m below sea level to 52 m above sea level. Four dominant land cover classes were identified in the study area using the RapidEye image (20/12/2015) which includes: vegetated area (20.1%), water (47.9%), bare land (8.5%), and built up area (23.5%) (Figure 2).
According to [50], there are two types of deprived urban areas in Nigeria: squatters and slums. Squatters are uncontrolled or temporary dwellings inhabited by migrants from within and outside the city, while slums are old residential areas built long ago, in line with the then-prevailing urban planning, zoning, and construction standards, but now dilapidated and overcrowded. The research conducted by [51] shows that Lagos has the two identified deprived areas (Figure 3). Further, the Lagos state government sometimes include squatters under the category of slums, due to their similar physical characteristics, as observed in the Lagos Metropolitan Development and Governance Project (2006), where water, road, and electricity were provided to nine blighted communities (Agege, Ajegunle, Amukoko, Badia, Iwaya, Makoko, Ilaje, Bariga, Ijeshatedo/Itire), without considering if it was a squatter or slum. In this study, squatters and slums were equally considered to prevent bias as they all need to be monitored and improved.

2.2. Data

The satellite images utilized in this study were from RapidEye (through the RapidEye science archive), acquired on 29 November 2009 and 20 December 2015 (Table 1). Other data utilized were vector data (road, water, land use maps, etc.) obtained from the Lagos State Ministry of Physical Planning and Urban Development. The imagery was not radiometrically calibrated because it was a Level 3A product (radiometric, sensor, and geometrically corrected). However, atmospheric correction and haze removal was done using ATCOR 2 on all the scenes. The corrected scenes were mosaicked and the study area subset was derived using its shapefile.

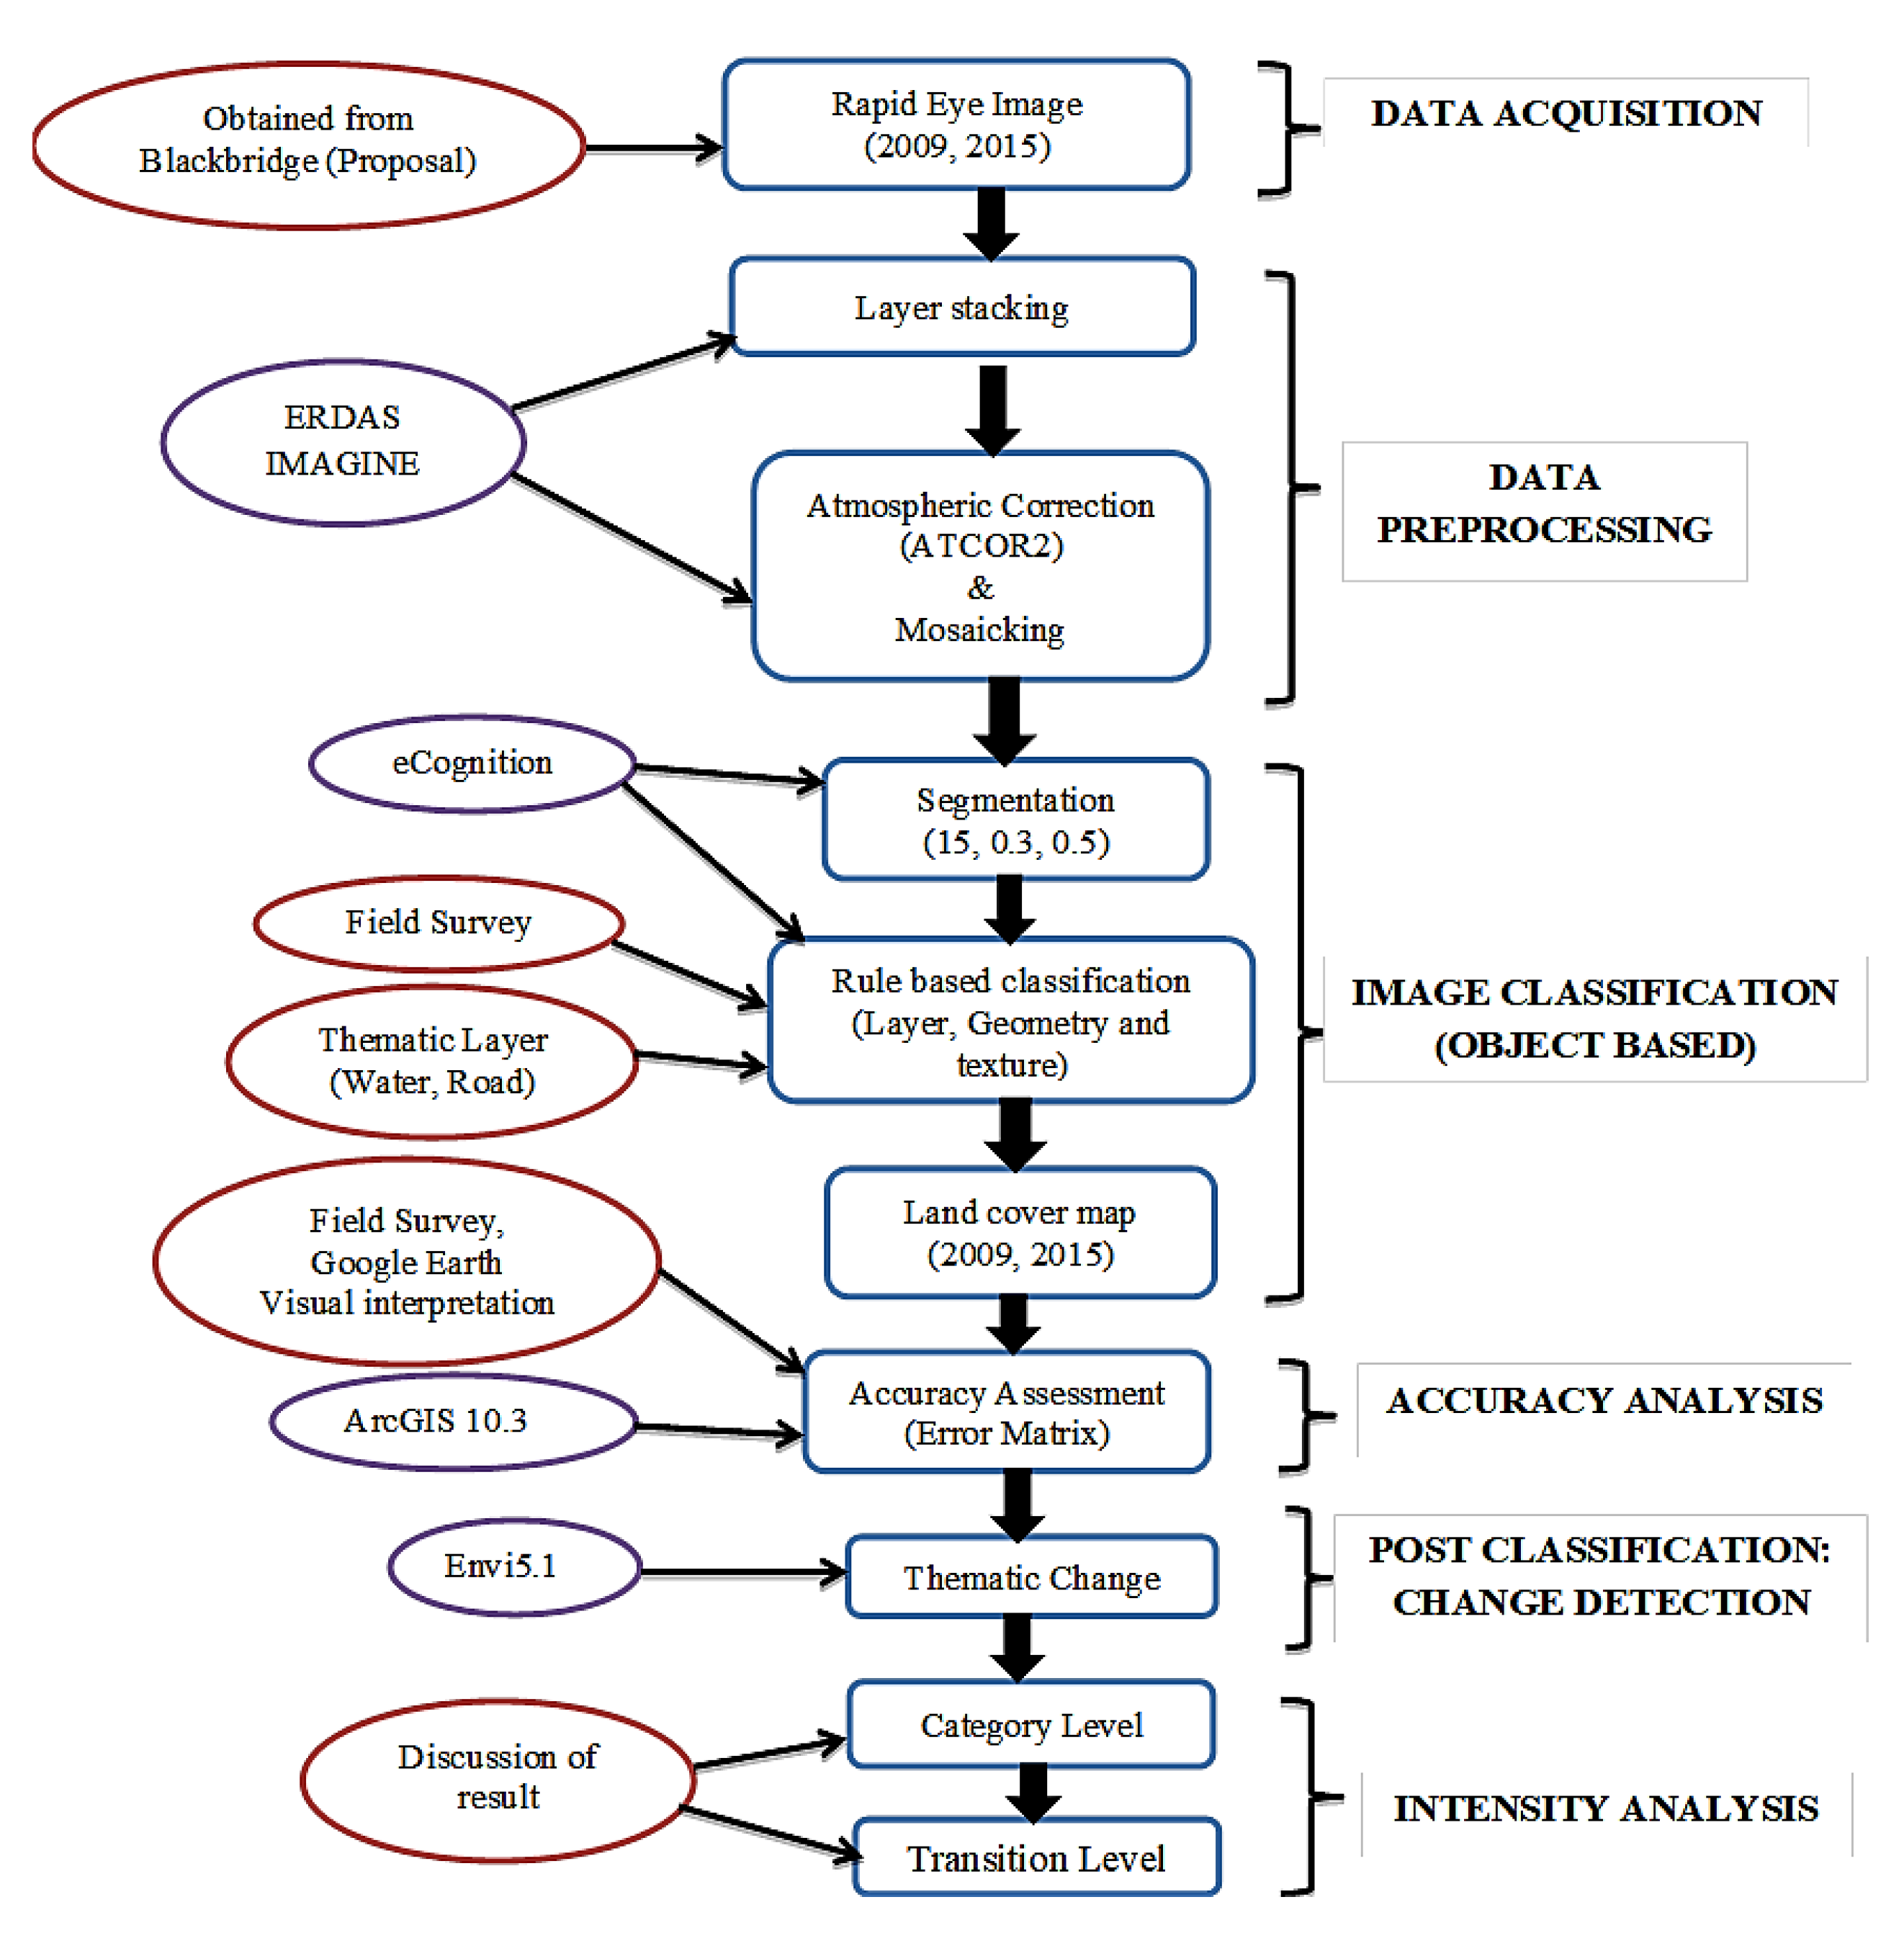
3. Overview of Methodology

This section discusses the methodology utilized in this study. The flowchart represents the successive steps taken in this study (Figure 4).

3.1. Data Processing

Change detection from satellite imageries could be from pre-classification or post-classification. This study utilized the post-classification techniques to detect changes in the land use maps developed from the satellite imageries acquired at different dates. This technique includes: data pre-processing, image classification, accuracy assessment, and change detection [35]. The post classification is widely utilized because it provides a matrix of land transition among different categories [32], which serves as the input data for the intensity analysis. The thematic change workflow in the ENVI software package [52] was utilized to detect spatial changes in the extent of slums and other identified LULC in the maps produced for 2009 and 2015.

3.2. Classification of Imagery

The images were analyzed using the object-based image analysis (OBIA). OBIA is conducted in two stages: segmentation of the image into homogenous objects based on their spectral and spatial/contextual properties, and classification of identified objects into different land use or land cover categories [53,54] The subset images were segmented using the multi-resolution segmentation algorithm in the eCognition Developer software [55], using scale factor, shape, and compactness values of 15, 0.3, and 0.5, respectively. Additionally, a weight of 2 was assigned to band 3 (red) of the image, because the reflectance of built-up areas is high in this band. Existing road and water layers were used as predefined boundaries for the segmentation process. The classification of the segmented image was carried out using the rule set classification method, which allows the combination of OBIA with expert knowledge and integration with geographic information systems data to produce a better result, especially in the extraction of slums from other land use types in urban areas [56].
Before classifying the image, a reconnaissance survey and review of the literature were used to develop a slum ontology [57] to serve as a comprehensive basis for the image based classification of slum in the study area. This includes:
At the environs level:
  • Nearness to water bodies could not be used as some of the planned communities were also located close to the water bodies;
  • Some of the slums were located close to employment opportunities in Lagos (markets, central business district, industrial sites etc.);
  • Need to combine the slums and squatter settlement as they have similar manifestations in Lagos;
  • Most of the squatter settlements along the expressway have been demolished by precedent governments; and
  • In some parts of the city, there were no distinct boundaries between the planned and the slum communities.
At the settlement level:
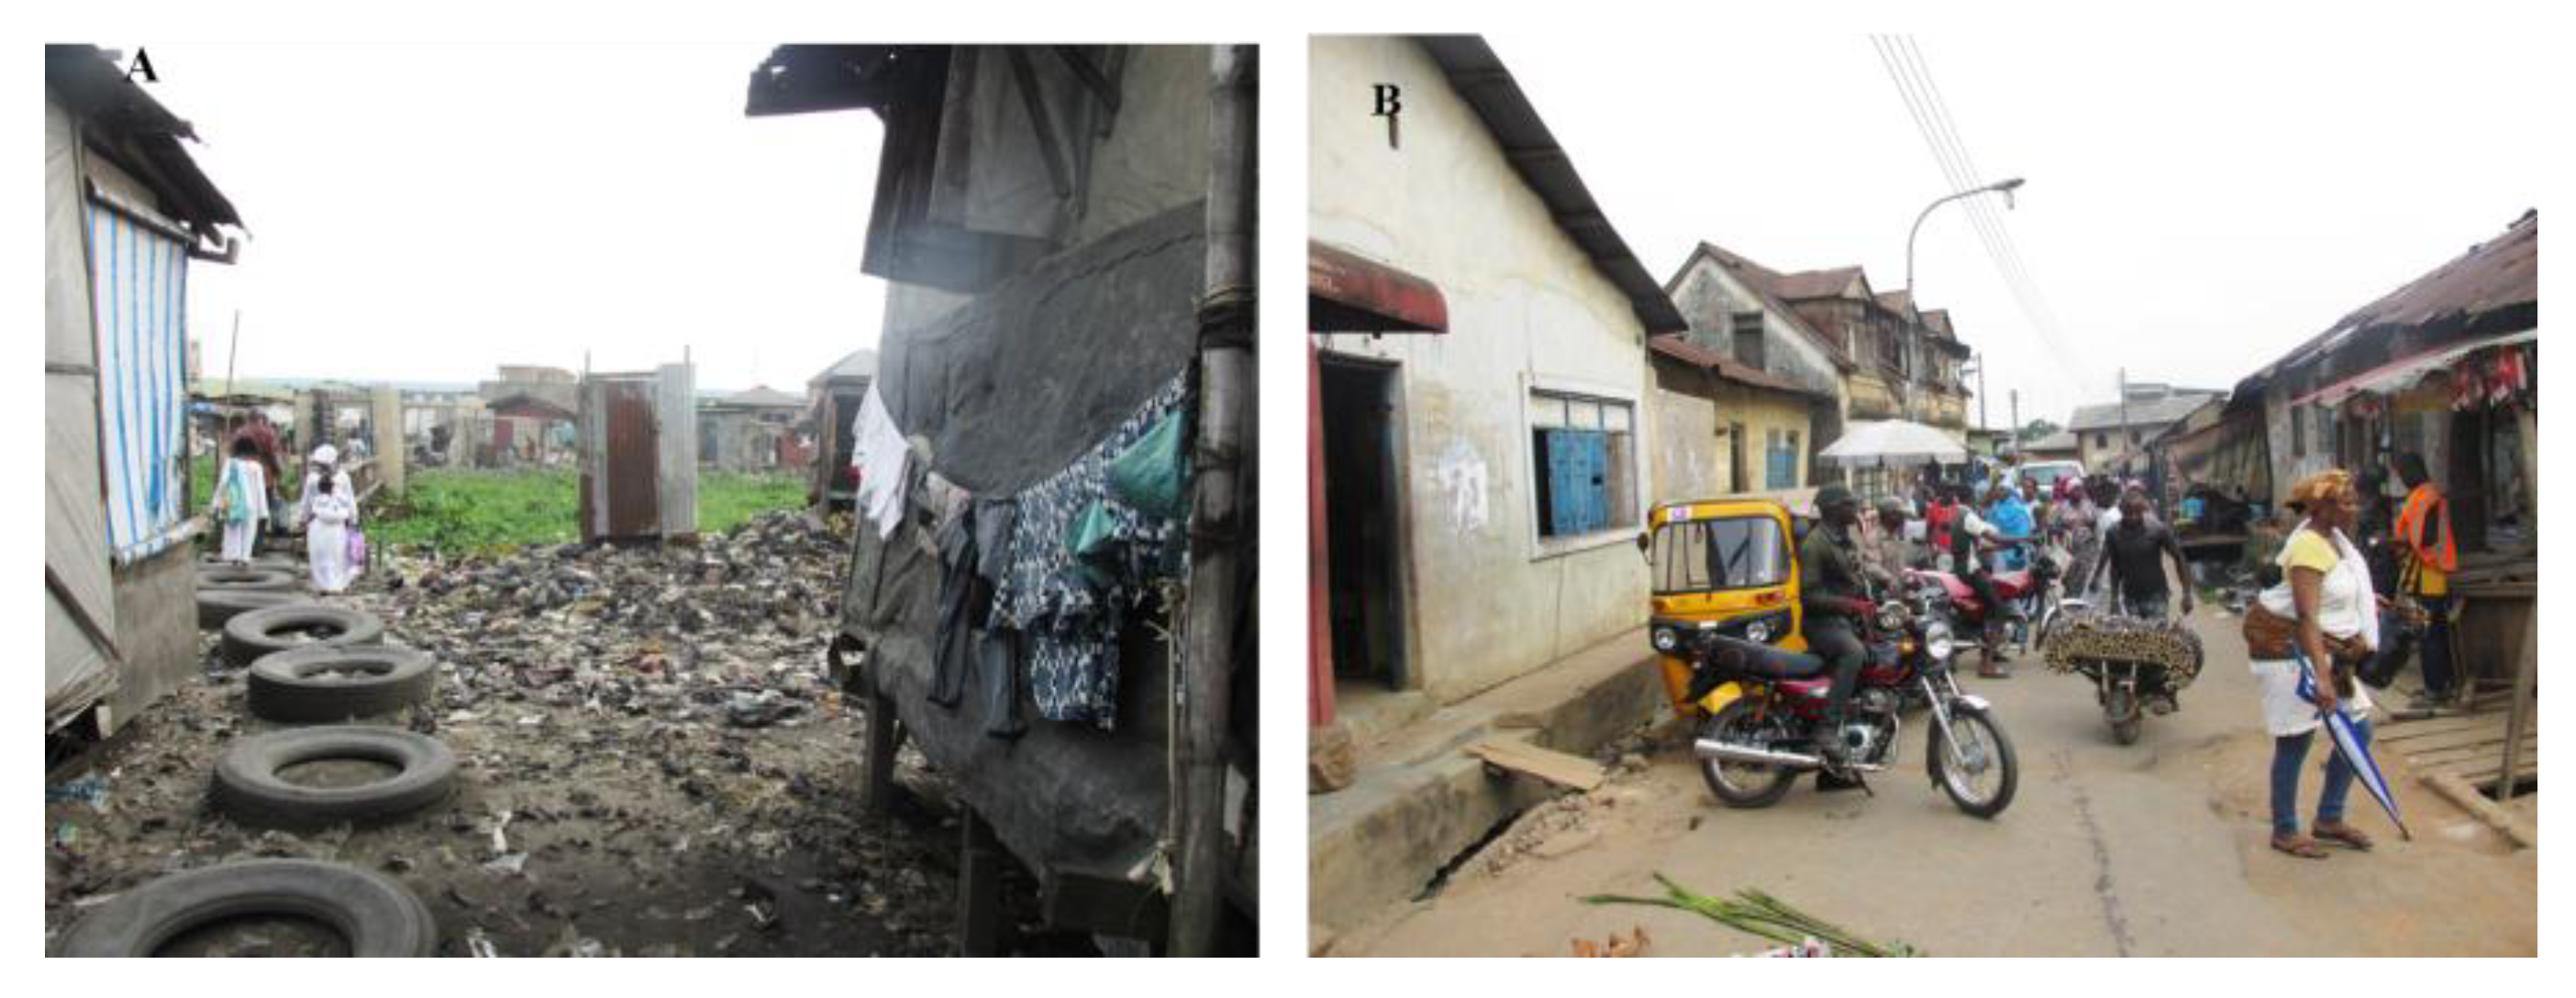
  • Most of the slums were highly compacted; and
  • The shape of the slums were irregular.
At the object level:
  • Roof type could be used to determine the use of some buildings in the study area; and
  • Although some of the slum communities have paved roads, unpaved roads and footpath were important observations to identify slums in Lagos.
The implication of these observations was that some of the rules utilized in the extraction of slums from satellite imagery, e.g., closeness to rivers or roads, were not entirely applicable in Lagos. Hence, extractions of most of the slum buildings in the study area were based on the textural properties of objects at the settlement level. Table 2 presents the categorization and analysis of the observations listed above based on the ontological framework and its OBIA parameterization.
Using trial and error techniques and studies [24,58,59,60], rule sets were developed to classify the images into classes, i.e., background, water bodies, slum, road, open space, vegetated area, and other urban areas. The 2015 image was classified first and the rule set transferred to the 2009 image with minor changes in some of the values. Table 3 and Table 4 describe the parameters used for the classification, and summarize what each class represents and the rule set utilized for their extraction from other land use types in the study area, respectively.
The first step taken was the classification of the non-built up area, which includes background, water, vegetated area, open space, and road. The background was classified as anything with a mean blue value of zero. The existing water polygon could not be utilized because of the encroachment of other land use categories on the water bodies, hence, a mean NIR value of less than 1075 for 2015 and 840 for 2009 was used to classify water. The thematic layer of road available was a line vector map, it was only able to classify the object under it and, to classify the exempted part, the density and relative border to the already-classified road was utilized. Normalized difference vegetation index (NDVI) values above 0.34 were used to classify vegetated area. Open space was classified using an NDVI value less than 0.34, but greater than 0.23. Additionally GLCMBLUE_CONTRAST below 65 was classified as open space.
Brightness, GLCMBLUE_CONTRAST, GLCMRED_CONTRAST, and RatioRED values greater than 1700, 400, 420, and 0.219, respectively, were used to classify other urban areas. The available thematic layer for the public and industrial old buildings was also utilized to classify other urban areas in the study area. Slums were classified using the Min overlap of the water layer on the remaining unclassified objects; GLCMBLUE_CONTRAST between 210 and 65; GLCM RED_CONTRAST above 200, and mean red between 1050 and 900. The rest of the unclassified objects were assigned to the other urban area class. The classified objects were exported from eCognition to ArcGIS [61] for accuracy assessment.

3.3. Accuracy Assessment

A thematic map derived from a classification is considered accurate if it provides an unbiased representation of the land cover it portrays [62]. An extensive field survey was conducted in the study area for verification of the developed LULC maps. Although 600 points (100 from each local government) were randomly selected using ArcGIS Random points, only 449 and 455 reference points were utilized for the 2009 and 2015 images, respectively (Table 5). This was due to inaccessibility to some of the sites and the unstable nature of some of the reference points. The assessment was complemented with the support of the historical view tool in Google Earth for 2009 and 2015, especially for the 2009 classification of water and vegetated area. Using these reference points, an error matrix was generated in ArcGis 10.3 to calculate the producer, user, and overall accuracy of the LULC maps [61]. Finally, a concordance analysis was implemented, and the Cohen kappa statistic computed [63].

3.4. Intensity Analysis

Since slums have distinctive spatial characteristics [19], intensity analysis can help to understand the underlying processes leading to their observed growth pattern. Intensity analysis compares the predicted annual uniform rate of change, the rate that will exist if the annual changes were distributed uniformly across the entire time extent, against the observed annual rate of change among categories [39]. The intensity analysis is based on the availability of maps of different time periods for the same sites containing the same land use categories. The application and limitations of intensity analysis have been discussed in several studies (see [35,38,39,40,41]).
As this study focused on one time interval (2009–2015), the category and transition levels of the intensity analysis were employed. The category level examines the size and speed of loss and gain for each land use category within a time interval, implying the gain (Gtj) or loss (Lti). It also gives information on which land use category is dormant or active during that time interval (Equations (1) and (2)). The transition level gives information if a land use category is being targeted or ignored during a time interval. It is calculated in two parts: transition “to” and transition “from”. (i) The transition “to” examines other categories transition to a land use category “n” during a time interval (Equation (3)), and the expected uniform intensity of transition to (Equation (4)).; and (ii) the transition “from”, which examines how other land use categories transit from category “m” (Equation (5)); similarly, the uniform intensity of transition “from” is also calculated (Equation (6)).
Category level:
G t j = [ ( i = 1 J C t i j ) C t j j ] / Y t + 1 Y t i = 1 J C t i j × 100 %  
L t i = [ ( j = 1 J C t i j ) C t i i ] / Y t + 1 Y t j = 1 J C t i j × 100 %  
Transition level:
R t i n = C t i n / ( Y t + 1 Y t ) j = 1 J C t i j × 100 %  
W t n = = [ ( i = 1 J C t i n ) C t n n ] / ( Y t + 1 Y t ) j = 1 J [ ( i = 1 J C t i j ) C t n j ] × 100 %  
Q t m j = C t m j / ( Y t + 1 Y t ) i = 1 J C t i j × 100 %  
W t n = [ ( j = 1 J C t m j ) C t m m ] / ( Y t + 1 Y t ) i = 1 J [ ( j = 1 J C t i j ) C t i m ] × 100 %  
SymbolMeaning
JNumber of categories
iIndex for a category at the initial time point for a particular time interval;
jIndex for a category at the final time point for a particular time interval;
mIndex for the losing category in the transition of interest;
nIndex for the gaining category in the transition of interest;
TNumber of time points
tIndex for the initial time point of interval [Yt,Yt+1], where t ranges from 1 to T − 1;
YtYear at time point t
CijNumber of pixels that transition from category i at time Yt to category j at time Yt+1;
GtjAnnual intensity of gross gain of category j for time interval [Yt,Yt+1];
LtiAnnual intensity of gross loss of category i for time interval [Yt,Yt+1];
RtinAnnual intensity of transition from category i to category n during time interval [Yt,Yt+1] where in;
WtnValue of uniform intensity of transition to category n from all non-n categories at time Yt during time interval [Yt,Yt+1]
QtmjAnnual intensity of transition from category m to category j during time interval [Yt,Yt+1] where j m
VtmValue of uniform intensity of transition from category m to all non-m categories at time [Yt+1];during time interval [Yt,Yt+1];
The mathematical notation for intensity analysis. Source: ([38], p. 107).

4. Results

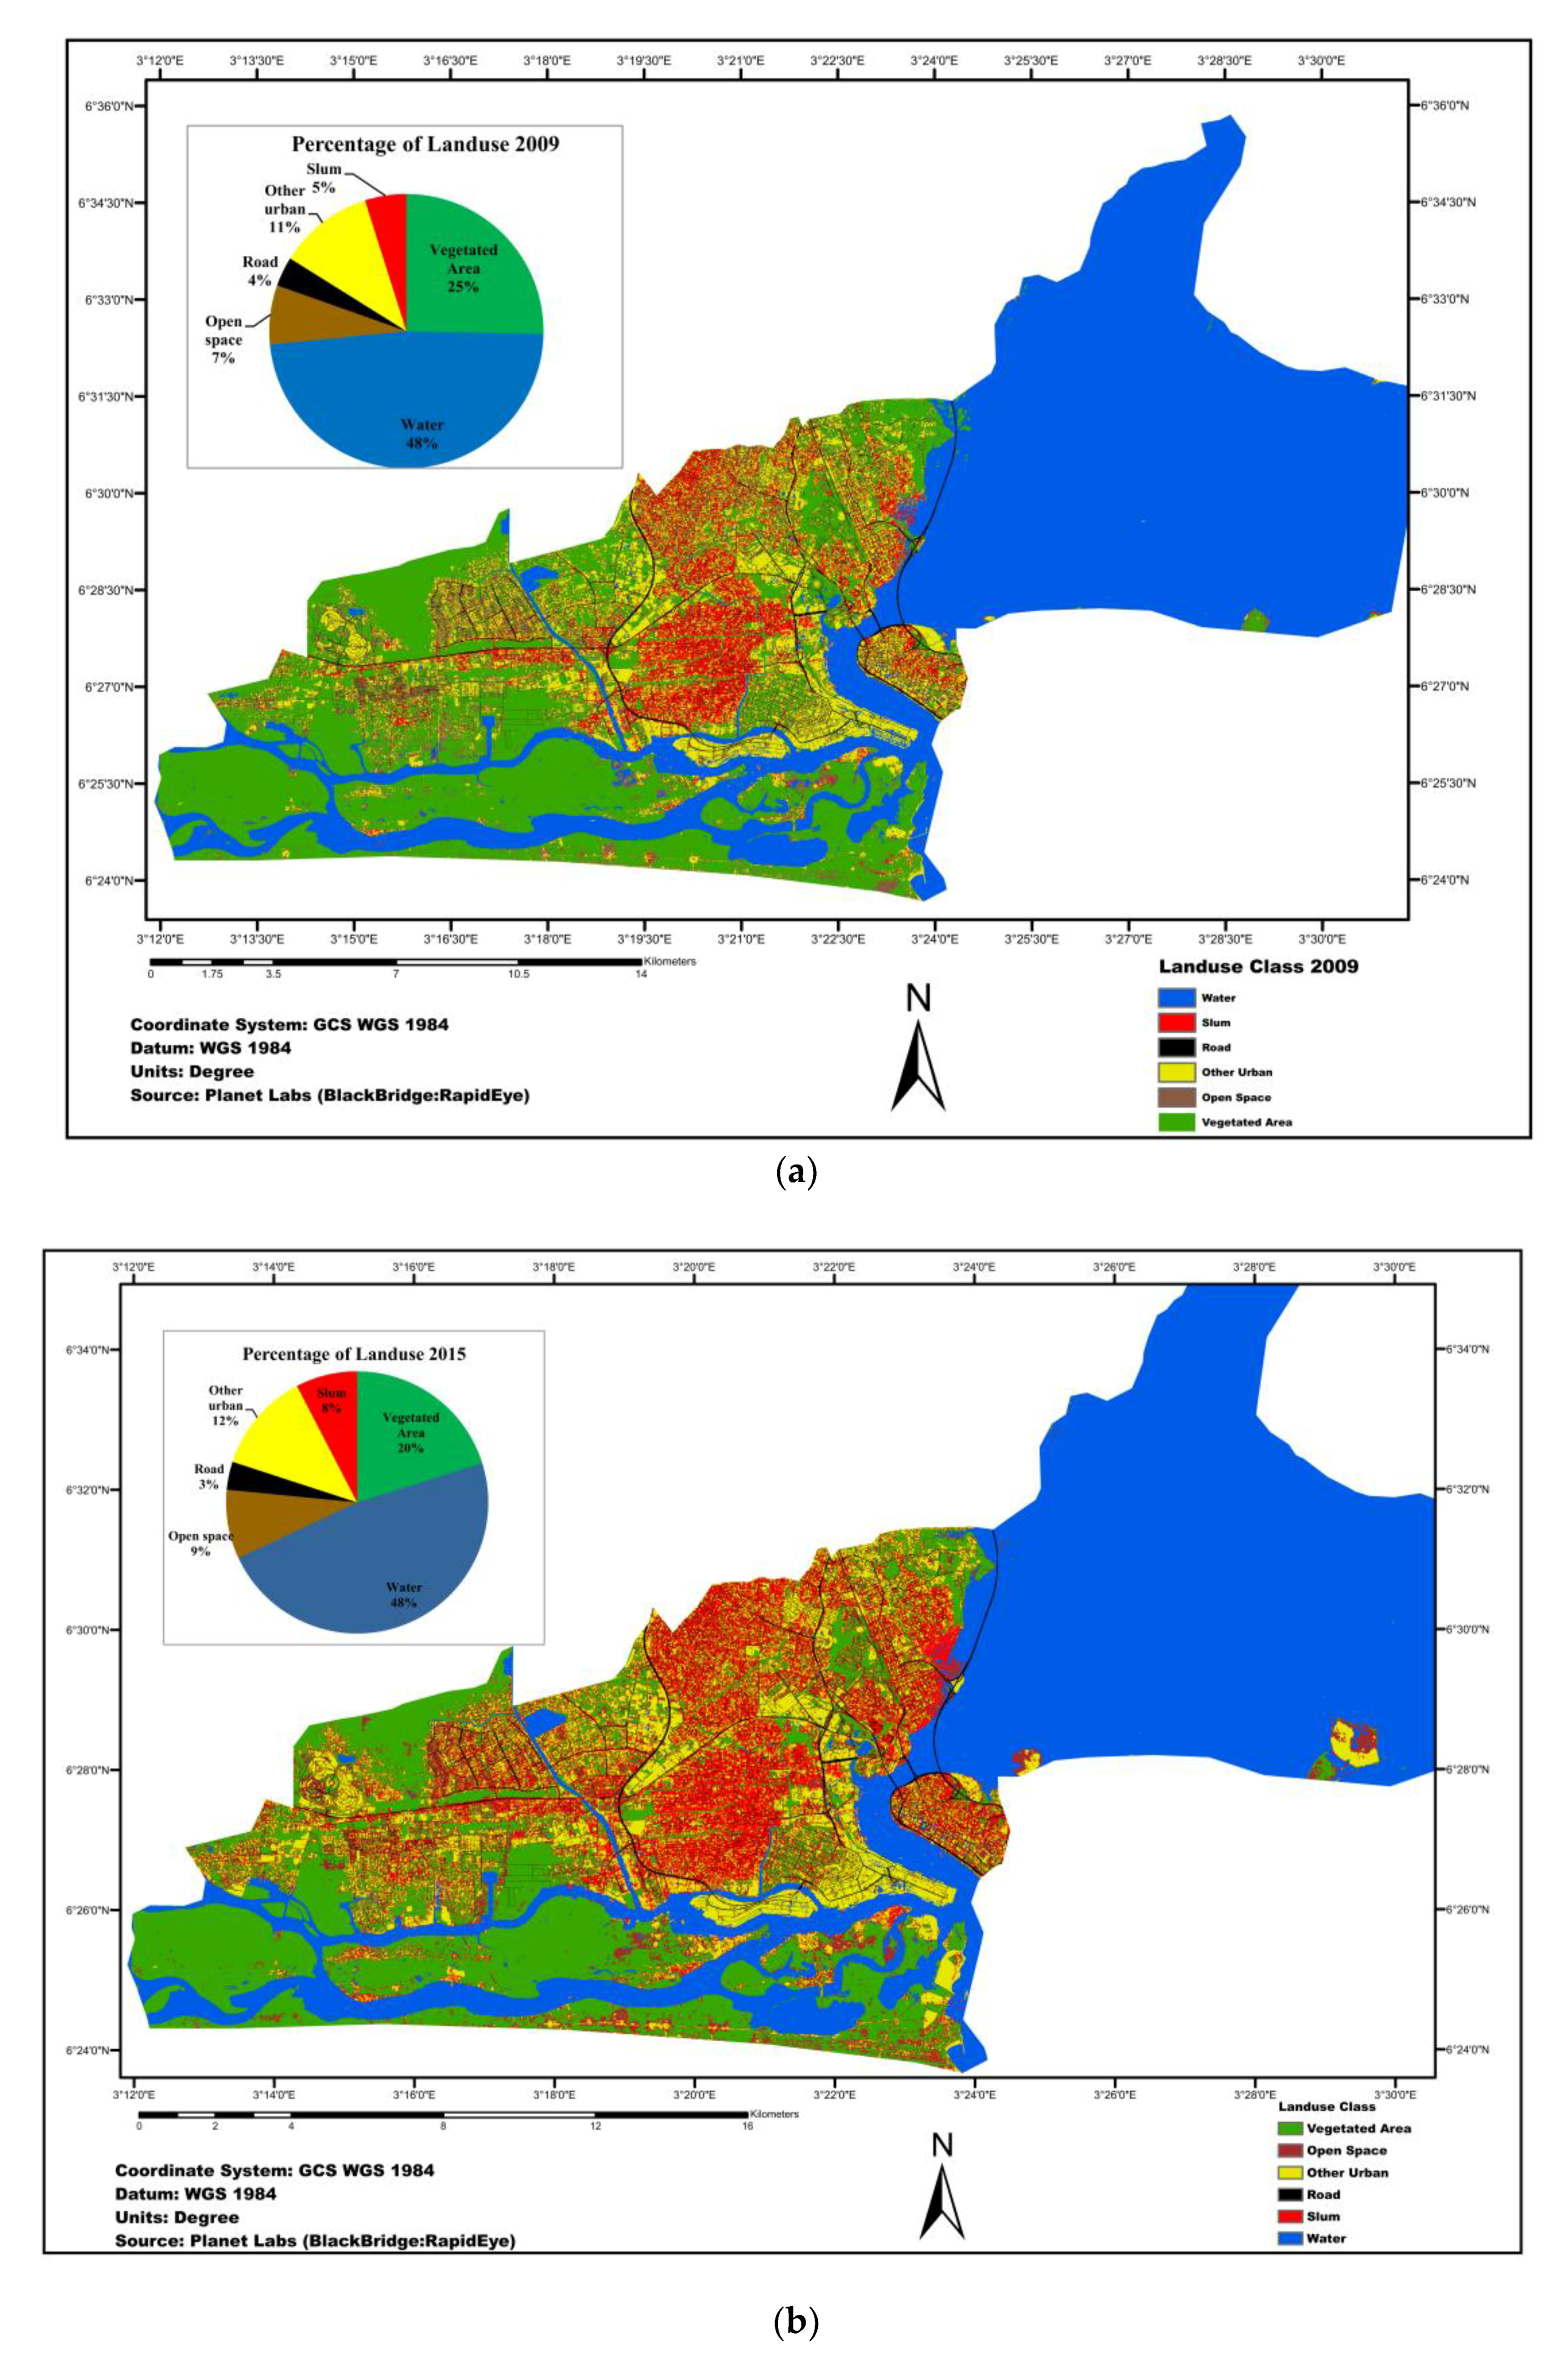
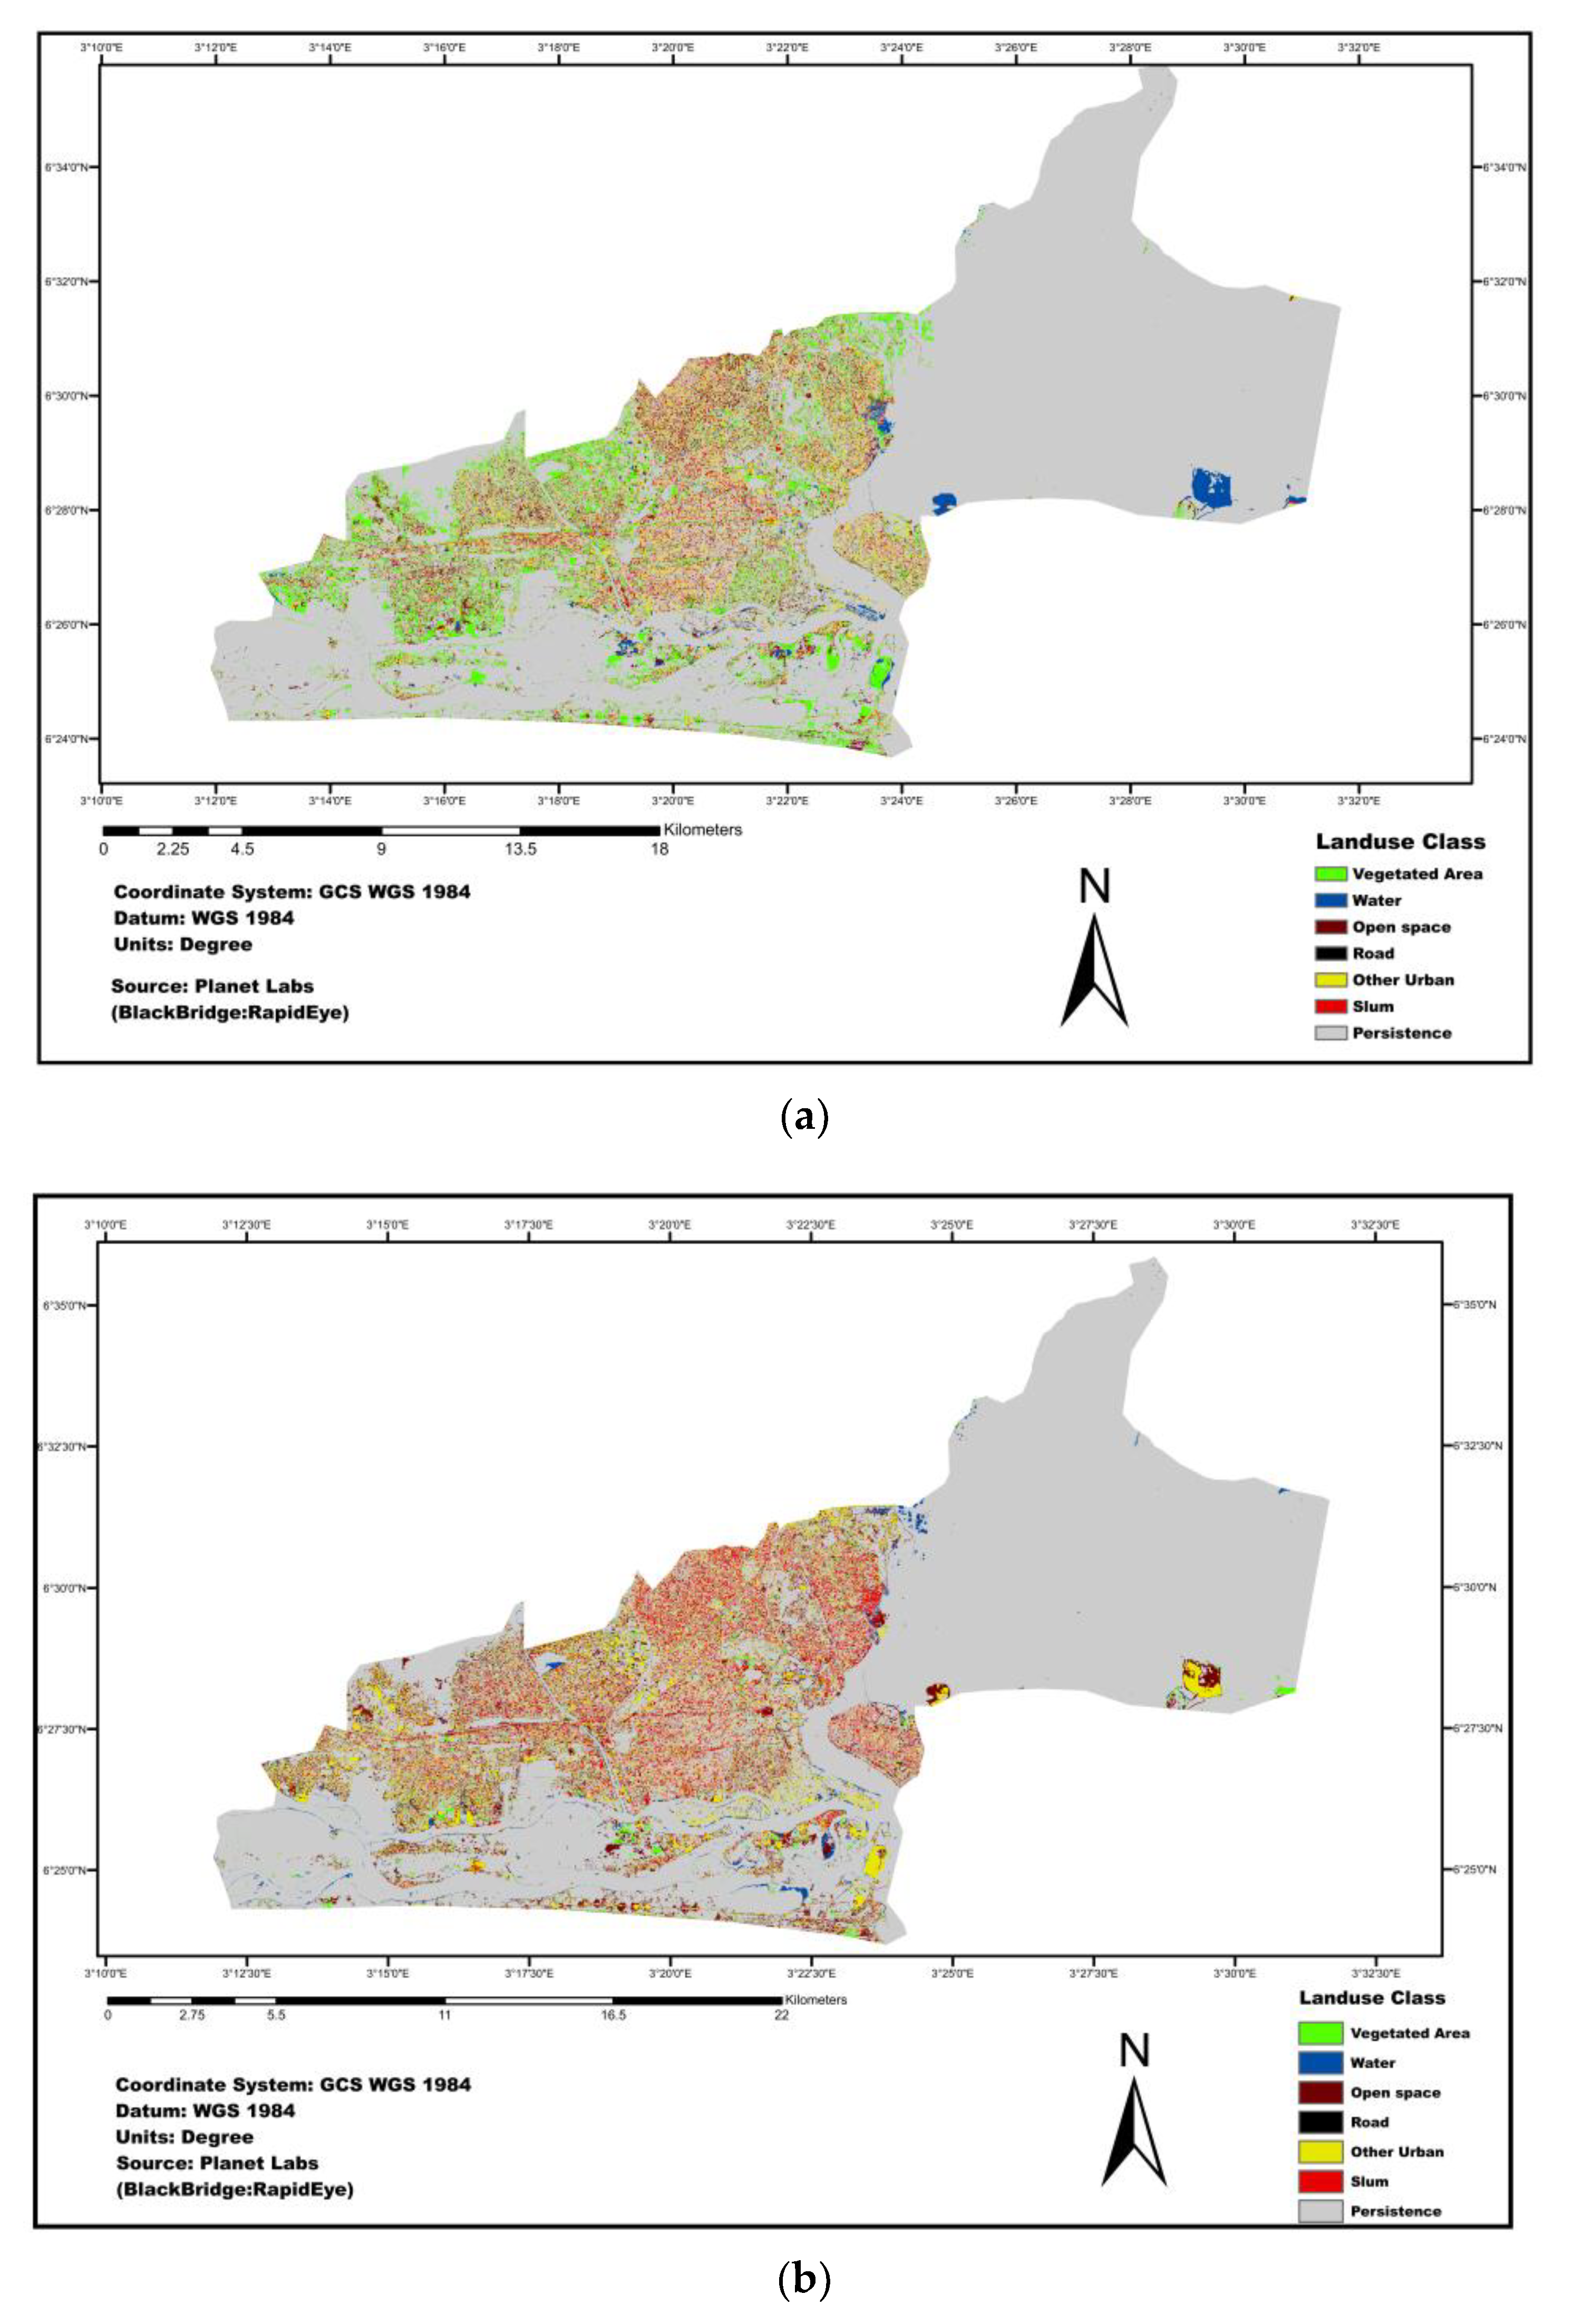
4.1. Production of Land Use and Landcover Maps and Accuracy Assessment

Based on the integration of OBIA with expert knowledge and GIS data, a LULC map of the study area was developed for 2009 and 2015. Six LULC (water, vegetated area, open space, other urban areas, roads, and slums) were derived from the RapidEye images (Figure 5a,b). Overall accuracies of 94% and 89% were estimated for the produced LULC maps of 2009 and 2015, respectively. Kappa coefficients of 0.9 and 0.86 were achieved for the 2009 and 2015 classified map, respectively. Furthermore, user and producer accuracies for each land use category were above 75% for the two maps, except for open space, which reached 66.1%, and which could be attributed to the heterogeneous nature of the land use class (Table 6).

4.2. Observed Patterns of Land Use and Land Cover Change Dynamics

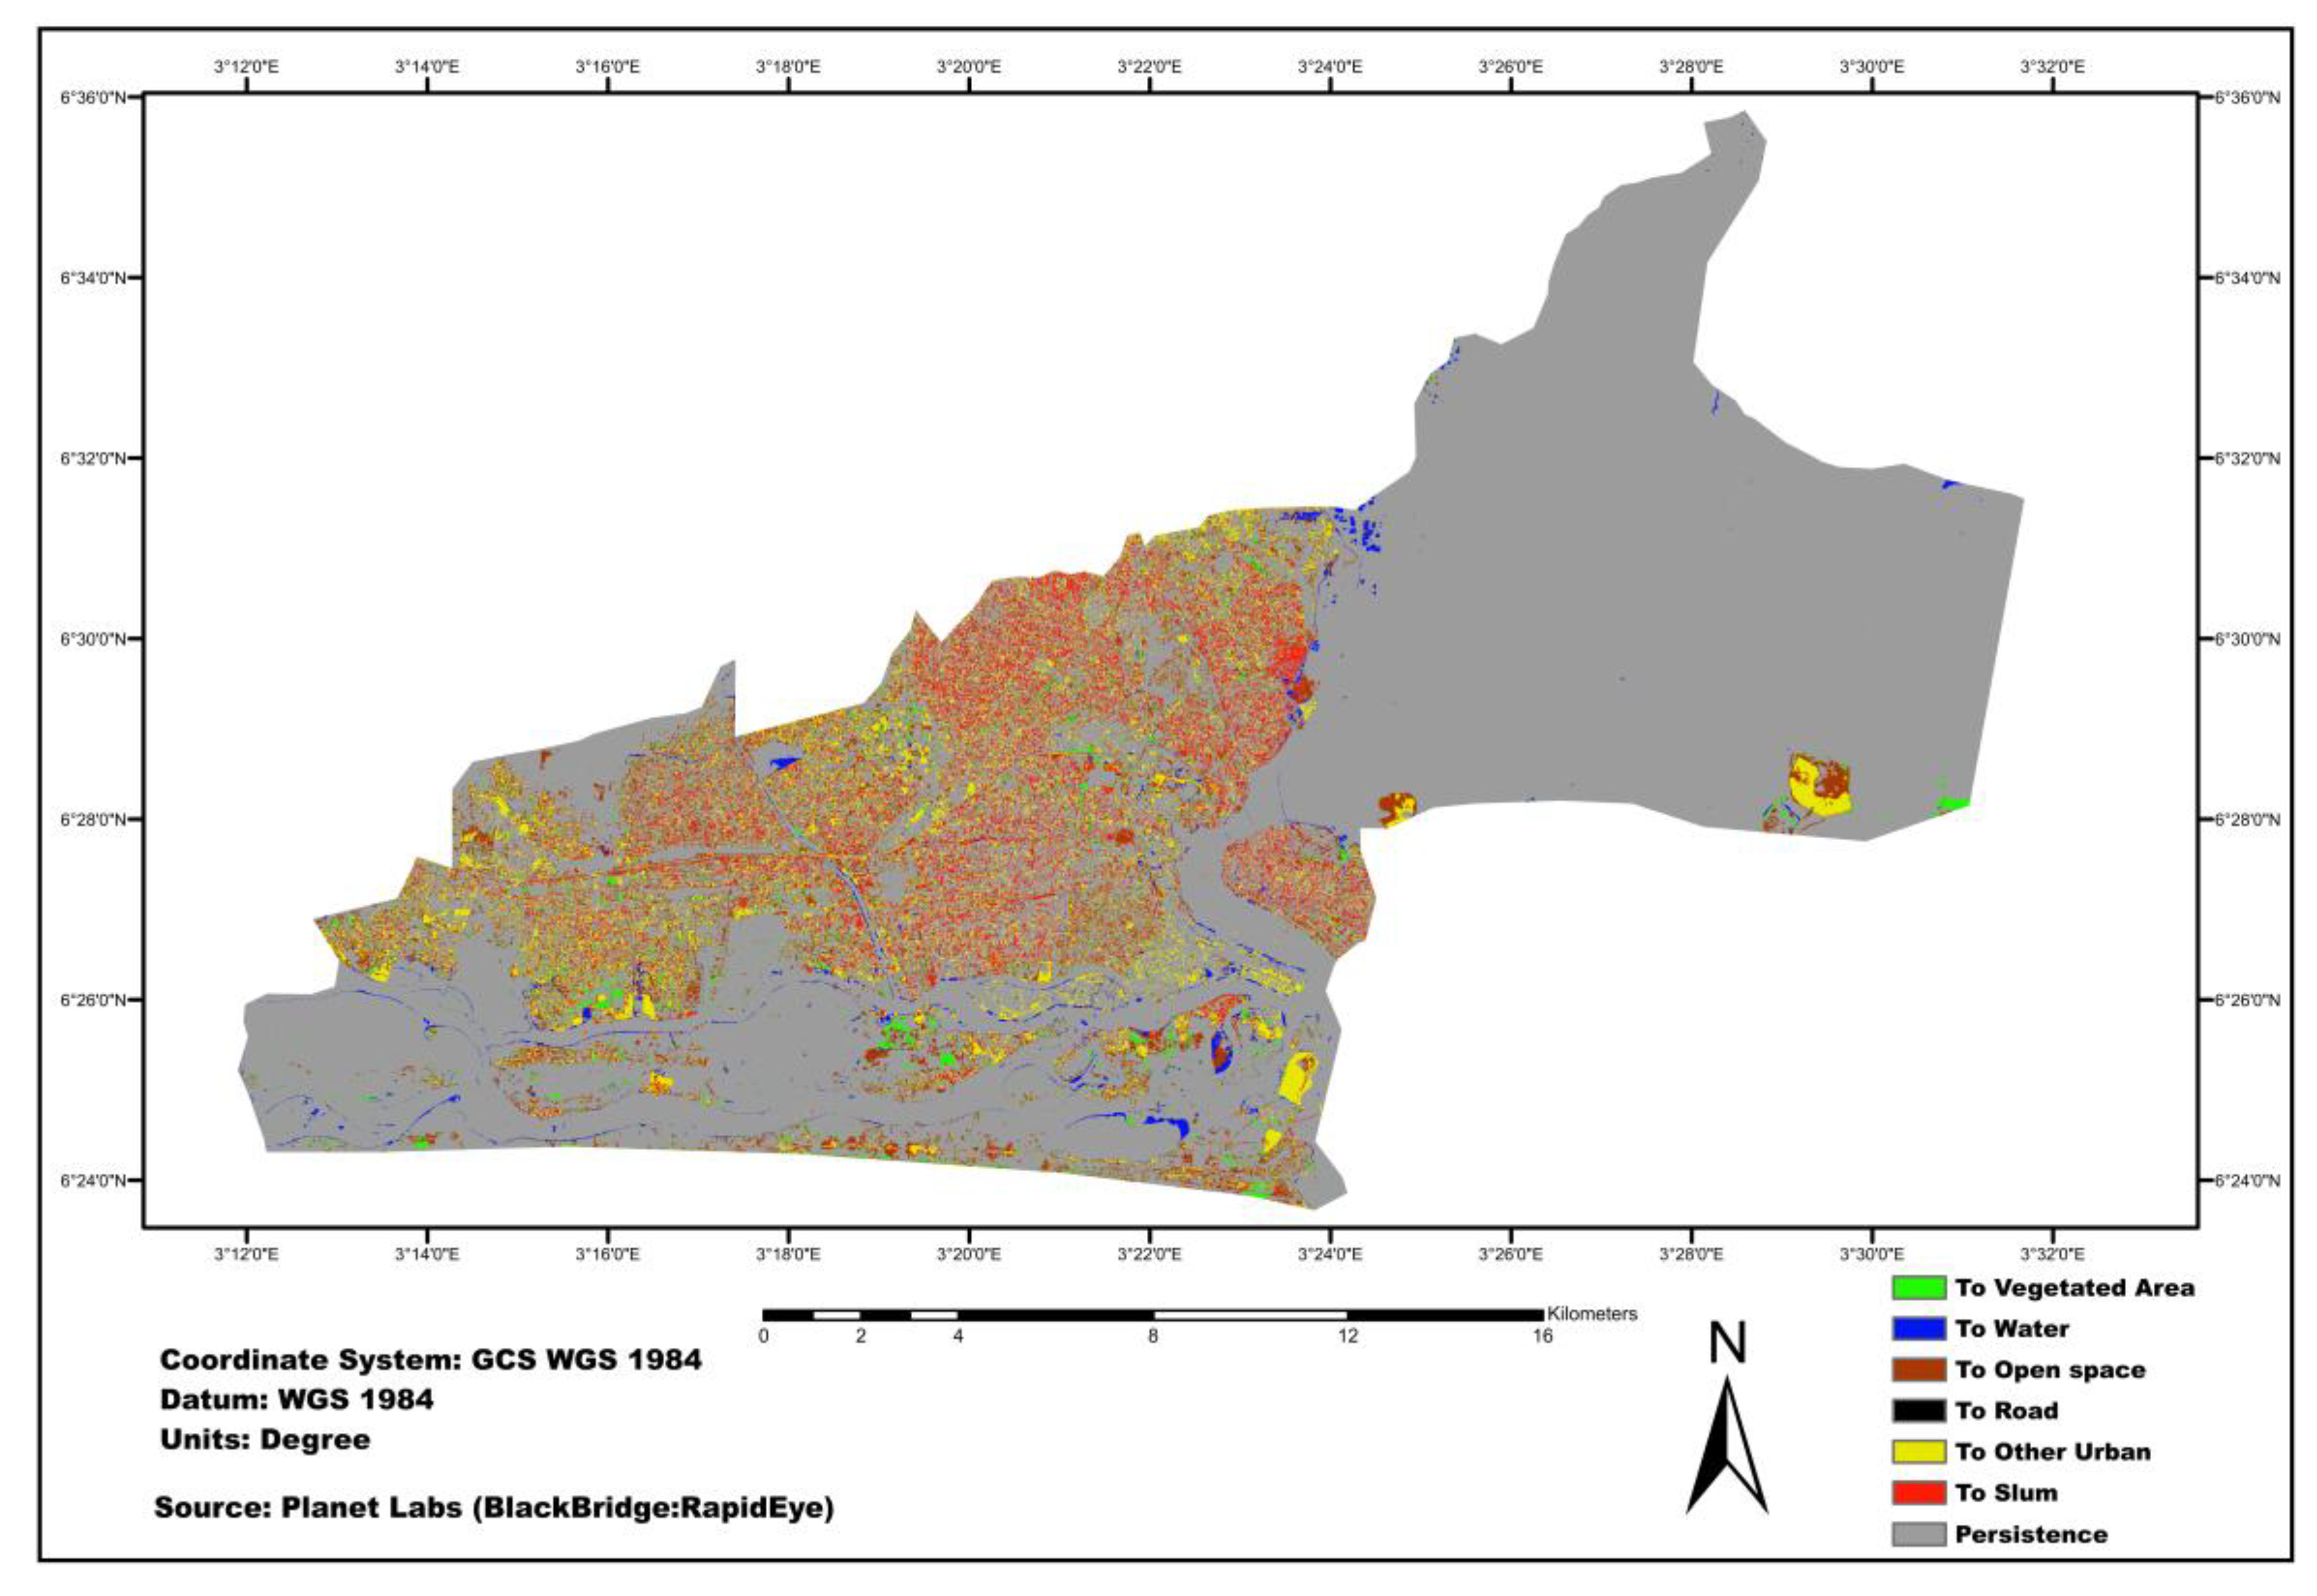
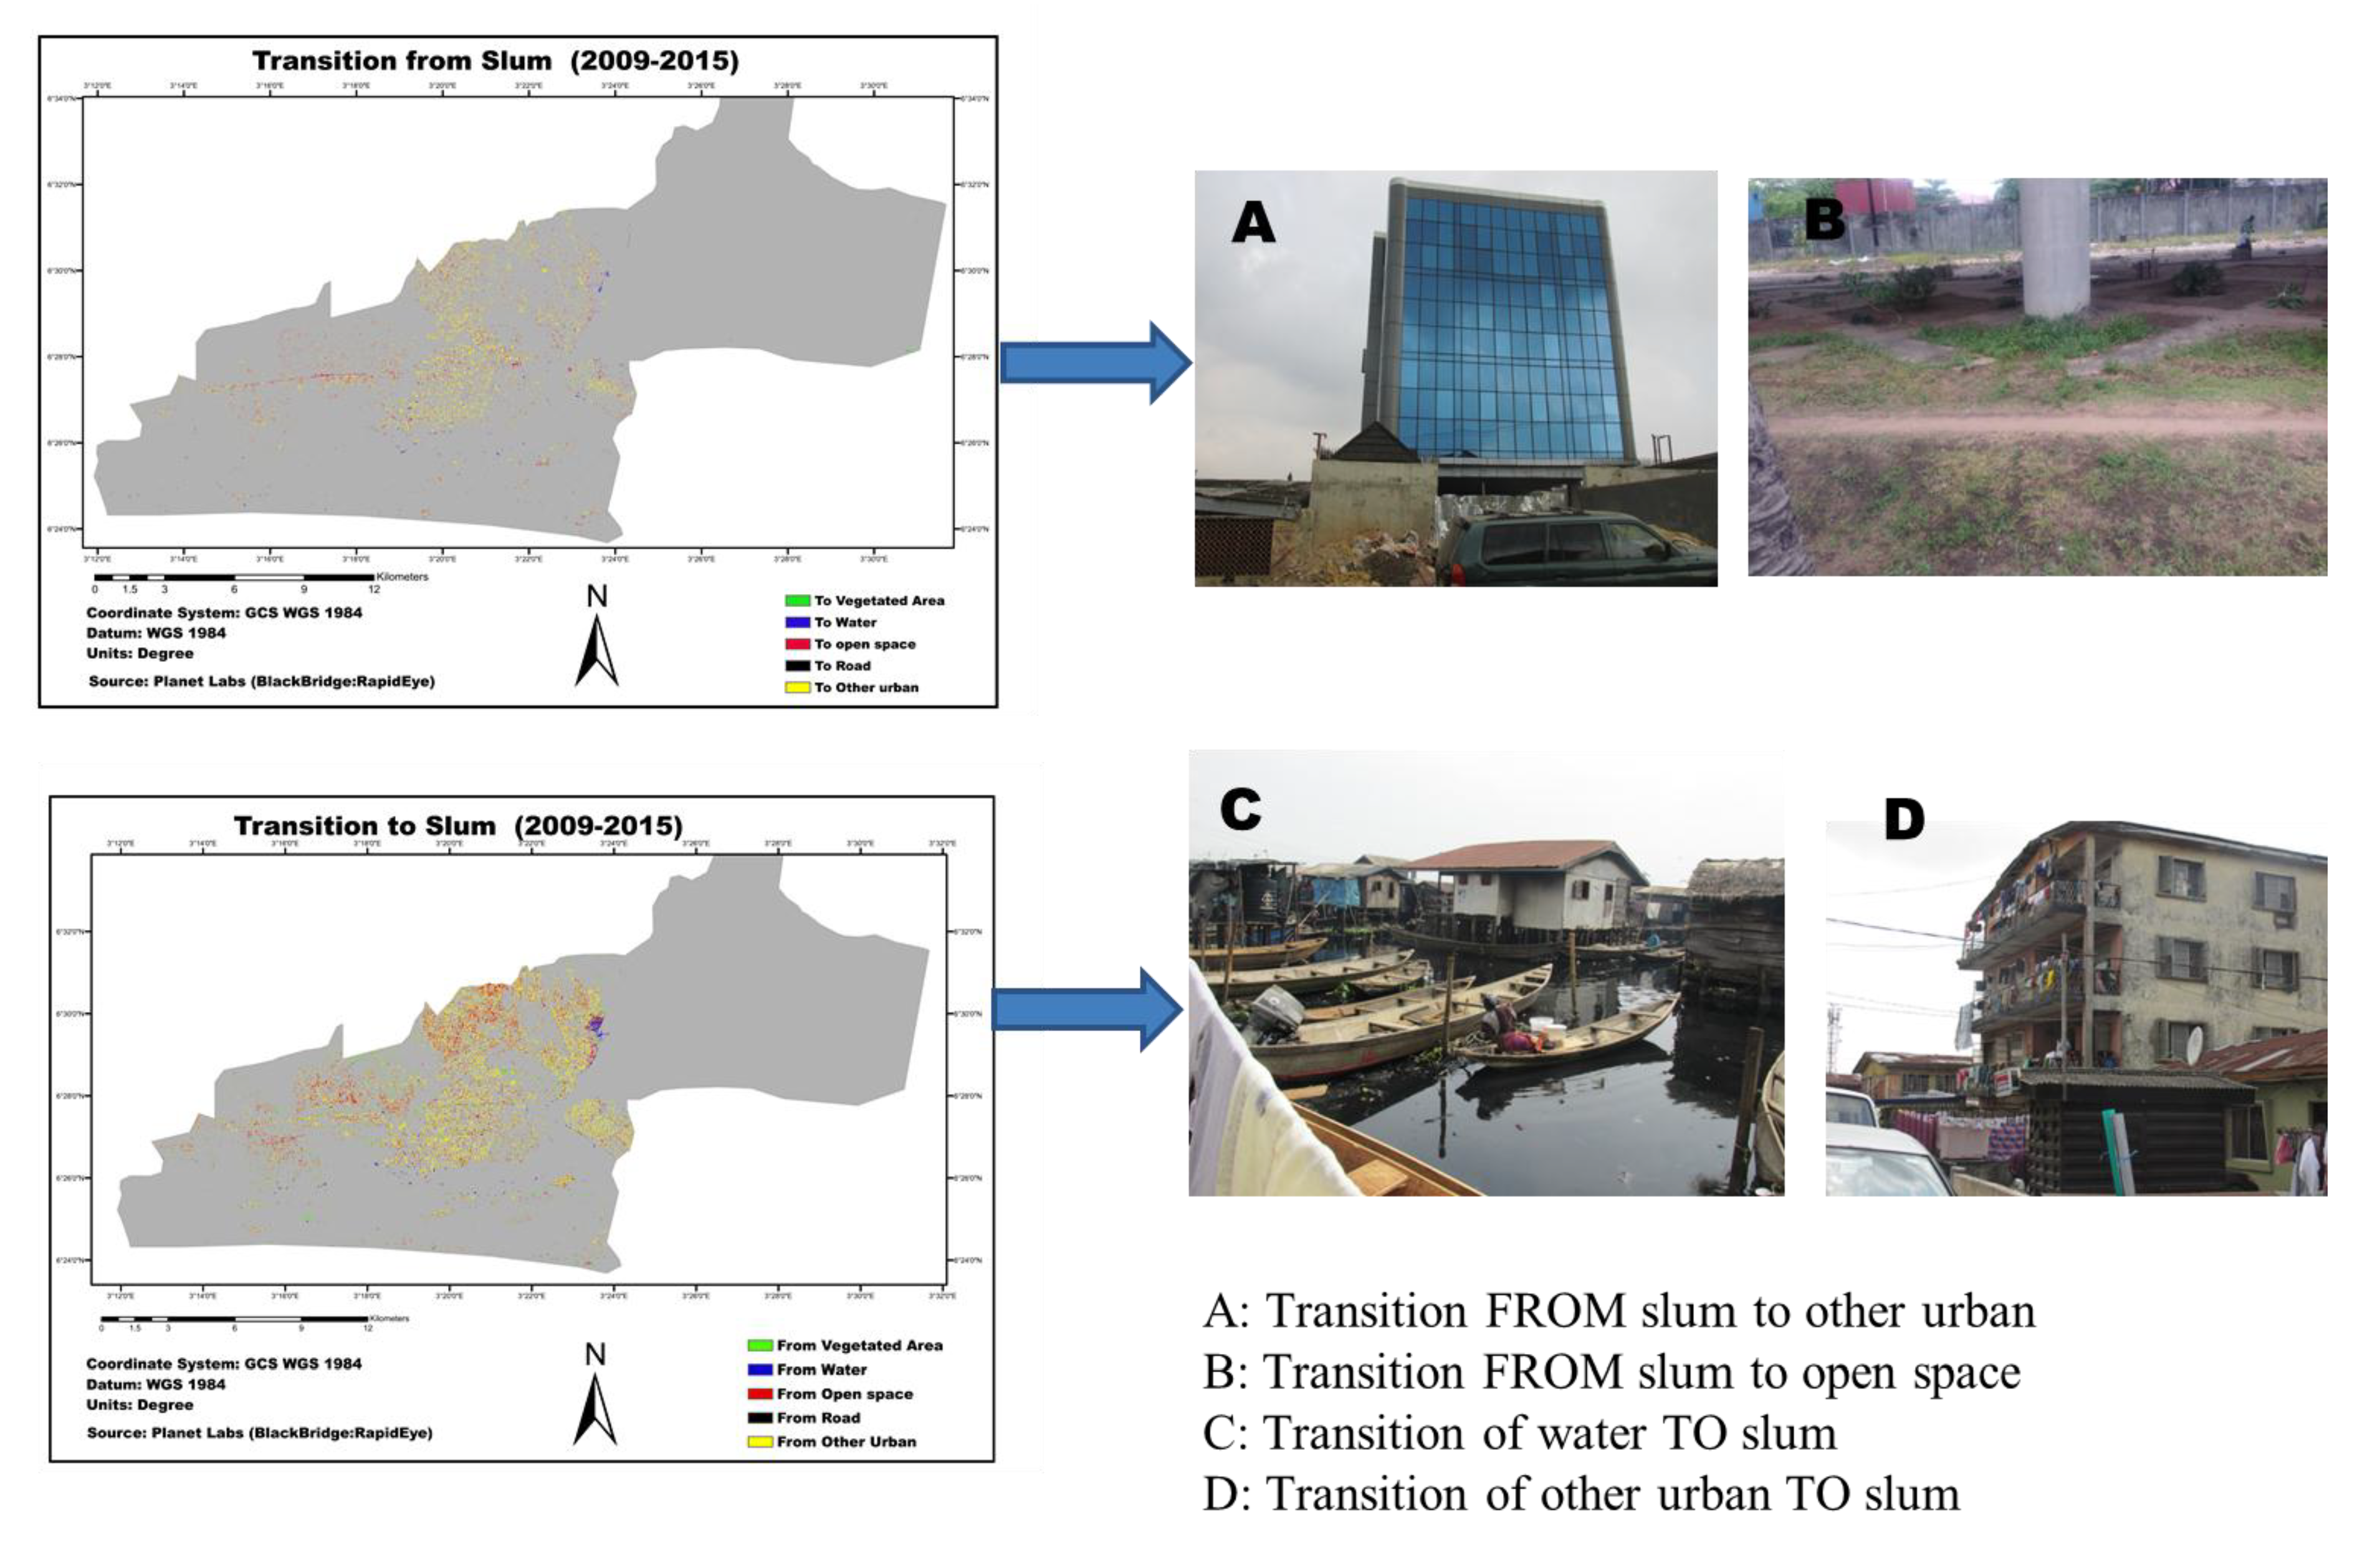
4.2.1. Visual Interpretation

Figure 6 presents a map showing the detected changes in the land use pattern in the study area during the time interval studied. The map gives information on the final state of the use of the land area. Transitions in all land use categories were observed during this time interval. Changes were observed in the proportion of areas covered by each land categories, except water, though small changes may have occurred. Furthermore, the area of change increased for slum, open space, roads, and other urban areas, while it decreased for vegetated areas. Although the proportion of the land area occupied by slums (Figure 5a,b) was smaller than other land use categories, its total net gain was higher compared to the others (Figure 7).

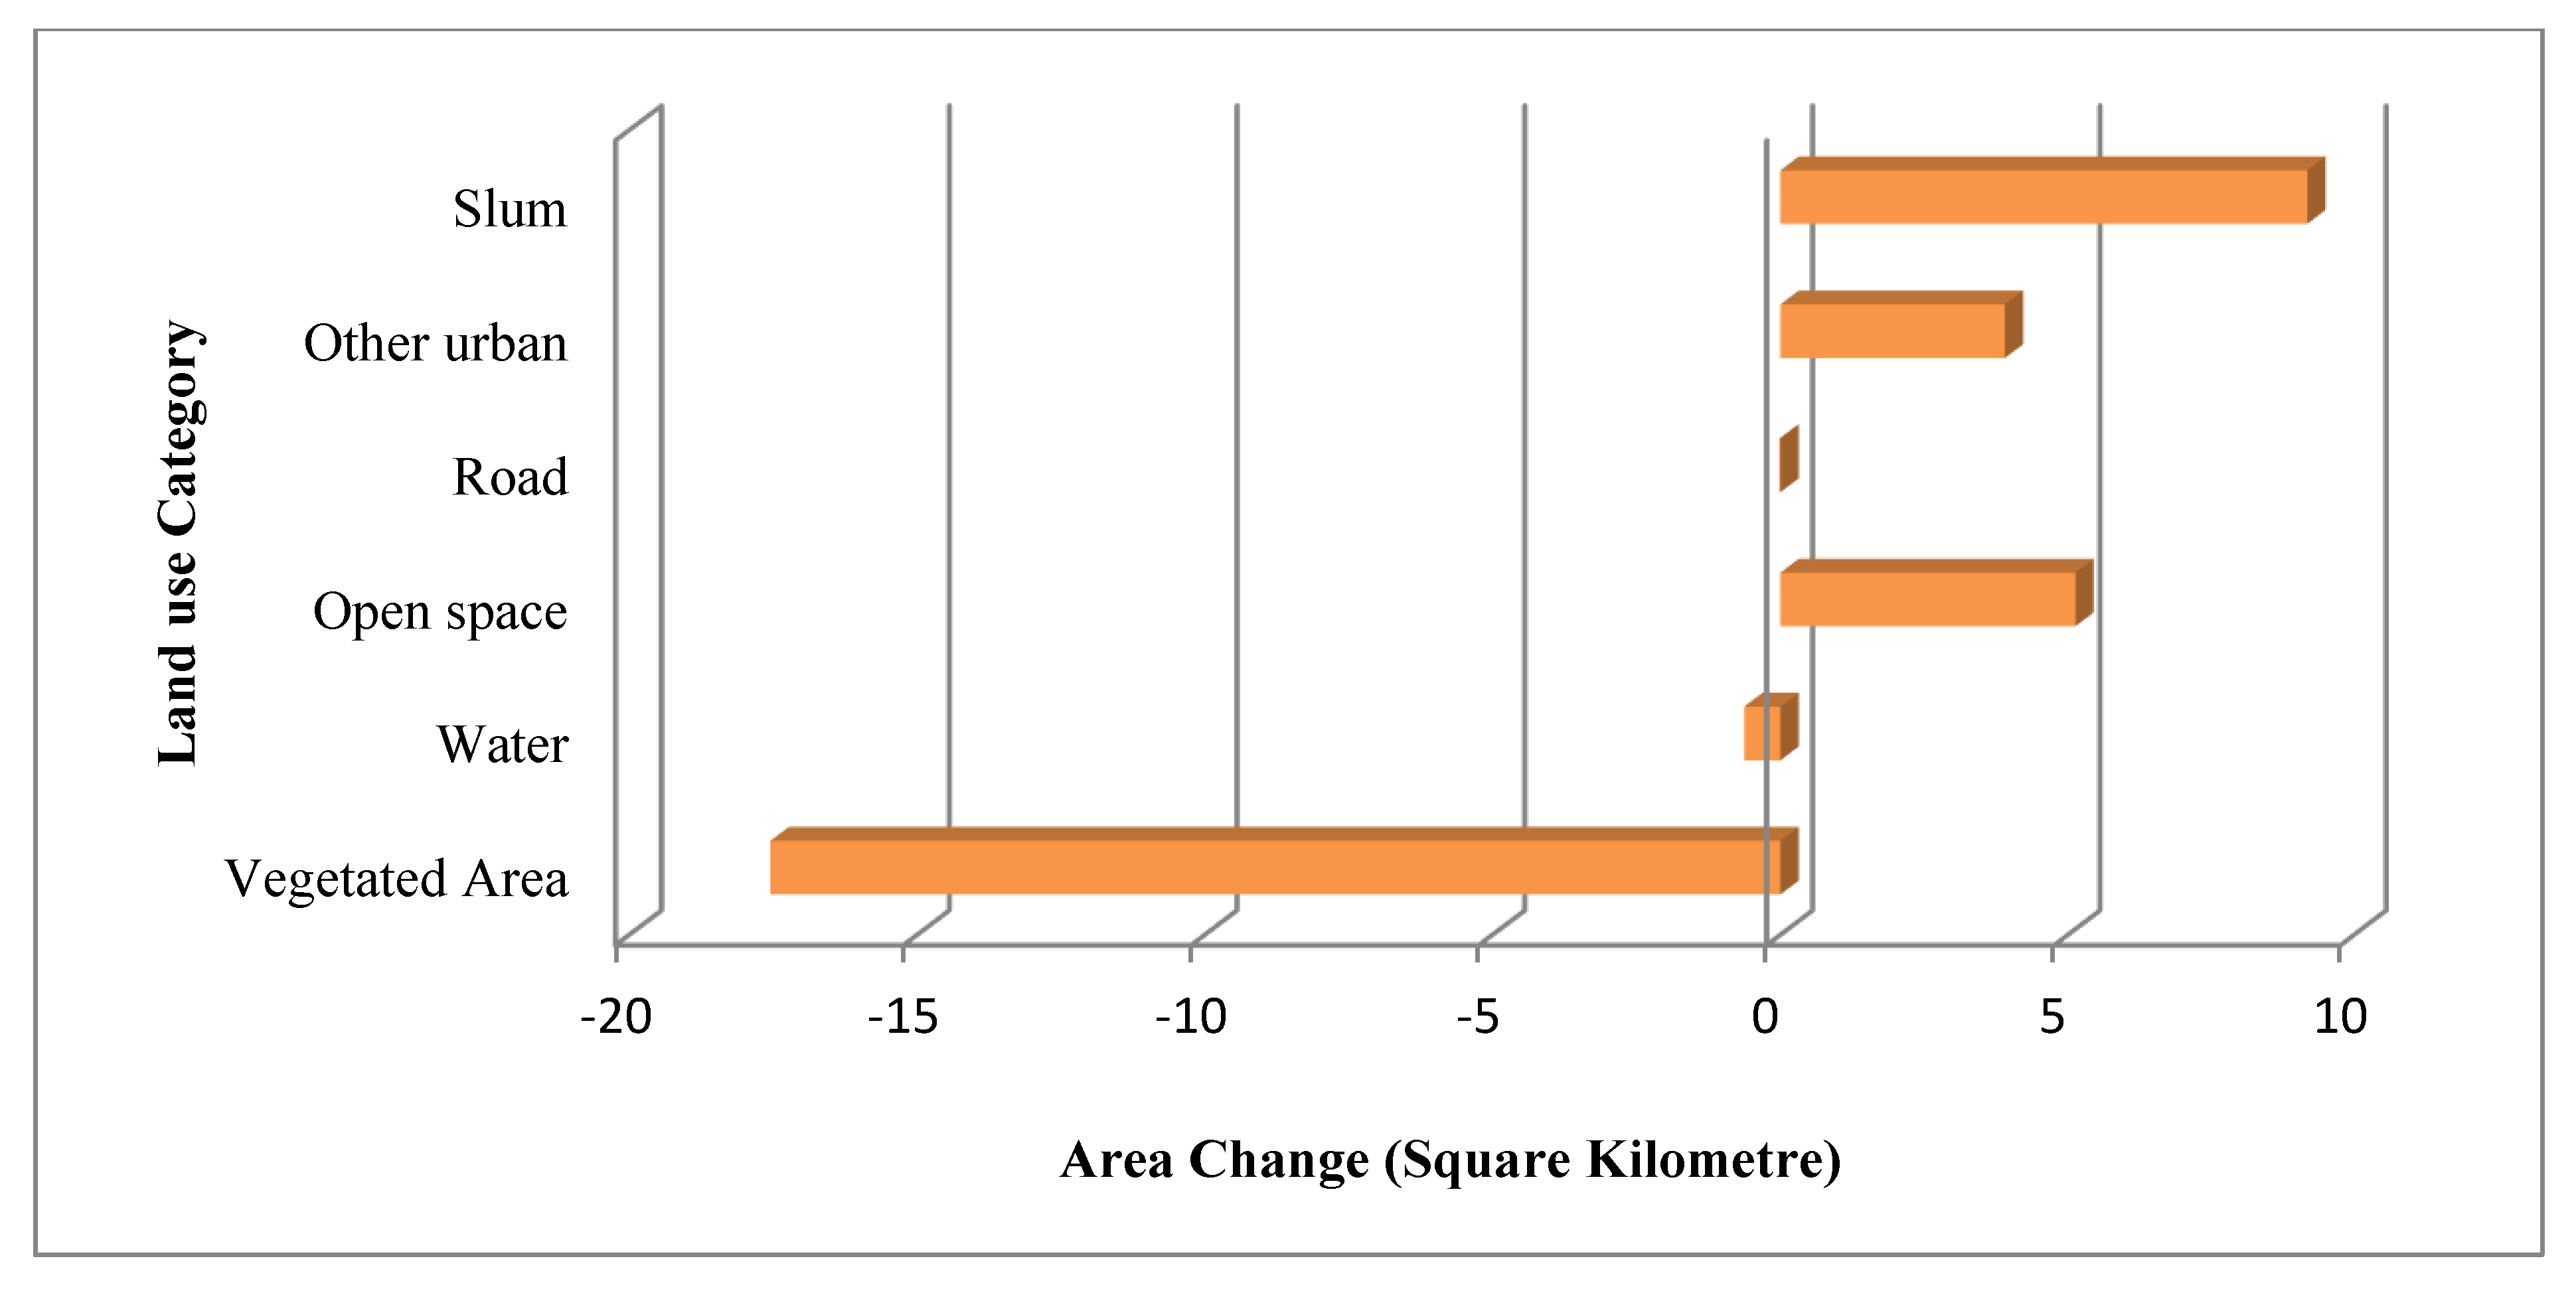
4.2.2. Quantification

Table 7 presents the pattern of LULC change in the study area. Water is the dominant land cover type in the study area, accounting for 47–48% of the two time points, followed by vegetated area (20–25%). This two land cover types contributed to the high percent of persistent land use observed during this time interval (81.1%). Vegetated area suffered the highest loss among the land use categories with a net loss of about 6%. This is common in urban areas, where the vegetated area is usually encroached upon during urban expansion, especially when it (vegetated area) is near urban areas [64] Overall, swapping of land area was observed in all the land use categories in this time interval, implying simultaneous loss and gain by all the land use types (except roads). However, the swap change is larger than the net change for slums, other urban areas, water, and open space, implying spatial reallocation rather than net quantity changes for these land use categories.

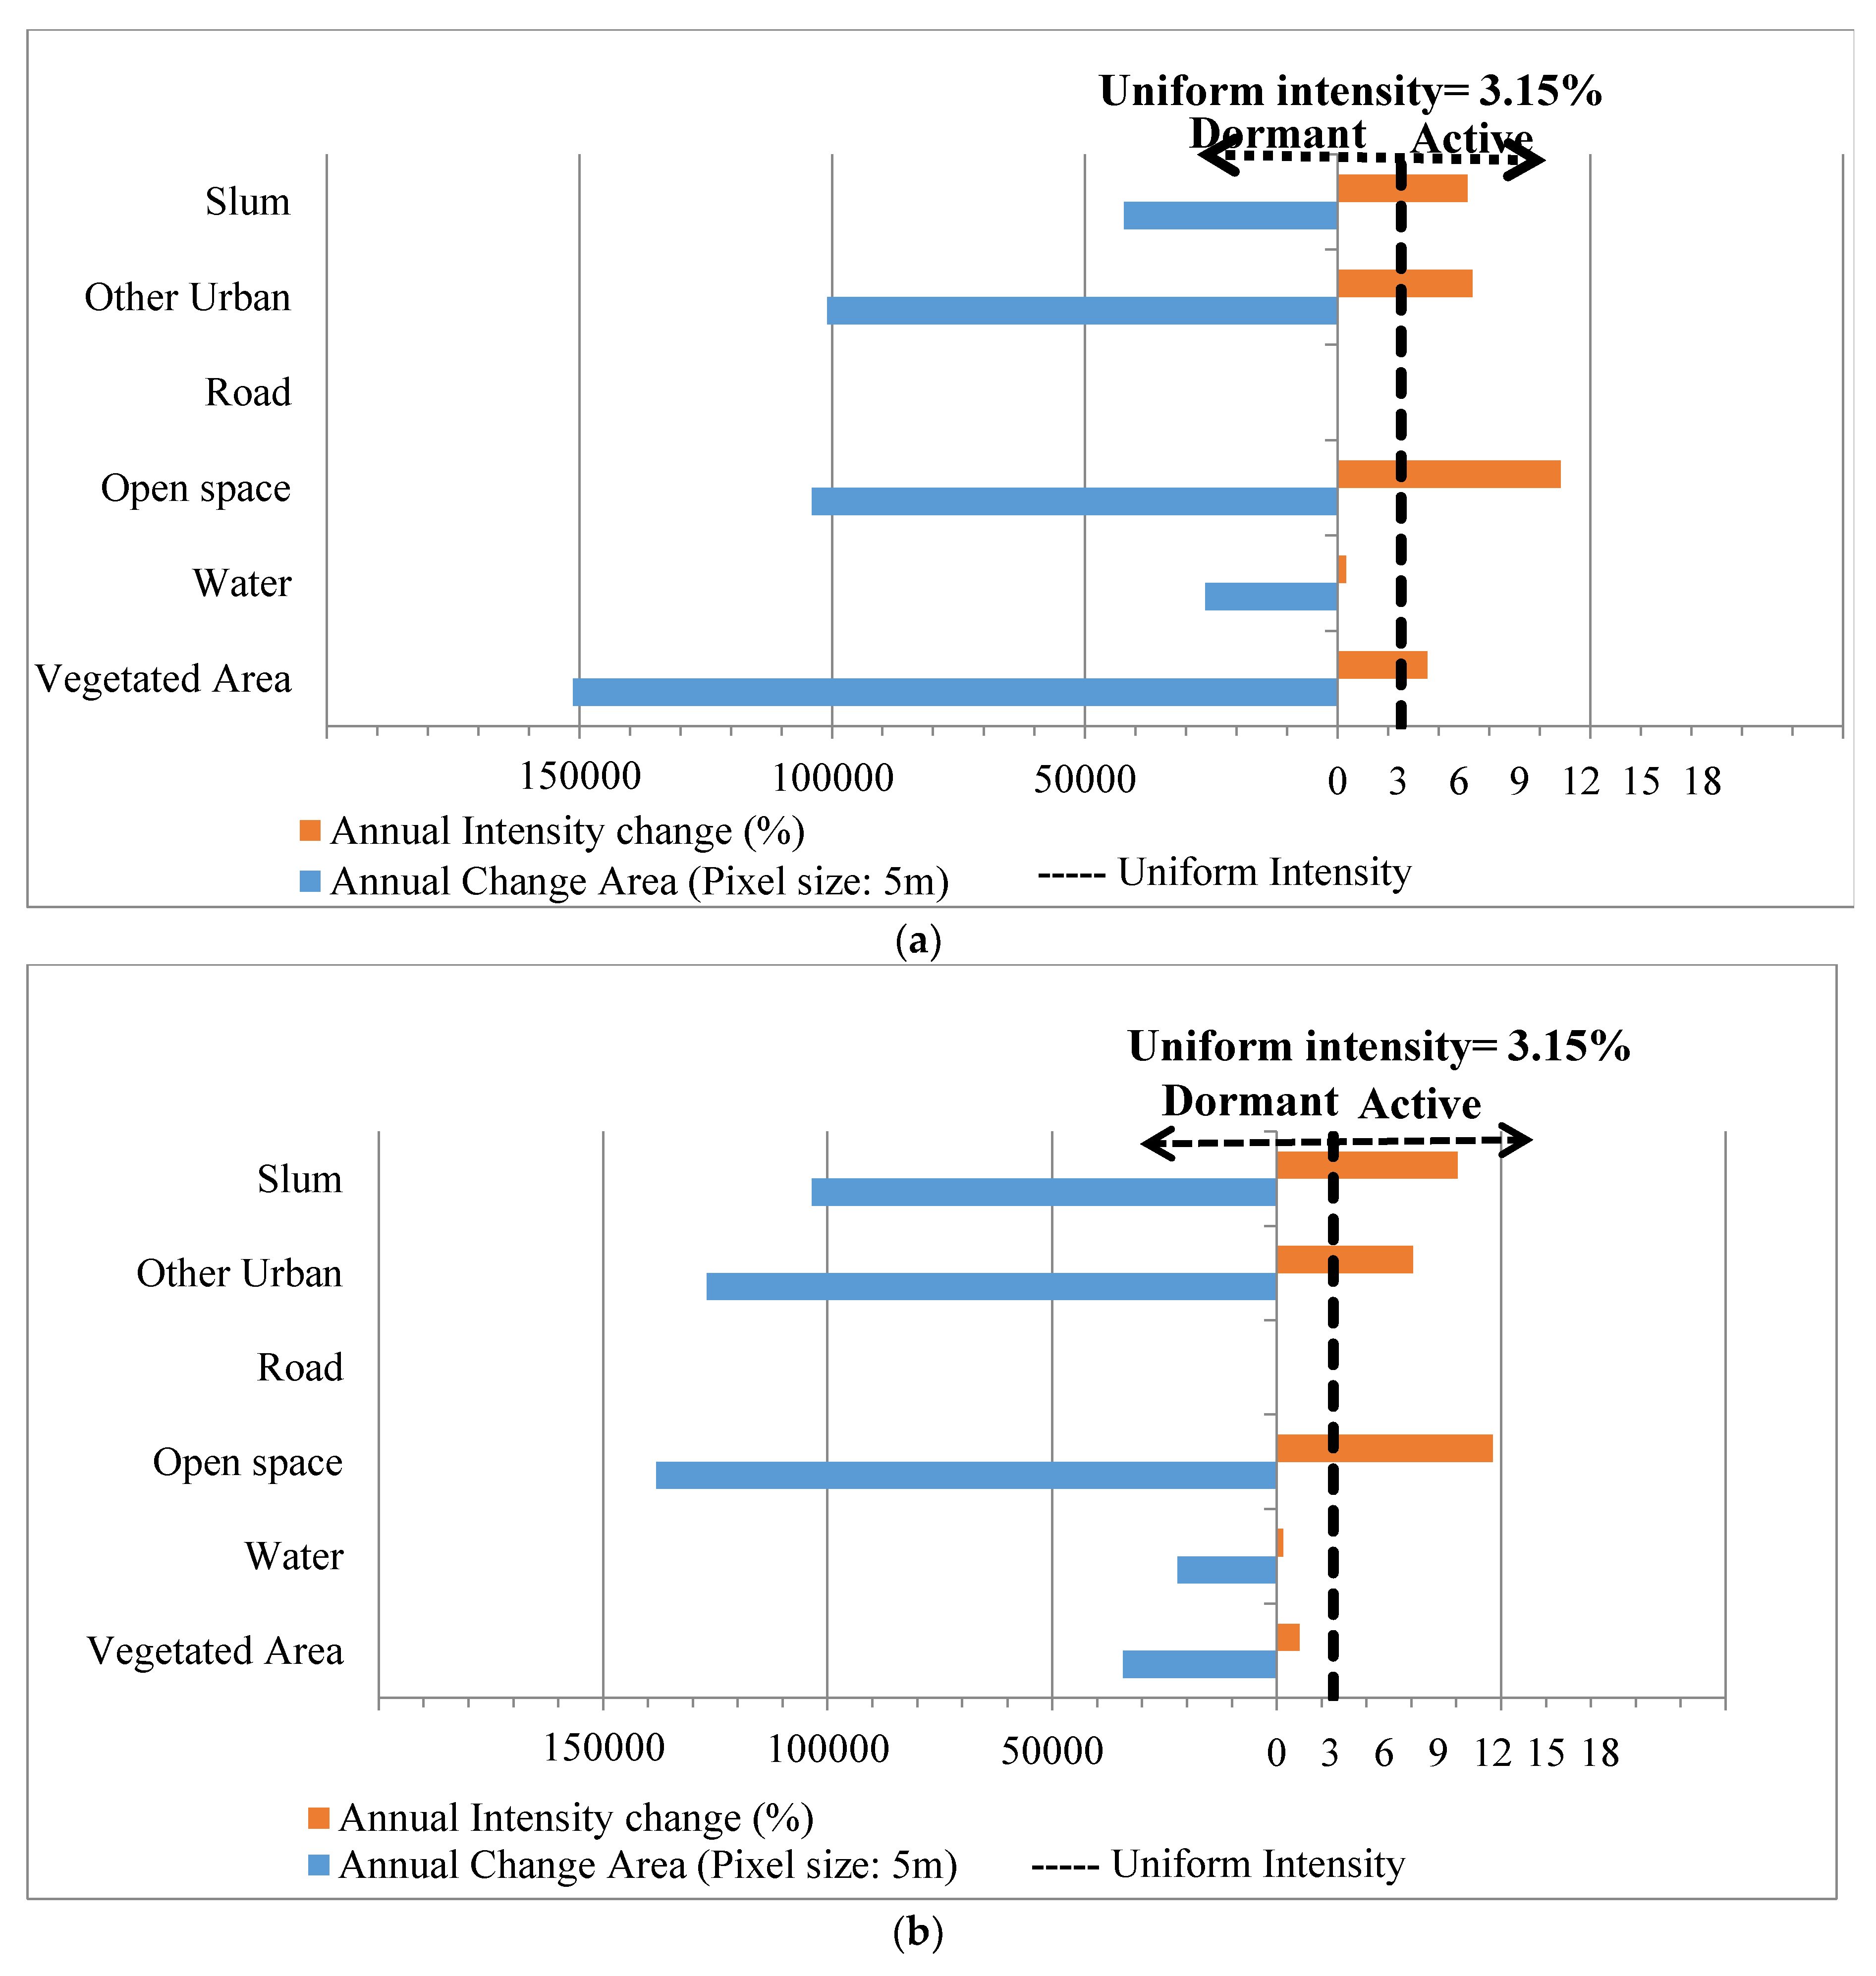
4.3. Intensity Analysis

4.3.1. Category Level

The interval level of intensity analysis required at least two time intervals, in order to compare the size and speed of change across different time intervals. However, this study utilized one time interval (2009–2015) due to the unavailability of data; hence, the interval level was excluded. The category level of the intensity analysis gives information about which land use category is relatively dormant or active during a particular time interval. The map showing category loss and gain in the research area is given in Figure 8a,b, respectively.
The graphical representation of the intensity loss and gain for the land categories during this interval is given in Figure 9a,b. The bar to the left gives area of changes (pixel) while the right gives the intensity of the changes (percent). The dotted vertical line gives the uniform intensity. If an intensity bar extends beyond the uniform intensity line, the category is considered to be active and if it is within the line, the category is considered dormant during that time interval.
It could be observed from Figure 9a that vegetated area, slum, other urban area, and open space were actively losing their land areas to other land use categories during this interval. Although the right side of the bar shows water was dormant, the left side shows that water also lost some of its land area during this time interval. The dormant state of water bodies during this time interval could be attributed to its large size, and if the size included in the domain is reduced, it could become an active class, as well. As Pontius, R.G., et al. [39] noted in their study of Central Kalimantan (Indonesia), the large size of a persistent land use category could influence the result of intensity analysis; hence, it is important to also consider the area change of the bar to obtain a better insight on intensity changes of different land use categories. Furthermore, while slums, other urban areas, and open spaces were actively losing, they were also actively gaining (Figure 9b), making them the most active land use categories in the study area between 2009 and 2015.

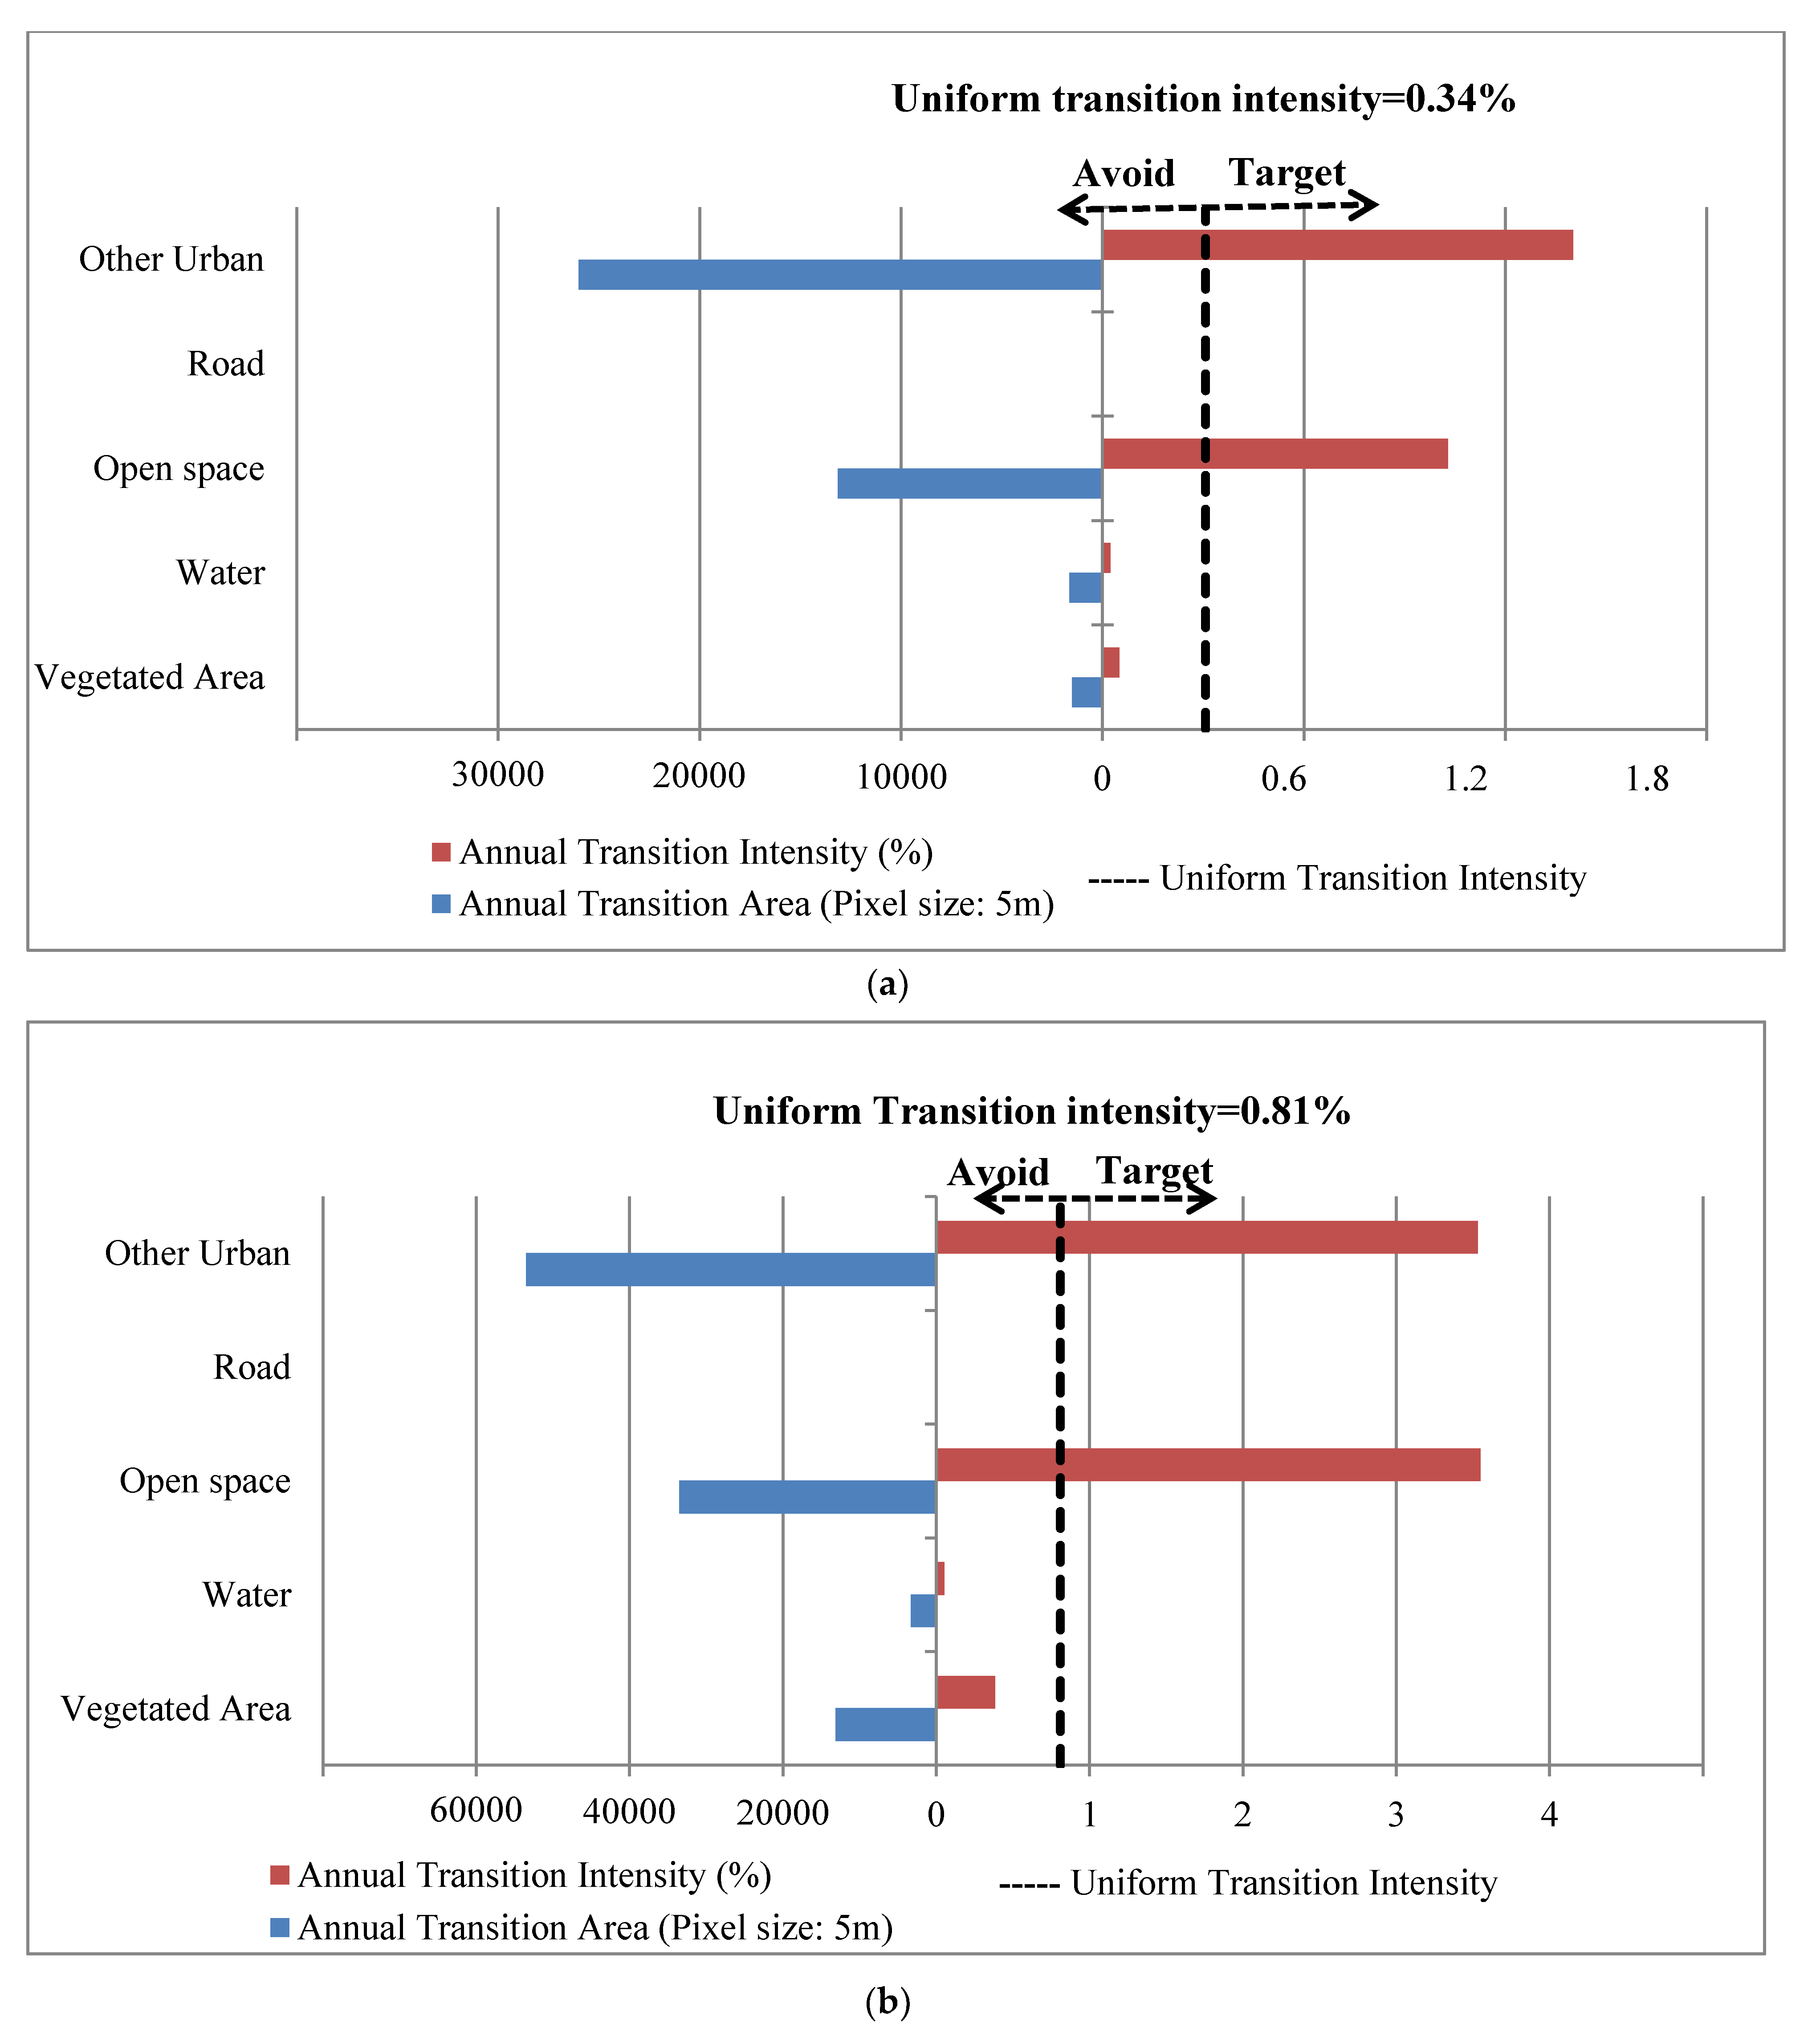
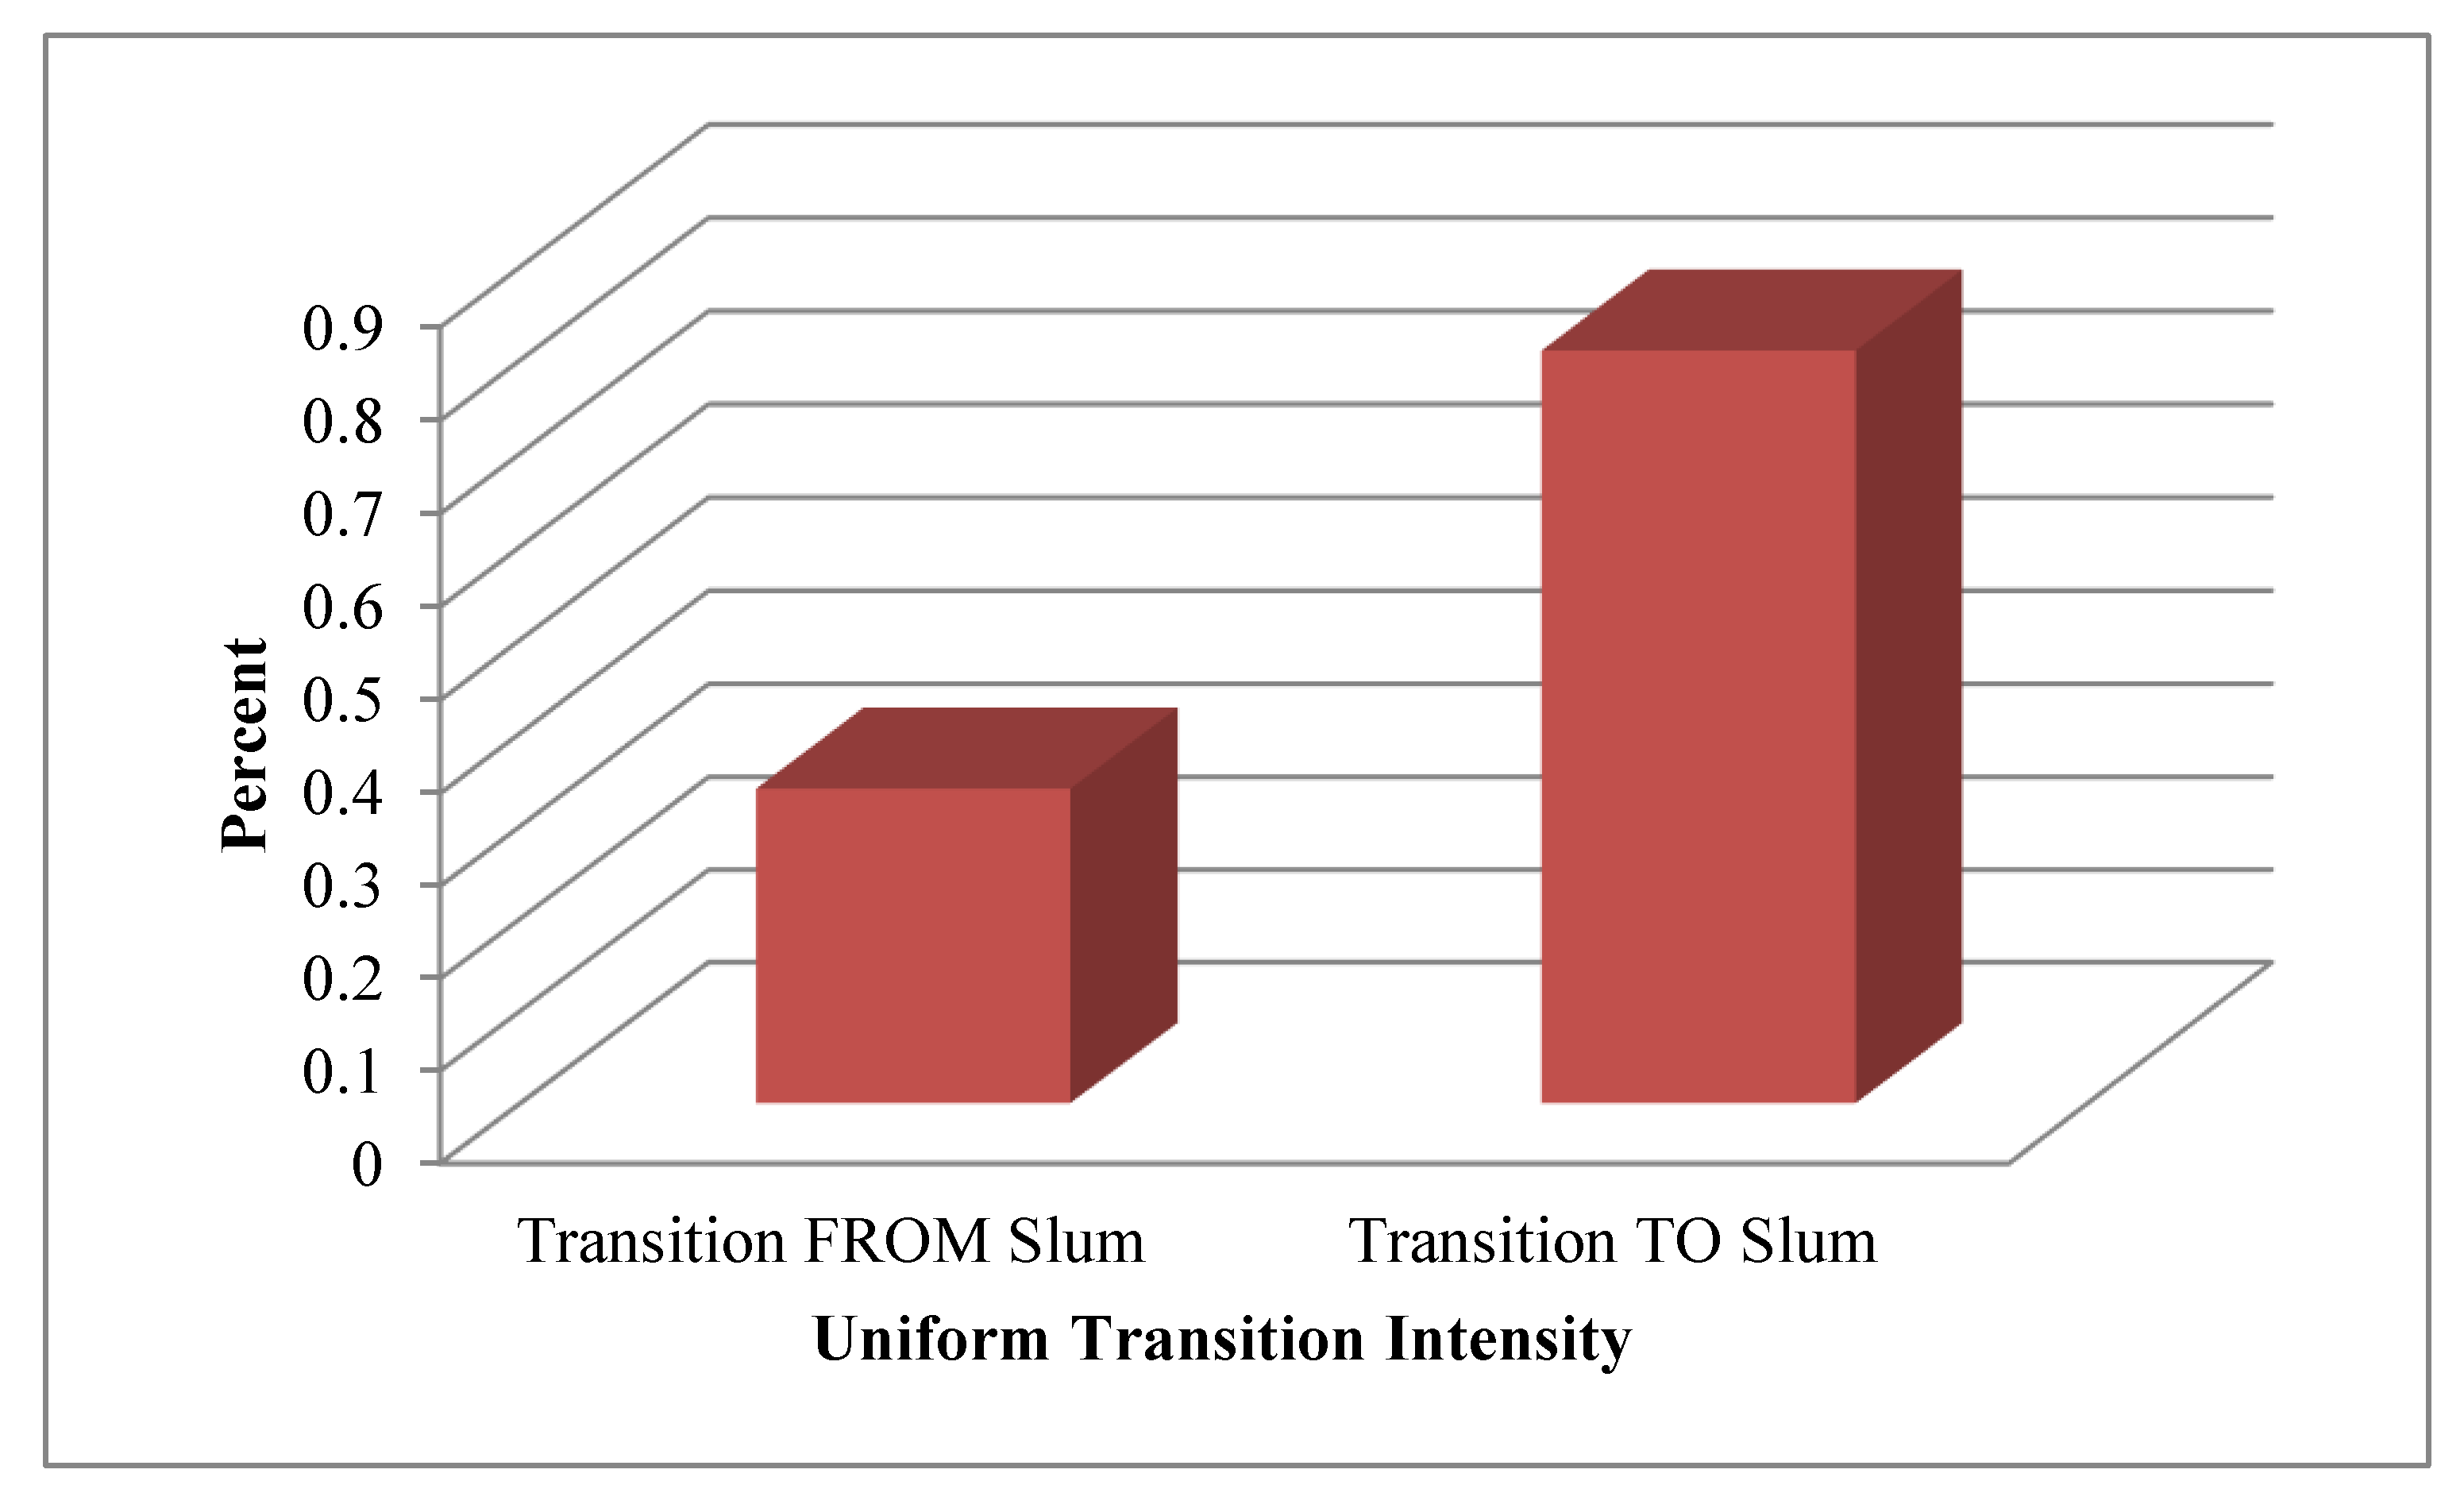
4.3.2. Transition Level

As observed in the previous section, slums were active (losing and gaining) during the time interval studied in the research area. This brings about the next question of which land category were slums losing to and gaining from? Figure 10 presents the map of the transition and examples of the transition observed in the research area.
Figure 11a,b presents the graphical representation of transition from slum and transition to slum, respectively. The bar extending to the left on the vertical axis shows the observed size of each transition (pixel), while the right side of the vertical axis gives the intensity of transition. The dotted vertical line is the uniform transition intensity and any bar that extends beyond the uniform line denote targets while within the uniform line means it is being avoided.
Figure 11a presents the transition from slum to other land use categories. During this time interval, other urban areas and road were targeting slums, so slums experienced high rates of conversion into other urban areas and open space in the study area. However, slums avoid conversion to water and vegetated area during this time interval. Similarly, slums also targeted other urban and open spaces (Figure 11b). On one hand, slums were targeted by both open space and other urban areas while, on the other hand, slums also target both other urban areas and open space. Hence, the transition observed between slums and other urban areas (slum and open space) is a systematic process of transition [38]. Further, the rate at which other land use categories transition to slums is higher than the rate of transition of slums to other land use categories (Figure 12). This implies that that slum growth is faster than its decline. Although the result shows that water is been avoided by slums, this is not the case as it was observed during the field survey that slums encroached on water bodies in the study area (Figure 10). This omission was due to the large size of water in the study area.

5. Discussion

From Pattern to Process

Overall Change: This study utilized RapidEye imagery and intensity analysis to classify and quantitatively analyze the pattern and process of slum growth in Lagos from 2009 to 2015. The overall result showed an area increase in the intensity of land utilized by open space, other urban areas, and slums, and a decrease in the area of land utilized by vegetated area between 2009 and 2015 in the study area (Figure 7). According to [65], the reduction in vegetated area (through conversion to other land use categories) was due to the rapid population growth in the city of Lagos. This was attributed to in-migration rather than natural increase [66,67]. The city has been the economic power and former capital of Nigeria, and continues to be a pulling factor for many migrants with little or no experience to survive in the large cities. Migrants consider only the benefits of moving and not the challenges that might be experienced due to the process of moving [68]]. The implication is that many migrants were absorbed into the already established slum communities leading to their growth.
Process involved in the transition of slum to other land categories: Though the overall result showed a net increase in area coverage of slum, it was observed that some of the initial land area belonging to slum in 2009 had been converted to other land use categories in 2015 (open space and other urban area). Demolition of existing slums (e.g., Badia, Makoko, Iwaya, Ilubirin) by the Lagos state government contributed to the observed transition of slums to other land use categories in this interval. Some of these demolitions were documented by [69]] in their report “The human cost of a megacity, forced evictions of the urban poor in Lagos, Nigeria”. Most often, the Lagos state government response to reduce slum proliferation is slum clearance, after eviction of slum residents, as a means to maintain city standards. However, Nwanna, C.R., et al. [70] argued that most of the observed slum clearance in Lagos is for profit maximization, as most of these slums are located on prime development land. For instance, Ilubirin, formerly a squatter settlement, is currently being converted to a high-income residential apartment. This action is common in squatter settlements in Lagos, primarily due to their illegality. However, in the case of slums where residents have a legal right to the land that their buildings were constructed upon, lease out (or sell) their land to private developers, who then convert them to high-priced rental houses. An example of such is found in Onike and Itire environs. Hence, slum clearance and its redevelopment to high-income residential areas is a form of gentrification in Lagos. Furthermore, squatters along major roads (e.g., Obalende axis) were demolished by the Lagos state government as part of their agenda to beautify the city. Thus, the transition of slums to other land use categories in the study area was due to demolition and gentrification processes.
Process involved in the transition of other land use categories to slum: According to [25], slum tends to evolve into hazardous sites such as water bodies. This trend was also observed in the study area, where slum communities (Figure 10) were found to have encroached on water bodies in the study area. Slum communities near water bodies have a high tendency of encroaching on water bodies. Although the result of the transition level of intensity analysis showed that water bodies were ignored by slums during this time interval, this omission was associated with the large size of water bodies in the study area.
The transition from other urban to a slum is a type of building which has been poorly maintained (Figure 10). This study focused on the older section of Lagos where the colonial style of houses were still common. Most of the colonial style of housing in Lagos is difficult to maintain because of inadequate technical knowhow and unavailability of foreign materials, leading to their poor maintenance [71]. In addition, poor maintenance of existing buildings in the study area is attributed to the poverty level in the city. Approximately 66.9% of Lagos residents’ live below the poverty line [72] and, according to [73], poverty is a cause of environmental stress in Lagos. Many house owners lack the required financial resources to maintain/improve their homes.
Furthermore, the Lagos state government concentrated development in other section of the city (Lagos Island axis) during this time interval. Hence, expansion of squatter settlements was observed especially close to the existing ones. Similarly, slum upgrading exercises undergone by the Lagos state government (e.g., Lagos Metropolitan Development and Governance Project, 2006) were primarily through the provision of infrastructural facilities and not the improvement of housing structures in the slum communities. Hence, many buildings from space still had similar textural properties.

6. Conclusions

This study contributes to slum mapping in West Africa, as not many study focus on Nigeria or Lagos, though Lagos had been infamously referred to as a megacity of slums. The study uses object-based image analysis, building on the generic slum ontology and its main contribution is the use of intensity analysis to link pattern and process of slum growth in Lagos. This study showed that through integration of object based image analysis with expert knowledge and geographical information system data, slums could be delineated from other land use categories in Lagos using a RapidEye image. An overall accuracy of 94% and 89%, and kappa coefficients of 0.9 and 0.86, were achieved for the 2009 and 2015 land use and land cover maps, respectively. The study established that from 2009 to 2015, the spatial extent of slums have increased in the study area, with a net gain of about 9.14 square kilometers. This was attributed to population growth due to in-migration to the city.
This study proceeded by utilizing category and transition level of intensity analysis to quantitatively analyze the pattern of slum growth in Lagos. The annual gain and loss intensity of slums in the studied interval were 10.08 and 6.41, respectively, compared to the annual uniform intensity of 3.15, thus making it an active land use category in Lagos between 2009 and 2015. At the transition level of intensity analysis, a systematic process of transition was observed between slums and other urban areas, as well as slums and open space, influenced by the Lagos state government. When the Lagos state government exerts their power in the study area, slums are converted to other land use categories, and vice versa. Further, the calculated uniform transition intensity “to” slum (0.81) was higher than the uniform transition intensity “from” slum (0.34). This implies that slum growth was faster than its decline in the interval studied.
Demolition and gentrification were the major processes contributing to slums losing some of their land area to other land use categories in the study area. Transition of other urban areas to slum was attributed to poor maintenance of existing building structures due to poverty and unavailable resources. Further, slums encroached on water bodies in the study area; however, the transition level of intensity analysis could not capture this process as an active process, because of the size of water bodies in the study area. Conclusively, slums in prime locations were often demolished, while new ones springs up at the least desirable areas (e.g., close to water bodies), partly due to the scarcity of land in the study area.
Slums will continue to be a major challenge to the urban landscape if the status quo persists. It is hoped that the result presented in this paper will assist in policy-driven initiatives on slum management (such as monitoring of land use categories targeted by slums to prevent further encroachment), and contributes to the body of knowledge on slum dynamics in emerging economies, especially in data-scarce countries. Although this study captures the applicability of object-based image analysis and intensity analysis to map and quantitatively link the pattern and process of slum growth in Lagos, there is scope for further improvement. The remotely-sensed data utilized in this study was for two periods (due to limited data availability) which covers the older section of Lagos, leading to the exemption of the interval level of intensity analysis. A broader coverage, including the whole city with more years of remotely-sensed data can give further insight on slum dynamics in Lagos, Nigeria.

Author Contributions

O.S.B. wrote the paper and, jointly with A.R., conceived and designed the proposal and methodology utilized in this study. D.C.-C. provided guidance and valuable contributions at every stage of the development of this work. C.J. and K.G. supervised the research process and gave valuable suggestions to improve the quality of the paper. All authors reviewed the manuscript.

Funding

This research was funded by Deutscher Akademischer Austauschdienst (DAAD) under the Development-Related Postgraduate Courses.

Acknowledgments

The result of this study forms part of a PhD dissertation, hosted by the Centre for Development Research (ZEF), Department of Geography, University of Bonn and Department of Geography, Ruhr University Bochum. We want to thank Planet Labs Germany for providing the RapidEye imageries utilized in this study free of charge under the RapidEye Science Archive (RESA). We also appreciate the anonymous Remote Sensing reviewers for their insightful and helpful comments during the review process.

Conflicts of Interest

The authors declare no conflict of interest.

References

  1. Davis, M. Planet of slums. New Left Rev. 2004, 26, 5–34. [Google Scholar]
  2. Cheru, F. Globalization and Uneven Urbanization in Africa: The Limits to Effective Urban Governance in the Provision of Basic Services. 2005. Available online: http://international.ucla.edu/media/files/57.pdf (accessed on 10 June 2017).
  3. Barrios, S.; Bertinelli, L.; Strobl, E. Trends in rainfall and economic growth in Africa: A neglected ca of the African growth tragedy. Rev. Econ. Stat. 2010, 92, 350–366. [Google Scholar] [CrossRef]
  4. Bobadoye, S.A.; Fakere, A.A. Slum Prevalence in Nigeria: What Role for Architects? World Environ. 2013, 3, 45–51. [Google Scholar]
  5. Stokes, C.J. A theory of slums. Land Econ. 1962, 38, 187–197. [Google Scholar] [CrossRef]
  6. George, C.K. Basic Principles and Methods of Urban and Regional Planning, 2nd ed; Libro-Gem Books: Lagos, Nigeria, 2002; ISBN1 978052715X. ISBN2 9789780527150. [Google Scholar]
  7. Simon, R.F.; Adegoke, A.K.; Adewale, B.A. Slum settlements regeneration in Lagos Mega-city: An overview of a waterfront Makoko community. Int. J. Educ. Res. 2013, 1, 1–16. [Google Scholar]
  8. Adedayo, A.F.; Malik, N.A. Factors influencing the growth of slums in Lagos metropolis, Nigeria. Ethiop. J. Environ. Stud. Manag. 2015, 8, 113–119. [Google Scholar] [CrossRef]
  9. Hofmann, P.; Taubenbock, H.; Werthmann, C. Monitoring and modelling of informal settlements-A review on recent developments and challenges. In Proceedings of the 2015 Joint Urban Remote Sensing Event (JURSE), Lausanne, Switzerland, 30 March–1 April 2015; pp. 1–4. [Google Scholar]
  10. Gulyani, S.; Bassett, E.M. Retrieving the baby from the bathwater: Slum upgrading in Sub-Saharan Africa. Environ. Plan. C Gov. Policy 2007, 25, 486–515. [Google Scholar] [CrossRef]
  11. Ooi, G.L.; Phua, K.H. Urbanization and slum formation. J. Urban Health 2007, 84, 27–34. [Google Scholar] [CrossRef] [PubMed]
  12. Shoko, M.; Smit, J. Use of Agent Based Modelling to Investigate the Dynamics of Slum Growth. S. Afr. J. Geomat. 2013, 2, 54–67. [Google Scholar]
  13. Andavarapu, D.; Edelman, D.J. Evolution of Slum Redevelopment Policy. Curr. Urban Stud. 2013, 1, 185–192. [Google Scholar] [CrossRef]
  14. Dung-gwom, J.Y. Urban Renewal in Jos-Bukuru Metropolis; A paper presented at the Nigerian Institute of Estate Surveyors Valuers, MCPD Workshop at Leadership Institute; Nigerian Institute of Estate Surveyors Valuers, MCPD Workshop at Leadership Institute: Jos-Bukuru, Nigeria, 2007. [Google Scholar]
  15. Pratomo, J.; Kuffer, M.; Martinez, J.; Kohli, D. Coupling Uncertainties with Accuracy Assessment in Object-Based Slum Detections, Case Study: Jakarta, Indonesia. Remote Sens. 2017, 9, 1164. [Google Scholar] [CrossRef]
  16. Mahabir, R.; Croitoru, A.; Crooks, A.T.; Agouris, P.; Stefanidis, A. A critical review of high and very high-resolution remote sensing approaches for detecting and mapping Slums: Trends, challenges and emerging opportunities. Urban Sci. 2018, 2, 8. [Google Scholar] [CrossRef]
  17. Arimah, B.C. The Face of Urban Poverty: Explaining the Prevalence of Slums in Developing Countries (No. 2010, 30); Working Paper; World Institute for Development Economics Research: Helsinki, Finland, 2010. [Google Scholar]
  18. Kit, O.; Lüdeke, M.; Reckien, D. Texture-based identification of urban slums in Hyderabad, India using remote sensing data. Appl. Geogr. 2012, 32, 660–667. [Google Scholar] [CrossRef]
  19. Sietchiping, R. Prospective Slum Policies: Conceptualization and Implementation of a Proposed Informal Settlement Growth Model. In Proceedings of the Third Urban Research Symposium on Land Development Urban Policy and Poverty Reduction, Brasilia, Brazil, 4–6 April 2005. [Google Scholar]
  20. Davis, M. Planet of Slums; Verso: London, UK; New York, NY, USA, 2006. [Google Scholar]
  21. Kumar Swami, S. An Empirical Study of Growth of Slum Population in India. Int. J. Political Sci. 2017, 3, 10–13. [Google Scholar]
  22. Sliuzas, R.; Mboup, G.; de Sherbinin, A. Report of the Expert Group Meeting on Slum Identification and Mapping; Report by CIESIN, UN-Habitat, ITC; Columbia University: New York, NY, USA, 2008; p. 36. [Google Scholar]
  23. Weeks, J.R.; Hill, A.; Stow, D.; Getis, A.; Fugate, D. Can we spot a neighbourhood from the air? Defining neighbourhood structure in Accra, Ghana. GeoJournal 2007, 69, 9–22. [Google Scholar] [CrossRef] [PubMed]
  24. Shekhar, S. Detecting slums from Quick Bird data in Pune using an object oriented approach. Int. Arch. Photogramm. Remote Sens. Spat. Inf. Sci. 2012, 39, 519–524. [Google Scholar] [CrossRef]
  25. Olthuis, K.; Benni, J.; Eichwede, K.; Zevenbergen, C. Slum upgrading: Assessing the importance of location and a plea for a spatial approach. Habitat Int. 2015, 50, 270–288. [Google Scholar] [CrossRef]
  26. Kuffer, M.; Pfeffer, K.; Sliuzas, R. Slums from space—15 Years of slum mapping using remote sensing. Remote Sens. 2016, 8, 455. [Google Scholar] [CrossRef]
  27. Hurskainen, P.; Pellikka, P. Change detection of informal settlements using multi-temporal aerial photographs—The case of Voi, SE-Kenya. In Proceedings of the 5th African Association of Remote Sensing of the Environment conference, Nairobi, Kenya, 17–22 October 2004. [Google Scholar]
  28. Veljanovski, T.; Kanjir, U.; Pehani, P.; Oštir, K.; Kovačič, P. Object-based image analysis of VHR satellite imagery for population estimation in informal settlement Kibera-Nairobi, Kenya. In Remote Sensing-Applications; InTech: Rijeka, Croatia, 2012; pp. 407–434. [Google Scholar]
  29. Adepoju, M.; Halilu, S.A.; Ozigis, S.M.; Mohammed, S.O.; Idris, I.; Adeluyi, S.; Eta, J. Mapping and Monitoring of Slum Development in Abuja, Nigeria with Satellite Remote Sensing and Geographical Information System. Int. J. Geosci. Geomat. 2013, 1, 69–76. [Google Scholar]
  30. Kit, O.; Lüdeke, M. Automated detection of slum area change in Hyderabad, India using multitemporal satellite imagery. ISPRS J. Photogram. Remote Sens. 2013, 83, 130–137. [Google Scholar] [CrossRef] [Green Version]
  31. Brown, D.G.; Walker, R.; Manson, S.; Seto, K. Modeling landuse and land cover change. In Land Change Science; Springer: Dordrecht, The Netherlands, 2012; pp. 395–409. [Google Scholar]
  32. Manandhar, R.; Odeh, I.O.; Pontius, R.G. Analysis of twenty years of categorical land transitions in the Lower Hunter of New South Wales, Australia. Agric. Ecosyst. Environ. 2010, 135, 336–346. [Google Scholar] [CrossRef]
  33. Raphael John, L.; Hambati, H.; Ato Armah, F. An Intensity Analysis of land- and land-cover change in Karatu District, Tanzania: Community perceptions and coping strategies. Afr. Geogr. Rev. 2014, 33, 150–173. [Google Scholar] [CrossRef]
  34. Rindfuss, R.; Stern, P. Linking Remote Sensing and Social Science: The Needs and the Challenge. In People and Pixels; Liverman, D., Moran, E.F., Rindfuss, R.R., Stern, P.C., Eds.; National Academy Press: Washington, DC, USA, 1998; pp. 1–27. [Google Scholar]
  35. Huang, J.; Pontius, R.G.; Li, Q.; Zhang, Y. Use of intensity analysis to link patterns with processes of land change from 1986 to 2007 in a coastal watershed of southeast China. Appl. Geogr. 2012, 34, 371–384. [Google Scholar] [CrossRef]
  36. Braimoh, A.K. Random and systematic land-cover transitions in northern Ghana. Agric. Ecosyst. Environ. 2006, 113, 254–263. [Google Scholar] [CrossRef]
  37. Pontius, R.G.; Shusas, E.; McEachern, M. Detecting important categorical land changes while accounting for persistence. Agric. Ecosyst. Environ. 2004, 101, 251–268. [Google Scholar] [CrossRef]
  38. Aldwaik, S.Z.; Pontius, R.G. Intensity analysis to unify measurements of size and stationarity of land changes by interval, category, and transition. Landsc. Urban Plan. 2012, 106, 103–114. [Google Scholar] [CrossRef]
  39. Pontius, R.G.; Gao, Y.; Giner, N.M.; Kohyama, T.; Osaki, M.; Hirose, K. Design and interpretation of intensity analysis illustrated by land change in Central Kalimantan, Indonesia. Land 2013, 2, 351–369. [Google Scholar] [CrossRef]
  40. Yang, Y.; Liu, Y.; Xu, D.; Zhang, S. Use of intensity analysis to measure land changes from 1932 to 2005 in Zhenlai County, Northeast China. Chin. Geogr. Sci. 2017, 27, 441–455. [Google Scholar] [CrossRef]
  41. Zhou, P.; Huang, J.; Pontius, R.G.; Hong, H. Land classification and change intensity analysis in a coastal watershed of Southeast China. Sensors 2014, 14, 11640–11658. [Google Scholar] [CrossRef] [PubMed]
  42. Filani, M. The Changing Face of Lagos: From Vision to Reform and Transformation; Cities Alliance: Brussels, Belgium, 2012. [Google Scholar]
  43. Lagos Bureau of Statistics. Lagos State Government Digest of Statistics; Ministry of Economic Planning and Budget: Lagos, Nigeria, 2013.
  44. United Nations, Department of Economic and Social Affairs, Population Division. World Urbanization Prospects: The 2014 Revision, Highlights (ST/ESA/SER.A/352); United Nations: Rome, Italy, 2014. [Google Scholar]
  45. Lagos Population. 28 July 2017. Available online: http://worldpopulationreview.com/world-cities/lagospop ulation (accessed on 10 September 2017).
  46. UN-Habitat. The Challenge of Slums. Global Report on Human Settlements 2003; United Nations Human Settlements Programme; Earthscan: London, UK; Sterling, VA, USA, 2003. [Google Scholar]
  47. World Bank. Project Appraisal Document to the Federal Republic of Nigeria for the Lagos Metropolitan Development and Governance Project; World Bank: Washington, DC, USA, 2006. [Google Scholar]
  48. Adelekan, I.O. Vulnerability of poor urban coastal communities to flooding in Lagos, Nigeria. Environ. Urban. 2010, 22, 433–450. [Google Scholar] [CrossRef] [Green Version]
  49. Benjamin, M.; Tavneet, S.; Thomas, S. The Economics of Slums in the Developing World. J. Econ. Perspect. 2013, 4, 187–210. [Google Scholar]
  50. Onokerhoraye, A.G. Urbanization and Environment in Nigeria: Implications for Sustainable Development; Benin Social Science Series for Africa; University of Benin: Benin City, Nigeria, 1995. [Google Scholar]
  51. Lagos State Government/United Nations Centre for Human Settlements Identification of Urban Renewal Areas in Metropolitan Lagos. Urban and Regional Planning Division: United Nations Development Programme UNCHS Habitat N1R 82/00/Implementation; Lagos State Government: Lagos, Nigeria, 1984.
  52. ENVI: Release 5.1; Exelis Visual Information Solutions: Boulder, CO, USA, 2013.
  53. Duro, D.C.; Franklin, S.E.; Dubé, M.G. A comparison of pixel-based and object-based image analysis with selected machine learning algorithms for the classification of agricultural landscapes using SPOT-5 HRG imagery. Remote Sens. Environ. 2012, 118, 259–272. [Google Scholar] [CrossRef]
  54. Blaschke, T. Object based image analysis for remote sensing. J. Photogramm. Remote Sens. 2010, 65, 2–16. [Google Scholar] [CrossRef]
  55. eCognition Developer: Release 9; Trimble Germany GmbH: Munich, Germany, 2014.
  56. Sliuzas, R.V.; Mboup, G.; de Sherbinin, A. Report of the Expert Group Meeting on Slum Identification and Mapping; CIESIN, UN-Habitat, ITC: Enschede, The Netherlands, 2008. [Google Scholar]
  57. Kohli, D.; Sliuzas, R.; Kerle, N.; Stein, A. An ontology of slums for image-based classification. Comput. Environ. Urban Syst. 2012, 36, 154–163. [Google Scholar] [CrossRef]
  58. Kohli, D.; Warwadekar, P.; Kerle, N.; Sliuzas, R.; Stein, A. Transferability of object-oriented image analysis methods for slum identification. Remote Sens. 2013, 5, 4209–4228. [Google Scholar] [CrossRef]
  59. Mhangara, P.; Odindi, J.; Kleyn, L.; Remas, H. Road Extraction Using Object Oriented Classification. Vis. Tech. Available online: http://www.ee.co.za/wp-content/uploads/legacy/posit11/PositionITnov-dec11-Vis_45-50.pdf (accessed on 3 March 2016).
  60. ESRI. ArcGIS Desktop: Release 10.3.1; Environmental Systems Research Institute: Redlands, CA, USA, 2015. [Google Scholar]
  61. Sori, N.D. Identifying and Classifying Slum Development Stages from Spatial Data. Master’s Thesis, University of Twente, Faculty of Geo-Information and Earth Observation, Enschede, The Netherlands, 2012. [Google Scholar]
  62. Foody, G.M. Status of land cover classification accuracy assessment. Remote Sens. Environ. 2002, 80, 185–201. [Google Scholar] [CrossRef]
  63. Congalton, R.G. A review of assessing the accuracy of classifications of remotely sensed data. Remote Sens. Environ. 1991, 37, 35–46. [Google Scholar] [CrossRef]
  64. Song, W.; Deng, X. Effects of urbanization-induced cultivated land loss on ecosystem services in the North China Plain. Energies 2015, 8, 5678–5693. [Google Scholar] [CrossRef]
  65. Adepoju, M.O.; Millington, A.C.; Tansey, K.T. Land/land cover change detection in metropolitan Lagos (Nigeria): 1984–2002. In Proceedings of the ASPRS 2006 Annual Conference, Reno, NV, USA, 1–5 May 2006. [Google Scholar]
  66. Aluko, O.E. The Impact of Urbanization on Housing Development: The Lagos Experience, Nigeria. Ethiop. J. Environ. Stud. Manag. 2010, 3, 64–74. [Google Scholar] [CrossRef]
  67. Immerwahr, D. The politics of architecture and urbanism in postcolonial Lagos, 1960–1986. J. Afr. Cult. Stud. 2007, 19, 165–186. [Google Scholar] [CrossRef] [Green Version]
  68. Abdul-Azeez, I.A.; Opoola, N.A. An appraisal of the factors influencing rural-urban migration in some selected local government areas of Lagos State Nigeria. J. Sustain. Dev. 2011, 4, 136–141. [Google Scholar]
  69. Amnesty International. The Human Cost of a Megacity Forced Evictions of the Urban Poor in Lagos, Nigeria; Index: Afr 44/7389/2017; Amnesty International: London, UK, 2017. [Google Scholar]
  70. Nwanna, C.R. Gentrification in Lagos State: Challenges and prospects. Br. J. Arts Soc. Sci. 2012, 5, 163–176. [Google Scholar]
  71. Adejimi, A. Poor building maintenance in Nigeria: Are Architects free from blames. In Proceedings of the ENHIR International Conference on “Housing: New Challenges and Innovations in Tomorrow’s Cities”, Iceland, 29 June–3 July 2005. [Google Scholar]
  72. Lagos Bureau of Statistics. Poverty Profile for Lagos State; Ministry of Economic Planning and Budget: Lagos, Nigeria, 2014.
  73. Oduwaye, L.; Lawanson, T.O. Poverty and Environmental Degradation in the Lagos Metropolis; Conference Proceedings on Urban and Regional Planning in the context of the Millennium Development Goals; Department of Urban and Regional Planning, Federal University of Technology: Minna, Nigeria, 2006. [Google Scholar]
Figure 1. Study area in Lagos State, Nigeria.
Remotesensing 10 01044 g001
Figure 2. Landcover map and DEM of the study area in the city of Lagos. The landcover map is based on classified RapidEye data acquired on 20 December 2015.
Remotesensing 10 01044 g002
Figure 3. Squatter (A) and slum (B) communities in Lagos (author’s photo, 2017).
Remotesensing 10 01044 g003
Figure 4. Work flow of the study.
Remotesensing 10 01044 g004
Figure 5. (a) Land use/cover map of study area in 2009; and (b) land use/cover map of the study area in 2015.
Remotesensing 10 01044 g005
Figure 6. Detected changes in the research area between 2009 and 2015.
Remotesensing 10 01044 g006
Figure 7. Area change of land use categories in the research area from 2009 to 2015.
Remotesensing 10 01044 g007
Figure 8. (a) The category loss intensity analysis map of the research area; and (b) the category gain intensity analysis map of the research area.
Remotesensing 10 01044 g008
Figure 9. (a) The category loss intensity for 2009–2015 in the research area; and (b) the category gain intensity for 2009–2015 in research area.
Remotesensing 10 01044 g009
Figure 10. Transition of land use categories in the research area.
Remotesensing 10 01044 g010
Figure 11. (a) Transition intensity analysis “from” slum (2009–2015); and (b) transition intensity analysis “to” slum (2009–2015).
Remotesensing 10 01044 g011
Figure 12. Comparison of uniform transition intensity of slum in the time interval.
Remotesensing 10 01044 g012
Table 1. Satellite imagery description.
Data Source/TypeAcquired SceneSpatial ResolutionAcquisition Date
RapidEye/Level 3A3142015_2009-11-29_RE2_3A_412557529 November 2009
RapidEye/Level 3A3142016_2009-11-29_RE2_3A_412557529 November 2009
RapidEye/Level 3A3142017_2009-11-29_RE2_3A_412557529 November 2009
RapidEye/Level 3A3142116_2009-11-29_RE2_3A_412557529 November 2009
RapidEye/Level 3A3142117_2009-11-29_RE2_3A_412557529 November 2009
RapidEye/Level 3A3142015_2015-12-20_RE4_3A_412557520 December 2015
RapidEye/Level 3A3142016_2015-12-20_RE4_3A_412557520 December 2015
RapidEye/Level 3A3142017_2015-12-20_RE4_3A_412557520 December 2015
RapidEye/Level 3A3142116_2015-12-20_RE4_3A_412557520 December 2015
RapidEye/Level 3A3142117_2015-12-20_RE4_3A_412557520 December 2015
Table 2. Adaptation of generic slum ontology concepts to an ontology for Lagos, with OBIA parameterization at environs, settlement, and objects.
LevelIndicatorsObservation (Lagos)OBIA Parameterization
EnvironsLocationLocated on river banks and marshy areasVector layer water:
Min overlap on water bodies
Neighbourhood characteristicsClose to employment opportunities (central business district, industries etc.)Not used due to absence of spatial data on economic opportunities
No defined boundaries between planned and slum communities.Not used due to absence of spatial data on different types of residential land use in the city
There are some public buildings that that were poorly maintained and need to be extracted to prevent misclassificationVector layer of public buildings to extract those buildings
SettlementDensityDenser than the planned communitiesTexture—GLCM
ShapeIrregularNot used
Object LevelBuildingRoof materials: corrugated iron sheets, concrete and plastic.Spectral—Layer mean values
Access networkUnpaved road and foot pathNot used
Table 3. Description of parameters used in the classification of the study area.
ParameterDescription
Normalized difference vegetation index NDVIIndex used to measure vegetation
Mean BlueMean intensity of all pixels forming an image in Blue band
Mean NIRMean intensity of all pixels forming an image in NIR band
DensityDistribution in space of the pixels of an image object
BrightnessMean intensity of all pixels forming an image object
Relative Border to roadThe ratio of the shared border length of an image object (with a neighboring image object assigned to Road) to the total border length
Minimum overlap with a thematic polygonComputes the maximum value of the overlap between an image object and a selected vector layer in percent
GLCMBLUE_CONTRASTMeasure of the amount of local variation in the image in Blue Band
GLCMRED_CONTRASTMeasure of the amount of local variation in the image in Red Band
Red RatioEnhancement of red band
Source: [55].
Table 4. Description of land use classes and a summary of rule set used for the classification in eCognition.
Land TypesDescriptionRule Set for 2009Rule Set for 2015
1BackgroundBlack BackgroundMean Blue = 0Mean Blue = 0
2WaterLagoon, rivers, ponds, reservoirs, swamps, water wayMean NIR ≤ 840Mean NIR ≤ 1075
3Vegetated areaSparse and dense vegetation, forest, grasslandNDVI ≥ 0.34NDVI ≥ 0.34
4RoadRoads (Primary and secondary), tarred roadRoad layer map
Density ≤ 1 and Relative border to road ≥ 0.5
Road layer map
Density ≤ 1 and Relative border to road ≥ 0.5
5Other urban areasOther built up (residential, public, commercial, industrial etc.) except slumBrightness ≥ 1700
GLCMBLUE_CONTRAST ≥ 400
RatioRED ≥ 0.207
Min Overlap (old industrial and public space) ≥ 20
Brightness ≥ 1700
GLCMBLUE_CONTRAST ≥ 400
RatioRED ≥ 0.219
Min Overlap (old industrial and public space) ≥ 20
GLCMRED_CONTRAST ≥ 420
6SlumSlum and squatters settlementsMin Overlap Water ≥ 95%
210 ≥ GLCMBLUE_CONTRAST ≥ 65
GLCMRED_CONTRAST ≤ 200
1050 ≥ Mean Red ≥ 900
Min Overlap Water ≥ 95%
210 ≥ GLCMBLUE_CONTRAST ≥ 65
GLCMRED_CONTRAST ≤ 200
1050 ≥ Mean Red ≥ 900
7Open spaceExposed soil, concrete floor, dump sites etc.0.34 ≥ NDVI ≥ 0.245
GLCMBLUE_CONTRAST ≤ 65
0.34 ≥ NDVI ≥ 0.23
GLCMBLUE_CONTRAST ≤ 65
Table 5. Sample sizes allotted to the targeted land use class in 2009 and 2015.
Land UseVerified Reference Points
20092015
Vegetated area129117
Open space5459
Other urban area6971
Road4249
Slum7780
Water7878
Total449455
Table 6. Summary of LULC map accuracies (%) for 2009 and 2015.
20092015
Land UseUser’s Accuracy (%)Producer’s Accuracy (%)User’s Accuracy (%)Producer’s Accuracy (%)
Water98.7100.0100.0100.0
Vegetated Area100.0100.0100.0100.0
Open88.077.078.066.1
Slum88.086.076.785.0
Other urban83.091.077.587.3
Road100.098.098.079.6
Overall Accuracy94.089.0
kappa coefficient:0.90.86
Table 7. Land use and land cover changes in the period 2009–2015 (%).
Land UseTotal 2009Total 2015PersistenceGainlossTotal ChangeSwapAbsolute Value of Net Change
Vegetated area25.3420.1418.621.526.738.253.05** 5.20
Water48.0847.9046.920.981.172.151.96** 0.19
Open space6.998.512.376.144.6210.779.251.52
Road3.473.463.460.000.010.010.000.01
Other urban11.2212.386.735.644.4910.138.981.16
Slum4.897.613.014.601.886.483.762.72
Total10010081.1118.8918.8937.7826.9910.79
** means net loss.

