Article

Real-Time Observations of Dust–Cloud Interactions Based on Polarization and Raman Lidar Measurements

1
Key Laboratory for Semi-Arid Climate Change of the Ministry of Education, College of Atmospheric Sciences, Lanzhou University, Lanzhou 730000, China
2
Department of Physics, National Central University, Chungli 32001, Taiwan
3
Department of Mechanical Engineering, Kun Shan University, Tainan 71070, Taiwan
4
College of Physical and Environmental Oceanography, Ocean University of China, Qingdao 266100, China
*
Authors to whom correspondence should be addressed.
Remote Sens. 2018, 10(7), 1017; https://doi.org/10.3390/rs10071017
Submission received: 8 May 2018 / Revised: 19 June 2018 / Accepted: 20 June 2018 / Published: 25 June 2018
(This article belongs to the Special Issue Remote Sensing of Atmospheric Properties)

Abstract

:
Dust aerosols have significant impact on the environment and climate through long-range transport. We report, in this paper, a case of dust–cloud interaction process using combined measurements of a ground-based polarization and Raman (PR) lidar systems, and implemented by the spaceborne Cloud-Aerosol Lidar and Infrared Pathfinder Satellite Observations (CALIPSO) lidar observations. The dust event occurred on 14 March 2009 over East Asia. During the two hours of observing time, the ground-based lidar observed an ongoing process of decreasing of the depolarization ratio (DR) accompanied by the increase of the water vapor simultaneously, indicating a dust–cloud interaction and particle transformation. CALIPSO measurements also found similar layers of dusts and clouds over lands and oceans with properties similar to the ground based lidar measurements. Our observation was a real-time dust–cloud process with the observation of occurrence of particle transformation. The depolarization reduced from 0.2 to 0.1 corresponding to a change of aspect ratio from 1.2 to 1.1. A discussion of a dust–cloud interaction in terms of three-stage cloud processes is made based on back-trajectory analyses and lidar observations. The result shows that dust aerosols decrease the cloud extinction coefficient by 41% but increase the cloud optical depth (COD) of water cloud by 12.79%, compared with that of pure water clouds. Furthermore, if dust aerosols participate as cloud condensation nuclei (CCN) in cloud physical processes, then they significantly reduce the size of the cloud droplet by 44–79%. Finally, based on three-year collocated CALIPSO and CloudSat measurements from 2007 to 2010, we found approximately one-third of clouds are originally dusty in the spring over the Pacific Coast areas.

Graphical Abstract

1. Introduction

Asian dust, with an annual emission of 1000–3000 Tg [1,2], can have a significant impact on the regional and global environment and the climate as it extends over a wide geographic region of the Northern Hemisphere, due to strong westerly winds [3,4,5,6,7,8]. The impacts of dust aerosols in regions of northern Asia such as Korea [9,10], Japan [11,12], and North America [2,13,14], have been well studied. Furthermore, dust aerosols from ~25.1% of dust events can be transported from Asian dust sources to the Arctic along a short transport path [15], and even circle around the globe more than once by the strong westerly wind in the mid-troposphere [16].
Dust aerosols affect climate through direct and indirect processes. Besides the direct effects that result in surface cooling and warming of the atmosphere [17], dust aerosols also influence cloud and precipitation, as discussed in the review of the aerosol–cloud–precipitation interactions by Andreae and Rosenfeld [18]. Dust aerosols have been known as active ice nuclei (IN), due to the recognition of their potential importance to ice phase transitions in cold clouds [19], affecting the development of cloud microphysics [20,21]. Evidence of the strong ice nucleating behavior of dust aerosol was mainly obtained from laboratory studies [22,23], and field measurements [24]. During the past few decades, more attention has been dedicated to investigating dust–cloud interactions based on observation data and model simulation. Levi and Rosenfeld [25] confirmed that IN concentrations considerably increase in the presence of desert dust in northern Israel. Sassen [26] found Asian dust-induced ice clouds over Alaska at temperatures far warmer than those expected for normal cirrus cloud. It is generally understood that dust aerosols, which are intrinsically hydrophobic and resist uptake of water vapor, can become hydrophilic by acquiring soluble coatings of sulfate, nitrate, and other compounds from interaction with air pollutants during the long-range transportation [27,28,29,30]. Thus, dust aerosols can be activated as cloud condensation nuclei (CCN) to form cloud droplets and increase or/and suppress precipitation [25,31,32].
Dust aerosols, which have experienced morphological change during transport, have been extensively studied by sampling in the field and analysis in the laboratory with electron microscopes or other instruments [29,31,33]. Li and Okada [34] have found that the particles are essentially spherical, with median circularity factor about 0.9 but less than 0.8 for source regions in China. The surface processes are microscopic and is difficult to observe by remote sensing in the atmosphere. However, lidar measurements can provide information about particle shapes in terms of polarization measurements [35,36]. By comparison of vertical and parallel polarizations of backscattering light, one can derive information about the sphericity of particles.
In this study, we will report a real-time observation of morphological evolution of dust aerosols by use of a ground-based lidar and spaceborne CALIPSO lidar. The combination of data from both instruments provides the possibility of observations of the occurrence of dust–cloud interaction in real time. In Section 2, several instruments and their data used in the study is briefly introduced. In Section 3, formation of marine water clouds induced by dust aerosols and dust–cloud interaction at low latitudes over East Asia is discussed. Finally, a conclusion is given in Section 4.

2. Instruments and Data

2.1. Ground-Based Polarization/Raman (PR) Lidar

A ground-based PR lidar has been developed to study the vertical structure of atmospheric aerosols, clouds, and water vapor in Chungli, Taiwan (24.97°N, 121.19°E) [37,38]. The PR lidar, which employs two telescopes with diameters of 20 and 45 cm, can simultaneously detect the polarization measurement at 532 nm and the Raman signals of N2 and H2O. The Raman lidar uses the 355 nm wavelength to excite Raman signals of N2 and H2O, and measures the backscattering signals at wavelengths 387 and 407 nm with two separate detectors through narrow band filters. The spatial resolutions for the polarization and Raman channels are 7.5 and 24 m, respectively. The particle linear depolarization ratio, which is zero for spherical particles (such as cloud droplets) but non-zero for irregularly shaped particles (e.g., dust and ice crystals), has traditionally been employed for identifying particles in terms of their spherical or non-spherical shapes [39]. Raman channels are used to retrieve profiles of the water vapor mixing ratio. In this study, the characteristics of the depolarization ratio (DR) with increasing humidity are investigated to show the possibility of dust aerosols forming spherical particles by absorbing water vapor.

2.2. Spaceborne Cloud-Aerosol Lidar and Infrared Pathfinder Satellite Observations (CALIPSO) Lidar

The spaceborne Cloud-Aerosol Lidar and Infrared Pathfinder Satellite Observations (CALIPSO) lidar is designed to globally acquire vertical profiles of clouds and aerosols with dual wavelengths at 532/1,064 nm and with a 1 m diameter telescope [40,41]. CALIPSO data of the following information are especially useful: (a) the attenuated backscatter signal (which is similar to backscattering coefficient); (b) the DR; (c) color ratio (ratio of backscatter coefficients of 1064 nm/532 nm); and (d) the vertical feature mask (VFM). Items (a) and (b) are similar to the ground-based lidar measurements described above. The DR from the CALIPSO lidar observation is valuable for identifying dust aerosols [42,43]. The color ratio can provide information on particle sizes based on the backscattering coefficient of 1064 nm relative to that of 532 nm. VFM is used to indicate nature of the particulate matter, such as dust, cloud, etc. In this study, the CALIPSO lidar was used to trace dust aerosols and dusty clouds during the dust event, and observations from collocated CALIPSO lidar and CloudSat radar are used to investigate the variation and microphysics of dusty water clouds in the downwind region.

2.3. Others

The NOAA/Air Resources Laboratory’s HYbrid Single-Particle Lagrangian Integrated Trajectory (HYSPLIT) model is able to compute simple air parcel trajectories and complex dispersion mainly based on the Lagrangian approach and the Eulerian approach [44]. In this study, HYSPLIT 72 h backward trajectories of the air masses were used to locate the dust source region and long-range transport path of the dust event using NCEP Global Data Assimilation System (GDAS) meteorological data as the input. Approximately 500 single backward trajectories were obtained from the HYSPLIT model for the altitude range from 100 to 3500 m during the period of 12:00 to 24:00 Local Standard Time (LST) on 14 March 2009 at the PR lidar site. The time interval and the altitude resolution are 1 h and 100 m, respectively. Finally, probability density function (PDF), defined as ratio of number of trajectories in each latitude/longitude grid (0.5° × 0.5°) and total trajectories, is calculated as descried in Huang et al. (2015). In situ measurements e.g., PM10, PM2.5, and relative humidity (RH), in Chungli, Taiwan, provided by the Environmental Protection Agency of Taiwan, are used to show the ground deposition during period of dust events.

3. Results and Discussions

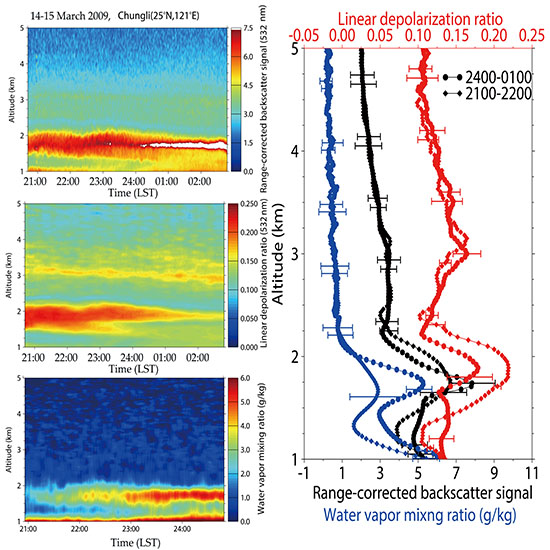
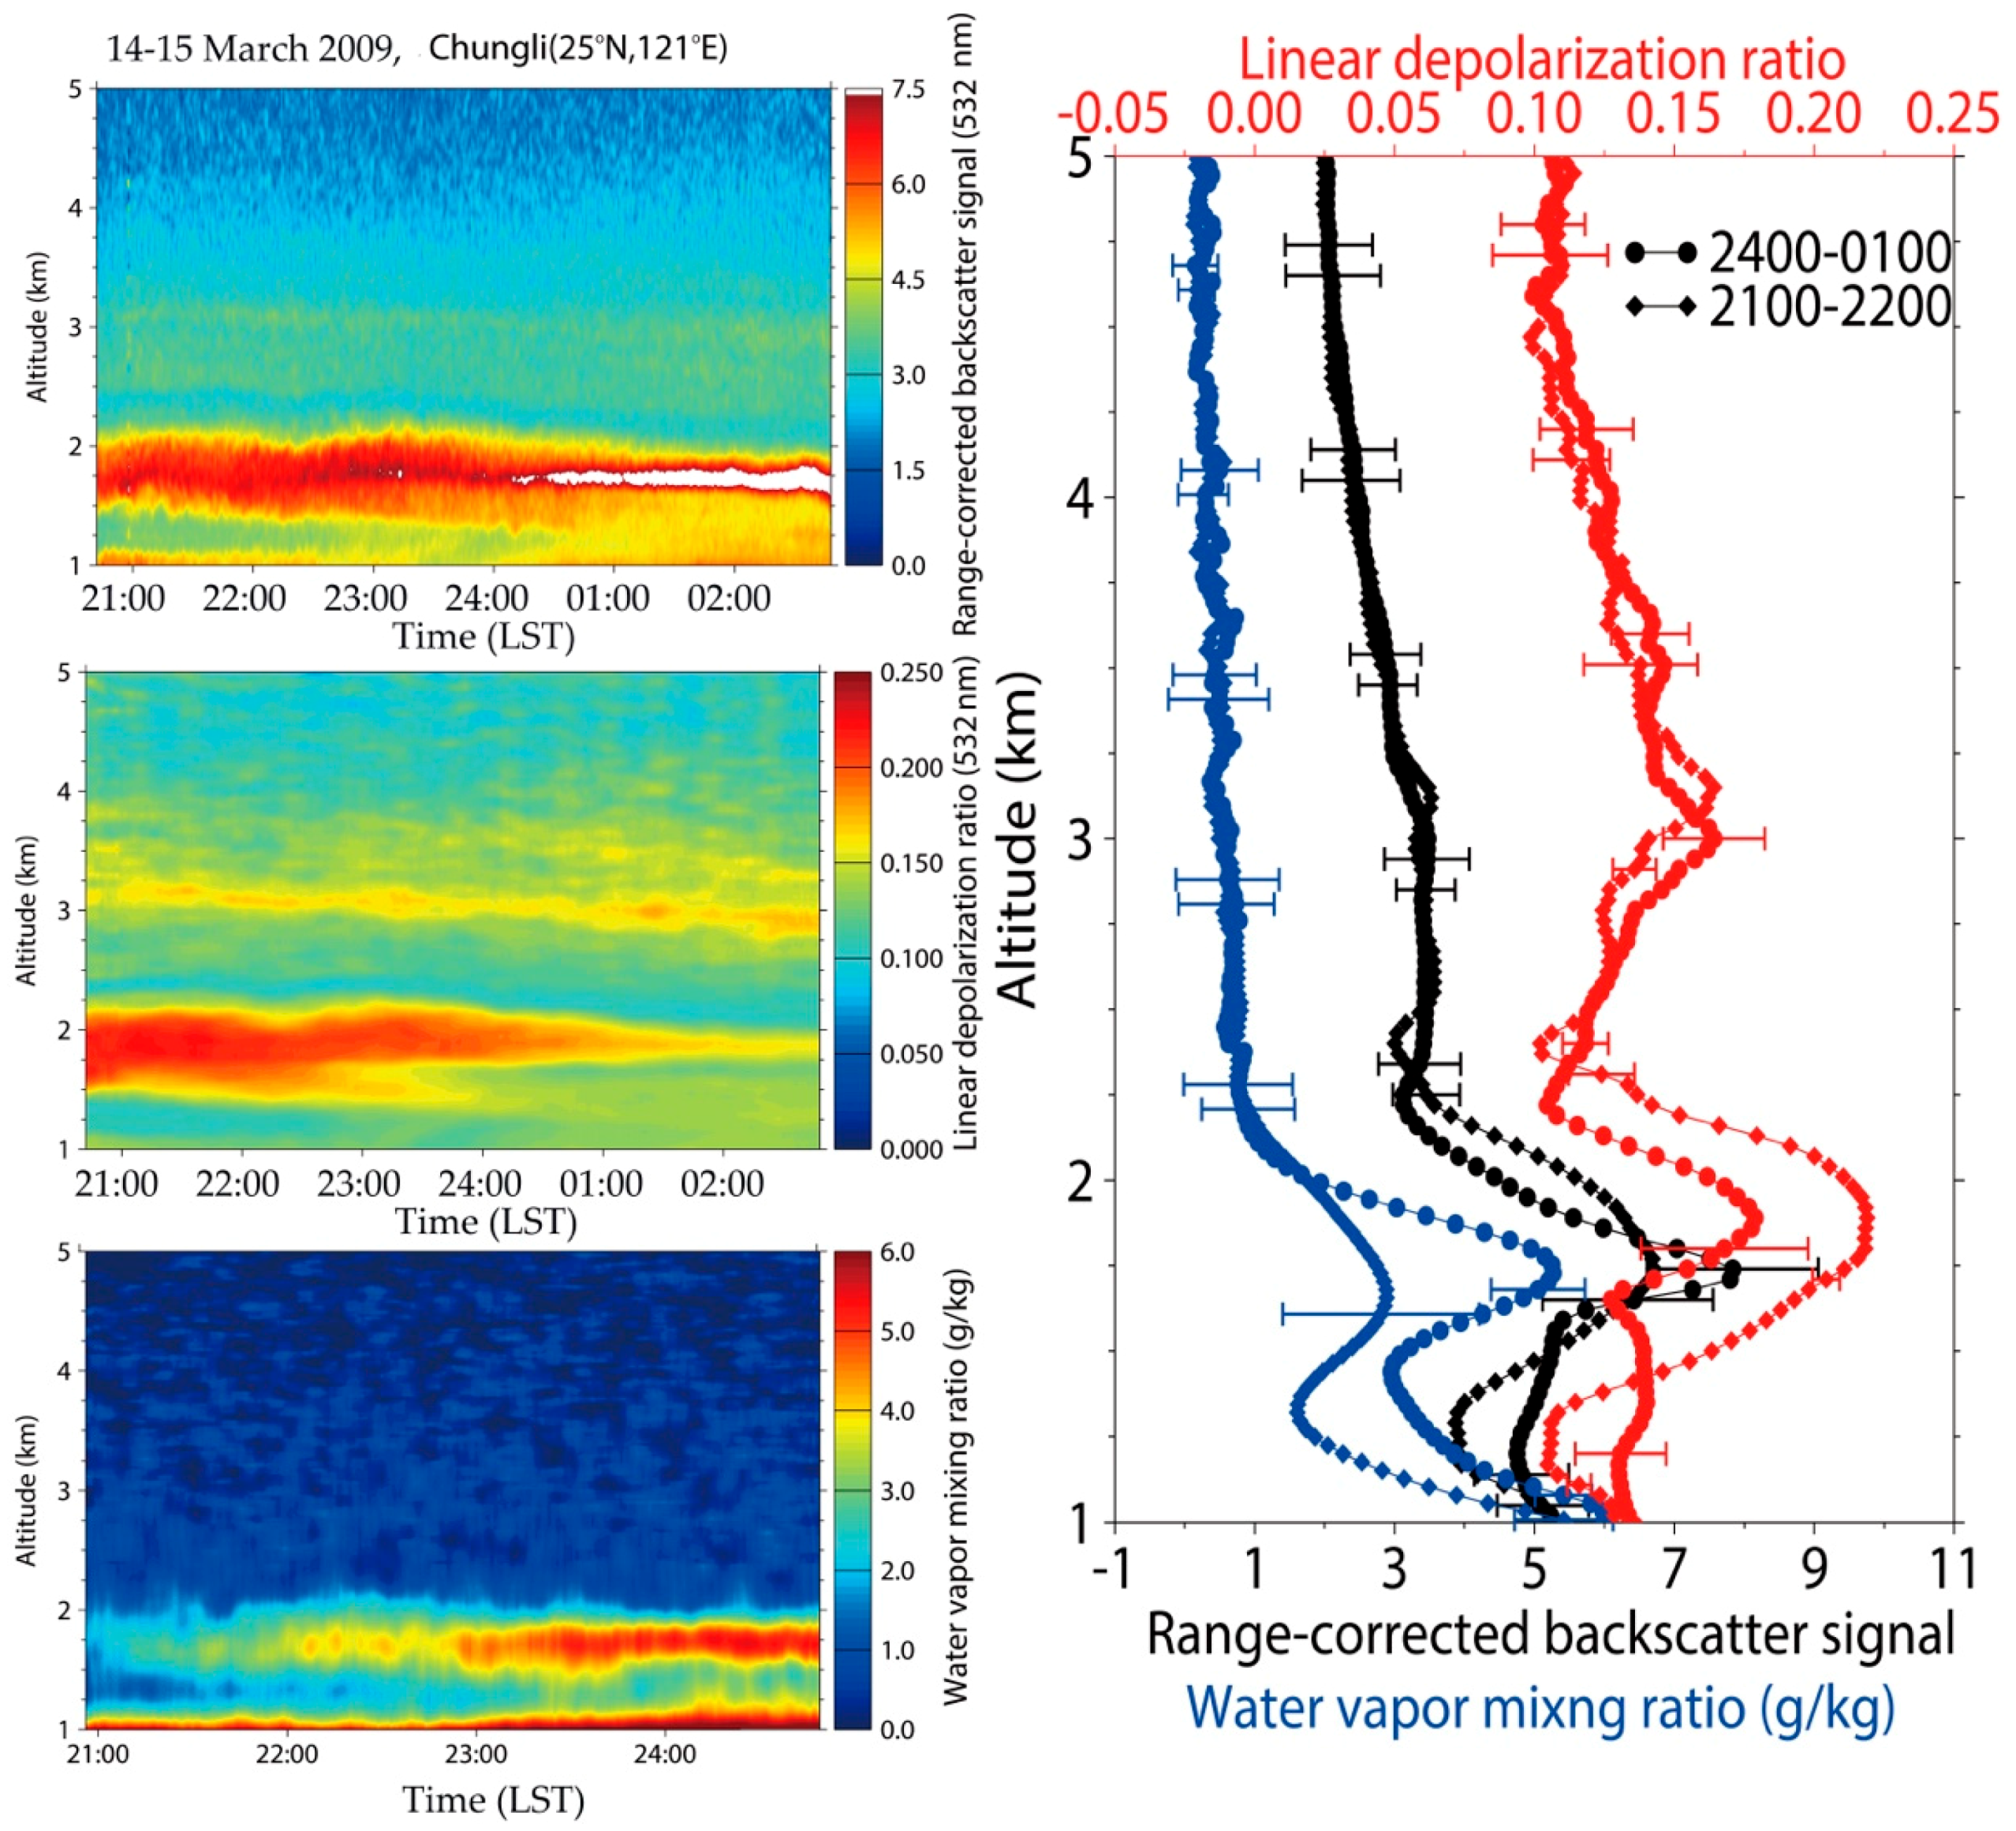
3.1. Formation of Dusty Water Cloud Observed by Lidars

On 14 March 2009, a heavy dust storm affected vast regions of East Asia. The ground-based measurements indicated that the value of PM10 exceeded 500 μg/m3 in Inner Mongolia, Beijing, and other cities in North China [10]. The radiative effect caused by the dust aerosols was studied for this event [45]. At the PR lidar site, PM10 mass concentration and RH were observed near the surface to determine the effect of the dust event. The PM10 value reached a peak of approximately 150 μg/m3 in Chungli City at 16:00 LST, as shown in Figure 1. In addition, the RH significantly decreased as the PM10 increased.
The observations from the PR lidar began at 20:45 LST on 14 March, as shown in the left panel of Figure 2. Initially, two dust layers were apparent at approximately 2 and 3 km, with strong lidar backscattering signals and large DR. In addition, the upper layer at 3 km exhibited a weaker backscatter than the lower 2 km layer. To compare the results before and after the dusty cloud occurred more clearly, periods at 21:00–22:00, 24:00–01:00 of observation data are selected to be averaged. Then profiles of range-corrected lidar backscatter signal (black), linear DR (red), and water vapor mixing ratio (blue) was shown in the right panel of Figure 2. The DRs for these two layers were similar to the values of approximately 0.2–0.3, which are confidently associated with dust storms [44,46]. Lidar ratios for dust aerosols of 45–55 (±15%) are generally retrieved from the PR lidar signals. As the water vapor at 2 km gradually increased, a dusty water cloud layer appeared in the low layer at approximately 22:00 LST, according to the stronger backscattering signals, the smaller DR, and the increased water vapor content. However, the upper dust layer only slightly changed during this observation period because no water vapor existed at this height. Eventually, the value of DR at 2 km decreased to approximately 0.1, indicating significant changes in the morphology of the dust aerosols. This result implied that the dust aerosols may act as CCN by absorbing water vapor, thereby transitioning into a water cloud as the water vapor increased.
To locate the source region and the transport path of the dust aerosols, 48 h backward trajectories using the NOAA HYSPLIT model were analyzed for the duration of the dust episode with the PR lidar site selected as the starting point. We calculated approximately 500 single backward trajectories over the altitude range of 100 to 3500 m for the period from 12:00 to 24:00 LST on 14 March 2009. The time interval and altitude resolution of the backward trajectories were 1 h and 100 m, respectively. Subsequently, the PDF of all of the trajectories at each 0.5° × 0.5° grid was calculated. Figure 3 shows that most of the backward trajectories were traced to the Gobi Desert, which is the second largest dust source in East Asia. Therefore, the dust aerosols were long-range transported from the Gobi Desert to Taiwan Island across Southeast China. CALIPSO measurements confirm the trajectory analysis that the dust event affected vast regions of China, as shown in Figure 4. According to the HYSPLIT backward trajectory analysis, the average travel time of the air masses from the Gobi Desert to the PR lidar site was approximately 43 h over a distance of ~2000 km.
The vertical structures of dust aerosols were measured by the spaceborne CALIPSO lidar, as shown in Figure 4. At 13:09 LST on 14 March 2009, CALIPSO passed over most of China while on a northward orbit. The CALIPSO measurements are useful for understanding the origin and the transport of the dust storm. One can see that a dust aerosol layer from the surface to 2 km height covered most of the area below the CALIPSO orbit in the eastern China at latitudes of 25°N to 40°N, from the western Taiwan Strait to Inner Mongolia at a length of approximately 2200 km. The mean profiles of total attenuated backscatter at 532 nm, DR, and color ratio are calculated from CALIPSO lidar observation around 13:40 14 March over east China (32°N–38°N, 112°E–116°E), as shown in the right panel of Figure 4. Error bars are standard deviations computed from the vertical bins of each profile. CALIPSO measurements show a DR of about 0.2 and a color ratio of about 0.6. In addition, an optically thinner dust layer with DR of about 0.1 located between 3 km and 5 km was also observed.
At 01:33 LST on 15 March, CALIPSO passed southward, mainly over the oceanic region off the east coast of China. In Figure 5, the black dotted line indicates the location of CALIPSO which was closest to the ground-based PR lidar site, with a distance of approximately 242 km. We divided the affected region in this path into three regions, as indicated by blocks A, B, and C in the figure. The VFM in region A, corresponding to northern Korea and Japan, shows dust layers at 1 and 4 km. In region B, which covers approximately 15~25°N and 120~124°E, is the most interesting region because it is close to the lidar site. The VFM in region B has clouds mostly within 1.5~3 km in the lower layer (light blue color) and has dust (brown) above 3 km at the top. Dust cloud modification occurs between regions A and B over the warm East China Sea. The DR from the CALIPSO observation is comparable to that of the ground-based measurements. In region C, the VFM shows that clouds mostly existed over the Southern Ocean, likely due to marine water clouds. According to the backward trajectory analysis, the lower dusty cloud observed by the ground-based lidar moved toward the northeast (wind direction of 261°) at a speed of 11 km/h in the direction of the CALIPSO orbit in Figure 5. This result indicates that the same dusty water cloud was simultaneously detected by the PR lidar and CALIPSO lidar, confirming that the long-range transported dust aerosols transitioned into a warm marine cloud.

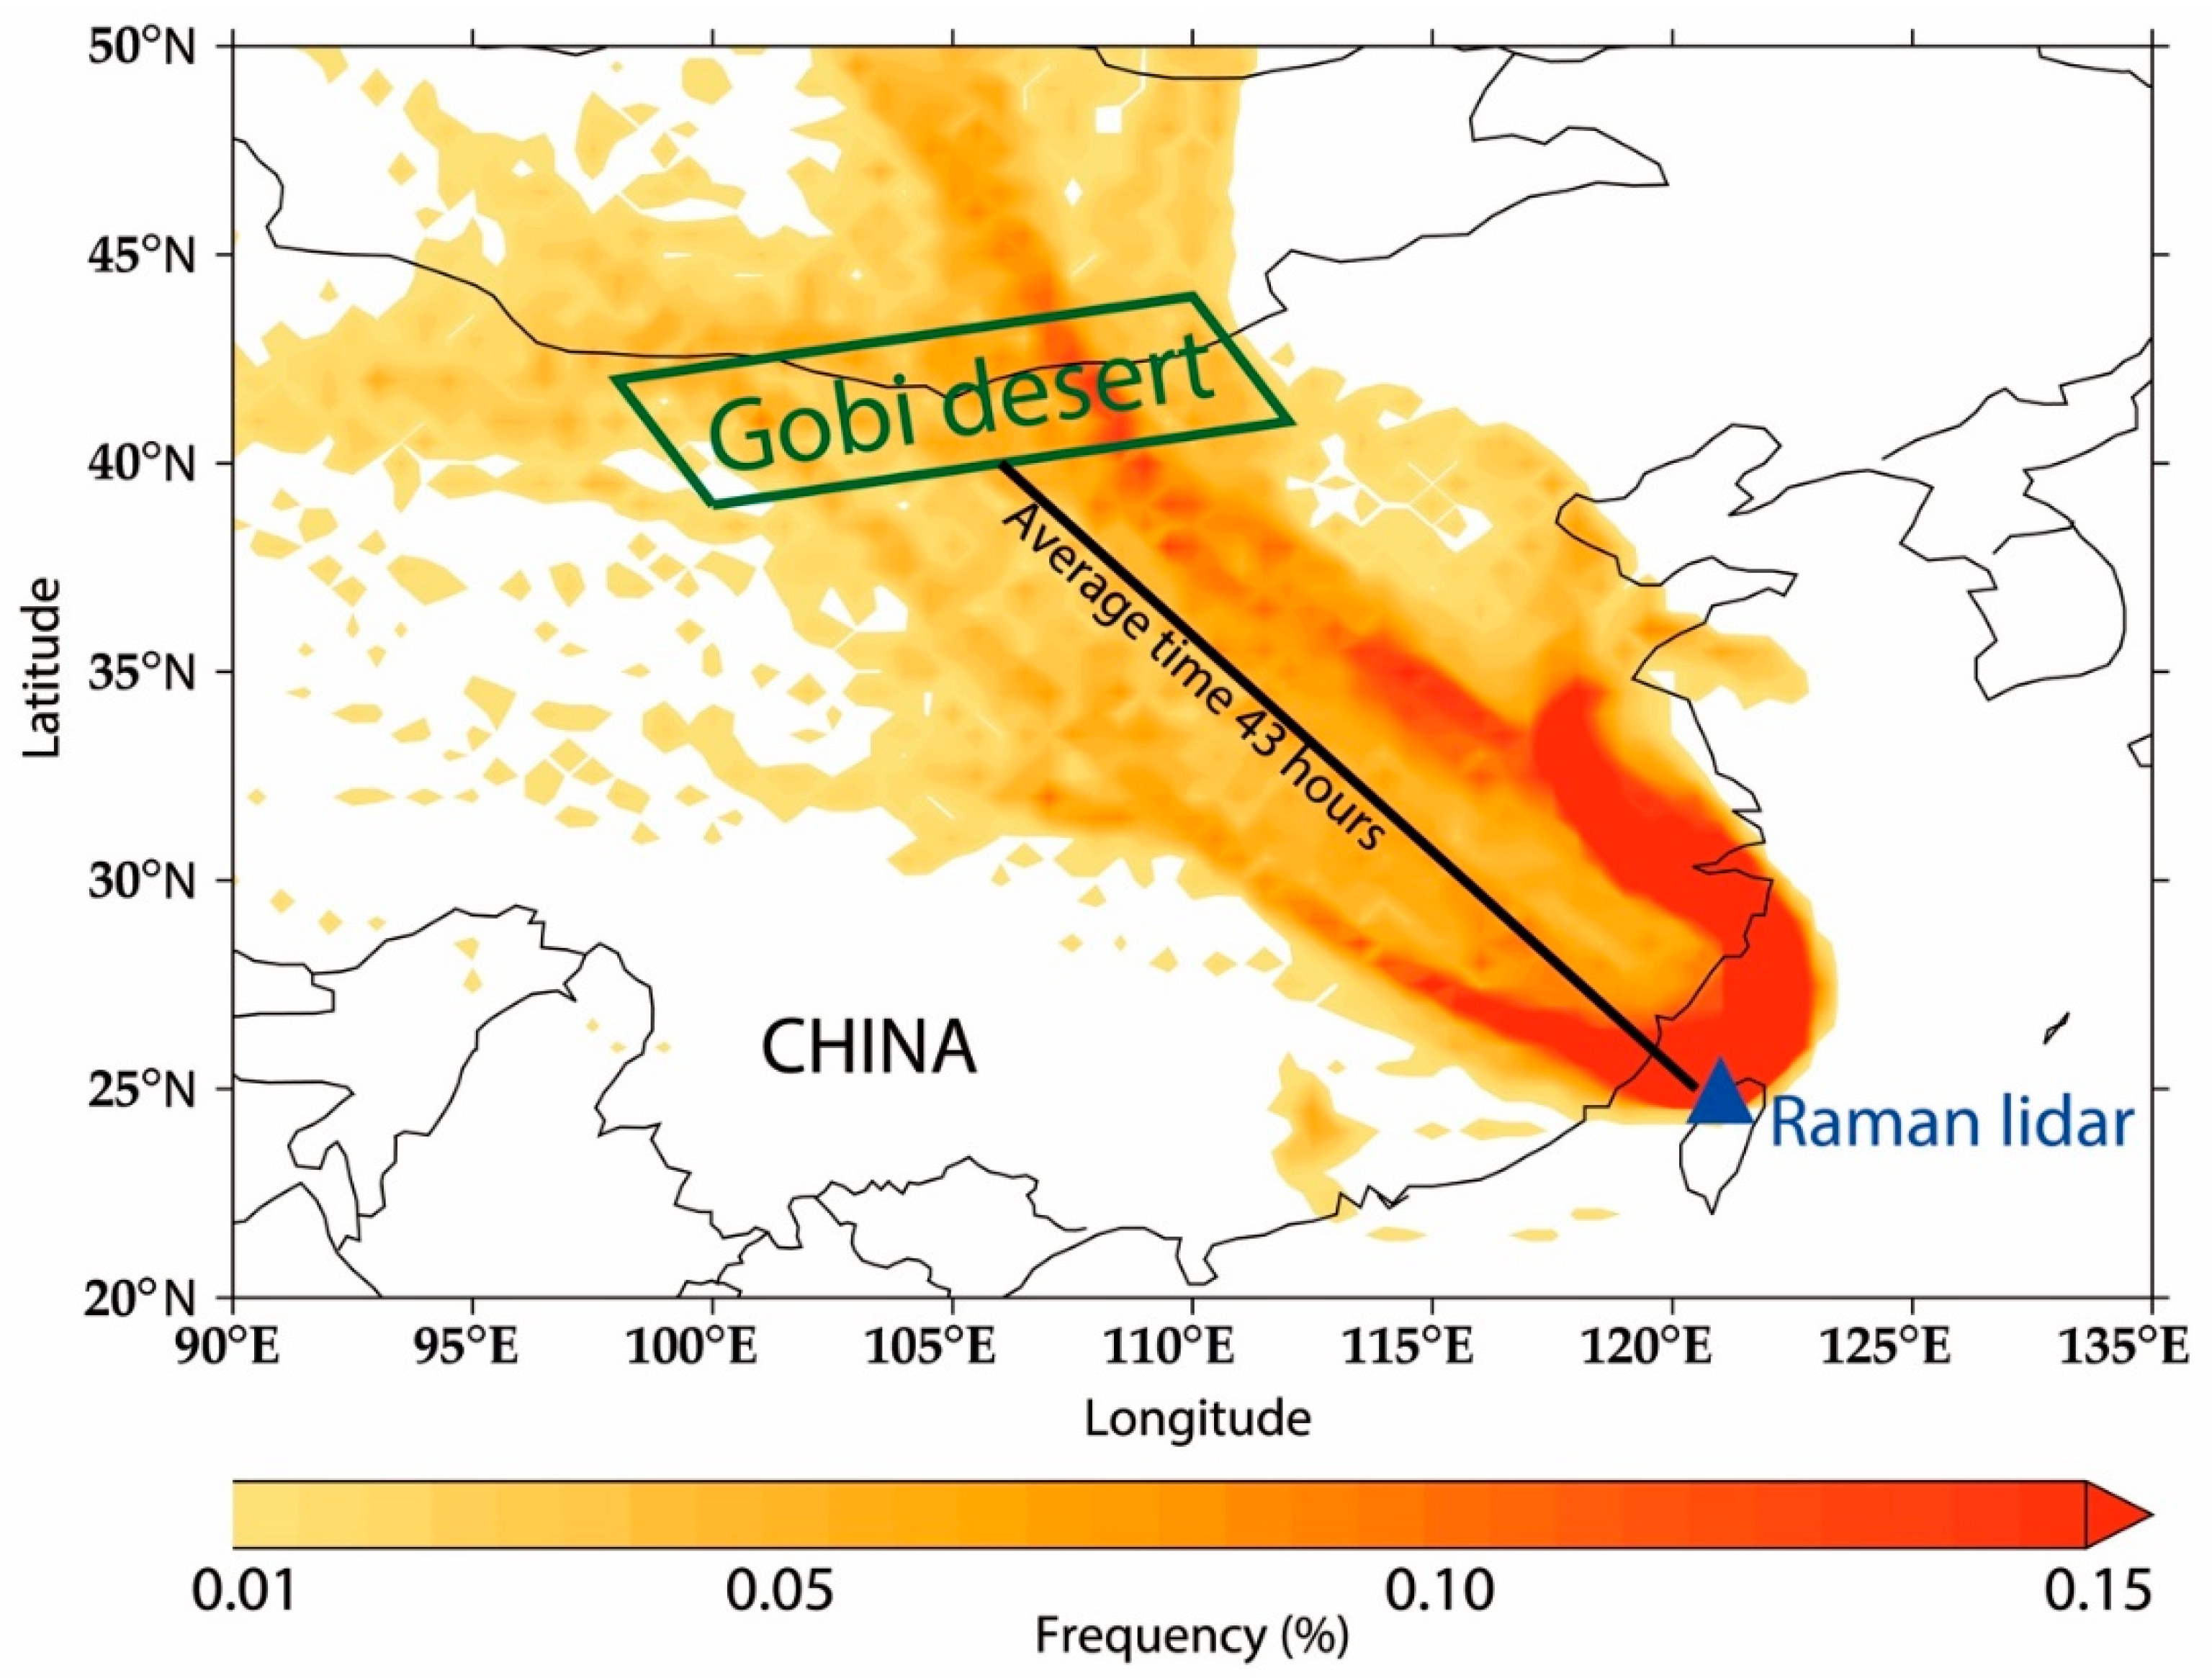
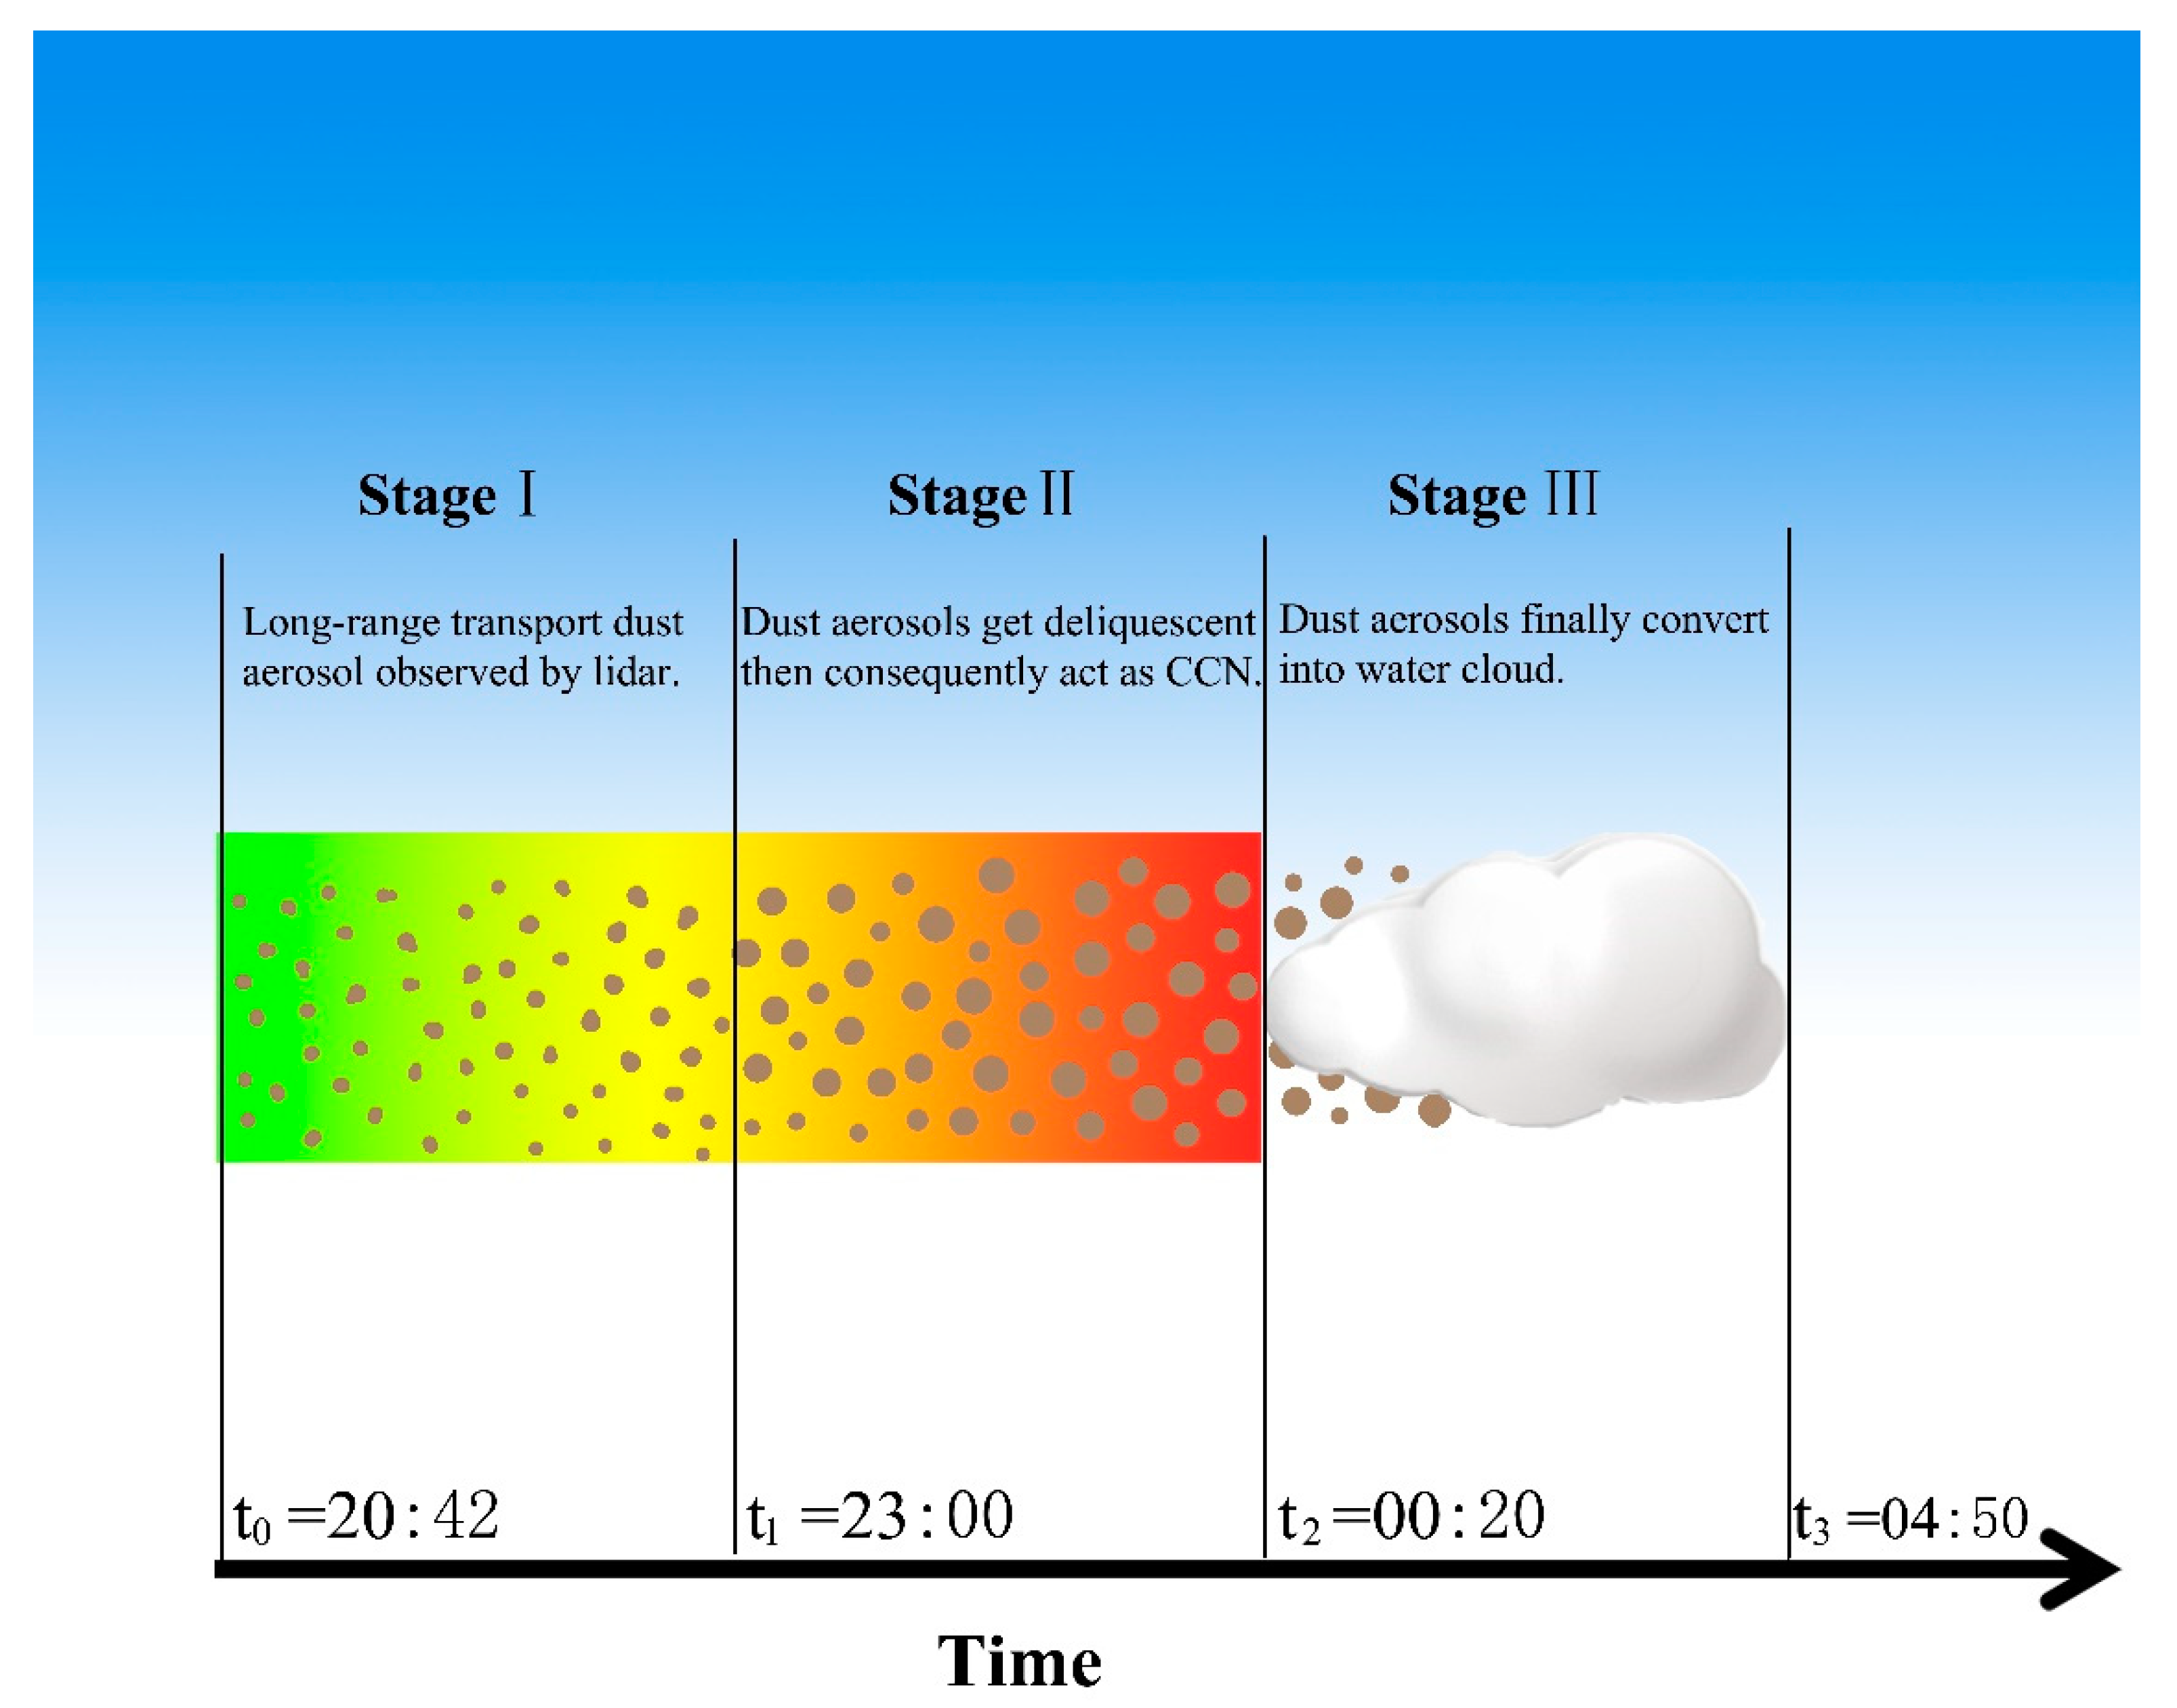
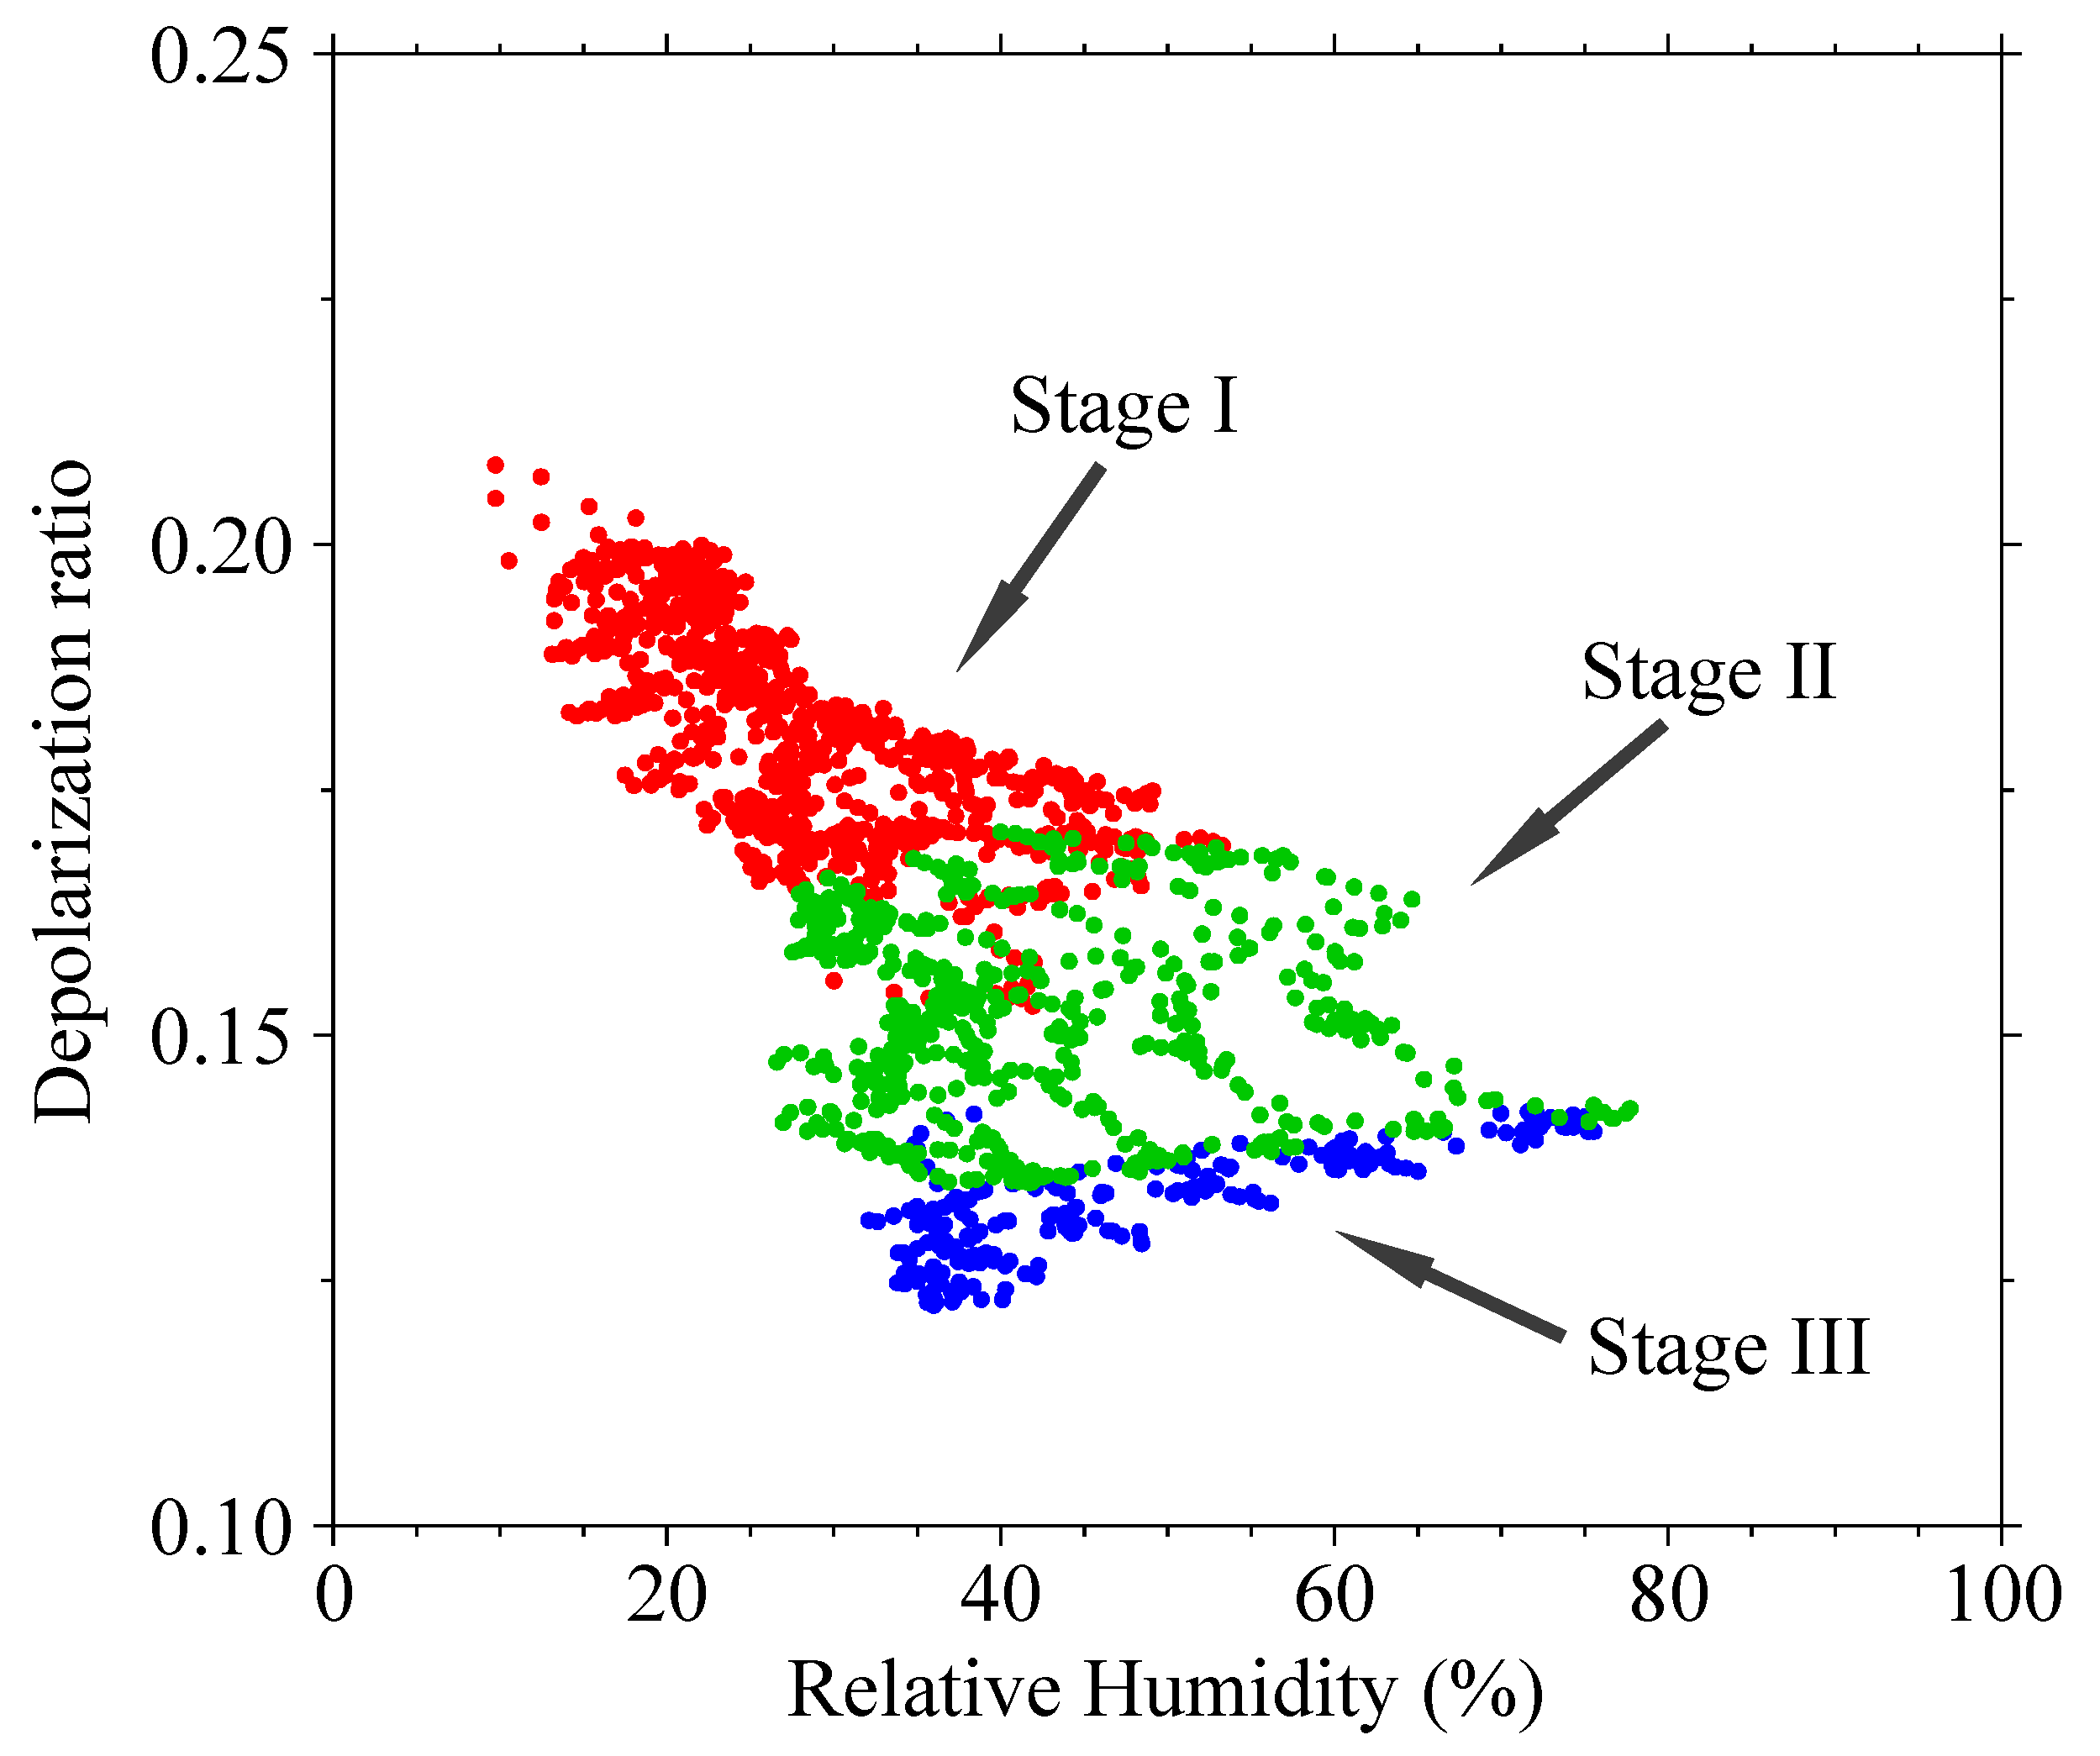
3.2. Stages of Long-Range Transported Dust Aerosols Converted into Water Cloud

Dust aerosols are typically lofted into the atmosphere by regional weather systems. During their long-range transport, dust aerosols interact with air pollutants and sea salt, enhancing their liquid cloud-nucleating ability [48,49]. By comparing data of the ground-based lidar, CALIPSO measurements, and backward trajectory studies, we can provide a better picture to understand the dust event from 14–15 March in Taiwan by construction of a three-stage process, as shown in Figure 6. In Stage I, dust aerosols were observed by the ground-based lidar and the PM10 value reached about 91 μg/m3, which is about three-fold higher than the normal level. At this time, the Raman lidar started to show a small trace of water cloud at 1.5 km, as shown in Figure 2. The water vapor signal was low, but started to increase gradually during this stage. In Stage II, the water vapor increased while dust aerosols were aloft. We propose that this is the beginning of the interaction between dust and water vapor, and the occurrences of hygroscopic growth and particle growth processes. This stage is characterized by an enhanced backscattering ratio and reduced DR, as shown in Figure 2. During Stage III, the backscattering signals and water vapor became high, and DR of the particles became low (~0.12), as shown in Figure 7. Reduced DR implies a changing dust morphology, which is most likely due to uptake of water vapor. The process is illustrated by the CALIPSO measurements. As shown in Figure 5, there is a dust cloud over the east China Sea (between regions A and B). During this stage, dust aerosols were transformed to be more spherical under moist condition. However, the optically thinner dust layer at 3 km remains unaffected by the water vapor.
Atmospheric RH was estimated from combined Raman lidar data and radiosonde temperature at a nearby sounding station. A scatter plot of the DR and RH between 1.5 and 1.7 km above the ground, shown in Figure 7, demonstrates that the DR of the lower dust layer decreased rapidly with RH. The results confirm a good correlation between the two parameters, and suggest that the particle change from non-spherical dust to spherical particles (droplets) corresponds to an increase in the water vapor concentration. These changes strongly suggest that the air mass containing the upper dust layer maintained dry conditions during the long-range transport from the dust source region, but the lower dust layer near 1.5 km was modified through mixing processes with the highly humid air.
The interaction of the dust aerosols with the water vapor is known as hygroscopic growth, and refers to processes in which particles absorb water vapor and dissolve into droplets. For example, the hygroscopic growth process of CaCO3 forms aqueous Ca (NO3)2. Particular studies have indicated that this process can proceed at low humidities (~17%), and should be more efficient at high humidity [31]. Images of aqueous droplets have been reported for many sampled particles. Song et al. [50] have also reported the first inland field observation of CaCl2 particles, which probably transitioned from CaCO3 through the reaction with gaseous HCl that is likely released from the reaction of sea salt with NOx/HNO3. Tobo et al. [32,33] showed calcium-rich Asian dust could be converted into aqueous droplets through reactions with HNO3 and HCl under high humidity conditions over marine atmosphere, based on single particle analysis. Since we do not have images of the collected particles, we may characterize the particle shape in terms of the aspect ratio based on DR. It should be noted that DR is sensitive to most of the microphysical aerosol parameters, such as particle shape, absorbance, and size etc. [51]. The spherical particles have aspect ratios close to 1 based on ground-based studies. Un-aged, atmospherically unprocessed Asian dust is shown to have aspect ratios between 1.4 and 1.5 in the source region [52], and 1.22 to 1.31 in Japan [34]. The increase of particle sphericity should be correlated with reduced DR, as reported in this paper. Based on results calculated by Sun et al. [53], we estimated that the aspect ratio for the DR of 0.1 at 532 nm was approximately 1.1, which is similar to spherical particles. Therefore, we confirmed that the lower dust layer interacted with sea salt to form soluble particles (such as CaCl2 or Ca(NO3)2), acting as CCN that absorb water vapor from the ocean, and finally, converted into a warm dusty cloud.

3.3. Microphysics of Marine Water Cloud Affected by Asian Dust

A comparison of the microphysical properties of dusty water clouds and pure water clouds at low altitudes over the ocean is studied using CALIPSO lidar level 2 data, as summarized in Table 1. Three cases of dusty water cloud and eight cases of pure water cloud were selected for analysis. The result shows that dusty water clouds have thicker geometrical thicknesses, but smaller mean extinction coefficient compared with that of pure water clouds. Furthermore, cloud optical depth (COD) of dusty water clouds is 13% larger than those of pure water clouds. To further investigate the effects of dust aerosols on the microphysical properties of water clouds, we calculated the droplet effective radius(Re) of cloud droplets from the mean cloud extinction coefficient and DR. The relationship between Re, DR, and extinction coefficient of cloud was given in the Equation (1) in the study of Hu et al. [54] based on Monte Carlo simulations, incorporating the CALIPSO instrument specifications, viewing geometry, and footprint size. Next, the ratio of Re for all of the selected cases divided by that of dusty cloud on 15 March was calculated in order to reduce the uncertainty in estimate. The result indicates that if dust aerosols participate as CCN in cloud physical processes, then they significantly reduce the size of the cloud droplet by 44–79%. Saito and Hayasaka [55] found that dust aerosols decrease Re of warm cloud droplets by 12% and increase the COD by 27% over East Asia based on MODIS observation data.

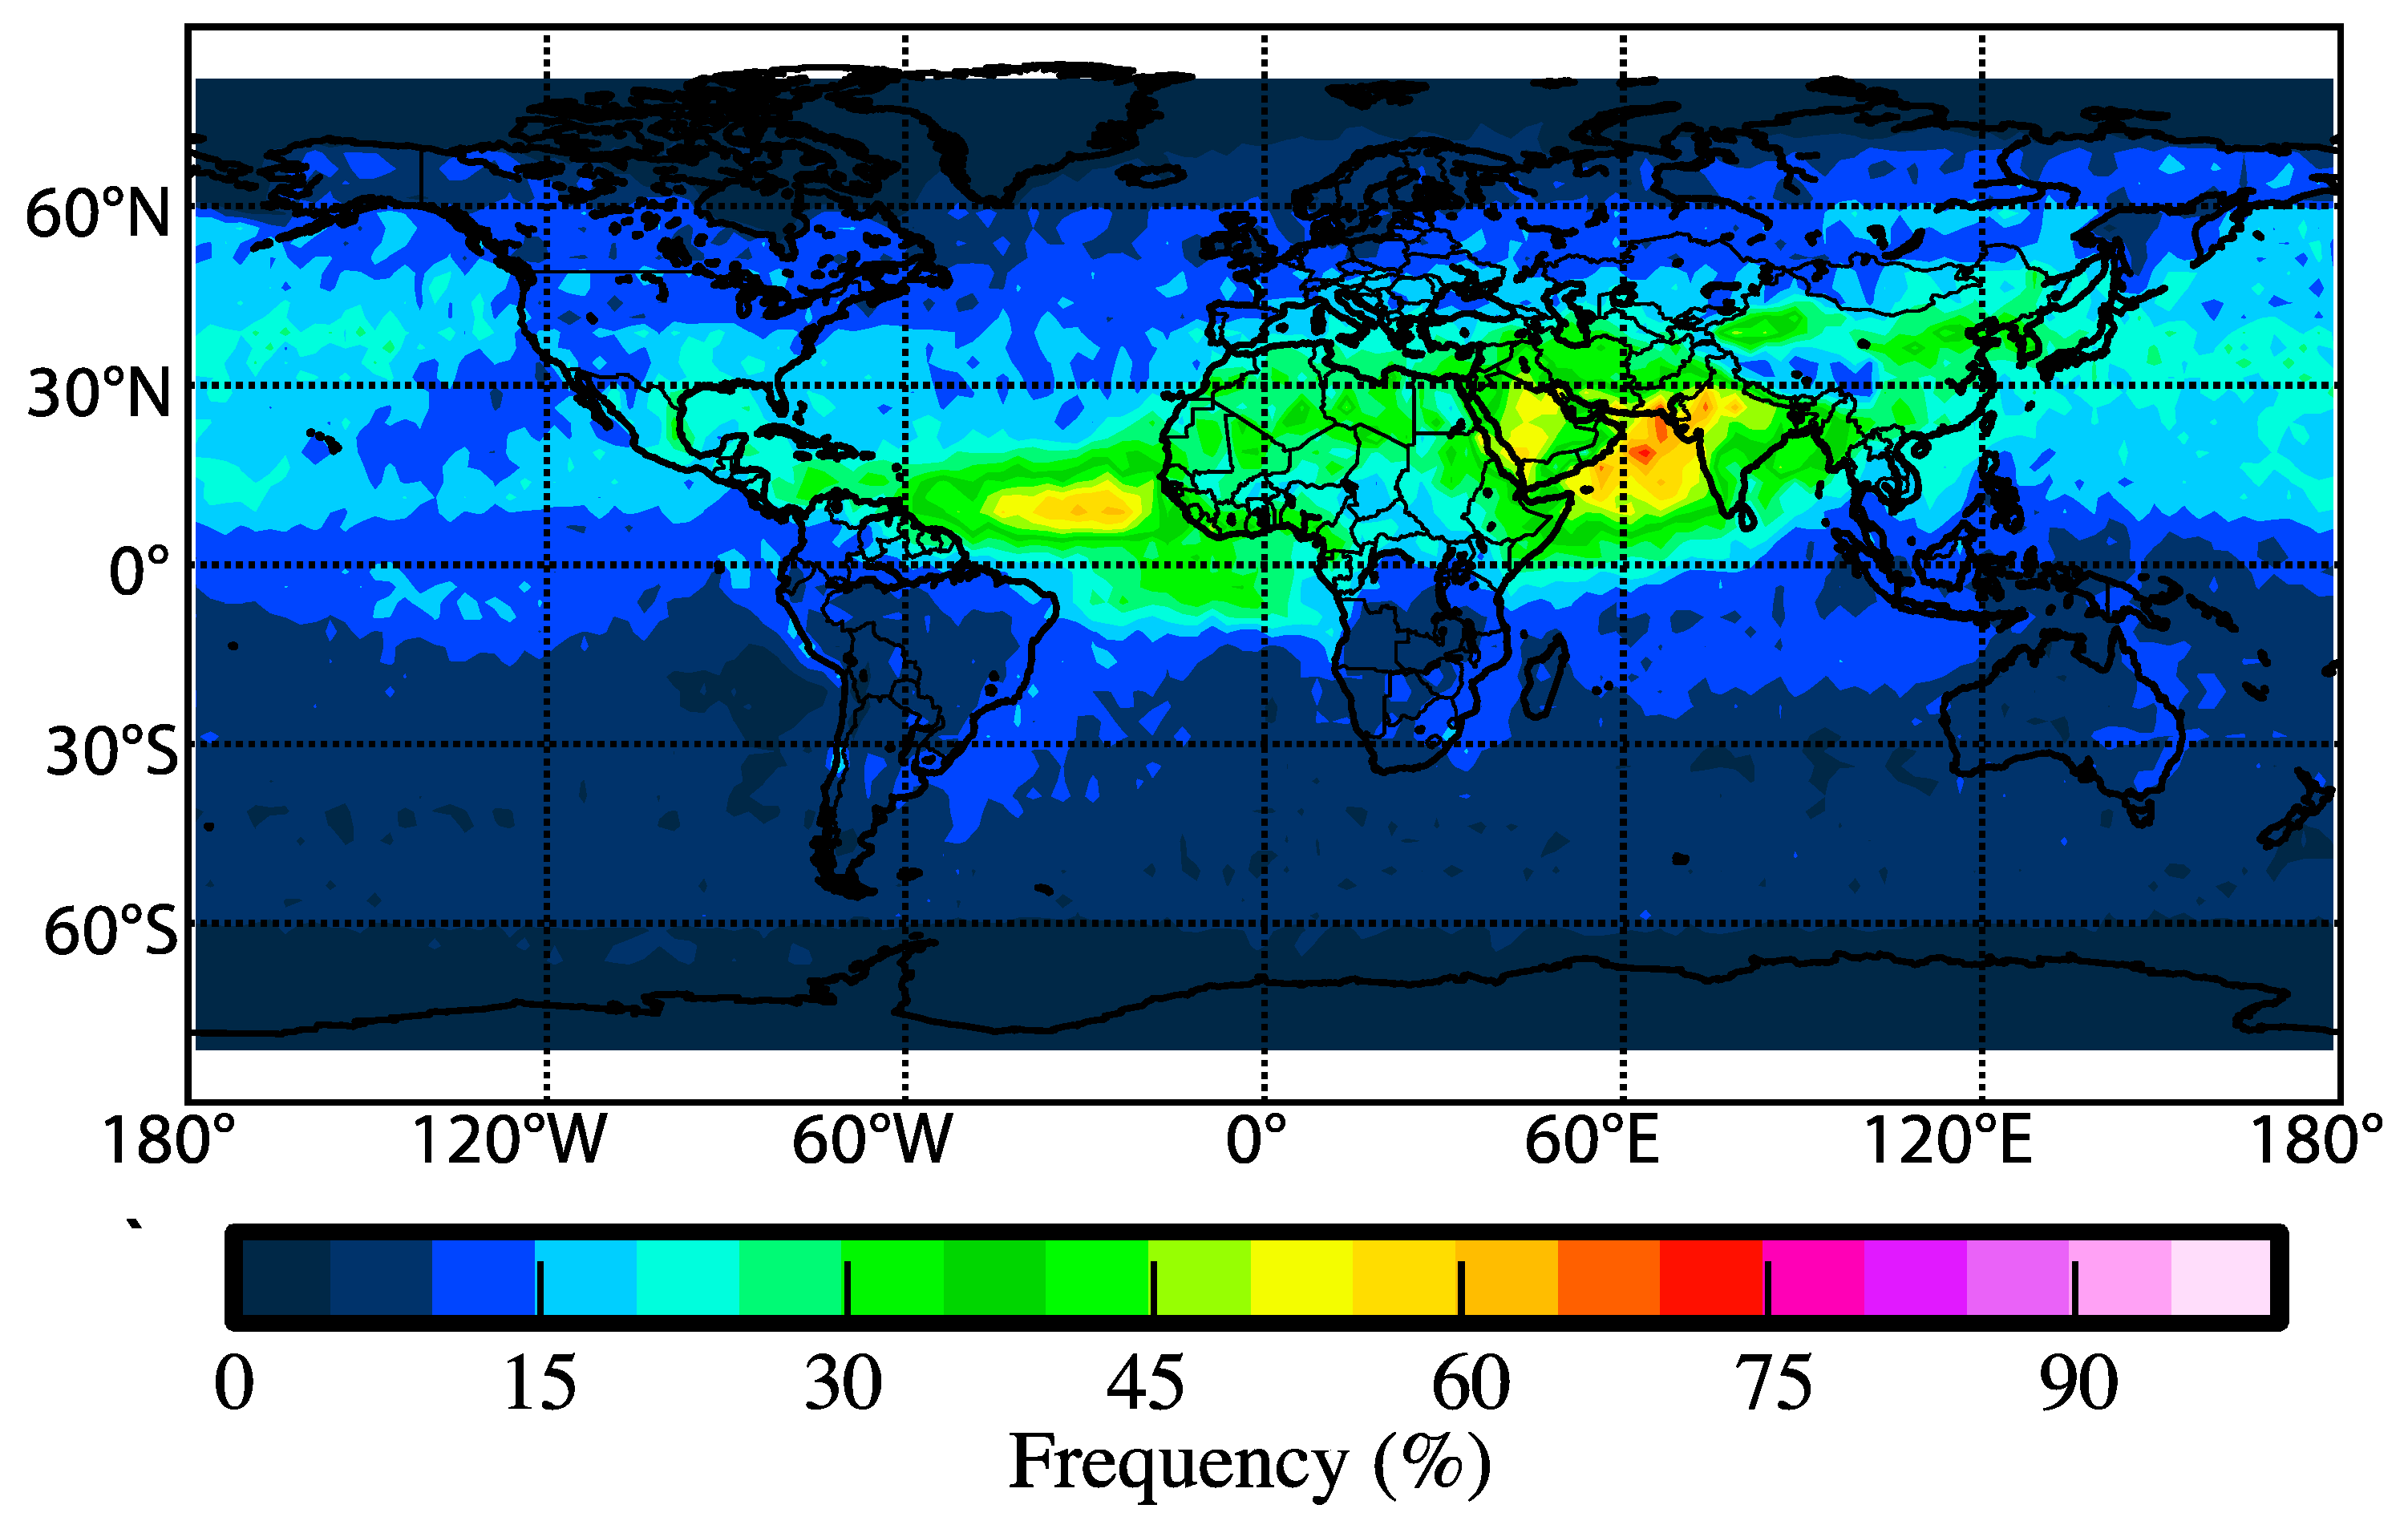
3.4. Global Distribution of Dusty Cloud in Spring

Collocated CALIPSO and CloudSat measurements were used to investigate the global distribution of dusty clouds between 2007 and 2010 in spring, as shown in Figure 8. Dusty clouds could be identified with clouds existing in a dust plume environment, while pure clouds are those in dust-free conditions, using the method as proposed by Wang et al. [56] and Jin et al. [57]. Here, we define dusty clouds as clouds observed within 50 m of the dust aerosols. Firstly, dust aerosol or cloud layer could be identified from CALIPSO lidar level 2 data product. Then the cloud mask data from CloudSat 2B-GEOPROF is used to confirm the presence of clouds and provide confidence of dusty cloud. The results show that two main high dusty clouds over the world are located at south Asia and west of Africa, up to more than 60%, and approximately one-third of clouds are dusty in the spring over the Pacific Ocean. Furthermore, cloud fraction of dusty cloud at low latitudes over the Ocean is about 20% in spring across east Asia to North America. Therefore, dust aerosol may have significant impact on cloud properties in the atmosphere.
Special attention has been dedicated to dust–cloud interactions globally in recent decades. For example, dust effects on clouds and precipitation have been discussed in the review of aerosol–cloud–precipitation interactions by Andreae and Rosenfeld (2008). Wurzler et al. (2000) [58] have confirmed that modified dust aerosols can serve as giant CCN, and thus, have a significant impact on the microphysical development of clouds. In addition, dusty clouds can lead to changes in radiative properties, latent heating, and precipitation, compared with dust-free conditions. Huang et al. (2006a) have confirmed that the mean ice water path and liquid water path of dusty clouds are 23.7% and 49.8% lower than their dust-free counterparts, respectively; the instantaneous net radiative forcing increased from −161.6 W/m2 for dust-free clouds to −118.6 W/m2 for dust-contaminated clouds, due to changes in the cloud microphysics from dust aerosols. Doherty and Evan (2014) [59] confirmed that the low cloud fractions increase by 3% to 10% with high mineral aerosol loadings over the tropical North Atlantic; this process is called the dust-stratocumulus indirect effect.

4. Conclusions

We investigated an Asian dust event originating in the Gobi Desert in March 2009 observed by combined ground-based Raman/polarization and spaceborne CALIPSO lidars observation. Two dust layers at 2 and 3 km were clearly detected by the ground-based PR lidars. The lower layer was deliquescent and transitioned into a dusty water cloud with increasing water vapor content, whereas the upper layer remained generally unchanged. The DR of the lower dust layer decreased rapidly with RH. Moreover, the observations from the spaceborne CALIPSO lidar were consistent with the ground-based measurement and backward trajectory analysis.
The impact of dust aerosols on the microphysical properties of water cloud is studied based on CALIPSO measurements. The result shows that dusty water clouds have a smaller mean extinction coefficient compared with that of pure water clouds. However, cloud optical depth of dusty water clouds is 12.79% larger than those of pure water clouds. Furthermore, if dust aerosols participate as CCN in cloud physical processes, then they significantly reduce the size of the cloud droplet by 44–79%. Based on collocated CALIPSO and CloudSat measurements from 2007 to 2010, global distribution of the dusty cloud fraction in spring is investigated. The results demonstrate that the two main high dusty clouds over the world are located at south Asia and west of Africa, up to more than 60%. And approximately one-third of clouds are dusty in the spring over the Pacific Ocean. In particular, cloud fraction of dusty cloud at low latitudes over the ocean is about 20% in spring across East Asia to North America. Considering the geographical feature of East Asia, especially under marine atmospheric conditions, the long-range transported dust aerosols should experience the modification of their surface physicochemical properties. Their possible influences on radiation and climate through formation of cloud and precipitation should be studied carefully in future.

Author Contributions

J.-B.N. is the PI for the ground-based NCU lidar station, wrote, analyzed, and edit part of the paper; C.-W.C. carried out the observation and analyzed the preliminary lidar data; H.J., W.W., S.Z. provided dusty cloud data based on CALIPSO and CLOUDsat observation; Z. H. analyzed the data and wrote the paper.

Funding

The National Natural Science Foundation of China (41521004, 41575017, 41627807 and 41505011), China 111 project (B 13045), the Fundamental Research Funds for the Central Universities (lzujbky-2017-k03, lzujbky-2017-kb02 and lzujbky-2017-it21), and Foundation of Key Laboratory for Semi-Arid Climate Change of the Ministry of Education in Lanzhou University.

Acknowledgments

CALIPSO and CloudSat data were obtained from the NASA Langley research center, and the HYSPLIT model was provided by the NOAA Air Resources Laboratory. The in-situ measurements were provided by the Environmental Protection Agency of Taiwan. We also acknowledge Timothy Logan for his insightful and valuable.

Conflicts of Interest

The authors declare no conflict of interest.

References

  1. Ginoux, P.; Chin, M.; Tegen, I.; Prospero, J.M.; Holben, B.; Dubovik, O.; Lin, S.-J. Sources and distributions of dust aerosols simulated with the GOCART model. J. Geophys. Res. Atmos. 2001, 106, 20255–20273. [Google Scholar] [CrossRef] [Green Version]
  2. Chin, M.; Diehl, T.; Ginoux, P.; Malm, W. Intercontinental transport of pollution and dust aerosols: Implications for regional air quality. Atmos. Chem. Phys. 2007, 7, 5501–5517. [Google Scholar] [CrossRef]
  3. Seinfeld, J.H.; Carmichael, G.R.; Arimoto, R.; Conant, W.C.; Brechtel, F.J.; Bates, T.S.; Cahill, T.A.; Clarke, A.D.; Doherty, S.J.; Flatau, P.J.; et al. ACE-ASIA: Regional climatic and atmospheric chemical effects of Asian dust and pollution. Bull. Am. Meteorol. Soc. 2004, 85, 367–380. [Google Scholar] [CrossRef]
  4. Huang, J.; Minnis, P.; Chen, B.; Huang, Z.; Liu, Z.; Zhao, Q.; Yi, Y.; Ayers, J.K. Long-range transport and vertical structure of Asian dust from CALIPSO and surface measurements during PACDEX. J. Geophys. Res. Atmos. 2008, 113. [Google Scholar] [CrossRef] [Green Version]
  5. Huang, J.; Zhang, W.; Zuo, J.; Bi, J.; Shi, J.; Wang, X.; Chang, Z.; Huang, Z.; Yang, S.; Zhang, B.; et al. An overview of the semi-arid climate and environment research observatory over the Loess Plateau. Adv. Atmos. Sci. 2008, 25, 1–16. [Google Scholar] [CrossRef]
  6. Huang, J.; Fu, Q.; Su, J.; Tang, Q.; Minnis, P.; Hu, Y.; Yi, Y.; Zhao, Q. Taklimakan dust aerosol radiative heating derived from CALIPSO observations using the Fu-Liou radiation model with CERES constraints. Atmos. Chem. Phys. 2009, 9, 4011–4021. [Google Scholar] [CrossRef] [Green Version]
  7. Bi, J.; Huang, J.; Fu, Q.; Wang, X.; Shi, J.; Zhang, W.; Huang, Z.; Zhang, B. Toward characterization of the aerosol optical properties over Loess Plateau of Northwestern China. J. Quant. Spectrosc. Radiat. Transf. 2011, 112, 346–360. [Google Scholar] [CrossRef]
  8. Li, Z.; Li, C.; Chen, H.; Tsay, S.C.; Holben, B.; Huang, J.; Li, B.; Maring, H.; Qian, Y.; Shi, G.; et al. East Asian Studies of Tropospheric Aerosols and their Impact on Regional Climate (EAST-AIRC): An overview. J. Geophys. Res. Atmos. 2011, 116. [Google Scholar] [CrossRef] [Green Version]
  9. Chun, Y.; Boo, K.; Kim, J.; Park, S.; Lee, M. Synopsis, transport, and physical characteristics of Asian dust in Korea. J. Geophys. Res. 2001, 106, 461–469. [Google Scholar] [CrossRef]
  10. Kim, S.; Chun, Y. Physical and chemical features of asian dust aerosol mixed with haze during 14–19 March 2009. Asia-Pac. J. Atmos. Sci. 2013, 49, 543–550. [Google Scholar] [CrossRef]
  11. Murayama, T.; Sugimoto, N.; Uno, I.; Kinoshita, K.; Aoki, K.; Hagiwara, N.; Liu, Z.; Matsui, I.; Sakai, T.; Shibata, T.; et al. Ground-based network observation of Asian dust events of April 1998 in East Asia. J. Geophys. Res. 2001, 106, 345–359. [Google Scholar] [CrossRef]
  12. Sugimoto, N.; Huang, Z.; Nishizawa, T.; Matsui, I.; Tatarov, B. Fluorescence from atmospheric aerosols observed with a multi-channel lidar spectrometer. Opt. Express 2012, 20, 20800. [Google Scholar] [CrossRef] [PubMed]
  13. Thulasiraman, S.; O’Neill, N.T.; Royer, A.; Holben, B.N.; Westphal, D.L.; McArthur, L.J.B. Sunphotometric observations of the 2001 Asian dust storm over Canada and the U.S. Geophys. Res. Lett. 2002, 29, 96-1–96-4. [Google Scholar] [CrossRef]
  14. Creamean, J.M.; Suski, K.J.; Rosenfeld, D.; Cazorla, A.; DeMott, P.J.; Sullivan, R.C.; White, A.B.; Ralph, F.M.; Minnis, P.; Comstock, J.M.; et al. Dust and biological aerosols from the Sahara and Asia influence precipitation in the Western U.S. Science 2013, 339, 1572–1578. [Google Scholar] [CrossRef] [PubMed]
  15. Huang, Z.; Huang, J.; Hayasaka, T.; Wang, S.; Zhou, T.; Jin, H. Short-cut transport path for Asian dust directly to the Arctic: A case study. Environ. Res. Lett. 2015, 10, 114018. [Google Scholar] [CrossRef]
  16. Uno, I.; Eguchi, K.; Yumimoto, K.; Takemura, T.; Shimizu, A.; Uematsu, M.; Liu, Z.; Wang, Z.; Hara, Y.; Sugimoto, N. Asian dust transported one full circuit around the globe. Nat. Geosci. 2009, 2, 557–560. [Google Scholar] [CrossRef]
  17. Kaufman, Y.J.; Koren, I.; Remer, L.A.; Rosenfeld, D.; Rudich, Y. The effect of smoke, dust, and pollution aerosol on shallow cloud development over the Atlantic Ocean. Proc. Natl. Acad. Sci. USA 2005, 102, 11207–11212. [Google Scholar] [CrossRef] [PubMed] [Green Version]
  18. Andreae, M.O.; Rosenfeld, D. Aerosol-cloud-precipitation interactions. Part 1. The nature and sources of cloud-active aerosols. Earth-Sci. Rev. 2008, 89, 13–41. [Google Scholar] [CrossRef]
  19. DeMott, P.J.; Cziczo, D.J.; Prenni, A.J.; Murphy, D.M.; Kreidenweis, S.M.; Thomson, D.S.; Borys, R.; Rogers, D.C. Measurements of the concentration and composition of nuclei for cirrus formation. Proc. Natl. Acad. Sci. USA 2003, 100, 14655–14660. [Google Scholar] [CrossRef] [PubMed] [Green Version]
  20. Huang, J.; Lin, B.; Minnis, P.; Wang, T.; Wang, X.; Hu, Y.; Yi, Y.; Ayers, J.K. Satellite-based assessment of possible dust aerosols semi-direct effect on cloud water path over East Asia. Geophys. Res. Lett. 2006, 33. [Google Scholar] [CrossRef] [Green Version]
  21. Huang, J.; Minnis, P.; Lin, B.; Wang, T.; Yi, Y.; Hu, Y.; Sun-Mack, S.; Ayers, K. Possible influences of Asian dust aerosols on cloud properties and radiative forcing observed from MODIS and CERES. Geophys. Res. Lett. 2006, 33. [Google Scholar] [CrossRef] [Green Version]
  22. Isono, K.; Komabayasi, M.; Ono, A. The nature and origin of ice nuclei in the atmosphere. J. Meteorol. Soc. Jpn. 1959, 37, 211–233. [Google Scholar] [CrossRef]
  23. Roberts, P.; Hallett, J. A laboratory study of the ice nucleating properties of some mineral particulates. Q. J. R. Meteorol. Soc. 1968, 94, 25–34. [Google Scholar] [CrossRef]
  24. Ansmann, A.; Tesche, M.; Althausen, D.; Müller, D.; Seifert, P.; Freudenthaler, V.; Heese, B.; Wiegner, M.; Pisani, G.; Knippertz, P.; et al. Influence of Saharan dust on cloud glaciation in southern Morocco during the Saharan Mineral Dust Experiment. J. Geophys. Res. Atmos. 2008, 113. [Google Scholar] [CrossRef] [Green Version]
  25. Levi, L.; Rosenfeld, D. Ice Nuclei, Rainwater Chemical Composition, and Static Cloud Seeding Effects in Israel. J. Appl. Meteorol. 1996, 35, 1494–1501. [Google Scholar] [CrossRef] [Green Version]
  26. Sassen, K. Dusty ice clouds over Alaska. Nature 2005, 434, 456. [Google Scholar] [CrossRef] [PubMed]
  27. Jordan, C.; Dibb, J.; Anderson, B.; Fuelberg, H. Uptake of nitrate and sulfate on dust aerosols during TRACE-P. J. Geophys. Res. 2003, 108, 8817. [Google Scholar] [CrossRef]
  28. Trochkine, D.; Iwasaka, Y.; Matsuki, A.; Yamada, M.; Kim, Y.-S.; Nagatani, T.; Zhang, D.; Shi, G.-Y.; Shen, Z. Mineral aerosol particles collected in Dunhuang, China, and their comparison with chemically modified particles collected over Japan. J. Geophys. Res. 2003, 108, 8642. [Google Scholar] [CrossRef]
  29. Zhang, D.; Iwasaka, Y. Size change of Asian dust particles caused by sea salt interaction: Measurements in southwestern Japan. Geophys. Res. Lett. 2004, 31. [Google Scholar] [CrossRef] [Green Version]
  30. Eastwood, M.L.; Cremel, S.; Wheeler, M.; Murray, B.J.; Girard, E.; Bertram, A.K. Effects of sulfuric acid and ammonium sulfate coatings on the ice nucleation properties of kaolinite particles. Geophys. Res. Lett. 2009, 36. [Google Scholar] [CrossRef] [Green Version]
  31. Laskin, A.; Iedema, M.J.; Ichkovich, A.; Graber, E.R.; Taraniuk, I.; Rudich, Y. Direct observation of completely processed calcium carbonate dust particles. Faraday Discuss. 2005, 130, 453. [Google Scholar] [CrossRef] [PubMed]
  32. Tobo, Y.; Zhang, D.; Matsuki, A.; Iwasaka, Y. Asian dust particles converted into aqueous droplets under remote marine atmospheric conditions. Proc. Natl. Acad. Sci. USA 2010, 107, 17905–17910. [Google Scholar] [CrossRef] [PubMed] [Green Version]
  33. Tobo, Y.; Zhang, D.; Nakata, N.; Yamada, M.; Ogata, H.; Hara, K.; Iwasaka, Y. Hygroscopic mineral dust particles as influenced by chlorine chemistry in the marine atmosphere. Geophys. Res. Lett. 2009, 36. [Google Scholar] [CrossRef] [Green Version]
  34. Li, J.; Okada, K. Water-Insoluble Particles in Spring Snow at Mt. Tateyama, Japan: Characteristics of the Shape Factors and Size Distribution in Relation with Their Origin and Transportation. J. Meteorol. Soc. Jpn. 2007, 85, 137–149. [Google Scholar] [CrossRef] [Green Version]
  35. Sakai, T.; Shibata, T.; Kwon, S.-A.; Kim, Y.-S.; Tamura, K.; Iwasaka, Y. Free tropospheric aerosol backscatter, depolarization ratio, and relative humidity measured with the Ranam lidar at Nagoya in 1994-1997: Contributions of aerosols from the Asian Continent and the Pacific Ocean. Atmos. Environ. 2000, 34, 431–442. [Google Scholar] [CrossRef]
  36. Freudenthaler, V.; Esselborn, M.; Wiegner, M.; Heese, B.; Tesche, M.; Ansmann, A.; Müller, D.; Althausen, D.; Wirth, M.; Fix, A.; et al. Depolarization ratio profiling at several wavelengths in pure Saharan dust during SAMUM 2006. Tellus B Chem. Phys. Meteorol. 2009, 61, 165–179. [Google Scholar] [CrossRef] [Green Version]
  37. Nee, J.B.; Chiang, C.W.; Hu, H.L.; Hu, S.X.; Yu, J.Y. Lidar measurements of Asian dust storms and dust cloud interactions. J. Geophys. Res. Atmos. 2007, 112. [Google Scholar] [CrossRef] [Green Version]
  38. Chiang, C.W.; Chen, W.N.; Liang, W.A.; Das, S.K.; Nee, J.B. Optical properties of tropospheric aerosols based on measurements of lidar, sun-photometer, and visibility at Chung-Li (25°N, 121°E). Atmos. Environ. 2007, 41, 4128–4137. [Google Scholar] [CrossRef]
  39. Huang, Z.; Huang, J.; Bi, J.; Wang, G.; Wang, W.; Fu, Q.; Li, Z.; Tsay, S.-C.; Shi, J. Dust aerosol vertical structure measurements using three MPL lidars during 2008 China-U.S. joint dust field experiment. J. Geophys. Res. 2010, 115, D00K15. [Google Scholar] [CrossRef]
  40. Winker, D.M.; Hunt, W.H.; McGill, M.J. Initial performance assessment of CALIOP. Geophys. Res. Lett. 2007, 34. [Google Scholar] [CrossRef] [Green Version]
  41. Hu, Y.; Vaughan, M.; Liu, Z.; Lin, B.; Yang, P.; Flittner, D.; Hunt, B.; Kuehn, R.; Huang, J.; Wu, D.; et al. The depolarization-attenuated backscatter relation: CALIPSO lidar measurements vs. theory. Opt. Express 2007, 15, 5327. [Google Scholar] [CrossRef] [PubMed]
  42. Liu, Z.; Omar, A.; Vaughan, M.; Hair, J.; Kittaka, C.; Hu, Y.; Powell, K.; Trepte, C.; Winker, D.; Hostetler, C.; et al. CALIPSO lidar observations of the optical properties of Saharan dust: A case study of long-range transport. J. Geophys. Res. Atmos. 2008, 113. [Google Scholar] [CrossRef] [Green Version]
  43. Zhou, T.; Huang, J.; Huang, Z.; Liu, J.; Wang, W.; Lin, L. The depolarization–attenuated backscatter relationship for dust plumes. Opt. Express 2013, 21, 15195. [Google Scholar] [CrossRef] [PubMed]
  44. Draxler, R.R.; Hess, G.D. An Overview of the HYSPLIT_4 Modelling System for Trajectories, Dispersion, and Deposition. Aust. Meteorol. Mag. 1998, 47, 295–308. [Google Scholar]
  45. Liu, J.; Zheng, Y.; Li, Z.; Flynn, C.; Welton, E.J.; Cribb, M. Transport, vertical structure and radiative properties of dust events in southeast China determined from ground and space sensors. Atmos. Environ. 2011, 45, 6469–6480. [Google Scholar] [CrossRef]
  46. Sugimoto, N.; Huang, Z. Lidar methods for observing mineral dust. J. Meteorol. Res. 2014, 28, 173–184. [Google Scholar] [CrossRef]
  47. Chiang, C.W.; Das, S.K.; Nee, J.B.; Hu, S.X.; Hu, H.L. Simultaneous measurement of humidity and temperature in the lower troposphere over Chung-Li, Taiwan. J. Atmos. Sol. Terr. Phys. 2009, 71, 1389–1396. [Google Scholar] [CrossRef]
  48. Logan, T.; Xi, B.; Dong, X. Aerosol properties and their influences on marine boundary layer cloud. condensation nuclei at the ARM mobile facility over the Azores. J. Geophys. Res. Atmos. 2014, 119. [Google Scholar] [CrossRef]
  49. Logan, T.; Dong, X.; Xi, B. Aerosol properties and their impacts on surface CCN at the ARM Southern Great Plains site during the 2011 Midlatitude Continental Convective Clouds Experiment. Adv. Atmos. Sci. 2018, 35, 224–233. [Google Scholar] [CrossRef]
  50. Song, Y.; Eom, H.; Jung, H.; Malek, M. Investigation of aged Asian dust particles by the combined use of quantitative ED-EPMA and ATR-FTIR imaging. Atmos. Chem. Phys. 2013, 13, 3463–3480. [Google Scholar] [CrossRef]
  51. Gasteiger, J.; Wiegner, M.; Groß, S.; Freudenthaler, V.; Toledano, C.; Tesche, M.; Kandler, K. Modelling lidar-relevant optical properties of complex mineral dust aerosols. Tellus B Chem. Phys. Meteorol. 2011, 63, 725–741. [Google Scholar] [CrossRef] [Green Version]
  52. Okada, K.; Heintzenberg, J.; Kai, K.; Qin, Y. Shape of atmospheric mineral particles collected in three Chinese arid-regions. Geophys. Res. Lett. 2001, 28, 3123–3126. [Google Scholar] [CrossRef] [Green Version]
  53. Sun, X.M.; Wang, H.H.; Shen, J.; Liu, W. Depolarization and polarization of light scattering by dustlike tropospheric aerosols. J. Electromagn. Waves Appl. 2010, 24, 1353–1364. [Google Scholar] [CrossRef]
  54. Hu, Y.; Vaughan, M.; McClain, C.; Behrenfeld, M.; Maring, H.; Anderson, D.; Sun-Mack, S.; Flittner, D.; Huang, J.; Wielicki, B.; et al. Global statistics of liquid water content and effective number concentration of water clouds over ocean derived from combined CALIPSO and MODIS measurements. Atmos. Chem. Phys. 2007, 7, 3353–3359. [Google Scholar] [CrossRef] [Green Version]
  55. Saito, T.; Hayasaka, T. Effects of dust aerosols on warm cloud properties over east Asia and the Sahara from satellite data. J. Meteorol. Soc. Jpn. 2014, 92A, 109–123. [Google Scholar] [CrossRef]
  56. Wang, W.; Huang, J.; Minnis, P.; Hu, Y.; Li, J.; Huang, Z.; Ayers, J.K.; Wang, T. Dusty cloud properties and radiative forcing over dust source and downwind regions derived from A-Train data during the Pacific Dust Experiment. J. Geophys. Res. Atmos. 2010, 115. [Google Scholar] [CrossRef] [Green Version]
  57. Jin, H.; Yi, Y.; Nasiri, S.L.; Liu, C.; Wang, W.; Li, J.; Chen, Y.; Wang, T. Impacts of Asian dust on the determination of cloud thermodynamic phase from satellite observations. Environ. Res. Lett. 2015, 10. [Google Scholar] [CrossRef]
  58. Wurzler, S.; Reisin, T.G.; Levin, Z. Modification of mineral dust particles by cloud processing and subsequent effects on drop size distributions. J. Geophys. Res. Atmos. 2000, 105, 4501–4512. [Google Scholar] [CrossRef] [Green Version]
  59. Doherty, O.M.; Evan, A.T. Identification of a new dust-stratocumulus indirect effect over the tropical North Atlantic. Geophys. Res. Lett. 2014, 41, 6935–6942. [Google Scholar] [CrossRef] [Green Version]
Figure 1. In situ measurements of the diurnal variations in PM10, PM2.5, and relative humidity (RH) near the ground surface in Chungli, Taiwan during 13–16 March 2009. The red and black lines represent the mass concentrations of PM10 and PM2.5, respectively, and the blue line shows the variation in RH. The peak of PM10 is indicated by a vertical red line.
Remotesensing 10 01017 g001
Figure 2. Left panel: vertical structure of the dust aerosols and clouds observed by ground-based PR lidar in Chungli, Taiwan beginning at 20:45 LST on 14 March 2009; Right panel: mean profiles of range-corrected lidar backscatter signal (black), linear depolarization ratio (red) and water vapor mixing ratio (blue) from the PR lidar observation. Errors are estimated based on Chiang et al. [47].
Remotesensing 10 01017 g002
Figure 3. Probability density function (PDF) calculated for approximately 500 single backward trajectories obtained from the HYSPLIT model for the altitude range from 100 to 3500 m during the period of 12:00 to 24:00 LST on 14 March 2009. The time interval and the altitude resolution are 1 h and 100 m, respectively. The resolution of each latitude/longitude grid is 0.5° × 0.5°.
Remotesensing 10 01017 g003
Figure 4. Left panel: vertical structure of the dust aerosols and clouds observed by the CALIPSO lidar over eastern China beginning at 13:09 LST on 14 March 2009. Right panel: mean profiles of total attenuated backscatter at 532 nm (black), depolarization ratio (red) and color ratio (blue) from CALIPSO lidar observation around 13:40 14 March over Eastern China (32°N–38°N, 112°E–116°E). Error bars are standard deviations computed from the vertical bins of each profile. The colored bar of the vertical feature mask (VFM) represents the type of particle layer: 0 = invalid, 1 = clear air, 2 = cloud, 3 = dust, 4 = stratospheric layer, 5 = surface, 6 = subsurface, and 7 = totally attenuated.
Remotesensing 10 01017 g004
Figure 5. Vertical structure of the dust aerosols and clouds observed by the satellite CALIPSO lidar at 01:33 LST on 15 March 2009. The black dotted line (right panel) indicates the location of CALIPSO that is closest to the ground lidar site.
Remotesensing 10 01017 g005
Figure 6. Schematic illustration of three stages of heterogeneous process, during which long-range transported dust aerosols are converted into water cloud under moist conditions in the atmosphere. Brown dots represent dust aerosols. The x-axis shows the evolution of the process estimated mainly from lidar measurements. Shadings show gradual change of water vapor at the altitude of the dust layer, and green and red colors represent low and high values of water vapor content, respectively.
Remotesensing 10 01017 g006
Figure 7. Scatter plot of the DR and RH estimated from combined Raman lidar data and radiosonde temperature at nearby sounding station, between 1.5 and 1.7 km above the ground. The red, green, and blue dots represent different observation periods, corresponding to Stage I, Stage II, and Stage III, as shown in Figure 6, respectively.
Remotesensing 10 01017 g007
Figure 8. Global distribution of dusty clouds estimated from the combined CALIPSO/CloudSat observations from 2007 to 2010 in Spring.
Remotesensing 10 01017 g008
Table 1. Comparison of the cloud microphysics between dusty water cloud and pure water cloud at low altitudes over the ocean.
Cloud TypeDate & Time (LST)LocationCloud Base Height (km)Thickness (km)Cloud Microphysics *
CODσ (km−1)Re/Re0 **
Dusty cloud15 March 2009 01:3320°N–25°N
122°E–124°E
1~31.803.551.971.0
19 March 2009 01:2324°N–26°N
129°E–131°E
1.5~41.602.671.671.1
24 March 2009 01:4223°N–25°N
124°E–125°E
1.5~3.52.003.821.910.9
Mean1.803.351.851.0
Pure cloud14 March 2009 01:0420°N–23°N
133°E–134°E
1~31.103.002.732.7
17 March 2009 01:3521°N–23°N
125°E–126°E
0.5~20.902.662.961.9
02 April 2009 01:3721°N–23°N
125°E–126°E
1.5~3.51.002.922.921.8
22 April 2009 01:0124°N–26°N
132°E–133°E
1~2.50.902.983.314.7
1 June 2009 01:5323°N–27°N
120°E–121°E
2.5~50.903.293.654.8
Mean0.962.973.113.18
* COD is the acronym of cloud optical Depth, σ and Re are the layer-integrated extinction coefficient and droplet effective radius, respectively; ** Ratios of Re of all of the selected cases are divided by that of the first dusty cloud case on 15 March 2009.

