Article

Multi-Scale Analysis of the Relationship between Land Subsidence and Buildings: A Case Study in an Eastern Beijing Urban Area Using the PS-InSAR Technique

1
College of Resources Environment and Tourism, Capital Normal University, 105 North Road of the 3rd Ringroad, Haidian District, Beijing 100048, China
2
Laboratory Cultivation Base of Environment Process and Digital Simulation, Beijing 100048, China
3
Beijing Laboratory of Water Resources Security, Beijing 100048, China
*
Author to whom correspondence should be addressed.
Remote Sens. 2018, 10(7), 1006; https://doi.org/10.3390/rs10071006
Submission received: 4 June 2018 / Revised: 19 June 2018 / Accepted: 20 June 2018 / Published: 25 June 2018
(This article belongs to the Special Issue Advances in Remote Sensing-based Disaster Monitoring and Assessment)

Abstract

:
Beijing is severely affected by land subsidence, and rapid urbanisation and building construction might accelerate the land subsidence process. Based on 39 Envisat Advanced Synthetic Aperture Radar (ASAR) images acquired between 2003–2010, 55 TerraSAR-X images acquired between 2010–2016, and urban building information, we analysed the relationship between land subsidence and buildings at the regional, block, and building scales. The results show that the surface displacement rate in the Beijing urban area ranged from −109 mm/year to +13 mm/year between 2003–2010, and from −151 mm/year to +19 mm/year between 2010–2016; two subsidence bowls were mainly distributed in the eastern part of the Chaoyang District. The displacement rate agreed well with the levelling measurements, with an average bias of less than six mm/year. At the regional scale, the spatial pattern of land subsidence was mainly controlled by groundwater extraction, compressible layer thickness, and geological faults. Subsidence centres were located in the area around ground water funnels with a compressible layer depth of 50–70 m. The block-scale analysis demonstrated a clear correlation between the block construction age and the spatial unevenness of subsidence. The blocks constructed between 1998–2005 and after 2005 showed considerably more subsidence unevenness and temporal instability than the blocks constructed before 1998 during both time periods. The examination of the new blocks showed that the spatial unevenness increased with building volume variability. For the 16 blocks with a high building volume, variability, and subsidence unevenness, the building-scale analysis showed a positive relationship between building volume and settlement in most blocks, although the R2 was lower than 0.5. The results indicate that intense building construction in urban areas could cause differential settlement at the block scale in Beijing, while the settlement of single buildings could be influenced by the integrated effects of building volume, foundation structures, and the hydrogeological background.

1. Introduction

Land subsidence, a phenomenon of gradual land surface settling, is a geological hazard caused mainly by anthropogenic activities such as subsurface fluid extraction, underground mining, and engineering construction. Currently, more than 50 cities in China have faced land subsidence issues, and of these, Beijing has been among the most seriously affected cities since the 1950s [1]. Uneven land surface settlement has been reported to cause damages to urban infrastructures, such as wall cracks and pipeline ruptures, leading to losses in the national economy [1]. It is known that land subsidence on the Beijing plains is mainly caused by an excessive withdrawal of groundwater and is controlled by lithological and geological structures such as clay layer thickness, active faults, and aquifer types. Chen et al. [2] investigated land subsidence processes between 2003–2010 in the Beijing plains area and reported that land subsidence in this area is greatest where the compressible layer thickness is approximately 50–70 m, and that the distribution of subsidence bowls is controlled by Quaternary faults. Chen et al. [3] and Lei et al. [4] reported that groundwater-level variations in the second confined aquifer had the greatest impact on the development of land subsidence, and significant differences in the deformation gradient were found on both sides of the faults. Zhou et al. [5,6] investigated the relationship between land-use types and subsidence rates and found that serious subsidence occurred mainly in wetland, paddy fields, upland soils, vegetable land, and peasant-inhabited land. Gao et al. [7] revealed that the inelastic and permanent compaction of the Beijing aquifer system was due to the continuous decline in the water level of the northern subsidence area in Beijing, and elastic deformation outside the subsidence area.
Although subsurface fluid extraction, e.g., groundwater over-exploitation, is a major factor contributing to regional land subsidence in many cities in China and other countries [8,9], research has shown that rapid urbanisation can also be a contributing factor, as building construction and space utilisation usually develop consolidation processes [10]. A case study by Solari et al. [11] demonstrated the correlation between the age of the construction of buildings and the subsidence rates in two small urban areas in Pisa, Italy. Pretesi et al. [12] detected ground subsidence that was caused by the soil consolidation process of a newly constructed building in Florence, Italy. Chen et al. [13] found that land subsidence in the Loess Plateau region of China exhibited a high correlation with the distribution of building land, and that subsidence rates increased with building density.
The investigation of the relationship between buildings and land subsidence requires the continuous monitoring of land surface displacement over a large area. Compared to traditional geodetic methods such as Global Positioning System (GPS) and levelling and deep soil settlement surveys, the permanent scatterer interferometric synthetic aperture radar (PS-InSAR) technique has become widely recognised for monitoring ground displacement over large areas in a timely and cost-efficient way [14,15,16]. Studies have also found that the PS-InSAR technique has the capability to obtain high-density and precise measurements of the construction area and linear objects in urban areas based on high-resolution synthetic aperture radar (SAR) data. Liao et al. [17] determined the long-term subtle deformation of large man-made structures in Shanghai with millimetre-scale accuracy using the Persistent Scatterer Interferometry (PSI) method based on TerraSAR-X images. Qin et al. [18] applied the PS-InSAR technique and 26 TerraSAR-X images to monitor surface deformation along a rail transit in Shanghai. Chen et al. [19] monitored land surface deformation around the Beijing Subway Line 6 area based on Radarsat-2 data between 2009–2012. Solari et al. [20] derived a time series of ground subsidence in an urban area in Pisa, Italy during 1992 and 2010 based on European Remote Sensing satellites (ERS) 1/2 and Envisat Advanced Synthetic Aperture Radar (ASAR) datasets and identified the deformation of city buildings. Tapete et al. [21] monitored the deformation of linear structures using measurement points from the InSAR technique based on Radarsat-1 data and GPS measurements, and analysed the uncertainty of the measurements. The utilisation of multi-source datasets has demonstrated the capability of facilitating an analysis of the long-term temporal evolution of ground deformation over urban areas.
During the last few decades in Beijing, urban areas have been rapidly expanding, and the land surface has been intensely developed and utilised. Buildings impose extra loads on the land, and the construction of buildings alters the natural processes of consolidation [22,23,24]. To date, only a few studies have examined the relationship between land subsidence and urban development in Beijing. Chen et al. [25] found a weak positive correlation between Landsat-derived urban indices and land subsidence between 2003–2010. Chen et al. [26] reported that the complexity of urban space utilisation may affect uneven settlement at five settlement centres. Both studies only analysed settlement funnel areas in which groundwater withdraw was the major control factor of land subsidence, and it is hard to attribute land subsidence to the urbanisation in these areas. Jiao et al. [27] studied the western Central Business District—a very small urban area—and found the skyscrapers with volumes over 3 × 10⁵ m3 showed a higher land subsidence rate than smaller buildings.
The aforementioned literature review shows that the impact of building construction on land subsidence have not been fully investigated in Beijing urban areas. How building construction impacts the subsidence processes at different spatial scales is not clear. The present study aims to fill this gap. The objective is to evaluate the relationship between building construction and land subsidence in Beijing urban areas at regional, block, and building scales using the PS-InSAR technique. Building characteristics, including the age of building construction and building volume, are considered. The Chaoyang District, where both urbanisation and land subsidence have developed rapidly over the past few decades, was selected as the study area. Five hydrogeological regions were partitioned over the study area, with each demonstrating a similar groundwater level and compressible layer thickness. Land subsidence data between 2003–2016 were derived based on 39 Envisat ASAR images and 55 TerraSAR-X images. For each hydrogeological region, the relationships between building characteristics, namely, the age of construction and building volume, with land subsidence, were evaluated at both the block scale and the single-building scale. A detailed description of the study area, datasets, and methodology is seen in Section 2 and Section 3. Section 4 and Section 5 present and discuss the results. The main conclusions are summarised in Section 6.

2. Study Area and Dataset

2.1. Study Area

Beijing (39°28′–40°05′N and 115°25′–117°30′E) is an international metropolitan city with rapid urban sprawl and a high intensity of human activities. In 2016, the population of Beijing reached 21,729 million, inhabiting an area of approximately 16,410 km2, of which 1410 km2 was built-up area. Beijing is affected by a monsoon-influenced semi-arid and semi-humid continental climate. The temporal and spatial distribution of annual precipitation occurs unevenly, and 60.4% of the precipitation is concentrated in the summer (July–September). Two thirds of the water sources for the Beijing municipality come from groundwater. Groundwater is mainly withdrawn from the shallow confined aquifer layer in single-layered structure areas, and the middle confined aquifer layer and deep confined aquifer layer in multi-layered structure zones [4]. Since 1950, the Beijing plain area has formed five major ground subsidence funnels in the Chaoyang, Tongzhou, Shunyi, Changping, and Daxing Districts.
In this paper, we chose the Dongbalizhuang–dajiaoting settlement funnel and its surrounding area in the Chaoyang District as the study area (205 km2). The groundwater level at the second confined aquifer varies from −37 m to −10 m, and the thickness of the clay layer in the first 100 m depth ranges from less than 50 m to 70 m. The Nanyuan–Tongxian geological fault is located across the study area (Figure 1), and rapid urbanisation has occurred in this area since the 1980s. Currently, the development in the study area is typical of urban areas in Beijing, with complex and intensive urban land use with mixed low-rise and high-rise buildings, historic and modern buildings, and commercial and residential buildings. Urban villages with considerable numbers of single-storey houses still exist.

2.2. SAR Images and Validation Datasets

To determine the land subsidence evolution in the study area, two sets of SAR images comprising 39 descending single look complex (SLC) scenes collected by Envisat ASAR from 18 June 2003 to 25 August 2010 and 55 ascending scenes collected by the TerraSAR-X satellite with Stripmap mode from 13 April 2010 to 24 May 2016 were utilised in this study (Figure 1). The spatial resolutions of the Envisat ASAR and TerraSAR-X images were approximately 30 m and 3 m on the ground, respectively. Although high spatial resolution SAR datasets such as the TerraSAR-X imagery are preferable for identifying permanent scatterers in urban areas, this type of high-resolution satellite was not available before 2008. Thus, Envisat ASAR images were used to derive surface deformation between 2003–2010. The external Digital Elevation Model (DEM) that was applied for PS-InSAR processing to remove the topographic phase and flatten effects came from Shuttle Radar Topography Mission (SRTM) with a spatial resolution of 90 m (http://dds.cr.usgs.gov/srtm/).
Land surface deformation measurements collected from 12 levelling benchmarks from 2003 to 2010, five levelling benchmarks between 2010–2013, and 13 levelling benchmarks between 2015–2016 were used for validation (Figure 1). Due to the limited availability of long-term observations, none of the in situ datasets covered the whole time span from 2010 to 2016.

2.3. Building Properties

From Google Earth, high-resolution images, and Baidu Street Map (map.baidu.com), the block locations were visually interpreted and manually outlined in ArcGIS software. In our study, a “block” refers to a gated community that is usually surrounded by main streets or roads. In the study area, a total of 178 blocks were identified. Most of the blocks were residential communities, and among them, some communities had one or two commercial buildings. Apart from the residential communities, several school campuses and commercial business districts were also located in the area. Sixteen blocks were urban villages with similar low-rise buildings. It has been reported that many of these villages have private wells, which may affect the local groundwater level. Previous research has shown that the subsidence rate increases as the distance to the pumping well decreases [2]. Twenty-four blocks were located within a 50-m buffer area of the Nanyuan–Tongxian geological fault. To minimise the influence of local groundwater level variation and the fault on the uneven subsidence within the blocks, we eliminated these blocks from further analysis. As a result, 138 blocks were selected with a total of 6023 buildings. For each building, properties such as building height, base area, and construction age were acquired from real estate companies. Building volume was estimated as the product of the building base area and height. Volume was used to represent the load of the buildings.

3. Methodology

First, land surface deformation over the study area from 2003 to 2016 was derived from Envisat ASAR and TerraSAR-X datasets using the PS-InSAR technique. The results were evaluated by a comparison with levelling measurements. The study area was then partitioned into five hydrogeological regions. Each region had a similar groundwater level and compressible thickness of the clay layer. For each region, the spatiotemporal pattern of land subsidence was analysed. The relationship between land subsidence and building characteristics, including construction age and building load, was then evaluated at both the block scale and building scale.

3.1. Land Subsidence Monitoring Using the PSI Technique

The PSI method is capable of detecting points with strong and stable radiometric characteristics based on a stack of SAR data and deriving surface deformation information. In this study, the Stanford method for persistent scatterers (StaMPS) PSI method developed by Hooper et al. [28] was used to retrieve time series deformation from the Envisat ASAR images. First, the image acquired on 18 April 2007 was selected as the master image. The StaMPS selected initial persistent scatterer (PS) candidates with a small dispersion index value (lower than 0.4 in this study). The phase stability analysis was then performed for each PS candidate, and the probability that each pixel was a PS pixel was refined based on the stability indicator. For PS pixels, the wrapped phase was corrected, and unwrapping was then applied. The spatially correlated errors were eliminated with the aid of a high-pass filter in time, and a low-pass filter in space. Finally, the time series deformation along the line-of-sight (LOS) direction was derived.
The PSI method presented by Ferretti et al. [29,30] in SARPROZ software was used to obtain a deformation time series from the 55 TerraSAR-X images. First, the TerraSAR-X image acquired on 1 November 2013 was selected as the master image by considering a shorter spatial baseline and temporal baseline. Other images were co-registered to the master image. Second, a series of differential interferograms were constructed with the aid of SRTM DEM and precise orbital data. Third, persistent scatterer candidates (PSCs) were obtained with an amplitude difference dispersion index lower than 0.3. Then, multi-image grid phase unwrapping was conducted, and an atmospheric phase screen (APS) was estimated and removed. Afterwards, PS points with a temporal coherence index greater than 0.75 were selected. This ensures that the selected PS points have a high coherence and show phase stability over a long period of time. Finally, the displacement time series for each PS point along the LOS were derived by separating the phase components of the interferometric phase. Research has shown that use of the StaMPS and the PSI method in SARPROZ software yields consistent results for the same datasets [31,32], while we found that StaMPS was more computationally intensive. Therefore, we used SARPROZ software to process the high amount of TerraSAR-X datasets. Note that we used the same reference points with known zero deformation in the overlapped area of two data frames. The vertical deformation rate was then estimated from the LOS deformation rate by assuming that the horizontal movement of the land surface can be neglected [2,7].

3.2. Multi-Scale Analysis of the Relationship between Building Characteristics and Land Subsidence

In Beijing, lithology provides the geological background for land subsidence, and the spatial variation in the groundwater level is closely related to the regional distribution of subsidence rates. To minimise the impact of hydrogeological conditions on the subsidence-building relationship analysis, the study area was partitioned into five hydrogeological regions based on the compressible thickness of the clay layer and groundwater level at the second confined aquifer (Table 1 and Figure 2). Compressible layer thickness was classified into three classes, including <50 m, 50–60 m and 60–70 m. Groundwater level at the second confined aquifer was classified into four classes, including −37 to −32 m, −32 to −27 m, −27 to −22 m, and −22 to −17 m. Blocks were grouped based on the construction age. There were a total of 25 blocks built prior to 1998, 65 blocks built between 1998–2005, and 48 blocks built after 2005 (Table 1).
For each region, the spatiotemporal pattern of the vertical deformation rate during the two observation periods was analysed. The spatial unevenness and temporal instability of the ground deformation within the blocks and their relationship with the block construction age and building volume variation was analysed. Further, the relationship between building-scale characteristics and settlement was analysed.

4. Results

4.1. Land Surface Deformation Derived from the PSI Techniques and Validation

A total of 167,690 pixels and 1,099,639 pixels were detected as PS points from the Envisat ASAR and TerraSAR-X datasets, respectively. As illustrated in Figure 3, the deformation rate ranged from −109.1 mm/year to +13.1 mm/year during 2003–2010 for the Envisat ASAR datasets and from −150.5 mm/year to +19 mm/year during 2010–2016 for the TerraSAR-X datasets. Figure 3a clearly shows five settlement funnels in the Chaoyang, Shunyi, and Changping districts in the Beijing plain. The two settlement funnels with the highest subsidence rates were located within the TerraSAR-X data frame (Figure 3b). At the Laiguangying settlement funnel, the maximum deformation rate reached −92 mm/year from 2003 to 2010, and −151 mm/year from 2010 to 2016. At the Dongbalizhuang-dajiaoting settlement funnel, the maximum deformation rate reached −109.1 mm/year and −141.5 mm/year from 2003 to 2010 and 2010 to 2016, respectively.
The deformation rates during the two periods were further assessed by 30 in situ levelling measurements collected from 2003 to 2010, 2010 to 2013, and 2015 to 2016. The PS pixels closest to the levelling benchmarks were selected. As there were no measurements available throughout the time period from 2010 to 2016, we calculated the average displacement rate during 2010–2013 and 2015–2016 from the cumulative displacement time series derived from the TerraSAR-X datasets. Figure 4 shows that the deformation rate measurements from the PSI techniques and levelling benchmarks are in good agreement. The average biases of the estimates from the PSI techniques are −1.57 mm/year (root mean square error (RMSE) = 2.45 mm/year, R2 = 0.90) for 2003 to 2010, 4.53 mm/year (RMSE = 8.01 mm/year, R2 = 0.98) for 2010 to 2013, and 5.00 mm/year (RMSE = 9.06 mm/year, R2 = 0.86) for 2015 to 2016. The StaMPS method applied to Envisat ASAR datasets and the SAR PROcessing tool by periZ (SARPROZ) method applied to TerraSAR-X datasets have different procedures; for example, StaMPS does not require any priori assumptions for the temporal nature of the deformation for PS selection. However, the validation results using levelling measurements indicate that reliable land deformation results were derived from both PSI methods. This supports the following analysis on the relationship between land subsidence and building characteristics.

4.2. Spatiotemporal Characteristics of Land Subsidence at Each Region

Table 2 and Table 3 list the deformation rate statistics in each region and within the blocks during 2003–2010 and 2010–2016. There were a total of 14,729 PS pixels (90 pixels/km2) and 163,072 PS pixels (939 pixels/km2) detected by the Envisat ASAR and TerraSAR-X datasets, respectively, in the five regions. Note that the point density from the TerraSAR-X datasets was over 10 times that from the Envisat ASAR datasets. This is mainly due to the differences in spatial resolution of the two datasets. The StripMap mode of TerraSAR-X acquisition provides up to 3-m resolution, while Envisat ASAR acquisition provides 30-m resolution imagery. During both time periods, the mean deformation rate in region I (−75.2 mm/year and −93.1 mm/year), region II (−68.1 mm/year and −94.0 mm/year), and region III (−53.8 mm/year and −64.1 mm/year) were much higher than those in regions IV and V. Regions I, II, and III also had higher deformation rate standard deviations (SDs) (>15 mm/year) than regions IV and V, indicating a greater unevenness in the subsidence of regions I, II, and III. Thus, we considered regions I, II, III, i.e., the regions with most severe subsidence, as the subsidence centre.
We further selected the PS pixels within the blocks. The number of PS pixels within the blocks accounted for approximately 29% (Envisat ASAR) and 40% (TerraSAR-X) of the PS pixels in the whole region. However, the density of the PS pixels in the blocks was higher than the overall PS pixel density due to the existence of buildings (120 pixels/km2 from Envisat ASAR and 1876 pixels/km2 from TerraSAR-X). Although the Envisat ASAR PS pixel density is much lower than the TerraSAR-X PS pixel density, there is still an average of over 30 PS pixels within each block, enabling further statistical analysis within the blocks. For each region, the mean and SD of the deformation rate within the blocks had a similar pattern as those of the whole region, indicating that the subsidence rates in these blocks can represent the overall regional situation (Table 2 and Table 3).
A comparison between Table 2 and Table 3 shows that the settlement rate increased significantly from 2003–2010 to 2010–2016 in all of the regions and blocks except for in region V. The SD of the settlement increased in all of the regions and blocks. In the subsidence centre area (regions I, II, and III), the increments in the mean and SD of the subsidence rates were even more notable. Specifically, the mean settlement rate increased from 75.2 mm/year to 93.1 mm/year in region I, from 68.1 mm/year to 94.0 mm/year in region II, and from 53.8 mm/year to 64.1 mm/year in region III. Figure 5 also shows that the spatial distribution of the subsidence rate is similar during the two time periods at each region, while the magnitude of the subsidence rate during 2010–2016 is significantly higher than that during 2003–2010.

4.3. Block-Scale Building Characteristics and Subsidence

From the two SAR datasets, the PS pixels within the blocks were extracted, and the average and range of the cumulative settlement were calculated for each block. In this study, we define the range, denoted as R(s), as the difference between the 95th percentile and the 5th percentile of the cumulative settlement within a given block during 2003–2010 based on the ASAR datasets or during 2010–2016 based on the TerraSAR-X datasets. The 95th percentile and 5th percentile were used in order to eliminate the outliers of PS-InSAR-derived cumulative settlement. R(s) was utilised to represent the spatial variation or unevenness of the land subsidence within each block. For each PS point derived from the ASAR dataset, we found the closest PS point derived from the TerraSAR-X dataset within a 5-m buffer area. The settlement velocity change, which was denoted as Δ v , from 2003–2010 to 2010–2016 was then calculated for the pairs of PS points. The range of the velocity change R( Δ v ), i.e., the difference between the 95th percentile and 5th percentile velocity change within each block, was calculated to represent the stability of the block settlement. The basic assumption was that blocks are relatively stable if there was no change in the displacement velocity during the two periods, or if the velocity change was similar across the block area; a high R( Δ v ) within the block indicates poor stability.
Table 4 summarises the average cumulative settlement and velocity change within the blocks constructed before 1998, between 1998–2005, and after 2005. In the subsidence centre area (regions I–III), the average cumulative settlement ranged from 563.2 mm to 574.3 mm between 2003–2010, and from 552.9 mm to 612.8 mm during 2010–2016; the average velocity change ranged from 14.5 mm/year to 17.5 mm/year. In the areas far from the subsidence centre (regions IV and V), the average cumulative settlement ranged from 144.8 mm to 176.2 mm between 2003–2010, and from 126.7 mm to 134.6 mm between 2010–2016; the velocity change varied from 6.1 mm/year to 7.4 mm/year. Note that there were six blocks constructed after 2005 in region I that had no PS pixels detected in the Envisat ASAR dataset due to the lack of permanent scatterers; hence, we did not include these blocks in the statistical calculation based on the Envisat ASAR dataset. The blocks constructed during the three time periods did not have considerably different settlements, regardless of the dataset used (Envisat ASAR TerraSAR). The velocity changes were also similar.
Table 4 compares the average R(s) and R( Δ v ) within the blocks constructed during the three time periods. The spatial unevenness of the subsidence in the newly constructed blocks was higher than that in the old blocks, as shown by both the Envisat ASAR and TerraSAR-X datasets. In the subsidence centre area, the blocks that were built prior to 1998 had an average unevenness of 52.1 mm between 2003–2010, and 47.7 mm between 2010–2016; the blocks built after 2005 had an average unevenness of 82.1 mm between 2003–2010 and 92.5 mm between 2010–2016. In addition, the newer blocks had a greater increase in displacement unevenness from 2003–2010 to 2010–2016. For example, in regions IV and V, the subsidence unevenness of the old blocks (constructed before 1998) increased from 63.3 mm to 64.5 mm, and that of the new blocks (constructed after 2005) increased from 68.9 mm to 78.8 mm. Figure 6 illustrates the percentage of blocks with each interval of R(s). As illustrated in Figure 6, in the subsidence centre area, only 20% of the old blocks had a subsidence unevenness over 80 mm between 2003–2010; in contrast, the unevenly subsiding blocks (R(s) > 80 mm) accounted for 48.4% and 40.9% of the newer blocks, respectively. Between 2010–2016, the percentage of unevenly subsiding old blocks decreased to 10%, while for newer blocks, the percentages were 48.4% and 43%. Similarly, in regions IV and V, the percentage of unevenly subsiding old blocks was lower than that of the unevenly subsiding new blocks. In the study area, there were four groups of adjacent blocks with new blocks close to old blocks. The described pattern, that is, that newer blocks had greater spatial unevenness and temporal instability than older blocks, was more evident at the local scale (Figure 7). Figure 7e illustrates the settlement range for each block of each group. The figure clearly shows that blocks constructed between 1998–2005 and after 2005 had greater R(s) values than the neighbouring old blocks.
In addition, Table 4 shows that newer blocks have greater R( Δ v ) values than older blocks. In regions I, II, and III, none of the old blocks had R( Δ v ) values greater than 15 mm/year, while 24.2% of the blocks that were constructed between 1998–2005, and 13.6% of the blocks constructed after 2005, had R( Δ v ) values greater than 15 mm/year. Similarly, the old blocks had lower R( Δ v ) values than the newer blocks in regions IV and V. The percentages of blocks with R( Δ v ) >15 mm/year were 0%, 9.4%, and 5% for old blocks, blocks constructed between 1998–2005, and blocks constructed after 2005, respectively (Figure 8). As R( Δ v ) represents the spatial variability of changes in subsidence velocity within the blocks, these results show that the new blocks were less stable than the old blocks.
We further focussed on the 48 blocks constructed after 2005 (28 blocks in regions I, II, and III, and 20 blocks in regions IV and V) and analysed the relationship between subsidence and building volume for these blocks. The 48 blocks were selected because they had a greater spatial unevenness and temporal instability of land subsidence than the old blocks. Compared with the blocks that were constructed between 1998–2005, they also had a greater increase in R(s) from 2003–2010 to 2010–2016; therefore, we speculated that the ground settlement within these blocks was more susceptible to the impact of building construction. Figure 9 shows the relationship between the range of cumulative displacement ( R ( s ) ) derived from the TerraSAR-X datasets and the range of building volume within the 48 new blocks in regions I, II, IV, and V. Note that there were no new blocks in region III. Except for in region I, R ( s ) increased with the building load range, i.e., greater differences in building load corresponded to greater unevenness in the settlement within the blocks. For example, in region V, three blocks had building volume differences greater than 2 × 10⁵ m3 and average R ( s ) values that reached 93 mm, which was a greater value than that of the blocks with small differences in building volume.

4.4. Building-Scale Subsidence and Building Volume

A building-scale analysis was performed on the 16 new blocks (seven in region I, 1 in region II, 5 in region IV and 3 in region V) with building volume differences greater than 105 m3 since they have relatively high subsidence unevenness. We calculated the cumulative displacement of each building from 2010 to 2016 using the co-registered PS points derived from the TerraSAR-X datasets, and analysed the relationship between building volume and displacement. Table 5 lists the coefficient, intercept, and R2 values of the linear regression model with building volume (105 m3) as the explanatory variable, and building cumulative displacement as the response variable. Despite low R2 values (0.1–0.43), most of the blocks (13 out of 16) showed a negative relationship (negative coefficient) between building volume and displacement; that is, building settlement increased with the magnitude of building volume. For example, in the Dafangju block community in region II, the buildings in the west subsided by approximately 740 mm between 2010–2016, while those in the east only subsided by approximately 635 mm in the same period. The volume of the western buildings was approximately 3.3 × 10⁵ m3, and that of the eastern buildings was approximately 0.3 × 10⁵ m3 (Figure 10a). In the Jintaixianfeng block community, there was a building cluster in the southeast with a greater subsidence rate than that of the other buildings. An examination of the building cluster showed that the buildings were commercial high rises with a volume of approximately 1.5 × 10⁵ m3, while the other buildings had a volume of approximately 0.4 × 10⁵ m3 (Figure 10b). However, in the remaining three blocks, a similar pattern was not found. For example, in the Huamao block of region V, there were three high-rise buildings constructed between 2005–2008 with 28–36 floors above the ground and four basement floors comprising a commercial centre. However, the displacement rate of these skyscrapers was obviously lower than that of the surrounding low-rise buildings.

5. Discussion

5.1. Causes of Land Subsidence at the Regional Scale

As illustrated in Table 2 and Table 3 and Figure 5, land subsidence between 2003–2010 and 2010–2016 presented similar spatial patterns. The settlement funnels in the Chaoyang district were clearly present in both time periods, and the deformation rates in regions I, II, and III were significantly higher than those in regions IV and V. We overlaid the contour map of the average groundwater table in the second confined aquifer between 2003–2010 and 2010–2016 on the displacement map, and found that the spatial variation in the land subsidence rate was generally consistent with the groundwater level contours (Figure 11a,b). However, the distribution of the subsidence bowl did not exactly align with the groundwater depression cone, which may be affected by the compressibility of the soil structure and the geological fault zone [7]. The comparison between Figure 11a,b shows that the groundwater level decreased considerably from 2003–2010 to 2010–2016. Correspondingly, the subsidence bowls expanded, and the subsidence rate increased during the two time periods. By comparing the land surface displacement time series derived from the TerraSAR-X data with the confined groundwater level changes at two observation wells between 2005–2014 [33], we found that the land subsidence trend was closely related to temporal variations in the groundwater level (Figure 11c,d). When the groundwater level declined, the magnitude of displacement increased correspondingly. Intense groundwater withdraw is the predominant cause of subsidence in the Beijing plain area, since regional drops in piezometric levels could reduce pore pressure and increase effective stresses [4].
The thickness of the soft clay layer provides the lithology and structural background for land subsidence in the Beijing plain area. In our study area, the highest deformation rate occurred in regions I, II, and III, where the compressible clay layer thickness reached 50–70 m. Thicker compressible soil tends to have a relatively high deformation rate when piezometric levels decrease. For each region, the mean and SD of the deformation rate within the blocks had similar patterns as those of the whole region, indicating that the subsidence rate of these blocks can represent the overall regional situation (Table 1). The spatial–temporal deformation rate pattern revealed that regional-scale land subsidence was mainly caused by drops in the groundwater level and mainly controlled by structures, including the compressible thickness of the clay layer and faults.

5.2. Effects of Building Characteristics on Block-Scale Subsidence Unevenness

The spatiotemporal evolution of land subsidence in the study area was mainly controlled by the aforementioned hydrogeological factors at the regional scale. Therefore, no substantial differences in cumulative settlement ( s ¯ ) and the subsidence rate change ( Δ v ¯ ) were discovered among the three types of blocks classified by the age of construction in either the subsidence centre area (regions I, II, and III) or the area far from the subsidence centre (regions IV and V). However, we did find that newer blocks had a higher spatial unevenness of subsidence than older blocks. In addition, the increase in displacement unevenness from 2003–2010 to 2010–2016 and the spatial variation of the velocity change in the new blocks were higher than those in the old blocks. In contrast, the old blocks were more stable than the new blocks. These observations were the most obvious in the four groups of blocks with new blocks and old blocks near each other (Figure 7). At such a local scale, the lithology features and groundwater conditions were similar; thus, the contribution of groundwater variations to displacement unevenness was limited. On the other hand, the construction of buildings could lead to significant load changes, thus resulting in uneven subsidence within blocks. As the old blocks had been built more than 10 years before the TerraSAR-X data acquisition time, the primary consolidation processes may had completed before this period; thus, the old blocks were more stable than the nearby new blocks.
Solari et al. [11] reported a positive relationship between the building construction age and settlement rate in small urban areas in Pisa, Italy. Dong et al. [34] also presented that the construction of urban infrastructure induces local-scale uneven subsidence in Shanghai, China. Stramondo et al. [10] detected some local areas affected by subsidence rates greater than 10 mm/year in Rome, and revealed the effect of building construction on land subsidence. Pratesi et al. [12] reported that the subsidence of newly constructed building displayed a sharp slope of displacement velocities during the first year of completion of construction in Florence, Italy. In these studies, regional subsidence showed homogeneous spatial patterns in urban areas, while localised high deformation rates were detected in some newly developed buildings or districts. Unlike these studies, the urban area in our study showed great spatial variation in deformation associated with variations in the groundwater level and geological condition. Even within the same region, spatial subsidence gradients were visible. Therefore, it is difficult to attribute the difference in the deformation rate of the new and old blocks to the contribution of building construction, because these differences may also be caused by groundwater variations. Nonetheless, a comparison of the settlement unevenness across the blocks, instead of the settlement itself, could minimise the impact of groundwater in such a small area. From our results, the higher spatial unevenness and temporal instability within the new blocks confirmed that the effect of building construction on subsidence could be revealed at a local scale.
For the new blocks that were constructed after 2005, the deformation unevenness was found to be related to the variations in building loads within the blocks. In the study area, most of the residential buildings in the blocks had a construction period less than five years. The intense building construction in a small area disturbed the balance of stresses in the overlying strata. Greater building load variation indicated greater differences in building structures or founding techniques, and thus differential settlement [10]. Skyscrapers may produce greater downward pressure, which consolidates the soft clay layer, than low-rise buildings, and thereby may cause greater subsidence.

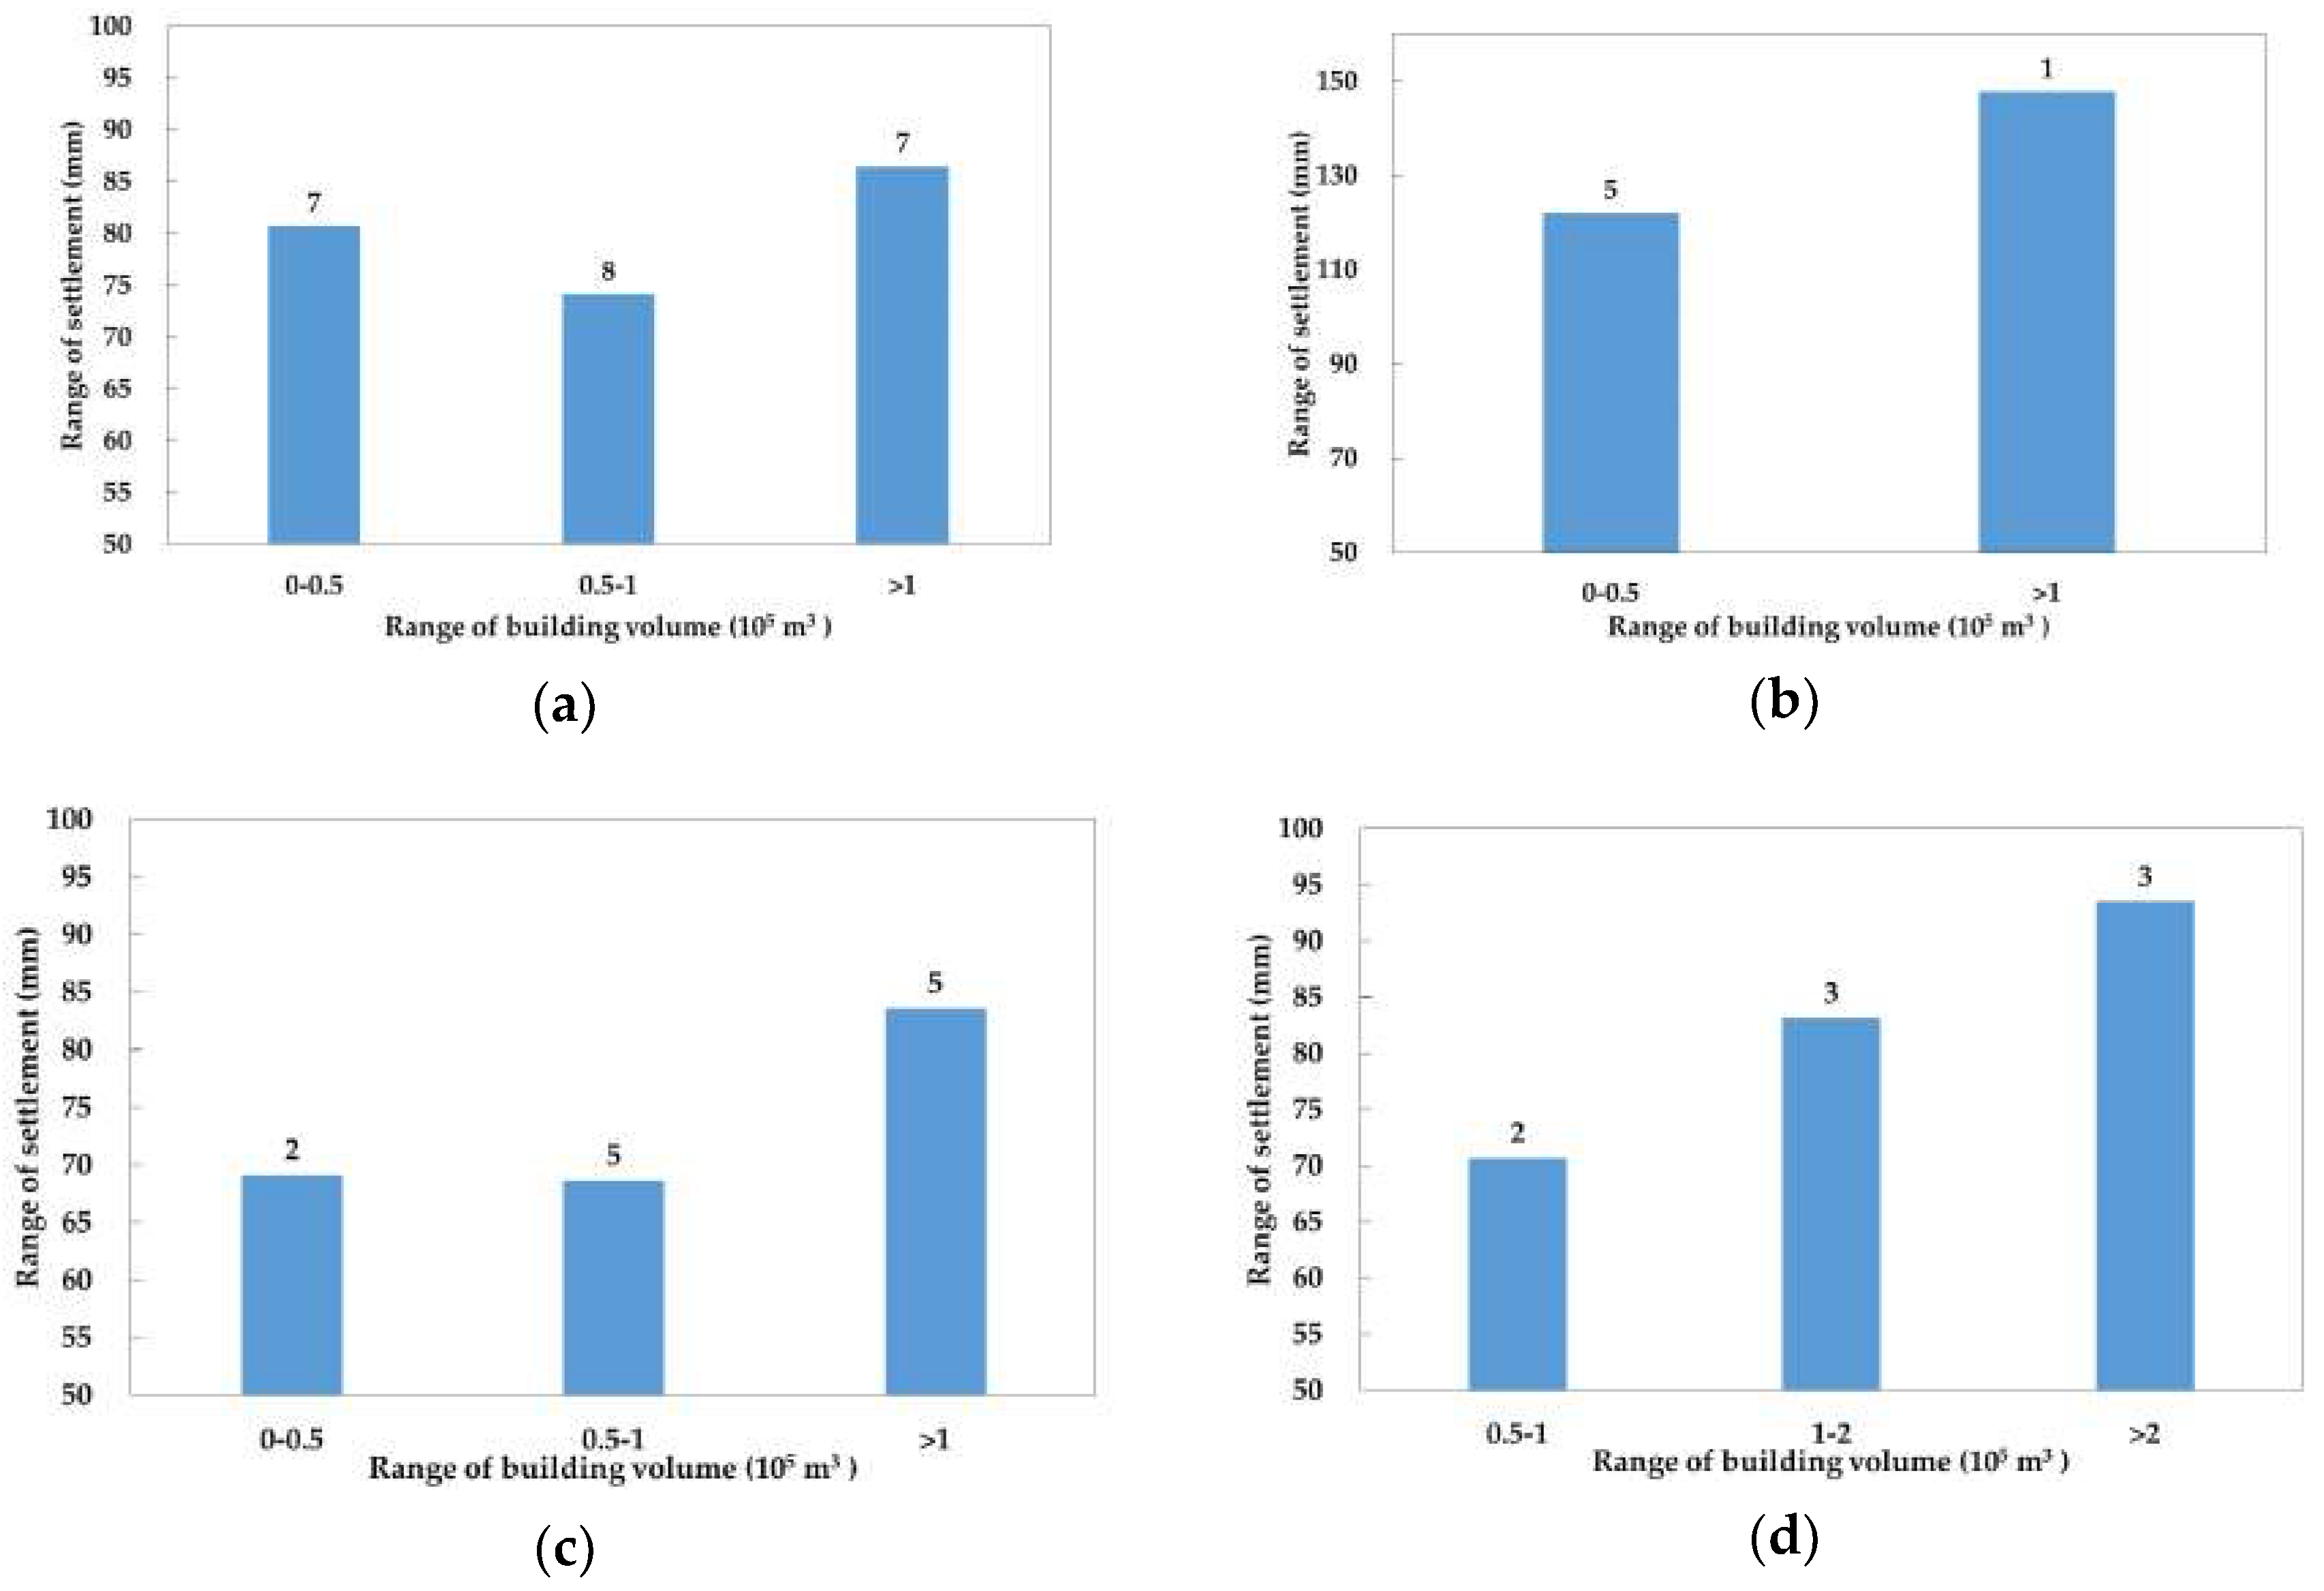
5.3. Effects of Building Volume on Building-Scale Subsidence

The magnitude of the imposed building load has been demonstrated as a factor promoting consolidation and high displacement rates [11]. In our study area, the analysis of the 16 blocks showed that building settlement increased with building volume in most blocks. Similarly, Jiao et al. [18] reported that buildings with a volume of over 3 × 10⁵ m3 had higher subsidence rates than small-volume buildings in the western CBD area. We also found that the R2 of the positive relationship was relatively low, and a few blocks, such as those in the Huamao Centre, even showed an opposite trend. A possible explanation for this is that the load contribution to ground settlement also depended on the type of foundation and corresponding depth [10]. For example, the three high-rise buildings in the Huamao Centre had four basement floors that each had a depth of at least 18 m. The foundation piles of these buildings may reach down to the substrate. The use of long piles or super long piles in high or super high buildings can effectively reduce settlement, and the increase in the building load does not cause the same proportion of ground settlement. Nonetheless, pile foundation construction may cause ground deformation in surrounding areas as a result of the stress transfer effect [34], and thus affect the spatial unevenness of the subsidence within a block.

6. Conclusions

In this study, we analysed the relationship between ground subsidence and building characteristics in the Beijing Chaoyang and Tongzhou districts using the PS-InSAR technique. First, 39 Envisat ASAR images between 2003–2010 and 55 TerraSAR-X images between 2010 to 2016 were used to obtain surface deformation. The results showed that the ground deformation rate in the Beijing urban area ranged from −109 mm/year to +13.1 mm/year from 2003 to 2010, and from −151 mm/year to +19 mm/year from 2010 to 2016. There were two obvious subsidence bowls in the eastern part of the Chaoyang District. The displacement rates that were estimated by the PS-InSAR datasets agreed well with the levelling observations, and the average biases were 1.57 mm/year at 12 levelling benchmarks from 2003 to 2010, 4.53 mm/year at five levelling benchmarks from 2010–2013, and 5.01 mm/year at 13 levelling benchmarks from 2015–2016. The study area was partitioned into five hydrogeological regions with similar groundwater levels at the second confined aquifer and compressible layer thicknesses. A total of 138 blocks with 6023 buildings were selected and analysed in the five regions. Based on the land subsidence monitoring results, we analysed the land subsidence pattern and its relationship with different building characteristics at regional, block, and building scales, and the following conclusions were drawn:
(1)
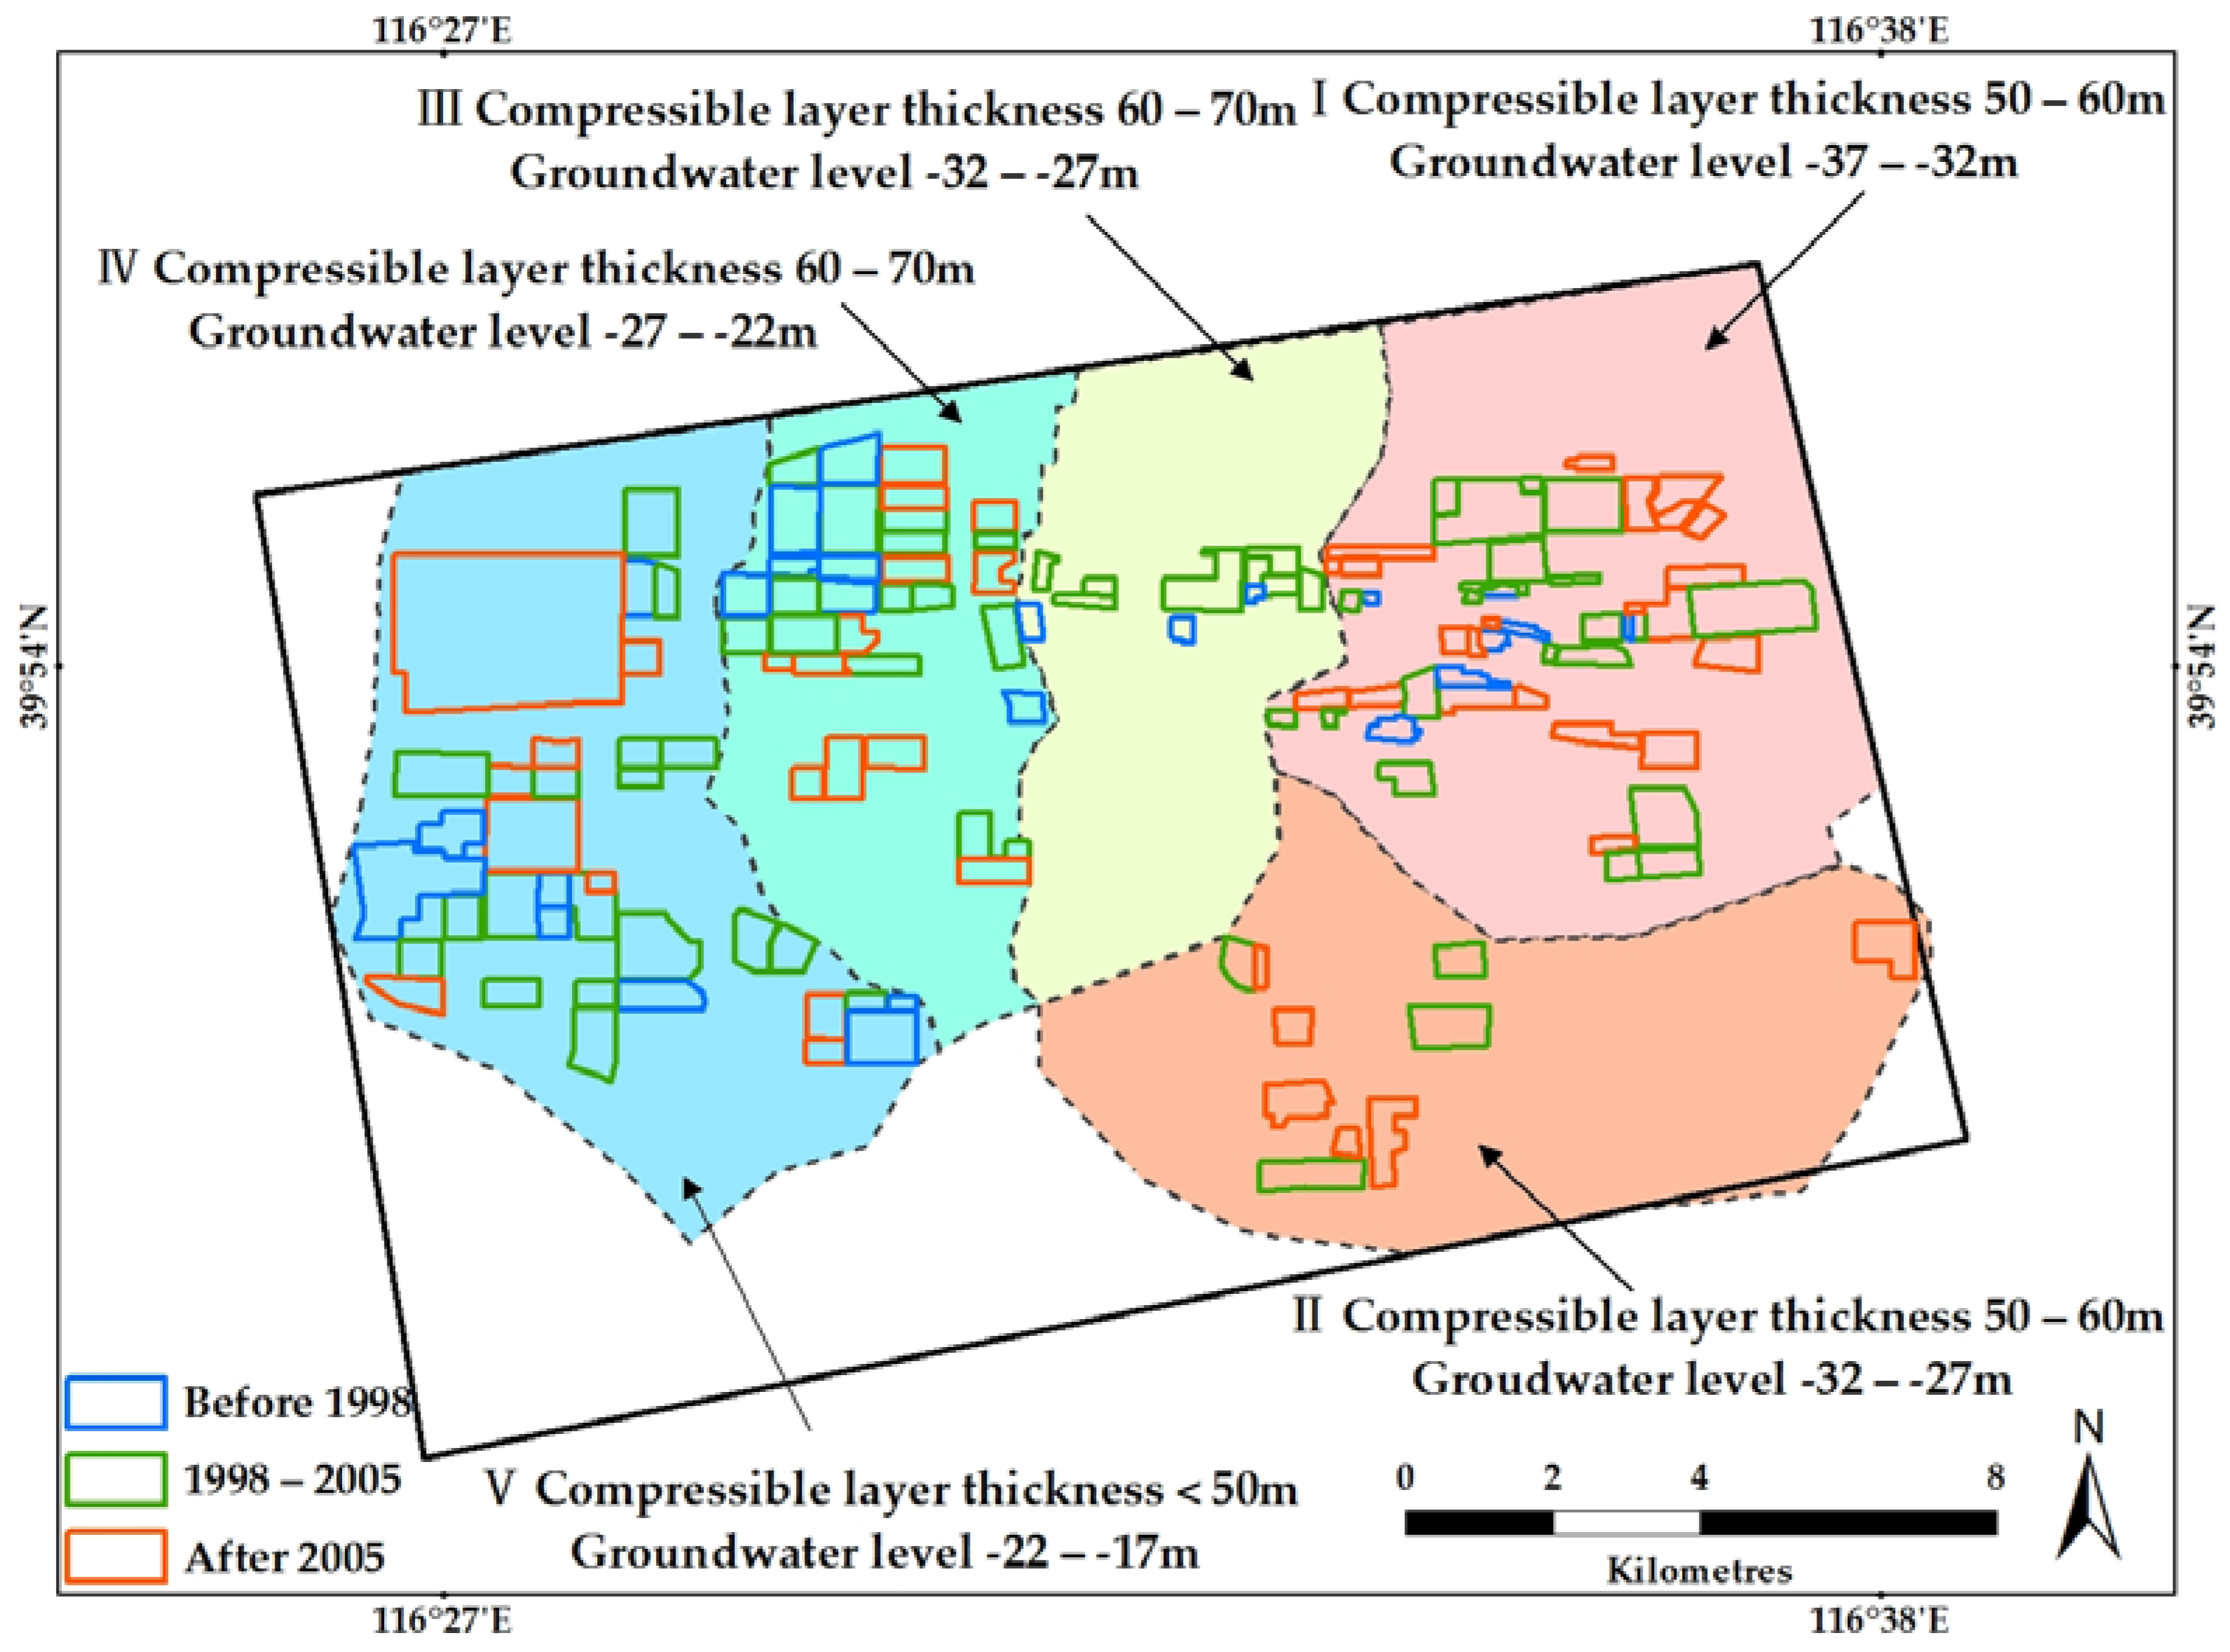
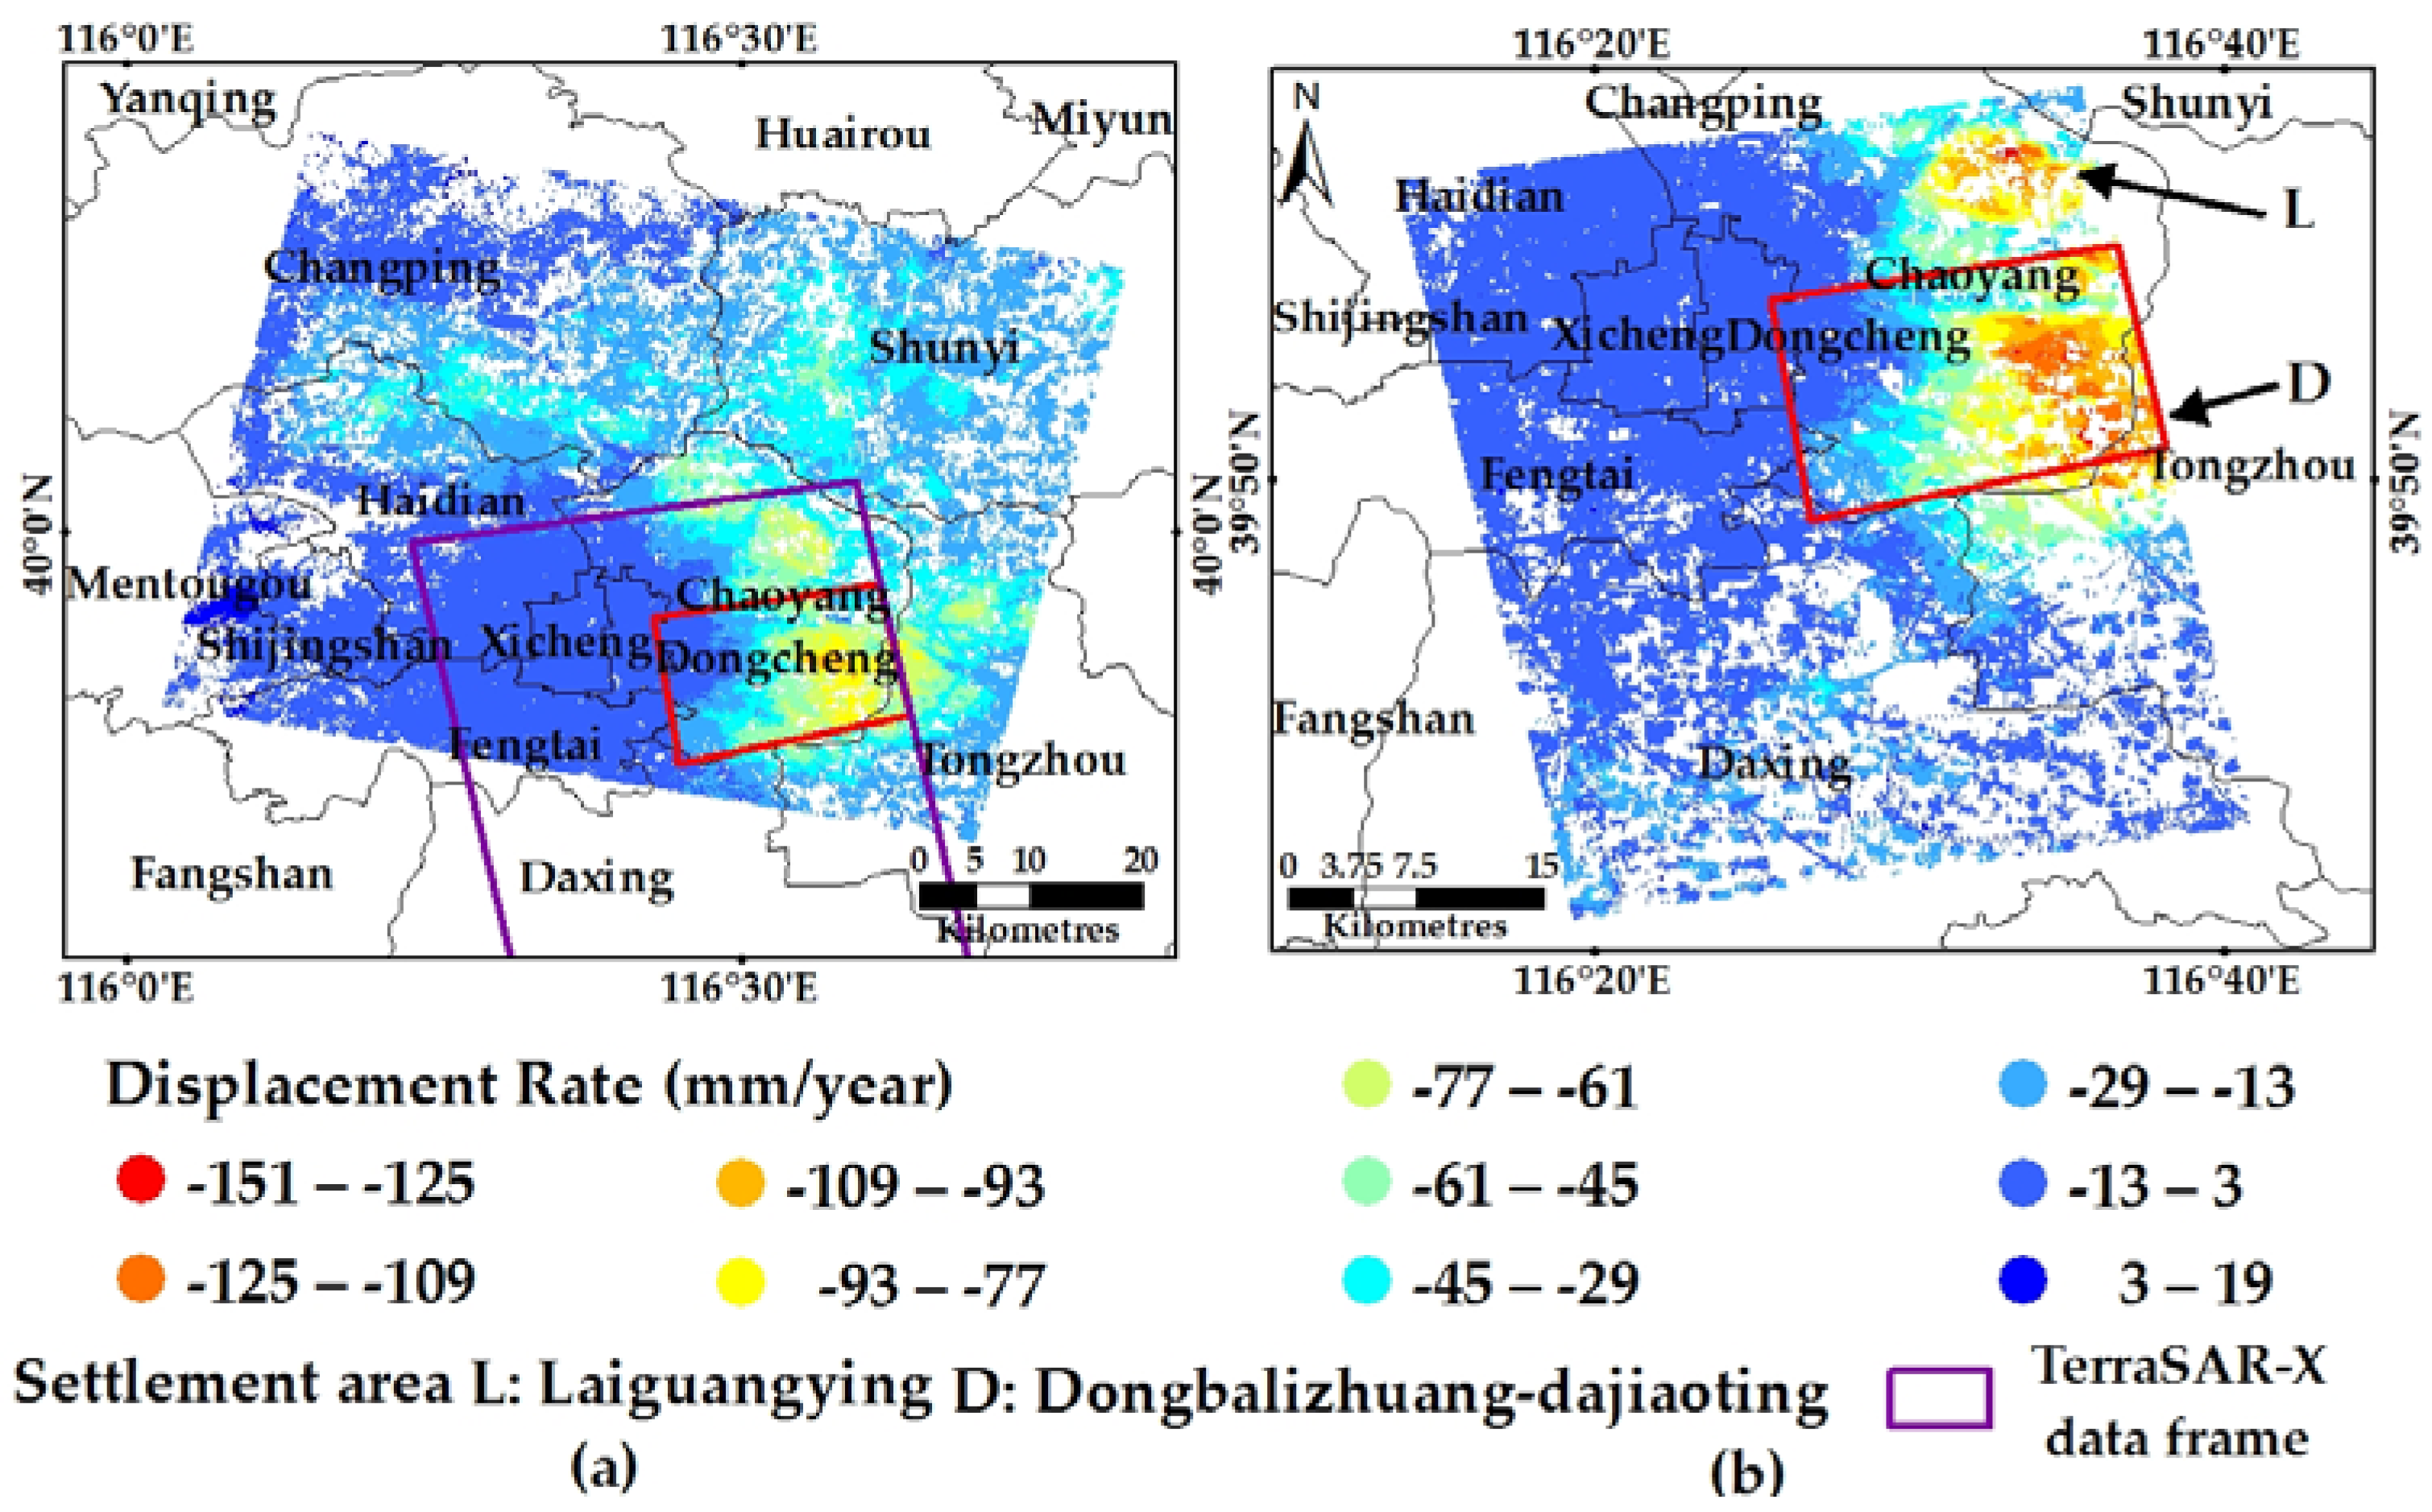
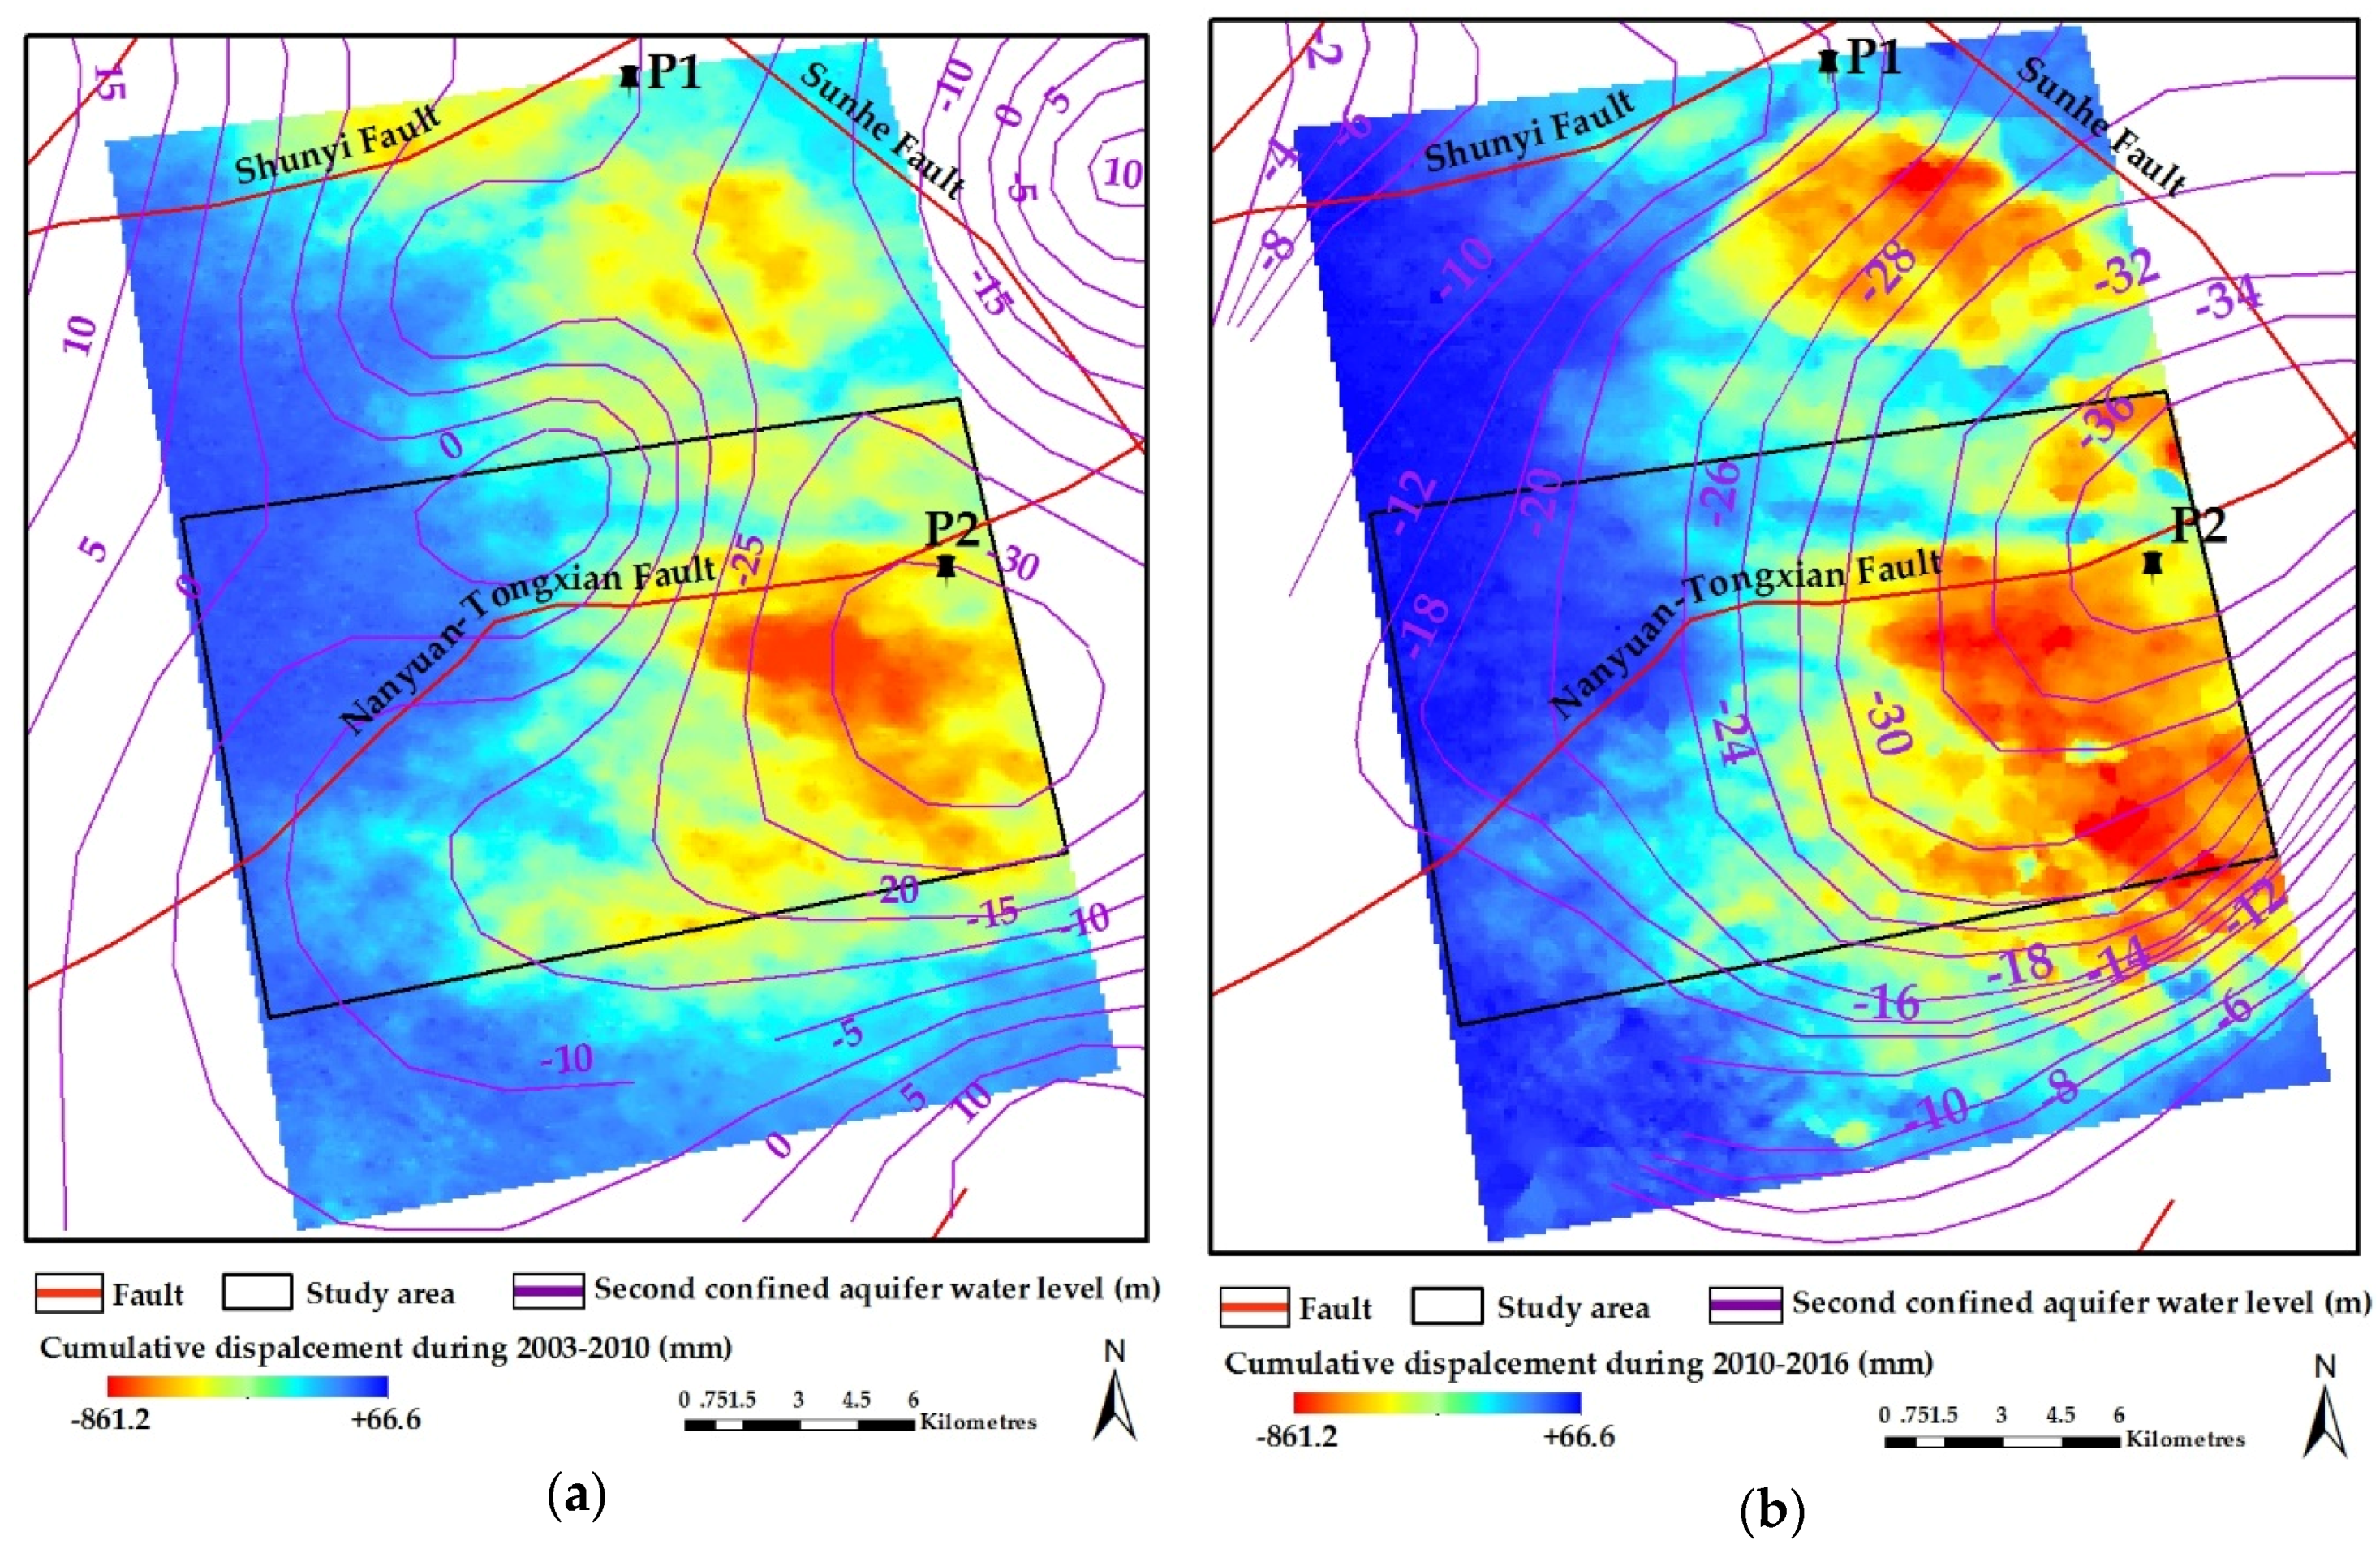
At the regional scale, the spatiotemporal evolution of land subsidence was mainly controlled by declines in the groundwater level, compressible layer thickness, and geological faults. The spatial pattern of the land subsidence rate distribution was consistent with groundwater level contours during the two time periods, and the highest deformation rate occurred in regions I, II, and III, where the compressible clay layer thickness reached 50–70 m. Geological faults also affected the subsidence unevenness at a regional scale. The mean and SD of ground displacement increased significantly from 2003–2010 to 2010–2016 in almost all of the regions. For each region, the mean and SD of ground displacement within the blocks showed a similar spatiotemporal pattern as that within the whole region.
(2)
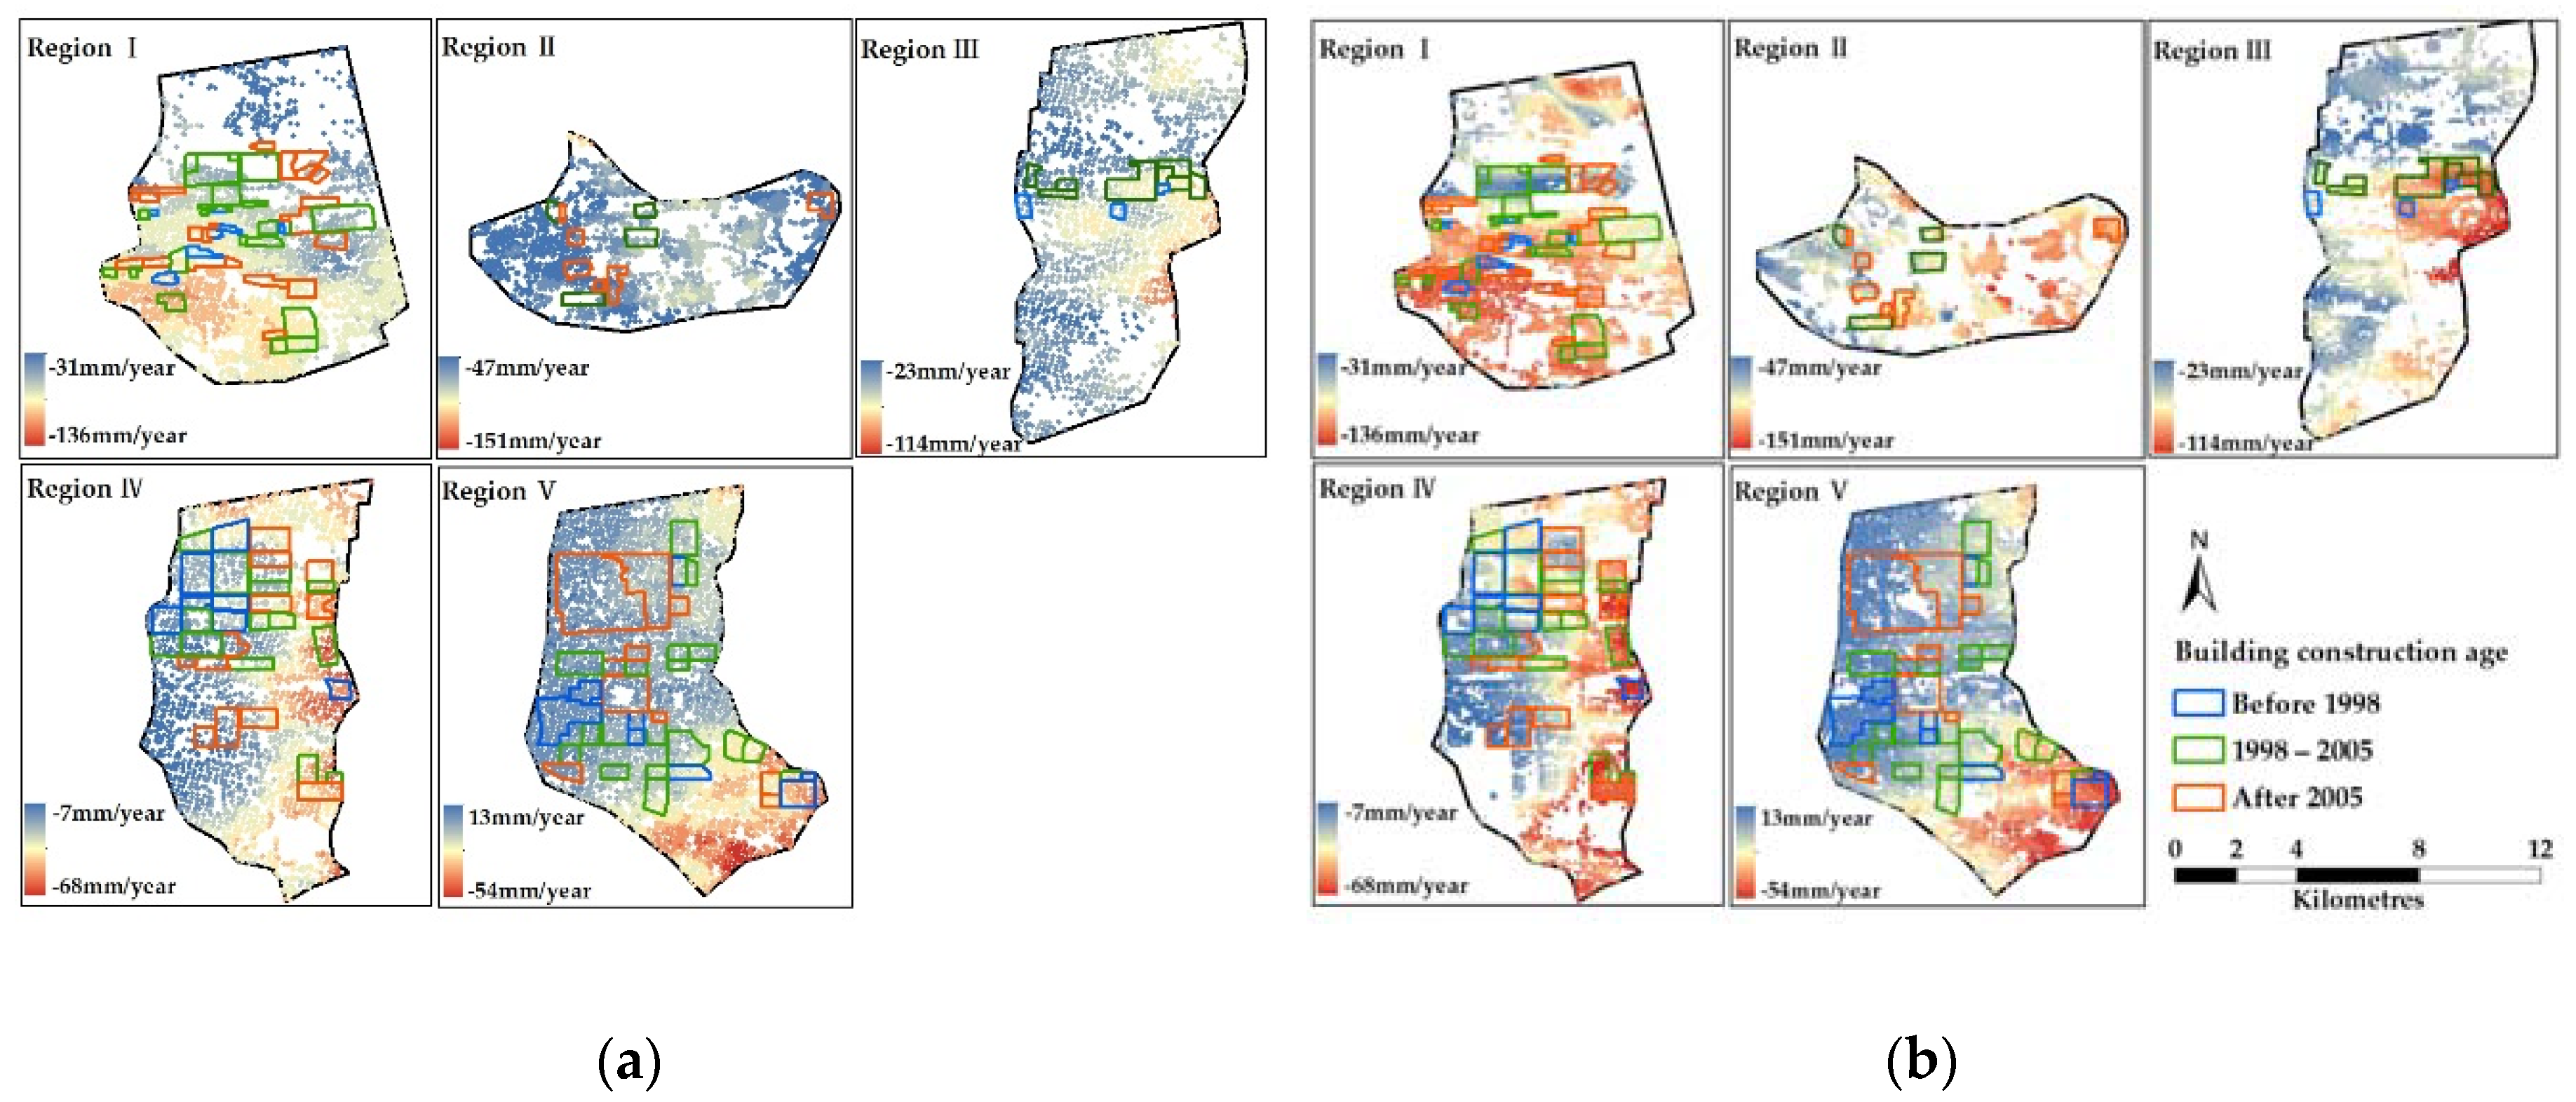
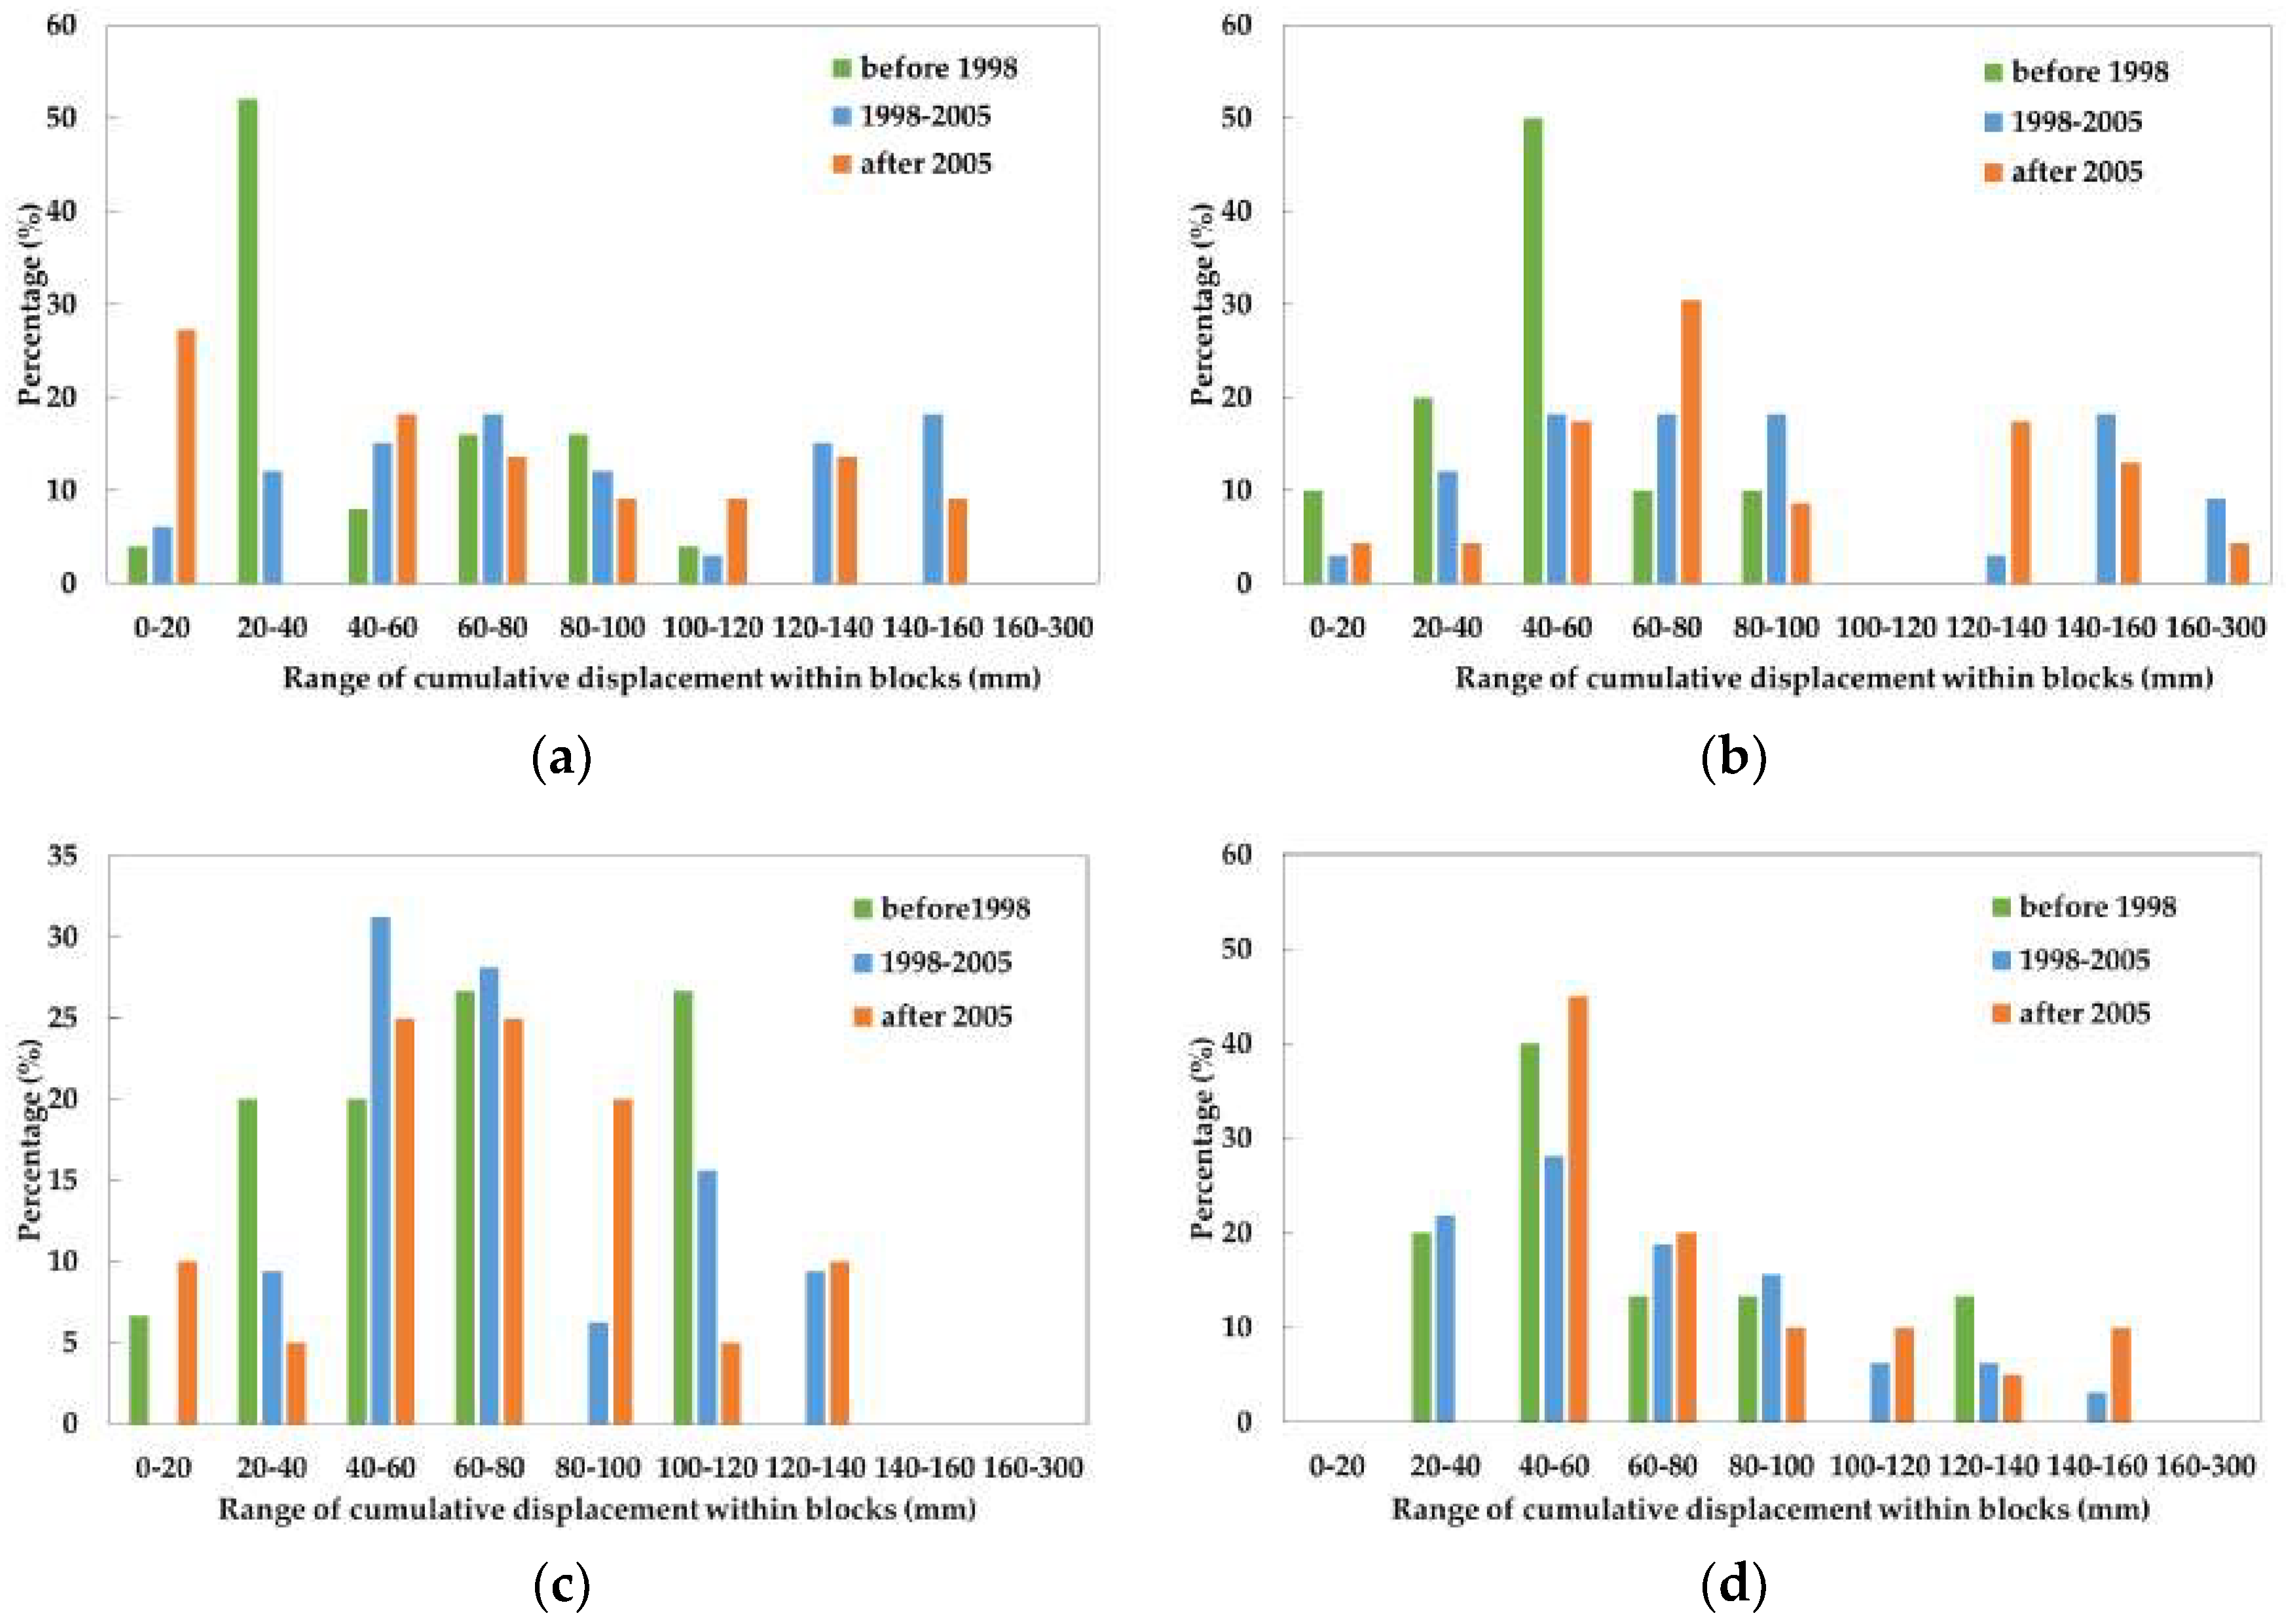
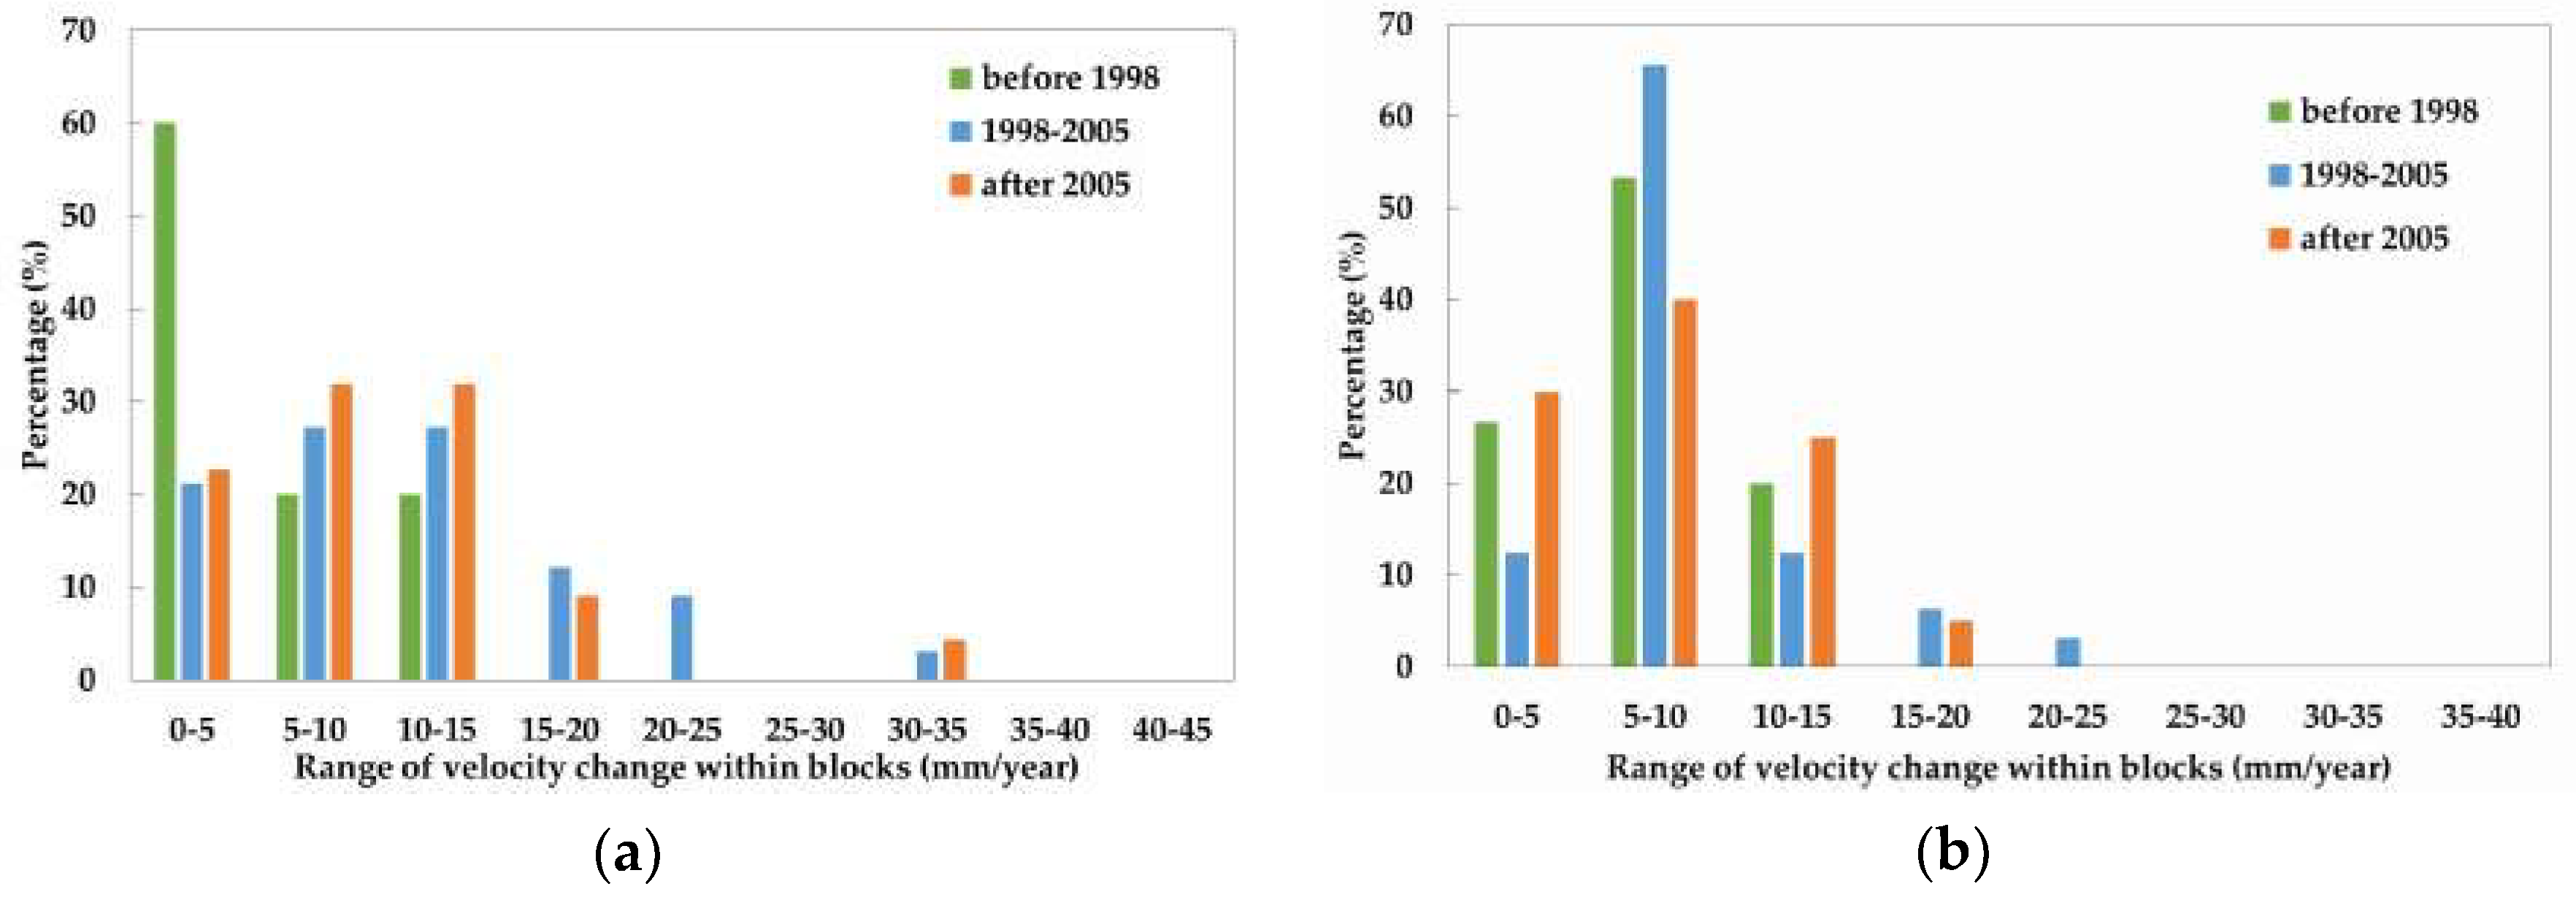
At the block scale, we analysed the relationship between the age of block construction and the deformation at the subsidence centre area (regions I, II, and III) and the area far from the subsidence centre (regions IV and V). Interestingly, we found that newly constructed blocks (constructed between 1998–2005 and after 2005) had a considerably higher spatial unevenness of ground settlement than the old blocks (constructed before 1998), especially during the time period of 2010–2016, as shown by the TerraSAR-X dataset. This pattern was more obvious for the block cluster with adjacent new and old blocks. The temporal instability of the deformation within the new blocks was also greater than that within the old blocks. For the new buildings, we found that subsidence unevenness was related to the variation in building volume within the block. Greater variations in building volume corresponded to greater subsidence unevenness. The block-scale results indicated that intense building construction within a small area could disturb the balance of stresses in the overlying strata, and thus cause differential settlement.
(3)
At the building scale, an analysis of 16 new blocks with a building volume range over 105 m3 demonstrated a weak positive relationship between single-building settlement and building volume in 13 blocks. However, in the remaining three blocks, we found the settlement rates of some high-rise buildings were lower than those of low-rise buildings. Single-building settlement can be caused by the combined effects of load magnitude, foundation structure, and foundation depth.
In summary, the impact of building construction on land subsidence was difficult to determine at the regional scale in a Beijing urban area, as hydrogeological conditions are the main drivers of subsidence, as reported in previous research. At the block scale and single-building scale, we found block construction age and building volume could affect the spatial unevenness and instability of subsidence. As the urban area in Beijing is characterised by complex land use and varied building properties, the impact of building construction on subsidence might be a combination of effects from these factors. Nevertheless, our conclusion implies that building construction contributed to the spatial unevenness of ground displacement at the local scale, and attention should be paid to those uneven settlement blocks.

Author Contributions

Q.Y. performed the experiment, analysed the data and wrote the manuscript. Y.K. provided crucial guidance and support during the research, and revised the manuscript. D.Z. contributed to the data validation and analysis. B.C. and H.G. provided important suggestions on the research direction. M.L. provided support for the map drawing. L.Z. and X.L. made important suggestions for data processing.

Funding

National Natural Science Foundation of China (Grant: 41401493) and 2015 Beijing Nova Program (xx2015B060).

Acknowledgments

This work was supported by the National Natural Science Foundation of China under Grant [41401493], by the 2015 Beijing Nova Program under Grant [xx2015B060] and by the Beijing Natural Science Foundation under Grant [5172002]. We also thank the reviewers for their valuable suggestions.

Conflicts of Interest

The authors declare no conflict of interest.

References

  1. Zhu, L.; Gong, H.L.; Li, X.J.; Wang, R.; Chen, B.B.; Dai, Z.X.; Teatini, P. Land subsidence due to groundwater withdrawal in the northern Beijing plain, China. Eng. Geol. 2015, 193, 243–255. [Google Scholar] [CrossRef]
  2. Chen, M.; Tomás, R.; Li, Z.H.; Motagh, M.; Li, T.; Hu, L.Y.; Gong, H.L.; Li, X.J.; Yu, J.; Gong, X.L. Imaging Land Subsidence Induced by Groundwater Extraction in Beijing (China) Using Satellite Radar Interferometry. Remote Sens. 2016, 8, 468. [Google Scholar] [CrossRef]
  3. Chen, B.B.; Gong, H.L.; Li, X.J.; Lei, K.C.; Zhu, L.; Gao, M.L.; Zhou, C.F. Characterization and causes of land subsidence in Beijing, China. Int. J. Remote Sens. 2017, 38, 808–826. [Google Scholar] [CrossRef]
  4. Lei, K.C.; Luo, Y.; Chen, B.B.; Guo, G.X.; Zhou, Y. Distribution characteristics and influence factors of land subsidence in Beijing area. Geol. China 2016, 6, 2216–2228. [Google Scholar]
  5. Zhou, C.F.; Gong, H.L.; Chen, B.B.; Zhu, F.; Duan, G.Y.; Gao, M.L.; Lu, W. Land subsidence under different land use in the eastern Beijing plain, China 2005–2013 revealed by InSAR timeseries analysis. GISci. Remote Sens. 2016, 53, 671–688. [Google Scholar] [CrossRef]
  6. Zhou, C.; Gong, H.; Chen, B.; Li, J.; Gao, M.; Zhu, F.; Chen, W.; Liang, Y. InSAR Time-Series Analysis of Land Subsidence under Different Land Use Types in the Eastern Beijing Plain, China. Remote Sens. 2017, 9, 380. [Google Scholar] [CrossRef]
  7. Gao, M.L.; Gong, H.L.; Chen, B.B.; Zhou, C.F.; Chen, W.F.; Liang, Y.; Shi, M.; Si, Y. InSAR time-series investigation of long-term ground displacement at Beijing Capital International Airport, China. Tectonophysics 2016, 691, 271–281. [Google Scholar] [CrossRef]
  8. Teatini, P.; Tosi, L.; Strozzi, T.; Carbognin, L.; Cecconi, G.; Rosselli, R.; Libardo, S. Resolving land subsidence within the Venice Lagoon by persistent scatterer SAR interferometry. Phys. Chem. Earth 2012, 40–41, 72–79. [Google Scholar] [CrossRef]
  9. Deng, Z.; Ke, Y.H.; Gong, H.L.; Li, X.J.; Li, Z.H. Land subsidence prediction in Beijing based on PS-InSAR technique and improved Grey-Markov model. GISci. Remote Sens. 2017, 54, 797–818. [Google Scholar] [CrossRef]
  10. Stramondo, S.; Bozzano, F.; Marra, F.; Wegmuller, U.; Cinti, F.R.; Moro, M.; Saroli, M. Subsidence induced by urbanisation in the city of Rome detected by advanced InSAR technique and geotechnical investigations. Remote Sens. Environ. 2008, 112, 3160–3172. [Google Scholar] [CrossRef]
  11. Solari, L.; Ciampalini, A.; Raspini, F.; Bianchini, S.; Moretti, S. PSInSAR Analysis in the Pisa Urban Area (Italy): A Case Study of Subsidence Related to Stratigraphical Factors and Urbanization. Remote Sens. 2016, 8, 120. [Google Scholar] [CrossRef]
  12. Pratesi, F.; Tapete, D.; Del Ventisette, C.; Moretti, S. Mapping interactions between geology, subsurface resource exploitation and urban development in transforming cities using InSAR Persistent Scatterers: Two decades of change in Florence, Italy. Appl. Geogr. 2016, 77, 20–37. [Google Scholar] [CrossRef]
  13. Chen, G.; Zhang, Y.; Zeng, R.Q.; Yang, Z.K.; Chen, X.; Zhao, F.M.; Meng, X.M. Detection of land subsidence associated with land creation and rapid urbanization in the Chinese Loess Plateau using Time Series InSAR: A case study of Lanzhou New District. Remote Sens. 2018. [Google Scholar] [CrossRef]
  14. Tosi, L.; Strozzi, T.; Da Lio, C.; Teatini, P. Regional and local land subsidence at the Venice coastland by TerraSAR-X PSI. Proc. Int. Assoc. Hydrol. Sci. 2015, 372, 199–205. [Google Scholar] [CrossRef] [Green Version]
  15. Tosi, L.; Da Lio, C.; Strozzi, T.; Teatini, P. Combining L- and X-Band SAR Interferometry to Assess Ground Displacements in Heterogeneous Coastal Environments: The Po River Delta and Venice Lagoon, Italy. Remote Sens. 2016, 8, 308. [Google Scholar] [CrossRef]
  16. Maghsoudi, Y.; van der Meer, F.; Hecker, C.; Perissin, D.; Saepuloh, A. Using PS-InSAR to detect surface deformation in geothermal areas of West Java in Indonesia. Int. J. Appl. Earth Obs. Geoinform. 2018, 64, 386–396. [Google Scholar] [CrossRef]
  17. Liao, M.S.; Pei, Y.Y.; Wang, H.M.; Fang, Z.L.; Wei, L.H. Subsidence Monitoring in Shanghai Using the PSInSAR Technique. Shanghai Land Resour. 2012, 33, 5–10. [Google Scholar]
  18. Qin, X.Q.; Yang, M.S.; Wang, H.M.; Yang, T.L.; Lin, J.X.; Liao, M.S. Application of High-resolution PS-InSAR in Deformation Characteristic Probe of Urban Rail Transit. Acta Geod. Geophys. Sin. 2016, 45, 713–721. [Google Scholar]
  19. Chen, W.F.; Gong, H.L.; Chen, B.B.; Liu, K.S.; Gao, M.L.; Zhou, C.F. Spatiotemporal evolution of land subsidence around a subway using InSAR time-series and the entropy method. GISci. Remote Sens. 2017, 54, 78–94. [Google Scholar] [CrossRef]
  20. Solari, L.; Ciampalini, A.; Raspini, F.; Bianchini, S.; Zinno, I.; Bonano, M.; Manunta, M.; Moretti, S.; Casagli, N. Combined Use of C- and X-Band SAR Data for Subsidence Monitoring in an Urban Area. Geosciences 2017, 7, 21. [Google Scholar] [CrossRef]
  21. Tapete, D.; Morelli, S.; Fanti, R.; Casagli, N. Localising deformation along the elevation of linear structures: An experiment with spaceborne InSAR and RTK GPS on the Roman Aqueducts in Rome, Italy. Appl. Geogr. 2015, 58, 65–83. [Google Scholar] [CrossRef] [Green Version]
  22. Tang, Y.; Cui, Z.; Wang, J.; Yan, L.; Yan, X. Application of grey theory-based model to prediction of land subsidence due to engineering environment in Shanghai. Environ. Geol. 2008, 55, 583–593. [Google Scholar] [CrossRef]
  23. Cui, Z.; Tang, Y.; Yan, X. Centrifuge modeling of land subsidence caused by the high-rise building group in the soft soil area. Environ. Earth Sci. 2010, 59, 1819–1826. [Google Scholar] [CrossRef]
  24. Xu, Y.; Ma, L.; Du, Y.; Shen, S. Analysis of urbanisation-induced land subsidence in Shanghai. Nat. Hazards 2012, 63, 1255–1267. [Google Scholar] [CrossRef]
  25. Chen, B.B.; Gong, H.L.; Li, X.J.; Lei, K.C.; Ke, Y.H.; Duan, G.Y.; Zhou, C.F. Spatial correlation between land subsidence and urbanization in Beijing, China. Nat. Hazards 2015, 75, 2637–2652. [Google Scholar] [CrossRef]
  26. Chen, B.B.; Gong, H.L.; Li, X.J.; Lei, K.C.; Gao, M.L.; Zhou, C.F.; Ke, Y.H. Spatial–temporal evolution patterns of land subsidence with different situation of space utilization. Nat. Hazards 2015, 77, 1765–1783. [Google Scholar] [CrossRef]
  27. Jiao, S.; Yu, J.; Milas, A.S.; Li, X.; Liu, L. Assessing the Impact of Building Volume on Land Subsidence in the Central Business District of Beijing with SAR Tomography. Can. J. Remote Sens. 2017, 43, 177–193. [Google Scholar] [CrossRef]
  28. Hooper, A.; Zebker, H.; Segall, P.; Kampes, B. A new method for measuring deformation on volcanoes and other natural terrains using InSAR persistent scatterers. Geophys. Res. Lett. 2004, 31. [Google Scholar] [CrossRef] [Green Version]
  29. Ferretti, A.; Prati, C.; Rocca, F. Nonlinear subsidence rate estimation using permanent scatterers in differential SAR interferometry. IEEE Trans. Geosci. Remote Sens. 2000, 38, 2202–2212. [Google Scholar] [CrossRef]
  30. Perissin, D.; Rocca, F. High-accuracy urban DEM using permanent scatterers. IEEE Trans. Geosci. Remote Sens. 2006, 44, 3338–3347. [Google Scholar] [CrossRef]
  31. Ruiz-Armenteros, A.M.; Bakon, M.; Lazecky, M.; Delgado, J.M.; Sousa, J.J.; Perissin, D.; Caro-Cuenca, M. Multi-Temporal InSAR Processing Comparison in Presence of High Topography. Procedia Comput. Sci. 2016, 100, 1181–1190. [Google Scholar] [CrossRef]
  32. Çomut, F.C.; Ustun, A.; Lazecky, M.; Aref, M.M. Multi band InSAR analysis of subsidence development based on the long period time series. Int. Arch. Photogramm. Remote Sens. Spat. Inf. Sci. 2015, 40, 115–121. [Google Scholar] [CrossRef]
  33. Wu, A. Chinese Institute of Geological Environment Monitoring. China Groundwater Level Yearbook for Geo-Environmental Monitoring; China Land Press: Beijing, China, 2014; pp. 154–196. ISBN 9787802463813. [Google Scholar]
  34. Dong, S.; Smsonov, S.; Yin, H.; Ye, S.; Cao, Y. Time-series analysis of subsidence associated with rapid urbanization in Shanghai, China measured with SBAS InSAR method. Environ. Earth Sci. 2014, 72, 677–691. [Google Scholar] [CrossRef]
Figure 1. Study area and dataset coverage.
Remotesensing 10 01006 g001
Figure 2. Location and extent of five regions.
Remotesensing 10 01006 g002
Figure 3. Average displacement rate derived from the (a) Envisat Advanced Synthetic Aperture Radar (ASAR) datasets during 2003–2010 and (b) TerraSAR-X datasets during 2010–2016. The red outline shows the boundary of the study area.
Remotesensing 10 01006 g003
Figure 4. Comparison of the displacement rates derived from the permanent scatterer interferometric synthetic aperture radar (PS-InSAR) technique and levelling measurements.
Remotesensing 10 01006 g004
Figure 5. Deformation rates of each region during (a) 2003–2010 and (b) 2010–2016.
Remotesensing 10 01006 g005
Figure 6. Percentage of blocks with different intervals of R(s) within blocks in (a) regions I, II, and III derived from the ASAR datasets; (b) regions I, II, and III derived from the TerraSAR-X datasets; (c) regions IV and V derived from the ASAR datasets; and (d) regions IV and V derived from the TerraSAR-X datasets.
Remotesensing 10 01006 g006
Figure 7. Four groups of neighbouring blocks ((a) group a, (b) group b, (c) group c, and (d) group d) and (e) the range of cumulative settlement derived from TerraSAR-X datasets for each group.
Remotesensing 10 01006 g007
Figure 8. Percentage of blocks with different intervals of R(∆v) within blocks in (a) regions I, II, and III, and (b) regions IV and V.
Remotesensing 10 01006 g008
Figure 9. Average range of cumulative settlement ( R ( s ) ¯ ) between 2010–2016 for blocks with different building volume ranges in (a) region I, (b) region II, (c) region IV, and (d) region V. The numbers above each bar denote the number of blocks.
Remotesensing 10 01006 g009
Figure 10. Cumulative displacement within the (a) Dafangju block and (b) Jintaixianfeng block.
Remotesensing 10 01006 g010
Figure 11. (a) Compressible thickness and groundwater level at the second confined aquifer superimposed onto an interpolated cumulative land deformation map. (b) Cumulative displacement derived by PS-InSAR and groundwater level at (c) the eastern Chaoyang and (d) eastern Balizhuang observation wells.
Remotesensing 10 01006 g011aRemotesensing 10 01006 g011b
Table 1. Compressible layer thickness, groundwater level, and number of blocks within each region.
RegionIIIIIIIVV
Compressible Layer Thickness (m)50–6050–6060–7060–70<50
Groundwater Level (m)
at Second Confined Aquifer
−37–32−32–−27−32–−27−27–−22−22–−17
Number of BlocksBefore 199870378
1998–200521481319
After 20052260128
Total5010113235
Table 2. Deformation rate of persistent scatterer (PS) points during 2003–2010 within regions and blocks. SD: standard deviations.
RegionIIIIIIIVV
Total Number of PS points32882305210325204513
Mean Deformation Rate of PS points (mm/year)−75.2−68.1−53.8−26.4−13.8
SD of Deformation Rate of PS Points (mm/year)16.711.011.910.68.5
Number of PS Points within Blocks9752612549681727
Mean Deformation Rate within Blocks (mm/year)−69.6−64.8−60.1−25.9−10.8
SD of Deformation Rate within Blocks (mm/year)20.28.610.49.45.7
Table 3. Deformation rate of PS points during 2010–2016 within regions and blocks.
RegionIIIIIIIVV
Total Number of PS Points35,15920,74318,34829,68759,135
Mean Deformation Rate of PS Points (mm/year)−93.1−94.0−64.1−30.4−13.6
SD of Deformation Rate of PS Points (mm/year)22.316.418.413.410.7
Number of PS Points within Blocks15,0235710252716,41925,978
Mean Deformation Rate within Blocks (mm/year)−89.0−91.6−82.0−30.0−11.2
SD of Deformation Rate within Blocks (mm/year)25.212.412.913.28.9
Table 4. The average cumulative settlement ( s ¯ ), average settlement velocity change ( Δ v ¯ ), average range of cumulative displacement ( R ( s ) ¯ ), and average range of velocity change ( R ( Δ v ) ¯ ) of PS pixels within blocks.
RegionConstruction age (N) s ¯ (mm) Δ v ¯ (mm/year) R ( s ) ¯ (mm) R ( Δ v ) ¯ (mm/year)
2003–20102010–20162003–20102010–2016
I–IIIBefore 1998 (10)574.3612.817.552.147.75.8
1998–2005 (33)596.9552.914.586.293.211.0
After 2005 (28) *563.2 *578.615.882.1 *92.510.5
IV, VBefore 1998 (15)144.8130.27.463.364.57.0
1998–2005 (32)165.8126.76.170.173.77.2
After 2005 (20)176.2 134.66.268.978.88.7
*: Among the 28 blocks constructed after 2005 in regions I–III, six blocks had no PS pixels detected by the Envisat ASAR dataset. Thus, they were not considered in the statistical calculation based on the Envisat ASAR dataset.
Table 5. Parameters of the linear regression model between building volume and building deformation. Deformation = a × volume (105) + b.
Region I II
a−149.5−36.0−216.4−17.90.35−4.9−1.8−10.5
b−335.4−366.5−319.6−841.1−840.4−400.2−665.1−679.0
R20.430.100.120.230.210.110.110.35
Region IV V
a11.4−5.80−9.4−7.8−16.54.5−6.2−10.0
b−165.5−113.9−66.8−280.9−83.0−69.9−48.6−45.7
R20.120.100.150.240.130.240.080.33

