Article

Supervised Classification of RGB Aerial Imagery to Evaluate the Impact of a Root Rot Disease

by
Chakradhar Mattupalli
1,
Corey A. Moffet
2,*,
Kushendra N. Shah
1 and
Carolyn A. Young
1,*
1
Noble Research Institute, LLC, 2510 Sam Noble Parkway, Ardmore, OK 73401, USA
2
USDA-ARS, Southern Plains Range Research Station, 2000 18th St., Woodward, OK 73801, USA
*
Authors to whom correspondence should be addressed.
Remote Sens. 2018, 10(6), 917; https://doi.org/10.3390/rs10060917
Submission received: 4 May 2018 / Revised: 1 June 2018 / Accepted: 7 June 2018 / Published: 10 June 2018
(This article belongs to the Section Remote Sensing Image Processing)

Abstract

:
Aerial imaging provides a landscape view of crop fields that can be utilized to monitor plant diseases. Phymatotrichopsis root rot (PRR) is a serious root rot disease affecting several dicotyledonous hosts, including the perennial forage crop alfalfa. PRR disease causes stand loss by spreading as circular to irregular diseased areas that increase over time, but disease progression in alfalfa fields is poorly understood. The objectives of this study were to develop a workflow to produce PRR disease maps from sets of high-resolution red, green and blue (RGB) images acquired from two different platforms and to assess the feasibility of using these PRR disease maps to monitor disease progression in alfalfa fields. Aerial RGB images, two from unmanned aircraft systems (UAS) and four images from a manned aircraft platform were acquired at different time points during the 2014–2015 growing seasons from a center-pivot irrigated, PRR-infested alfalfa field near Burneyville, OK. Supervised classification of images acquired from both platforms were performed using three spectral signatures: image-specific, UAS-platform-specific and manned-aircraft platform-specific. Our results showed that the UAS-platform-specific spectral signature was most efficient for classifying images acquired with the UAS, with accuracy ranging from 90 to 96%. In contrast, manned-aircraft-acquired images classified using image-specific spectral signatures yielded 95 to 100% accuracy. The effect of hue, saturation and value color space transformations (HSV and Hrot60SV) on classification accuracy was determined, but the accuracy estimates showed no improvement in their efficiency compared to the RGB color space. Finally, the data showed that the classification of the bare ground increased by 74% during the study period, indicating the extent of alfalfa stand loss caused by PRR disease. Thus, this study showed the utility of high-resolution RGB aerial images for monitoring PRR disease spread in alfalfa.

Graphical Abstract

1. Introduction

The bird’s-eye view perspective that aerial imagery provides of target areas offers an objective assessment and cost-effective method to monitor large areas compared to ground-based scouting [1]. With recent technological advances, high resolution aerial images can be acquired by coupling different kinds of sensors [2,3] to a variety of platforms, including satellites, manned aircrafts and unmanned aircraft systems. Several studies have utilized aerial images to monitor plant health in agricultural and forest lands [1,4,5]. While the aerial images obtained from sensors differ with sensor type and resolution, they all are derived using a variable wavelength of light energy that is distinctly recorded by the sensor aboard a platform. Furthermore, the utility of various imaging platforms also largely depends on the sensor’s capabilities, the question the user intends to address, and whether the platform–sensor combination is economical. Of course, the value of the answer depends on its accuracy and there is often a tradeoff between accuracy and cost. The optimal platform–sensor combination will balance the spatial, spectral, radiometric, and temporal resolution requirements along with processing requirements to maximize accuracy and minimize costs.
Alfalfa (Medicago sativa L.) is an important perennial forage legume with high nutritive values, making it an ideal choice for cattle feed, especially dairy cattle. Of the 86.7 million tons of hay and haylage produced in the US in 2017, alfalfa accounted for 51% of the total production [6]. However, alfalfa production in southern Oklahoma is severely limited due to Phymatotrichopsis root rot (PRR) disease (also referred to as cotton root rot, Texas root rot, Phymatotrichum root rot or Ozonium root rot), which is caused by Phymatotrichopsis omnivora, a soil-borne ascomycete fungus. In addition to alfalfa, the pathogen has a very broad host range affecting dicotyledonous hosts (including cotton), but not monocotyledonous plants [7]. Symptoms of PRR disease are visible during mid-to-late summer, when diseased plants begin to wilt and then rapidly die. The leaves remain firmly attached to the plant but they turn brown, leaving a clear outline of dead plants at the disease front. In the field, the disease manifests as numerous circular infested areas spreading in a centrifugal fashion, gradually coalescing and enlarging during the growing season [8,9]. As the disease circles expand, the increasing area of bare ground provides an opportunity for the encroachment of weeds. Some alfalfa plants inside the circle recover from the disease and these survivors reestablish by developing a large number of lateral roots below the crown [10].
Monitoring PRR disease movement and assessing the extent of alfalfa stand loss at the ground level pose challenges to producers due to the increasing number of disease circles combined with the emergence of survivors and weeds in the resulting bare ground. Aerial imaging provides the ability to make landscape-scale assessments and is therefore an effective method to monitor and map PRR-diseased areas. In fact, aerial photography taken from an aircraft for visualizing PRR disease in cotton dates back to 1929, and likely represents the first of such report of the study of plant diseases [11,12]. This was later followed by the documentation of PRR-infested areas utilizing color infrared photography and multispectral video imagery, but these images were not further analyzed due to lack of sophisticated image processing techniques [13,14,15].
During the past decade, with the availability of the latest high-end sensors and image analysis software, considerable research has been done to detect and map PRR-infested areas in cotton fields. For example, a manned aircraft that acquired multispectral and hyperspectral images with more than one-meter resolution was successfully utilized to distinguish PRR-infested areas from non-infested areas [15]. Likewise, the utility of six supervised and two unsupervised classification techniques for the accurate classification of multispectral images of PRR-infested cotton fields was also explored [16]. Further, Yang et al. [17] compared multispectral images of PRR-infested cotton fields taken at 10-year intervals and showed how historical images can be used to make site-specific management recommendations. The current literature shows extensive usage of multispectral images acquired using manned aircrafts to study PRR disease progression in cotton fields. However, there is no knowledge of PRR disease progression or mapping available for a perennial forage crop system such as alfalfa. Aerial imaging in alfalfa provides an additional opportunity to not only monitor PRR disease within a growing season, but also across years, spanning different alfalfa stand ages. This enables the tracking of disease initiation and cessation across multiple growing seasons.
The applications for unmanned aircraft systems (UAS) in agriculture have been increasing, with studies such as mapping weed infestations, nutrient and drought stress, to sampling plant pathogen spores from the lower atmosphere [18,19,20,21]. High-resolution multispectral aerial images obtained from UAS were also shown to successfully detect diseases such as Huanglongbing in a citrus orchard and powdery-mildew-affected opium poppy plants [22,23]. Similar research involving the use of UAS has not been reported for the study of PRR disease in alfalfa, thereby presenting an opportunity for further investigation.
In the current study, high-resolution red/green/blue (RGB) aerial images of a PRR-infested alfalfa field were obtained at different times during two crop growing seasons using either manned or unmanned aircraft platforms with the following objectives: (1) develop a workflow to produce PRR disease maps from sets of high-resolution RGB images acquired from two different platforms; and (2) assess the feasibility of using these PRR disease maps to monitor disease progression in alfalfa fields.

2. Materials and Methods
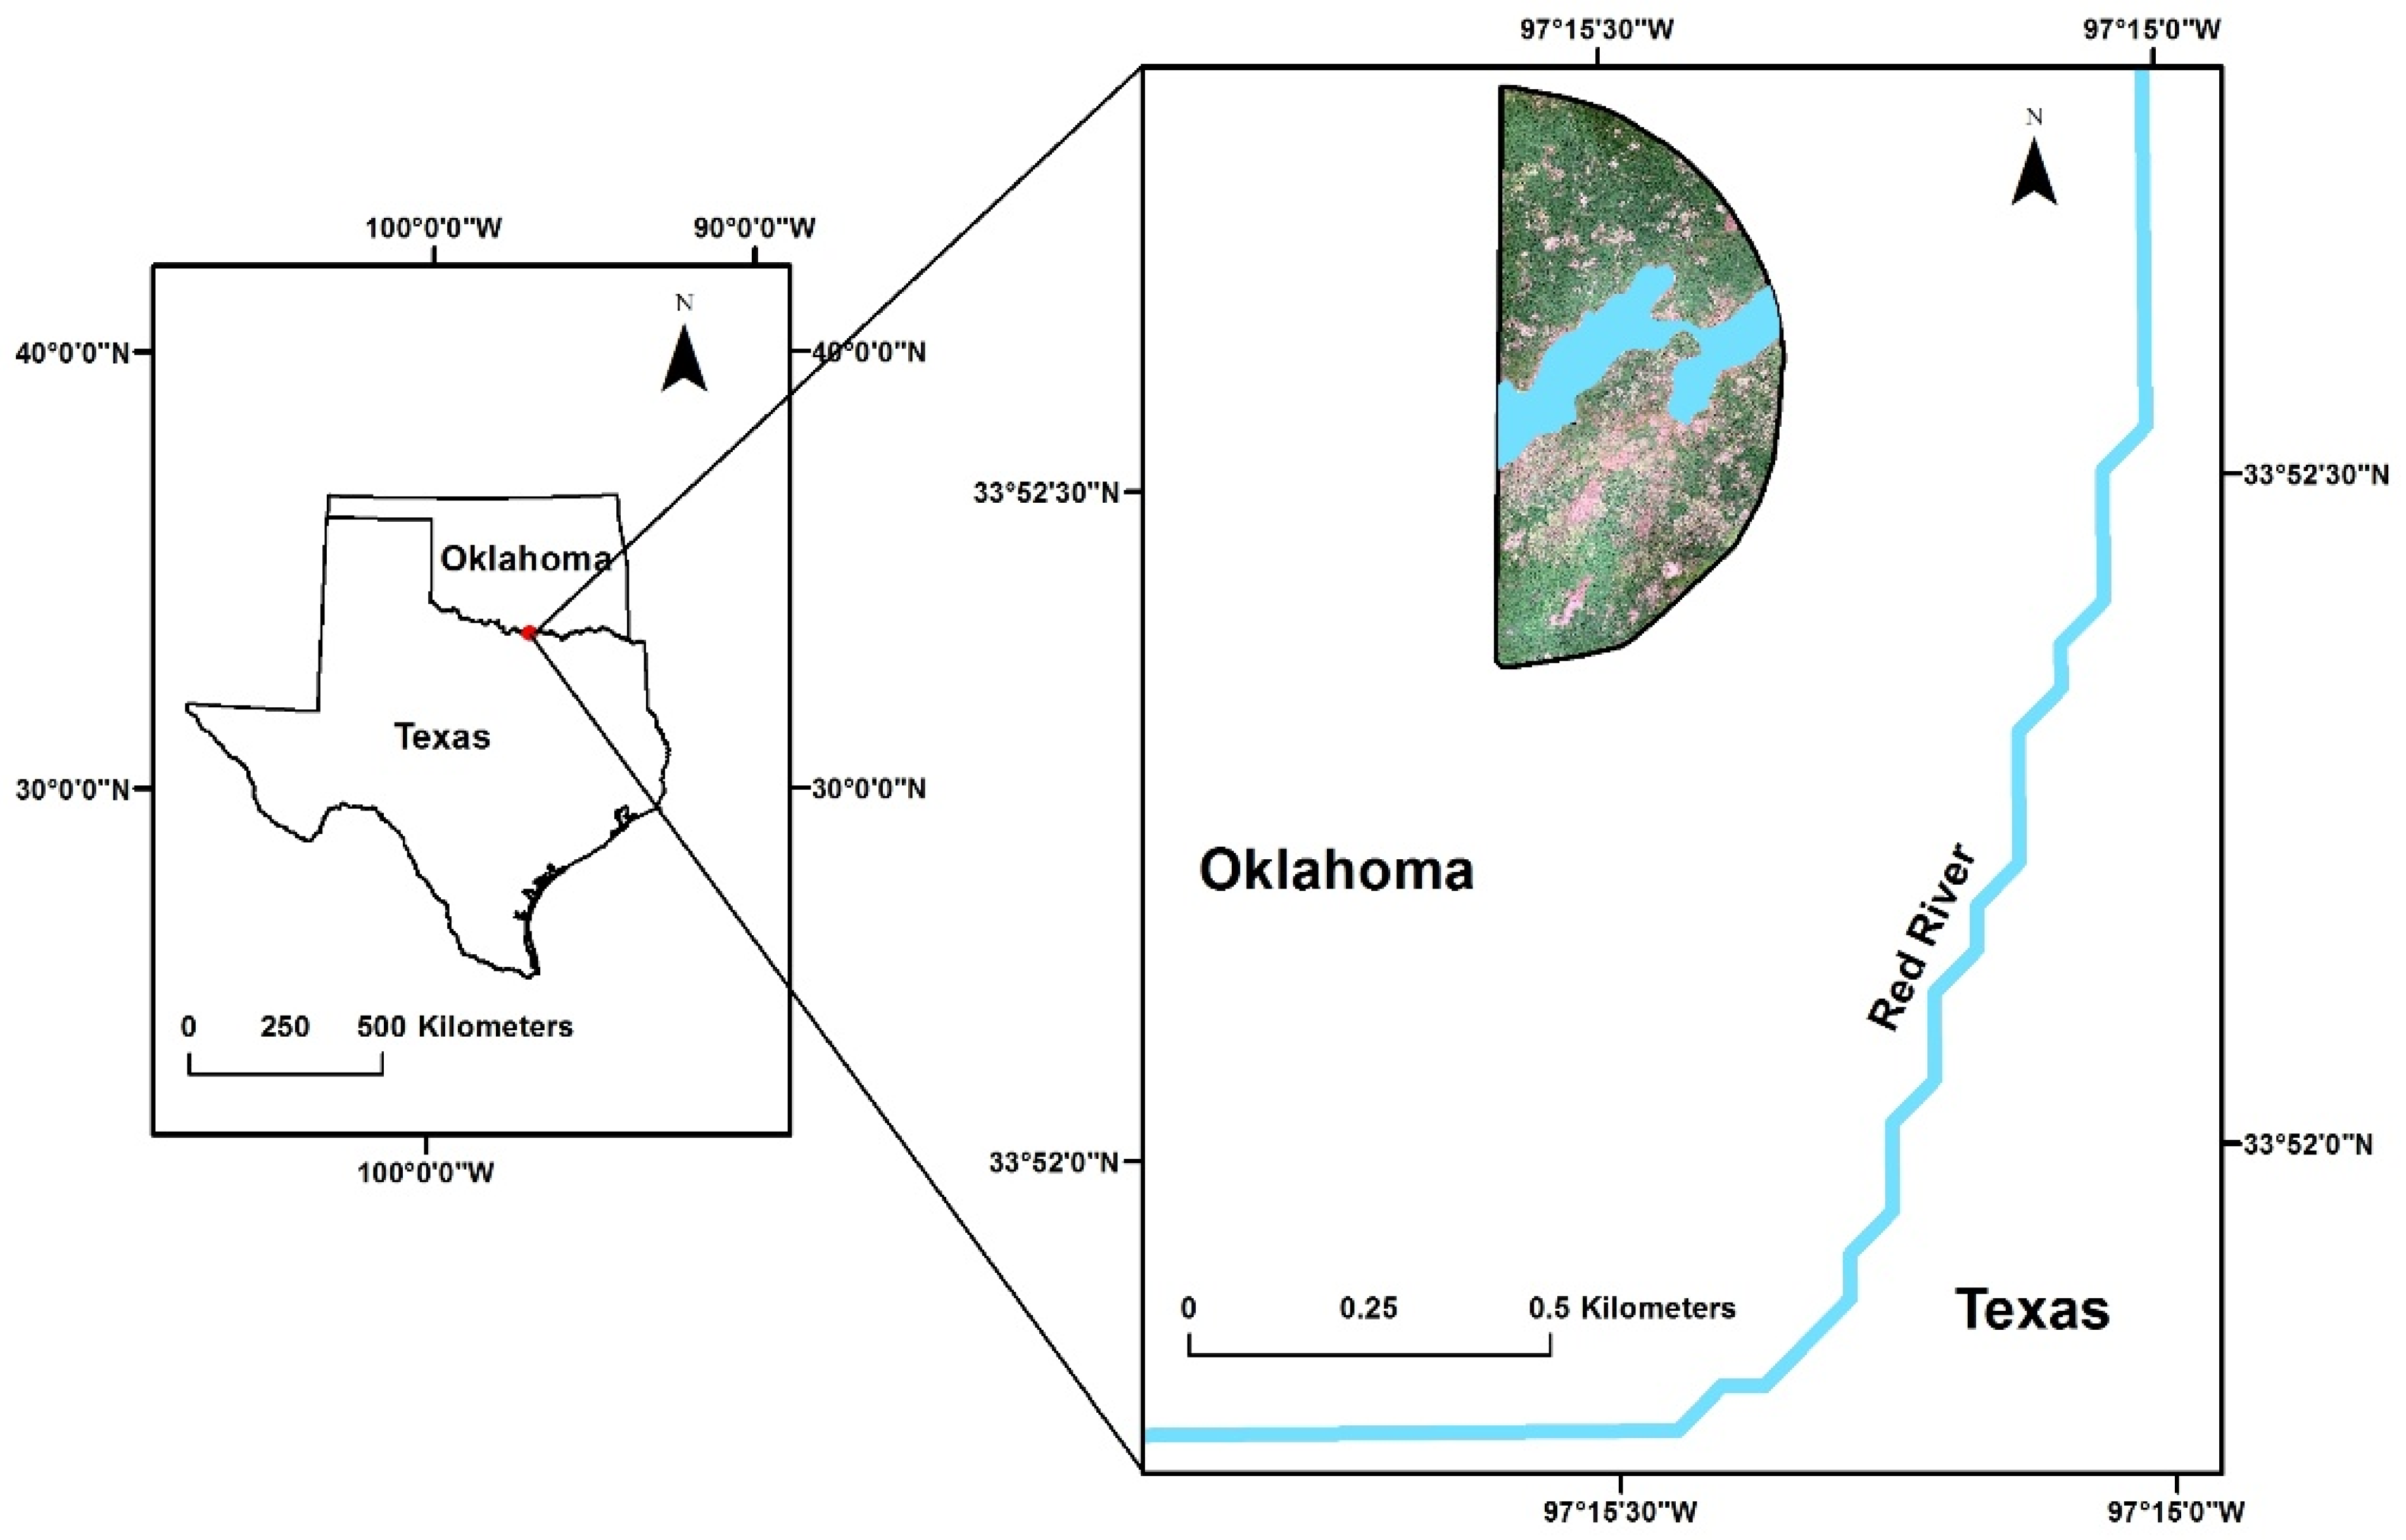
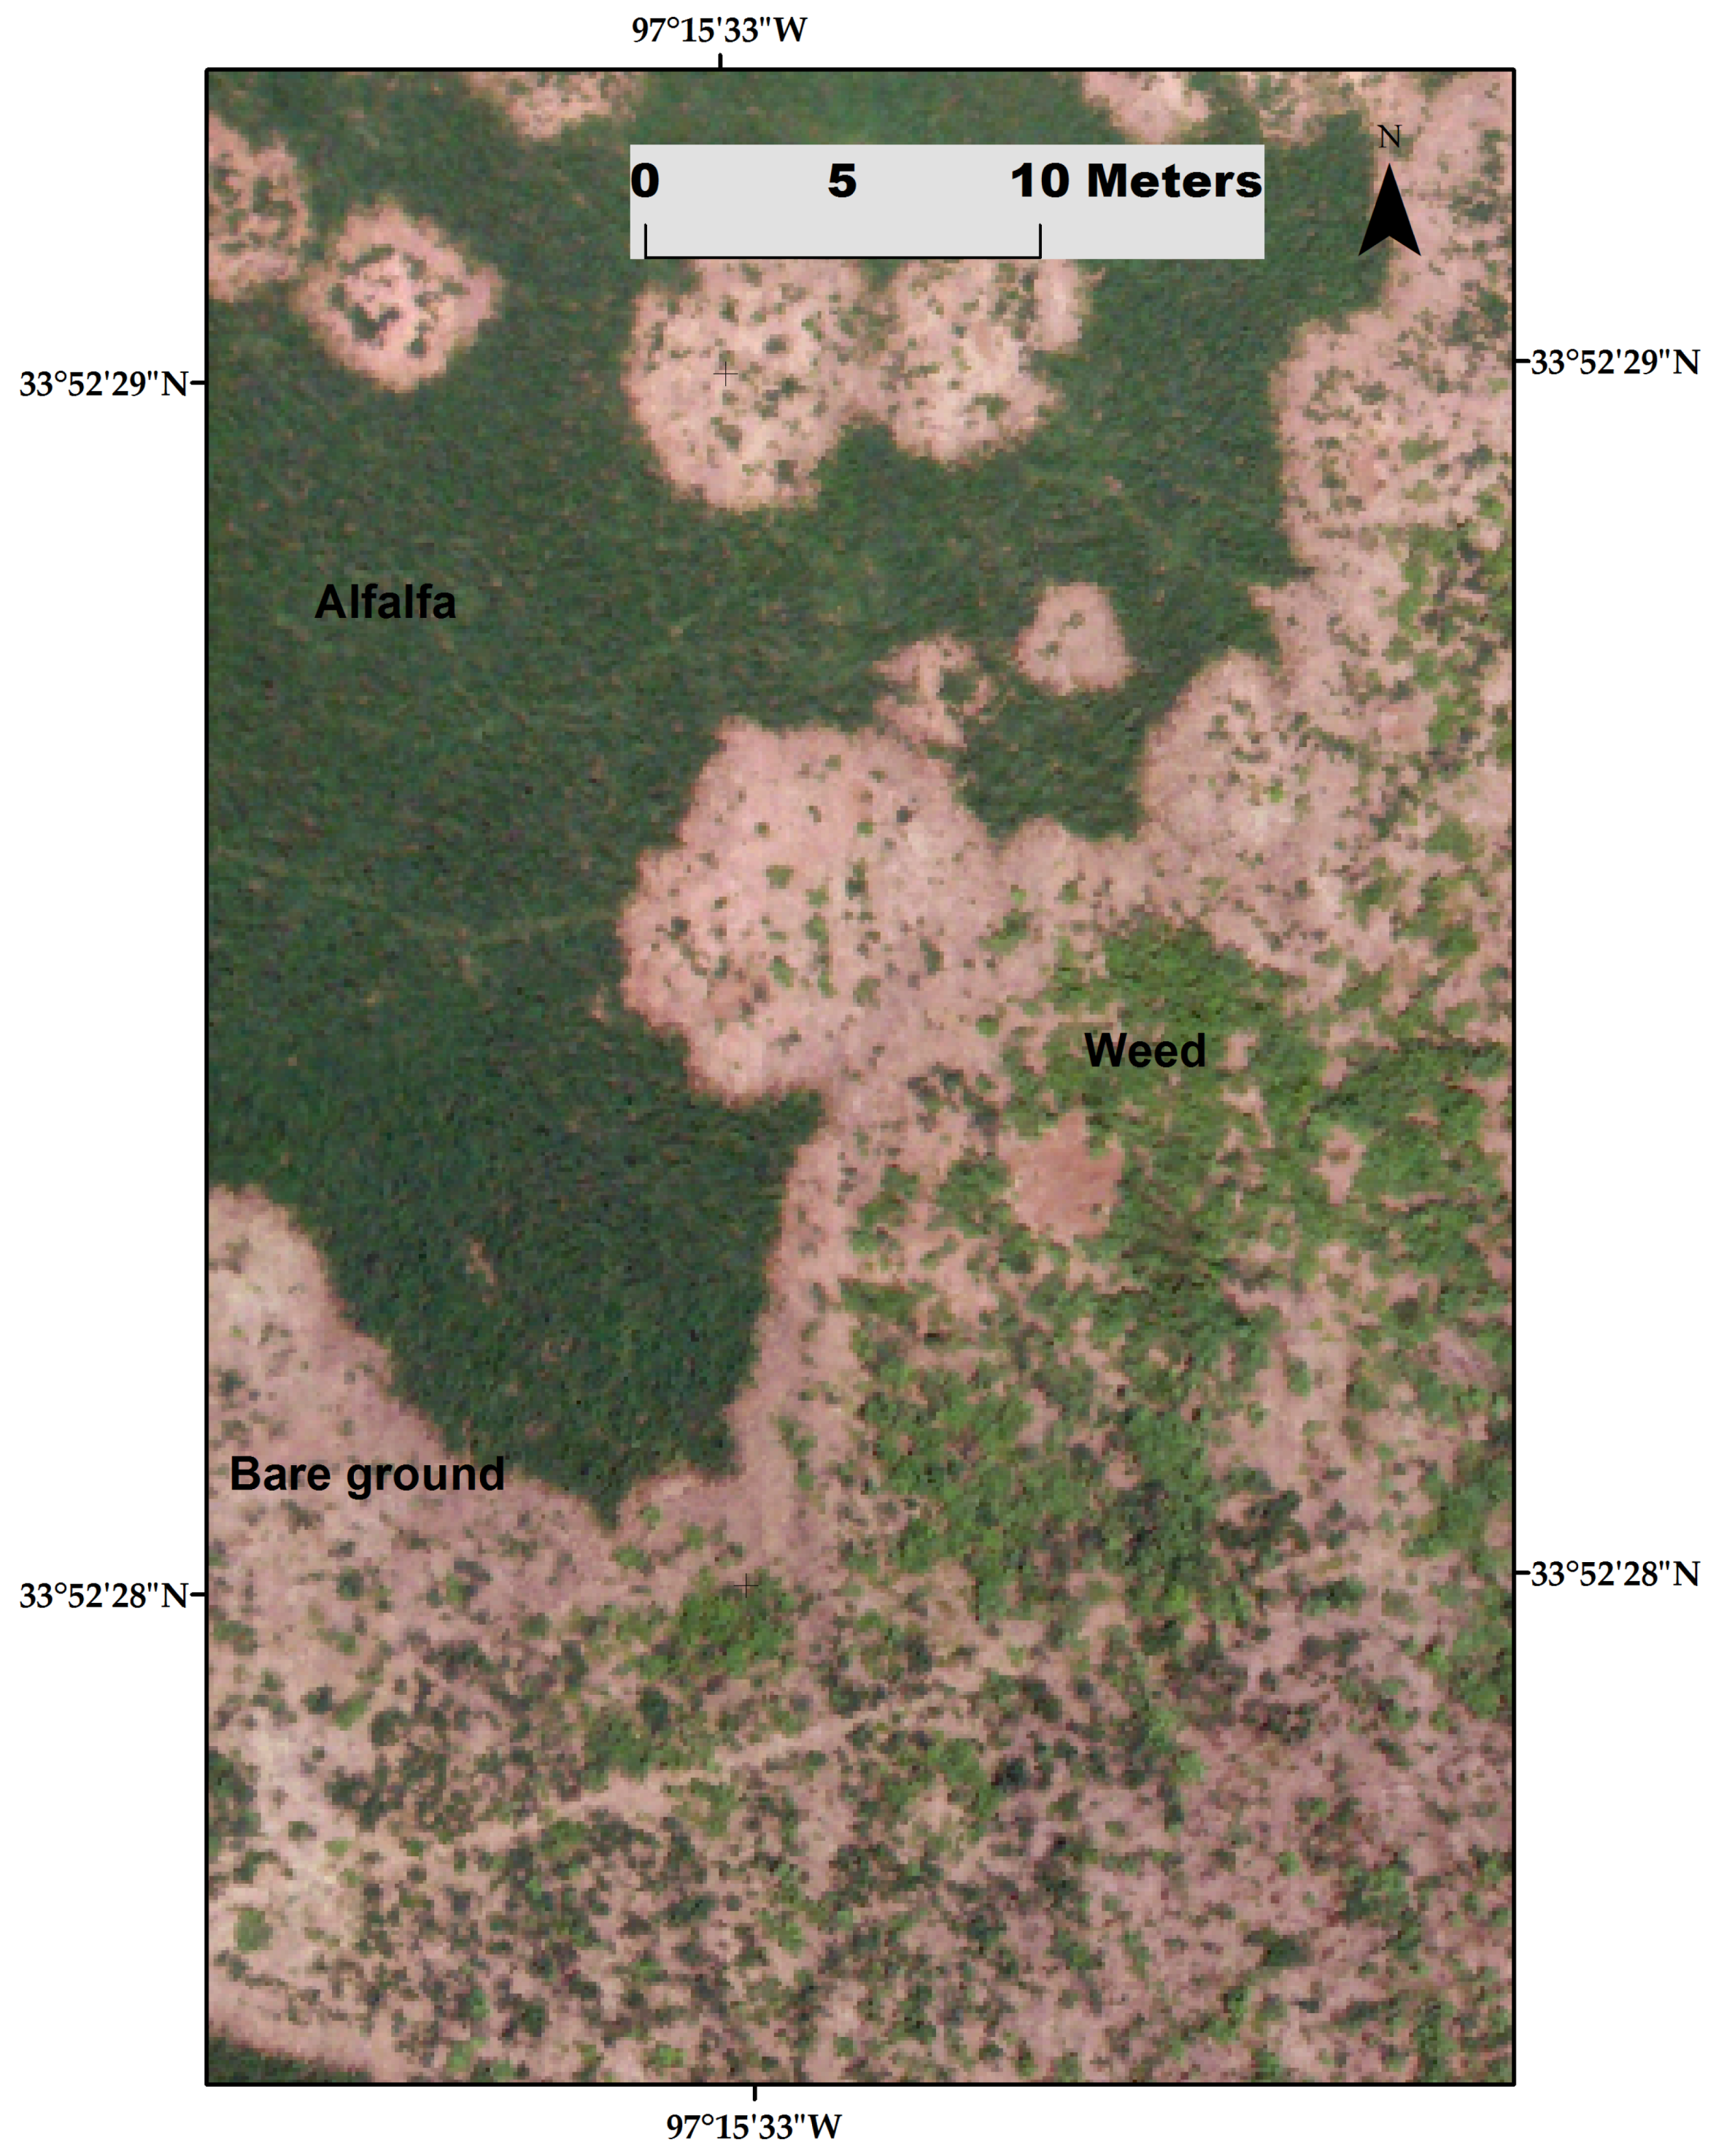
2.1. Study Site

The study was conducted on a PRR-infested 24.8 ha semi-circular alfalfa commercial hay production field under a center-pivot irrigation system located at the Noble Research Institute’s Red River Farm, Burneyville, Oklahoma (Figure 1; 33°52′35″ N, 97°15′28″ W, 210 m elevation). The study site was previously a pecan orchard that was converted in 2005 into a production field. Soybeans, rye, wheat, triticale and oats were grown on this site before planting with America’s Alfalfa Alfagraze 600 RR in the autumn of 2011. During May and June of 2015, this location received 856 mm of rainfall (nearly 90% of the average annual precipitation) and the Red River escaped its banks flooding portions of the study site, which resulted in a loss of 3.6 ha of alfalfa from the field.

2.2. Data Collection and Processing

Two different imaging platforms (Supplementary Figure S1) were utilized to acquire a total of six aerial images from the study site at different solar times during the growing seasons of 2014 and 2015 (Table 1). A Vireo fixed-wing unmanned aircraft system (UAS) with a 10 megapixel (MP) RGB camera was flown in June and August 2014 by the Farm Intelligence Company (USA). The flights occurred at an altitude of 120 m above ground level (AGL) between 11:00 to 15:00 (local time) and the conditions were sunny to mostly sunny.
In October 2014 and during the 2015 growing season, aerial imagery was obtained by CloudStreet AirBorne Survey (USA) using a 22 MP Canon EOS 5D Mark III mounted on a piloted Dragonfly sport utility aircraft flown at 300 m AGL. An aerial survey system (Track’ Air, Hengelo, The Netherlands) was used to automatically trigger the camera as the pilot maneuvered the aircraft over each point in the flight plan grid. A laser range finder used as an altimeter recorded the aircraft’s altitude AGL at high frequency. A geographic positioning system (GPS) receiver recorded the coordinates of the aircraft. Time stamps logged from the altimeter and GPS were matched with the trigger time logged by the camera to determine the altitude and location of the aircraft at the time the image was captured [24,25,26].
Images acquired from the manned aircraft platform were converted from the RAW file format to the TIFF file format. The UAS images were collected in JPEG format and were not converted. Irrespective of the image source, the images were loaded into the Agisoft PhotoScan software. The images underwent a series of workflow steps that included image alignment, building dense cloud, developing mesh and creating an orthomosaic, as described in the software’s user manual. The final orthomosaic images were brought into the ArcMap software package 10.3.1 for additional computation. A minimum of 24 white reflective 0.09 m2 metal square plates were fixed on the ground at known locations around and within the field. These plates could be manually identified in the aerial images and served as ground control points for image registration. In order to maintain the map projection and accuracy, the images were geo-rectified with a spline transformation and projected to the Universal Transverse Mercator (UTM), World Geodetic Survey 1984 (WGS-84), Zone 14 North coordinate system. The polygon selection tool was then used to delineate the flooded section and field boundary from all six aerial images.
The RGB images collected using manned and unmanned aircrafts had a ground sample distance that ranged from 0.018 m to 0.064 m (Table 1). To ensure standardization while analyzing images across different time intervals, all the images were resampled to a coarser resolution of 0.10 m. Image resampling was performed with the ‘resample’ tool using the nearest neighbor assignment resampling technique.

2.3. Image Classification

PRR has a distinctive disease pattern that is discernible from the damage caused by other pests and abiotic factors [9,16]. Multispectral or hyperspectral images make it possible to detect the condition of diseased plants that are not visible to the human eye and also capable of identifying plant stress or the severity of damage. However, our datasets include only the visible light bands R, G, and B in images that could not differentiate those nuanced differences, as our objective was to monitor PRR disease spread rather than disease identification. Ground truthing revealed PRR as the dominant factor contributing to alfalfa stand loss at the study site during the 2014–2015 period. The study site was therefore categorized into two classes: alfalfa and bare ground (treated as a ‘soil’ class while performing supervised image classification). However, during the course of the study, weeds emerged in some of the bare portions of the diseased areas. Hence, weed was also included as a third class in the image classification process (Figure 2).
The non-availability of ground reference data limited our ability to generate training and validation data sets, which were required to perform supervised classification. As an alternative approach, a researcher experienced with field knowledge of PRR disease at this site visually inspected the georectified resampled image to generate training and validation data. In silico identification of one hundred polygons encompassing all three classes (alfalfa (40), soil (40), and weed (20)) that were uniformly spread throughout the study area were selected for each image (Figure 3). Of these, 60 (alfalfa (25), soil (25), and weed (10)) were randomly selected as training datasets and the remaining 40 (alfalfa (15), soil (15), and weed (10)) served for validation purposes. This ensured that the training and validation datasets are independent of each other. The total number of pixels utilized to generate the training and validation datasets are enumerated in Table 2. Each image (except the August 2014 and September 2015 images) was classified using one of three spectral signatures from the training samples that are specific to: (a) the image; (b) the UAS platform; and (c) the manned aircraft platform. The UAS platform-specific and manned aircraft platform-specific spectral signatures were developed based on the August 2014 and September 2015 RGB images, respectively. Therefore, for the August 2014 image, the image-specific and UAS platform-specific spectral signatures were the same. Similarly for the September 2015 image, the image-specific and manned-aircraft-platform-specific spectral signatures were identical. Our choice of selecting these particular RGB images to develop platform-specific images was based on the fact that they were taken during the mid-growing season, a time period when PRR disease symptoms are pronounced in the field.
A color model conversion function was employed in the ArcMap software to convert the aerial images from RGB to hue, saturation and value (HSV) color space. Unlike RGB, the HSV color space channels are less correlated with each other. This conversion sets the hue, saturation, and value channel values between 0 and 240, 0 and 255, and 0 and 255, respectively. Analysis of the spectral signatures generated with HSV images revealed that the hue channel provided greater contrast between the three classes in the study, but with higher variation than the saturation and value channels. Since hue is expressed as a polar dimension with a red hue mapped to values near 240 and 0, we rotated the hue values 60 units to produce a new Hrot60SV image by adding 60 units to the hue channel values less than 180 and subtracting 180 from values between 240 and 180 (e.g., 0 and 240 becomes 60 and 180 becomes 0). This conversion was performed in the R software version 3.4.2 using a raster package. Thus, for each aerial image we had three variants to evaluate: RGB, HSV and Hrot60SV (Figure 4). Based on the spectral signatures unique to each variant image, maximum likelihood supervised classification was performed, categorizing each image into three classes (alfalfa, soil and weed). The maximum likelihood classification algorithm assigned a pixel to a user-defined class based on Bayes’ theorem of decision-making.

2.4. Model Accuracy

An accuracy assessment of all the classified images was performed using 40 validation polygons that were generated for each image, as mentioned above. One pixel was randomly selected from each validation polygon and compared with the corresponding pixel class in the classified image. This iterative process was performed 1000 times to compute the mean overall accuracy and balanced accuracy values for the alfalfa, soil and weed pixel classes. As the weed class was underrepresented compared to the alfalfa and soil classes, balanced accuracy values were estimated for each class, thus accounting for imbalance datasets. All analyses were performed in the R software, version 3.4.2, using the raster and caret packages [27,28].

2.5. Agreement between Two Classified Images

Comparison of the classified images generated for an RGB aerial image using two different spectral signatures was performed by pairing all pixels in the three classes from both images, thereby creating nine classes (alfalfa–alfalfa, soil–soil, weed–weed, alfalfa–soil, alfalfa–weed, soil–alfalfa, soil–weed, weed–alfalfa and weed–soil). The consistent class pairs where both classified pixels agreed (alfalfa–alfalfa, soil–soil, weed–weed) were not considered for further analysis. To estimate the true accuracy of the other six inconsistent class pairs in the remaining set of pixels, 20 random pixels were sampled in a stratified random manner from each class pair, and we visually inspected the pixels in the RGB image to manually classify the pixel. All analyses were performed in the R software, version 3.4.2, using the raster package.

2.6. Post-Processing of Classified Images

The visual observation of the classified images showed many misclassified isolated pixels. To remove this noise, the images underwent a series of post-classification processing steps: filtering to remove isolated pixels from the classified images, smoothing class boundaries and reclassifying small isolated regions (pixel count less than 100) to the closest surrounding cell values. All these steps were accomplished using generalization tools (majority filter, boundary clean, region group, set null and nibble tools) listed in the ArcMap software package 10.3.1. After performing post-classification processing, the number of pixels that belonged to each class was calculated for each image to assess the area of alfalfa stand loss that occurred due to PRR disease.

3. Results

In total, two (June 2014 and August 2014) and four (October 2014, June 2015, September 2015 and October 2015) RGB datasets were collected using UAS and manned aircraft, respectively, from the study area during the 2014–2015 growing seasons (Table 1). As the ground sample distance for images acquired from both platforms were different, all the images were resampled to 10 cm resolution ensuring consistent comparison among the images. Visual inspection of the aerial images showed expanding circular to irregular PRR disease circles with asymptomatic plants outside the circle along with survivors and in some instances weeds occupying the bare ground areas inside the disease circle.

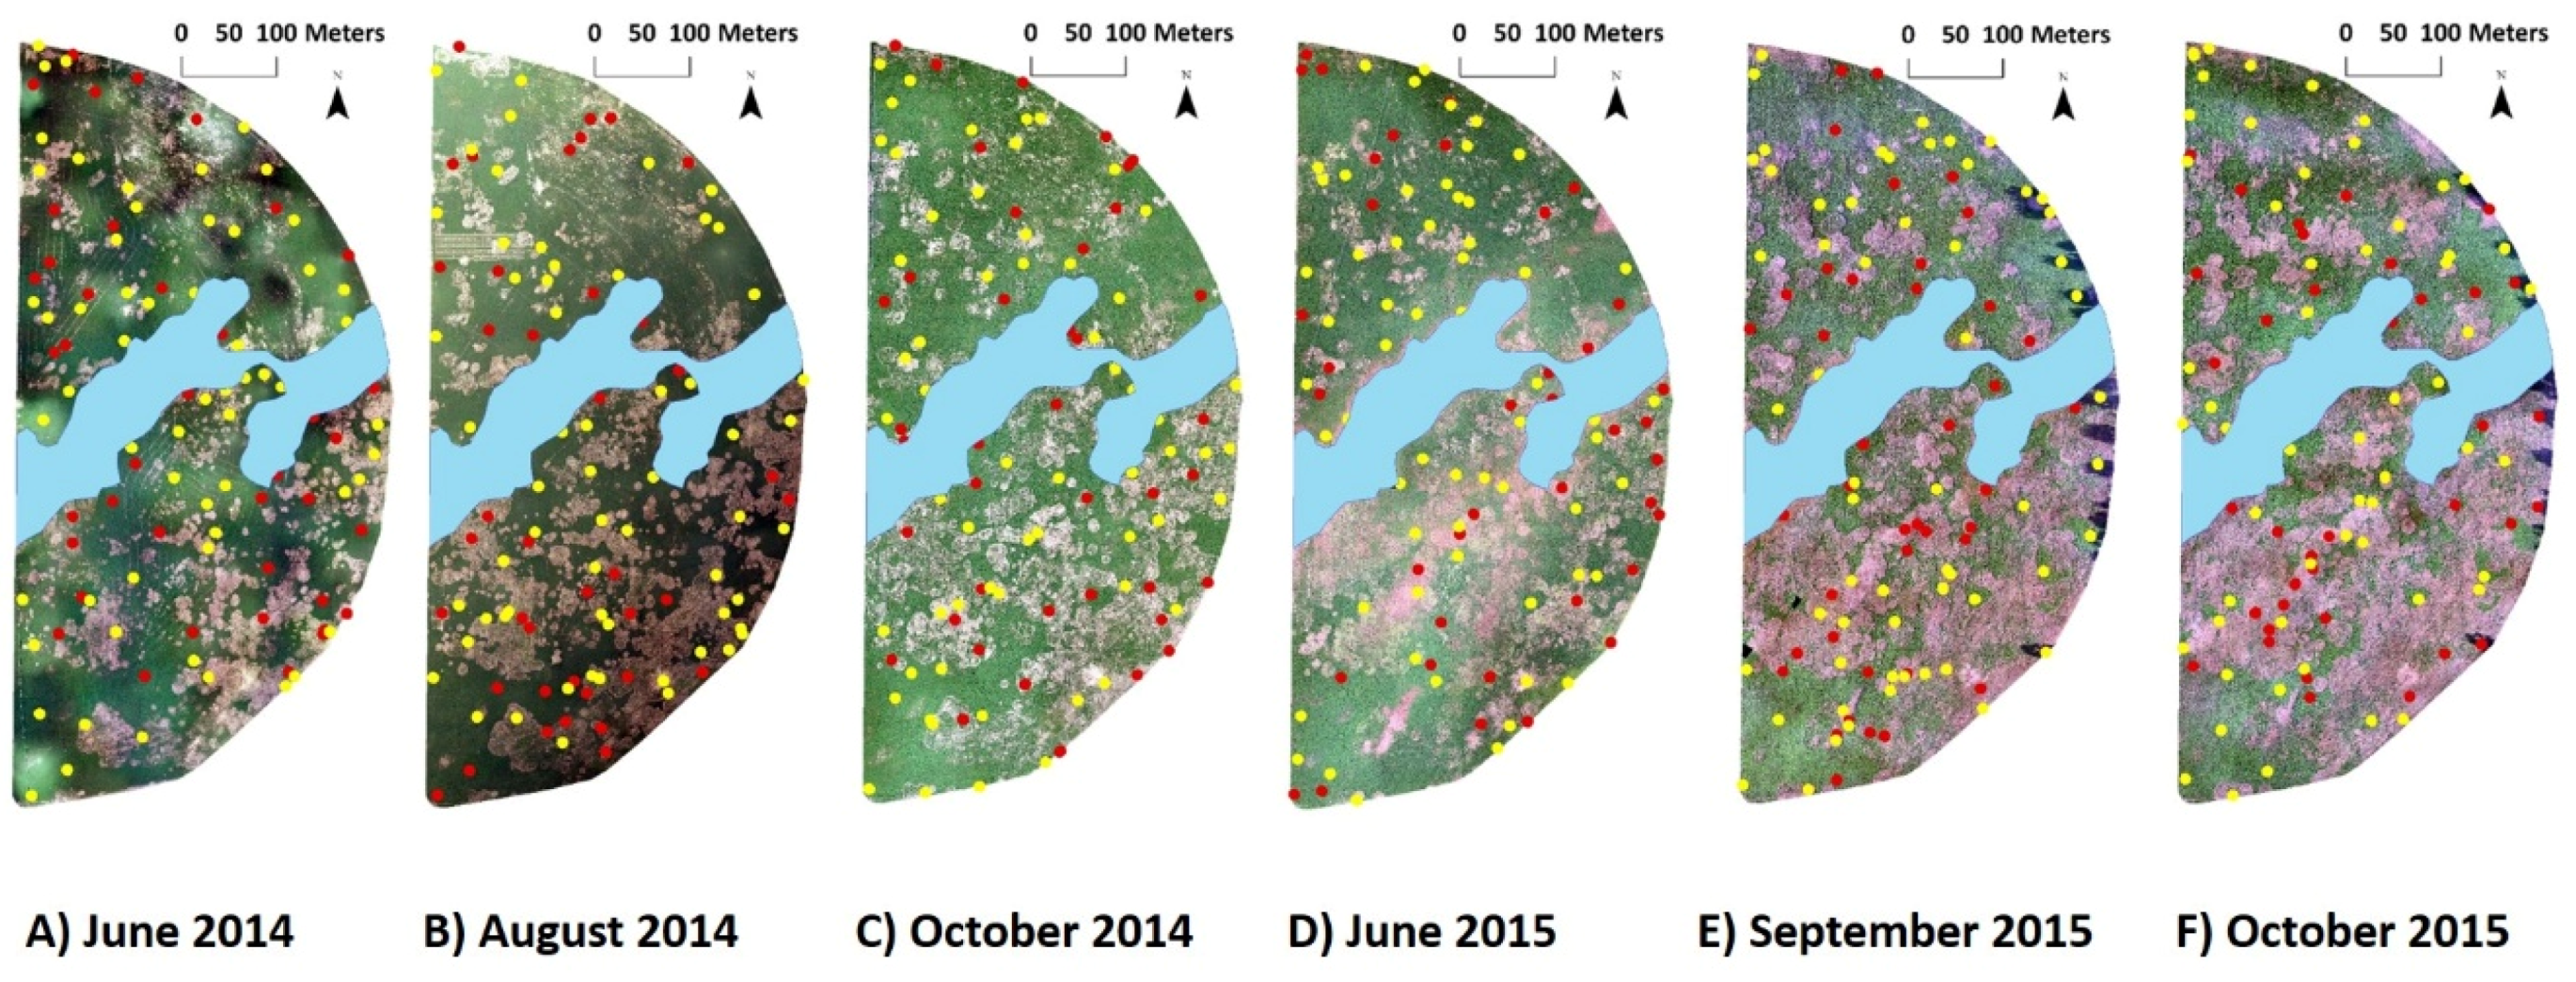
3.1. UAS-Acquired Images

The accuracy assessment estimates for the supervised classification of the June 2014 and August 2014 RGB images using different spectral signatures are summarized in Table 3. The overall accuracy for the June 2014 classified image acquired using the UAS platform ranged from 0.508 for the manned aircraft platform-specific spectral signature to 0.968 for the image-specific spectral signature. It is interesting to note that the UAS platform-specific spectral signature (developed based on the August 2014 image) when applied to the June 2014 image yielded an accuracy of 0.901, comparable to the accuracy values developed with the image-specific spectral signature. Likewise, the overall accuracy for the August 2014 RGB image classified with the UAS platform-specific spectral signature (which happens also to be image-specific) and the manned-aircraft-platform-specific spectral signature was 0.896 and 0.584, respectively. Balanced accuracy assessments estimated for the soil class showed accuracy values higher than 0.86 regardless of the spectral signature for both the June and August 2014 images (Table 3). However, classification with the manned aircraft platform-specific spectral signature resulted in only a small number of pixels being assigned to the alfalfa class. This resulted in lower accuracy values of 0.50 for the alfalfa class for both UAS platform-acquired images. Similar trends were observed with the HSV and Hrot60SV variants of the June and August 2014 images (Supplementary Tables S1 and S2). The data clearly indicated that the manned aircraft platform-specific spectral signature cannot be employed to classify images acquired using the UAS platform.
We further analyzed the congruency between the June 2014 RGB image classified using the image-specific spectral signature and the UAS platform-specific spectral signature (the overall mean accuracies were 0.968 and 0.901, respectively). For this purpose, we compared the class assigned to each pixel from both classified images, which resulted in the generation of nine class pairs, as described in Table 4. About 76% of the pixels from both classified images had assigned all three classes (alfalfa, soil and weed) the same. The remaining 24% of pixels did not match between the classified images. A weight factor was calculated for each inconsistent class pair based on the percentage of pixels (Table 4 and Table 5). We then randomly selected 20 pixels from the set of pixels in each inconsistent class pair (alfalfa–soil, alfalfa–weed, soil–alfalfa, soil–weed, weed–alfalfa, weed–soil), and manually classified the pixel by visually evaluating the corresponding pixel in the June 2014 RGB image. The results are presented as a percentage of pixels within each pair classified as alfalfa, soil, or weed (Table 5). Overall congruency was determined by multiplying the percentage matching the manual classification by the weight factor and summing over the classes. The results in Table 5 indicate that the image classified using the UAS platform-specific spectral signature had more class pairs (classes alfalfa–soil, soil–alfalfa, weed–alfalfa, weed–soil) closely representing the manually classified RGB image, compared to the image classified using the image-specific spectral signature (classes alfalfa–weed and soil–weed).
Further, the sum across classes of their correct weight-factor-adjusted percentage was 47.70 and 41.10, respectively. These data suggest that although the overall accuracy for the image classified using the image-specific spectral signature (0.968, Table 3) was higher than the image classified using the UAS platform-specific spectral signature (0.901, Table 3), the pixels from the latter classified image more closely resembled the manually classified pixels when the supervised classification disagreed. Therefore, the best spectral signature for classifying the June 2014 RGB image was with the UAS platform-specific signature.

3.2. Manned-Aircraft-Acquired Images

Accuracy assessment estimates for the supervised classified images from October, 2014, June, September and October, 2015 RGB images acquired by a manned aircraft using different spectral signatures are presented in Table 3. The overall accuracy for these four classified images using image-specific spectral signatures ranged from 0.915 for September, 2015 to 0.981 for the June, 2015 image. The spectral signatures developed based on the UAS platform were not able to classify any of the images taken by manned aircraft, as evidenced by accuracy estimates ranging from 0.405 to 0.56. With regards to the classification based on the manned-aircraft-platform-specific spectral signature, the overall mean accuracy estimates ranged from 0.687 to 0.903, indicating that the utility of the manned-aircraft-specific spectral signature is image specific.
Balanced accuracy assessments for soil class for all four images classified using the image-specific and manned-aircraft-platform-specific spectral signatures showed accuracy values higher than 0.93 (Table 3). In contrast, balanced accuracy estimates for the alfalfa and weed classes were lower (ranging between 0.5 and 0.731) for all four images when classified using the UAS platform-specific spectral signature. Similar trends were also observed for the HSV and Hrot60SV variants for all four images acquired by manned aircraft (Supplementary Tables S1 and S2), indicating that the spectral signature developed based on the UAS-acquired images cannot be employed to classify images acquired using manned aircraft. In addition, image-specific spectral signatures provided the greatest accuracy for the classification of images acquired by manned aircraft.

3.3. Effects of Post-Processing on Image Accuracy

Our data showed a minimal effect of HSV and Hrot60SV transformation on improving the classification accuracy of the images. Therefore, we continued our analysis with RGB images, thereby reducing the time and resources spent during the image transformation process. The best spectral signatures for classifying RGB aerial images were determined to be as follows: UAS platform-specific spectral signature for images acquired by UAS, and the image-specific spectral signature for manned-aircraft-acquired images. However, upon visual observation these classified images showed many misclassified isolated pixels, creating a speckled appearance. We then performed post-classification processing steps to diminish this effect and estimated the accuracy values of the images, as outlined in Table 6. Apart from the June 2014 image, post-classification processing either maintained or improved the overall accuracy estimates for all the datasets. With respect to the June 2014 image, the overall accuracy slightly dropped from 0.901 (Table 3) to 0.898 (Table 6). The June and September 2015 post-processing classified images resulted in 100 percent accuracy.

3.4. Effect of PRR Disease on Alfalfa Stand

We have further determined the effect of PRR disease on alfalfa stands from the post-processing classified images. Based on the classified image datasets from Table 6, the area covered by the alfalfa, soil and weed classes was determined and the results are presented in Figure 5. The area under the alfalfa, soil and weed classes from the June 2014 image were estimated to be 13.7, 5.8, and 1.7 ha, respectively. Although, it has to be noted that the accuracy of the alfalfa, soil and weed areas was 89.7%, 99.8% and 78% for each class, respectively (Table 6). Intuitively, as the season progresses one might expect a reduction in the alfalfa stand and a corresponding increase in bare ground due to PRR disease. By the end of crop season in October 2015, the areas under alfalfa and soil have changed dramatically. PRR disease caused a reduction of 31.4% in the alfalfa stand between June 2014 and October 2015, with the bare ground increasing by 74% during this period (Figure 5).

4. Discussion

We applied an aerial imaging approach to better understand PRR disease spread and map PRR-infested areas in an alfalfa field. Earlier research on PRR disease has focused on multispectral or hyperspectral aerial images acquired using a manned aircraft platform; these studies were conducted in cotton, another important host for P. omnivora [15,17,29]. To our knowledge, this is the first study that used multiple aerial high-resolution RGB images of a PRR-infested alfalfa field, spanning a period of two growing seasons (2014–2015). Unlike cotton, alfalfa is a perennial forage crop and is cut several times within a growing season, thereby providing a unique opportunity to study PRR disease progression under such intense management practices. In addition, continuous host availability over different years influences pathogen movement and survival, thereby affecting stand yields. We therefore used RGB images, as we were interested in monitoring PRR disease spread rather than PRR detection, in which case we would have resorted to using multi- or hyper-spectral sensors capable of capturing different spectra not perceived by the human eye. The major focus of this study was to develop a workflow for analyzing RGB images collected using UAS and manned aircraft platforms, and to discern the utility of these data for the study of PRR disease progression in alfalfa.
Regardless of the platform, remote sensing images are subject to optical and perspective distortions that arise during the process of image acquisition and representing a three-dimensional image into a two-dimensional format. Previous research has indicated that the usage of small focal length sensors (28 mm) produces more such distortions and that these distortions may have to be corrected during processing in order to measure geometric quantities correctly [30]. In the current study, the UAS image dataset was developed using vendor-generated proprietary jpeg images without any change. For the images acquired with the manned aircraft platform, we used the Unidentified Flying Raw (UFRaw) application to convert the RAW file format to the TIFF file format, with the camera white balance option selected for color corrections. As earlier research has indicated higher perspective distortion with small focal length (50 mm) sensors compared to 85 or 105 mm sensors, the current study’s image dataset collected with the manned aircraft used an 85 mm focal length lens to yield minimum optical and perspective distortions [31].
Initially, we examined the possibility of developing a single spectral signature to classify all the images that would reduce the processing time and computing resources. Our data indicated that a single spectral signature is not applicable for the analysis of images collected from the UAS and manned aircraft platforms. Hence, each image was classified using three spectral signatures: (a) image-specific; (b) UAS platform-specific; and (c) manned aircraft platform-specific. We identified that the UAS platform-specific spectral signature can be used to classify images acquired from a UAS platform, yielding higher accuracy results (Table 3, Supplementary Tables S1 and S2). However, the same model does not hold for manned aircraft images. The data from Table 3 and Supplementary Tables S1 and S2 indicated increased accuracy estimates when the manned aircraft images were classified using image-specific spectral signatures.
The acquisition of RGB images using different sensors at various flight times (Table 1) might be some of the reasons that a single spectral signature could not be utilized for images from both platforms. The images obtained also had different spectral resolutions; to balance this effect, all images were resampled to a coarser resolution (0.10 m), ensuring uniform comparison. The flights for both platforms occurred at different times during the day resulting in images with varying degrees of lighting in addition to shadowing effects. To account for differences in luminance between the images and to accurately segment pixels into the classes alfalfa, soil and weed, we investigated the utility of color space conversion for our dataset.
The images from our study were converted to the traditional RGB (red, green, blue channels) color space. Several studies have shown a better separation of the image features by weighting each channel differently during the process of transforming the RGB color space. Such changes are expected to yield diverse color distributions in each model, as most of the transformations are non-linear [32,33]. For example, in a study where 11 different color spaces (RGB, normalized rgb, XYZ, L*a*b*, L*u*v*, HSV, HLS, YCrCb, YUV, I1I2I3 and TSL) were compared to segment lettuce plants and soil from a set of images, the L*a*b* color space was shown to achieve superior classification, with 99.2% accuracy [34]. While there is no single optimum color space for any image classification, we chose to transform our RGB dataset into an HSV color model, as this model has been shown to be robust to illumination variations and removing shadow effects [35,36,37]. After performing HSV transformation, we observed high variation in the pixel values of the hue channel, especially for the soil class, since the soils have a reddish hue with values just above 0 and just below 240. To minimize this variation, the hue channel pixel values were rotated by 60 units to yield a Hrot60SV transformation.
We expected improved classification accuracies with the HSV and Hrot60SV color spaces compared to the RGB color space (Table 3, Supplementary Tables S1 and S2), but failed to find support for this hypothesis in the data and subsequently rejected this hypothesis. Although the balanced accuracy estimates for the soil class were more than 92% for the RGB color space images classified using different spectral signatures (the UAS-platform-based signature for UAS-acquired images and the image-specific spectral signature for manned-aircraft-acquired images), a major factor contributing to the differences in the overall accuracy estimates appears to be the alfalfa and weed classes. In addition to color space conversions, we investigated the effect of the spectral angle mapper (SAM) algorithm when performing supervised classification on a subset of our dataset. Unlike the maximum likelihood classification algorithm that was used to perform supervised classification in this study, SAM does not require any assumptions regarding the statistical distribution of the data and is not affected by solar illumination and shading effects [38]. However, the SAM classification resulted in accuracies of less than 85% compared to the maximum likelihood classification algorithm (data not shown). This is in contrast to Yang et al. [16], who detected PRR in cotton fields using SAM with more than 95% accuracy, but their dataset was comprised of multispectral images, unlike the RGB images that were used in the current study. While it is a recognized challenge to accurately segment crops from weeds, other studies have mitigated this hurdle by using artificial neural network algorithms and other machine-learning-based approaches; assessing their utility for our dataset is beyond the scope of this study [39,40].
Post-classification processing steps were performed to minimize the speckled effect in the image, i.e., for removing misclassified isolated pixels and small regions less than 100 pixels. This process either maintained or improved the overall accuracy for five of the six images analyzed (Table 6). For June 2014, the overall mean accuracy decreased from 0.901 to 0.898. This is also the image for which we determined that using the UAS-platform-specific spectral signature was better than the image-specific spectral signature. We estimated the congruency between the classified images generated by both spectral signatures, compared with the manually classified RGB pixels and determined UAS-platform-specific signature to be more accurate than the image-specific spectral signature. We observed lower balanced accuracy values for the weed class for this image. This is the result of significantly fewer weeds, leading to the generation of smaller training and validation datasets (Table 2). We hypothesize that fewer training pixels might have an influence on the misclassification of some of the pixels as falling in the weed class instead of the alfalfa class or vice-versa.
The classified RGB aerial images estimating the extent of alfalfa stand loss due to PRR showed wide fluctuations in the area under the three classes, especially the soil class. More weeds occupied the new empty soil areas created by the PRR disease, leading to a reduction in the area under soil. However, by the end of the study period (October 2015), about 10 ha of area was recorded for the soil class, compared to 5.8 ha at the start of the study period (June 2014). This can be attributed to the formation of new diseased areas as well as the increase in existing diseased areas. Similar effects of PRR have been observed in one cotton growing season using multispectral images, where the percentage of root-rot-infected areas increased from 5.4% to 13.2% and 21.6% to 26.8% in two fields in Edroy, TX and from 27.0% to 37.8% and 21.4% to 50.6% in two fields in San Angelo, TX [29].

5. Conclusions

To summarize, Phymatotrichopsis root rot disease severely limits alfalfa production in southern Oklahoma. Alfalfa fields infested with P. omnivora often reduce stand life and productivity. The extent of disease spread occurring in a growing season greatly affects alfalfa stand longevity, butlittle is understood about this phenomenon. Hence, through this study we provide a framework for obtaining high-resolution RGB aerial images from either UAS or manned aircraft platforms and the subsequent workflow to deduce the extent of PRR disease spread. Understanding the loss of alfalfa stand areas reported from aerial images could help a producer make informed management choices such as replanting or site-specific fungicide application to slow down the spread of the disease.

Supplementary Materials

The following are available online at https://www.mdpi.com/2072-4292/10/6/917/s1, Figure S1: Aerial imaging platforms used for data collection from a Phymatotrichopsis root-rot-infested alfalfa hay production field during 2014 and 2015. (A) Vireo unmanned aerial vehicle, (B) Dragonfly sport utility piloted aircraft; Table S1: Accuracy assessment values of HSV images using different spectral signatures; Table S2: Accuracy assessment values of Hrot60SV images using different spectral signatures.

Author Contributions

Conceptualization, C.A.M. and C.A.Y.; Formal analysis, C.M., C.A.M. and K.N.S.; Methodology, C.A.M.; Project administration, C.A.Y.; Writing—original draft, C.M.; Writing—review and editing, C.M., C.A.M., K.N.S. and C.A.Y.

Acknowledgments

We thank Gloria Desanker for help with preliminary image processing. We thank the Noble Research Institute, LLC for funding. Mention of trade names or commercial products in this article is solely for the purpose of providing specific information and does not imply recommendation or endorsement by the USDA. The U.S. Department of Agriculture (USDA) prohibits discrimination in all its programs and activities on the basis of race, color, national origin, age, disability, and where applicable, sex, marital status, familial status, parental status, religion, sexual orientation, genetic information, political beliefs, reprisal, or because all or part of an individual’s income is derived from any public assistance program. Persons with disabilities who require alternative means for communication of program information (Braille, large print, audiotape, etc.) should contact USDA’s TARGET Center at (202) 720-2600 (voice and TDD). To file a complaint of discrimination, write to USDA, Director, Office of Civil Rights, 1400 Independence Avenue, S.W., Washington, D.C. 20250-9410, or call (800) 795-3272 (voice) or (202) 720-6382 (TDD). USDA is an equal opportunity provider and employer.

Conflicts of Interest

The authors declare no conflict of interest. The funding sponsors had no role in the design of the study; in the collection, analyses, or interpretation of data; in the writing of the manuscript, and in the decision to publish the results.

References

  1. Dash, J.P.; Watt, M.S.; Pearse, G.D.; Heaphy, M.; Dungey, H.S. Assessing very high resolution UAV imagery for monitoring forest health during a simulated disease outbreak. ISPRS J. Photogramm. Remote Sens. 2017, 131, 1–14. [Google Scholar] [CrossRef]
  2. Mahlein, A.-K. Plant disease detection by imaging sensors–parallels and specific demands for precision agriculture and plant phenotyping. Plant Dis. 2016, 100, 241–251. [Google Scholar] [CrossRef]
  3. Simko, I.; Jimenez-Berni, J.A.; Sirault, X.R. Phenomic approaches and tools for phytopathologists. Phytopathology 2017, 107, 6–17. [Google Scholar] [CrossRef] [PubMed]
  4. Harris, J.L.; Di Bello, P.L.; Lear, M.; Balci, Y. Bacterial leaf scorch in the District of Columbia: Distribution, host range, and presence of Xylella fastidiosa among urban trees. Plant Dis. 2014, 98, 1611–1618. [Google Scholar] [CrossRef]
  5. Mirik, M.; Jones, D.C.; Price, J.A.; Workneh, F.; Ansley, R.J.; Rush, C.M. Satellite remote sensing of wheat infected by Wheat streak mosaic virus. Plant Dis. 2011, 95, 4–12. [Google Scholar] [CrossRef]
  6. USDA-NASS. Available online: http://quickstats.nass.usda.gov/results/7C288133-3D6D-356D-92EB-E0D2FDB11C76 (accessed on 20 April 2018).
  7. Taubenhaus, J.J.; Ezekiel, W.N. A rating of plants with reference to their relative resistance or susceptibility to Phymatotrichum root rot. Texas Agric. Exp. Stn Bull. 1936, 527, 1–52. [Google Scholar]
  8. Streets, R.B.; Bloss, H.E. Phymatotrichum Root Rot; American Phytopathological Society: St. Paul, MN, USA, 1973; Volume Monograph No. 8. [Google Scholar]
  9. Young, C.A.; Uppalapati, S.R.; Mysore, K.S.; Marek, S.M. Phymatotrichopsis root rot. In Compendium of Alfalfa Diseases and Pests, 3rd ed.; Samac, D.A., Rhodes, L.H., Lamp, W.O., Eds.; American Phytopathological Society: St. Paul, MN, USA, 2015; pp. 44–46. [Google Scholar]
  10. King, C.J. Habits of the cotton root rot fungus. J. Agric. Res. 1923, 26, 405–418. [Google Scholar]
  11. Steddom, K.; Jones, D.; Rush, C. A picture is worth a thousand words. APSnet Features 2005. [Google Scholar] [CrossRef]
  12. Taubenhaus, J.J.; Ezekiel, W.N.; Neblette, C.B. Airplane photography in the study of cotton root rot. Phytopathology 1929, 19, 1025–1029. [Google Scholar]
  13. Nixon, P.R.; Escobar, D.E.; Bowen, R.L. A multispectral false-color video imaging system for remote sensing applications. In Proceedings of the 11th Biennial Workshop on Color Aerial Photography and Videography in the Plant Sciences and Related Fields, Weslaco, TX, USA, 27 April–1 May 1987; pp. 295–305. [Google Scholar]
  14. Nixon, P.R.; Lyda, S.D.; Heilman, M.D.; Bowen, R.L.; Texas A&M Agricultural Experiment Station, College Station. Incidence and Control of Cotton Root Rot Observed with Color Infrared Photography; Information Systems Division, National Agricultural Library: Beltsville, MD, USA, 1975. [Google Scholar]
  15. Yang, C.; Everitt, J.H.; Fernandez, C.J. Comparison of airborne multispectral and hyperspectral imagery for mapping cotton root rot. Biosyst. Eng. 2010, 107, 131–139. [Google Scholar] [CrossRef]
  16. Yang, C.; Odvody, G.N.; Fernandez, C.J.; Landivar, J.A.; Minzenmayer, R.R.; Nichols, R.L. Evaluating unsupervised and supervised image classification methods for mapping cotton root rot. Precis. Agric. 2015, 16, 201–215. [Google Scholar] [CrossRef]
  17. Yang, C.; Odvody, G.N.; Thomasson, J.A.; Isakeit, T.; Nichols, R.L. Change detection of cotton root rot infection over 10-year intervals using airborne multispectral imagery. Comput. Electron. Agric. 2016, 123, 154–162. [Google Scholar] [CrossRef] [Green Version]
  18. Aylor, D.E.; Schmale, D.G., III; Shields, E.J.; Newcomb, M.; Nappo, C.J. Tracking the potato late blight pathogen in the atmosphere using unmanned aerial vehicles and Lagrangian modeling. Agric. For. Meteorol. 2011, 151, 251–260. [Google Scholar] [CrossRef]
  19. Mattupalli, C.; Komp, M.R.; Young, C.A. Integrating geospatial technologies and unmanned aircraft systems into the grower’s disease management toolbox. APS Features 2017. [Google Scholar] [CrossRef]
  20. Sankaran, S.; Khot, L.R.; Espinoza, C.Z.; Jarolmasjed, S.; Sathuvalli, V.R.; Vandemark, G.J.; Miklas, P.N.; Carter, A.H.; Pumphrey, M.O.; Knowles, N.R.; et al. Low-altitude, high-resolution aerial imaging systems for row and field crop phenotyping: A review. Eur. J. Agron. 2015, 70, 112–123. [Google Scholar] [CrossRef]
  21. Zhang, C.; Kovacs, J.M. The application of small unmanned aerial systems for precision agriculture: A review. Precis. Agric. 2012, 13, 693–712. [Google Scholar] [CrossRef]
  22. Calderón, R.; Montes-Borrego, M.; Landa, B.B.; Navas-Cortés, J.A.; Zarco-Tejada, P.J. Detection of downy mildew of opium poppy using high-resolution multi-spectral and thermal imagery acquired with an unmanned aerial vehicle. Precis. Agric. 2014, 15, 639–661. [Google Scholar] [CrossRef] [Green Version]
  23. Garcia-Ruiz, F.; Sankaran, S.; Maja, J.M.; Lee, W.S.; Rasmussen, J.; Ehsani, R. Comparison of two aerial imaging platforms for identification of Huanglongbing-infected citrus trees. Comput. Electron. Agric. 2013, 91, 106–115. [Google Scholar] [CrossRef]
  24. Booth, D.T.; Cox, S.E. Very large scale aerial photography for rangeland monitoring. Geocarto Int. 2006, 21, 27–34. [Google Scholar] [CrossRef]
  25. Booth, D.T.; Cox, S.E.; Berryman, R.D. Precision measurements from very-large scale aerial digital imagery. Environ. Monit. Assess. 2006, 112, 293–307. [Google Scholar] [CrossRef] [PubMed]
  26. Moffet, C.A.; Taylor, J.B.; Booth, D.T. Very large scale aerial (VLSA) imagery for assessing postfire bitterbrush recovery. In Proceedings of the USDA Forest Service RMRS-P-52, Cedar City, UT, USA, 6–8 June 2006; pp. 161–168. [Google Scholar]
  27. Hijmans, R.J.; van Etten, J.; Cheng, J.; Mattiuzzi, M.; Sumner, M.; Greenberg, J.A.; Lamigueiro, O.P.; Bevan, A.; Racine, E.B.; Shortridge, A.; et al. Raster: Geographic data analysis and modeling. In R Package Version 2.6-7; R Core Team: Vienna, Austria, 2017. [Google Scholar]
  28. Kuhn, M.; Wing, J.; Weston, S.; Williams, A.; Keefer, C.; Engelhardt, A.; Cooper, T.; Mayer, Z.; Kenkel, B.; The R Core Team; et al. Caret: Classification and regression training. In R Package Version 6.0-78; R Core Team: Vienna, Austria, 2017. [Google Scholar]
  29. Yang, C.; Odvody, G.N.; Fernandez, C.J.; Landivar, J.A.; Minzenmayer, R.R.; Nichols, R.L.; Thomasson, J.A. Monitoring cotton root rot progression within a growing season using airborne multispectral imagery. J. Cotton Sci. 2014, 18, 85–93. [Google Scholar]
  30. An, N.; Palmer, C.M.; Baker, R.L.; Markelz, R.C.; Ta, J.; Covington, M.F.; Maloof, J.N.; Welch, S.M.; Weinig, C. Plant high-throughput phenotyping using photogrammetry and imaging techniques to measure leaf length and rosette area. Comput. Electron. Agric. 2016, 127, 376–394. [Google Scholar] [CrossRef] [Green Version]
  31. Třebický, V.; Fialová, J.; Kleisner, K.; Havlíček, J. Focal length affects depicted shape and perception of facial images. PLoS ONE 2016, 11, e0149313. [Google Scholar] [CrossRef] [PubMed]
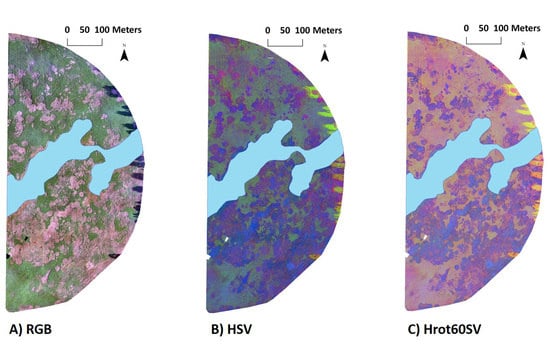
  32. Hernández-Hernández, J.L.; García-Mateos, G.; González-Esquiva, J.M.; Escarabajal-Henarejos, D.; Ruiz-Canales, A.; Molina-Martínez, J.M. Optimal color space selection method for plant/soil segmentation in agriculture. Comput. Electron. Agric. 2016, 122, 124–132. [Google Scholar] [CrossRef]
  33. Philipp, I.; Rath, T. Improving plant discrimination in image processing by use of different colour space transformations. Comput. Electron. Agric. 2002, 35, 1–15. [Google Scholar] [CrossRef]
  34. García-Mateos, G.; Hernández-Hernández, J.L.; Escarabajal-Henarejos, D.; Jaen-Terrones, S.; Molina-Martínez, J.M. Study and comparison of color models for automatic image analysis in irrigation management applications. Agric. Water Manag. 2015, 151, 158–166. [Google Scholar] [CrossRef]
  35. Chaves-González, J.M.; Vega-Rodríguez, M.A.; Gómez-Pulido, J.A.; Sánchez-Pérez, J.M. Detecting skin in face recognition systems: A colour spaces study. Digit. Signal Process. 2010, 20, 806–823. [Google Scholar] [CrossRef]
  36. Hamuda, E.; Mc Ginley, B.; Glavin, M.; Jones, E. Automatic crop detection under field conditions using the HSV colour space and morphological operations. Comput. Electron. Agric. 2017, 133, 97–107. [Google Scholar] [CrossRef]
  37. Huang, W.; Kim, K.; Yang, Y.; Kim, Y.S. Automatic shadow removal by illuminance in HSV color space. Comput. Sci. Inf. Technol. 2015, 3, 70–75. [Google Scholar] [CrossRef]
  38. Petropoulos, G.P.; Vadrevu, K.P.; Xanthopoulos, G.; Karantounias, G.; Scholze, M. A comparison of spectral angle mapper and artificial neural network classifiers combined with Landsat TM imagery analysis for obtaining burnt area mapping. Sensors 2010, 10, 1967–1985. [Google Scholar] [CrossRef] [PubMed] [Green Version]
  39. Hamuda, E.; Glavin, M.; Jones, E. A survey of image processing techniques for plant extraction and segmentation in the field. Comput. Electron. Agric. 2016, 125, 184–199. [Google Scholar] [CrossRef]
  40. Jeon, H.Y.; Tian, L.F.; Zhu, H. Robust crop and weed segmentation under uncontrolled outdoor illumination. Sensors 2011, 11, 6270–6283. [Google Scholar] [CrossRef] [PubMed]
Figure 1. Location of the study area.
Remotesensing 10 00917 g001
Figure 2. RGB (Red, green, blue) aerial image acquired from an alfalfa field infested with Phymatotrichopsis root rot disease located near Burneyville, OK in August 2014. Training and validation data points were generated from alfalfa, bare ground and weed areas. Alfalfa and weeds could be distinguished as they were different shades of green.
Remotesensing 10 00917 g002
Figure 3. RGB (Red, green, blue) aerial images acquired during the 2014-15 growing season (AF) from an alfalfa field infested with Phymatotrichopsis root rot disease located near Burneyville, OK, 2014–2015 (33°52′35″ N, 97°15′28″ W). Training data points are represented in yellow and validation data points are represented in red. The solid light blue color represents the flooded area due to intense rain storms in the spring of 2015, which was masked in the 2014 images for consistency between years.
Remotesensing 10 00917 g003
Figure 4. RGB (red, green, blue), HSV (hue, saturation, value) and Hrot60SV (hue values rotated 60 units, saturation, value) transformations of the September 2015 aerial image obtained from an alfalfa field infested with Phymatotrichopsis root rot disease located near Burneyville, OK (33°52′35″ N, 97°15′28″ W). The solid light blue color masks the flooded area due to intense rain storms in the spring of 2015.
Remotesensing 10 00917 g004
Figure 5. Class area estimates of post-processing RGB images for an alfalfa field infested with Phymatotrichopsis root rot disease near Burneyville, OK, 2014–2015.
Remotesensing 10 00917 g005
Table 1. List of image datasets acquired by manned and unmanned aircraft systems (UAS) from a Phymatotrichopsis root-rot-infested alfalfa field near Burneyville, OK, 2014–2015.
PlatformImage (Acquisition Date)Ground Sampling Distance (m)Flight Time (Hours, Central Standard Time)
UASJune 2014 (23 June 2014)0.01813:23 to 14:13
UASAugust 2014 (5 August 2014)0.02411:49 to 12:35
Manned aircraftOctober 2014 (29 October 2014)0.04610:23 to 11:35
Manned aircraftJune 2015 (29 June 2015)0.04013:23 to 14:13
Manned aircraftSeptember 2015 (17 September 2015)0.0648:02 to 9:00
Manned aircraftOctober 2015 (15 October 2015)0.0638:37 to 9:22
Table 2. Number of training and validation pixels assigned to perform supervised image classification.
ImageTraining PixelsValidation Pixels
AlfalfaSoilWeedAlfalfaSoilWeed
June 20141865205720412411406192
August 201415871667569898957591
October 201414281505568822819513
June 20159841029502613636577
September 201514361529472987956576
October 201515151412356888893416
Table 3. Accuracy assessment values of RGB (red, green, blue) images using different spectral signatures.
ImageImage Acquired PlatformSpectral Signature YBalanced Accuracy ZOverall Mean Accuracy Z
AlfalfaSoilWeed
June 2014UASImage specific0.968 ± 0.020.999 ± 00.899 ± 0.080.968 ± 0.04
UAS platform specific0.9 ± 0.030.998 ± 0.010.841 ± 0.100.901 ± 0.03
Manned aircraft platform specific0.5 ± 00.971 ± 0.020.736 ± 0.030.508 ± 0.01
August 2014 WUASUAS platform specific0.871 ± 0.051 ± 00.905 ± 0.040.896 ± 0.04
Manned aircraft platform specific0.5 ± 00.864 ± 0.030.770 ± 0.040.584 ± 0.03
October 2014Manned aircraftImage specific0.986 ± 0.020.962 ± 0.030.967 ± 0.030.959 ± 0.03
UAS platform specific0.731 ± 0.060.659 ± 0.040.509 ± 0.020.560 ± 0.05
Manned aircraft platform specific0.684 ± 0.060.934 ± 0.030.686 ± 0.070.687 ± 0.06
June 2015Manned aircraftImage specific0.976 ± 0.021 ± 00.983 ± 0.020.981 ± 0.02
UAS platform specific0.559 ± 0.060.777 ± 0.040.507 ± 0.020.535 ± 0.04
Manned aircraft platform specific0.718 ± 0.050.988 ± 0.020.846 ± 0.040.781 ± 0.04
September 2015 XManned aircraftUAS platform specific0.516 ± 0.040.547 ± 0.030.5 ± 00.405 ± 0.02
Image specific0.928 ± 0.040.978 ± 0.020.887 ± 0.060.915 ± 0.04
October 2015Manned aircraftImage specific0.954 ± 0.030.981 ± 0.020.897 ± 0.060.940 ± 0.03
UAS platform specific0.564 ± 0.040.543 ± 0.030.5 ± 00.457 ± 0.03
Manned aircraft platform specific0.946 ± 0.040.956 ± 0.030.812 ± 0.080.903 ± 0.04
W The Unmanned aircraft system (UAS) platform-specific spectral signature was developed based on the August 2014 RGB image. Hence, the image-specific and UAS platform-specific spectral signatures are the same for the August 2014 image; X The manned-aircraft-specific spectral signature was developed based on the September 2015 RGB image. Hence, the image-specific and manned-aircraft-specific spectral signatures are same for the September 2015 image; Y The best spectral signature for each image is formatted in bold; Z Values presented after the ± sign represent the standard deviation of the mean.
Table 4. Agreement between the June 2014 RGB (red, green, blue) image classified using the image-specific spectral signature and the June 2014 RGB image classified using UAS platform-specific spectral signature.
Class Pair (Image Specific–UAS Platform Specific)Percentage of PixelsWeight Factor Z
Alfalfa–Alfalfa57.65-
Soil–Soil17.92-
Weed–Weed0.70-
Alfalfa–Soil3.080.130
Alfalfa–Weed7.380.311
Soil–Alfalfa0.030.001
Soil–Weed0.010.001
Weed–Alfalfa6.770.285
Weed–Soil6.460.272
Z The weight factor was calculated for each inconsistent class pair based on the percentage of pixels.
Table 5. Validation of the June 2014 image classified using the image-specific and UAS platform-specific spectral signatures by comparison with the corresponding pixels from the original June 2014 RGB image.
Class Pair (Image Specific–UAS Platform Specific)Weight Factor XManual Classification (Percentage of Pixels) YImage Specific Correct ZUAS Platform Specific correct ZNeither Correct Z
AlfalfaSoilWeed
Alfalfa–Soil0.130455505.857.150.00
Alfalfa–Weed0.3111000031.100.000.00
Soil–Alfalfa0.001703000.030.070.00
Soil–Weed0.001604000.040.000.06
Weed–Alfalfa0.285802000.0022.805.70
Weed–Soil0.2722065154.0817.685.44
41.1047.7011.20
X Weight factor values for each class pair were obtained from Table 4.
Y The percentage of pixels was calculated by randomly selecting 20 pixels from the set of pixels in each class pair, which were manually classified by visually evaluating the corresponding pixel in the June 2014 RGB (red, green, blue) image.
Z The overall congruency was determined by multiplying the percentage matching the manual classification by the weight factor and summing over the classes.
Table 6. Accuracy assessment estimates of post-processing RGB (red, green, blue) images for an alfalfa field infested with Phymatotrichopsis root rot disease located near Burneyville, OK, 2014–2015.
ImageImage Acquisition Platform/Spectral SignatureBalanced Accuracy ZOverall Mean Accuracy Z
AlfalfaSoilWeed
June 2014UAS/UAS platform specific0.897 ± 00.998 ± 0.010.78 ± 0.040.898 ± 0.01
August 2014UAS/UAS platform specific0.951 ± 0.031 ± 00.975 ± 0.010.963 ± 0.02
October 2014Manned aircraft/Image specific1 ± 00.951 ± 0.030.935 ± 0.010.953 ± 0.02
June 2015Manned aircraft/Image specific1 ± 01 ± 01 ± 01 ± 0
September 2015Manned aircraft/Image specific1 ± 01 ± 01 ± 01 ± 0
October 2015Manned aircraft/Image specific1 ± 00.998 ± 0.010.994 ± 0.020.998 ± 0.01
Z Values presented after the ±sign represent the standard deviation of the mean.

