3.1. Materials
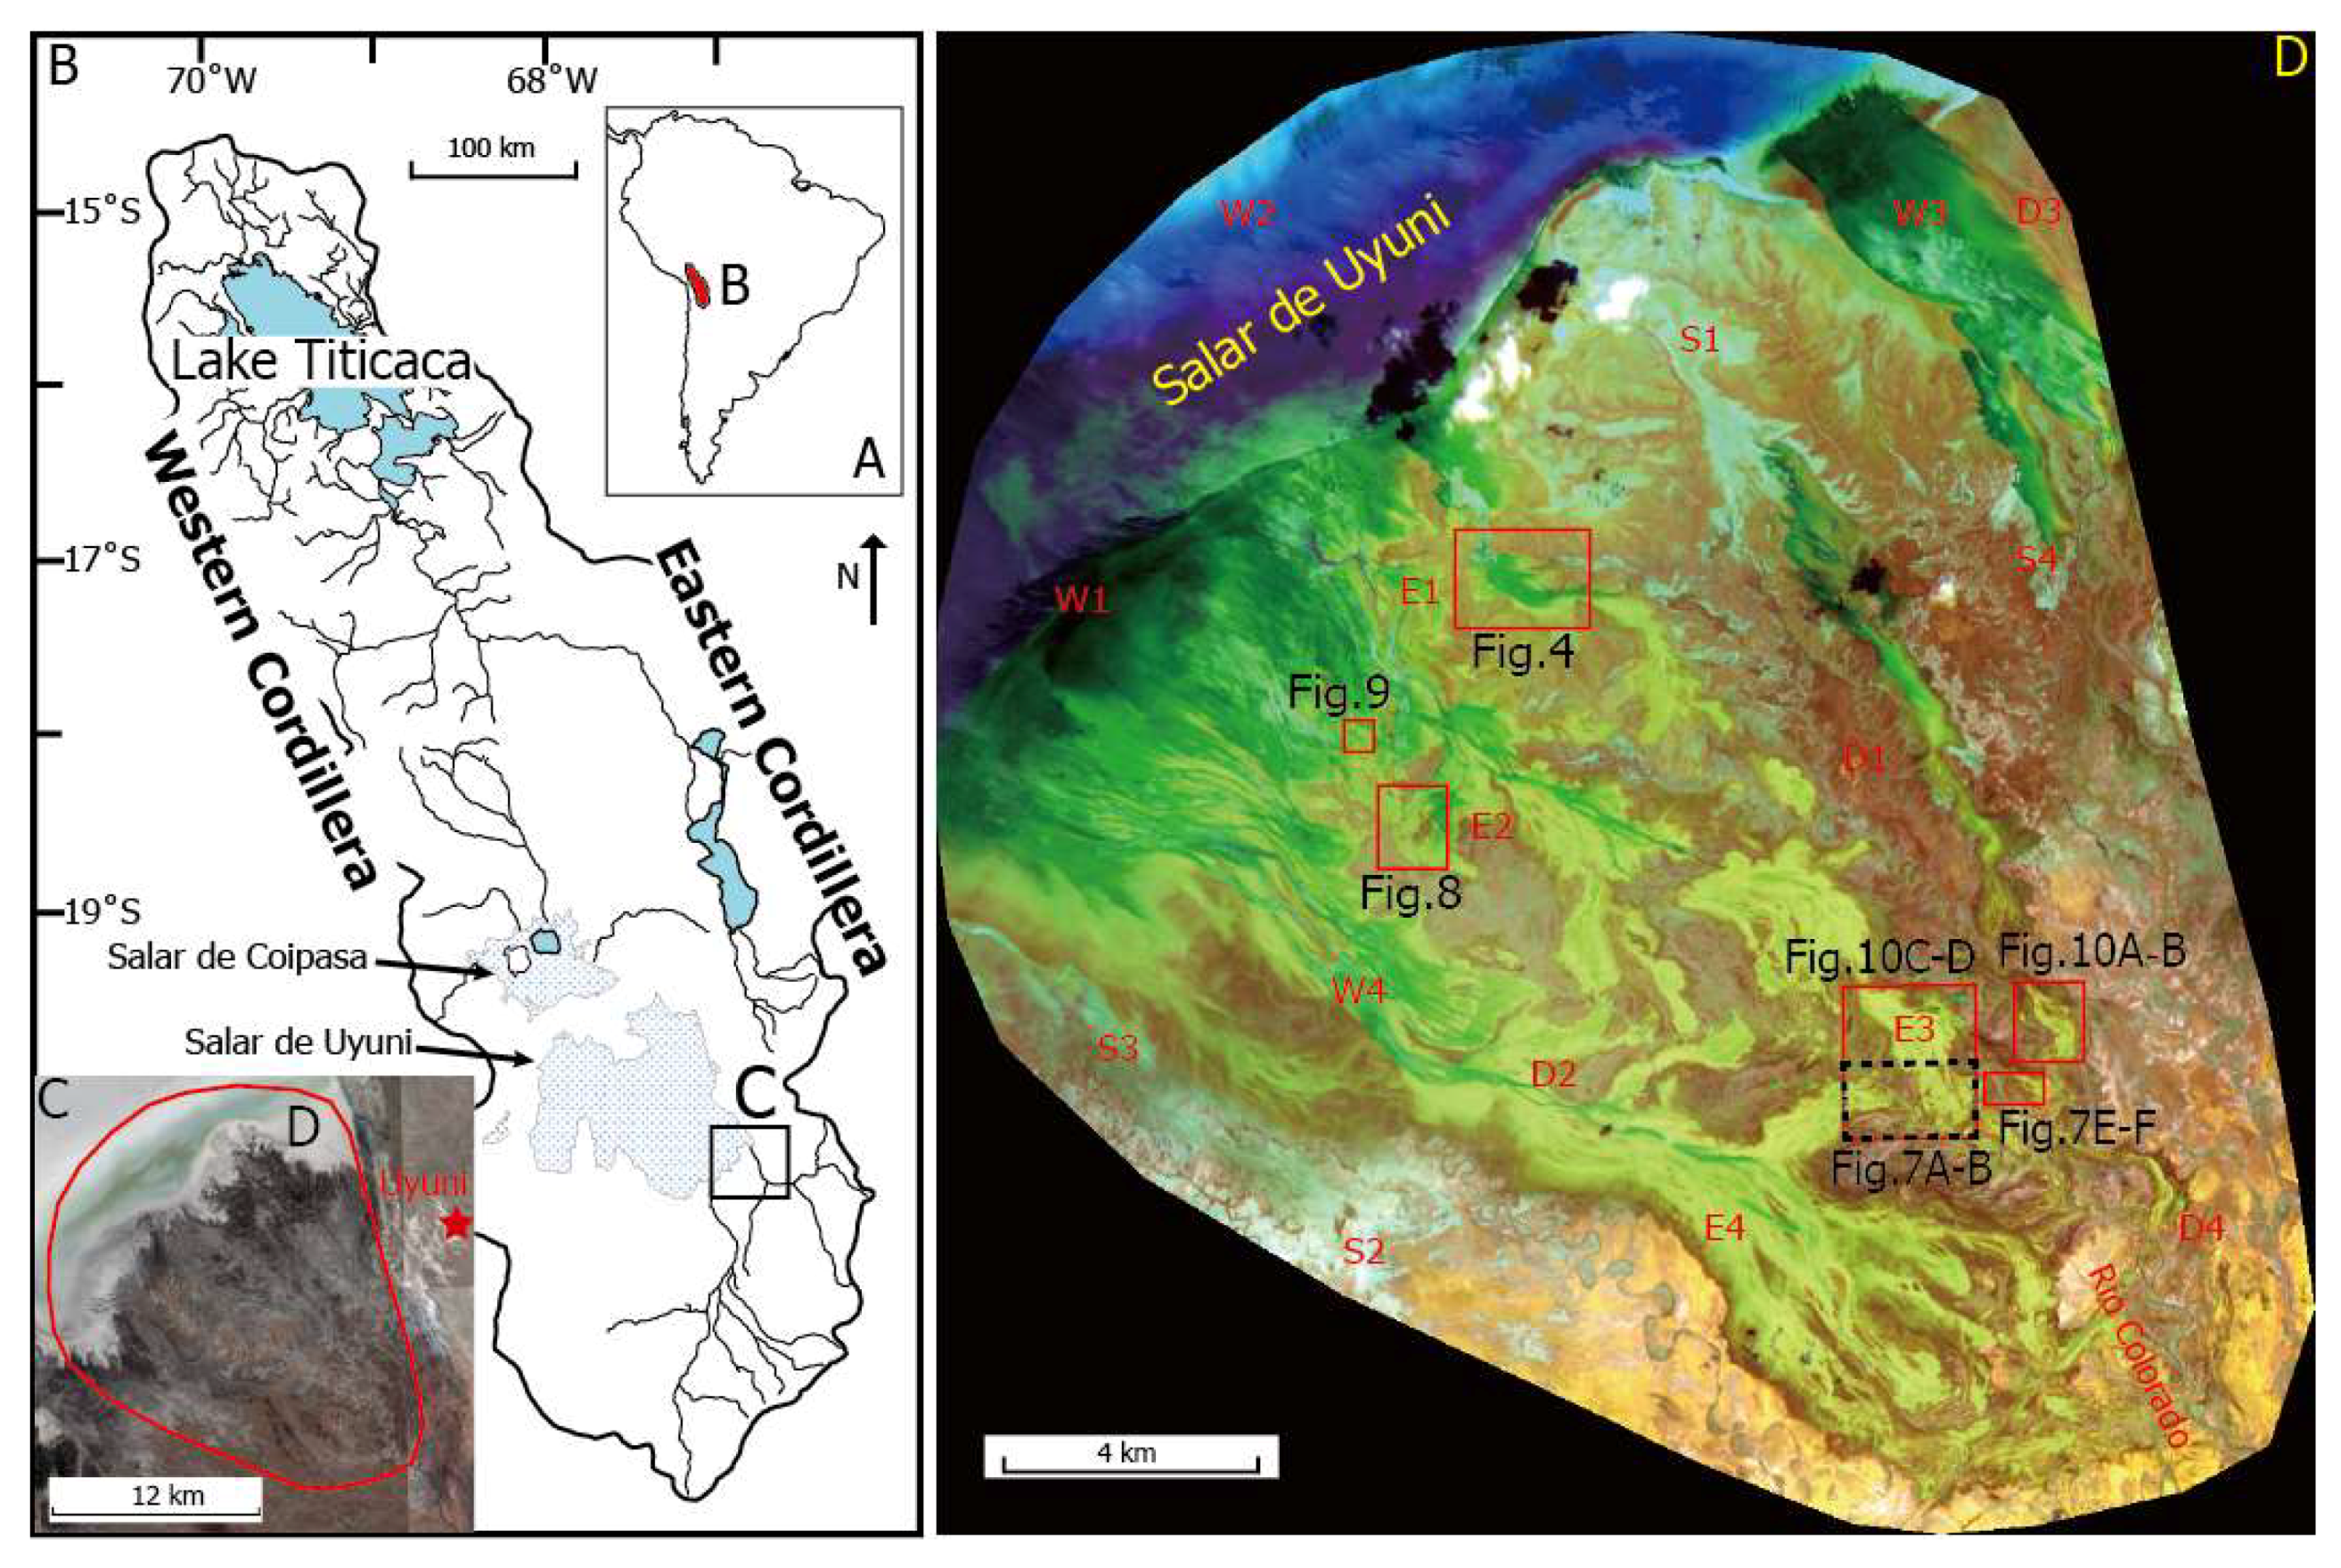
Daily precipitation data in the Uyuni area were collected for the period 1976 through 2017 from the Bolivian Servicio Nacional de Meteorología e Hidrología. Although we have precipitation data from only one gauge, the major moisture supply by strong low-level northwesterly winds along the eastern flank of the central Andes makes the precipitation pattern consistent in the drainage catchment of the study area [
40].
Launched in June 2015, Sentinel-2A Level-1C (L1C) Multispectral Instrument (MSI) data are publically available for free download from Sentinels Scientific Data Hub (
https://scihub.copernicus.eu/). MSI data are characterized by a span of 13 spectral bands with a spatial resolution on the ground ranging from 10 m to 60 m (
Table 1). These spectral and spatial resolutions, along with the availability of images free of charge, make Sentinel-2 very appealing for water mapping and flood monitoring as well as for other applications such as crop monitoring in agriculture (e.g., [
28,
42,
43]).
The Sentinel-2 L1C datasets are the standard product of Top of Atmosphere (TOA) reflectance and were pre-processed to generate and format bottom of atmosphere (BOA) Level-2A products using the Sen2Cor processor (version 2.3) under Anaconda Python platform [
44]. Sen2Cor enables Sentinel-2 L1C products to be processed for physical atmospheric, terrain and cirrus correction and creates BOA reflectance corrected bands [
43]. The output product format is a collection of JPEG-2000 images with bands reproduced at three different resolutions (10, 20 and 60 m). Sen2Cor also produces a resampled version of the higher resolution bands (10 and 20 m) to 20 and 60 m, respectively. In this study, we used bands with resolution of 20 m to extract flood extent and undertake classifications. In the SWIR bands (spatial resolution of 20 m), water absorbs solar radiation more strongly than in the visible (spatial resolution of 10 m), and these are subjected to MNDWI and ICA methods to extract flood extents in the subsequent analysis. The use of the 20 m version of the visible and NIR bands is justified by the need to avoid any artifacts that would have arisen by sharpening lower resolution SWIR bands.
3.2. Methodology
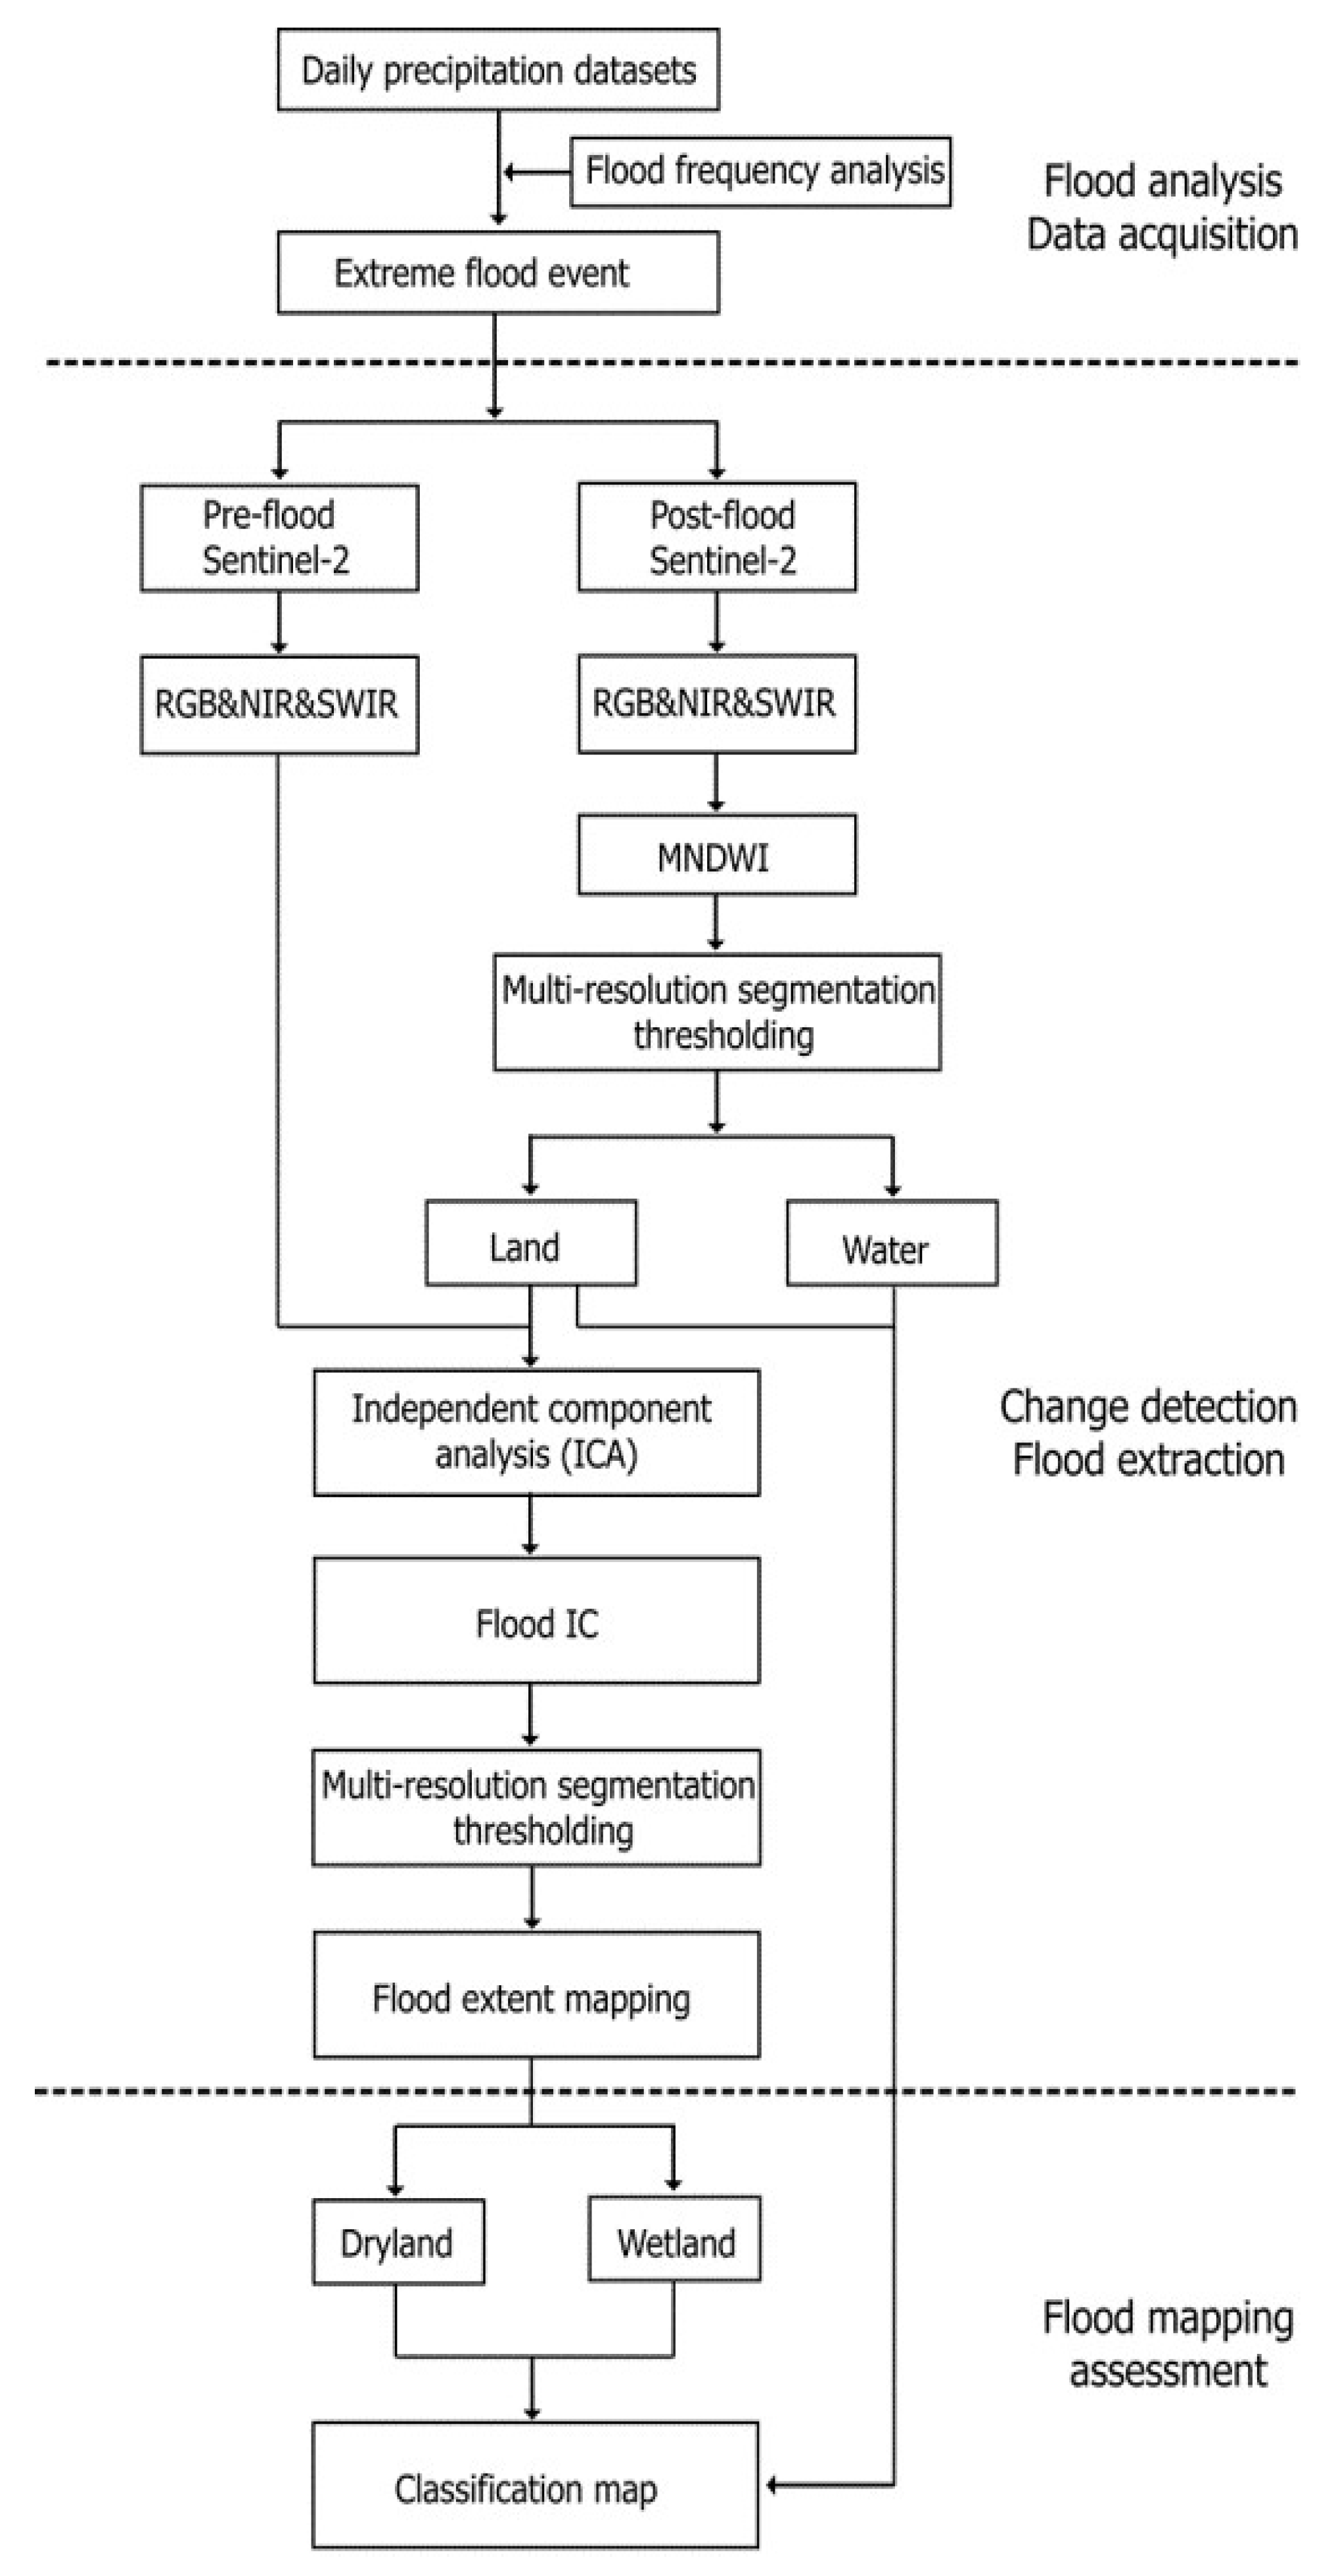
Daily precipitation data can be used for maximum daily precipitation frequency analysis and to pinpoint the peak flood events. Pre- and post-flood imagery can then be selected for extracting flood extents and patterns and analyzing the associated geomorphological changes (
Figure 2).
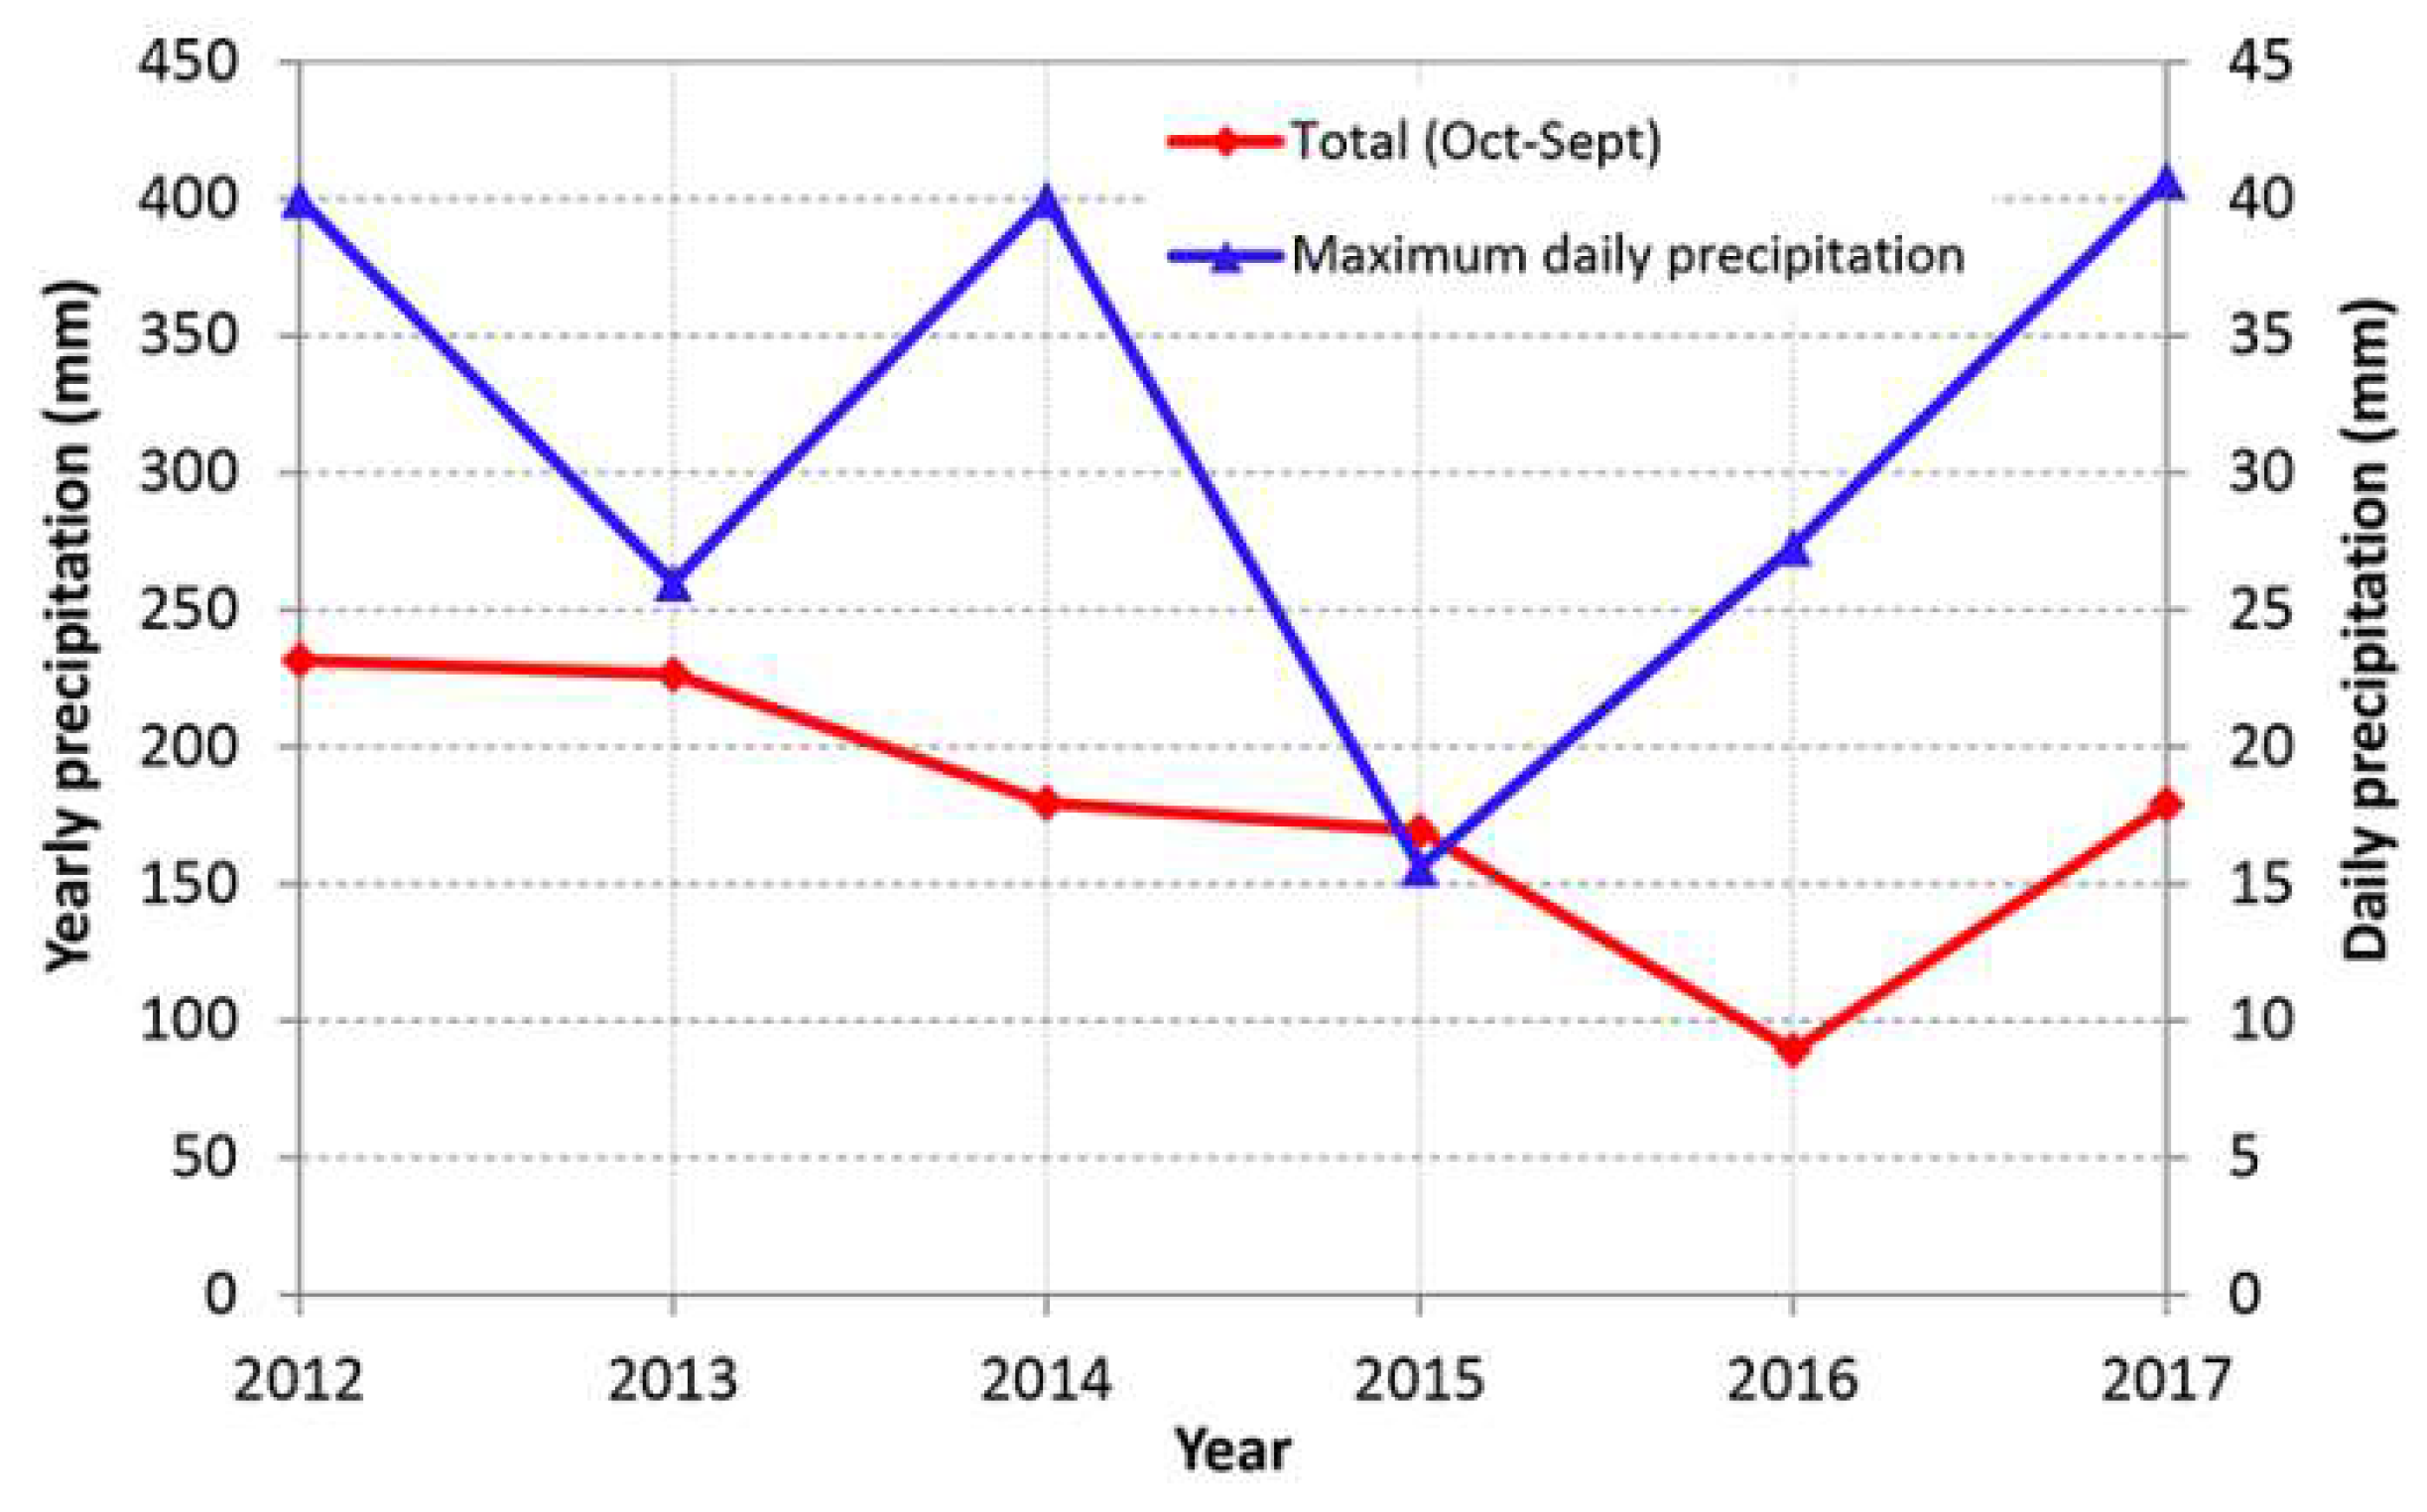
In this study, the daily precipitation data were processed to extract maximum daily precipitation and return periods. The maximum daily precipitation frequency analysis showed that the peak rainfall (40.7 mm) on 6 January 2017 is an approximately 40-year event (
Figure 3), and this corresponded with an extreme flood. This flood event was within the observation periods of Sentinel-2. The Sentinel-2 image available from immediately after this event is from 9 January 2017 with cloud cover of up to 50% but the image on 19 January 2017 is less cloudy, particularly in the medial and distal regions of the lower Río Colorado, which is the main region of interest for investigating geomorphological changes. Therefore, we selected the Sentinel-2 data acquired on 19 January 2017 for the post-flood image. For the pre-flood image, the data acquired on 20 December 2016 were selected, due to high cloud cover on the image of 30 December 2016 (
Table 2). This is justified by the limited rainfall between 20 December 2016 and 6 January 2017.
The selected pre-flood and post-flood Sentinel-2 data were then processed for flood extent extraction and assessments (
Figure 2). Before processing, using visual inspection, clouds and cloud shadows were detected and removed. The lower Río Colorado is characterized by low gradients (~0.000575 m/m declining to ~0.000148 m/m) and a surrounding, largely homogeneous, red-brown oxidized, fine-grained surface with no vegetation, although white, salt-rich surfaces also occur locally [
40,
41,
45]. The main region of interest—namely the medial and distal parts of the river and floodplain—was almost free of clouds, but some sporadic clouds and cloud shadows were easily identified due to their strong contrast with surrounding areas. Post-flood data were first used to separate then-existing water bodies and land according to MNDWI, along with multi-resolution segmentation thresholding. MNDWI has been reported to successfully extract water bodies because water absorption of solar radiation in SWIR bands is stronger than in NIR and visible bands [
46]:
where
is reflectance in Band 3 and
is reflectance in Band 11 for Sentinel-2 [
28,
47]. As indicated in
Section 3.1, we used Band 3 and Band 11 with 20 m spatial resolution derived from Sen2cor output files for MNDWI calculation, although Band 3 had an original spatial resolution of 10 m.
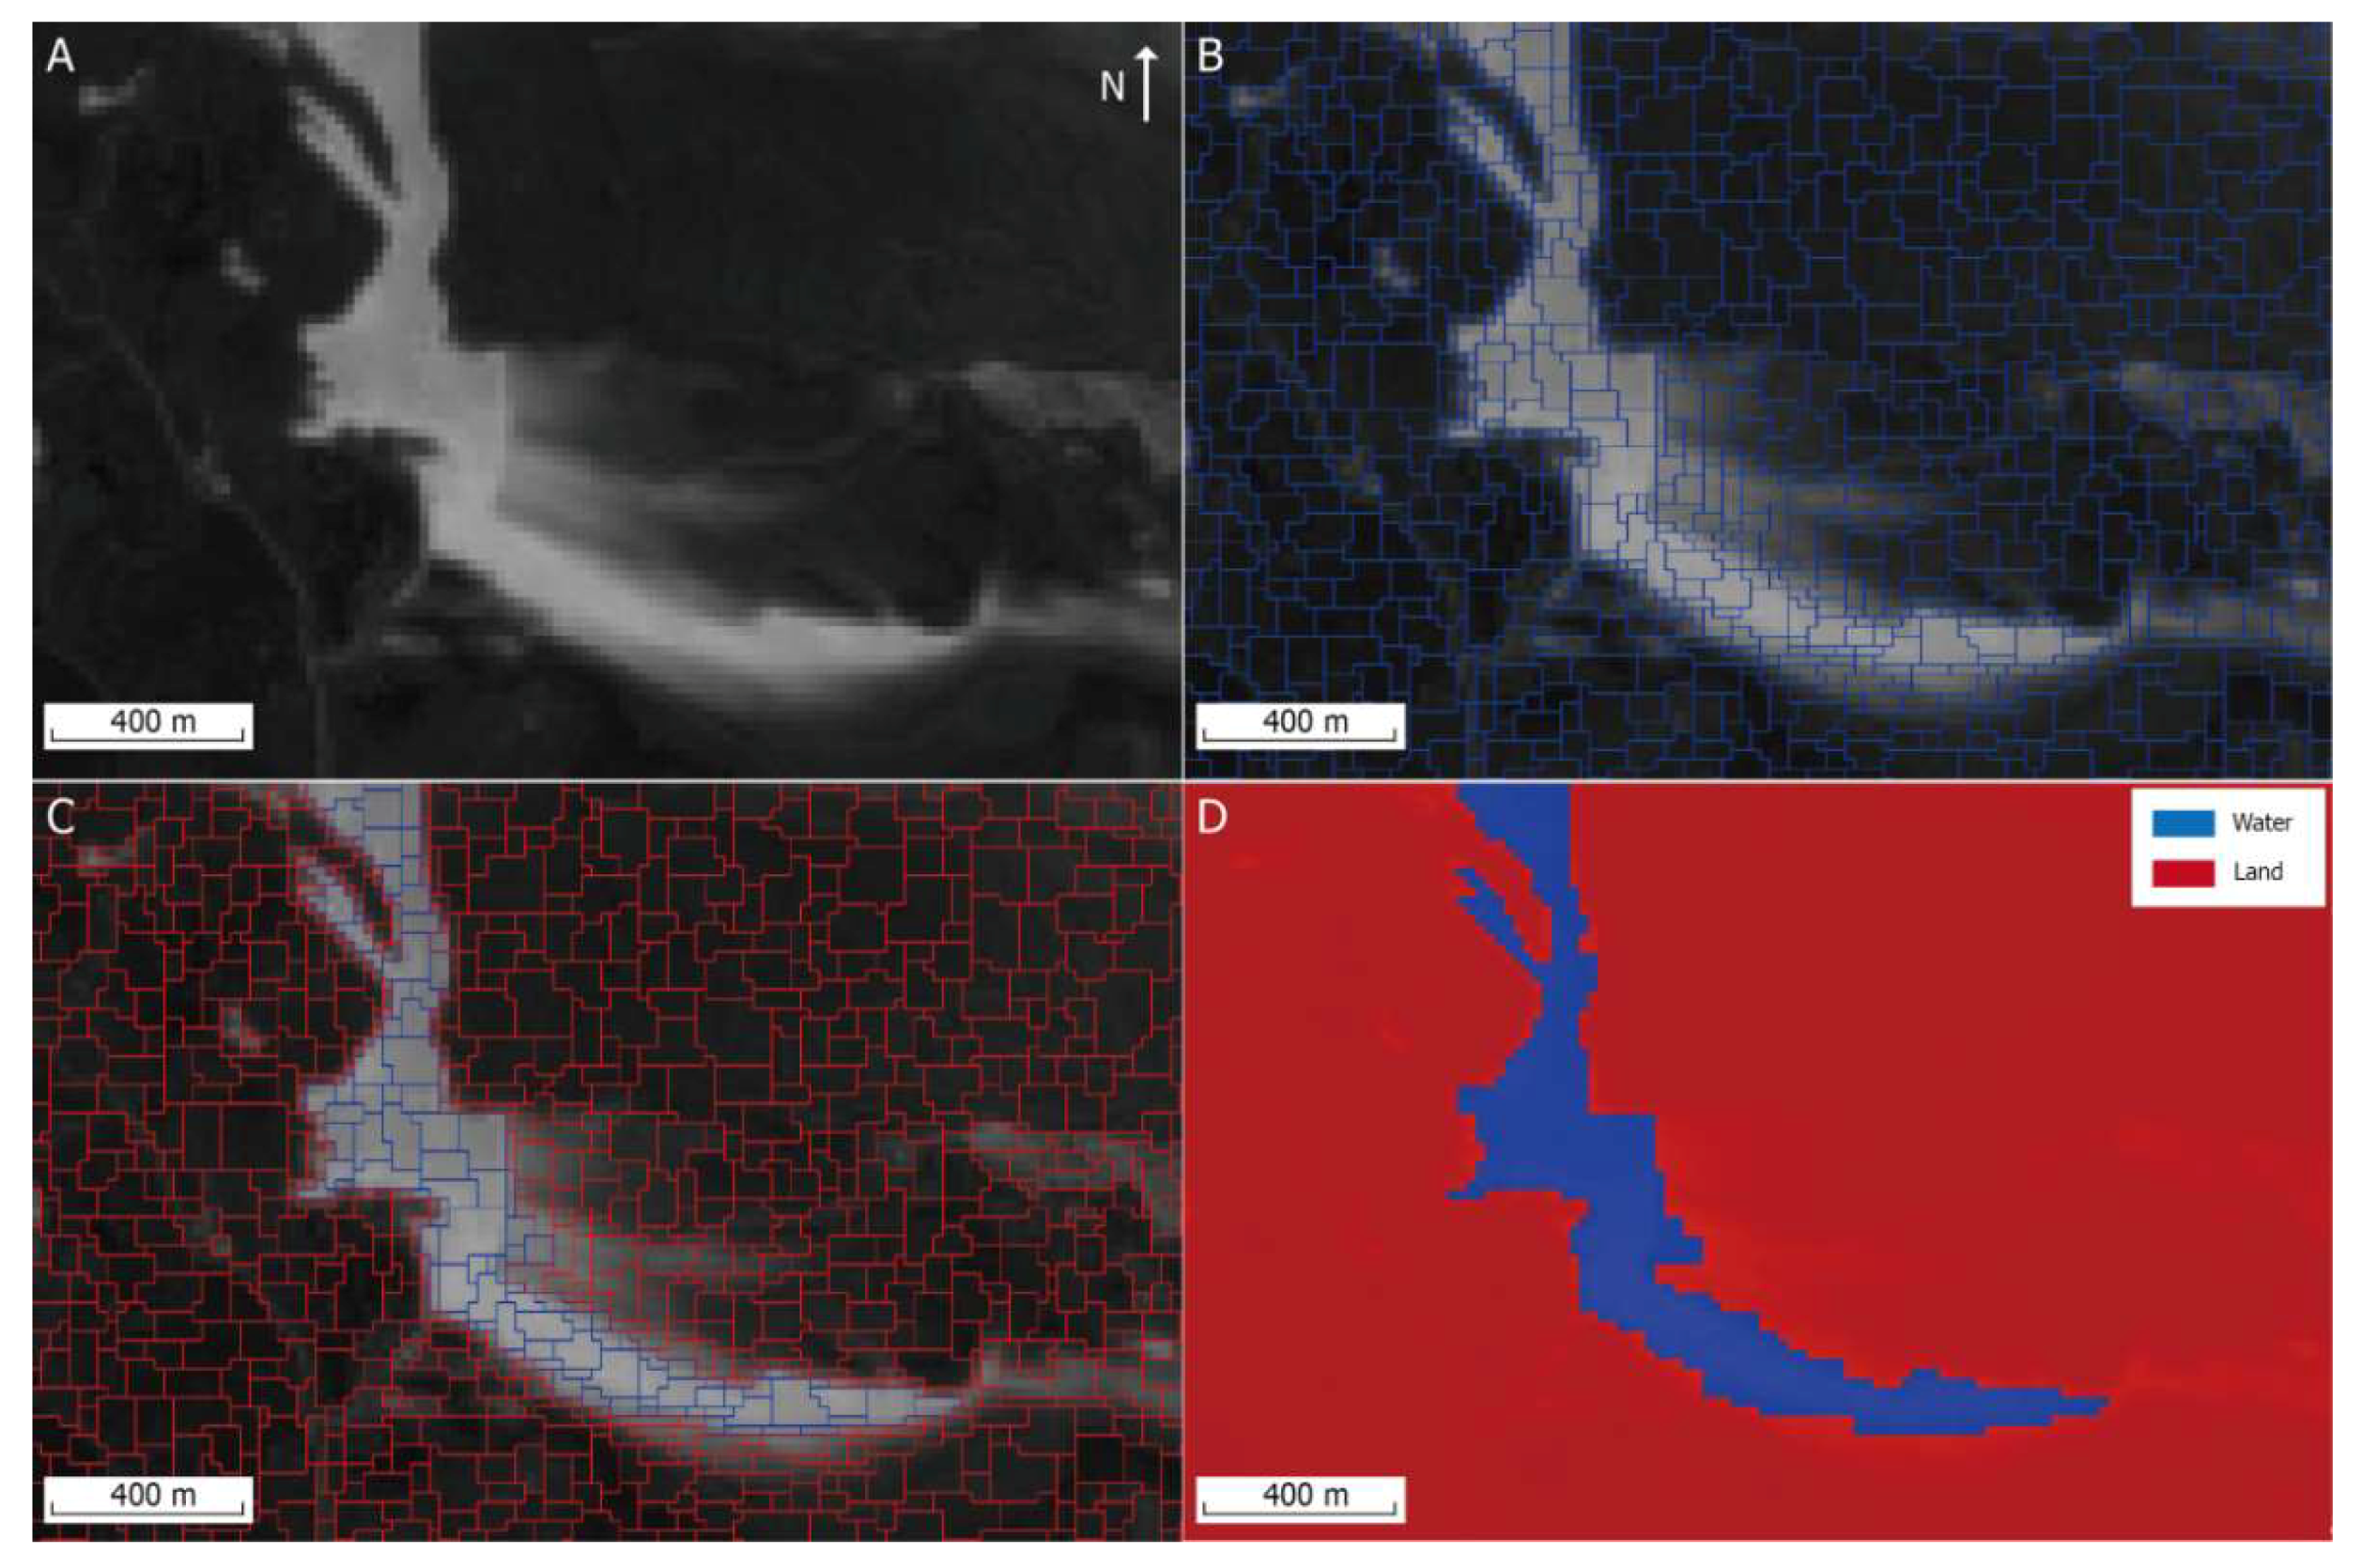
The threshold is generally set to zero to extract water bodies from MNDWI, but in practice, different data acquisition conditions (e.g., satellite platforms and regions) mean that the characteristics of water index in specific images determine the threshold values. Water indices algorithms also tend to produce positively high pixel values for water bodies while other surface materials are negative, resulting in a typical bi-model of distribution of foreground and background pixels on the image histogram [
28]. Histogram shape-based Otsu’s method was then used to determine the threshold value for the surface water (0.24). In this study, an object-based multiresolution segmentation algorithm was first applied on MNDWI to build homogeneous polygons, and their spectral mean values were calculated [
48,
49,
50]. Parameters of multiresolution segmentation processes were set using the values in
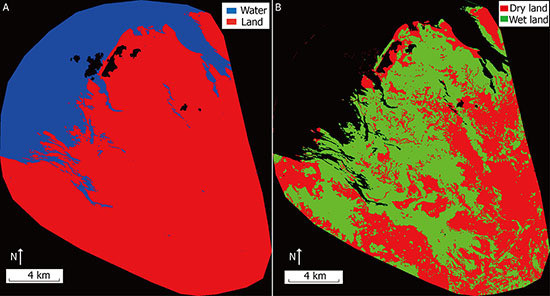
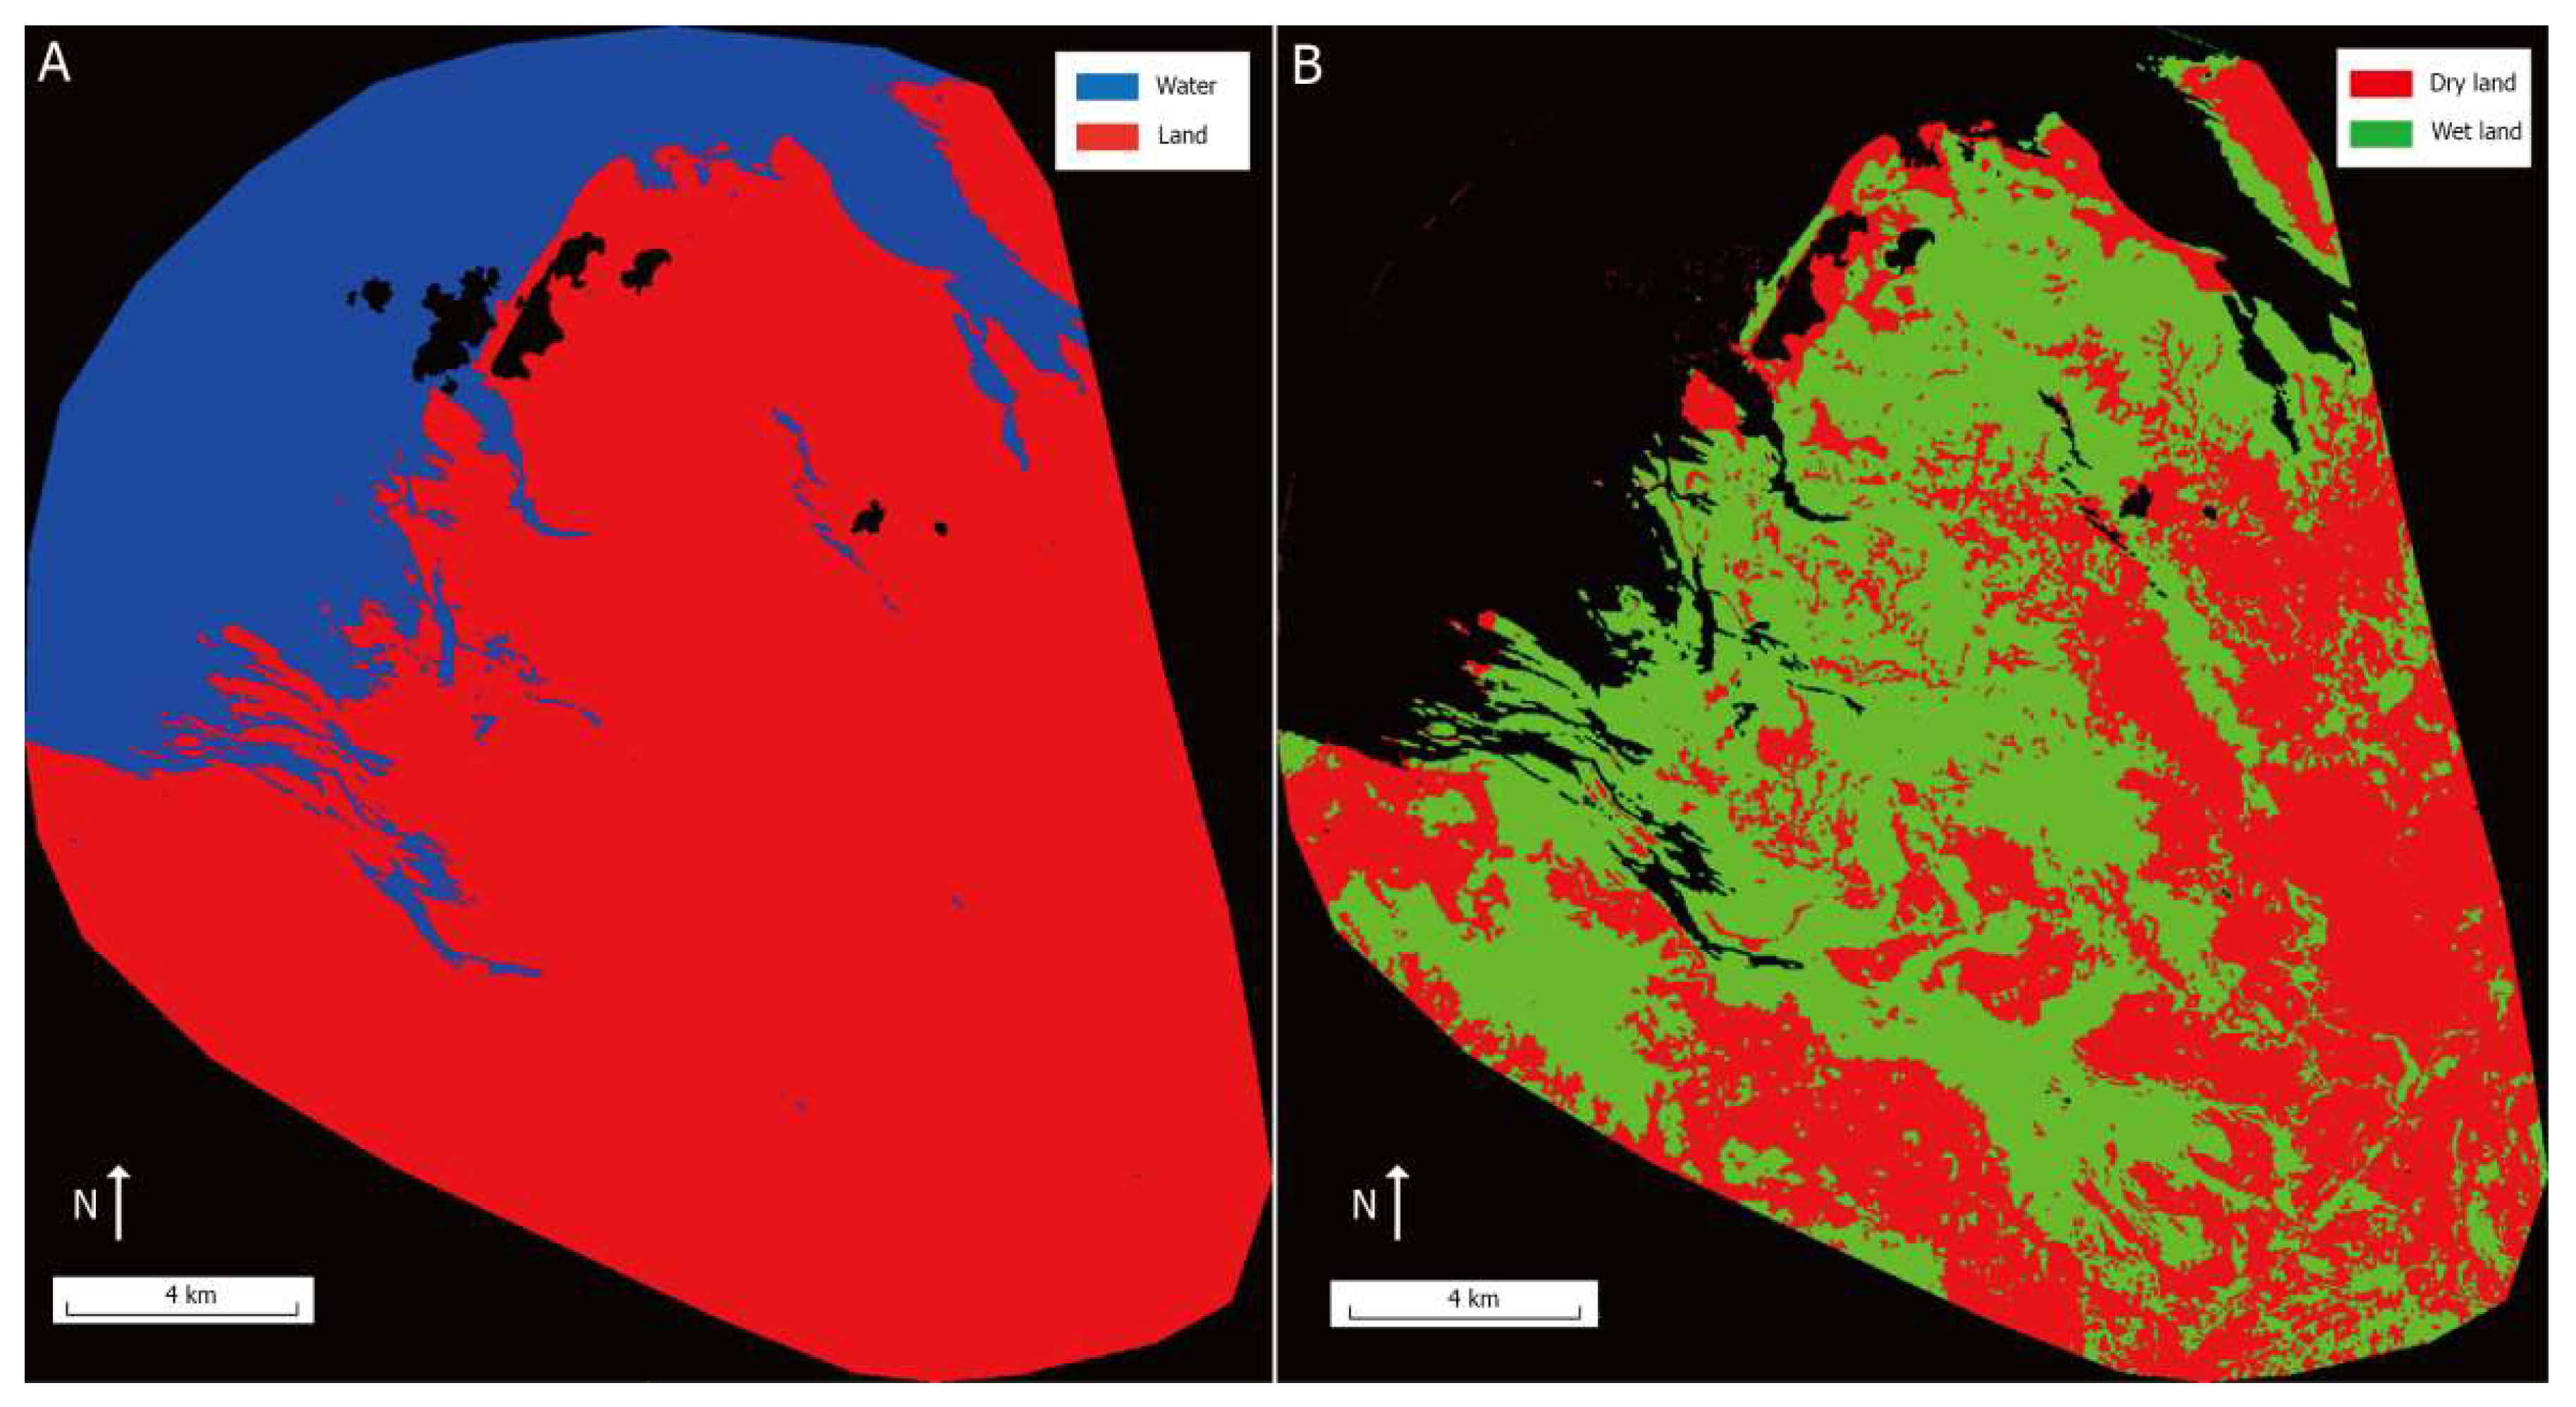
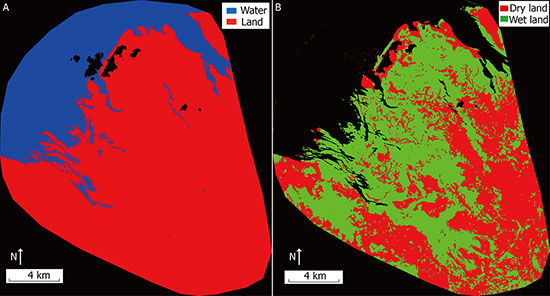
Table 3. For multiresolution segmentation of MNDWI, only one layer (MNDWI results) was used and therefore the image layer weight was 1. We also used a thematic layer to specify regions of interest for segmentation. The scale parameter is used to determine the maximum allowed heterogeneity of the resulting image objects, while the composition of homogeneity criterion is used to define the object homogeneity to which the scale parameter refers. The polygons with the mean values greater than the threshold value were categorized as water and polygons with the mean values less than the threshold value were categorized as land (
Figure 4).
Regions of interest on land areas were subsequently created using the segmentation results of MNDWI and applied to a subset of the land area from the stacking data of pre-flood and post-flood Sentinel-2 imagery. Independent component analysis (ICA) was used on the stacked Sentinel-2 data, and flood components (flood IC) were identified through resultant independent components.
The underlying idea of independent component analysis (ICA) is that a set of multivariate signals can be decomposed into statistically independent sources without prior knowledge about the statistics of the source [
25,
26]. Given a set of random variables
= (x1, x2, …, x
n), and assuming that these variables are a linear mixture of independent components:
= (s1, s2, …, s
n), the model of ICA is as follows:
where
is the unknown matrix of mixing parameters,
is an observation vector, and ICA could estimate
, which is capable of computing its inverse
. To extract source signals (independent components), Equation (2) is rewritten as:
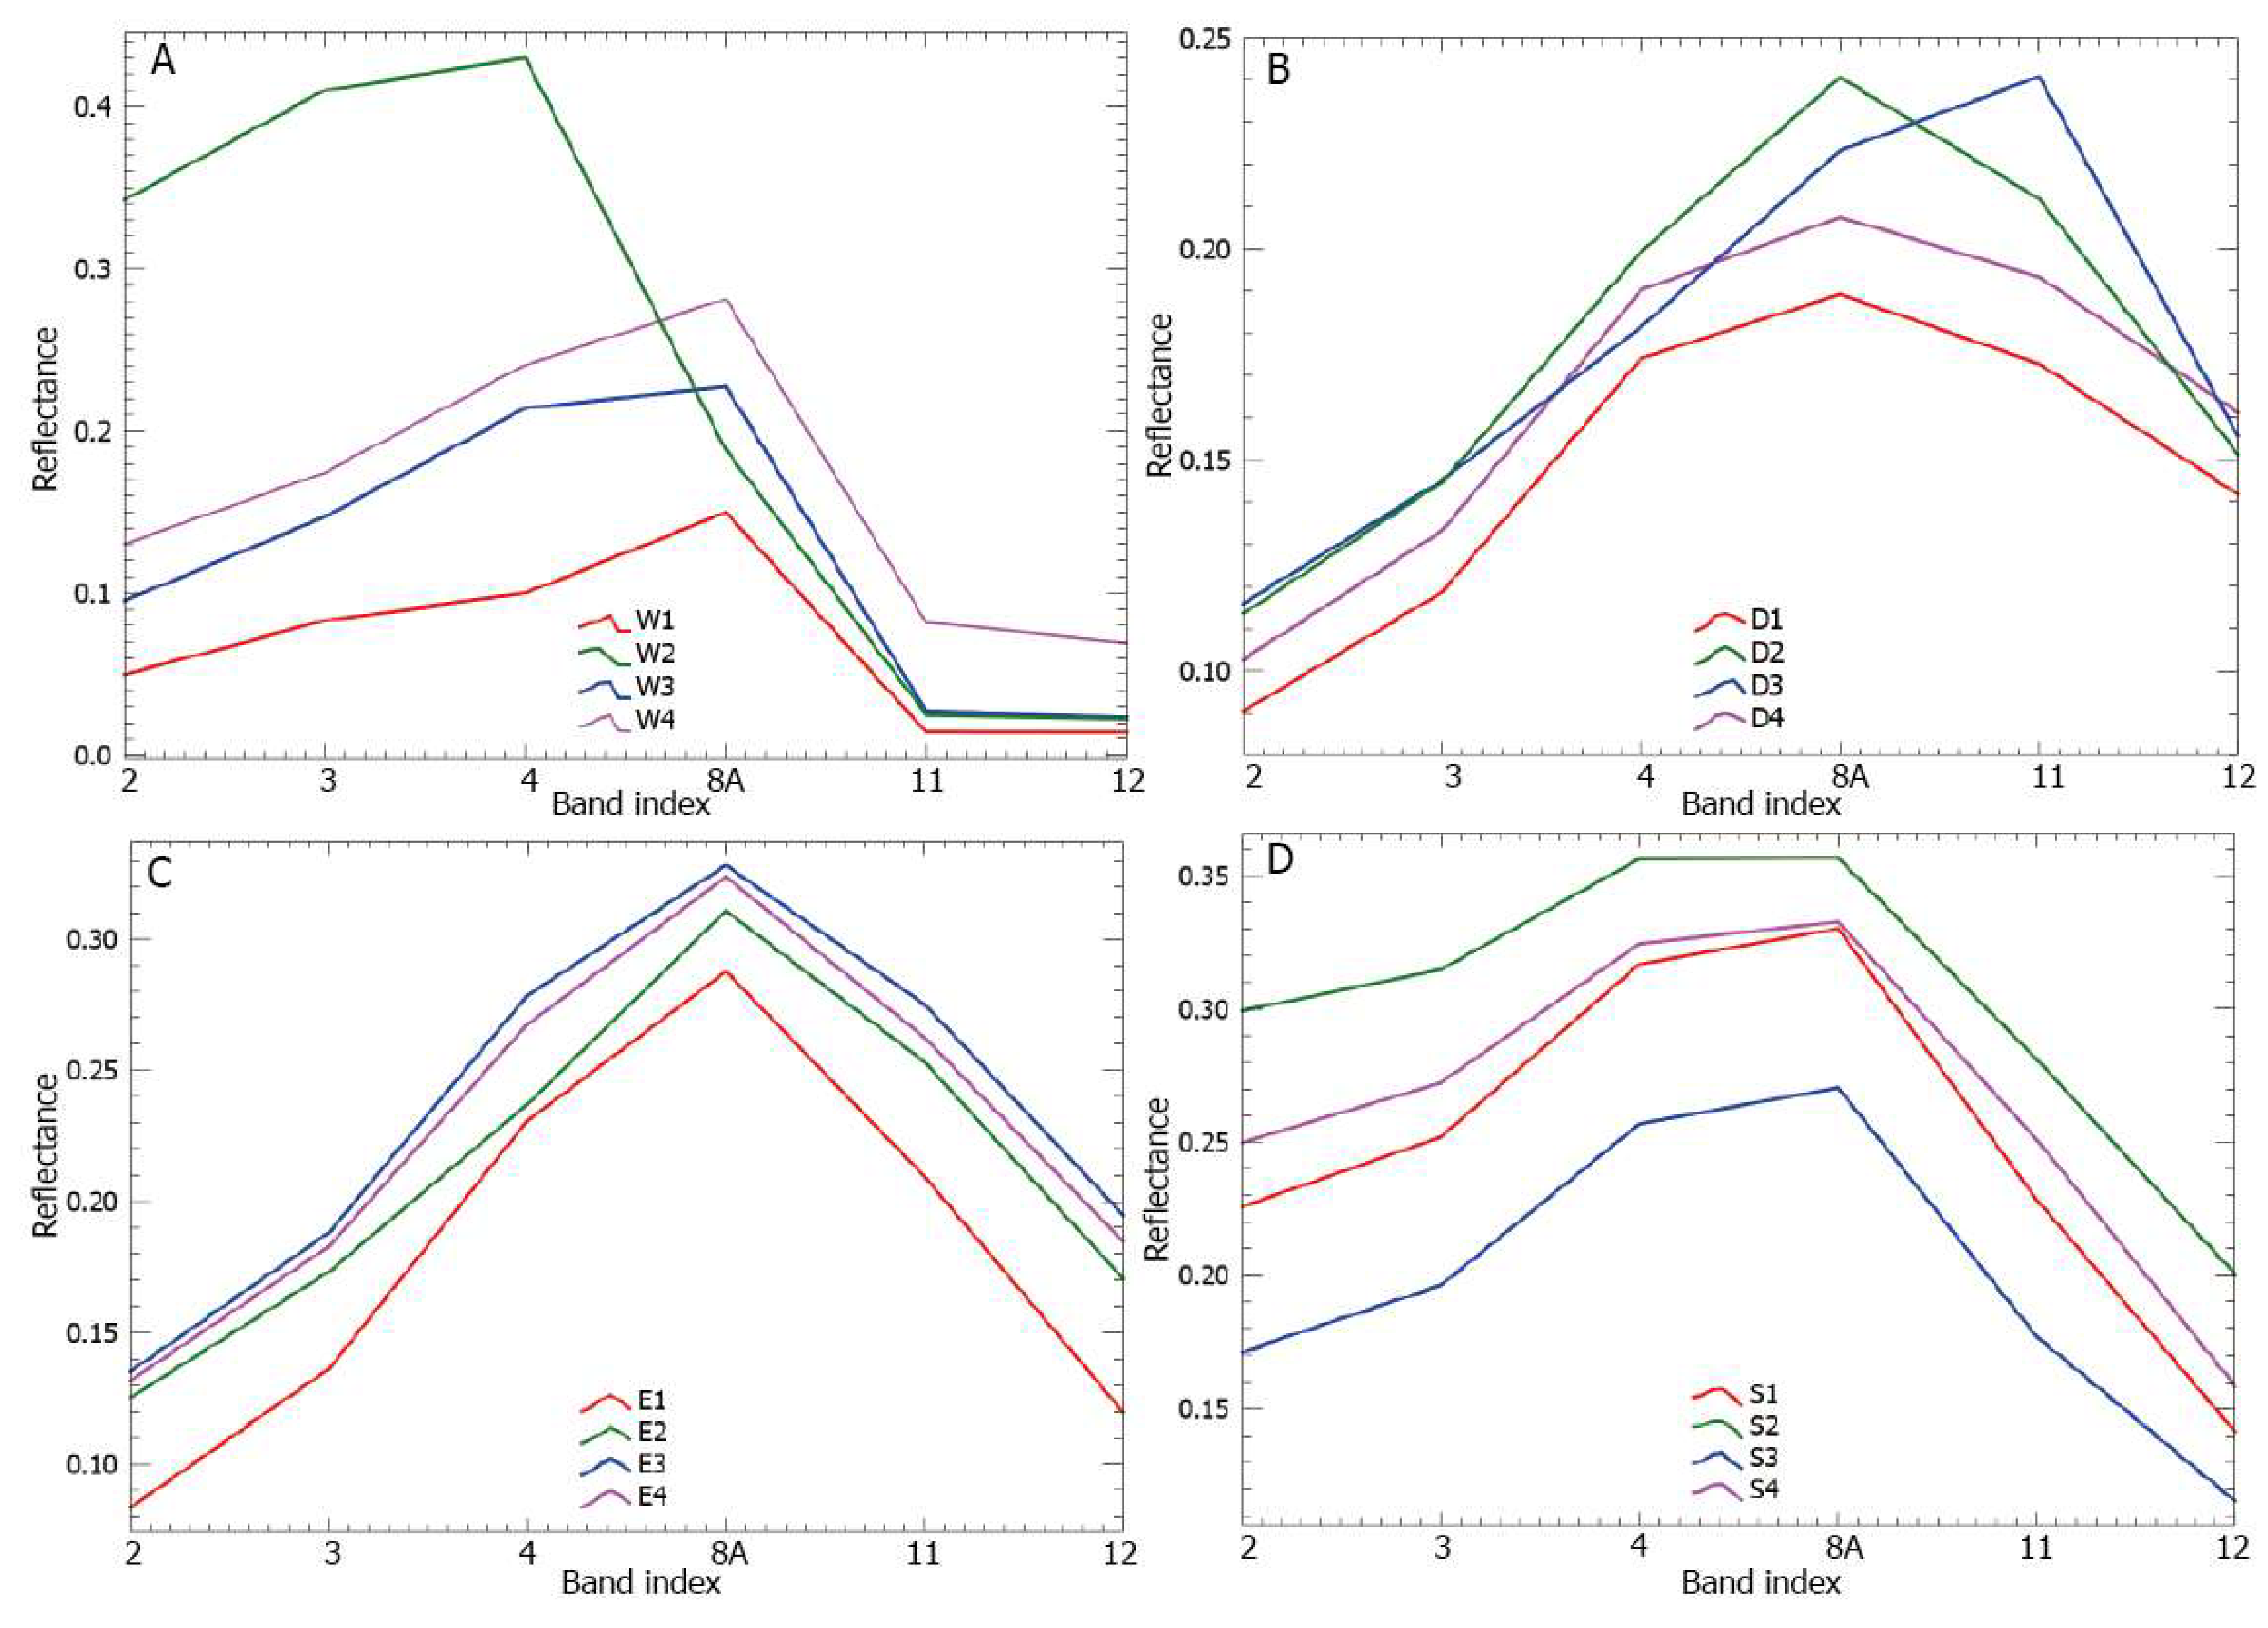
For a pre- and post-flood image stack, changed pixels due to moisture differences are accurately distinguished as the uncorrelated data using the algorithm ICA [
24,
51]. This study involved NIR and SWIR bands of Sentinel-2, which have a significant reduction in reflectance in the post-flood image and therefore help to identify inundated areas [
52]. The pre- and post-flood Sentinel-2 imagery was then stacked to create a 12-band composite raster, which was subsequently processed using ICA transformation. Experiments on increasing complexity of the ICA, such as increasing the number of iterations and thresholds, indicated that those changes would not produce prominent changes in the resulting ICs [
24]. ICA parameters were then set as in
Table 4. ICA transformation created 12 independent components, which were used to further determine flooding areas. The criterion to select a flood IC is a significant reduction in reflectance of the NIR and SWIR bands due to residual soil moisture [
24]. In this study, IC band 6 was selected as the flood IC for separating dry land and wet land.
Using multi-resolution segmentation thresholding (
Table 3) along with experiments on density slice, dry land and wet land were extracted from the flood IC. Both the segmentation of land and water as well as dry land and wet land were assessed using the visual interpretation map of the study area. Confusion matrices were used to evaluate the classification results from MNDWI and flood IC including commission error, omission error, producer’s accuracy, user’s accuracy, overall accuracy and Kappa coefficient.
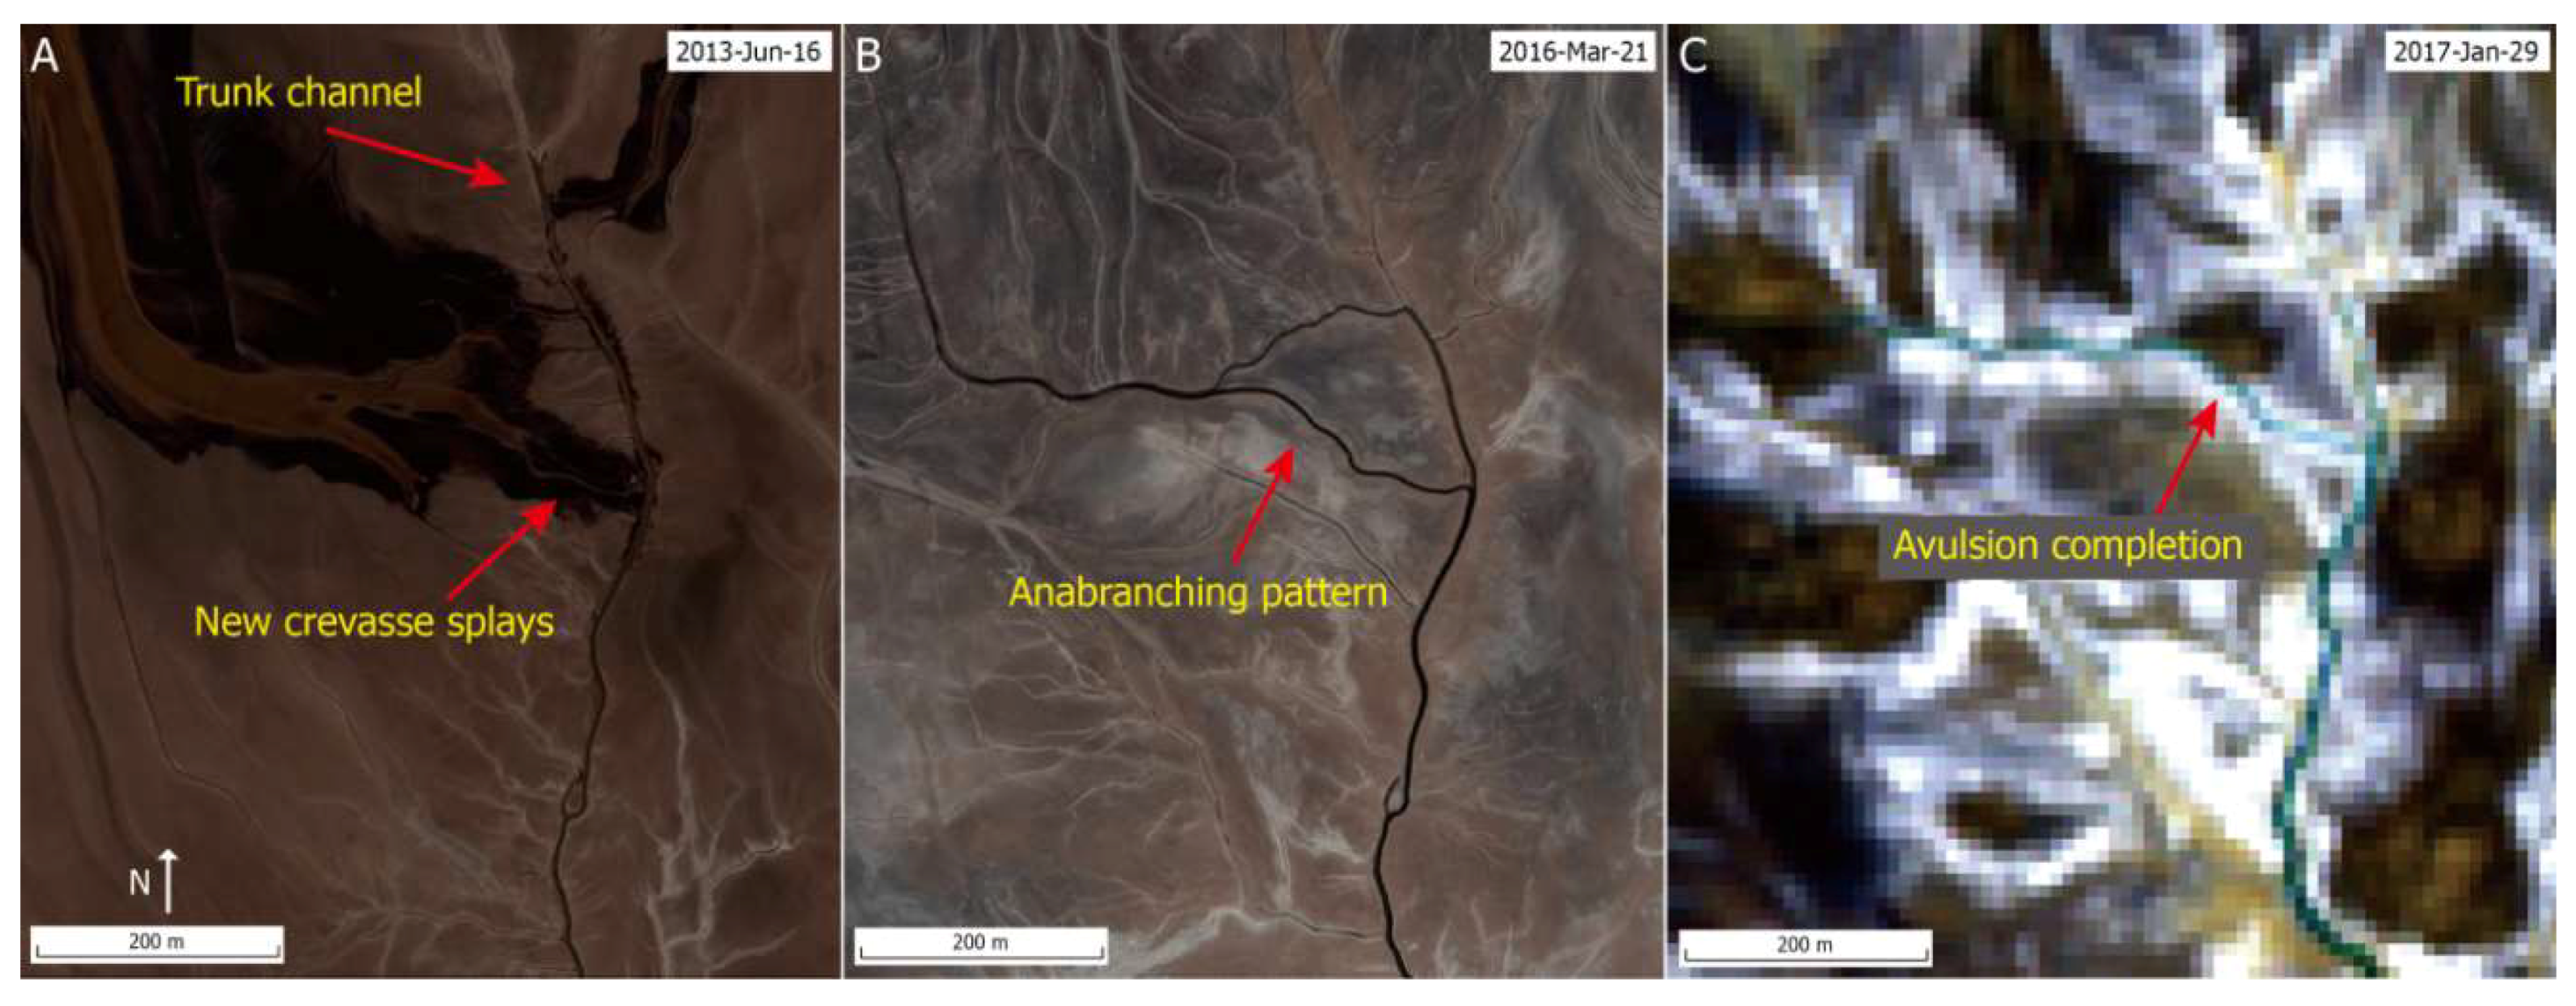
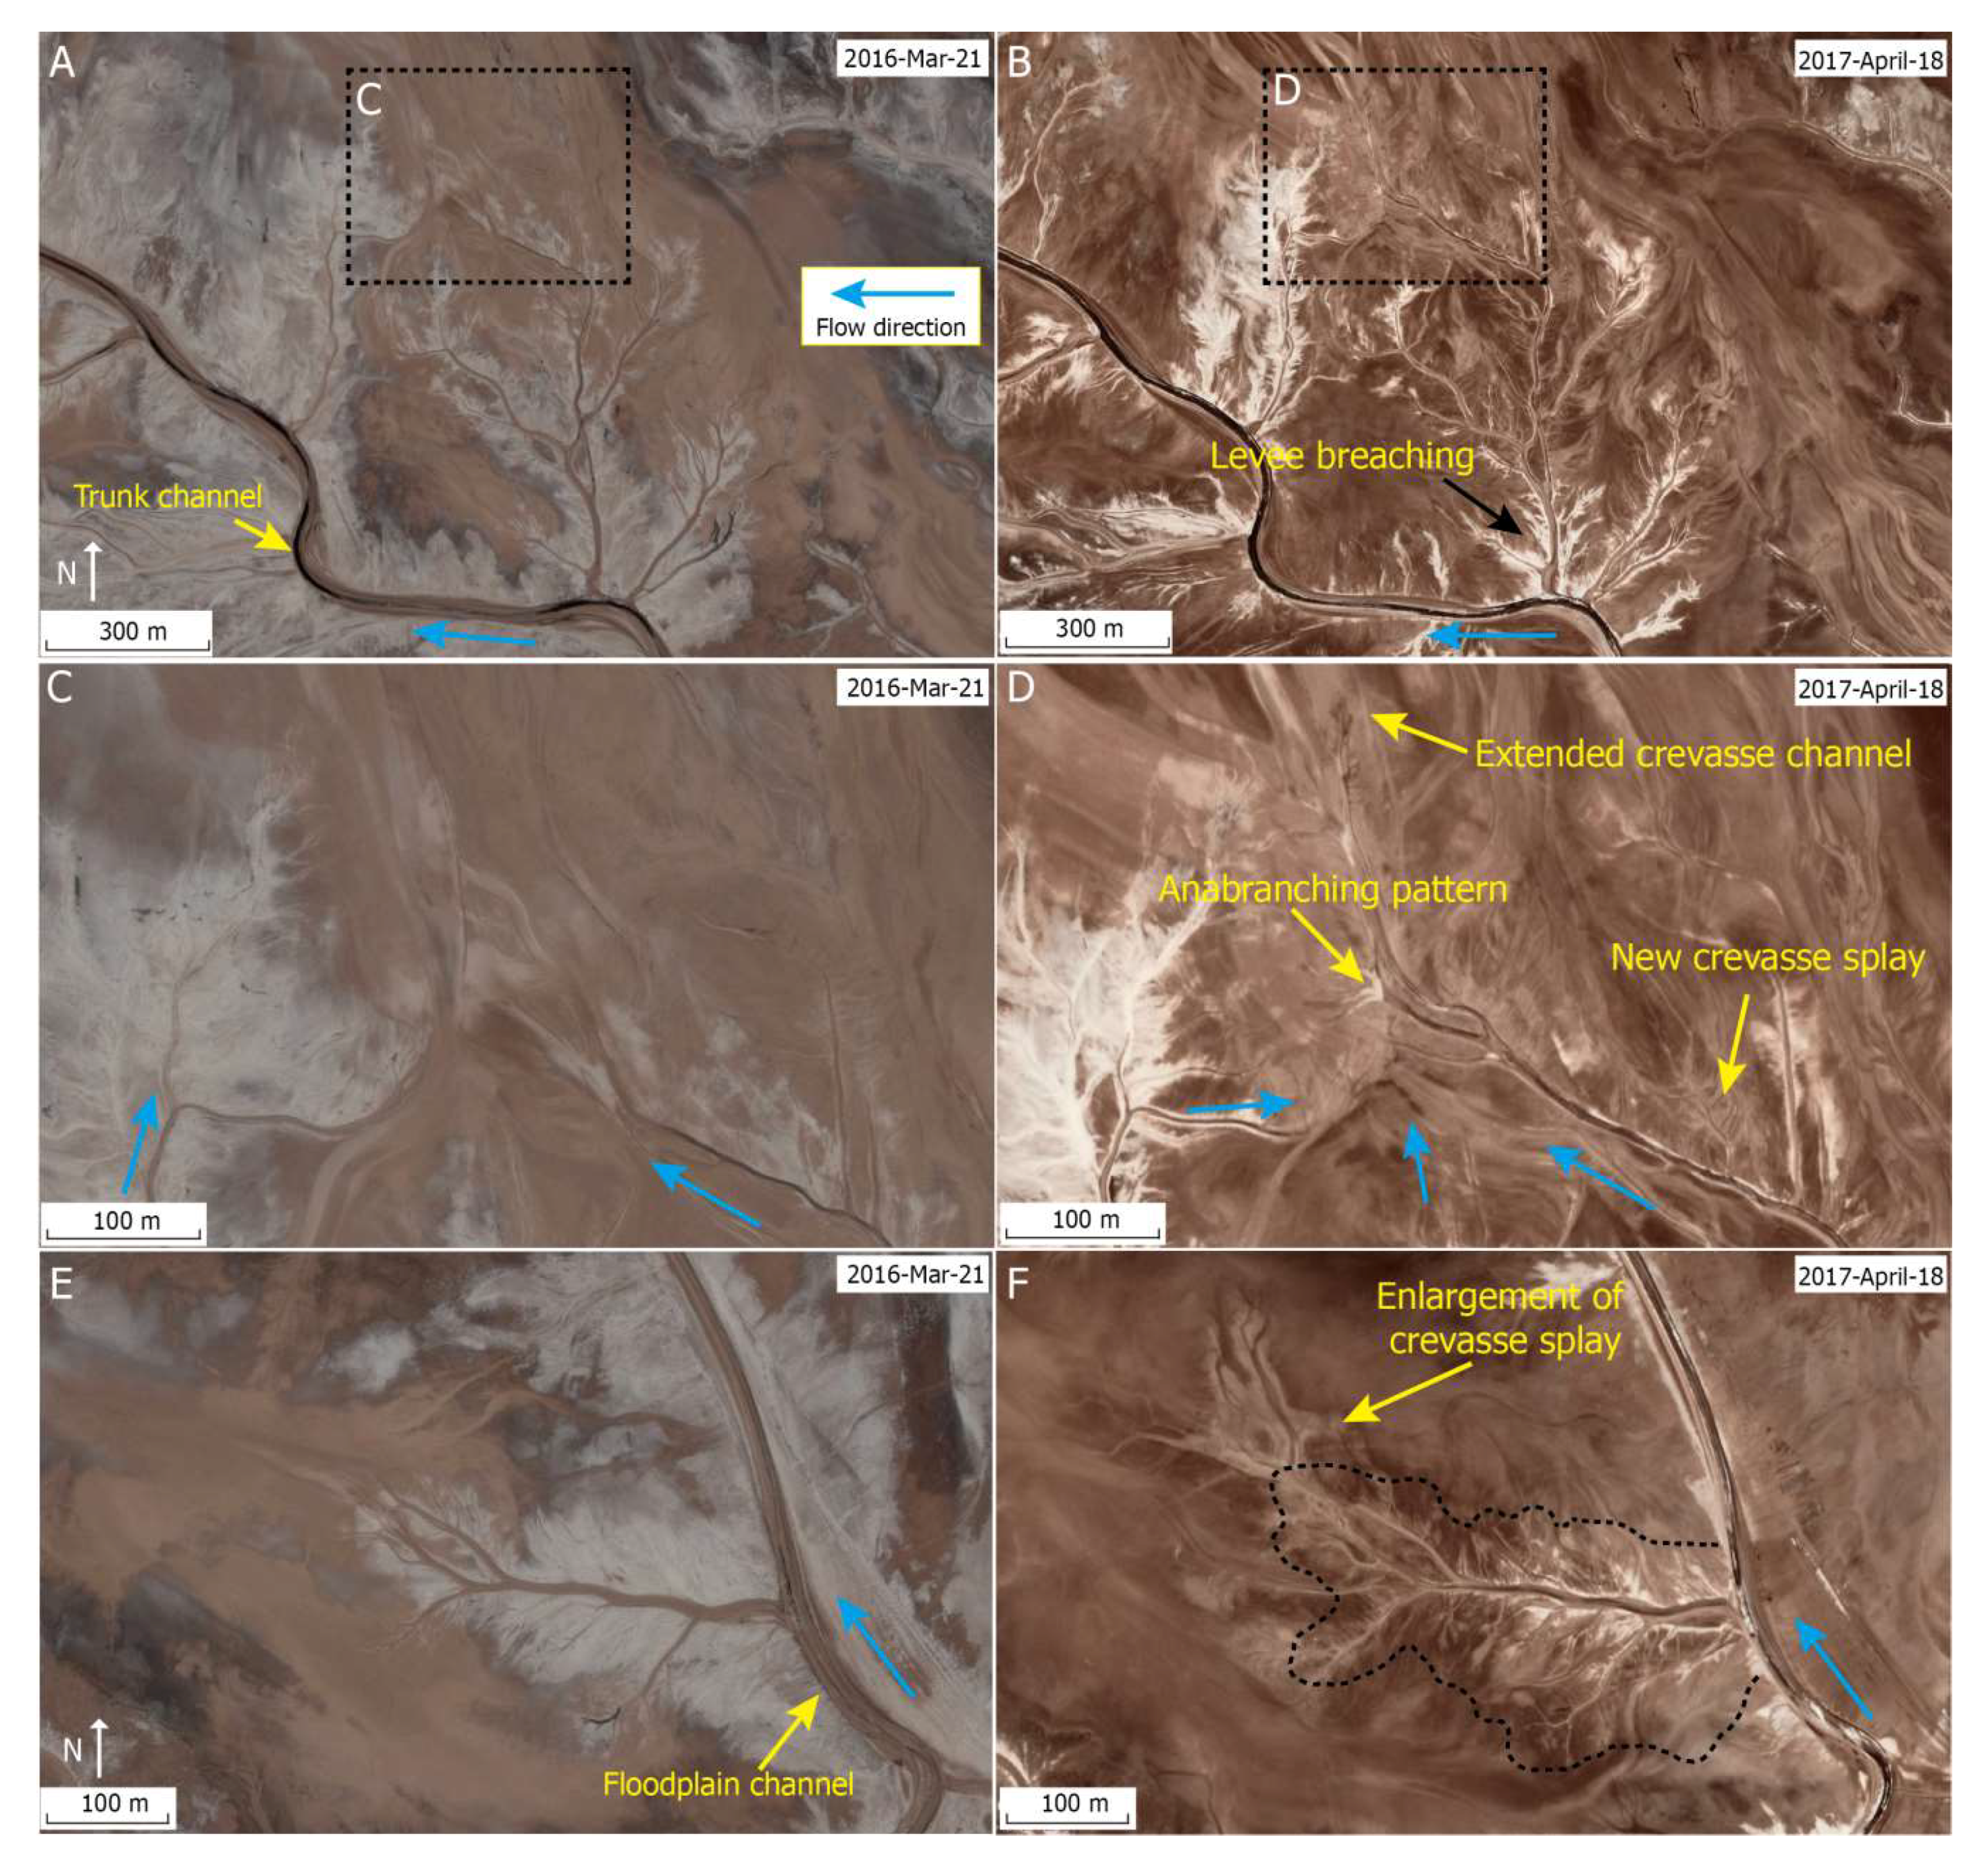
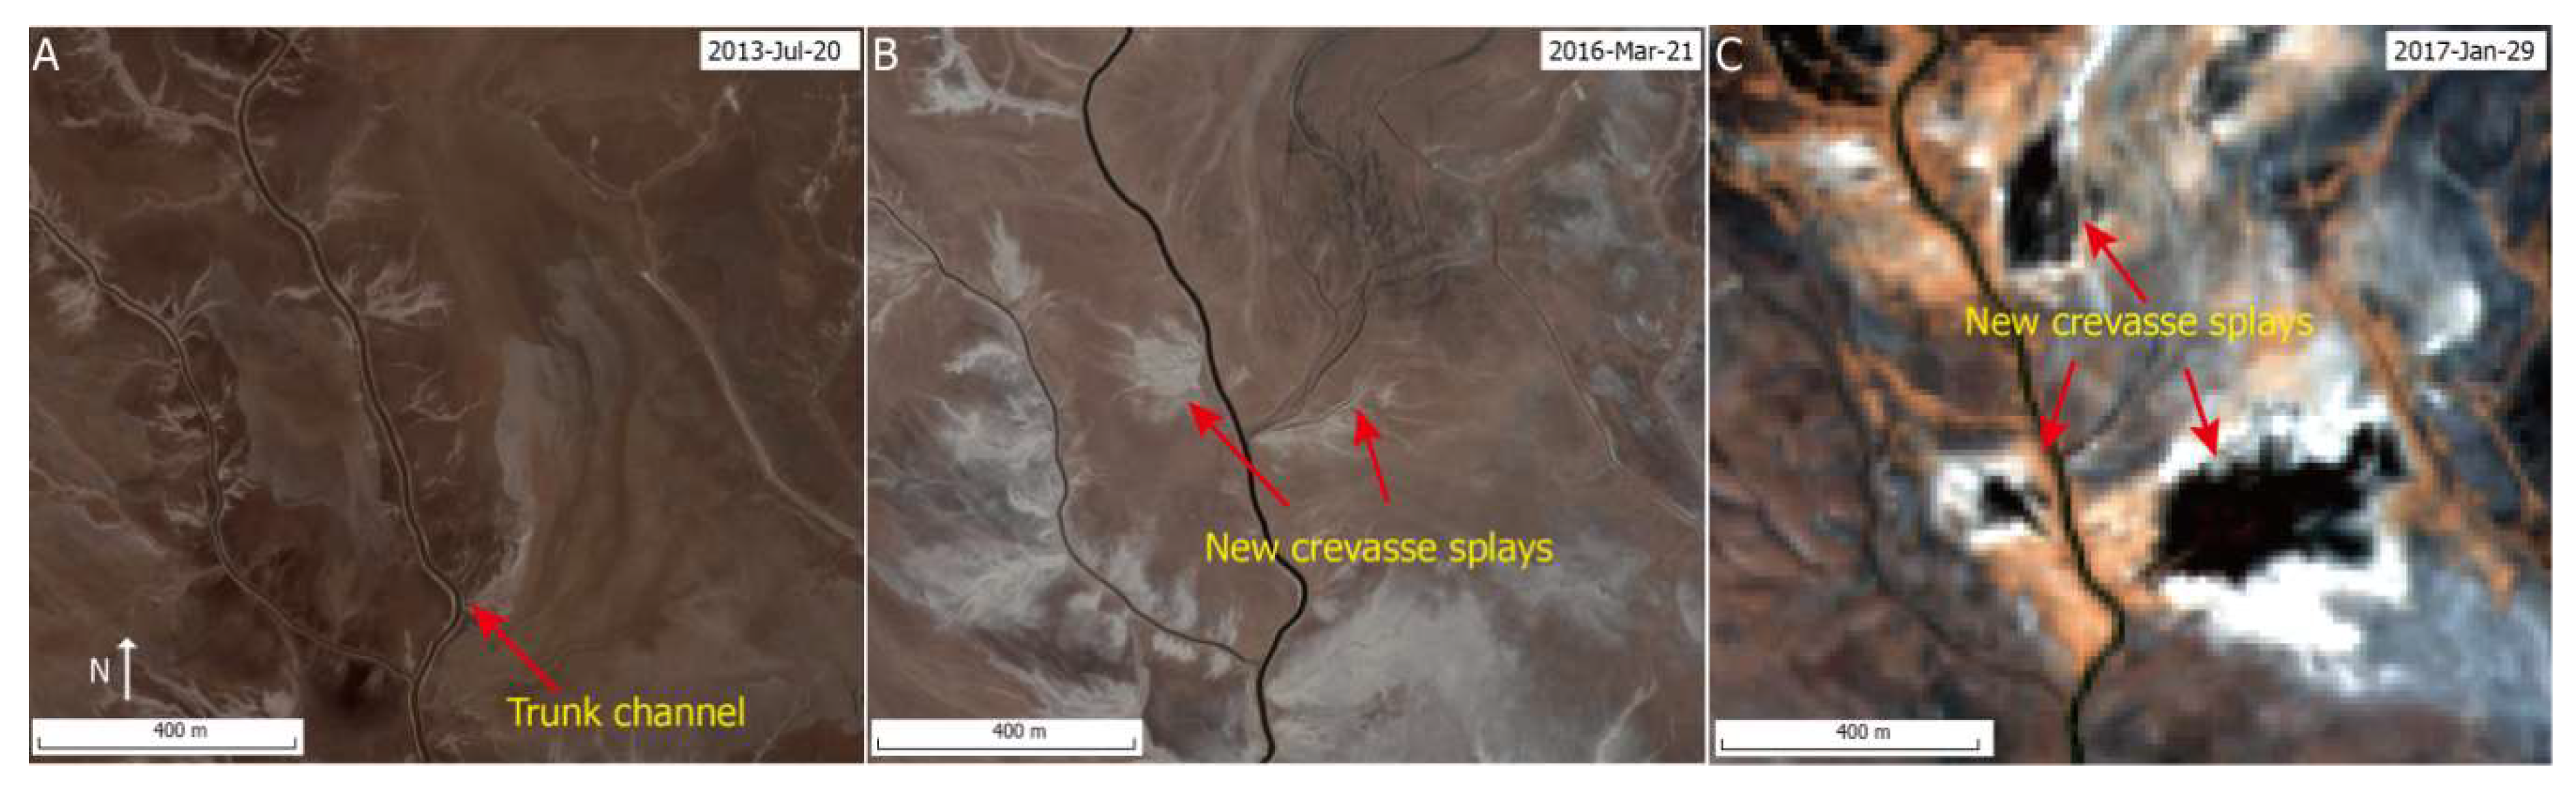
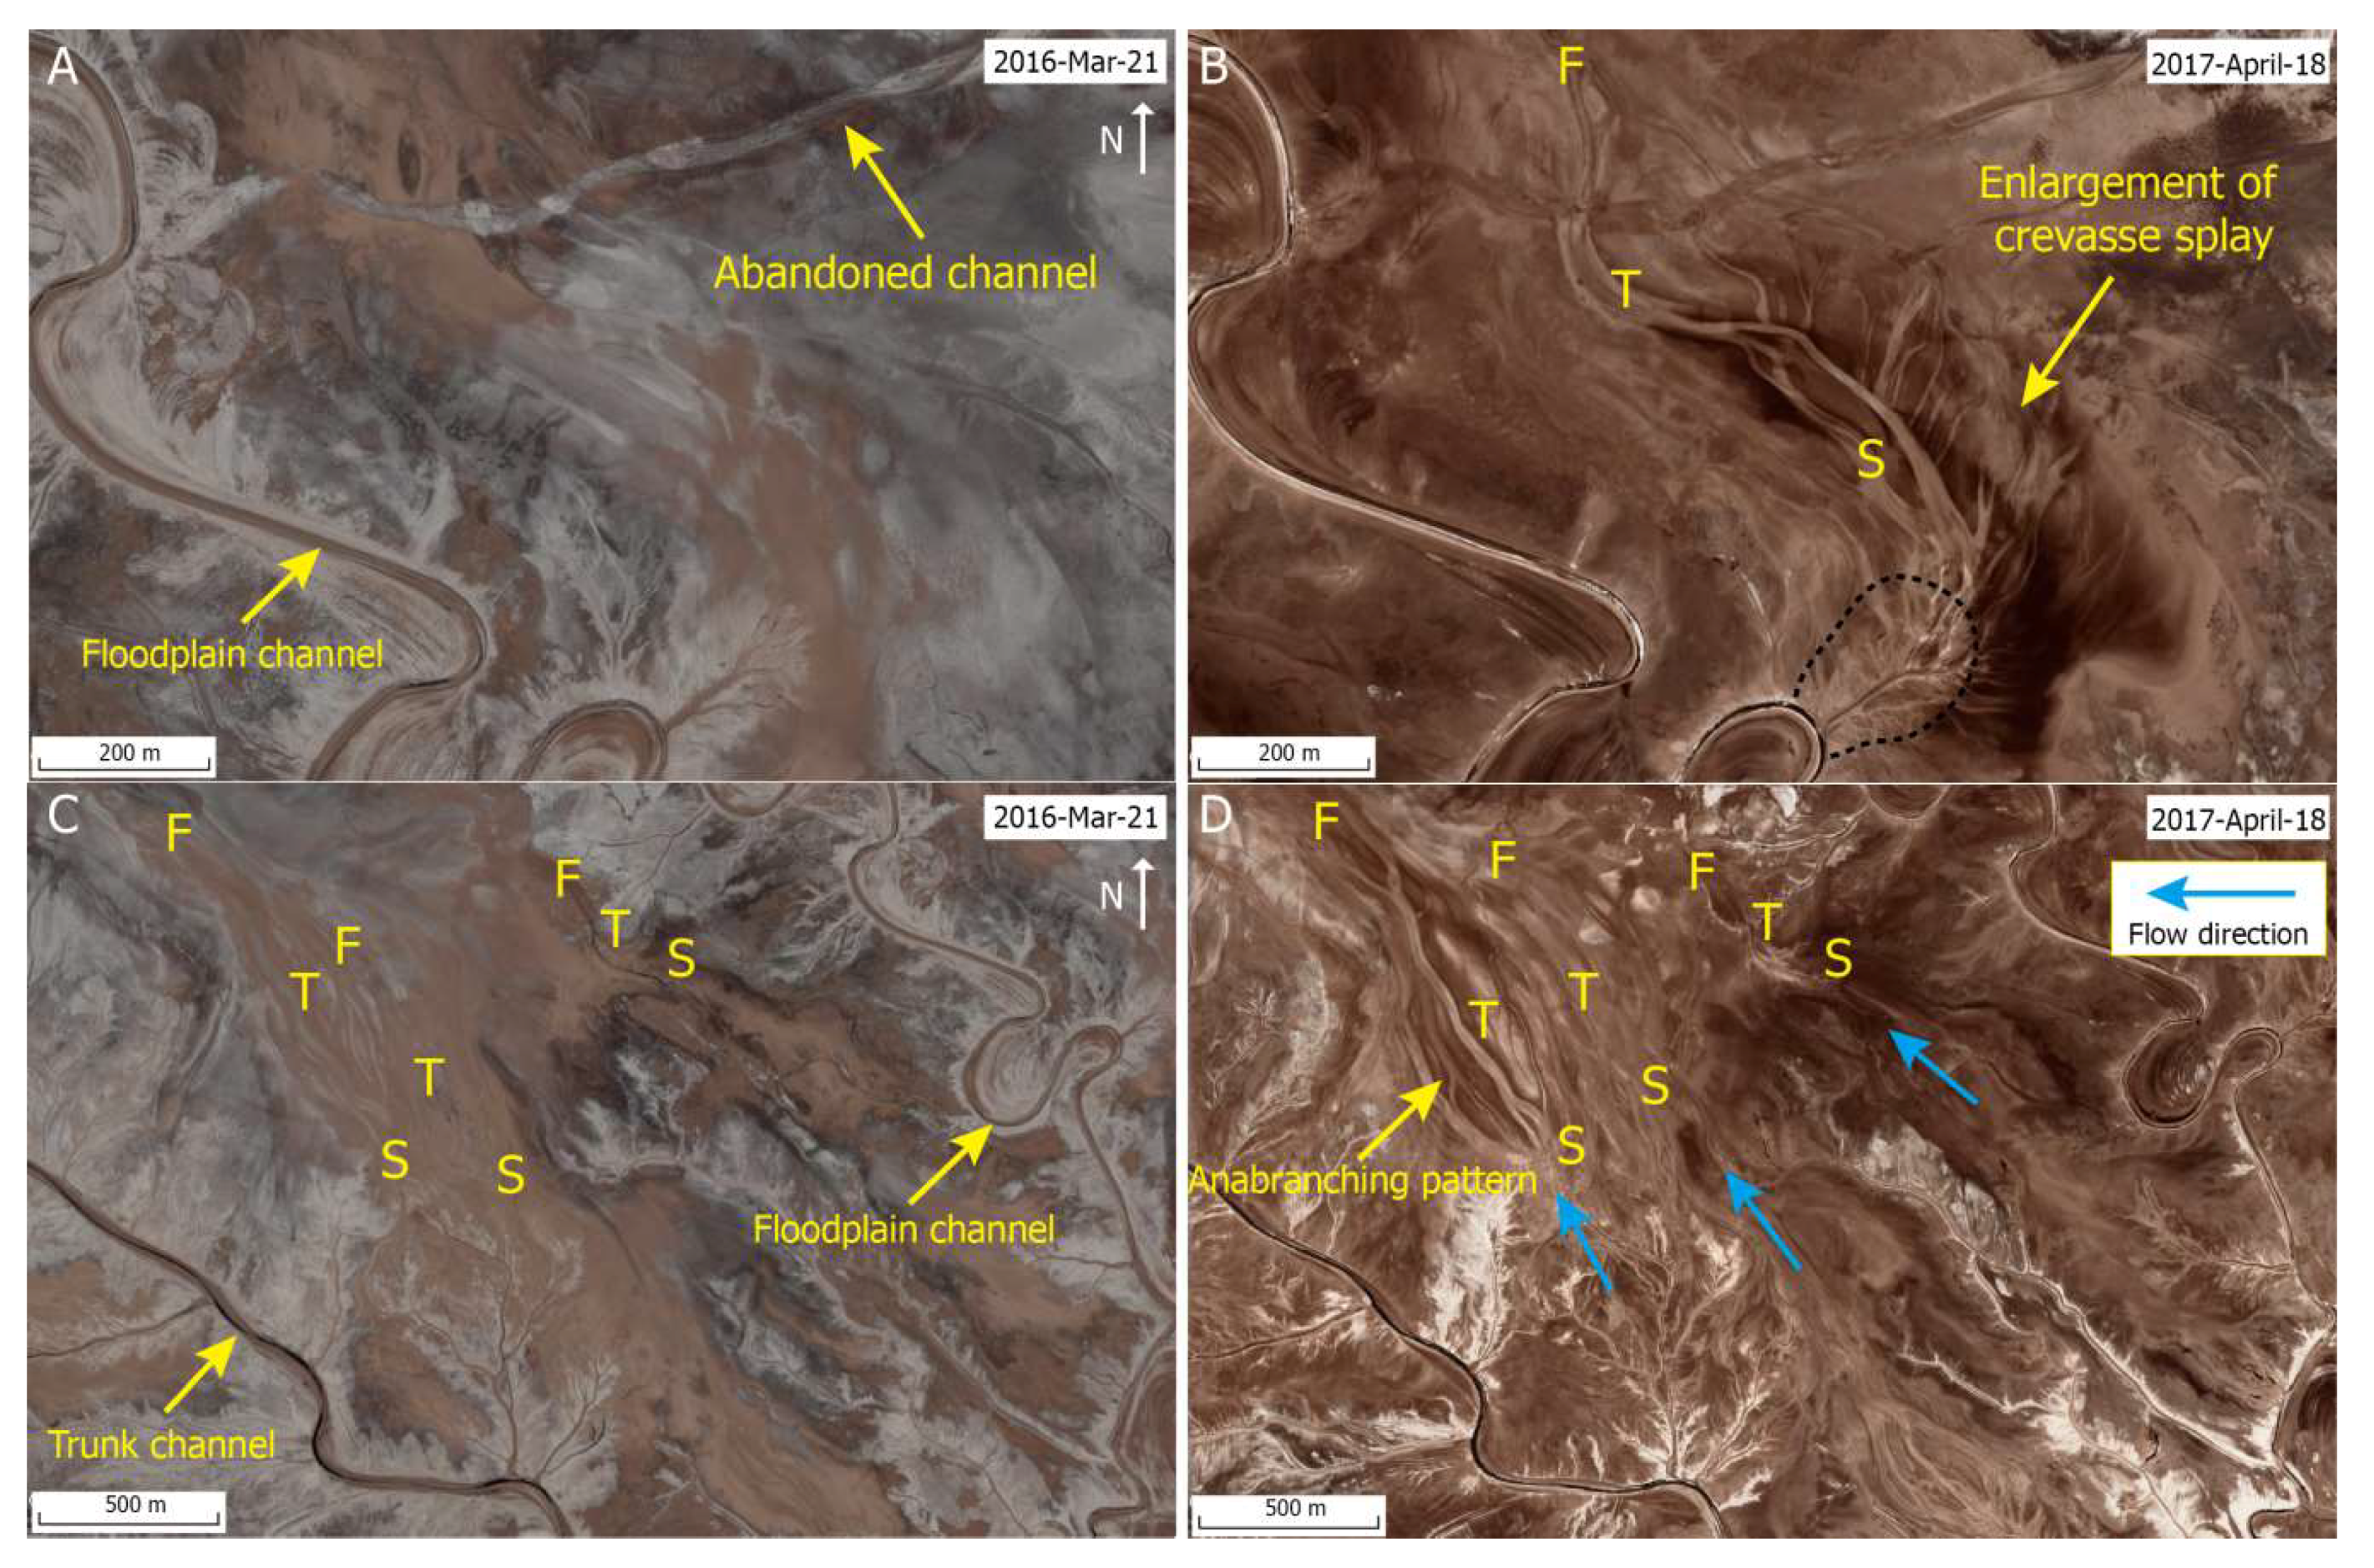
Multi-resolution segmentation thresholding was processed using a Trimble software eCognition Developer 9.4. Sentinel-2 bands with 10 m resolution along with WorldView imagery available on Google Earth were used to visually investigate changes to channel and floodplain morphology.


