A Comparison of ECV and SMOS Soil Moisture Products Based on OzNet Monitoring Network


1
Guangzhou Institute of Geography, Guangzhou 510070, China
2
Key Laboratory of Guangdong for Utilization of Remote Sensing and Geographical Information System, Guangzhou 510070, China
3
Guangdong Open Laboratory of Geospatial Information Technology and Application, Guangzhou 510070, China
4
State Key Laboratory of Resources and Environmental Information System, Institute of Geographic Sciences and Natural Resources Research, Chinese Academy of Sciences, Beijing 100101, China
5
Jiangsu Center for Collaborative Innovation in Geographical Information Resource Development and Application, Nanjing 210023, China
*
Author to whom correspondence should be addressed.
Remote Sens. 2018, 10(5), 703; https://doi.org/10.3390/rs10050703
Submission received: 8 April 2018
/
Revised: 26 April 2018
/
Accepted: 3 May 2018
/
Published: 4 May 2018
Abstract
:Soil moisture is an essential variable in many hydrological and meteorological models. Spatially continuous soil moisture datasets are important for understanding water cycle and climate change. Currently, satellite-based microwave sensors have been the main resources for obtaining global soil moisture data. This paper evaluates the performance of different soil moisture products from the combined Essential Climate Variable (ECV) and Soil Moisture and Ocean Salinity (SMOS) satellite against the stations within the OzNet soil moisture networks over southeastern Australia. SMOS soil moisture products obtained from two versions (ascending and descending) were included. The evaluations were carried out at both network and site scales. According to the validation results, the ECV products outperformed the SMOS products at both scales. Comparing the two versions of the SMOS products, the SMOS ascending product generally performed better than the SMOS descending product and obtained comparable accuracy to the ECV product at Kyeamba and Yanco sites. However, the SMOS ascending performed poorly at the Adelong sites. Moreover, the ECV product has less data gaps than the SMOS products, because the ECV products were developed by combining passive and active microwave products. Consequently, the results in this study show that the combined ECV product is recommended, as both accuracy and integrity of the soil moisture product are important. The SMOS ascending product is recommended between the two overpass versions of SMOS products.

1. Introduction
Soil water is a key variable in the global water cycle, and is a significant medium for energy exchange between the surface of the land and the atmosphere [1,2,3,4]. Continuous soil moisture data are important for drought monitoring, estimation of agricultural production, and are of fundamental importance to many hydrological and land surface models [5,6,7]. The soil moisture content is the quantity of water contained in soil. It can be measured on a volumetric or mass (gravimetric) basis. Typically, gravimetric methods or ground-penetrating sensors are used to measure in situ water content. The gravimetric method is to weigh the soil sample before and after drying. The water mass is the difference between the weights of the wet and oven dried samples [8]. However, this method is time-consuming, and acquiring near-real-time soil moisture information is impossible in this way. Ground-penetrating sensors are most frequently made with resistance block sensors, tensiometers, heat dissipation sensors, neutron probes, time-domain reflectometers (TDR), frequency-domain reflectometers (FDR), and capacitance [9]. These in situ sensors can continuously monitor the soil water content automatically, and are often used to monitor soil moisture continuously in agricultural and hydrological applications. However, a field site only can acquire representative soil moisture information at its location. Widespread and spatially continuous measurement of soil moisture is essential, but this capability does not exist for field site measurements.
Satellite remote sensing techniques have provided possibilities for global measurement of soil moisture [10,11,12,13]. Satellites with microwave sensors are used for soil moisture detection because of the large contrast between the dielectric constant of soil and water at microwave bands [14,15]. Estimation of soil moisture content based on remote sensing techniques began in the mid-1970s, shortly after the development of satellite remote sensing techniques [16]. Since then, many algorithms and products have been developed based on active microwave (AMW) and passive microwave (PMW) remote sensing methods [6,10,17]. Previous evaluations indicated that soil moisture retrieval at a frequency of about 1.4 GHz (L-band), such as from the Soil Moisture and Ocean Salinity (SMOS) and Soil Moisture Active passive (SMAP) satellites, have better agreement with in situ measurements than those at X-band (i.e., AMSR-E, AMSR2, and TMI) and C-band frequencies (i.e., AMSR-E, AMSR2, ASCAT, ERS, and WindSat) [2,14,18,19,20,21,22]. This is because that the L-band frequency—1.4 GHz—has a better capacity to penetrate vegetation than the higher microwave frequencies of C-band (6.9 GHz) and X-band (10.7 GHz). In addition, observations at the lower-frequency L-band microwave frequency generally penetrate the soil profile to a greater depth than the C- and X-band microwaves, typically up to 5 cm depth [16]. The PMW and AMW sensors can make observations under nearly any weather condition, however, both sensors have limitations [23]. For example, PMW observations can be affected by radio frequency interference (RFI), which may prevent surveying over large areas; AMW observations can be degraded by areas of vegetation, which could have an impact on the interpretation of AMW observations [14]. Combining active and passive microwave soil moisture products, in theory, should produce better performance than any single sensor products [15]. This study concentrates on the combined Essential Climate Variable (ECV) and SMOS soil moisture products. The SMOS products are the first soil moisture data from satellite-based passive L-band microwave systems, and are acknowledged to open up the possibility of soil moisture observations from L-band data [17,20]. The combined ECV product has merged products from passive and active microwave sensors to fill data gaps and improve data quality [16]. Evaluation and assessment of satellite-based soil moisture products are fundamental for their applications, and are particularly helpful for understanding and improving the quality of satellite-based soil moisture products. However, due to the availability of in situ measurements, most validations have been conducted in the United States and Europe. A few studies have been conducted over Asia, such as over the Tibetan Plateau and South Korea [1]. There is still a requirement for validations over other parts of the world.
The newly released SMOS level 3 (L3) products use a multi-orbit (MO) soil moisture retrieval algorithm. Compared with the SMOS level 2 (L2) product, which was produced by using a single-orbit (SO) algorithm, the SMOS L3 products are improved by the number of successful retrievals at the border of the swath. The effects of the vegetation optical thickness (VOT) and the RFI of SMOS L3 are reduced by adding more constraints in the retrieval process [24,25]. Although previous versions of SMOS L3 products (e.g., V2.45, V2.48, V2.72) have been validated against in situ measurements or compared with land data assimilation system estimates [14,18,24], the accuracy of the latest version (V3.10) of SMOS L3 soil moisture products, which was updated in July 2016, remains to be evaluated at local sites.
The objective of this study is to evaluate the ECV and SMOS L3 (V3.10) soil moisture products using in situ measurements of the OzNet monitoring network over southeastern Australia. In this study, we compared the ECV products with two versions of SMOS products (ascending and descending) at two scales. First, the soil moisture products were directly compared to in situ measurements of individual sites. Then, evaluations were conducted at an area-average scale considering the scale mismatch between the individual sites and the pixels of satellite-based measurements of soil moisture content. A comparison between the two SMOS overpass versions is also examined. Additionally, the data gaps of these soil moisture products were calculated and compared.
2. Data and Methods
2.1. Study Area and In Situ Soil Moisture Data
The evaluation study was carried out at the Adelong, Kyeamba, and Yanco soil moisture monitoring networks, which belong to the OzNet hydrological monitoring network, which is within the Murrumbidgee River catchment in New South Wales, Australia (Figure 1). Figure 1b,d show the elevation and terrain slope of derived from the digital elevation model (DEM) data with spatial resolution of 1 arc-second (approximately 30 m) from the Shuttle Radar Topography Mission (SRTM). Figure 1c,e present the average elevation and slope for each grid of 0.25° × 0.25°. In situ measurement data are obtained from the website of OzNet hydrological monitoring network (http://oznet.org.au/) [26]. The dataset is available from September 2001 to the present day. There are a total of 30 soil moisture-monitoring sites split between the 3 networks that were used for validation of the satellite-based soil moisture products in this study (Table 1). The dataset includes soil moisture at 0–5 (or 0–8), 0–30, 30–60, and 60–90 cm depths. Considering that satellites with microwave sensors can only detect surface layer soil moisture, we used the in situ measurements at the topsoil layer (0–5 cm or 0–8 cm) for the evaluation.
2.2. Remote Sensing Soil Moisture Products
2.2.1. SMOS
The Soil Moisture and Ocean Salinity (SMOS) satellite was launched in 2009 as part of the European Space Agency (ESA)’s Earth Explorer program [27]. The goal of the SMOS mission is monitoring surface soil moisture with a target accuracy of 0.04 m3/m3. The satellite revisit time is between 1 and 3 days, and the entire Earth’s surface is covered by the SMOS field of view every 3 days. The SMOS L3 products are generated at 1 day intervals at a global extent, and are provided on a 0.25° spatial resolution. We obtained the SMOS L3 RE04 products, version 3.10, from the SMOS Data Center (http://www.catds.fr/sipad). The daily 0.25° grid resolution SMOS Level 3 products include both ascending (morning—about 6:00 a.m.) (SMOSA) and descending (evening—about 6:00 p.m.) (SMOSD) overpasses. These two different versions allow for comparison between the different SMOS products. In this study we used the datasets from January 2010 to May 2011.
2.2.2. ECV
The Essential Climate Variable (ECV) soil moisture product was developed as a part of European Space Agency’s (ESA) Water Cycle Multi-mission Observation Strategy (WACMOS) and Soil Moisture Climate Change Initiative (CCI) projects [16]. The ECV soil moisture products span almost 40 years (from 1978 to the present day) on a daily basis and at a spatial resolution of 0.25° × 0.25°. The input data have been continuously upgraded by including new sensors, through algorithmic updates and sensor intercalibration efforts. The combined ECV product merges various single-sensor (including active and passive microwave sensors) soil moisture products into a harmonized record by combining the strengths of the individual products [15,16,28]. In this study, we used the combined ECV soil moisture product v02.2, available from http://esa-soilmoisture-cci.org. The products are provided at a daily interval and in volumetric units (m3/m3). The products from 1 January 2010 to 31 May 2011 are obtained for evaluation for consistency with the time range of SMOS products and OzNet soil moisture network data.
2.3. Methods
Conclusions may be biased due to the scale mismatch between the in situ sites and the pixel cell size of satellite-based soil moisture products. Therefore, the coarse-scale ECV and SMOS products are evaluated at two scales. First, we directly evaluated the products based on individual sites; then, the evaluation was carried out at network scale, by calculating the average in situ soil moisture measurements for each site or network and the corresponding pixel-average remote sensing soil moisture observations.
The statistical metrics that are used to evaluate the products include correlation coefficient (R), root mean square error (RMSE), unbiased root mean square difference (ubRMSD), and bias. These error metrics are expressed as follows:
where is the in situ measurement at station i, is the pixel value of the satellite-based soil moisture products at the location of station i, is average value of in situ measurements, and is the average value of the pixel values at the locations of all the stations.
Additionally, as the correlation analysis can be influenced by seasonal variations, we also computed correlation coefficients, RMSE, and ubRMSD for soil moisture anomalies (Rano) [29,30]. The soil moisture anomalies were computed based on a five week (35 day) moving window [2,30]. The soil moisture anomaly at day t () is defined as
where SM(t) is the soil moisture at day t, and the overbar indicates the temporal mean for the 35 day period.
3. Results
3.1. Validation for Individual Sites
To compare the performance of the three satellite-based soil moisture products, we firstly evaluated them at six selected sites (A1, A2, K3, K14, Y6, and Y9), which were randomly selected from two sites within each network. The error metrics at the selected sites are shown in Table 2. The metrics show that at the Adelong sites the ECV product outperformed both SMOS products, with higher R values, lower MAEs, RMSEs, and bias. Similarly, the Rano values at A1 and A2 are higher for the ECV product than those of either SMOS products, whereas the RMSE and ubRMSD for the soil moisture anomalies are lower for the ECV product than those of the SMOS products.
At the Kyeamba sites, the SMOSA product showed higher R values than the ECV product, though after seasonal variation removal, the ECV error metrics were better than the SMOS products; additionally, the RMSEano and ubRMSDano of ECV are also lower than those of SMOSA and SMOSD.
At the Yanco sites, the R, RMSE and ubRMSD error metrics before and after seasonal variation removal for the ECV and SMOS products are similar. The correlation of ECV at Y6 is the highest, and R of ECV at Y9 is lower than that of SMOSA, both before and after seasonal variation removal.
In general, the ECV product performed better than the SMOS products at the selected sites, both before and after the seasonal variation removal. Additionally, when comparing the two versions of SMOS products, the SMOSA is superior to SMOSD products at each selected site.
The temporal behavior of soil moisture at the selected sites was then examined. Figure 2 shows that the ECV soil moisture product shows good correlation with the in situ measurements and an overall match with the temporal variations of the in situ measured soil moisture content at all sites. The SMOSA product also shows good correlation with the temporal variations of in situ measurements at Kyeamba and Yanco, but at Adelong, both SMOS products show bias to the in situ measurements, especially the SMOSD soil moisture product. The ECV products underestimated the in situ soil moisture at Kyeamba, and both versions of the SMOS products show extreme underestimation of the soil moisture content at A2, Adelong. There are many data gaps in the SMOS products; these data gaps are intrinsic in the microwave-sensor-based soil moisture products [5] and are a result of the acquisition orbits and retrieval algorithms used in their calculation. The combined ECV soil moisture products merge various single-sensor (including active and passive microwave sensors) soil moisture products into a harmonized record by combining the strengths of the individual products [15,16,28]; consequently, the percentage of coverage of ECV products has been improved. However, there are still some gaps in the ECV soil moisture product, which are analyzed and discussed in the Section 3.3.
As the suitability of the selected sites is difficult to evaluate, the error metrics at each site were then calculated to further evaluate the performance of the different soil moisture products at the site-scale. The error metrics plotted as box plots are shown in Figure 3; further, the boxplots of Rano, RMSEano, and ubRMSDano are shown in Figure 4. Figure 3 shows that the ECV products at each site generally have higher R values, and smaller values of RMSE, ubRMSD, and bias than the SMOS products. In addition, the bias values at most sites are positive, implying that the soil moisture products overestimate the in situ measurements. Furthermore, the SMOSA product shows better error metrics than SMOSD, with higher R values, and smaller RMSE and ubRMSD.
Analysis of the error metrics of soil moisture anomalies (Figure 4) shows that the results are consistent with the validation results of soil moisture without seasonal removal. The Rano values of ECV product are generally higher than those of the SMOS products, and the ECV product also has lower RMSEano and ubRMSDano values than the SMOS products. In terms of the two overpass versions of SMOS products, the SMOSA performs better than SMOSD product.
In summary, at the individual site scale, the ECV product generally performs better than the SMOS products, and the SMOSA version outperforms the SMOSD version product.
3.2. Validation for the Network Scale
Since there is a scale mismatch between the in situ measurements and the pixels of satellite-based soil moisture observations, we further evaluated the soil moisture products at the network scale. The error metrics of soil moisture before and after seasonal variation removal were calculated based on the site-averaged in situ and satellite-estimated soil moisture content within in each network (Table 3). At Adelong, the ECV obtained better results than both the SMOS products for all error metrics, with Rano and ubRMSDano of 0.52 and 0.03 m3/m3, respectively. For the Adelong network, the SMOS soil moisture products are clearly less accurate than the ECV products. For the Kyeamba network, although the SMOSA produced the highest correlation (R = 0.79), the other error metrics were better for the ECV product. In contrast, at Yanco, the error metrics for the ECV product were generally better than those of the SMOS products.
At the network scale, the ECV product generally performed better than the SMOS soil moisture products. Comparison of the two SMOS products shows that although the SMOSA achieved lower accuracy at Adelong, it gave better correlation and lower RMSE and ubRMSD error metrics than SMOSD at Kyeamba and Yanco. As a result, the performance of SMOS products varies spatially at different sites, while the ECV soil moisture products achieved relatively consistent correlations with the in situ measurements.
Figure 5 presents the Taylor diagrams that show the correlation coefficients (R), standard deviations (SD), and root mean standard deviations (RMSD) between the three soil moisture products and in situ soil moisture content over the three networks. Overall, the ECV product has a higher correlation with in situ measurements than the SMOS products. The SD and RMSD of ECV product are lower than those of SMOS products, and are closer to the in situ measurements. This also indicates that higher internal variations exist in the SMOS products.
The temporal behavior of measured and satellite-based soil moisture content at the network scale during the entire period was also examined (Figure 6). The ECV product accurately captured the temporal changes of the in situ measured soil moisture for the three networks. The SMOSA product also captures the temporal soil moisture variations at Kyeamba and Yanco. However, the SMOSD product greatly deviated from the in situ measured values at these two networks. In addition, the two SMOS products performed poorly, replicating the in situ soil moisture at Adelong, although the SMOSA product had higher correlations with the in situ values than the SMOSD. Overall, the SMOSA performed better than the SMOSD. This is consistent with the general consensus that morning observations are more accurate than those later in the day, due to the difference in temperature between vegetation canopy and soil surface being at a minimum [14].
3.3. Data Gaps in the Satellite-Based Soil Moisture Products
Data gaps commonly exist in microwave-sensor-based remote sensing soil moisture products [5,16] for a variety of reasons. The analyses in Section 3.1 show that there are many data gaps in the three soil moisture products. In this section, we calculated the percentage of data gaps for each product from 1 January 2011 to 31 December 2012 over Australia (Figure 7). The percentage of data gaps of ECV products in eastern Australia is generally below 20%. Over Western Australia, the percentage of data gaps in ECV products is about 50%. The SMOSA and SMOSD products generally have 50–60% data gaps across the Australia continent. The ECV soil moisture products are a combination of various single-sensor AMW and PMW soil moisture products. Therefore, the merged products generally outperformed the single-sensor products. According to the analysis above, the ECV soil moisture products not only performed better than the SMOSA and SMOSD products, but also have lower percentage of data gaps.
The satellite microwave sensors only detect surface layer soil moisture because of the limited penetration depths of the microwave signal [31,32,33]. However, the installation depths of the in situ probes are typically 0–5 cm at the top soil layer. Soil moisture content varies greatly from the top soil to root zone layers [34,35,36], especially in arid and semi-arid regions [37]. Consequently, satellite-based products fail to detect root-zone soil water content, and this gap in penetration depth may explain some of the discrepancies between the remotely sensed soil moisture products and the in situ measurements.
Although the observation time of satellites is instantaneous, the revisit time of these polar orbiting satellites could be at least 1 day, whereas there are continuous measurements at the in situ sites. As the top soil layer water content can vary greatly from morning to evening, these observation time gaps could also lead to uncertainties in comparison between in situ measurements and satellite-based soil moisture products.
The satellite-based soil moisture data, in general, have a coarse spatial resolution of 0.25° × 0.25°. Although they are valuable for understanding the water cycle and energy exchange between the land surface and the atmosphere, their coarse spatial resolution makes them unsuitable for regional application involving hydrology, water resources management, and agriculture. This scale mismatch could also give rise to uncertainties in validation of satellite-based soil moisture products [2]. The ground-based in situ soil moisture sites are point-scale data only measure the soil water content at the locations of individual sites. Soil moisture content has great spatial heterogeneity both vertically and horizontally. For example, the terrain and landcover types within the pixel covering the Adelong sites are spatially variable, the area covered by one pixel of the remotely sensed soil moisture products is about 625 km2, and the in situ sampling point density in the Adelong network is about 1 point per 125 km2. Additionally, the distribution of soil water within the area of pixel cell could vary considerably. Thus, the direct validation based on in situ measurements is uncertain.
4. Discussion
This study examined the ability of ECV and SMOS soil moisture products to represent surface soil moisture measurements and the temporal variations over southeast Australia. The evaluation results indicate the ECV soil moisture product outperforms the SMOS product, both for soil moisture and the anomalies. This is consistent with previous validation studies over the Tibetan Plateau and southwest China [2,18]. Previous studies [24,38] show that RFI can lead to great bias and noise in the SMOS products, especially over Central and East Asia. The RFI-filtered SMOS L3 products for this study were shown in the study of Al-Yaari et al., to have an average probability of RFI occurrences of less than 0.1 from 2010 to 2012 in Australia [24]. This indicates that RFI may have little effect upon the unfavorable performance in the study region.
The results of this study show that the SMOSA product performed better than the SMOSD product. Al-Yaari et al. showed that the SMOSA product gave a better correlation to soil moisture content when compared with the SMOSD product over many parts of the world [24]. Zeng et al. also support these findings in that SMOSA soil moisture products outperformed SMOSD soil moisture products over Tibetan Plateau [18]. However, the opposite conclusion was drawn by Su et al. [39]. A possible explanation for this is that a previous version of the SMOS product (Version RE01) was used, and the RFI was not removed in that study. RFI, however, has a larger influence on SMOSA than the SMOSD products within Australia [24].
Validation results reveal that the ECV and SMOS soil moisture products at Yanco are closer to the in situ measurements than those at Adelong and Kyeamba, and the worst performance can be found in Adelong. Figure 8 displays the soil texture, and land cover types within the study area, where significant differences in landscapes occur between the three network locations. According to Leroux et al., the forest fraction has a great impact on SMOS errors in Australia, especially near the coasts where forest occurs [38]. Table 1 and Figure 8 show that the Kyeamba network is located in an area of gentle slopes with mixed grassland and cropland, the Yanco network is located in a plain with mixed grassland and cropland. The metadata of the OzNet sites did not include land cover and soil texture information, which is shown in Figure 8. The land cover map was derived from the GlobCover 2009 obtained from the European Space Agency (ESA) GlobCover project [40], and the soil texture map was derived from the Harmonized World Soil Database (HWSD) v1.2 [41]. The forest fraction of the satellite pixel where the Adelong sites are located is about 40%, according to Figure 8a, which shows that the vegetation cover at the five Adelong sites are grassland and cropland. This demonstrates that representing the soil moisture of the pixel with the Adelong sites may be problematic. The soil texture map shows that the Yanco and Kyeamba network locations generally have homogenous soil types of loamy sand and sandy loam, respectively. The soils at the Adelong network are mixed with sandy loam and sandy clay loam, with the sand percentage in the soil decreasing from west to east. The percentage of sand, as was pointed by Leroux et al., has a negative influence on SMOS product error for Australia [38]. The SMOS products have a high dry bias at the Adelong sites, which is possibly due to the influence of the vegetation types being greater than that of soil texture in the study area.
Another reason relating to the dry bias of Adelong sites is the impacts of terrain slope and sunglint. The reflected solar radiation from the land surface in near the specular direction (sunglint) can cause warm biases in brightness temperature (BT) and therefore result in dry bias in soil moisture [42,43]. However, because sunglint was assumed to be a specular reflection, it is less reflective over land surface than the ocean. Thus, the magnitude of sunglint was often ignored over land in SMOS soil moisture retrieval algorithm. However, simulations conducted by He et al. indicates that stronger sunglint can be viewed from larger slopes because local solar incident angle can be significantly changed by the terrain slope [44]. The SMOS L3 soil moisture is made over a range of incidence angles (0 to 55°). This multiangled measurement may be highly influenced by the terrain slope [45]. The terrain slope of the pixel which the Adelong sites are located is larger than 9°, according to Figure 1e. This large terrain slope can change the local incident angle and make sunglints visible, further leading to more bias. Moreover, when considering ascending overpasses over a given point in Australia, the SMOS has a trajectory from south to north, therefore, the view direction of SMOS ascending overpasses over Australia ranges from southeast to northeast. Conversely, for descending overpasses over the same area, the view direction of SMOS ranges between northwest to southwest. Figure 9a displays the terrain aspects derived from DEM of 30 m spatial resolution within the pixel of Adelong sites. Figure 9b illustrates the statistics of the percentage of aspects at each direction. According to Figure 9, the terrain aspects within the pixel of Adelong sites are mainly northeast and east, therefore, stronger sunglint may be viewed in the specular direction by SMOS ascending overpasses than descending overpasses. This may help to explain why SMOS ascending soil moisture has much stronger dry bias than the descending retrievals at Adelong.
As discussed above, and in the analysis of data gaps in Section 3.3, the lack of near-real-time availability and data gaps in time and space largely reduce the potential value of the current satellite-based soil moisture products in multiple practical applications. The mismatch of spatial scales and measuring depths between in situ sites and satellite data pixels would lead to the uncertainties of ground-based validation of the satellite-based soil moisture products. Thus, further research is needed to fill the data gaps and develop a new validation scheme for satellite soil moisture products.
5. Conclusions
Soil moisture is a significant variable of hydrology and land surface process. Remote sensing of soil moisture is a fundamental issue in land surface remote sensing and validation of remote sensing soil moisture products is essential for improving the development of estimation algorithms of soil moisture. In this study, we evaluated the ECV and SMOS L3 soil moisture products over southeast Australia based on data from the OzNet soil moisture measurements network.
The ECV products generally gave a better correlation and more closely matched the temporal variation of in situ moisture measurements than either of the SMOS products in the study area. The ECV products were also found to overestimate the soil moisture levels within the three networks, while the SMOS products tend to underestimate the soil moisture at Adelong and overestimate the soil moisture at Yanco. Comparison of the two overpasses of SMOS products showed that the morning retrievals gave better correlations than those in the evening and produced results comparable with the ECV product at Kyeamba and Yanco. However, the SMOSD product gave better correlations at Adelong.
The data gaps of the three soil moisture products were examined. The ECV products generally have less data gaps than SMOS products because of the combination of various single-sensor soil moisture data. This study only focuses on three in situ soil moisture networks in southeast Australia; they may not reflect the product accuracy in other areas. Therefore, it is important that such similar careful analyses can be conducted at other networks.
Author Contributions
W.J. and J.S. conceived and designed the experiments; X.Z. performed the experiments; W.J. and J.S. analyzed the data; W.J. wrote the paper.
Acknowledgments
This work was jointly supported by the GDAS’ Special Project of Science and Technology Development (2017GDASCX-0101, 2018GDASCX-0904); Guangdong Innovative and Entrepreneurial Research Team Program (2016ZT06D336); the National Natural Science Foundation of China (41401430); National Special Program on Basic Works for Science and Technology of China (2013FY110900); State Key Laboratory of Resources and Environmental Information System (O88RA20CYA); the 13th Five-year Informatization Plan of Chinese Academy of Sciences (No.XXH13505-07); and the National Earth System Science Data Sharing Infrastructure (http://www.geodata.cn/).
Conflicts of Interest
No potential conflict of interest was reported by the authors.
References
- Peng, J.; Loew, A.; Merlin, O.; Verhoest, N.E.C. A review of spatial downscaling of satellite remotely sensed soil moisture. Rev. Geophys. 2017, 55, 341–366. [Google Scholar] [CrossRef]
- Peng, J.; Niesel, J.; Loew, A.; Zhang, S.; Wang, J. Evaluation of Satellite and Reanalysis Soil Moisture Products over Southwest China Using Ground-Based Measurements. Remote Sens. 2015, 7, 15729–15747. [Google Scholar] [CrossRef]
- Seneviratne, S.I.; Davin, E.; Hirschi, M.; Mueller, B.; Orlowsky, B.; Teuling, A. Soil Moisture-Ecosystem-Climate Interactions in a Changing Climate. In Proceedings of the AGU Fall Meeting, San Francisco, CA, USA, 5–9 December 2011. [Google Scholar]
- Houser, P.R.; Shuttleworth, W.J.; Famiglietti, J.S.; Gupta, H.V.; Syed, K.H.; Goodrich, D.C. Integration of soil moisture remote sensing and hydrologic modeling using data assimilation. Water Resour. Res. 1998, 34, 3405–3420. [Google Scholar] [CrossRef]
- Cui, Y.; Long, D.; Hong, Y.; Zeng, C.; Zhou, J.; Han, Z.; Liu, R.; Wan, W. Validation and reconstruction of FY-3B/MWRI soil moisture using an artificial neural network based on reconstructed MODIS optical products over the Tibetan Plateau. J. Hydrol. 2016, 543, 242–254. [Google Scholar] [CrossRef]
- Dorigo, W.; de Jeu, R. Satellite soil moisture for advancing our understanding of earth system processes and climate change. Int. J. Appl. Earth Obs. Geoinf. 2016, 48, 1–4. [Google Scholar] [CrossRef]
- Seneviratne, S.I.; Corti, T.; Davin, E.L.; Hirschi, M.; Jaeger, E.B.; Lehner, I.; Orlowsky, B.; Teuling, A.J. Investigating soil moisture-climate interactions in a changing climate: A review. Earth-Sci. Rev. 2010, 99, 125–161. [Google Scholar] [CrossRef]
- Klute, A. Methods of soil analysis. Part 1. Physical and mineralogical methods. Methods Soil Anal. Part Phys. Mineral. Methods 1986, 146, 413–423. [Google Scholar]
- Fang, B.; Lakshmi, V.; Bindlish, R.; Jackson, T.J.; Cosh, M.; Basara, J. Passive Microwave Soil Moisture Downscaling Using Vegetation Index and Skin Surface Temperature. AGU Fall Meet. 2012, 12, 1712–1717. [Google Scholar]
- Naeimi, V.; Scipal, K.; Bartalis, Z.; Hasenauer, S.; Wagner, W. An Improved Soil Moisture Retrieval Algorithm for ERS and METOP Scatterometer Observations. IEEE Trans. Geosci. Remote Sens. 2009, 47, 1999–2013. [Google Scholar] [CrossRef]
- Kerr, Y.H.; Waldteufel, P.; Wigneron, J.P.; Delwart, S.; Cabot, F.; Boutin, J.; Escorihuela, M.J.; Font, J.; Reul, N.; Gruhier, C.; et al. The SMOS Mission: New Tool for Monitoring Key Elements ofthe Global Water Cycle. IEEE Proc. 2010, 98, 666–687. [Google Scholar] [CrossRef] [Green Version]
- Wagner, W. Evaluation of the agreement between the first global remotely sensed soil moisture data with model and precipitation data. J. Geophys. Res. 2003, 108, 4611–4620. [Google Scholar] [CrossRef]
- Kellogg, K.; Njoku, E.; Thurman, S.; Edelstein, W.; Jai, B.; Spencer, M.; Chen, G.S.; Entekhabi, D.; O'Neill, P.; Piepmeier, J. NASA’s Soil Moisture Active and Passive (SMAP) Mission. In Proceedings of the 2010 SPIE Remote Sensing Conference, Toulouse, France, 20–23 September 2010. [Google Scholar]
- Yee, M.S.; Walker, J.P.; Rüdiger, C.; Parinussa, R.M.; Koike, T.; Kerr, Y.H. A comparison of SMOS and AMSR2 soil moisture using representative sites of the OzNet monitoring network. Remote Sens. Environ. 2017, 195, 297–312. [Google Scholar] [CrossRef]
- Liu, Y.Y.; Parinussa, R.M.; Dorigo, W.A.; De Jeu, R.A.M.; Wagner, W.; van Dijk, A.I.J.M.; McCabe, M.F.; Evans, J.P. Developing an improved soil moisture dataset by blending passive and active microwave satellite-based retrievals. Hydrol. Earth Syst. Sci. 2011, 15, 425–436. [Google Scholar] [CrossRef] [Green Version]
- Dorigo, W.; Wagner, W.; Albergel, C.; Albrecht, F.; Balsamo, G.; Brocca, L.; Chung, D.; Ertl, M.; Forkel, M.; Gruber, A.; et al. ESA CCI Soil Moisture for improved Earth system understanding: State-of-the art and future directions. Remote Sens. Environ. 2017, 203, 185–215. [Google Scholar] [CrossRef]
- Kerr, Y.H.; Waldteufel, P.; Richaume, P.; Wigneron, J.P.; Ferrazzoli, P.; Mahmoodi, A.; Bitar, A.A.; Cabot, F.; Gruhier, C.; Juglea, S.E.; et al. The SMOS Soil Moisture Retrieval Algorithm. IEEE Trans. Geosci. Remote Sens. 2012, 50, 1384–1403. [Google Scholar] [CrossRef]
- Zeng, J.; Li, Z.; Chen, Q.; Bi, H.; Qiu, J.; Zou, P. Evaluation of remotely sensed and reanalysis soil moisture products over the Tibetan Plateau using in-situ observations. Remote Sens. Environ. 2015, 163, 91–110. [Google Scholar] [CrossRef]
- Griesfeller, A.; Lahoz, W.A.; Jeu, R.A.M.d.; Dorigo, W.; Haugen, L.E.; Svendby, T.M.; Wagner, W. Evaluation of satellite soil moisture products over Norway using ground-based observations. Int. J. Appl. Earth Obs. Geoinf. 2016, 45, 155–164. [Google Scholar] [CrossRef]
- Bitar, A.A.; Leroux, D.; Kerr, Y.H.; Merlin, O.; Richaume, P.; Sahoo, A.; Wood, E.F. Evaluation of SMOS Soil Moisture Products Over Continental U.S. Using the SCAN/SNOTEL Network. IEEE Trans. Geosci. Remote Sens. 2012, 50, 1572–1586. [Google Scholar] [CrossRef] [Green Version]
- Fang, L.; Hain, C.R.; Zhan, X.; Anderson, M.C. An inter-comparison of soil moisture data products from satellite remote sensing and a land surface model. Int. J. Appl. Earth Obs. Geoinf. 2016, 48, 37–50. [Google Scholar] [CrossRef]
- Zhang, X.; Zhang, T.; Zhou, P.; Shao, Y.; Gao, S. Validation Analysis of SMAP and AMSR2 Soil Moisture Products over the United States Using Ground-Based Measurements. Remote Sens. 2017, 9, 104. [Google Scholar] [CrossRef]
- Entekhabi, D.; Njoku, E.; O'Neill, P.; Spencer, M.; Jackson, T.; Entin, J.; Im, E.; Kellogg, K. The Soil Moisture Active/Passive Mission (SMAP). In Proceedings of the 2008 IEEE International Geoscience and Remote Sensing Symposium, IGARSS, Boston, MA, USA, 6–11 July 2008; pp. III-1–III-4. [Google Scholar]
- Al-Yaari, A.; Wigneron, J.P.; Ducharne, A.; Kerr, Y.; de Rosnay, P.; de Jeu, R.; Govind, A.; Al Bitar, A.; Albergel, C.; Muñoz-Sabater, J.; et al. Global-scale evaluation of two satellite-based passive microwave soil moisture datasets (SMOS and AMSR-E) with respect to Land Data Assimilation System estimates. Remote Sens. Environ. 2014, 149, 181–195. [Google Scholar] [CrossRef] [Green Version]
- Al Bitar, A.; Mialon, A.; Kerr, Y.H.; Cabot, F.; Richaume, P.; Jacquette, E.; Quesney, A.; Mahmoodi, A.; Tarot, S.; Parrens, M.; et al. The global SMOS Level 3 daily soil moisture and brightness temperature maps. Earth Syst. Sci. Data 2017, 9, 293–315. [Google Scholar] [CrossRef]
- Smith, A.B.; Walker, J.P.; Western, A.W.; Young, R.I.; Ellett, K.M.; Pipunic, R.C.; Grayson, R.B.; Siriwardena, L.; Chiew, F.H.S.; Richter, H. The Murrumbidgee soil moisture monitoring network data set. Water Resources Res. 2012, 48, 7701. [Google Scholar] [CrossRef]
- Kerr, Y.H.; Waldteufel, P.; Wigneron, J.P.; Martinuzzi, J.; Font, J.; Berger, M. Soil moisture retrieval from space: The Soil Moisture and Ocean Salinity (SMOS) mission. IEEE Trans. Geosci. Remote Sens. 2002, 39, 1729–1735. [Google Scholar] [CrossRef]
- Liu, Y.Y.; Dorigo, W.A.; Parinussa, R.M.; de Jeu, R.A.M.; Wagner, W.; McCabe, M.F.; Evans, J.P.; van Dijk, A.I.J.M. Trend-preserving blending of passive and active microwave soil moisture retrievals. Remote Sens. Environ. 2012, 123, 280–297. [Google Scholar] [CrossRef]
- Albergel, C.; De Rosnay, P.; Balsamo, G.; Isaksen, L.; Muñozsabater, J. Soil Moisture Analyses at ECMWF: Evaluation Using Global Ground-Based In Situ Observations. J. Hydrometeorol. 2012, 13, 1442–1460. [Google Scholar] [CrossRef]
- Dorigo, W.A.; Gruber, A.; De Jeu, R.A.M.; Wagner, W.; Stacke, T.; Loew, A.; Albergel, C.; Brocca, L.; Chung, D.; Parinussa, R.M.; et al. Evaluation of the ESA CCI soil moisture product using ground-based observations. Remote Sens. Environ. 2015, 162, 380–395. [Google Scholar] [CrossRef]
- Dobson, M.C.; Ulaby, F.T. Active microwave soil moisture research. IEEE Trans. Geosci. Remote Sens. 1986, GE-24, 23–36. [Google Scholar] [CrossRef]
- Ulaby, F.T.; Batlivala, P.P.; Dobson, M.C. Microwave backscatter dependence on surface roughness, soil moisture, and soil texture: Part I-bare soil. IEEE Trans. Geosci. Electron. 1978, 16, 286–295. [Google Scholar] [CrossRef]
- Hallikainen, M.T.; Ulaby, F.T.; Dobson, M.C.; Elrayes, M.A.; Wu, L. Microwave Dielectric Behavior of Wet Soil-Part 1: Empirical Models and Experimental Observations. IEEE Trans. Geosci. Remote Sens. 1985, GE-23, 25–34. [Google Scholar] [CrossRef]
- Kornelsen, K.C.; Coulibaly, P. Root-zone soil moisture estimation using data-driven methods. Water Resour. Res. 2014, 50, 2946–2962. [Google Scholar] [CrossRef]
- Scott, C.A.; Bastiaanssen, W.G.M.; Ahmad, M.U.D. Mapping Root Zone Soil Moisture Using Remotely Sensed Optical Imagery. J. Irrig. Drain. Eng. 2003, 129, 326–335. [Google Scholar] [CrossRef]
- Montaldo, N.; Albertson, J.D.; Mancini, M.; Kiely, G. Robust simulation of root zone soil moisture with assimilation of surface soil moisture data. Water Resour. Res. 2001, 37, 2889–2900. [Google Scholar] [CrossRef]
- Wang, X.; Xie, H.; Guan, H.; Zhou, X. Different responses of MODIS-derived NDVI to root-zone soil moisture in semi-arid and humid regions. J. Hydrol. 2007, 340, 12–24. [Google Scholar] [CrossRef]
- Leroux, D.J.; Kerr, Y.H.; Richaume, P.; Fieuzal, R. Spatial distribution and possible sources of SMOS errors at the global scale. Remote Sens. Environ. 2013, 133, 240–250. [Google Scholar] [CrossRef] [Green Version]
- Su, C.-H.; Ryu, D.; Young, R.I.; Western, A.W.; Wagner, W. Inter-comparison of microwave satellite soil moisture retrievals over the Murrumbidgee Basin, southeast Australia. Remote Sens. Environ. 2013, 134, 1–11. [Google Scholar] [CrossRef]
- Bicheron, P.; Amberg, V.; Bourg, L.; Petit, D.; Huc, M.; Miras, B.; Brockmann, C.; Hagolle, O.; Delwart, S.; Ranera, F. Geolocation Assessment of MERIS GlobCover Orthorectified Products. IEEE Trans. Geosci. Remote Sens. 2011, 49, 2972–2982. [Google Scholar] [CrossRef] [Green Version]
- Fischer, G.; Velthuizen, H.V.; Shah, M.; Nachtergaele, F. Global AgroEcological Assessment for Agriculture; The Century, Rome, Food and Agriculture Organization of the United Nations: Rome, Italy, 2010. [Google Scholar]
- Escorihuela, M.J.; Saleh, K.; Richaume, P.; Merlin, O.; Walker, J.P.; Kerr, Y.H. Sunglint observations over land from ground and airborne L-band radiometer data. Geophys. Res. Lett. 2008, 35, 293–310. [Google Scholar] [CrossRef]
- Panciera, R.; Walker, J.P.; Kalma, J.D.; Kim, E.J.; Hacker, J.M.; Merlin, O.; Berger, M.; Skou, N. The NAFE'05/CoSMOS Data Set: Toward SMOS Soil Moisture Retrieval, Downscaling, and Assimilation. IEEE Trans. Geosci. Remote Sens. 2008, 46, 736–745. [Google Scholar] [CrossRef] [Green Version]
- He, L.; Chen, J.M.; Chen, K.S. Simulation and SMAP Observation of Sun-Glint Over the Land Surface at the L-Band. IEEE Trans. Geosci. Remote Sens. 2017, 55, 2589–2604. [Google Scholar] [CrossRef]
- Jin, M.; Zheng, X.; Jiang, T.; Li, X.; Li, X.-J.; Zhao, K. Evaluation and Improvement of SMOS and SMAP Soil Moisture Products for Soils with High Organic Matter over a Forested Area in Northeast China. Remote Sens. 2017, 9, 387. [Google Scholar] [CrossRef]
Figure 1.
Locations and terrain of the Murrumbidgee Soil Moisture Monitoring Network (the dashed line presents the pixel size of 0.25° × 0.25°): (a) position of the network in Australia, (b) elevation derived from SRTM DEM of 30 m spatial resolution, (c) average elevation for each grid of 0.25° × 0.25°, (d) terrain slope derived from SRTM DEM of 30 m spatial resolution, (e) average terrain slope for each grid of 0.25° × 0.25°.
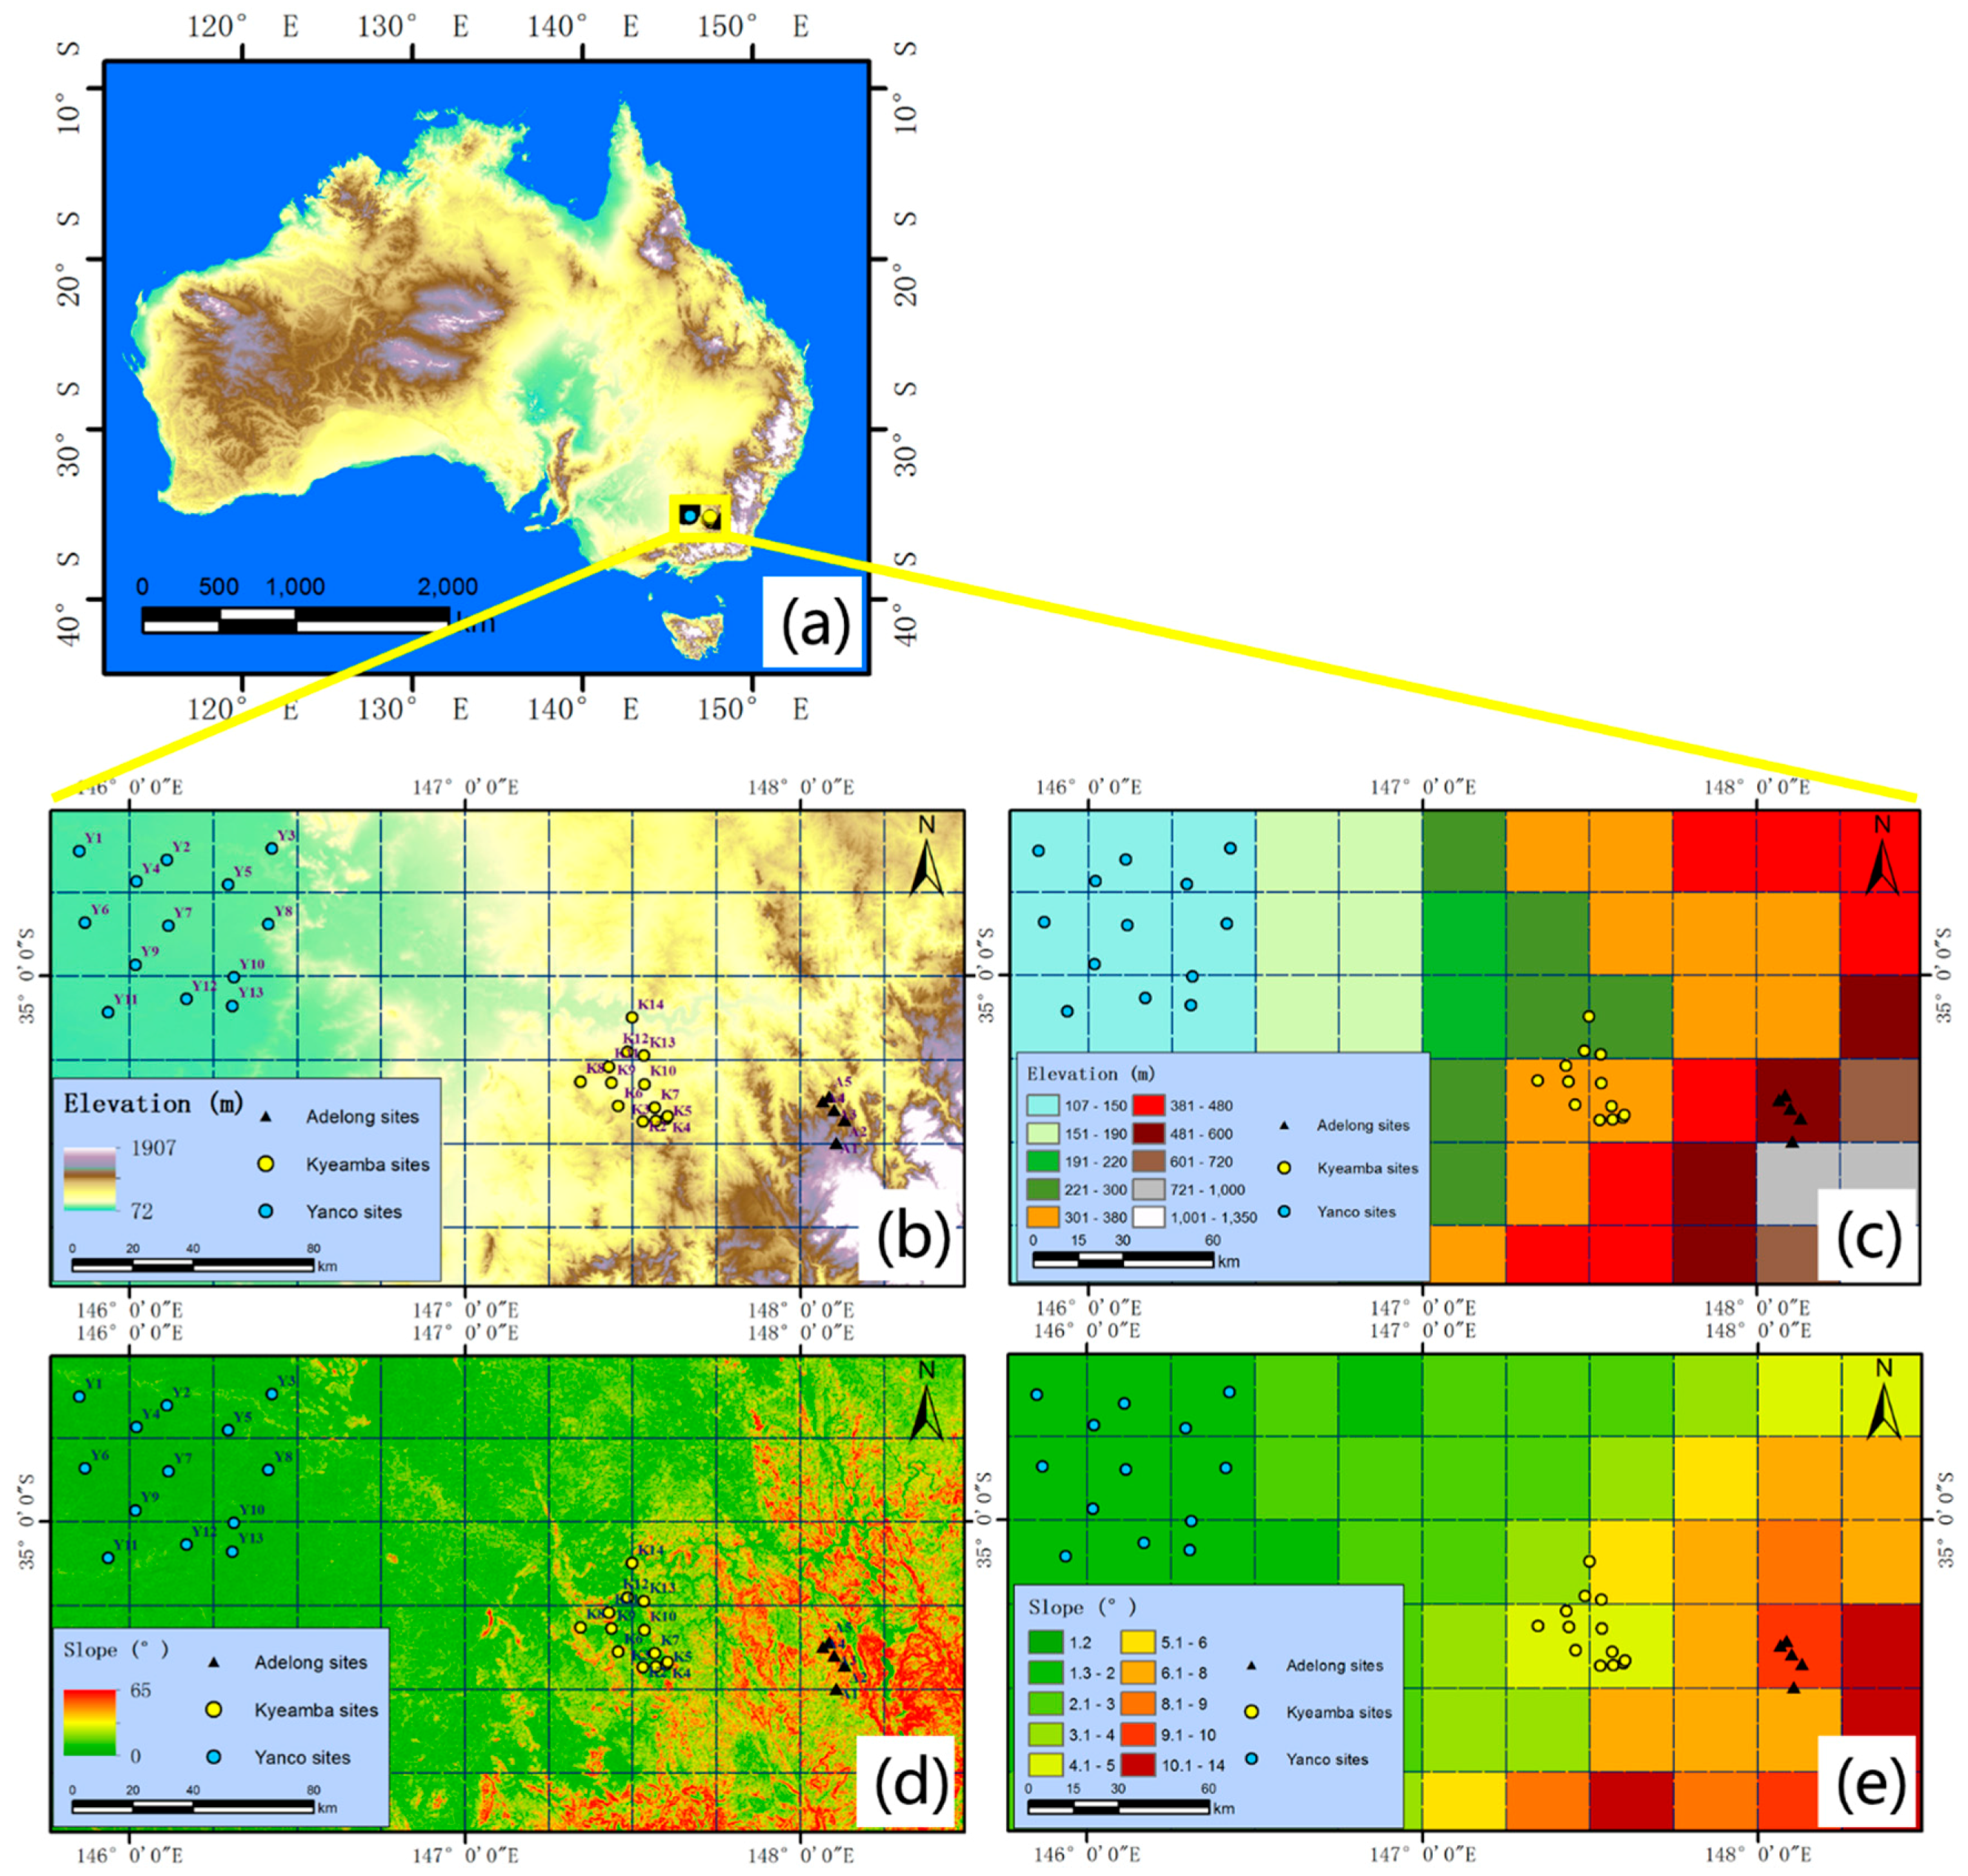
Figure 2.
Comparison of temporal behavior of the soil moisture products and in situ measurements at selected Adelong (A1, A2), Kyeamba (K3, K14), and Yanco (Y6, Y9) sites.
Figure 2.
Comparison of temporal behavior of the soil moisture products and in situ measurements at selected Adelong (A1, A2), Kyeamba (K3, K14), and Yanco (Y6, Y9) sites.

Figure 3.
The box plots showing the error metrics of each sites in the three networks: (a) R, (b) RMSE, (c) ubRMSD, and (d) Bias.
Figure 3.
The box plots showing the error metrics of each sites in the three networks: (a) R, (b) RMSE, (c) ubRMSD, and (d) Bias.

Figure 4.
The box plots showing the anomaly error metrics of each site in the three networks: (a) Rano, (b) RMSEano, (c) ubRMSDano.
Figure 4.
The box plots showing the anomaly error metrics of each site in the three networks: (a) Rano, (b) RMSEano, (c) ubRMSDano.

Figure 5.
Taylor diagrams displaying correlation coefficients, standard deviations, and root mean standard deviations between three soil moisture products and in situ soil moisture over three networks: (a) Adelong; (b) Kyeamba; and (c) Yanco.
Figure 5.
Taylor diagrams displaying correlation coefficients, standard deviations, and root mean standard deviations between three soil moisture products and in situ soil moisture over three networks: (a) Adelong; (b) Kyeamba; and (c) Yanco.

Figure 6.
Comparison of temporal behavior of the soil moisture products in situ measurements of different network.
Figure 6.
Comparison of temporal behavior of the soil moisture products in situ measurements of different network.

Figure 7.
Percentage of data gaps of (a) ECV; (b) SMOSA; and (c) SMOSD soil moisture products from 1 January 2011 to 31 December 2012 over Australia.
Figure 7.
Percentage of data gaps of (a) ECV; (b) SMOSA; and (c) SMOSD soil moisture products from 1 January 2011 to 31 December 2012 over Australia.

Figure 8.
(a) Land cover and (b) soil texture maps of the study area (the dashed line presents the pixel size of 0.25° × 0.25°).
Figure 8.
(a) Land cover and (b) soil texture maps of the study area (the dashed line presents the pixel size of 0.25° × 0.25°).

Figure 9.
(a) Terrain aspect map derived from SRTM digital elevation model (DEM) within the pixel of 0.25° which Adelong sites are located; (b) statistics of the percentage of aspects at each direction within the pixel.
Figure 9.
(a) Terrain aspect map derived from SRTM digital elevation model (DEM) within the pixel of 0.25° which Adelong sites are located; (b) statistics of the percentage of aspects at each direction within the pixel.


Table 1.
The latitudes/longitudes, elevations, slopes, land cover types, and soil classes for sites within the different networks.
Table 1.
The latitudes/longitudes, elevations, slopes, land cover types, and soil classes for sites within the different networks.
| Network | Site Number | Latitude | Longitude | Elevation (m) | Slope | Land Cover Type | Soil Class |
|---|---|---|---|---|---|---|---|
| Adelong | A1 | −35.4975 | 148.1065 | 827 | 5.49 | Savannas | Sandy clay loam * |
| A2 | −35.4283 | 148.1316 | 557 | 5.79 | Grasslands | Sandy clay loam * | |
| A3 | −35.3997 | 148.1011 | 503 | 12.13 | Grasslands | Sandy loam * | |
| A4 | −35.3731 | 148.0661 | 537 | 10.50 | Grasslands | Sandy loam * | |
| A5 | −35.3602 | 148.0854 | 377 | 0.99 | Croplands | Sandy loam * | |
| Average | -- | -- | 560.2 | 6.98 | -- | -- | |
| SD | -- | -- | 164.7 | 4.43 | -- | -- | |
| Kyeamba | K2 | −35.4353 | 147.5310 | 338 | 4.31 | Croplands | Sandy loam * |
| K3 | −35.4341 | 147.5690 | 312 | 2.65 | Grasslands | Sandy loam * | |
| K4 | −35.4269 | 147.6000 | 297 | 3.62 | Croplands | Sandy loam * | |
| K5 | −35.4193 | 147.6040 | 319 | 4.00 | Croplands | Sandy loam * | |
| K6 | −35.3898 | 147.4570 | 329 | 2.80 | Grasslands | Silty loam | |
| K7 | −35.3939 | 147.5660 | 267 | 2.10 | Grasslands | Silty loam | |
| K8 | −35.3163 | 147.3440 | 328 | 6.02 | Grasslands | Silty loam | |
| K10 | −35.3240 | 147.5350 | 234 | 1.04 | Croplands | Silty loam | |
| K11 | −35.2720 | 147.4290 | 325 | 5.56 | Grasslands | Sandy loam * | |
| K12 | −35.2275 | 147.4850 | 218 | 2.08 | Croplands | Silty loam | |
| K13 | −35.2389 | 147.5330 | 251 | 5.58 | Grasslands | Loamy sand | |
| K14 | −35.1249 | 147.4970 | 188 | 2.94 | Croplands | Silty loam | |
| Average | -- | -- | 283.8 | 3.56 | -- | -- | |
| SD | -- | -- | 50.6 | 1.58 | -- | -- | |
| Yanco | Y1 | −34.6289 | 145.8490 | 119 | 0.66 | Croplands | Silty loam |
| Y2 | −34.6548 | 146.1100 | 127 | 1.39 | Grasslands | Silty loam | |
| Y3 | −34.6208 | 146.4240 | 147 | 3.74 | Croplands | Silty loam | |
| Y4 | −34.7194 | 146.0200 | 126 | 0.73 | Croplands | Loamy sand | |
| Y5 | −34.7284 | 146.2930 | 137 | 1.77 | Grasslands | Loamy sand * | |
| Y6 | −34.8426 | 145.8670 | 118 | 0.33 | Grasslands | Silty loam | |
| Y7 | −34.8518 | 146.1150 | 130 | 3.38 | Open shrublands | Loamy sand * | |
| Y8 | −34.8470 | 146.4140 | 144 | 1.64 | Croplands | Silty loam | |
| Y9 | −34.9678 | 146.0160 | 125 | 0.46 | Grasslands | Loamy sand * | |
| Y10 | −35.0054 | 146.3100 | 123 | 0.73 | Grasslands | Loamy sand * | |
| Y11 | −35.1098 | 145.9360 | 116 | 0.33 | Grasslands | Loamy sand * | |
| Y12 | −35.0696 | 146.1690 | 121 | 1.39 | Croplands | Loamy sand * | |
| Y13 | −35.0903 | 146.3060 | 122 | 0.73 | Grasslands | Loamy sand * | |
| Average | -- | -- | 127.3 | 1.33 | -- | -- | |
| SD | -- | -- | 9.8 | 1.10 | -- | -- |
* The soil texture information is derived from the Harmonized World Soil Database (HWSD) v1.2.
Table 2.
The error metrics of different soil moisture products at the selected sites.
| Network | Site ID | Products | R | Rano | RMSE | RMSEano | ubRMSD | ubRMSDano | Bias |
|---|---|---|---|---|---|---|---|---|---|
| m3/m3 | m3/m3 | m3/m3 | m3/m3 | ||||||
| Adelong | A1 | ECV | 0.79 | 0.54 | 0.05 | 0.03 | 0.04 | 0.03 | 0.13 |
| SMOSA | 0.29 | 0.09 | 0.14 | 0.10 | 0.11 | 0.08 | −0.41 | ||
| SMOSD | 0.49 | 0.48 | 0.15 | 0.15 | 0.15 | 0.13 | 0.04 | ||
| A2 | ECV | 0.54 | 0.38 | 0.12 | 0.04 | 0.04 | 0.03 | 0.99 | |
| SMOSA | 0.54 | 0.26 | 0.08 | 0.07 | 0.07 | 0.06 | −0.37 | ||
| SMOSD | 0.47 | 0.36 | 0.13 | 0.12 | 0.13 | 0.11 | 0.33 | ||
| Kyeamba | K3 | ECV | 0.70 | 0.55 | 0.08 | 0.04 | 0.07 | 0.04 | 0.15 |
| SMOSA | 0.72 | 0.36 | 0.07 | 0.07 | 0.07 | 0.06 | 0.05 | ||
| SMOSD | 0.51 | 0.34 | 0.16 | 0.15 | 0.15 | 0.14 | 0.27 | ||
| K14 | ECV | 0.64 | 0.60 | 0.15 | 0.06 | 0.10 | 0.05 | −0.34 | |
| SMOSA | 0.75 | 0.52 | 0.15 | 0.06 | 0.08 | 0.05 | −0.37 | ||
| SMOSD | 0.51 | 0.38 | 0.16 | 0.13 | 0.14 | 0.12 | −0.27 | ||
| Yanco | Y6 | ECV | 0.77 | 0.69 | 0.07 | 0.06 | 0.07 | 0.05 | −0.09 |
| SMOSA | 0.64 | 0.44 | 0.07 | 0.06 | 0.07 | 0.05 | −0.02 | ||
| SMOSD | 0.51 | 0.26 | 0.10 | 0.10 | 0.10 | 0.08 | 0.02 | ||
| Y9 | ECV | 0.75 | 0.61 | 0.10 | 0.06 | 0.09 | 0.06 | −0.19 | |
| SMOSA | 0.76 | 0.69 | 0.08 | 0.06 | 0.08 | 0.06 | −0.05 | ||
| SMOSD | 0.69 | 0.62 | 0.10 | 0.09 | 0.09 | 0.08 | −0.08 |
Table 3.
Error metrics for the network scale of different products.
| Network | Products | R | Rano | RMSE | RMSEano | ubRMSD | ubRMSDano | Bias |
|---|---|---|---|---|---|---|---|---|
| m3/m3 | m3/m3 | m3/m3 | m3/m3 | |||||
| Adelong | ECV | 0.69 | 0.52 | 0.07 | 0.04 | 0.05 | 0.03 | 0.33 |
| SMOSA | 0.38 | 0.04 | 0.12 | 0.07 | 0.08 | 0.07 | −0.55 | |
| SMOSD | 0.50 | 0.44 | 0.13 | 0.12 | 0.13 | 0.11 | −0.09 | |
| Kyeamba | ECV | 0.72 | 0.66 | 0.06 | 0.04 | 0.06 | 0.03 | 0.05 |
| SMOSA | 0.79 | 0.55 | 0.06 | 0.05 | 0.06 | 0.05 | −0.02 | |
| SMOSD | 0.55 | 0.42 | 0.14 | 0.14 | 0.14 | 0.13 | 0.16 | |
| Yanco | ECV | 0.83 | 0.68 | 0.05 | 0.04 | 0.04 | 0.04 | 0.06 |
| SMOSA | 0.80 | 0.75 | 0.07 | 0.05 | 0.05 | 0.04 | 0.23 | |
| SMOSD | 0.78 | 0.69 | 0.08 | 0.07 | 0.07 | 0.07 | 0.22 |
© 2018 by the authors. Licensee MDPI, Basel, Switzerland. This article is an open access article distributed under the terms and conditions of the Creative Commons Attribution (CC BY) license (http://creativecommons.org/licenses/by/4.0/).
Share and Cite
MDPI and ACS Style
Jing, W.; Song, J.; Zhao, X. A Comparison of ECV and SMOS Soil Moisture Products Based on OzNet Monitoring Network. Remote Sens. 2018, 10, 703. https://doi.org/10.3390/rs10050703
AMA Style
Jing W, Song J, Zhao X. A Comparison of ECV and SMOS Soil Moisture Products Based on OzNet Monitoring Network. Remote Sensing. 2018; 10(5):703. https://doi.org/10.3390/rs10050703
Chicago/Turabian StyleJing, Wenlong, Jia Song, and Xiaodan Zhao. 2018. "A Comparison of ECV and SMOS Soil Moisture Products Based on OzNet Monitoring Network" Remote Sensing 10, no. 5: 703. https://doi.org/10.3390/rs10050703
Note that from the first issue of 2016, this journal uses article numbers instead of page numbers. See further details here.