1. Introduction
Forest covers approximate 30% of the global land area, which plays a significant role in the natural circulation of carbon and the mitigation of climate change [
1]. These important ecological processes are usually affected by the canopy vertical structure (CVS), which is defined as the quantity and arrangement of the canopy along the vertical axis [
2]. As a characterization of CVS, the canopy height profile (CHP) represents the relative canopy vertical distribution that depicts the fraction of total plant area.
There are two categories of measurement techniques to estimate the CHP: traditional ground methods and advanced remote sensing approaches. A representative ground method to obtain canopy height profiles is the point sampling quadrat provided by Wilson, who measured the points of intercepting foliage along a series of vertical transects from the top to bottom of the canopy by utilizing several lines [
3]. An improved point quadrat method was developed by MacArthur and Horn using a calibrated telephoto camera [
4], and applied by Arber to northern temperate canopies [
5]. These field inventories are obviously time-consuming, laborious, expensive, and inappropriate for a large-scale measurement.
Conversely, remote sensing technology can provide more accurate measurement of spatially-continuous properties of forest structure over large areas in a rapid manner. Passive optical remote sensing systems mainly collect the reflected sunlight from the exterior canopy surface and are almost unable to acquire the information inside the canopy due to topographical occlusion, the limitation of the employed spectral range, and poor illustration conditions. They can hardly capture the vertical forest structure directly and exclusively obtain the limited characterization of the canopy structure, such as tree crown and leaf area index (LAI) [
6,
7,
8]. Airborne light detection and ranging (LiDAR) can partially penetrate the canopy and reveal the vertical structure of the canopy by using small-footprint laser data, such as discrete returns or digitalized waveforms [
9]. There are two typical processing approaches to extract the CHP with small-footprint LiDAR data: (1) derivation of gap probability and the corresponding incremental distribution at optional areas for LiDAR point clouds with high point densities [
10,
11,
12,
13]; and (2) the methodology used in spaceborne large-footprint full waveform LiDAR [
14,
15], but small-footprint LiDAR waveforms first need to be aligned according to the elevation and summed to generate an accumulative large-footprint waveform [
16,
17,
18]. According to the character of full waveforms and their relationships with CVS, Harding et al. [
15] provided the procedures of transforming waveform data of the Scanning LiDAR Imager of Canopies by Echo Recovery (SLICER) into the CHP and validated the results with the ground-based measurements.
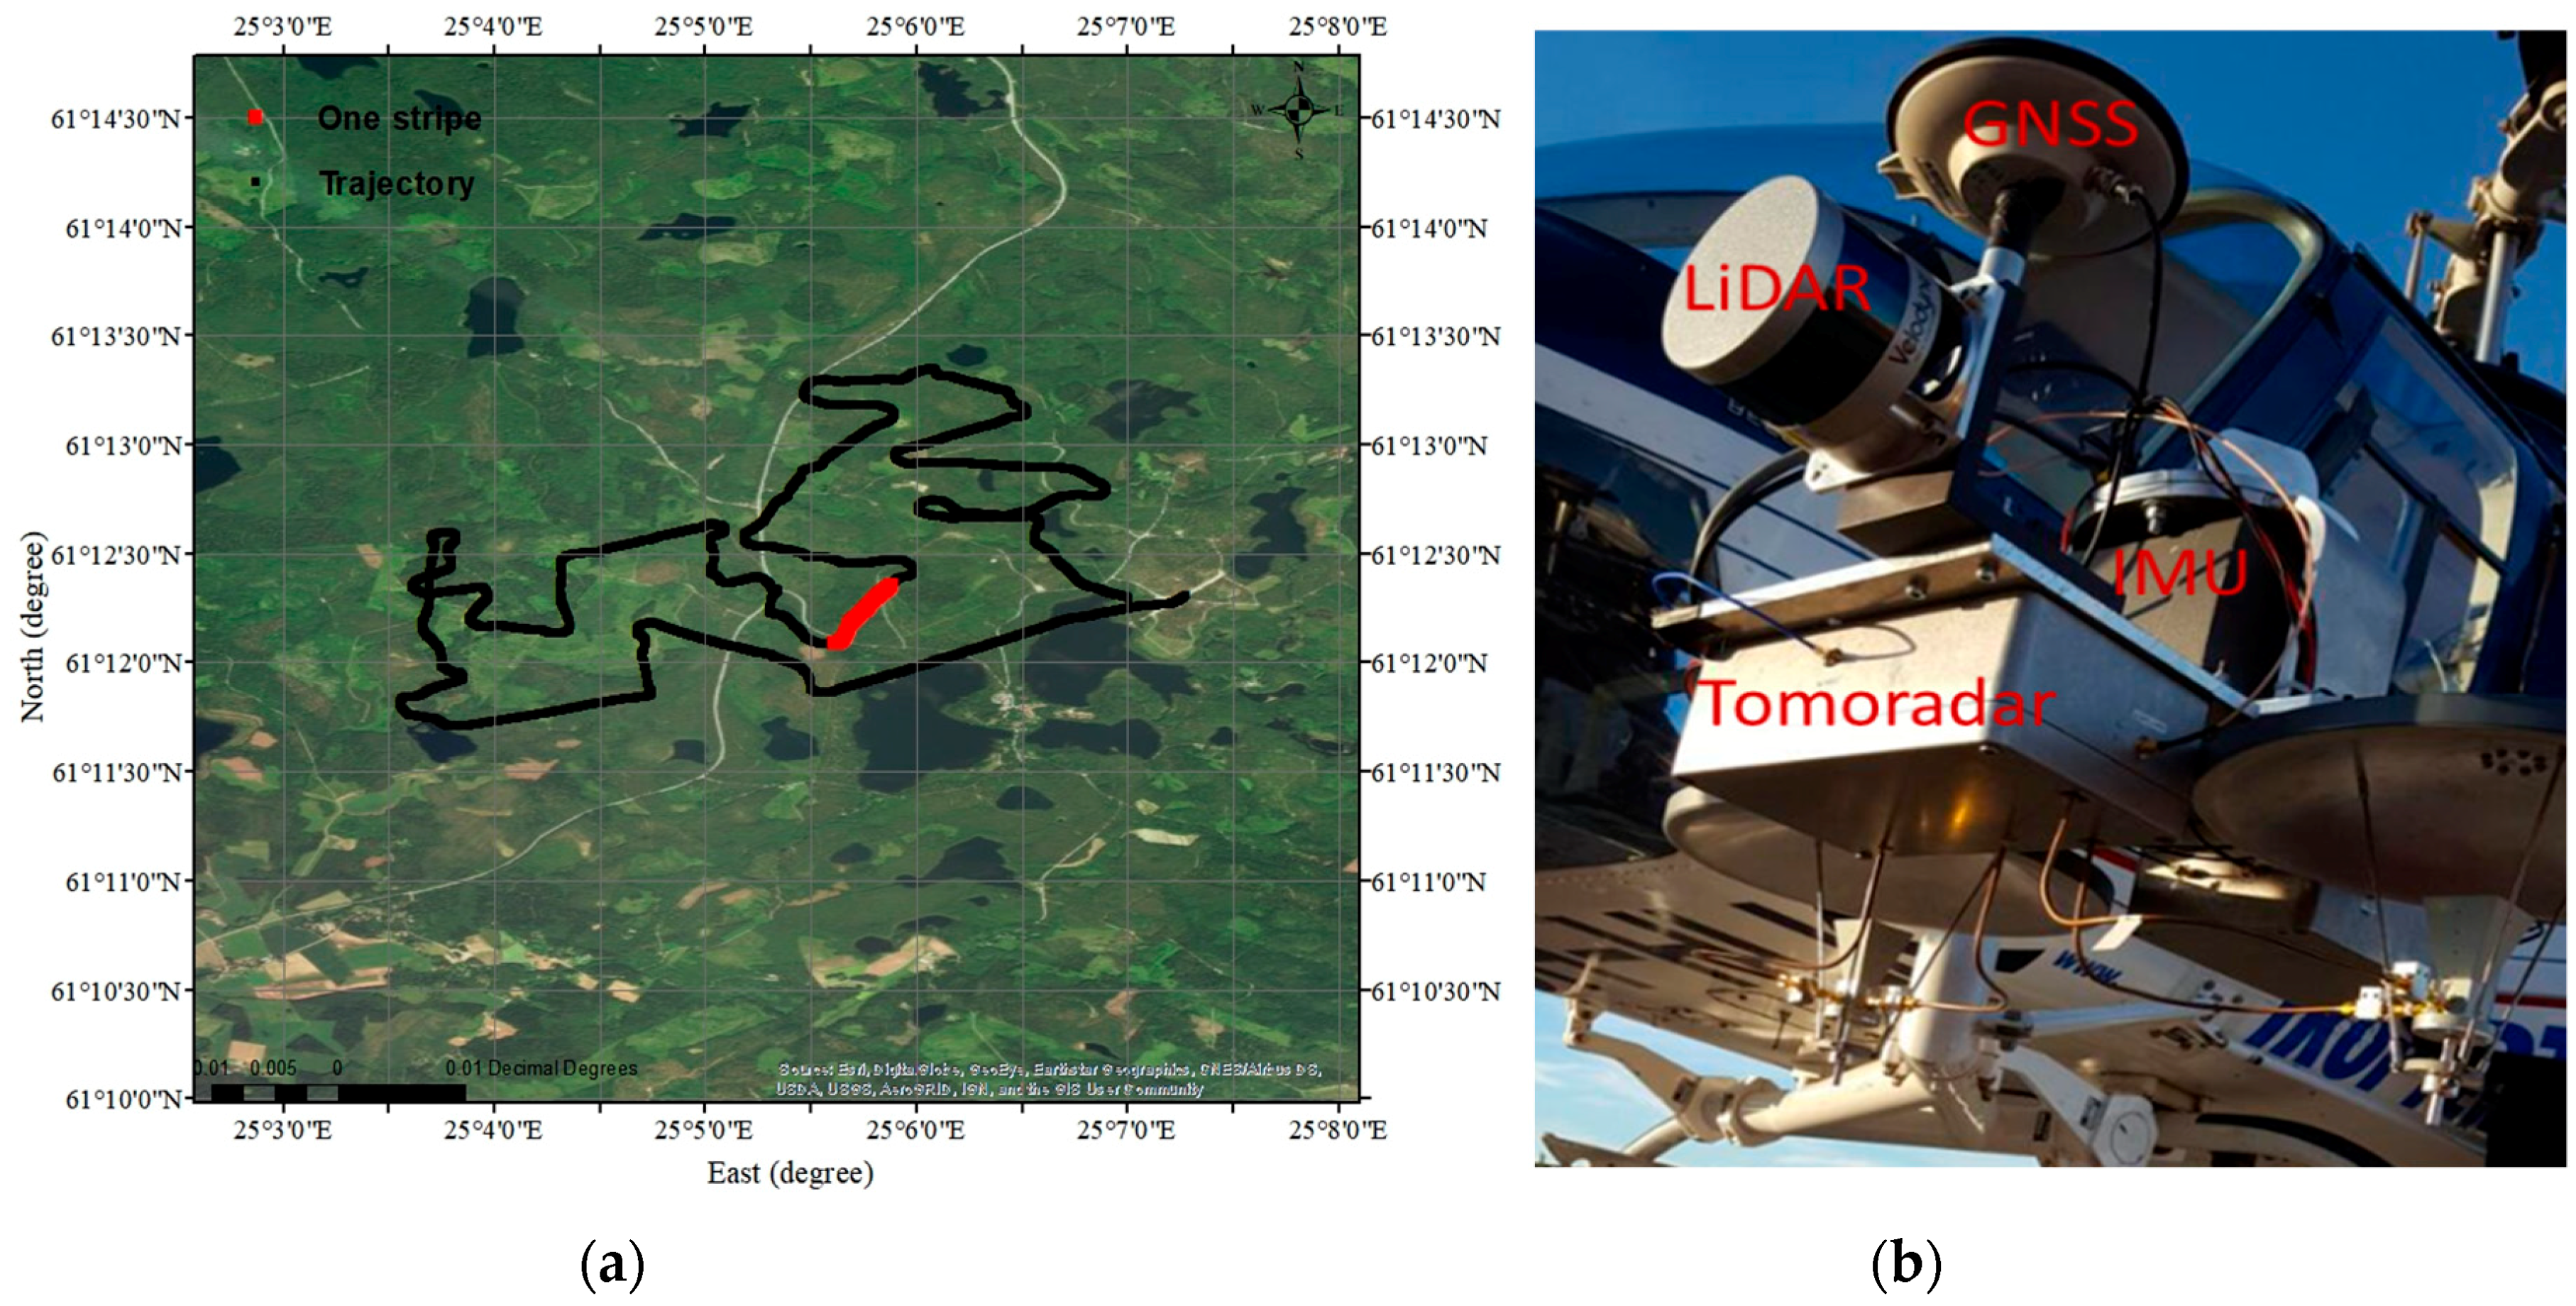
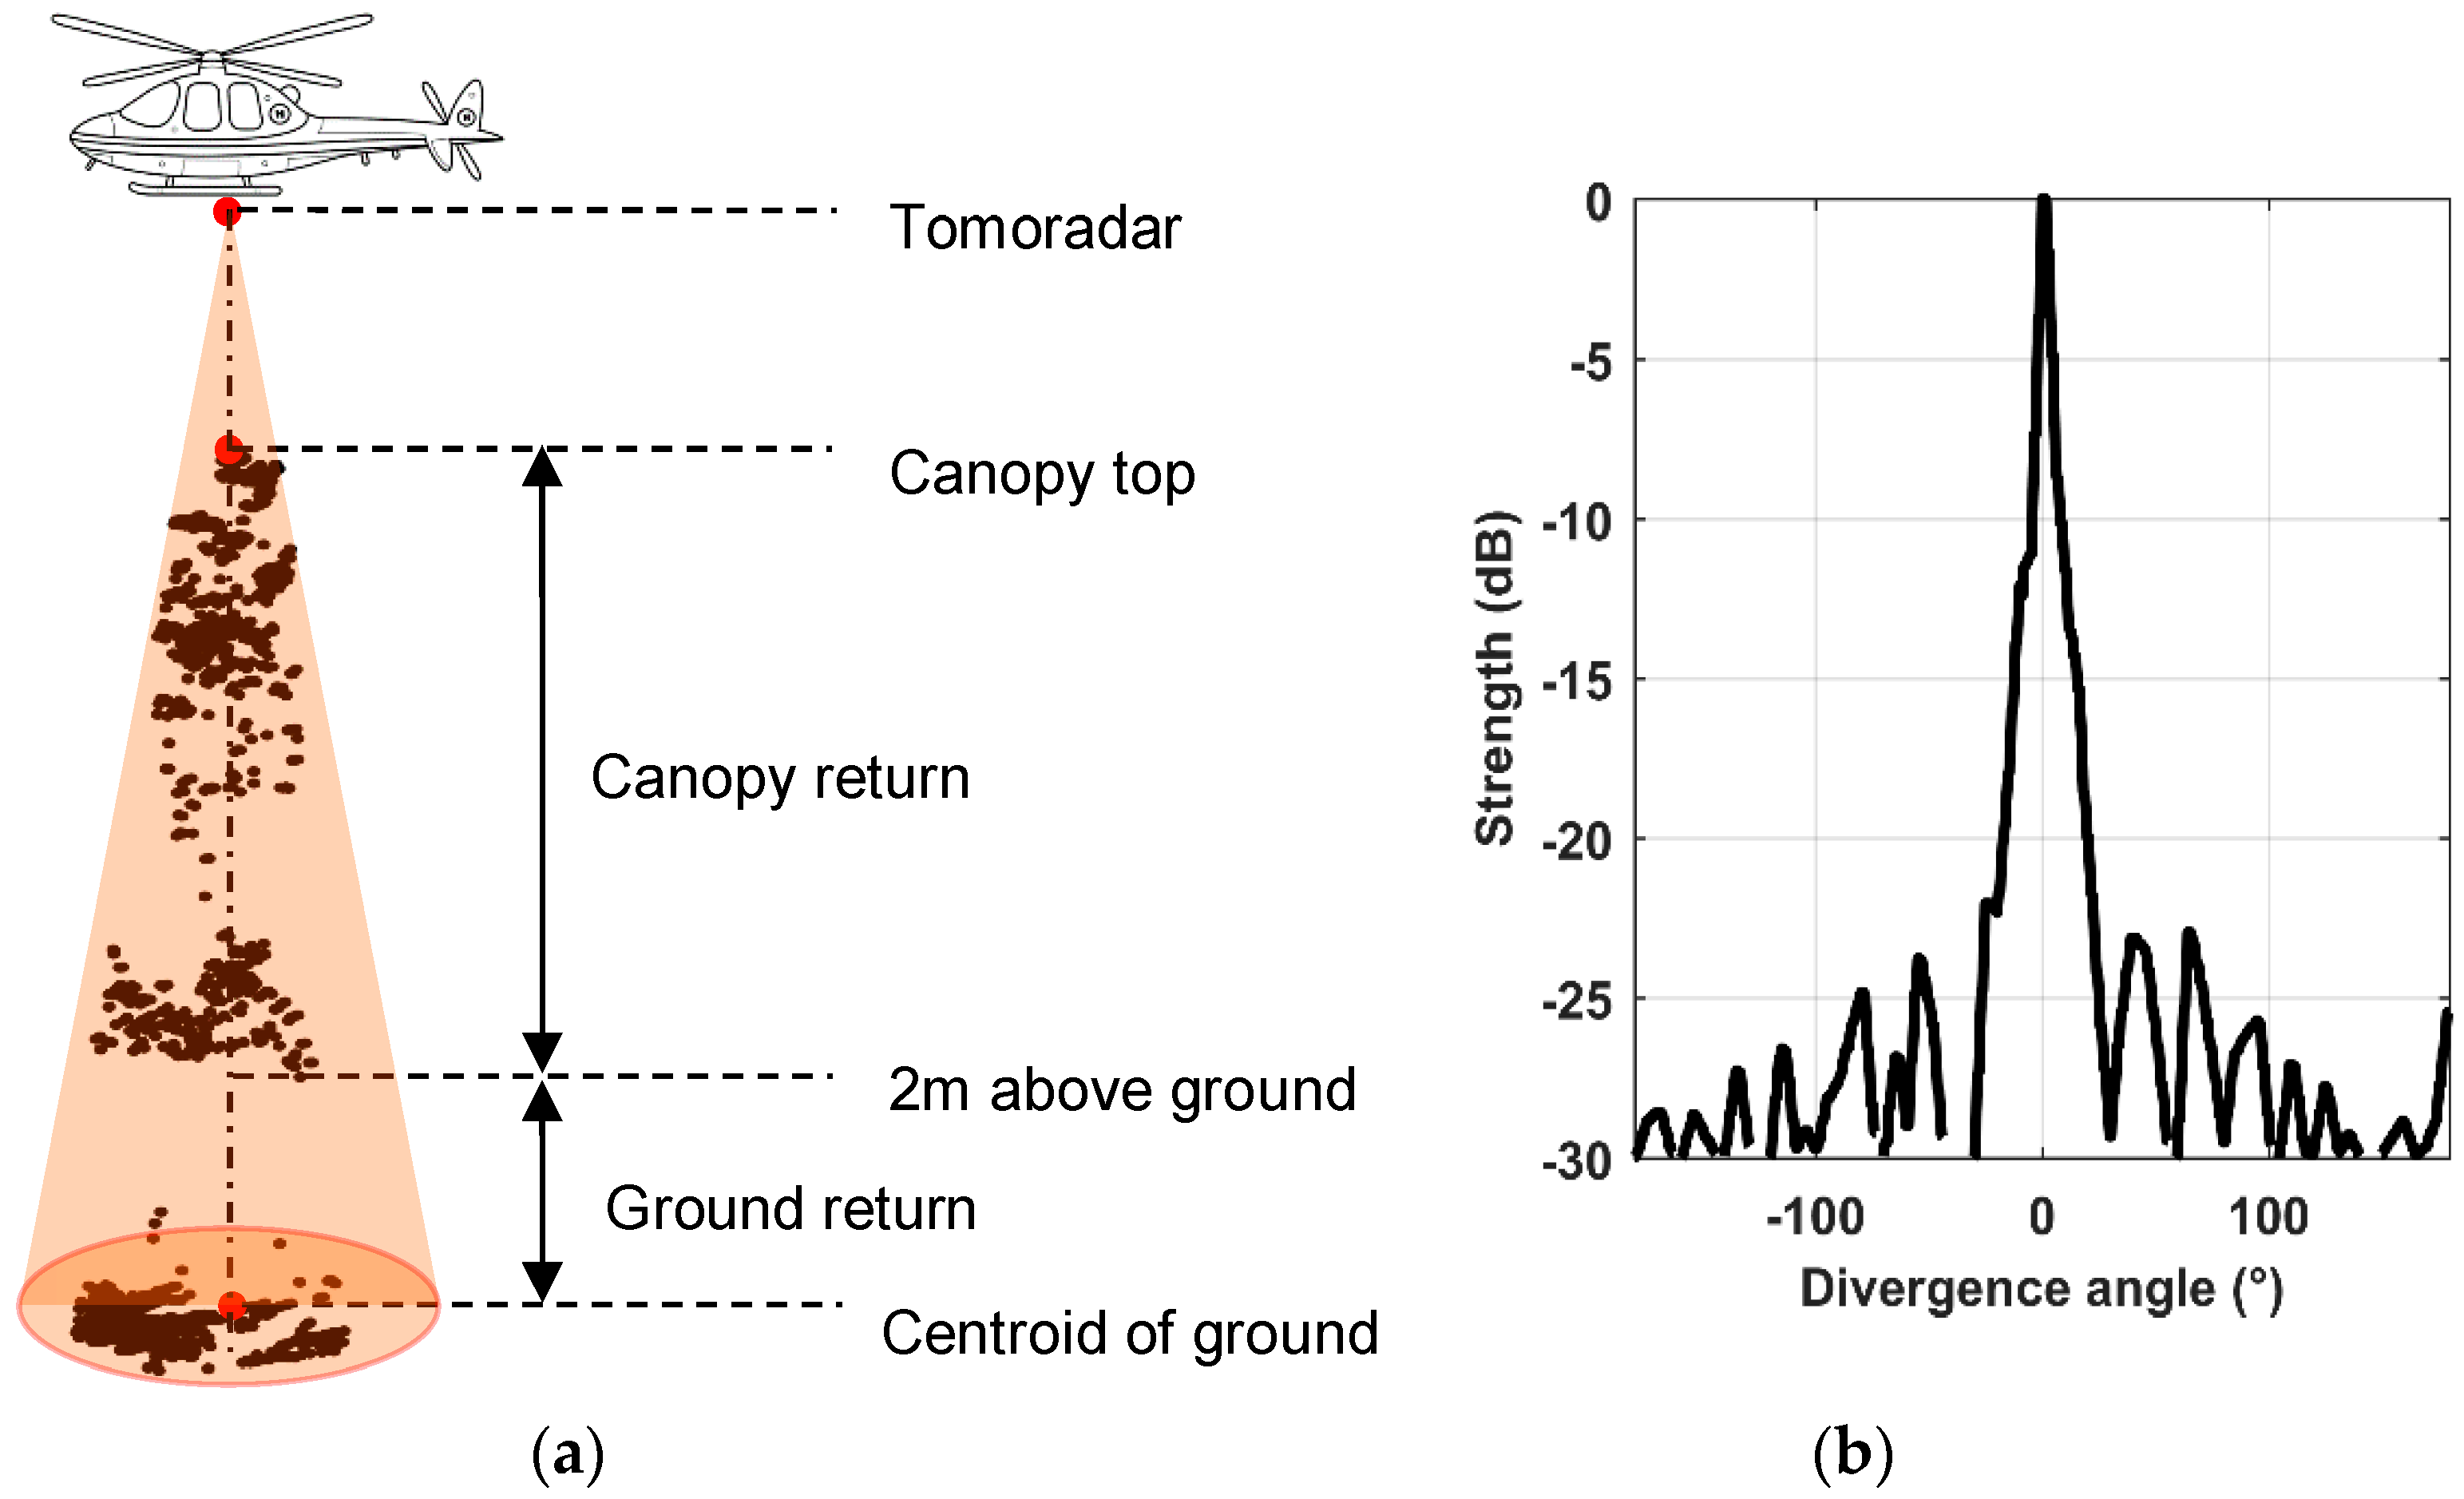
For acquiring canopy height and other vertical canopy structure information, a light-weighted Ku-band frequency-modulated continuous waveform (FM-CW) airborne profiling radar, named Tomoradar, was designed by the Finnish Geospatial Research Institute (FGI), which is currently the only available Ku-band profiling radar for forest measurements to the best of our knowledge [
19,
20,
21]. Tomoradar on-board an airborne platform can collect the full polarization backscattered waveforms within the footprint of several meters from the forest with an operational altitude of several tens of meters. Furthermore, a Velodyne
® VLP-16 LiDAR installed on the same platform was employed to offer a coincident laser point cloud. Considerable amount of research has been carried out in the field of retrieving forest biomass from satellite radar data. There have been two main research lines, using either (1) SAR backscattering information [
22] or (2) elevation models extracted from the SAR data [
23], to retrieve forest biomass estimation models. Without going too deep into the details of these techniques, one of the main challenges today is to better understand the interaction of radar waves with forest vertical structures under variable environmental conditions. By comparing the Tomoradar waveforms and high-density ALS data, it may be possible to advance the understanding of spaceborne radar responses from forests as well and, accordingly, contribute to the current SAR satellite-based biomass retrieval models. Thus, in this paper, the estimations of the CHP, which is a typical characterization parameter, are investigated using Tomoradar waveforms and LiDAR discrete returns.
In this research, a processing method of deriving the CHP from Tomoradar waveforms was developed on the basis of the methodology used in the large-footprint waveform LiDAR while, for LiDAR data, the CHP extracted from the small-footprint LiDAR with discrete returns were utilized. One stripe of the Tomoradar field measurements containing 6766 effective waveforms of boreal forest data in Southern Finland were employed to extract the canopy height profile. According to the difference and linear regression analysis, the comparisons of CHP extracted from Tomoradar and LiDAR were investigated thoroughly. The results may provide guidance for potential applications of using radar sensors for forest inventories.
The rest of this paper is organized as follows:
Section 2 describes the study area, Tomoradar waveforms, and LiDAR data, and illustrates the methods of derivation and comparisons of the CHP;
Section 3 expounds the comparison of CHP result; and, finally, the conclusions are drawn in
Section 4.
3. Results and Discussion
Due to the complexity of the flight trajectory, only Tomoradar measurements at the proximate nadir direction are applicable to derive the CHP. The nadir angle of the Tomoradar can be determined according to the roll angles from the IMU onboard the helicopter. When the nadir angles are less than five degrees, approximately 67% of the raw waveforms (6766 of 10,002 measurements) are reserved to be investigated.
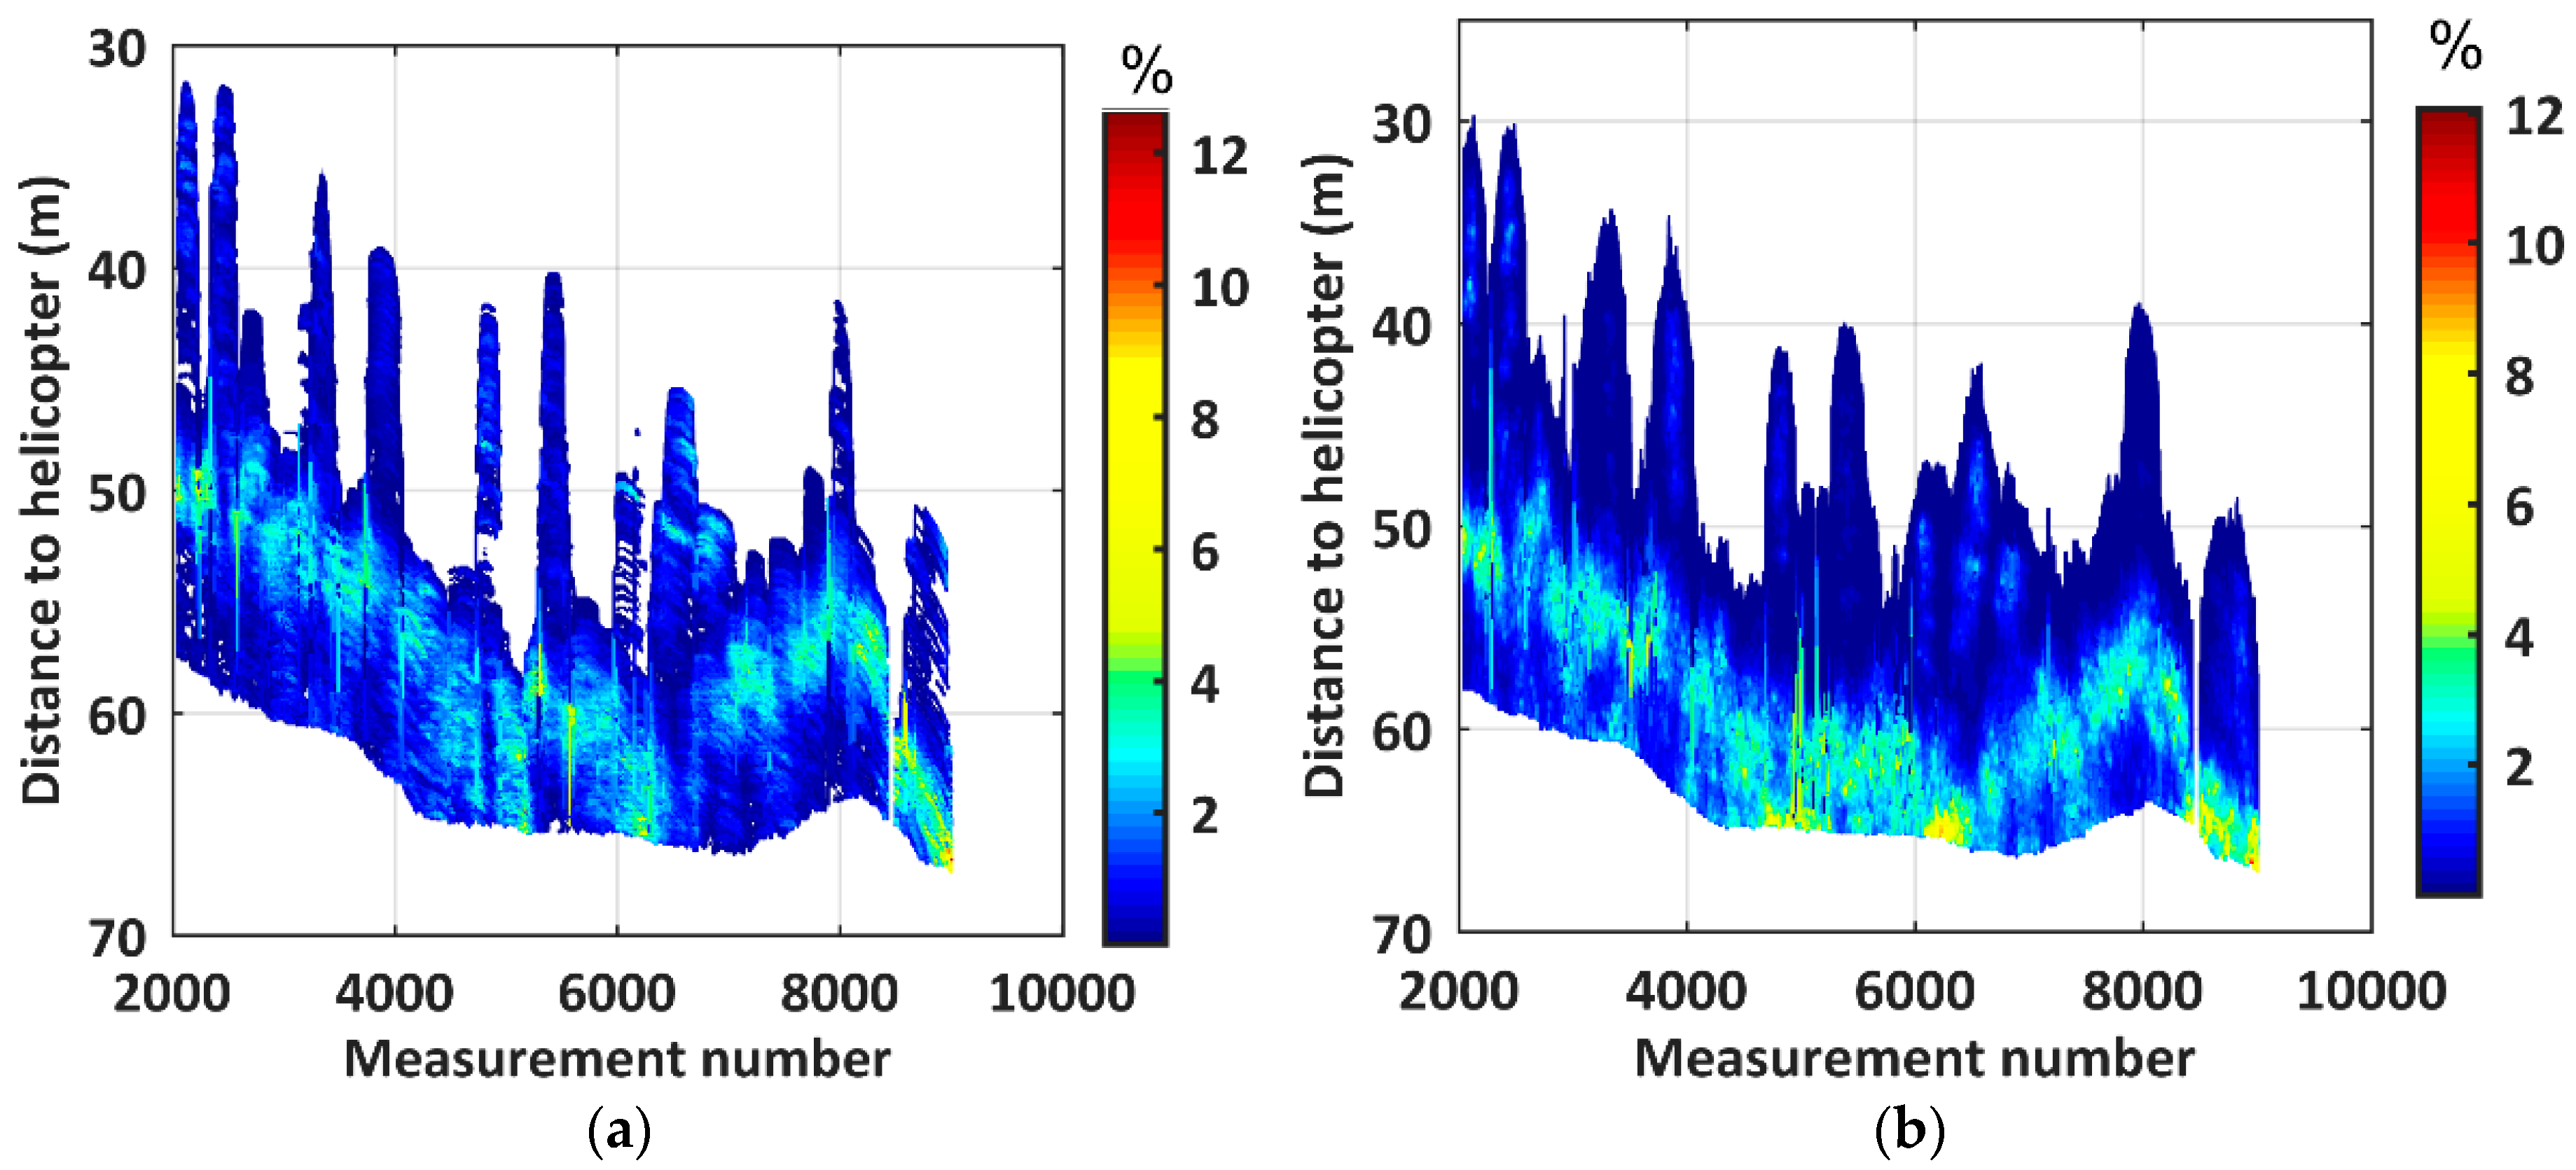
According to above-mentioned method, we compute the CHP for 6766 measurements by using the Tomoradar waveforms and LiDAR data, the distributions of which versus the distances to the helicopter are illustrated in
Figure 6.
It can be perceived that the tendency of the CHP extracted from Tomoradar waveforms are nearly similar as those from the LiDAR data, as
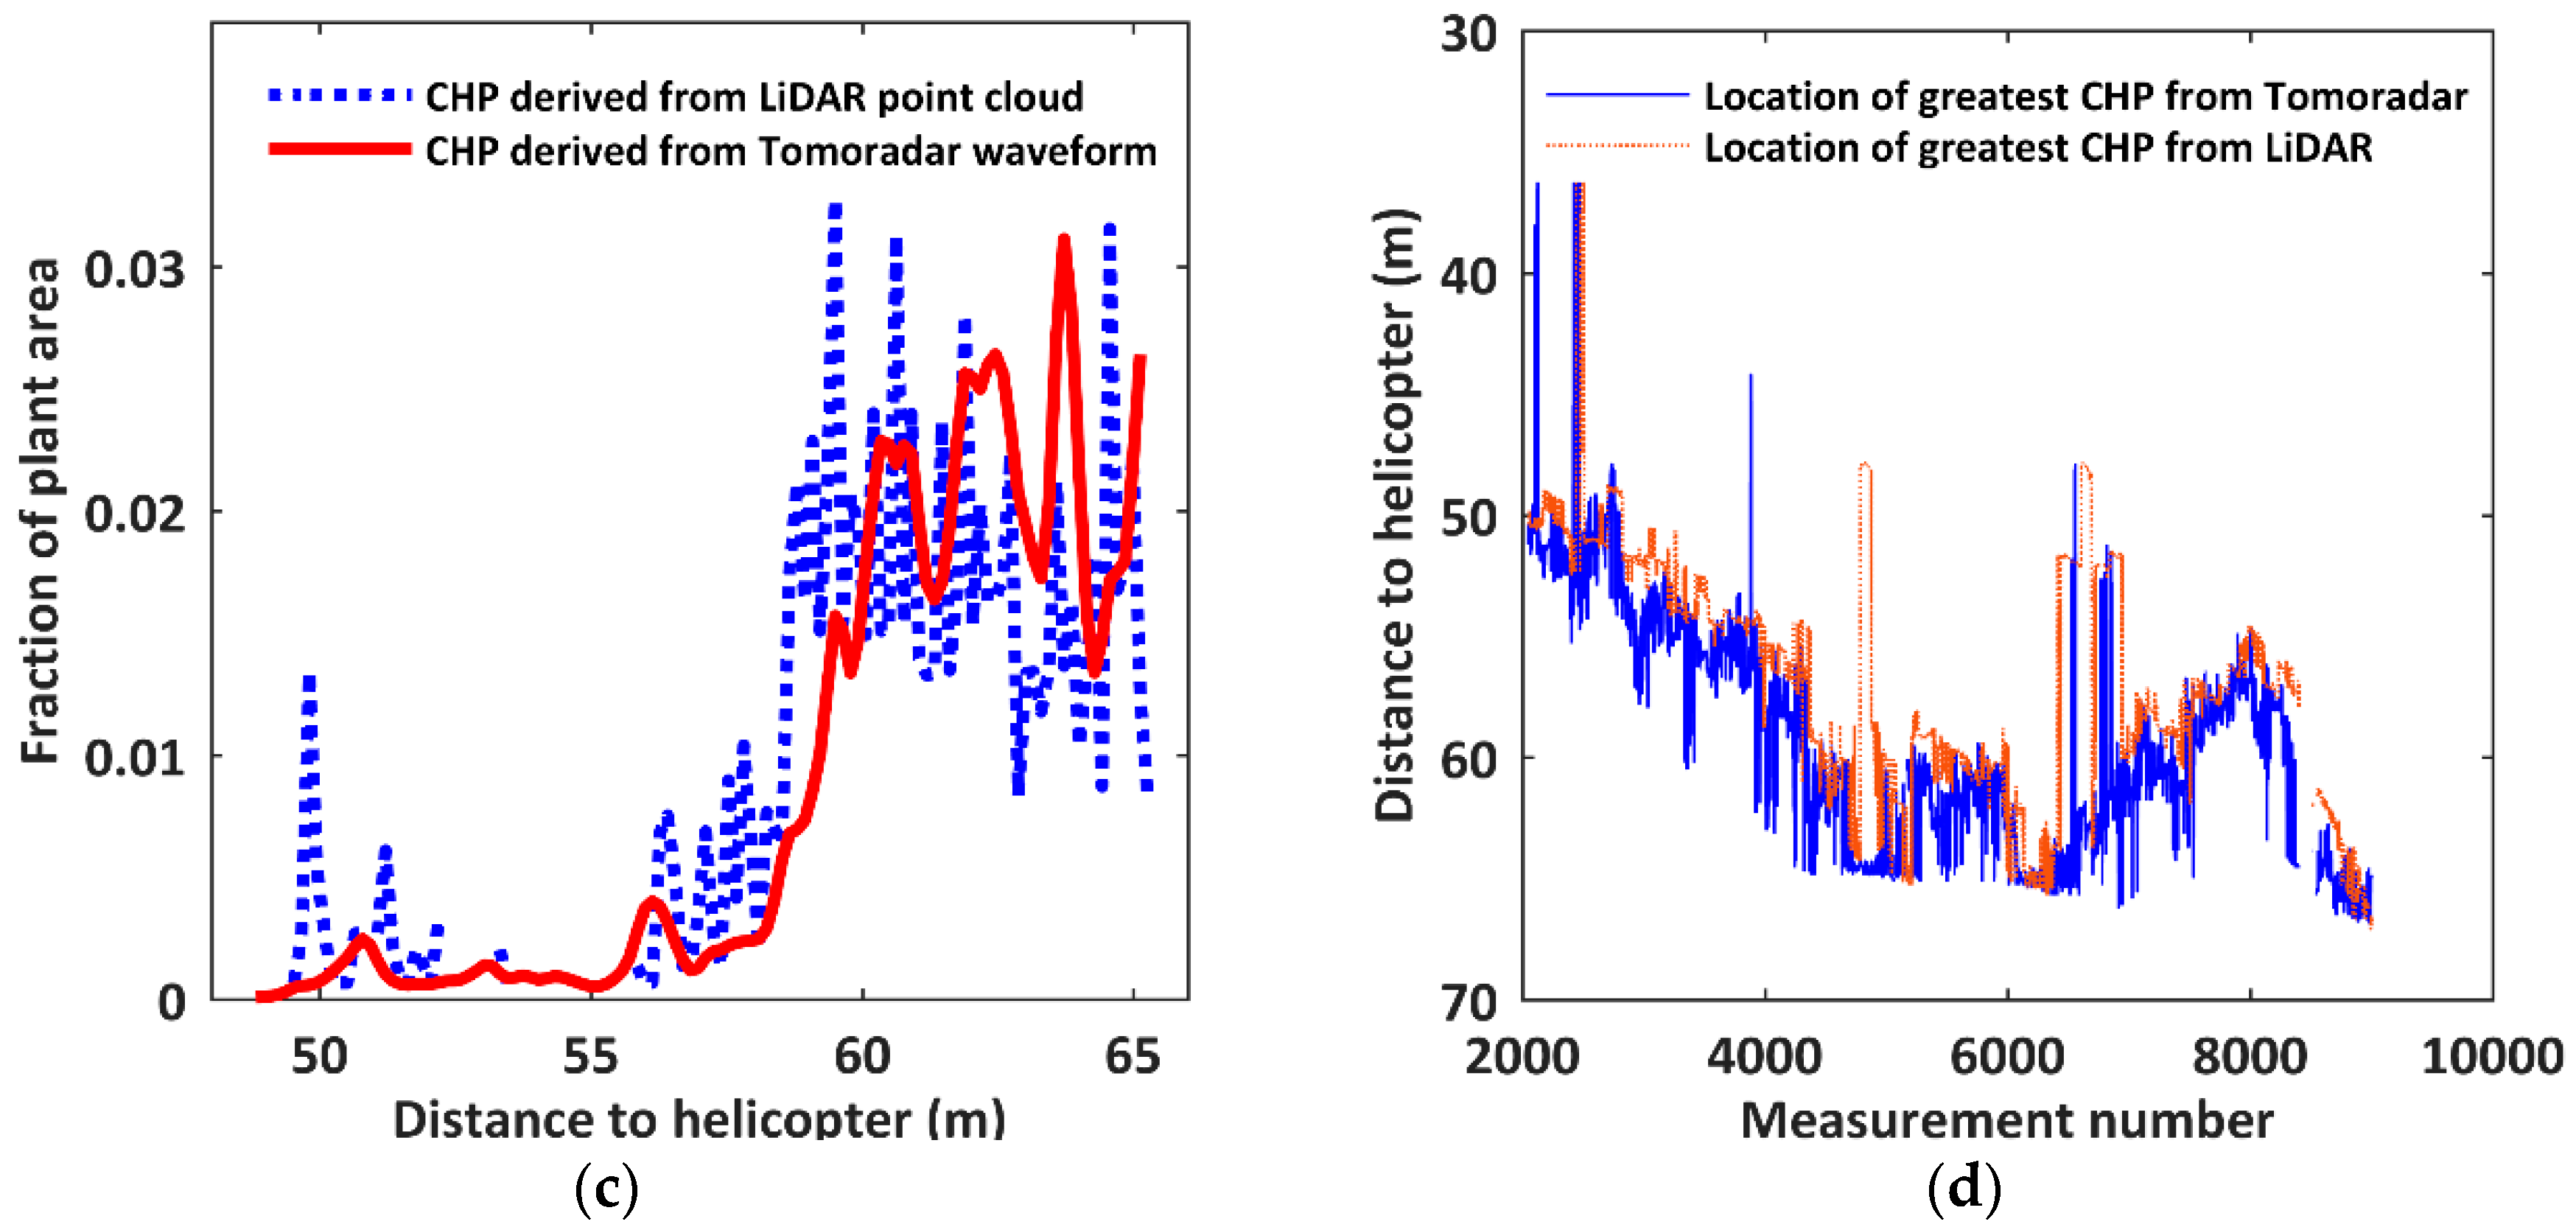
Figure 6a,b presents. From the canopy top to 2 m above ground, the CHP are multimodal structures for all the measurements, as an example of the 6000th measurement in
Figure 6c. Moreover, the locations of greatest CHP in
Figure 6d derived from Tomoradar results are obviously deeper than those from LiDAR, and the average difference approaches 2.59 m. This demonstrates that more microwave energy passes through the interior of the canopy, which proves the Tomoradar microwave signal has a stronger penetration capability than the LiDAR signal even though the Ku band has lower penetration than longer-wavelength bands, such as the C band and P band.
3.1. Analysis of the Differences of the CHPs
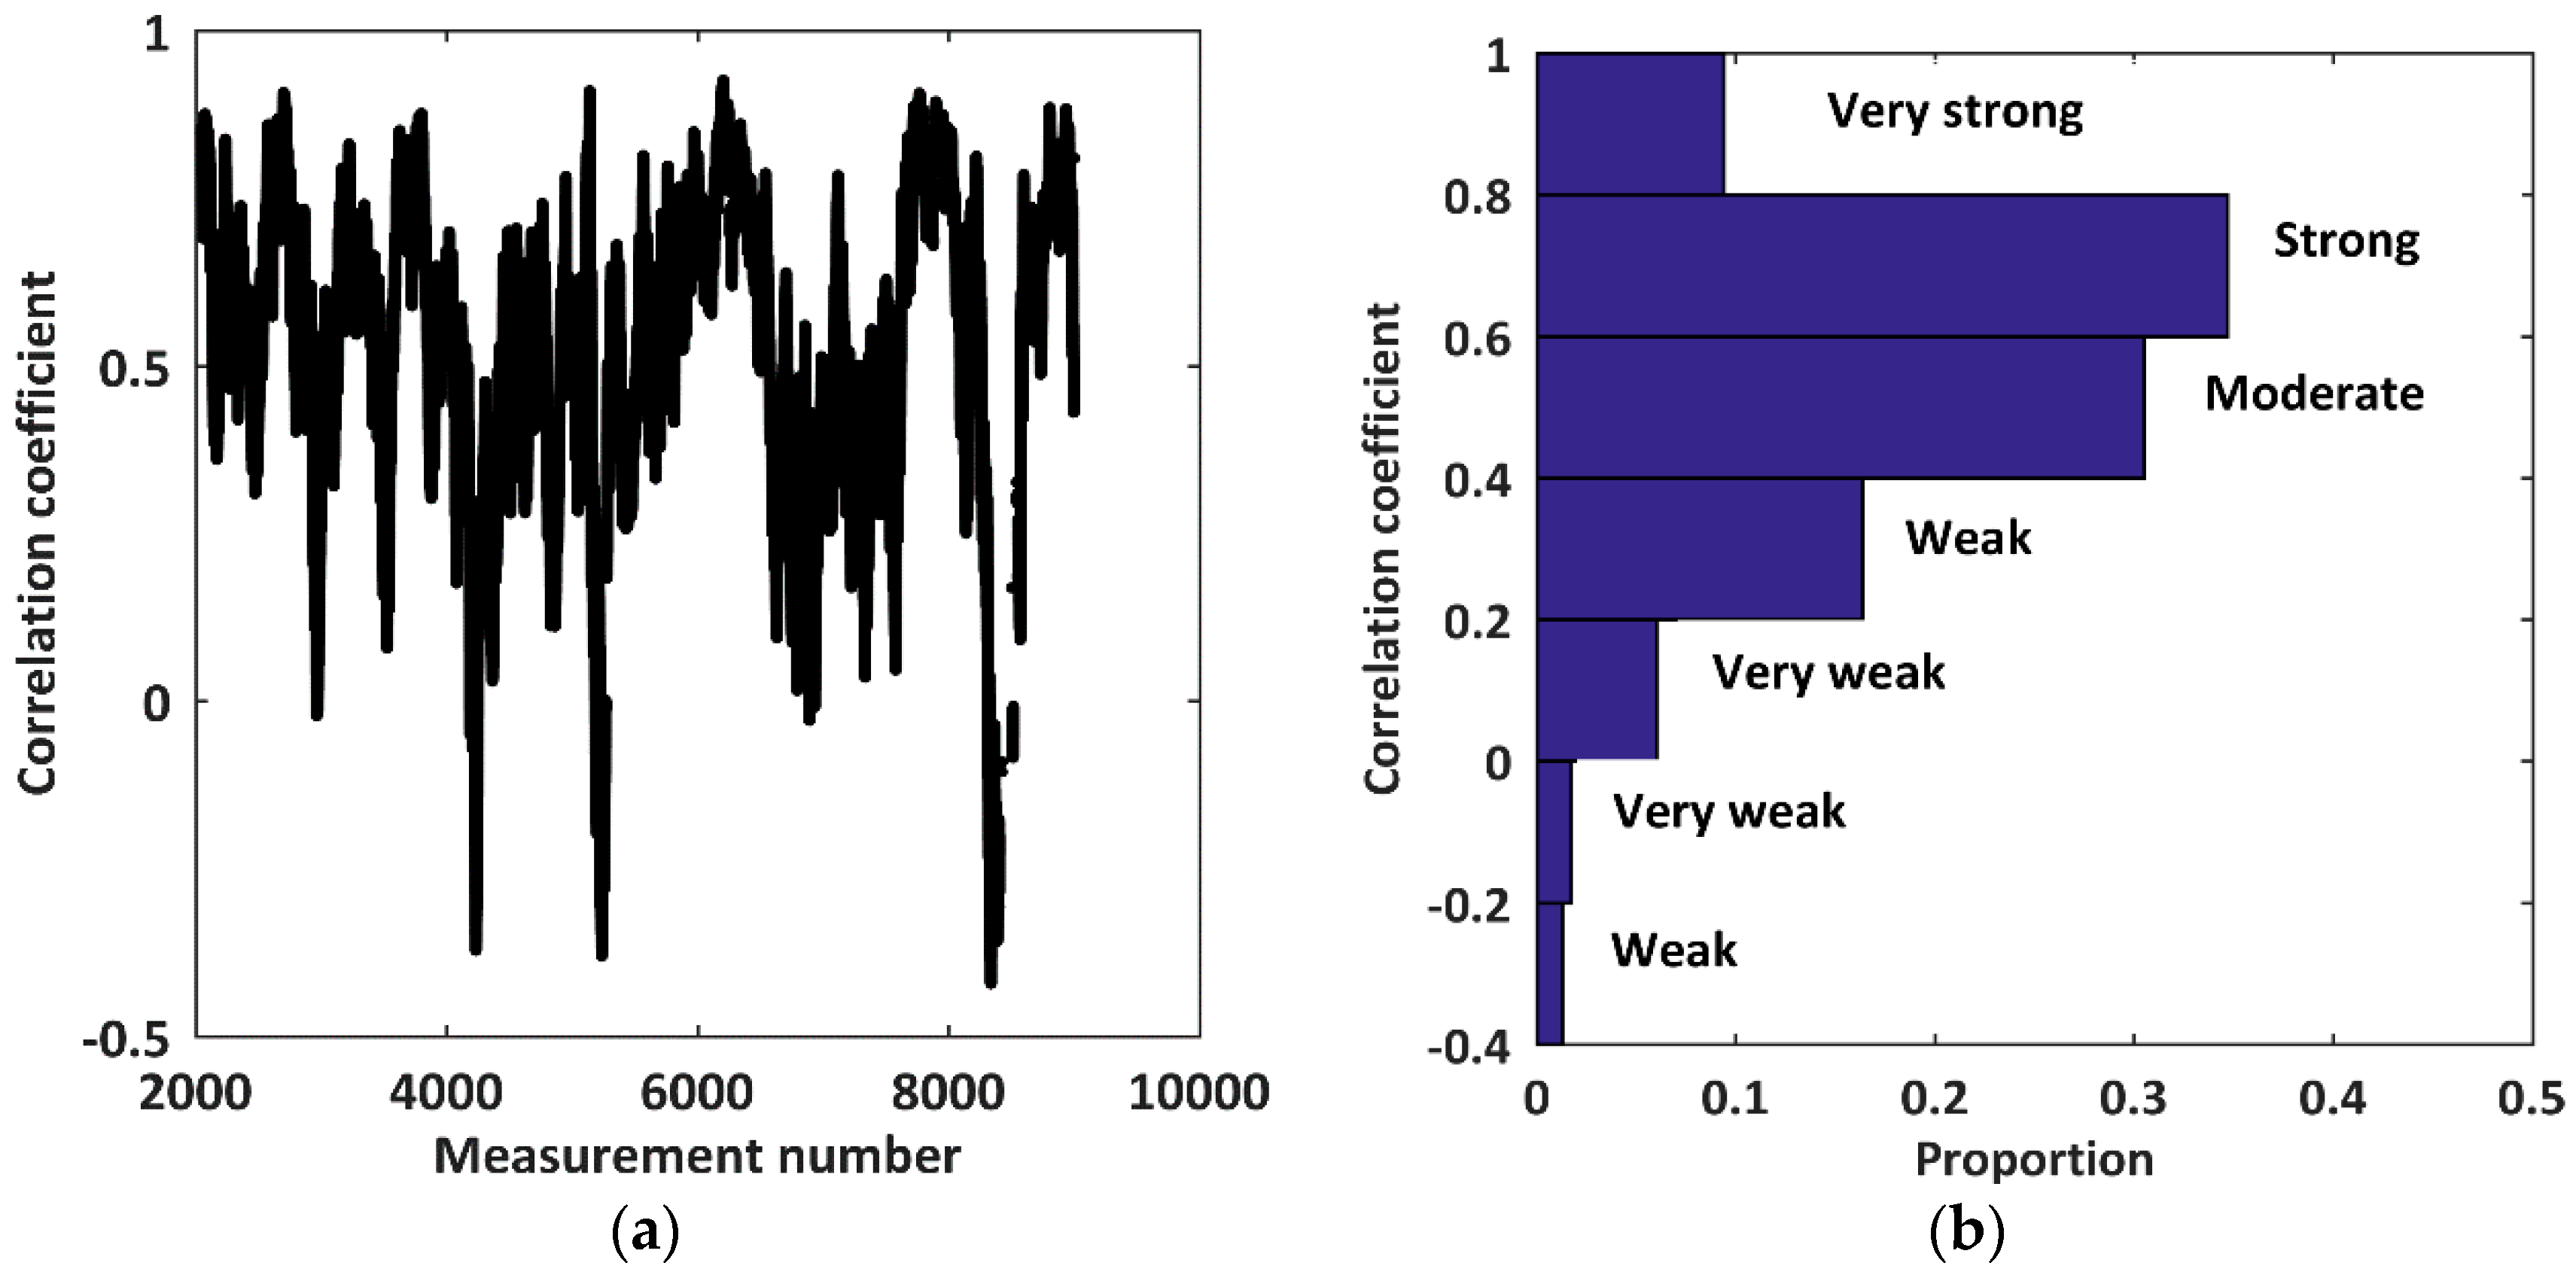
To quantitatively compare the relationships of the CHPs extracted from Tomoradar and LiDAR data, we first calculate the correlation coefficients for all reserved measurements according to Equation (7) and present a histogram based on the strength of the correlation in
Figure 7.
In
Figure 7a, the correlation coefficients vary with the measurement number, and range between –0.40 and 0.93. According to the correlation strength, we divide the correlation coefficients into 10 sections with an interval of 0.2 when they take values from −1 to 1. By counting the numbers within each section, we obtain the corresponding proportions to all 6766 measurements (
Figure 7b) and enumerate them in
Table 1.
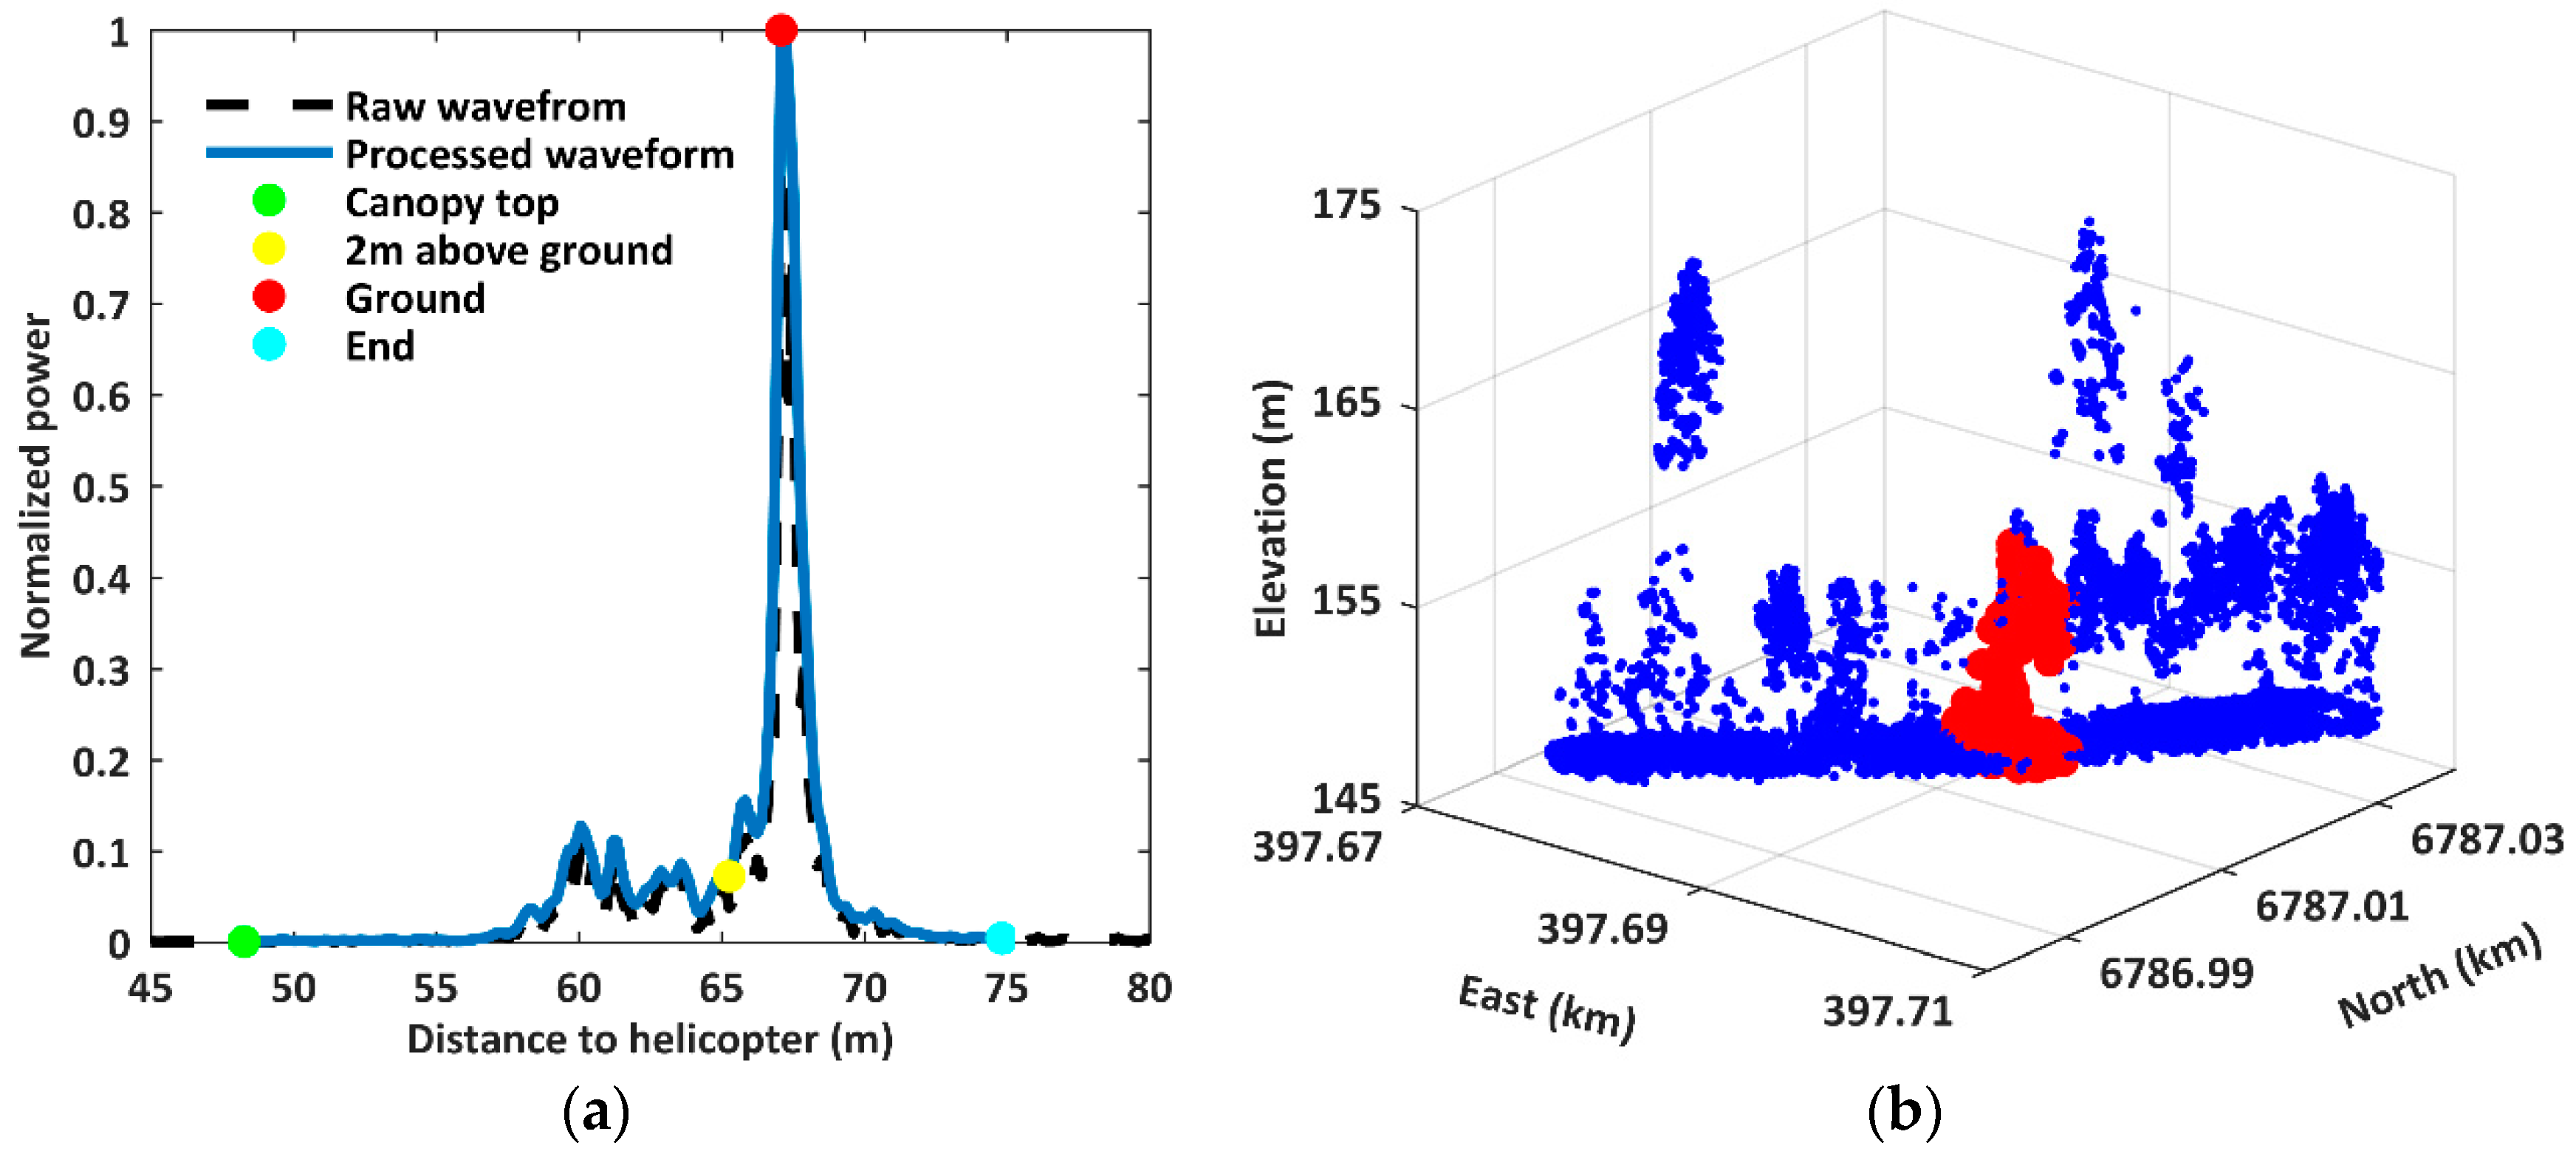
Most of the CHPs (74.59%) derived from Tomoradar and LiDAR data have above-moderate correlation strength, and only 25.41% of the CHPs correlate weakly or very weakly. To explore the outliers, we select the worst one (the 5270th measurement) with a correlation strength of zero and illustrate the matching Tomoradar waveform and LiDAR data in
Figure 8.
The Tomoradar waveform at the 5270th measurement (
Figure 8a) is correctly processed and four feature points, including the canopy top, 2 m above ground, centroid of ground, and end of ground, are precisely extracted, and the canopy height extracted from
Figure 7a is approximately 20 m. Consequently, the weak correlation strength is owning to the coincident LiDAR data (
Figure 8b). We discover that the canopy height of the coincident LiDAR is about 10 m as the red-colored point cloud indicates, however, there are some higher trees with a canopy height of approximately 22 m in the neighboring area which are obviously different from the vegetation of the 5270th measurement. We believe that main lobe leakage should be the cause for such a phenomenon, which is similar to the canopy estimation outlier found in [
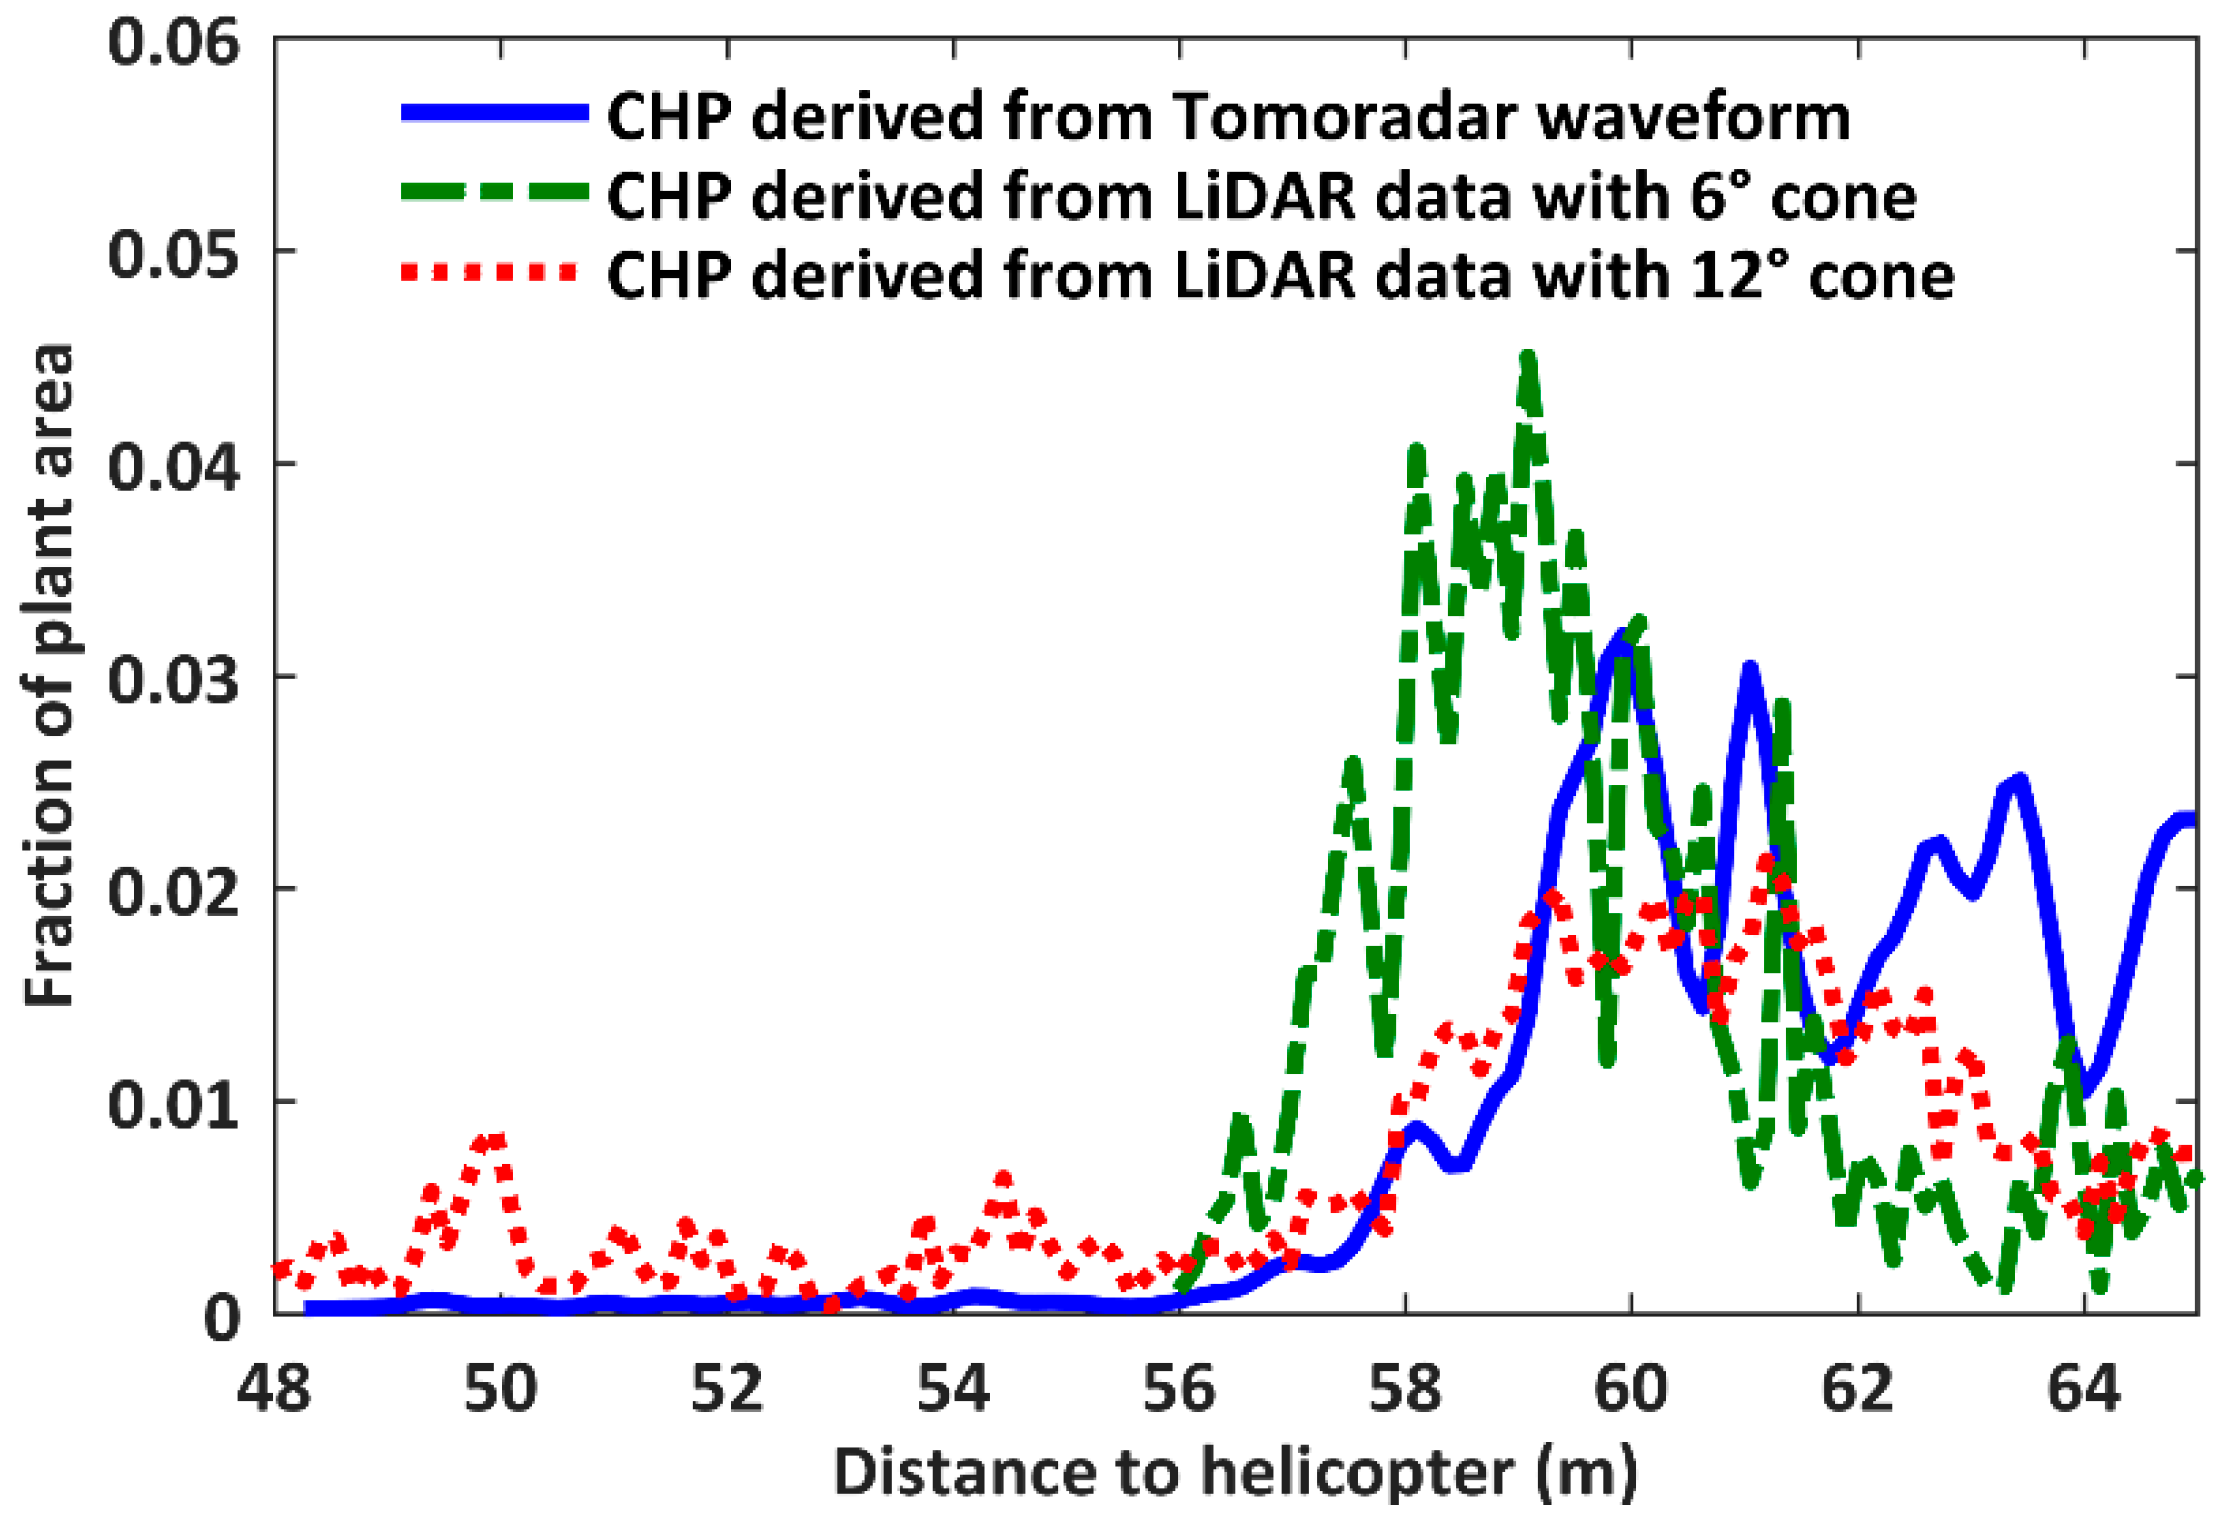
28]. To verify their impacts on the extraction of the canopy height profile, the Tomoradar footprint cone is expanded from six degrees to 12 degrees on purpose to contain these trees. The CHP derived from the 5270th Tomoradar waveforms and LiDAR data within cones of six degrees and 12 degrees are shown in
Figure 9.
We observe that the canopy height profile derived from the LiDAR data within the cone of 12 degrees is extremely distinguished from the original result within the cone of six degrees, as
Figure 9 presents, which becomes more dispersed and approaches that extracted from the Tomoradar waveform. The improvement of the correlation coefficient from 0 to 0.81 also confirms that it has a higher correlation with the Tomoradar result, and the reason is the main lobe leakage of the antenna pattern of Tomoradar system. The antenna pattern is usually strongly peaked along the microwave beam axis, and the spatial dimension is defined by the angular region over which the antenna power pattern is less than 3 dB below its value at the beam center. However, all antennas have side lobes and part of the received energy comes from outside the main 3 dB area. Thus, it can lead to some ambiguities due to radiation collected via the side lobes and misinterpreted as radiation in the main lobe, just like the example of the 5270th measurement. The influence of side lobes may be negative or positive, depending on the vegetation structure within the Tomoradar footprint cone, such as the composition, geometry, roughness, position, and so on.
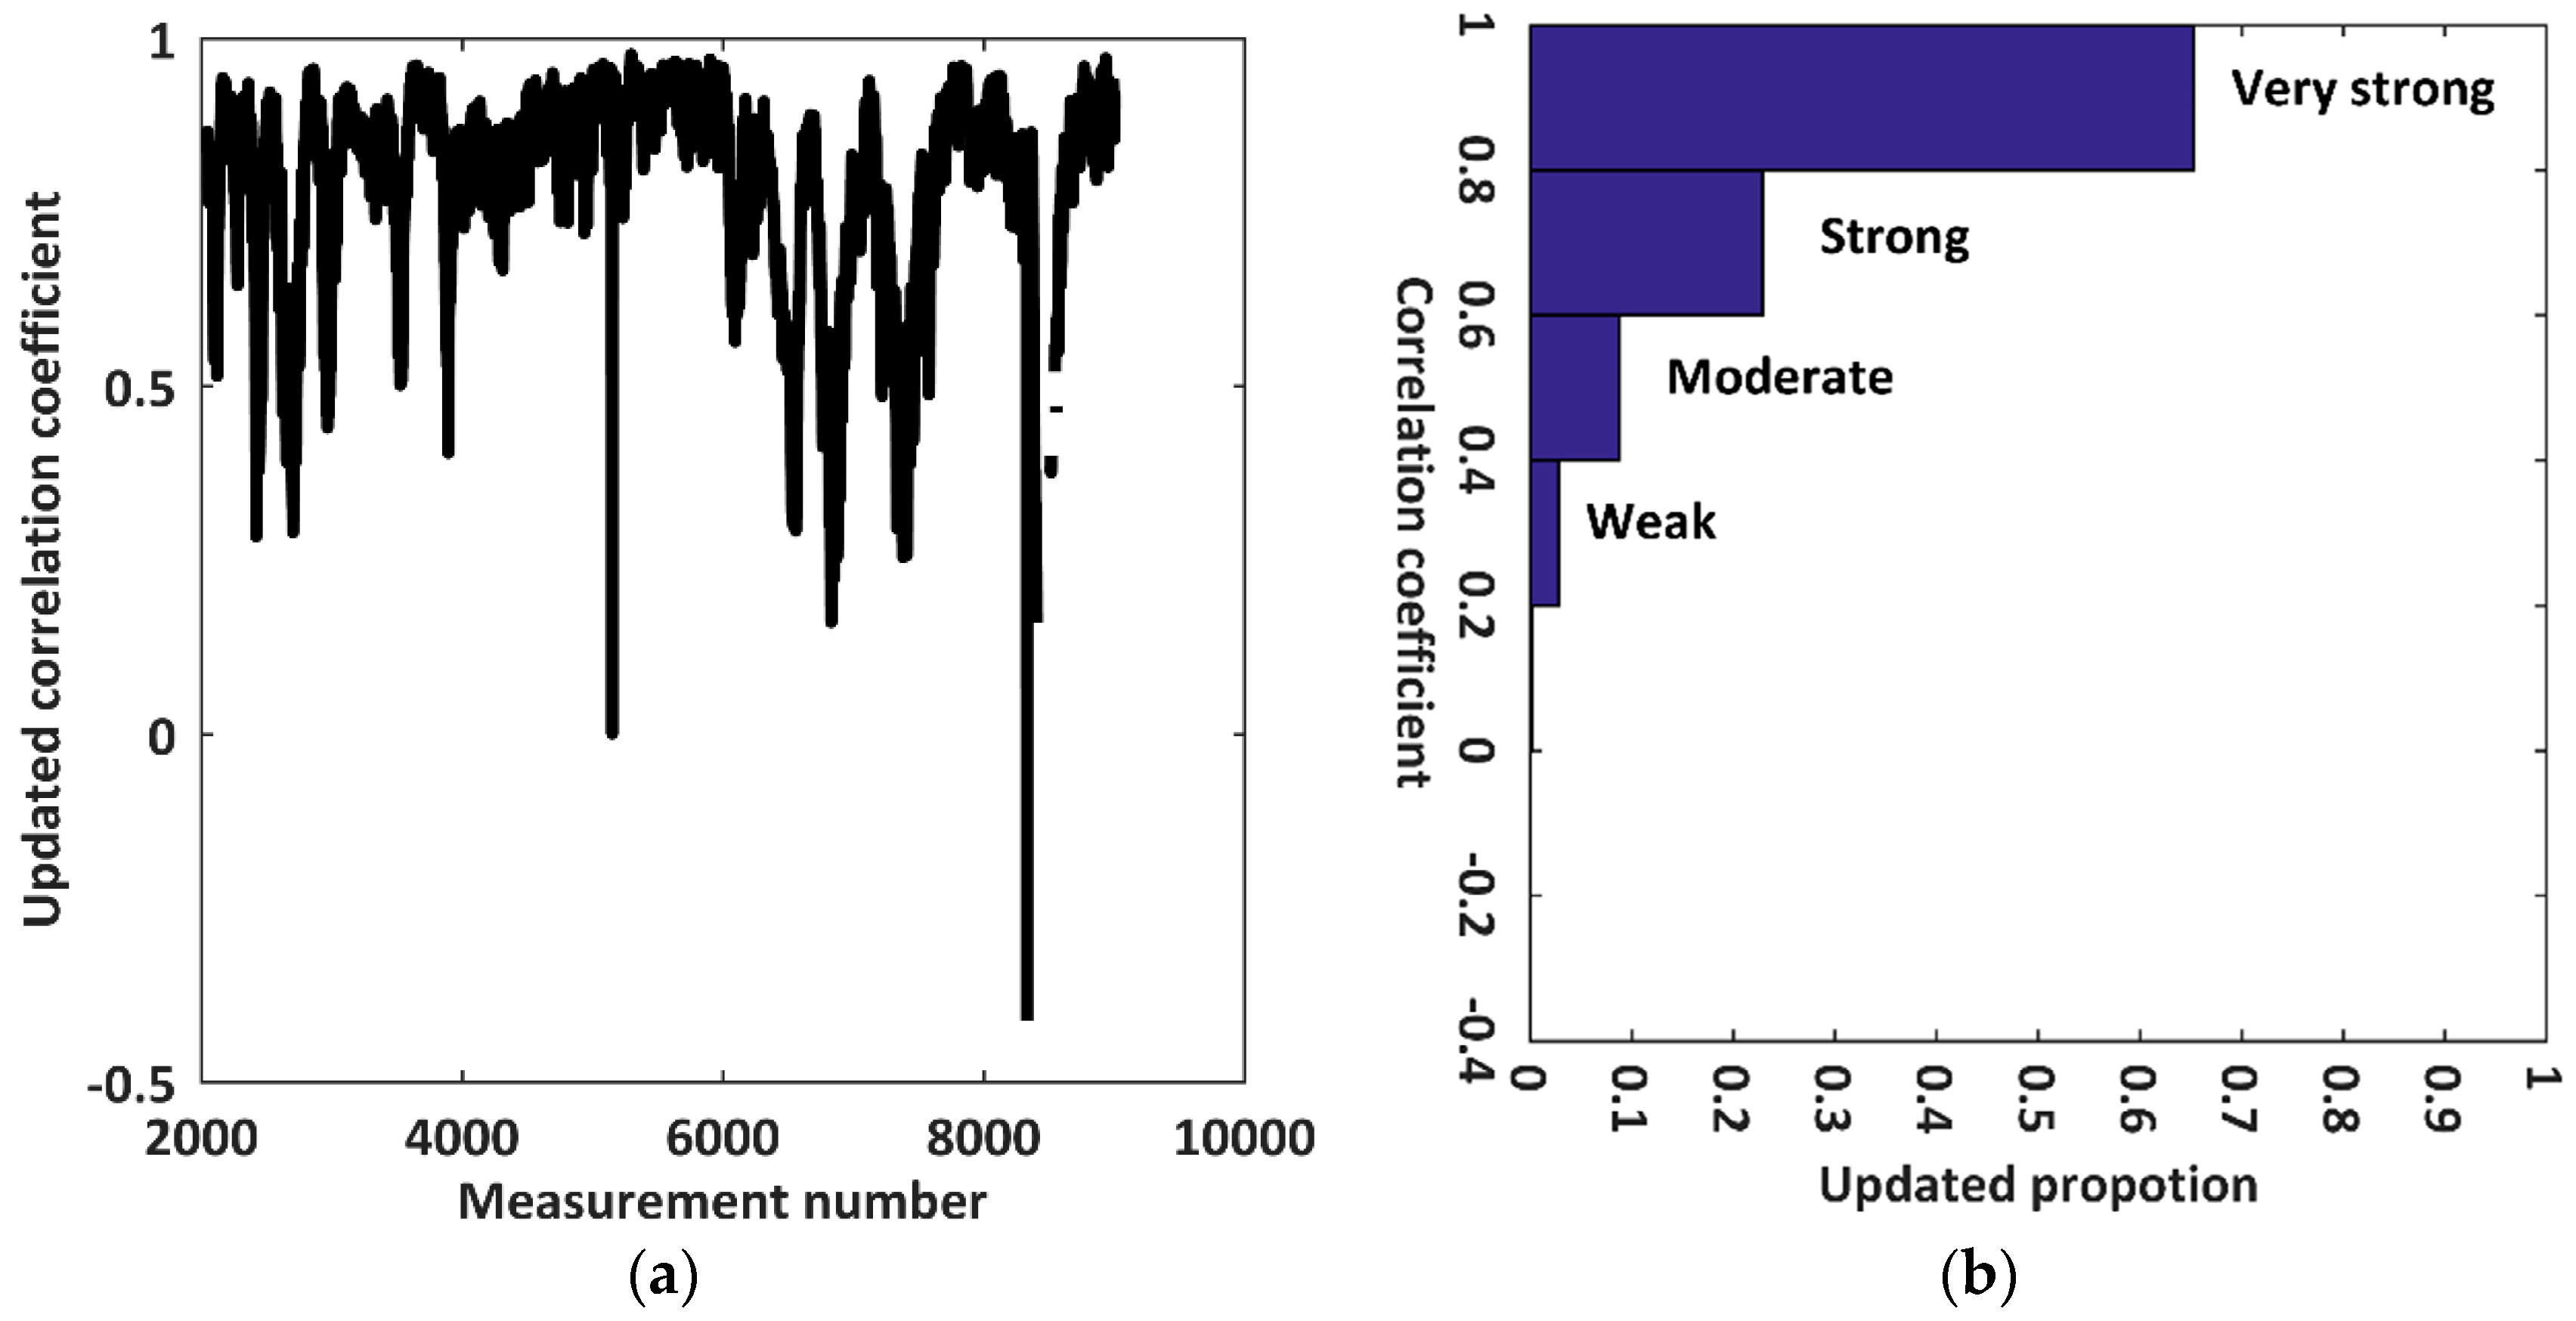
To eliminate the influence of side lobes on the extraction of the CHP, the Tomoradar footprint cone is selected as 20 degrees to comprise over 95% of the energy of the main lobe based on the Tomoradar antenna pattern offered by the antenna manufacturer. Hence, the updated correlation coefficients and histogram of the corresponding proportions are presented in
Figure 10.
The updated results in
Figure 10a demonstrated that most of the correlation coefficients greatly increase relative to those in
Figure 6a. Meanwhile, we noticed that the updated proportions of the correlation coefficients in
Figure 9b were dependent on the strength of the correlation: very strong (65.28%), strong (22.89%), moderate (8.79%), weak (2.82%), and very weak (0.22%). An overwhelming majority of the CHPs (96.96%) derived from Tomoradar waveforms had above-moderate correlation with those from the LiDAR data.
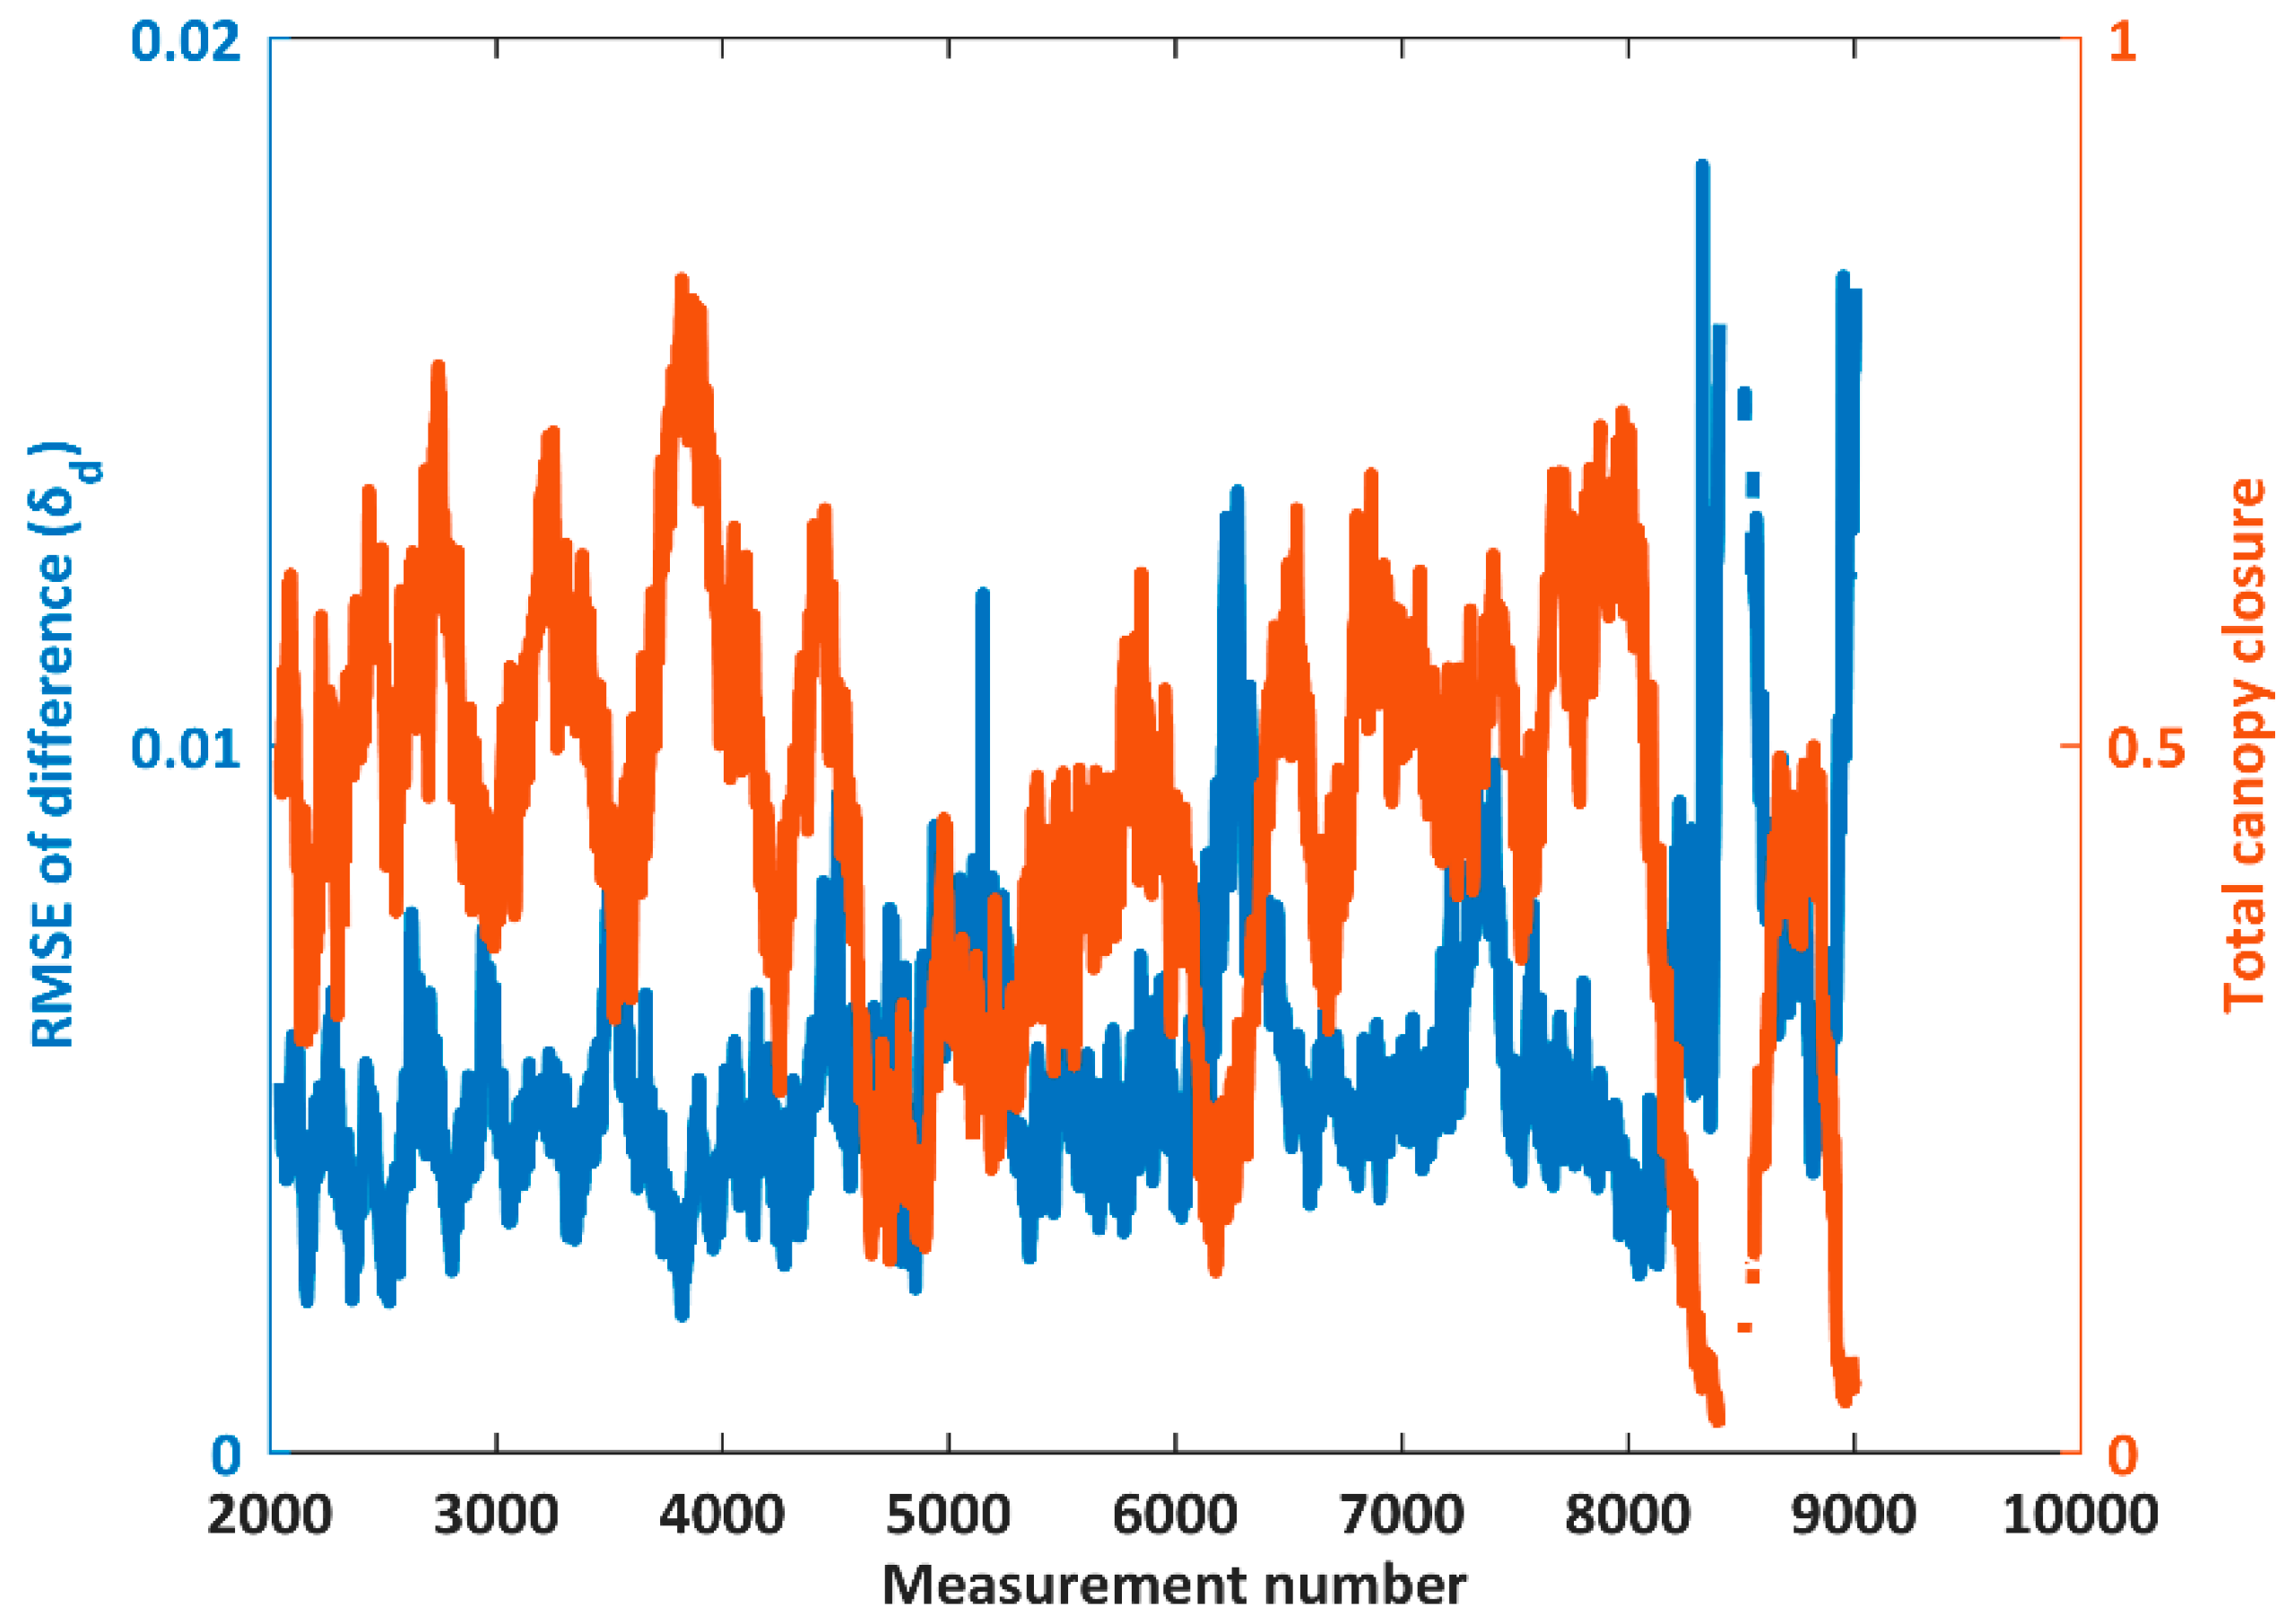
For quantitatively analyzing the differences of the CHP derived from Tomoradar waveforms and the LiDAR data, we calculated the RMSEs of the differences (
δd) for all 6766 measurements. Moreover, we presented the illustrations of
δd and total canopy closures in
Figure 11 to reveal the inner connections between them.
About 98% of the RMSEs of the difference (
δd) varied from 0.002 to 0.01, and the average of the difference (
μd) was less than 0.012. Furthermore, the RMSEs and total canopy closures fluctuated with completely opposite tendencies for all 6766 measurements. This suggested that CHP derived from Tomoradar waveforms were approaching those from the LiDAR data, when the microwave or laser transmits into a relatively open canopy. However, the differences increased if the microwave or laser projected into a denser canopy due to the different penetration capabilities. In
Figure 11, the average of
δd for a canopy with smaller total closure (less than 0.5) is 0.0042, and yet which is 0.0058 for a canopy with larger total closure (larger than 0.5).
3.2. Linear Regression Results
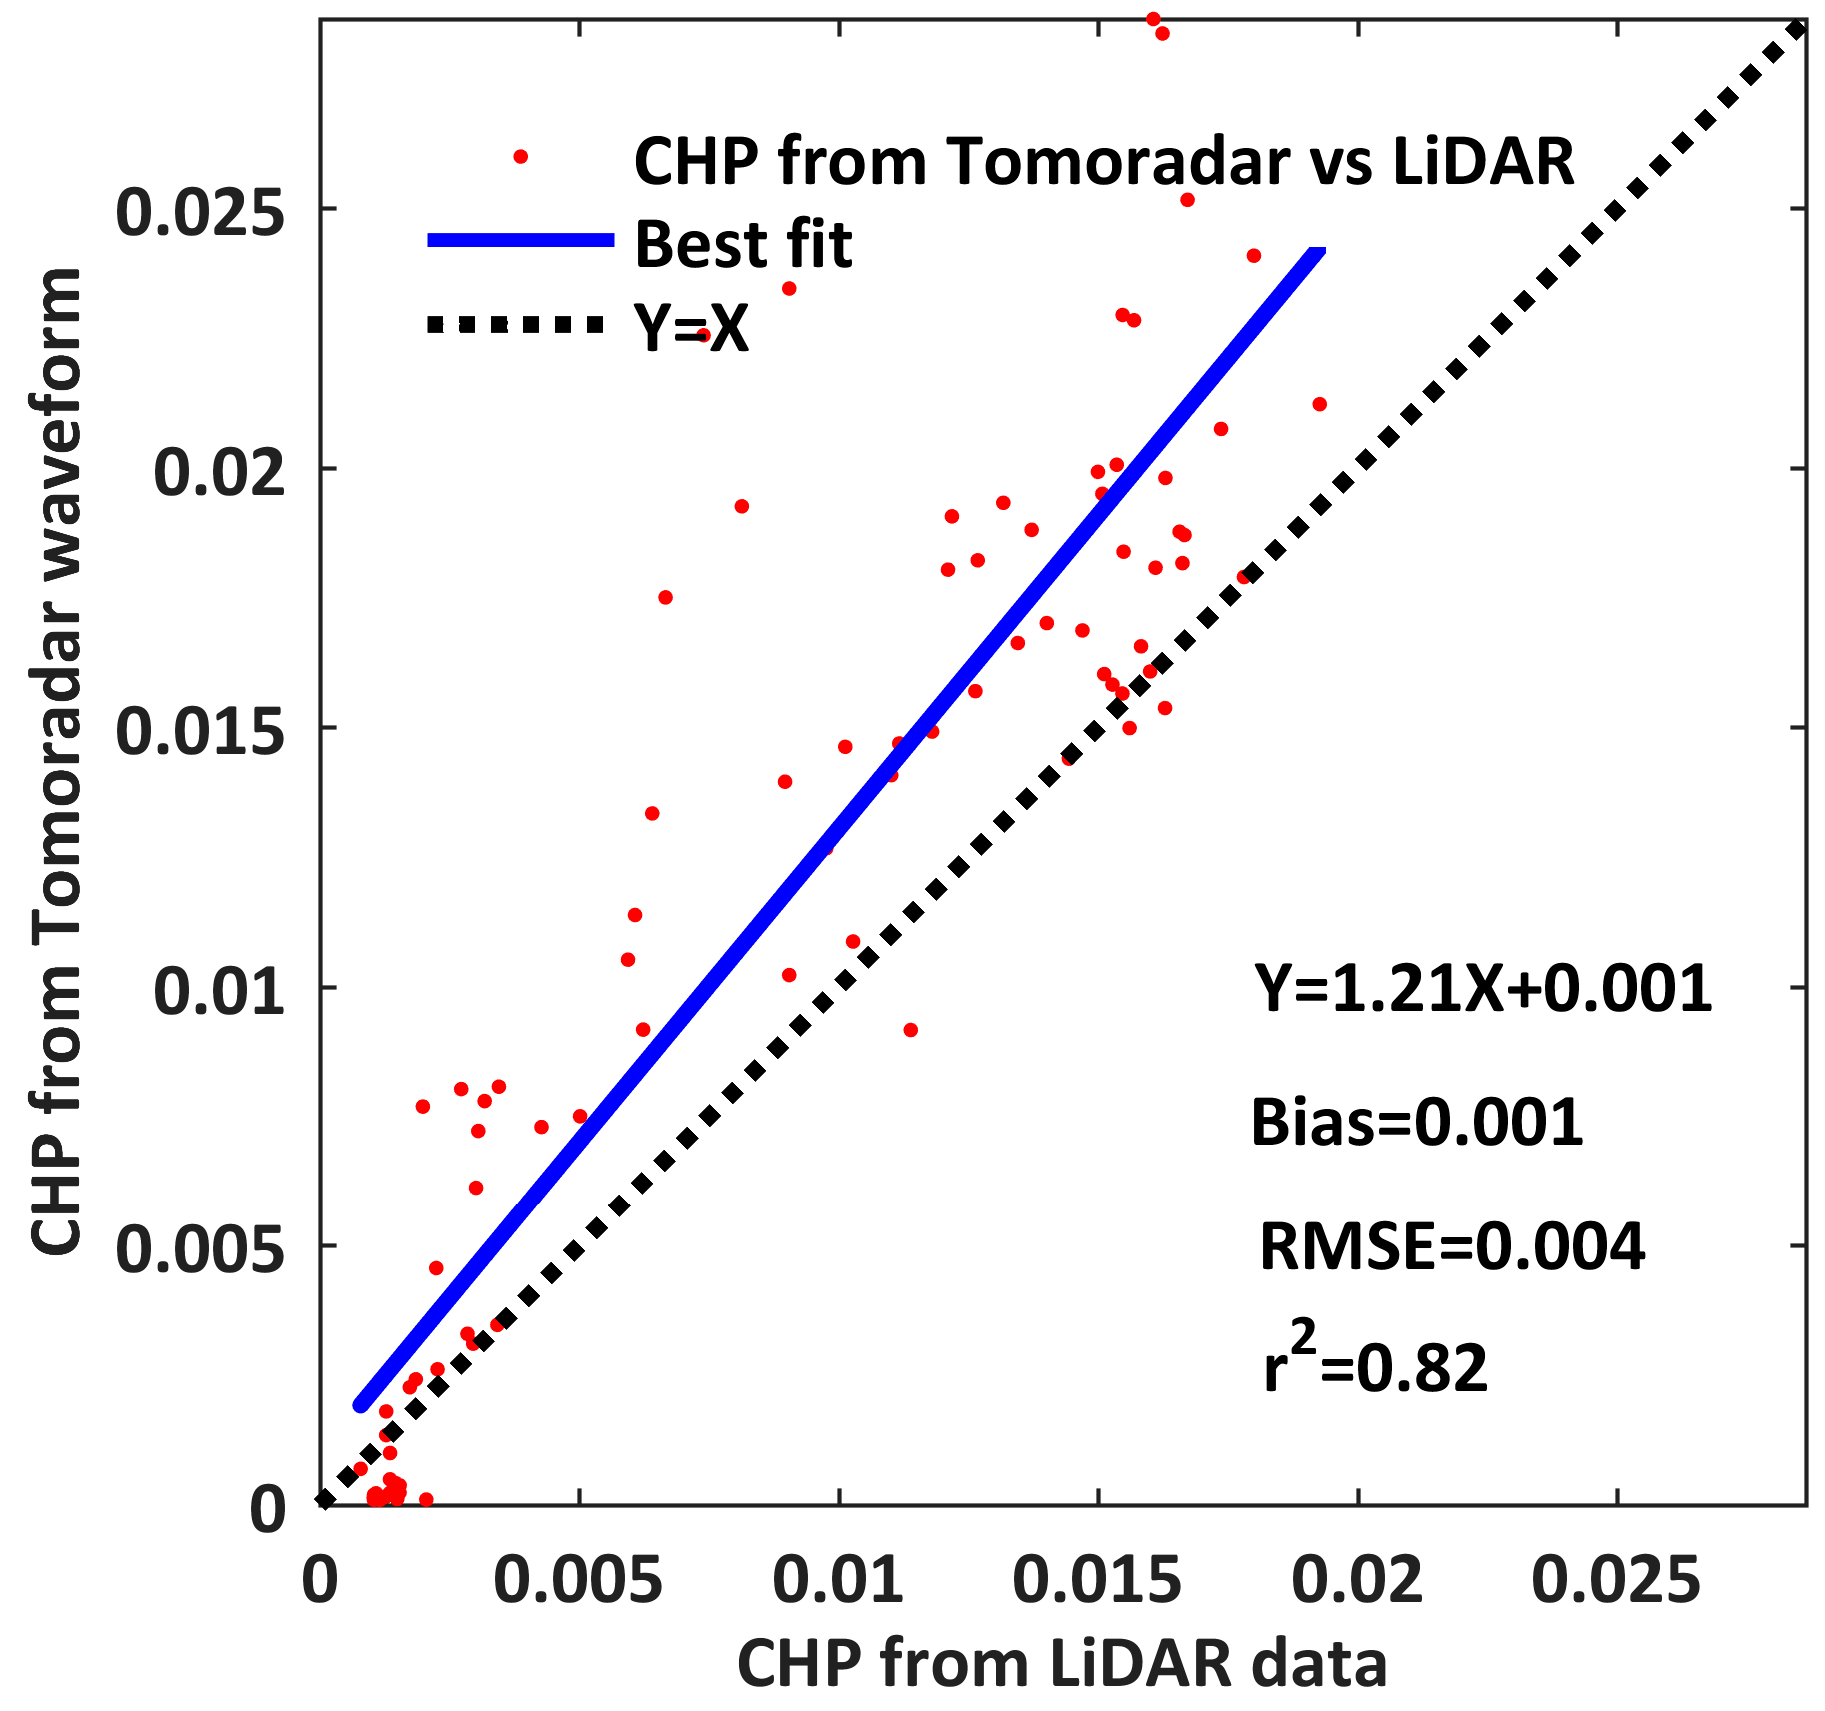
The purpose of linear regression is to explore whether the CHPs derived from Tomoradar waveform keep the linear relationships with those from LiDAR data. Taking the 5700th measurement in the stripe of the study area as an example, we presented a scatterplot of the CHP from Tomoradar waveforms versus that from the LiDAR data and the linear regression results in
Figure 12.
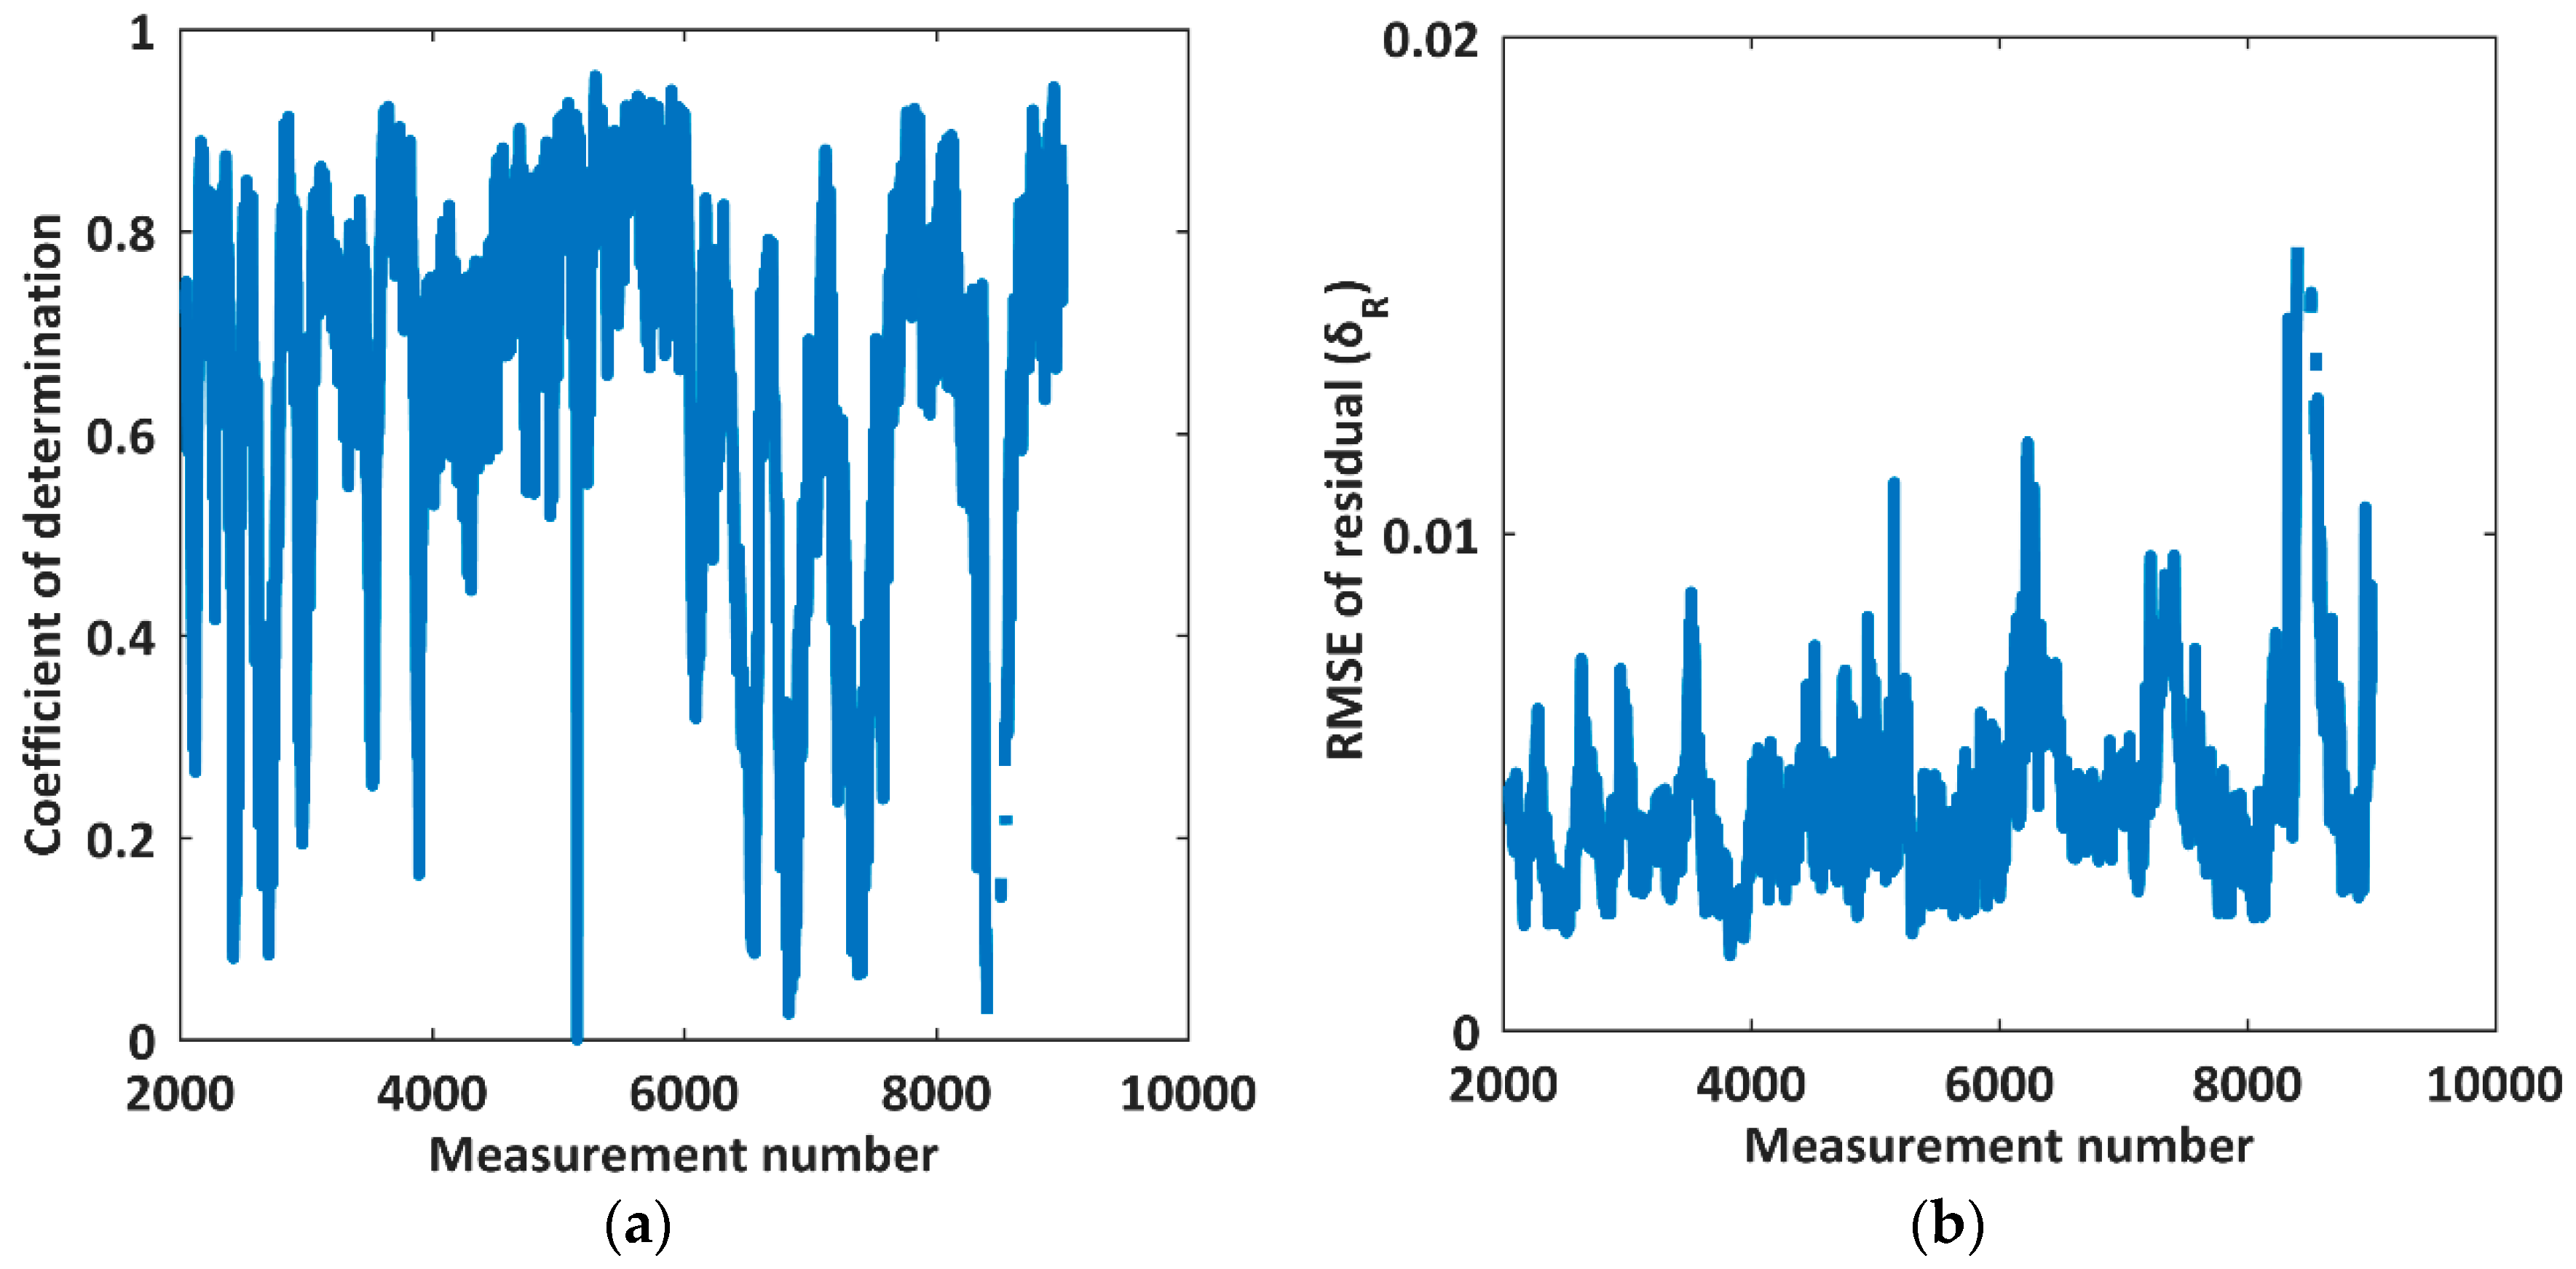
For obtaining more linear regression results of the CHPs, we computed the coefficients of determination and the RMSEs of residuals for 6766 measurements and provided the corresponding distributions in
Figure 13. To investigate the relationship between the regression results and the differences of the CHP, the correlation coefficients and the RMSEs of the differences were also introduced in
Figure 13.
Comparing the results of different analyses and linear regressions, we noticed that the coefficients of determination (
r2) and RMSEs of residual (
δR) present similar distributions with correlation coefficients (
R2) and RMSE of the differences (
δd), individually. However, both R
2 and
δd were greater than
r2 and
δR, respectively. The comparisons discovered that regression results should be better when the CHPs derived from the Tomoradar waveforms correlate well with those from the LiDAR data. Meanwhile, in
Figure 12a, 79.89% of the coefficients of determination were larger than 0.5, which denoted that most of the relationships between the CHPs from Tomoradar waveforms and those from the LiDAR data can be accurately explained by using the linear regression models. Furthermore, 98.89% of the RMSEs of residuals (
δR) ranged from 0.001 to 0.01, and the averages of the residuals were approximately zero in
Figure 12b.
4. Conclusions
In this research, we utilize raw data originating from both Tomoradar and VLP-16 LiDAR on-board the same airborne platform to derive the CHP. Based on the evaluation indicators, including the correlation coefficient, the RMSE of the difference, coefficient of determination, and the RMSE of the residuals of linear regression, the comparisons of the CHP extracted from these two sensors were thoroughly expounded.
The 6766 effective measurements in one stripe of the study area in Southern Finland were applied in the derivation of the canopy height profile. Through calculation and analysis, we observed that approximately 74.59% of the measurements had above-moderate correlation strength (a correlation coefficient greater than 0.4). However, if the Tomoradar footprint beam width was defined as 20 degrees to contain over 95% of the transmitting energy of the main lobe, the comparisons of the CHPs derived from Tomoradar and LiDAR data would be notably changed: 96.96% of the CHPs derived from the Tomoradar waveforms correlated well with those from the LiDAR data (the correlation coefficient is greater than 0.6). Based on the Tomoradar footprint cone, we obtained the following analysis results: (1) about 98% of the RMSEs of the difference took values from 0.002 to 0.01, and all averages of the difference (μd) were less than 0.012; (2) 79.89% of the coefficients of determination were larger than 0.5; and (3) 98.89% of the RMSEs of residuals (δR) ranged from 0.001 to 0.01.
Through investigations in the pape, we can draw some conclusions: (1) Tomoradar waveforms could be employed in the derivation of the CHP, and provide more detailed information inside the canopy than the LiDAR data; (2) in a region with a relatively open canopy, the CHPs from Tomoradar waveforms correlate well and maintain a linear relationship with those from the LiDAR data. However, the differences of the CHP from Tomoradar waveforms and LiDAR data increased in a region with a denser canopy; and (3) because of main lobe leakage, the partial comparisons would be influenced, when the vegetation characters within the outside portion of the main lobe, including density, composition, geometry, and roughness were obviously different from those within the beam width (−3 dB).
Due to the differences in wavelength and detection means between the Tomoradar and LiDAR, the derived canopy parameters would be diverse to some extent. Except for the CHP, more canopy results, such as percentile height, leaf area index (LAI), biomass, and so on, should be compared in future research. The analysis may provide some references for the application of Tomoradar waveforms and data fusion of LiDAR data in forest investigations. A mechanical scanning version of the Tomoradar might also be investigated for a wider swath with a higher operation efficiency.


 ,
, 

