Plasmaspheric Electron Content Inferred from Residuals between GNSS-Derived and TOPEX/JASON Vertical TEC Data


1
School of Geodesy and Geomatics, Wuhan University, Wuhan 430079, China
2
Chinese Antarctic Center of Surveying and Mapping, Wuhan University, Wuhan 430079, China
*
Authors to whom correspondence should be addressed.
Remote Sens. 2018, 10(4), 621; https://doi.org/10.3390/rs10040621
Submission received: 13 March 2018
/
Revised: 31 March 2018
/
Accepted: 12 April 2018
/
Published: 18 April 2018
(This article belongs to the Special Issue Multi-Constellation Global Navigation Satellite Systems: Methods and Applications)
Abstract
:The plasmasphere, which is located above the ionosphere, is a significant component of Earth’s atmosphere, and the plasmasphere electron content (PEC) distribution is determined by different physical mechanisms to those of the ionosphere electron content (IEC). However, the observation for the PEC is very limited. In this study, we introduced a methodology (called zero assumption method, which is based on the assumption that PEC can reach zero) to extract the PEC over TOPEX/JASON (T/J) and global navigation satellite system (GNSS) overlapping areas. Results show that the daily systematic bias (T/J vertical TEC > GNSS-derived vertical TEC) for both low (2009) and high (2011) solar activity condition is consistent, and the systematic bias for JASON2 and JASON1 is different. We suggest that systematic biases predominantly arise from the sea state bias (SSB), especially the tracker bias. After removing the systematic bias, we extracted reliable PEC inferred from differences between GNSS-derived vertical TEC and T/J vertical TEC data. Finally, the characteristics of the plasmaspheric component distribution for different local times, latitudes, and seasons were investigated.

1. Introduction
The plasmasphere is located where the ionosphere and magnetosphere meet and contains relatively dense and low energy plasma. The plasmasphere electron content (PEC) is several orders less than the ionosphere electron content (IEC), but the contribution of PEC to the ionosphere can be significant [1,2]. The plasmasphere density distribution is determined by different physical mechanisms to those of the ionosphere, and the existence of the plasmasphere makes it difficult to interpret data from ionospheric measurements [3]. Despite these difficulties, many efforts and approaches have been proposed to estimate PEC and identify the plasmaspheric contribution to the ionosphere total electron content (TEC). With this aim, several researchers have attempted to construct plasmasphere models [4,5,6,7,8], and others have used onboard low earth orbit (LEO) satellites measurements to analyze PEC and its relative contribution to ionosphere TEC. Specifically, PEC can be estimated using dual frequency signals transmitted by GPS satellites and recorded by GPS receivers on LEO satellites. Then, the contribution to GPS TEC can be calculated from ground-based GPS TEC and onboard LEO satellites PEC [9,10,11,12]. For example, Yizengaw et al. [9] discussed the PEC contribution based on JASON1 onboard and ground-based GPS measurements. They showed that the relative contribution of PEC had a minimum value during the day (approximately 10%) and a maximum value during the night (up to 60%). Moreover, the maximum contribution occurs at equatorial areas because the GPS raypath distance through the plasmasphere is longer at low latitudes than at mid-high latitudes. González-Casado et al. [10] described an approach that did not depend on fixed altitudes to separate contributions of the ionosphere and plasmasphere, and their results are consistent with previous studies and model calculations. Furthermore, Zhang et al. [12] utilized the podTEC measurements from COSMIC satellites to GPS satellites signals under solar minimum conditions, and studied the PEC variations with geomagnetic latitudes, magnetic local times and seasons, as well as selected longitudes.
We know that GPS TEC is the sum of IEC and PEC; therefore, the plasmasphere component to the GPS TEC can be derived by comparing with collated measurements from ionosondes, incoherent scatter radar data, or LEO satellite measurements (e.g., FORMOSAT-3/COSMIC, T/J). Then, the residuals of the comparisons are assumed to estimate PEC [2,13,14,15,16]. For instance, Belehaki et al. [13] extracted PEC from residuals between GPS-derived TEC and ground-based ionosonde IEC at Athens, showing that PEC exhibits a diurnal variation with a morning minimum and an evening maximum, and that PEC contribution describes the significance of the plasmasphere to the ionosphere, especially during the night. Chong et al. [14] investigated PEC from ISR and GPS observations at Millstone Hill, and showed that both PEC and its relative contribution exhibit diurnal variation patterns. Cherniak et al. [2] estimated PEC (h > 700 km) from GPS TEC and COSMIC IEC values under solar minimum conditions (2009), and revealed that PEC varies minimally with time of day at mid-latitudes, and that PEC contributions show a clear dependence on time, with maximum values during night (>50–60%) and smaller values during day (approximately 25–45%).
Similar approaches have also been used for plasmaspheric studies using T/J satellites. Jee et al. [15] compared GPS vTEC and T/J vTEC for 1998–2009, and reported a positive relative TEC difference (i.e., GPS vTEC > T/J vTEC) in the PEC contribution to the ionosphere, which was largest in the early morning sector (up to 100%). However, many studies have found that T/J vTEC has a positive systematic bias of 2–5 TECu above real ionospheric TEC values when compared to other independent sources (i.e., T/J vTEC > GPS vTEC) [17,18,19,20,21,22,23]. This is paradoxical because GPS satellite altitude (~20,000 km) is higher than that of T/J satellites (~1336 km); thus, GPS vTEC should be larger than T/J vTEC due to it including the plasmasphere contribution above the T/J satellite orbital altitude. Chelton et al. [17] pointed out that the relative TEC bias indicates a systematic error in the T/J sea state bias (SSB) correction, which is an empirical model with limited accuracy, and SSB assembles corrections for the sum of the electromagnetic (EM) bias, skewness bias and tracker bias. Meza et al. [20] performed a comparison of GPS-based la plata ionospheric model (LPIM) with T/J estimates during quiet geomagnetic days in 1997. They concluded that systematic biases for T/J-LPIM were 2.5–3.0 TECu, and larger during equinox than during solstice periods. Brunini et al. [22] believed that the positive bias was mainly caused by a combination of LPIM underestimation (at low latitudes) and T/J SSB correction (at mid-latitudes). Azpilicueta and Brunini [23] reported the constant bias on TOPEX vTEC was caused by miscomputing the ionospheric correction.
In this study, for the first time, zero-assumption methodology was introduced to determine the systematic bias over T/J and GNSS overlapping areas for low (2009) and high (2011) solar activity condition. After removing the systematic bias, we extracted PEC inferred from differences between GNSS-derived vTEC and T/J vTEC data. Finally, the characteristics of the plasmasphere component for different local times, latitudes, and seasons were investigated.
2. GNSS-Derived vTEC Data and JASON vTEC Data
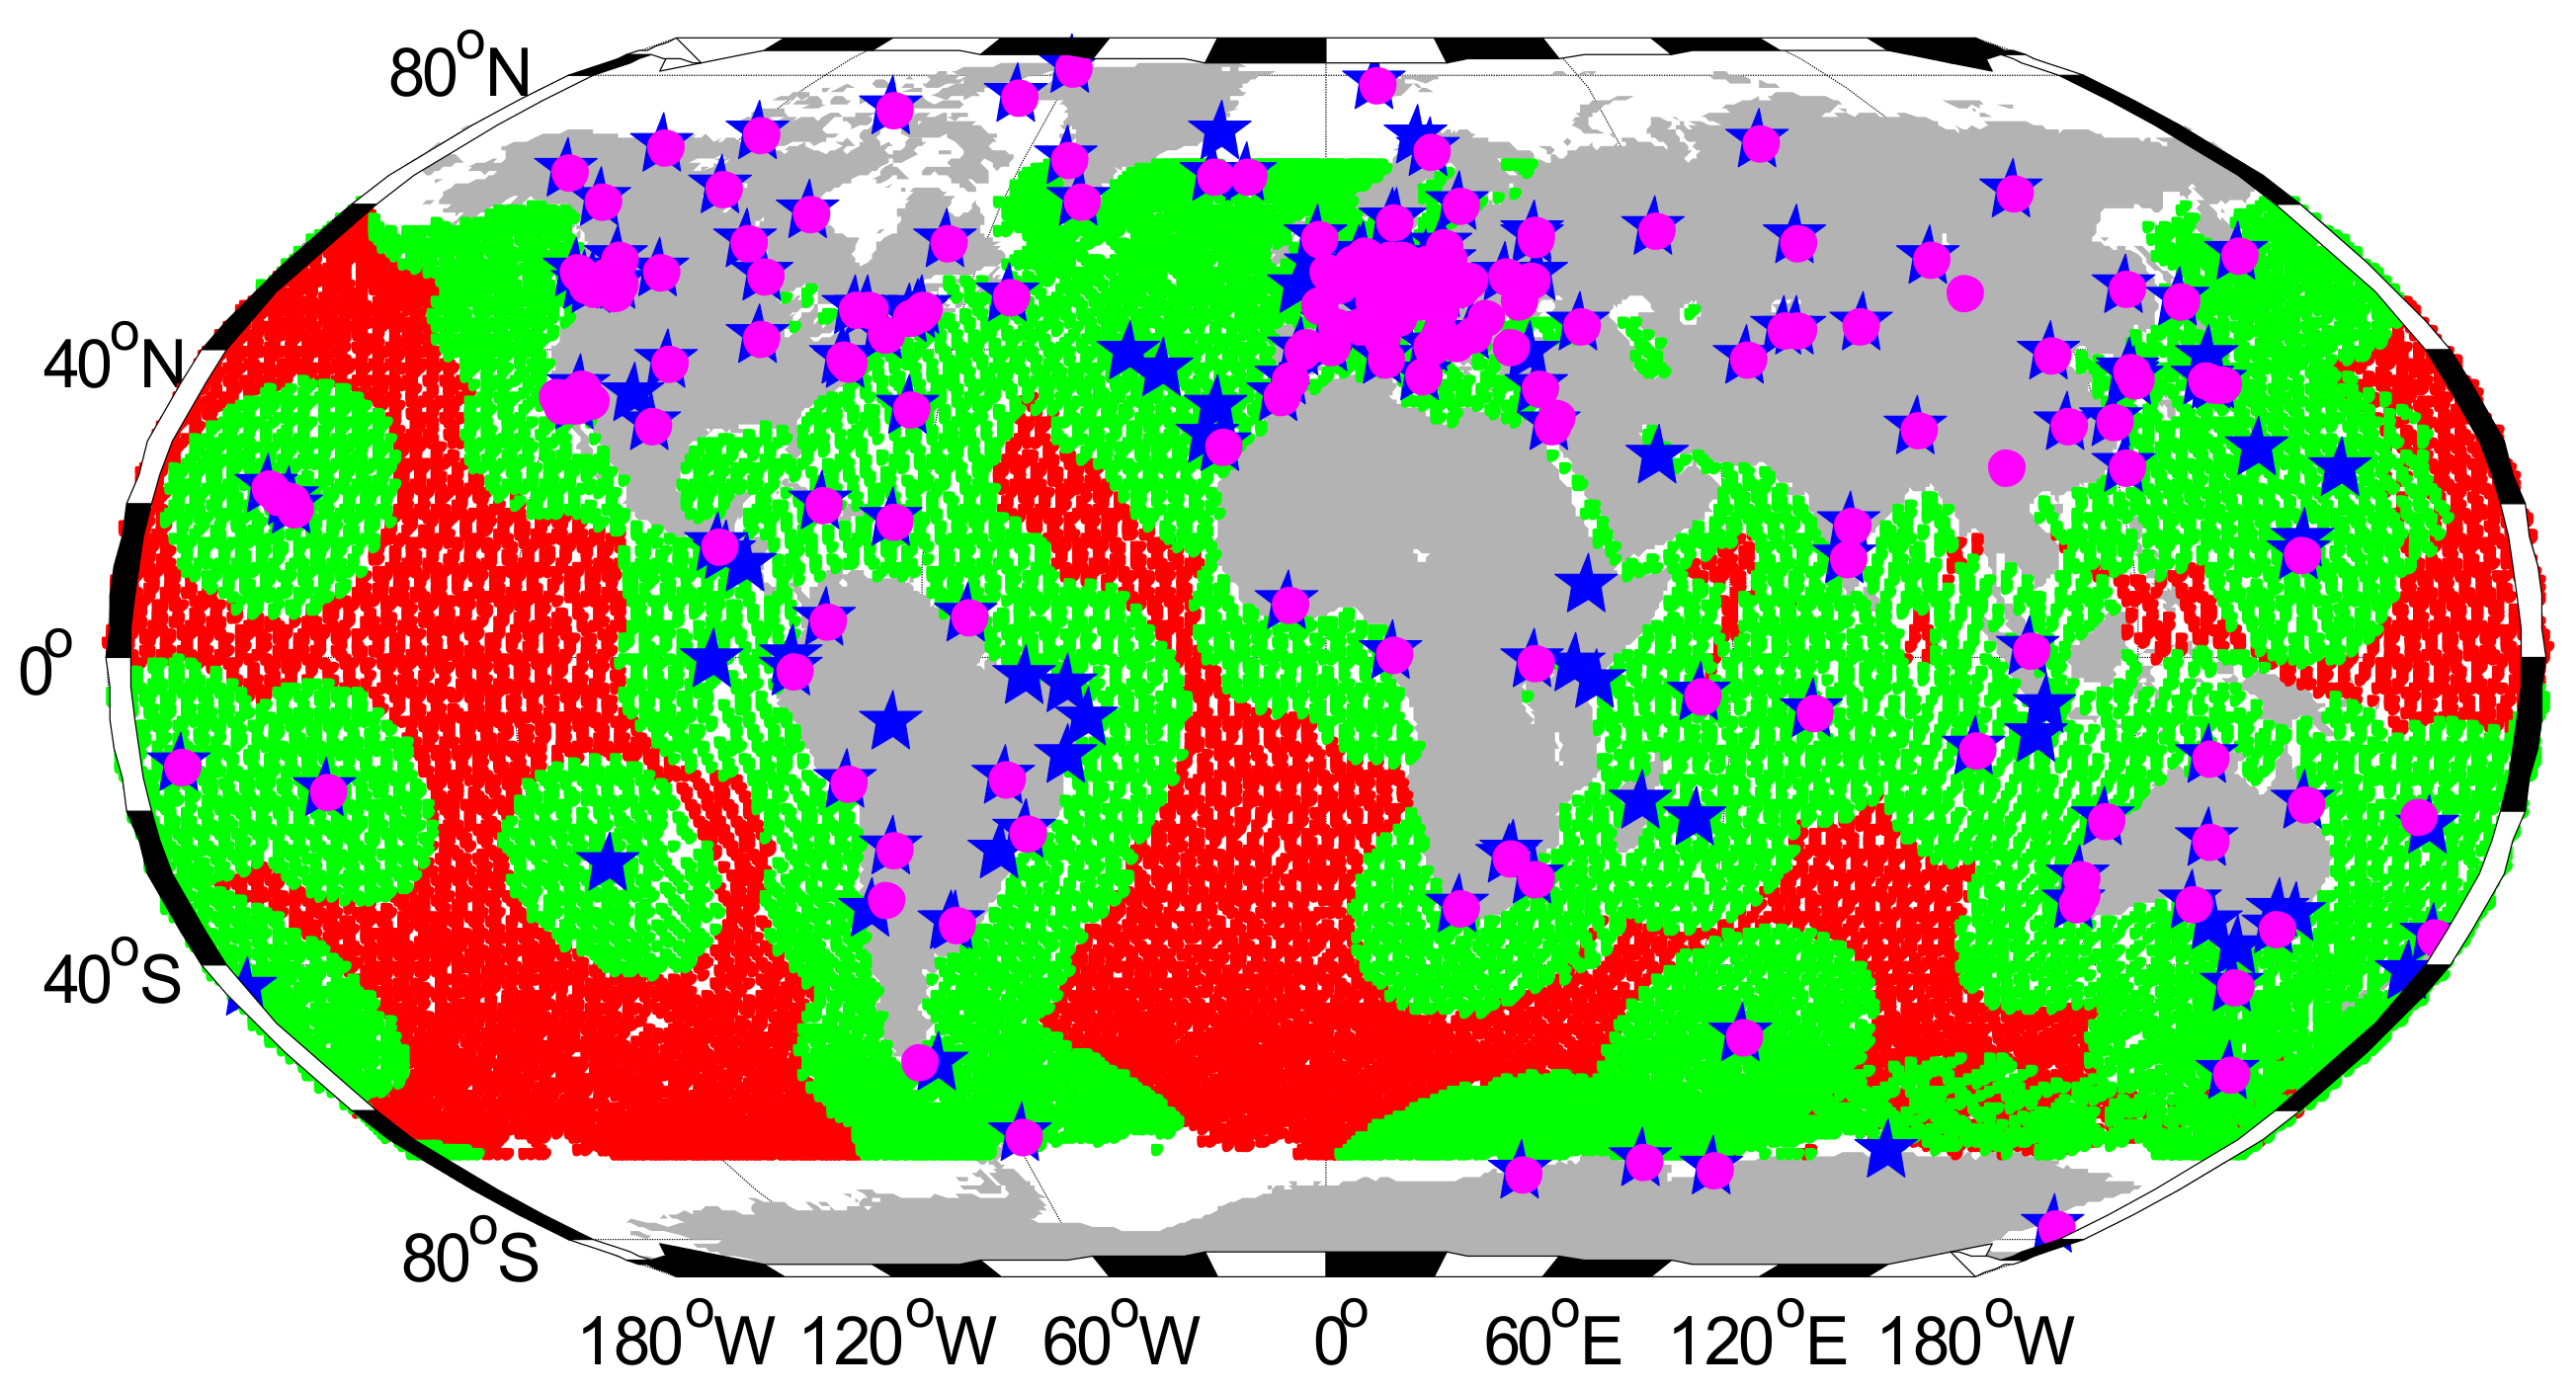
Based on GNSS dual-frequency code and phase measurements from globally distributed International GNSS Service (IGS) tracking stations (Figure 1), it is possible to invert Global Ionosphere Maps [24,25,26]. GNSS TEC used in this study is obtained from GIMs of the Center for Orbit Determination in Europe (CODE), the Jet Propulsion Laboratory (JPL), and the Polytechnic University of Catalonia (UPC) for 2009. The approaches used by these three analysis centers to provide global ionosphere products differ, but their databases are almost the same. CODE’s GIM is developed by a 15 × 15 spherical harmonic function model with a 2-h resolution [27,28]. JPL’s technique is based on a linear composition of bi-cubic spline interpolation within 1280 spherical triangular tiles that tessellate the ionosphere, corresponding to 642 vertices [29]. UPC independently computes the TEC with a two-layer tomographic model and an interpolation scheme, with the help of the IRI model to improve the UPC products [19,26]. Besides, Nykiel et al. [30] presented an orthogonal projection technique for mapping TEC, which allows us to visualize ionospheric irregularities. In GIMs computation, several error sources can limit the ionosphere model accuracy: the spherical symmetry assumption, when the elevation-dependent mapping function is used to convert slant TEC (sTEC) to vertical TEC (vTEC); the ionosphere layer height, used to describe the vTEC distributions; the lack of GNSS data over wide areas, such as the sea and southern mid-high latitude areas; and the differential code bias for GNSS satellites and receivers.
The T/J vTEC data are a by-product of the dual-frequency satellite radar altimeter missions to measure the surface height of the global oceans. The TOPEX, JASON1/JASON2/JASON3 missions all operate simultaneously at 13.575 GHz (Ku band) and 5.3 GHz (C band), flying at an identical orbit altitude (approximately 1336 km) with an inclination angle of 66° and a period of 112 min [15,31,32]. By measuring the range on two different frequencies, the T/J altimeter can provide a direct vTEC over the oceans (worst case of GNSS-derived vTEC) up to the T/J orbit altitude [17,22,33,34]. If Ku band ionospheric range correction is calculated as presented by Brunini et al. [22], then the vTEC can be expressed as follows:
where is the Ku band ionospheric range correction, and is the band frequency in GHz. Similar to the process suggested by Imel et al. [32], T/J vTEC used in our analysis was averaged over a 21-s smoothing window along track to reduce the inherent noise effects of the altimeters. Applying this technique continuously suggests that the precision of T/J vTEC estimates is accepted to be 1 TECu [32,35,36]. In addition, considering the resolution of the GIM in this study, the smoothed T/J vTEC was sampled for 15 s after the 21-s running window.
3. Data Processing and Analysis
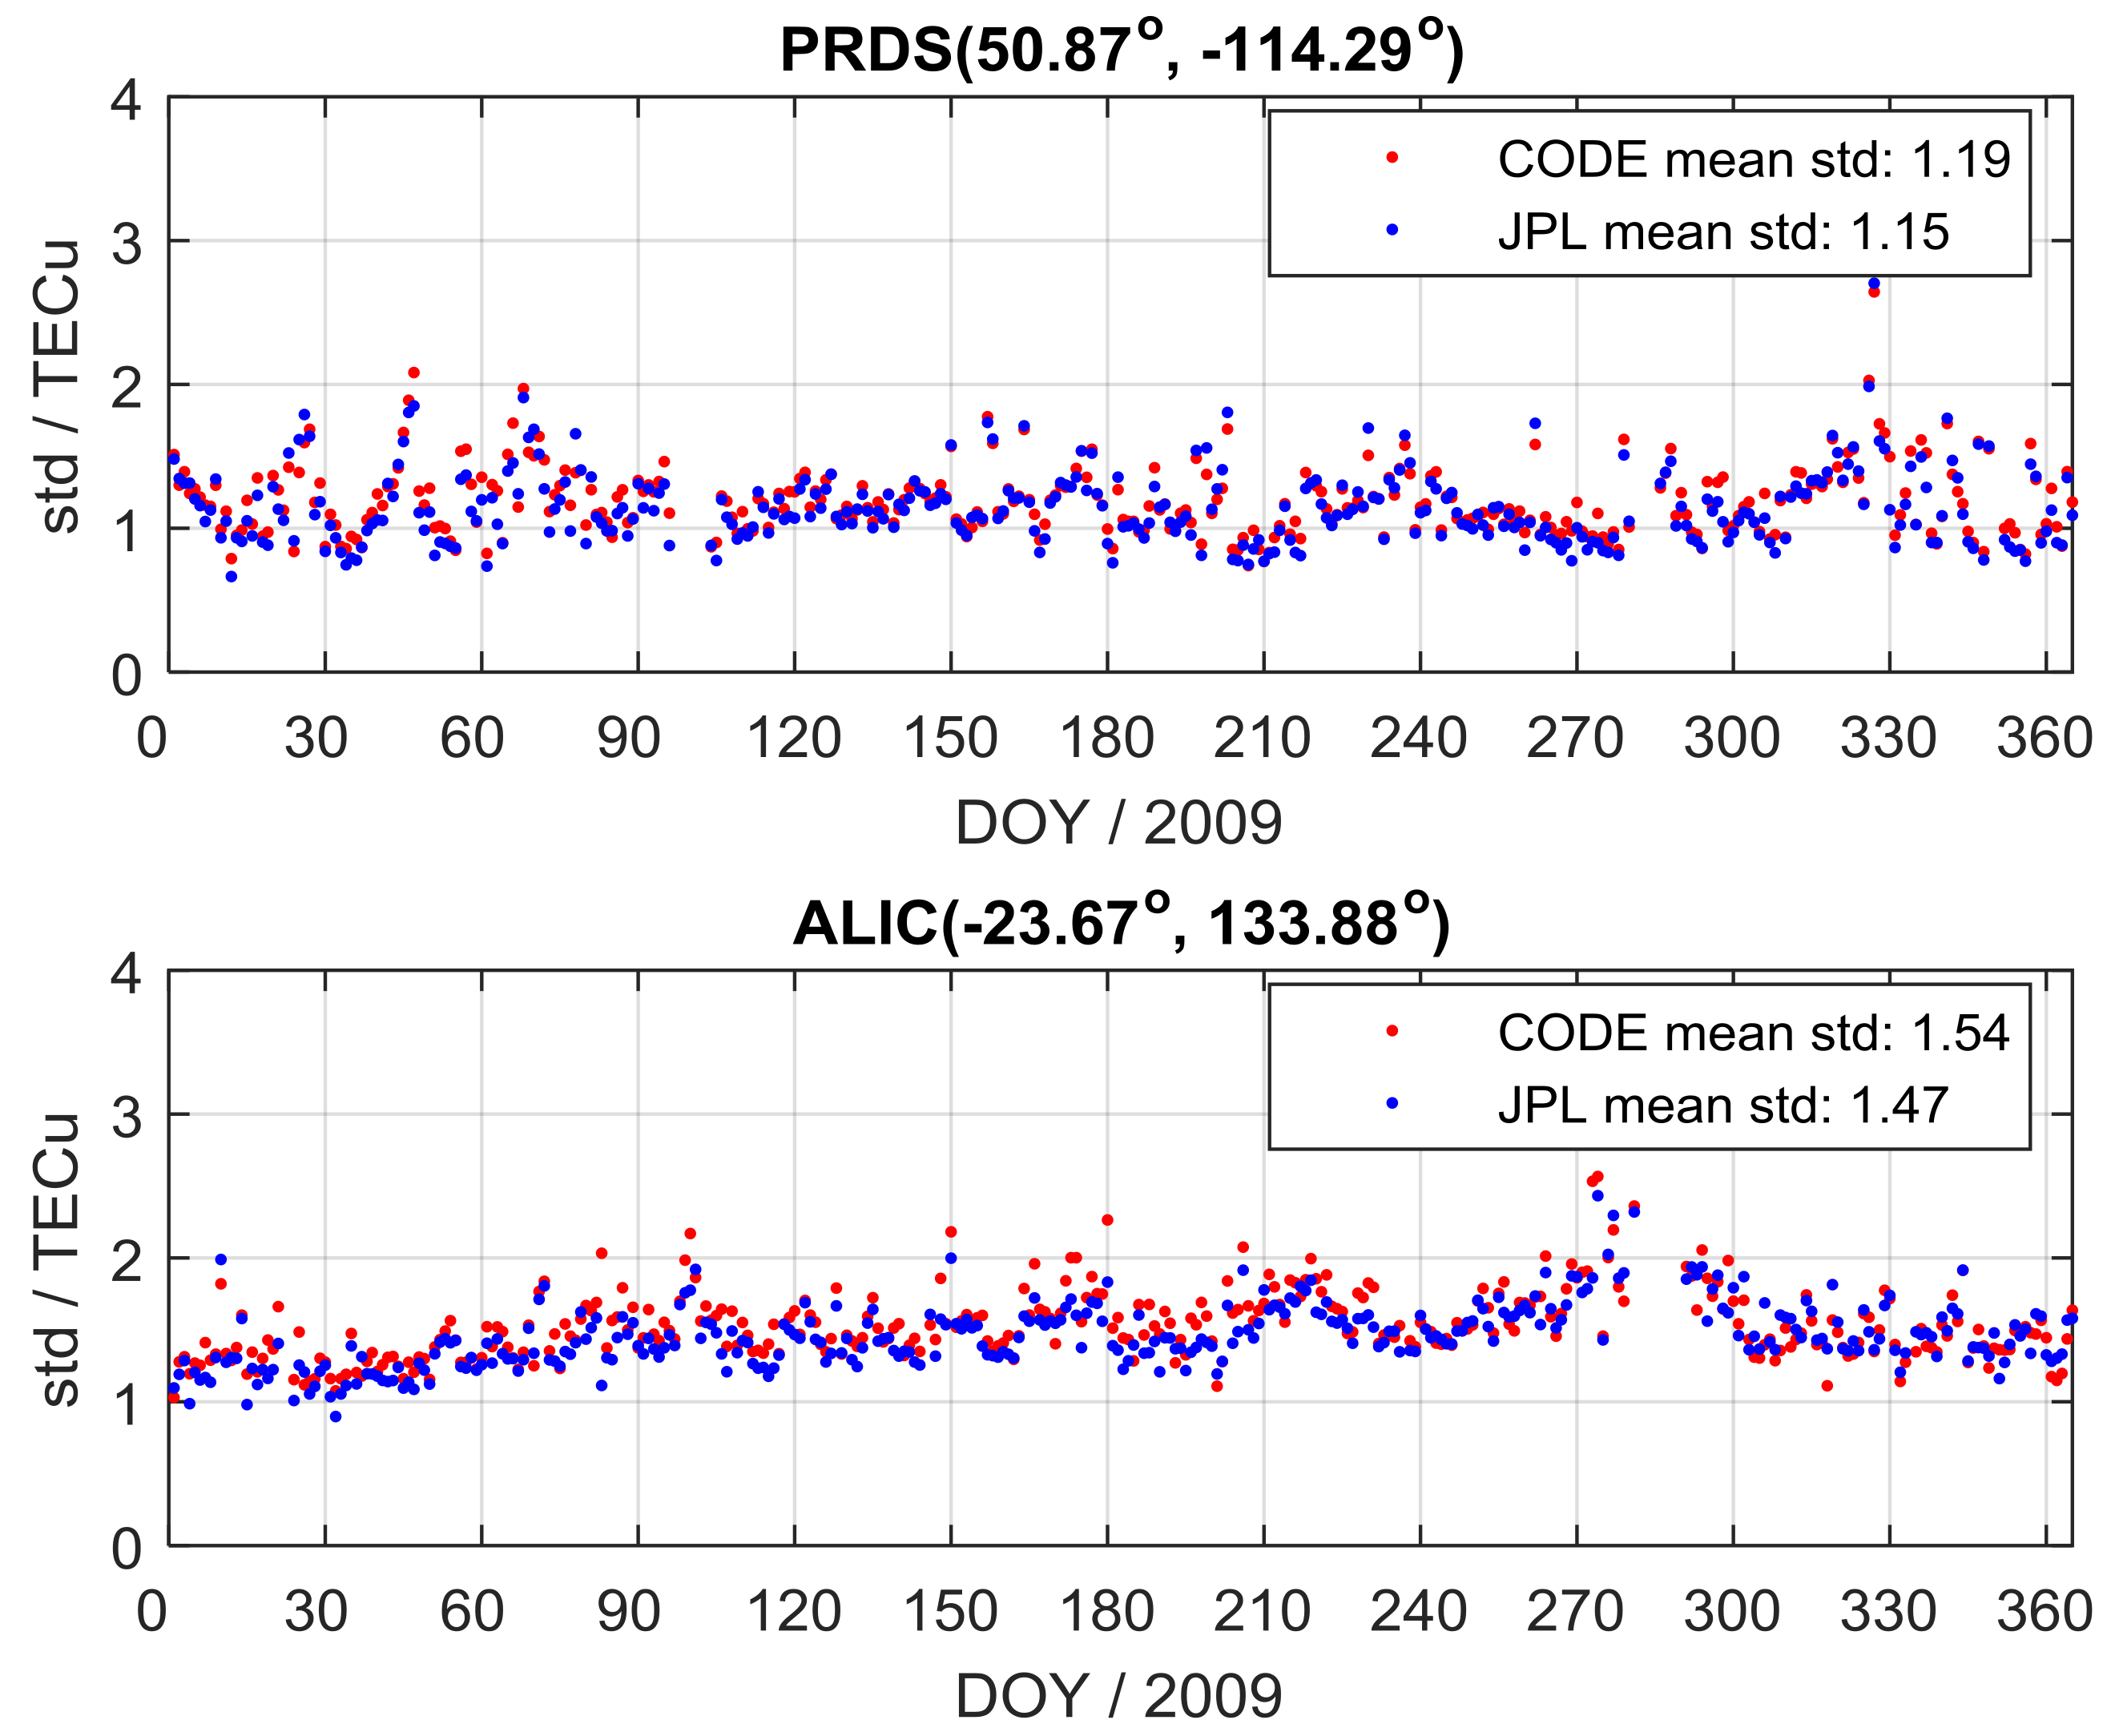
In this study, GIM-derived vTEC performance was validated with GPS-based vTEC at the ionospheric pierce point (IPP) location. The ionospheric slant TEC (sTEC) can be directly extracted from the raw dual-frequency measurements by removing the satellite DCB and receiver DCB [37], which are released by CODE and JPL IONEX file. Then, we can obtain the GPS-based vTEC at IPP through applying the mapping function. The GIM-derived vTEC at IPP can be extracted through a spatial interpolation scheme, and linear time interpolation between two consecutive GIMs. Here, two IGS sites (PRDS and ALIC) in 2009 were selected as an example to evaluate the GIM-derived interpolation vTEC performance. To reduce the error from the mapping function and multipath, the elevation cutoff was selected as 30°. Taking the vTEC extracted from the GPS dual-frequency measurements as the reference value, we calculated the standard deviation (std) of the GIM-derived vTEC interpolation value from CODE and JPL. Figure 2 shows the statistical result; it can be found that the accuracy is lowest within 2 TECu (the mean std at PRDS for CODE and JPL are 1.19 TECu and 1.15 TECu, respectively; similarly, the mean std at ALIC for CODE and JPL is 1.54 TECu and 1.47 TECu, respectively), suggesting that the GIM-based interpolation vTEC from CODE and JPL is consistent with that of the GPS dual-frequency measurements. Therefore, it is believed that GIMs-derived vTEC from CODE and JPL has high accuracy within 2 TECu. Meanwhile, as the stations are densely distributed in the interested zone of our paper, the determination of the GIMs-derived vTEC should not be greatly affected by the interpolation scheme.
For the comparison between GNSS-derived vTEC and T/J vTEC, some points should be noted. Firstly, CODE/JPL/UPC GIMs are typically produced continually by 2.5° × 5° × 2 h, while T/J satellites measure vTEC along their orbits, and advance by only 2° per day. Given the different characteristics of the datasets, GNSS-derived vTEC were interpolated to the T/J footprint location through a bivariate spatial interpolation scheme, and linear time interpolation between two consecutive two-hourly GIMs. After the interpolation, the standard deviation (Std) of residuals () and the corresponding bias were computed. Secondly, the two datasets in 2009 and 2011 were binned for three seasonal conditions: Equinox (March, April, September, and October), June solstice (May, June, July, and August), and December solstice (January, February, November, and December). In addition, considering the effect of distance to the IGS sites, areas over the ocean (close to and far from IGS sites, respectively) were selected to calculate the Std in different latitude bands. Specifically, the spherical distance was calculated between the considered T/J footprint locations and IGS stations at the ionosphere thin layer (at the altitude of 450 km above the earth mean surface). The maximum spherical distance based on the thin-layer approximation was set to 790 km, which was determined by our investigation. When the distance was within 790 km, T/J footprint location was regarded as close to IGS sites; otherwise, it was far from IGS sites.
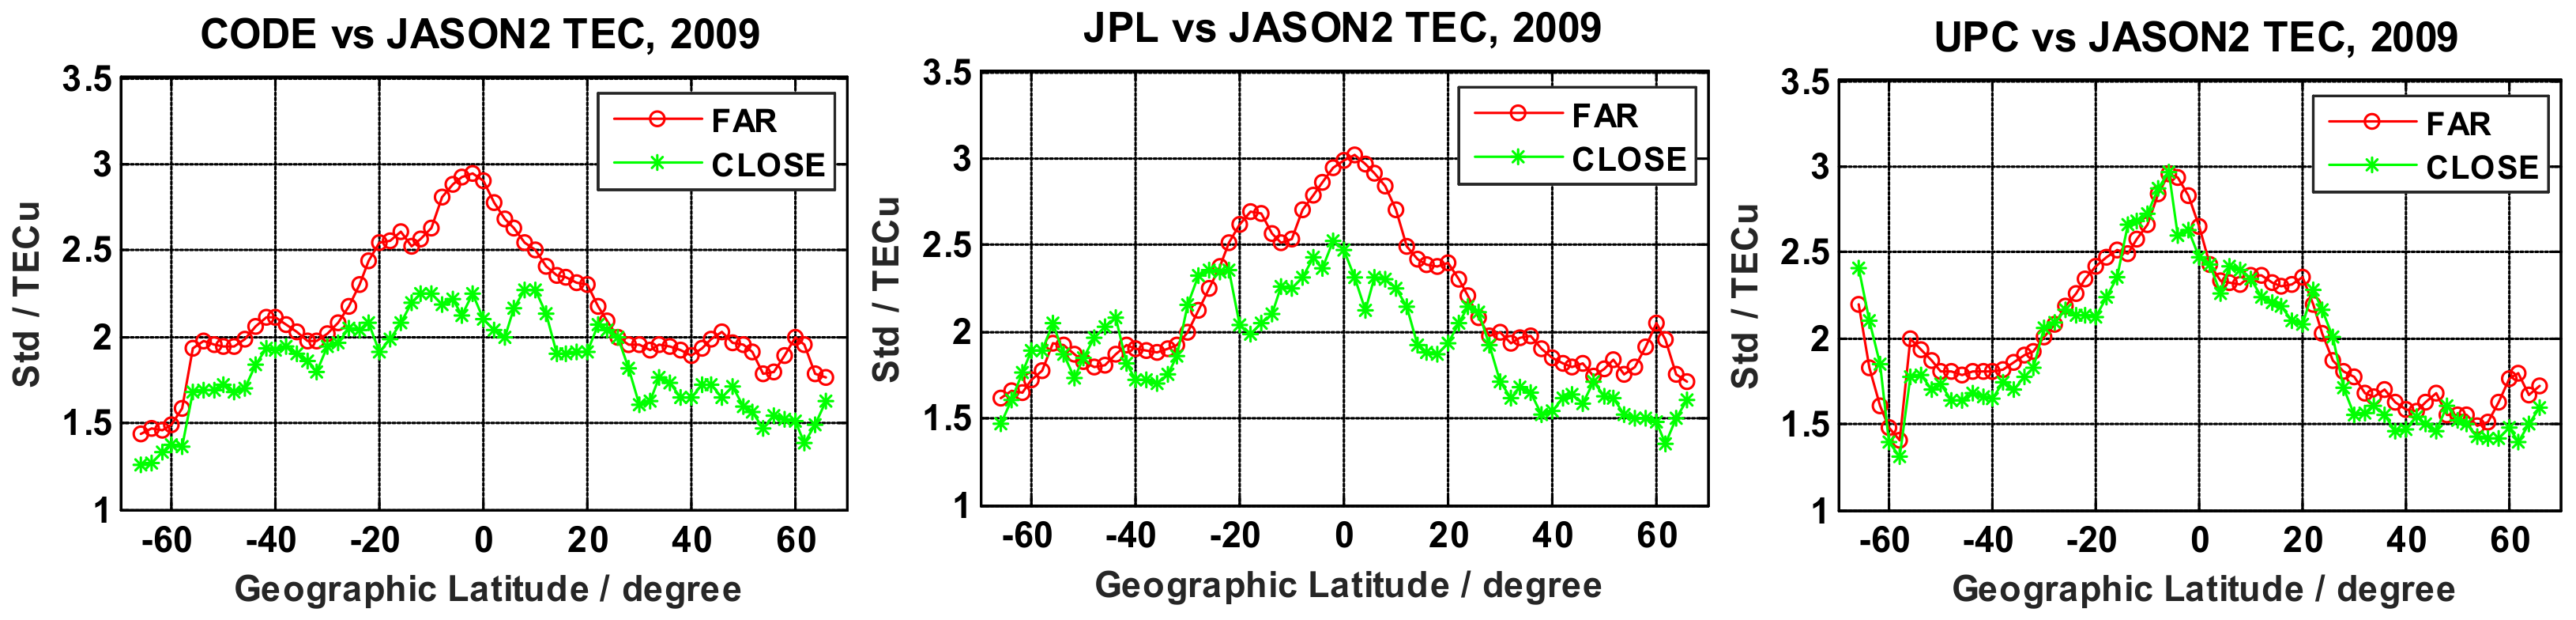
In Figure 3, the Std of CODE/JPL GIM close to IGS stations is significantly smaller than that far from IGS sites, and the Std shows a latitudinal dependence, which is compatible with the plasmaspheric distribution. The larger Std far from IGS sites may be attributed to the relatively low vTEC accuracy from GIMs over the sea, where the IGS tracking station distribution is very sparse and uneven. Thus, to improve GNSS-derived vTEC determination, several T/J and GNSS overlapping areas that are relatively close to IGS stations (green footprints in Figure 1) were selected to minimize interpolation errors on GIMs (see Figure 3). Note that the Std for the equatorial zones is worse than that obtained at mid-high latitudes; these major errors are mainly due to large ionospheric gradients and plasmaspheric components in the equator. In the UPC GIM model, the UPC Std has similar results with different distances. This behavior is possibly due to the use of IRI in the interpolation procedure when UPC GIM was computed. This makes the results more compatible with TOPEX [19]. Therefore, in the following analysis, we only estimated the bias by CODE/JPL GIMs and JASON vTEC data.
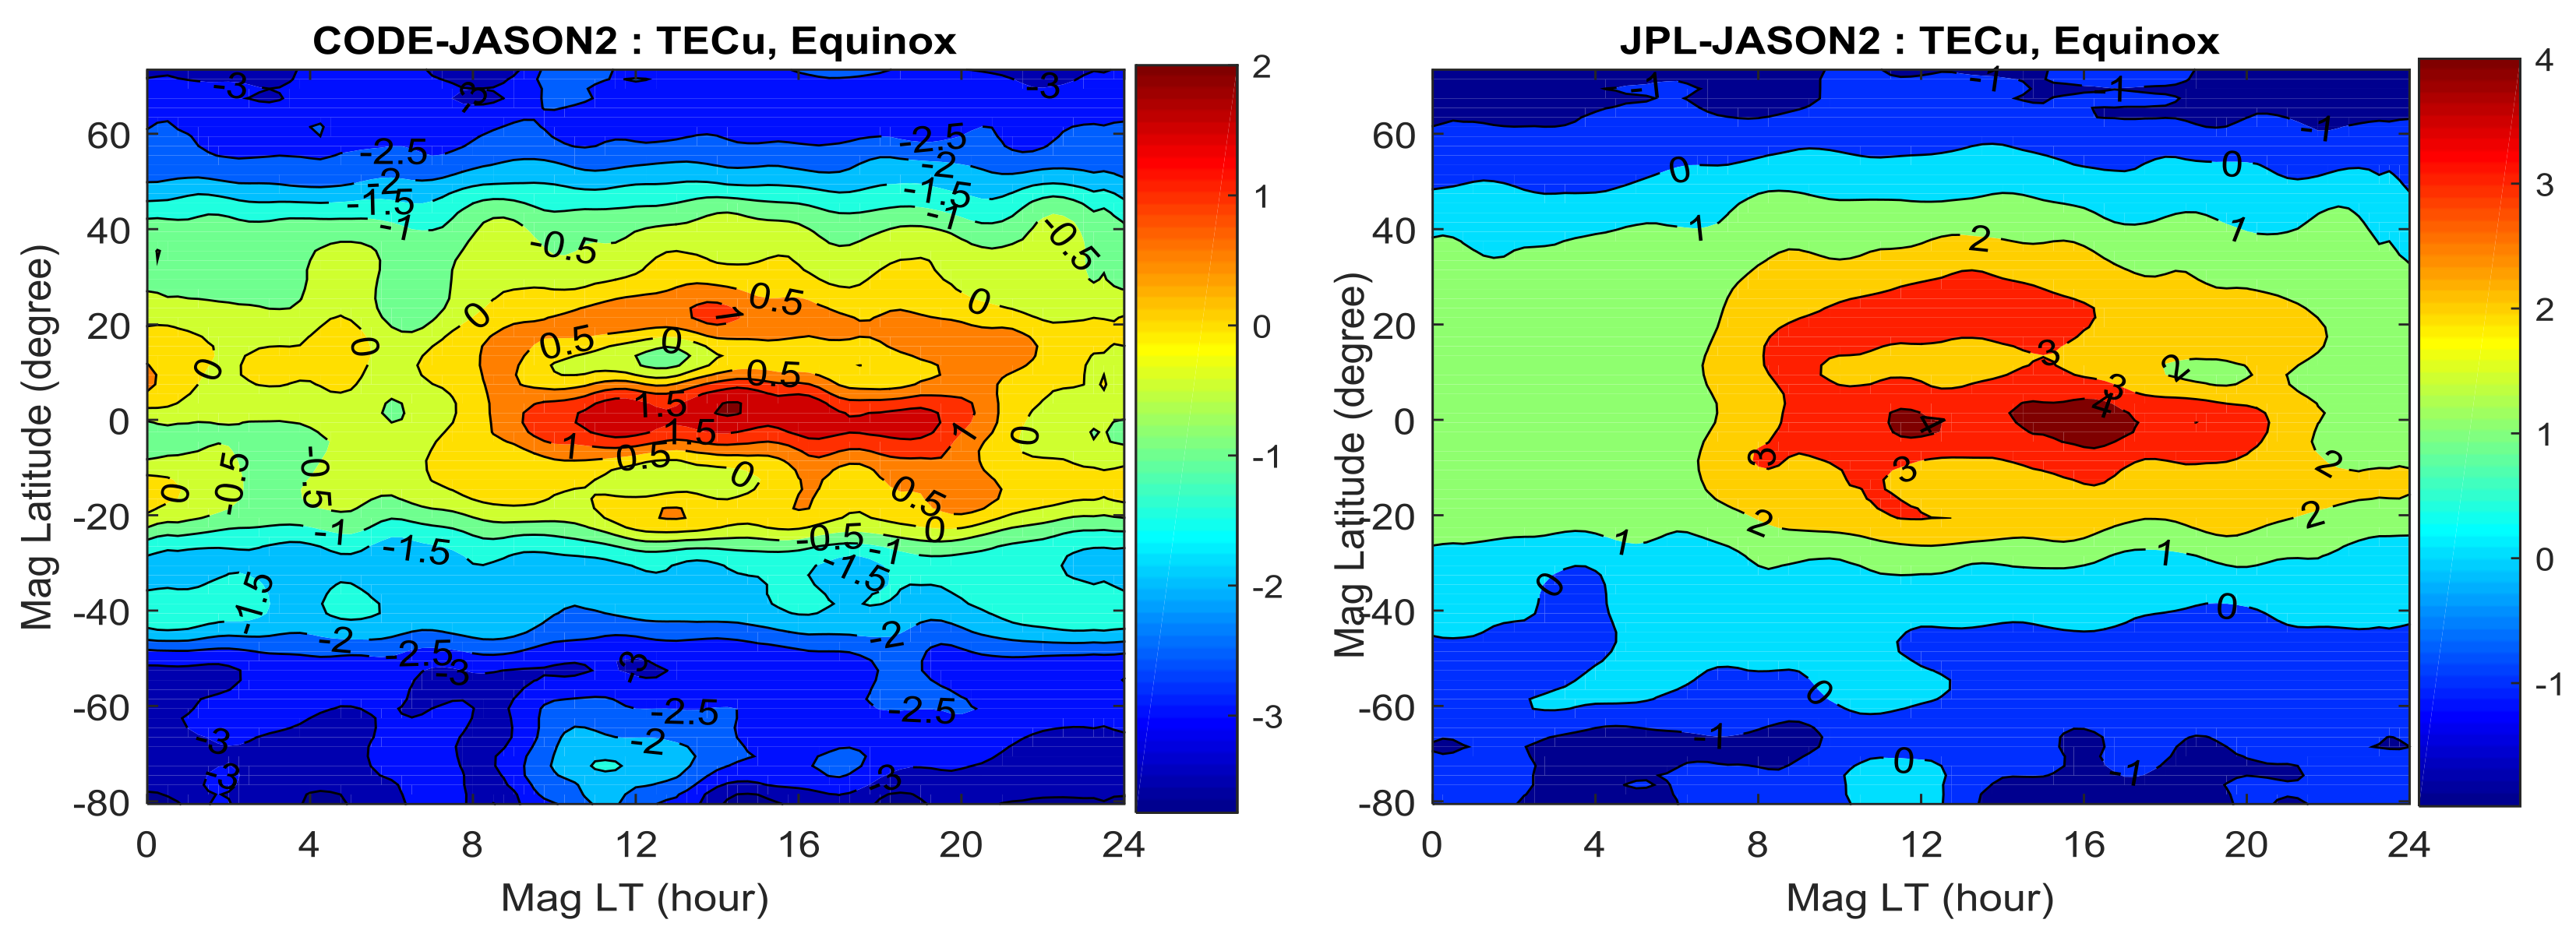
For our global analysis of the , we chose a bin size of 2° × 15 min resolution in magnetic latitude and local time for different seasons. Figure 4 shows the mean mapped by geomagnetic latitude and local time (LT) coordinates. The most dominant feature is that the spatial distribution of the difference in with different seasons is consistent with the plasmaspheric component, but the magnitude of is somewhat smaller than the normal plasmasphere, and some negative values exist at high latitudes.
It appears that systematic biases exist, and make normal plasmasphere values shift to the values of Figure 4. Considering that GNSS satellite orbit altitude (~20,000 km) is significantly higher than that of T/J satellites (~1336 km), GNSS-derived vTEC should be larger due to the additional contribution of the plasmasphere above the T/J satellite orbital altitude. However, the difference maps (Figure 4) not only show positive values (at middle and low latitudes) but also negative values (mainly at high latitudes). From the comparison above, we propose that a systematic bias may exist in CODE GIM minus JASON2 vTEC, as well as another systematic bias in JPL GIM minus JASON2. In principle, this type of systematic bias could be generated by an overestimation of T/J vTEC (T/J calibration error) or an underestimation of GNSS-derived vTEC (GIM mis-modeling). However, according to the GIM-based interpolation vTEC accuracy, as well as the smaller Std (close to the IGS sites in Figure 3), we believe that the GNSS-derived vTEC (with abundant IGS sites nearby) from GIM has very high accuracy, thereby indicating that the systematic bias mainly arises from T/J (see details in Discussion and Conclusion).
We propose a method here to remove the systematic bias, namely, the zero assumption method [3,9,11], whereby observed vTEC (or PEC) above the LEO satellite orbital altitude can be very small (even close to zero) at high latitudes or during nighttime.
Based on the assumption that the systematic bias mainly arises from T/J satellites, we can get
where is the vTEC interpolated from GIM at T/J location, is the direct vTEC measurements from ocean surface to T/J satellite altitude, and is the systematic bias existed in .
Then,
If we assume that the daily minimum of PEC in Equation (3) can reach zero at high latitudes or during nighttime (namely, ), which is more likely to occur in the geomagnetic range from ±50° to ±80° during the night, then the systematic bias can be expressed as follows:
where is the daily minimum of the . To exclude the outliers in , the final systematic bias in the study is determined by averaging values of over each season.
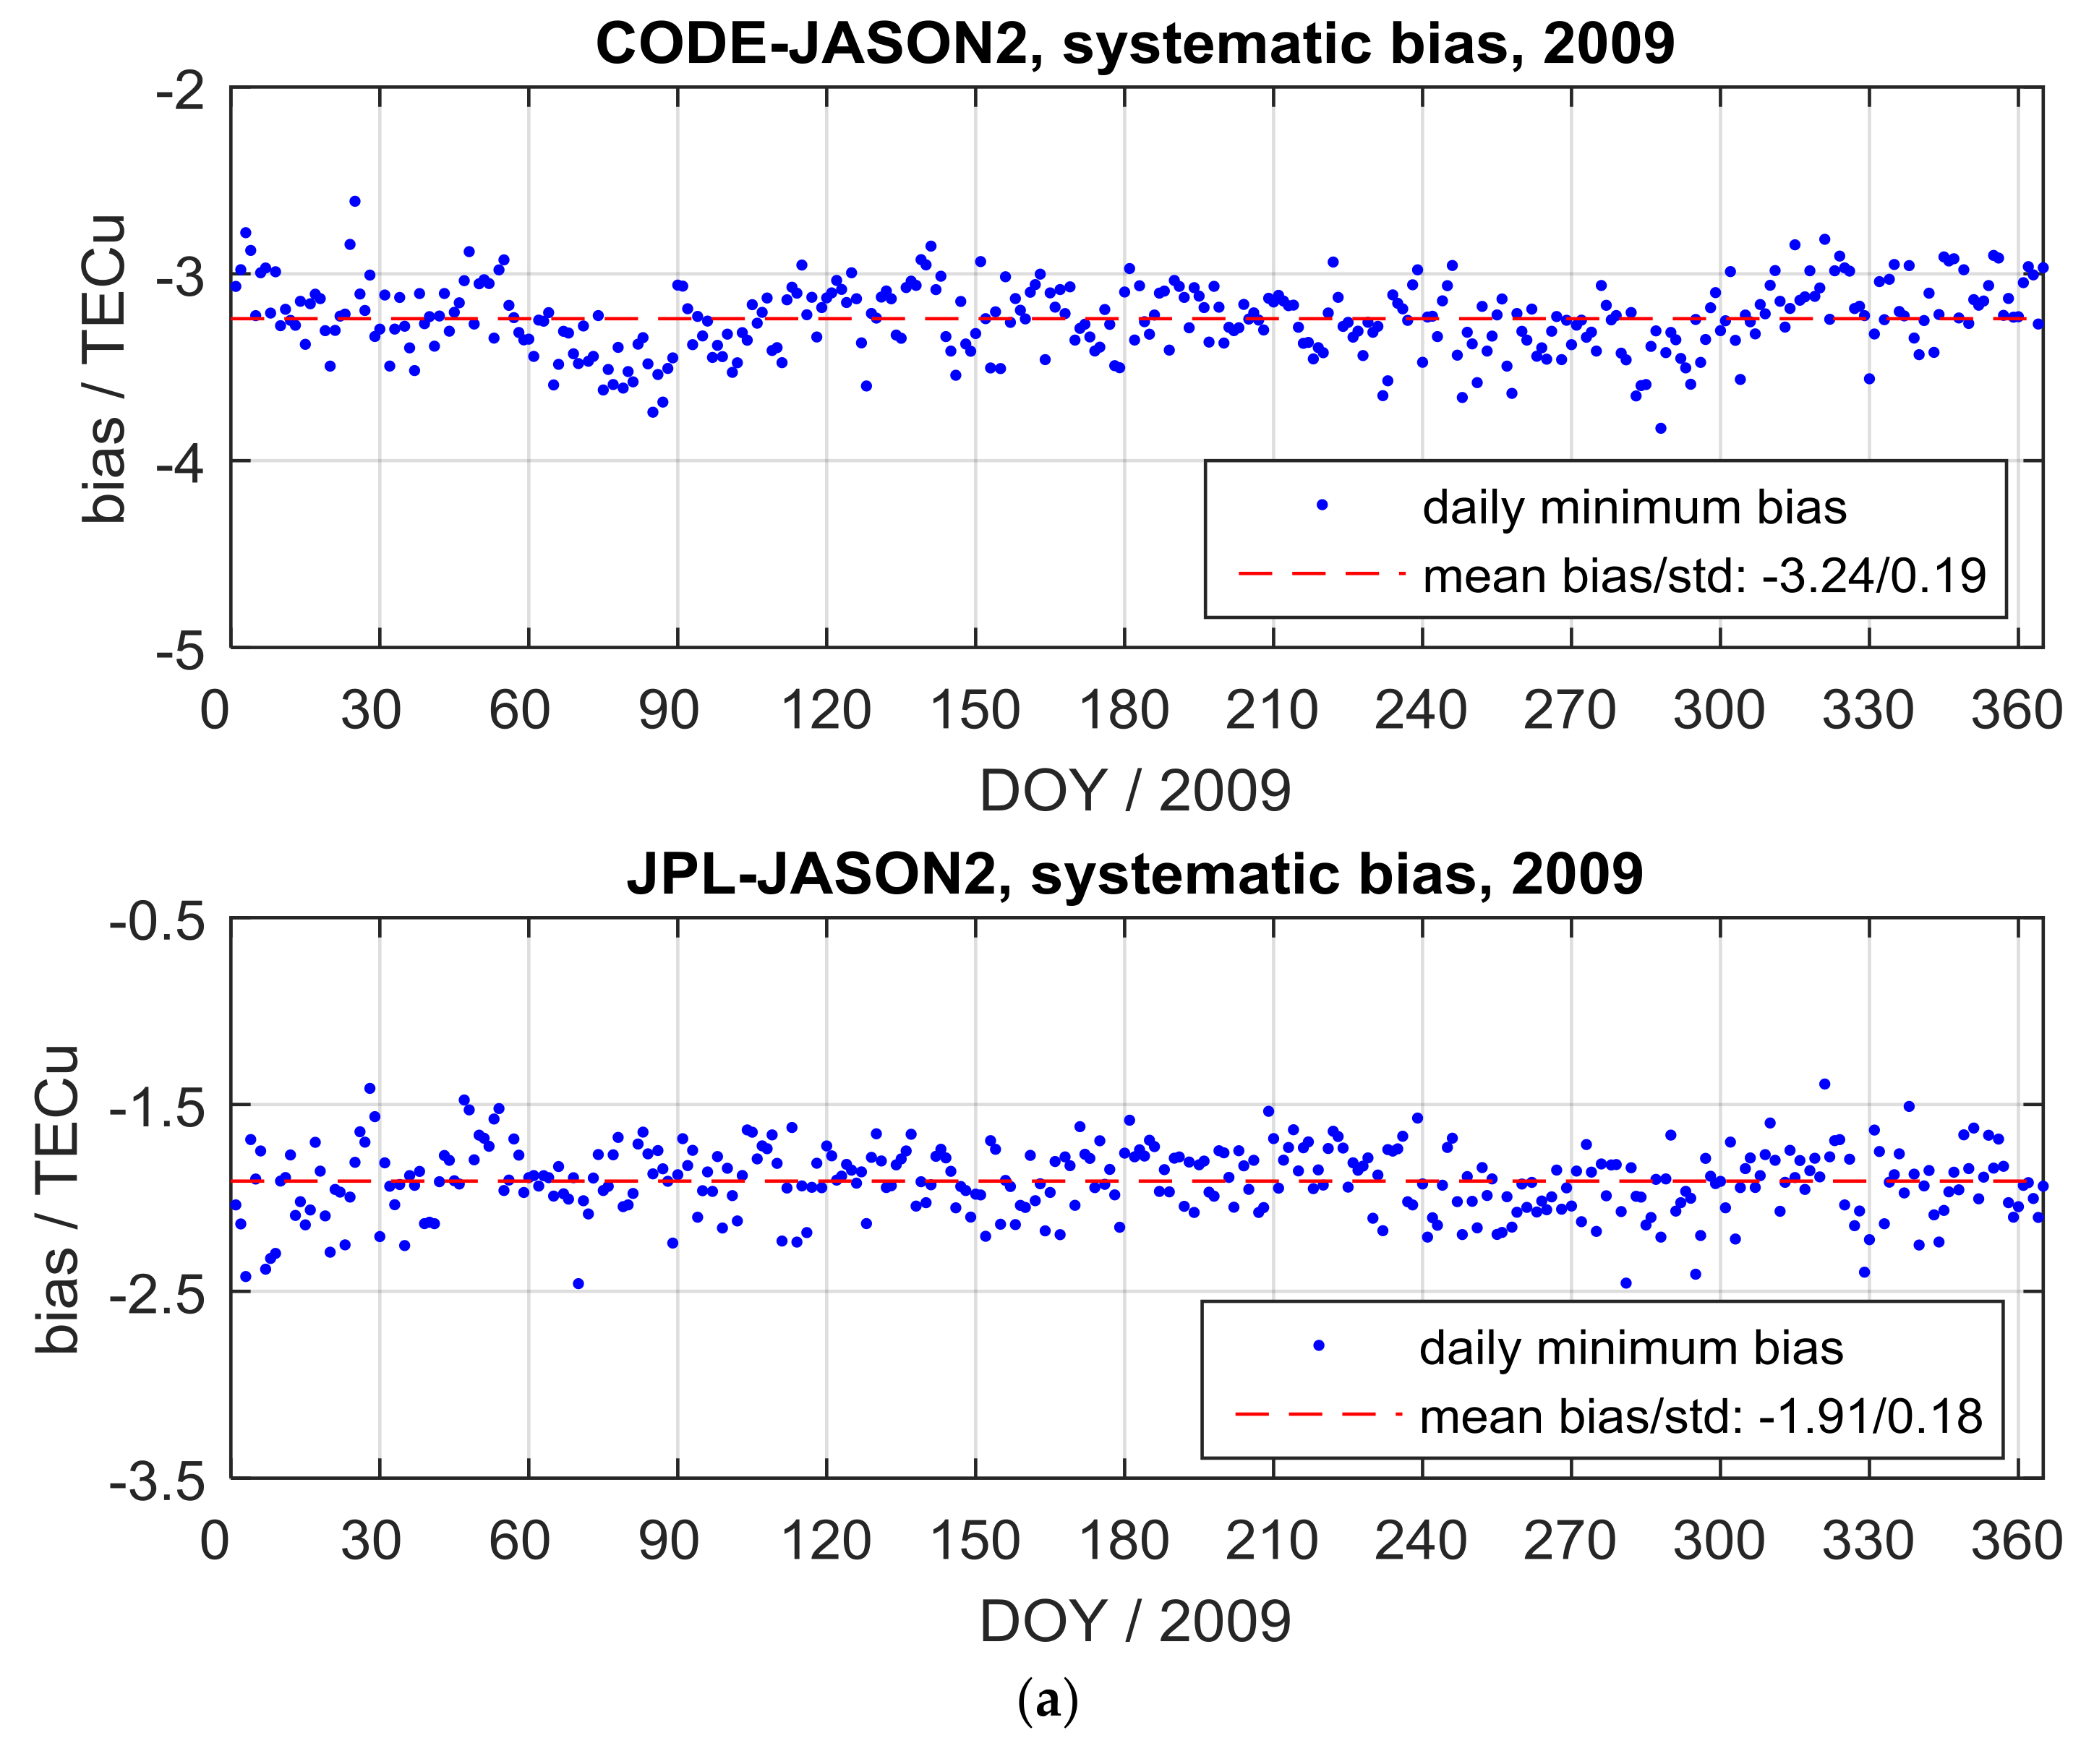
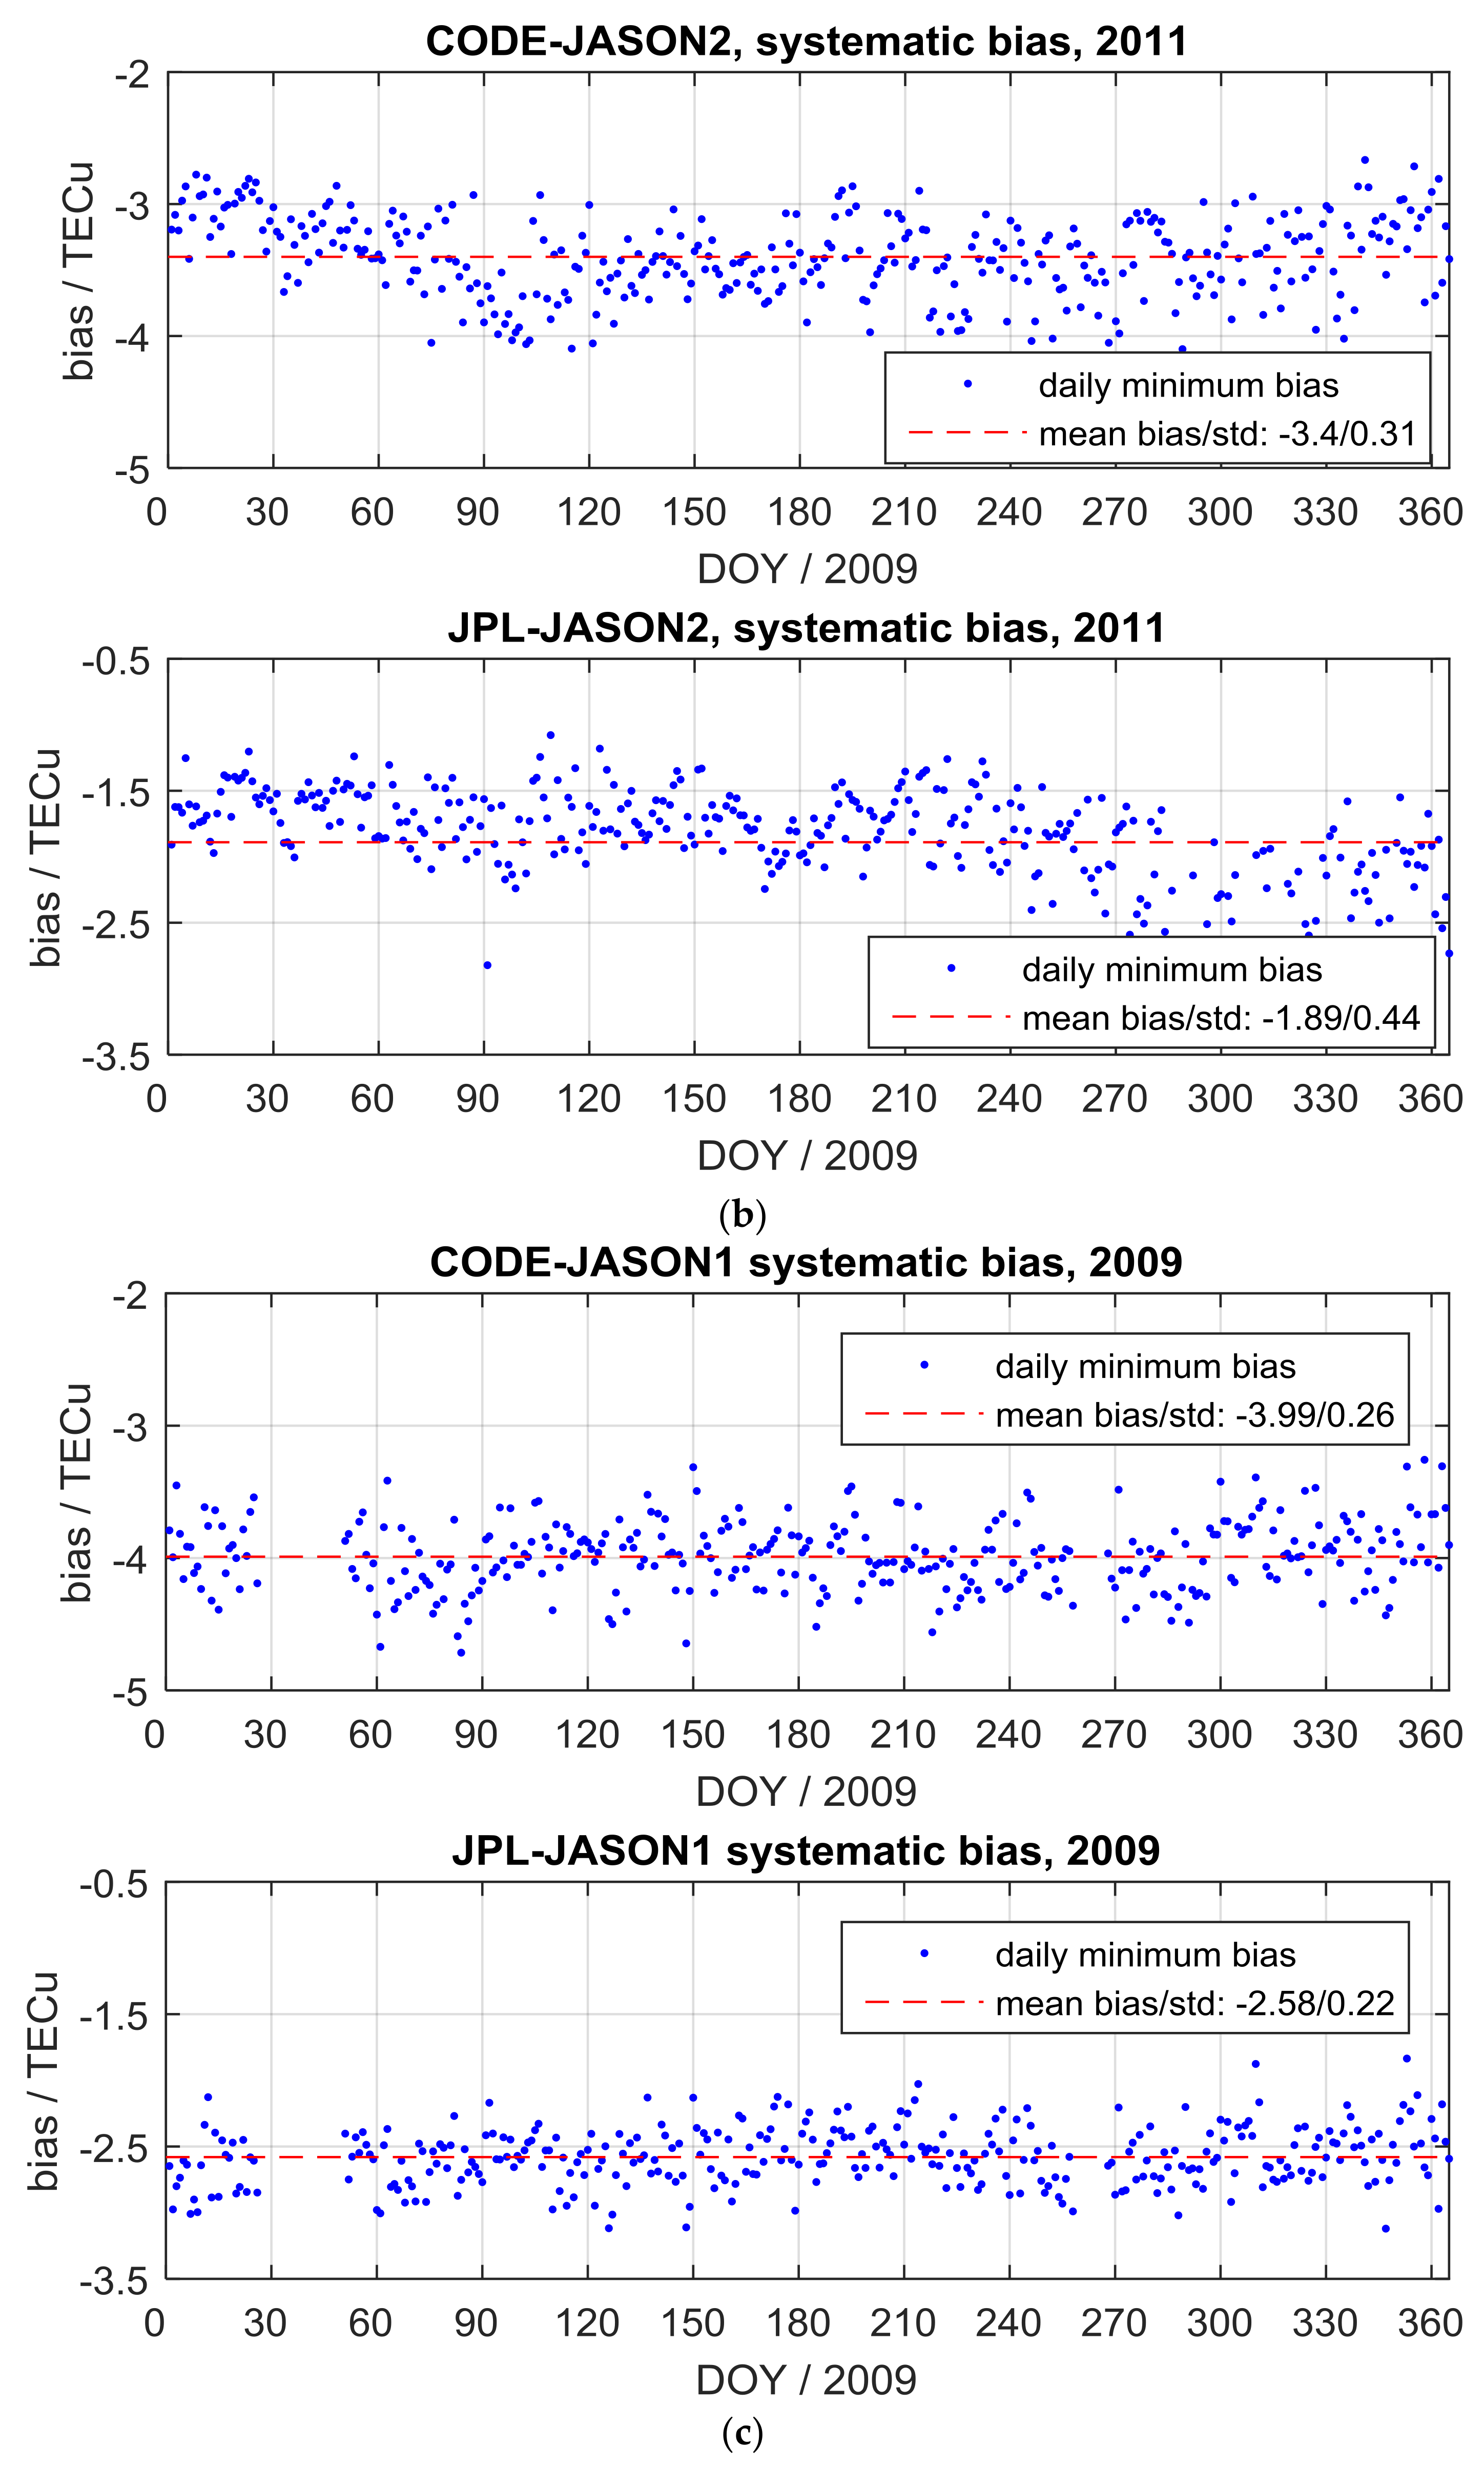
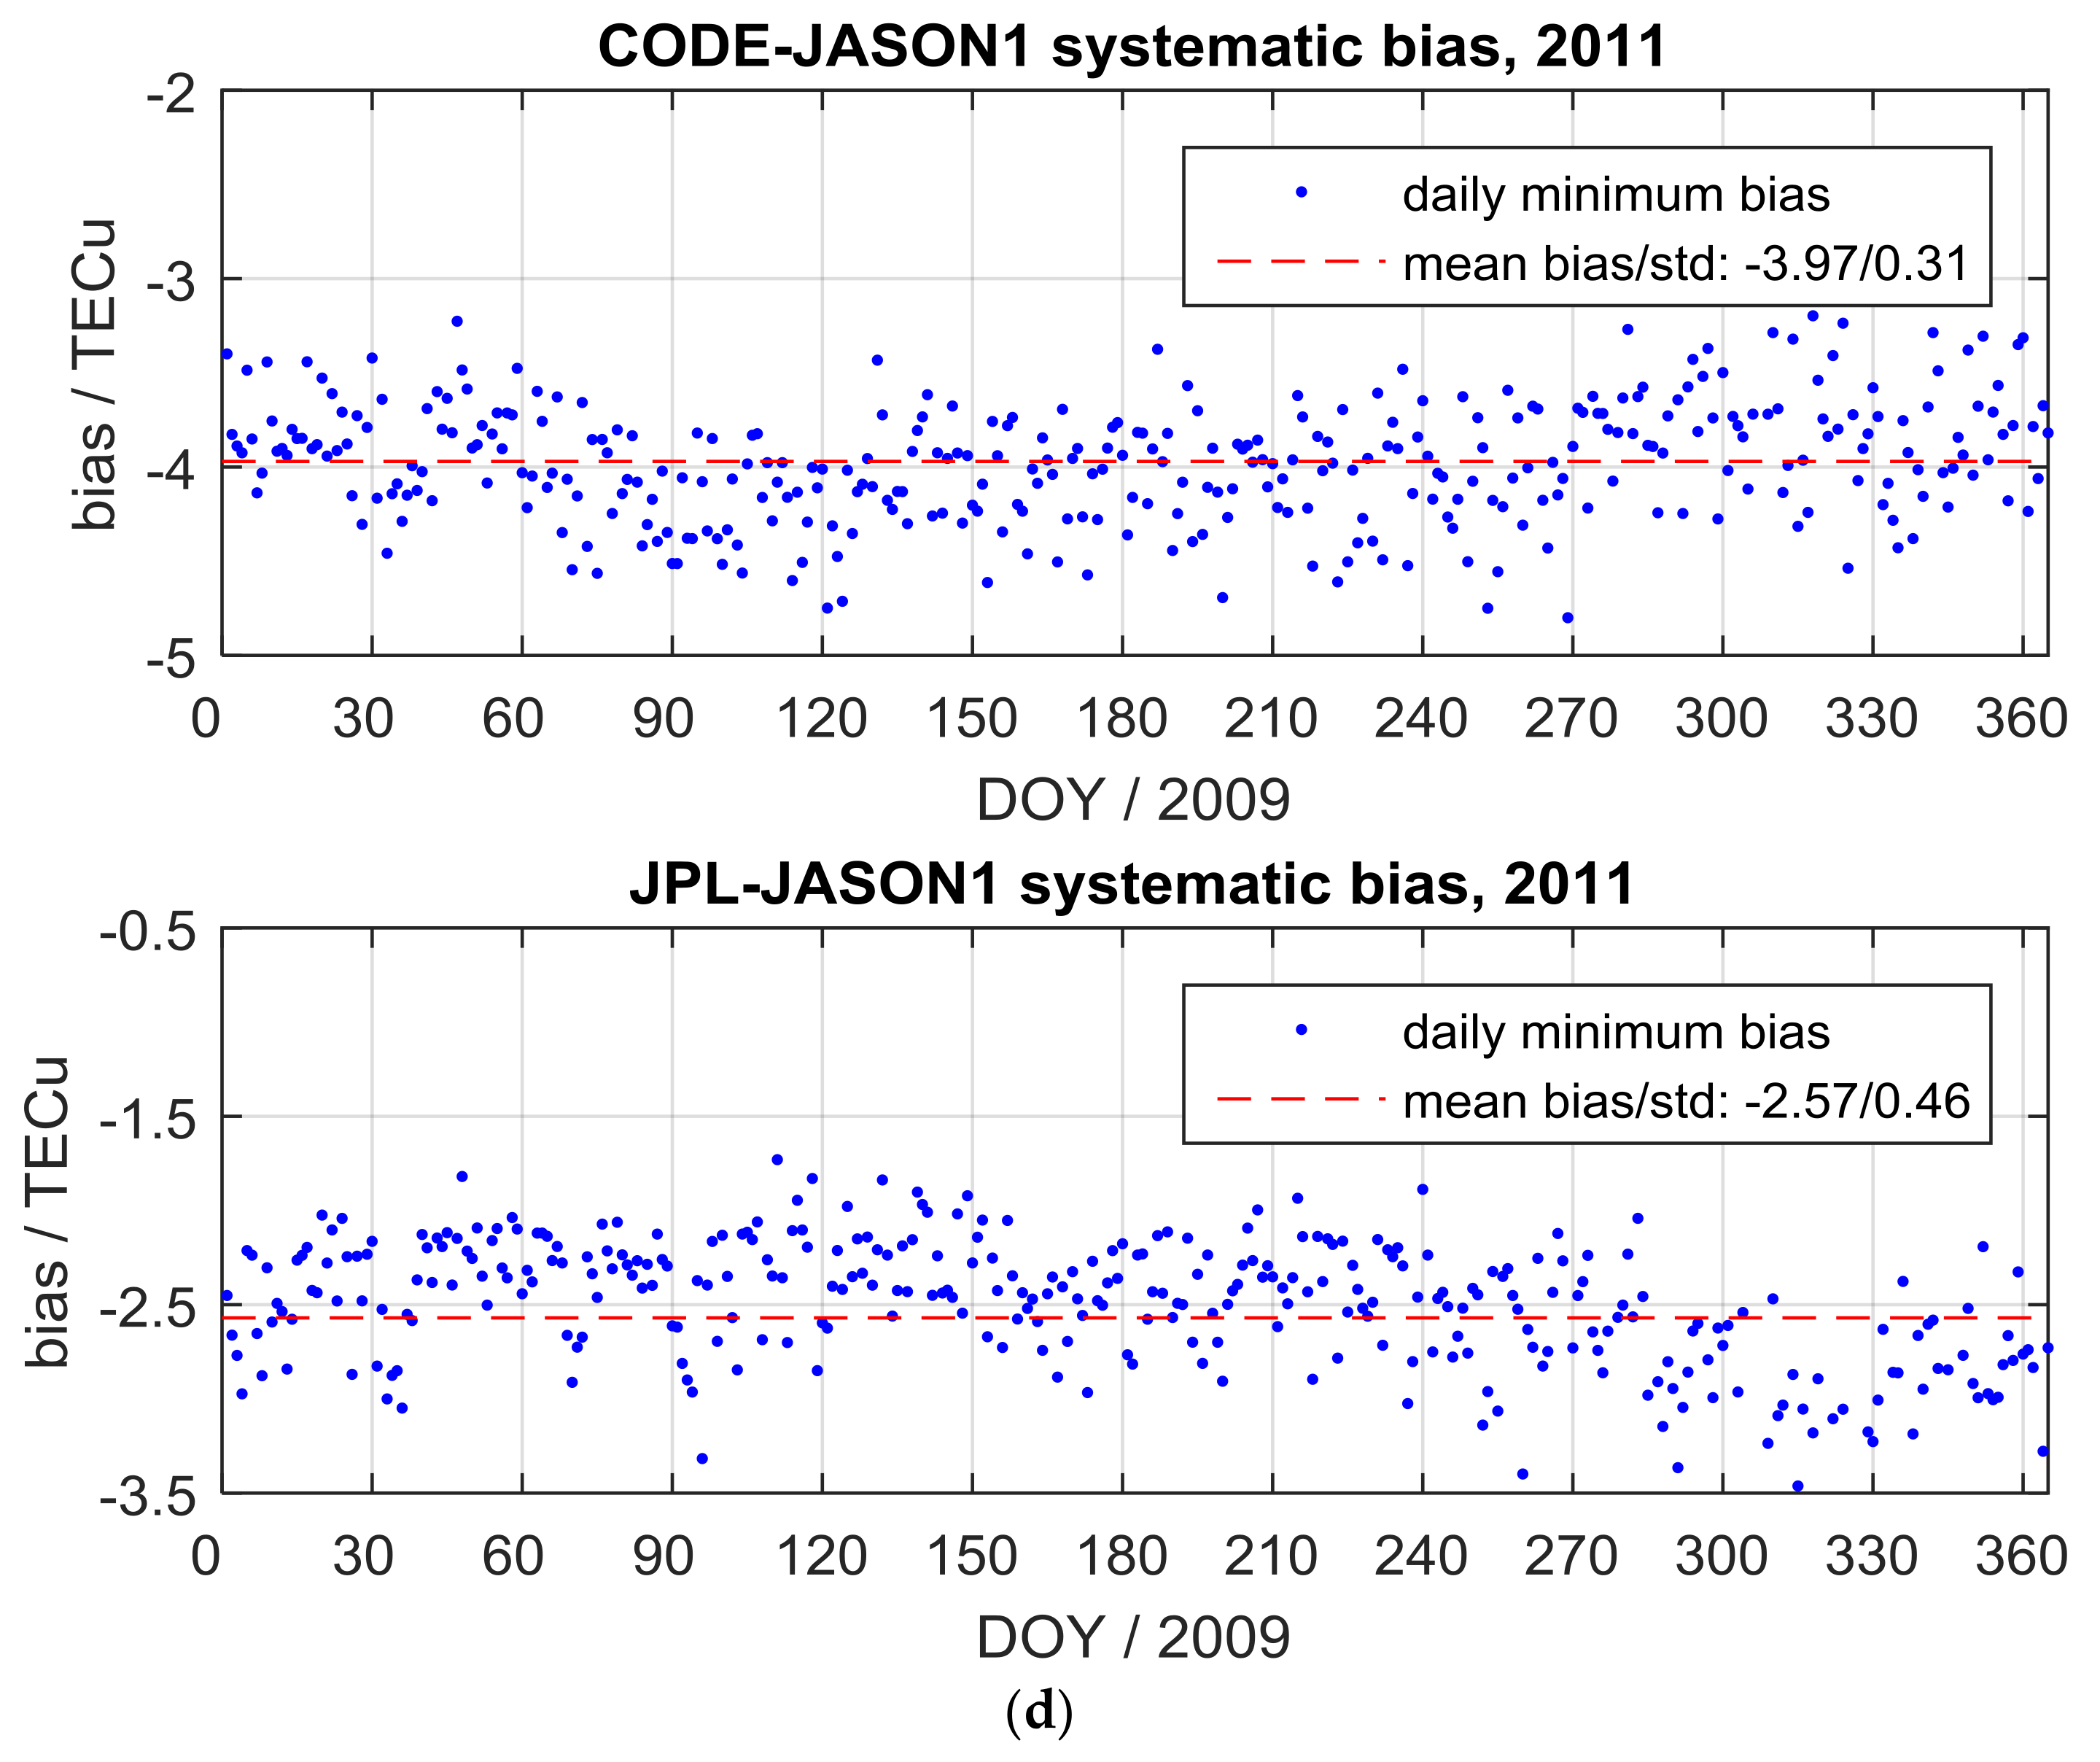
To investigate the stability of the daily bias, we calculated the systematic bias in 2009 and 2011 (Figure 5a–d). It is found that the daily bias for JASON2 in 2009 is very stable, and the magnitude of the daily systematic bias value in 2011 is consistent with that in 2009. In addition, the daily systematic bias for JASON1 in 2011 is in agreement with that in 2009 (Figure 5a,b).Therefore, the systematic bias in 2009 (low solar condition) and 2011 (high solar condition) is stable, and it does not vary with solar activity. It should also be noted that the systematic bias differs for JASON2 and JASON1, suggesting that we should carefully use the systematic bias from JASON1 and JASON2 to extract PEC. The average values of daily systematic bias over each season were removed to extract PEC and obtain the plasmaspheric contribution above the T/J satellite altitude.
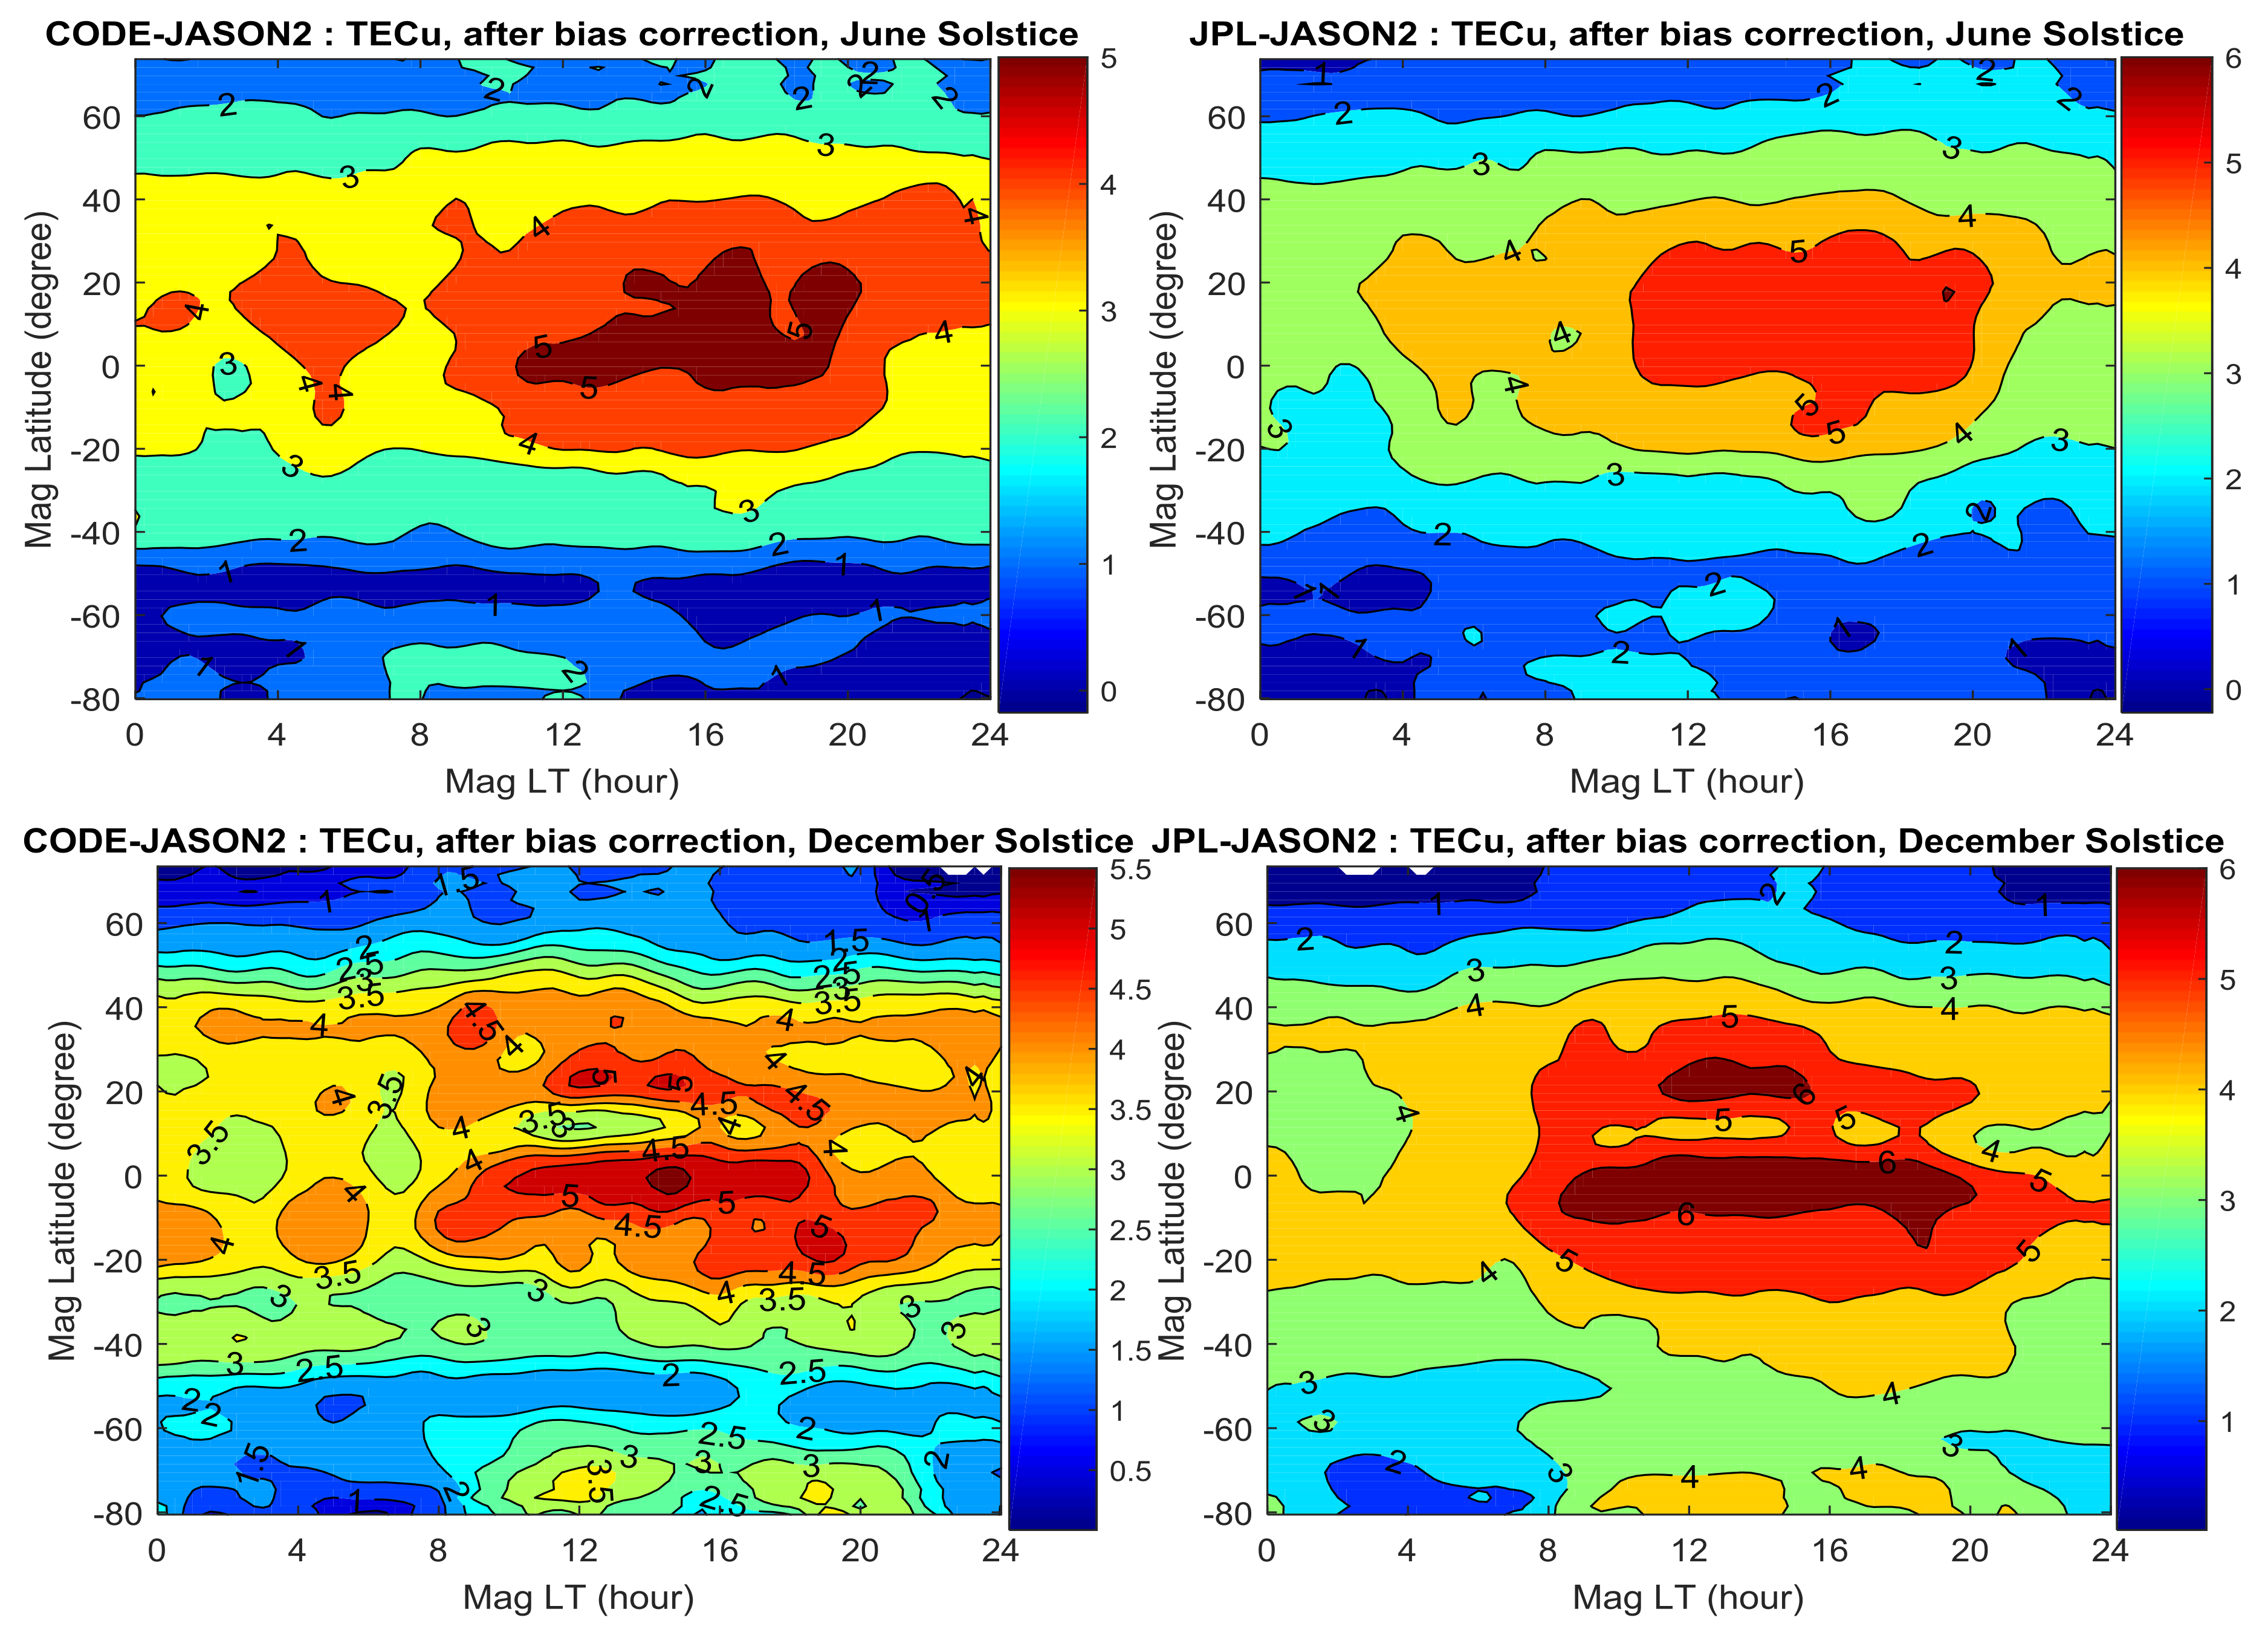
After subtracting the background systematic bias, we obtain Figure 6. As expected, the values are all positive, and the PEC distribution is in good agreement with the general plasmaspheric distribution investigated by other measurements and methods [2,11,12,16]. Hence, our proposed method for extracting PEC is suitable and reliable, and the systematic bias correction is reasonable. Furthermore, the PEC for CODE-JASON2 has the same distribution trend and magnitude as for JPL-JASON2; both are mainly distributed in annular area at mid-low latitudes, and show almost the same daytime peaks in equatorial regions for the corresponding season. This also indicates that the systematic bias correction is relatively accurate and reasonable.
To further validate that the systematic bias exists in T/J vTEC data and must be removed when extracting PEC from the differences of GNSS-derived vTEC and T/J vTEC, the same procedure is repeated for other datasets (GIM and JASON1 data). After systematic bias correction, the plasmasphere maps calculated from GIM and JASON1 (Figure 7a) show that the PEC maintains a good agreement with the performance shown in Figure 6. Both have a very similar distribution trend and magnitude (note that the color scales are slightly different). Using different datasets based on residuals between GNSS-derived vTEC and T/J vTEC, such as CODE-JASON2, JPL-JASON2, CODE-JASON1, and JPL-JASON1, we extracted compatible, almost identical PEC maps, which have similar trends and magnitudes. Therefore, we conclude that systematic biases on T/J vTEC do exist, and that this systematic bias is different for different datadets. For instance, the systematic bias differs for JASON2 and JASON1. We also calculated the PEC for JASON1 and JASON2 in 2011 (Figure 7b), and found that the extracted PEC distribution for JASON1 and JASON2 in 2011 is identical, which also suggests that our proposed method is correct and reliable. Moreover, after removing the reasonable systematic bias, we investigated PEC characteristics for different latitudes, local times, and seasons.
4. Characteristics of the Plasmasphere
As mentioned in Section 3, the positive absolute differences (after bias correction) can be regarded as the PEC. Thus, we discuss PEC characteristics for low (2009) and high (2011) solar activity condition in this section.
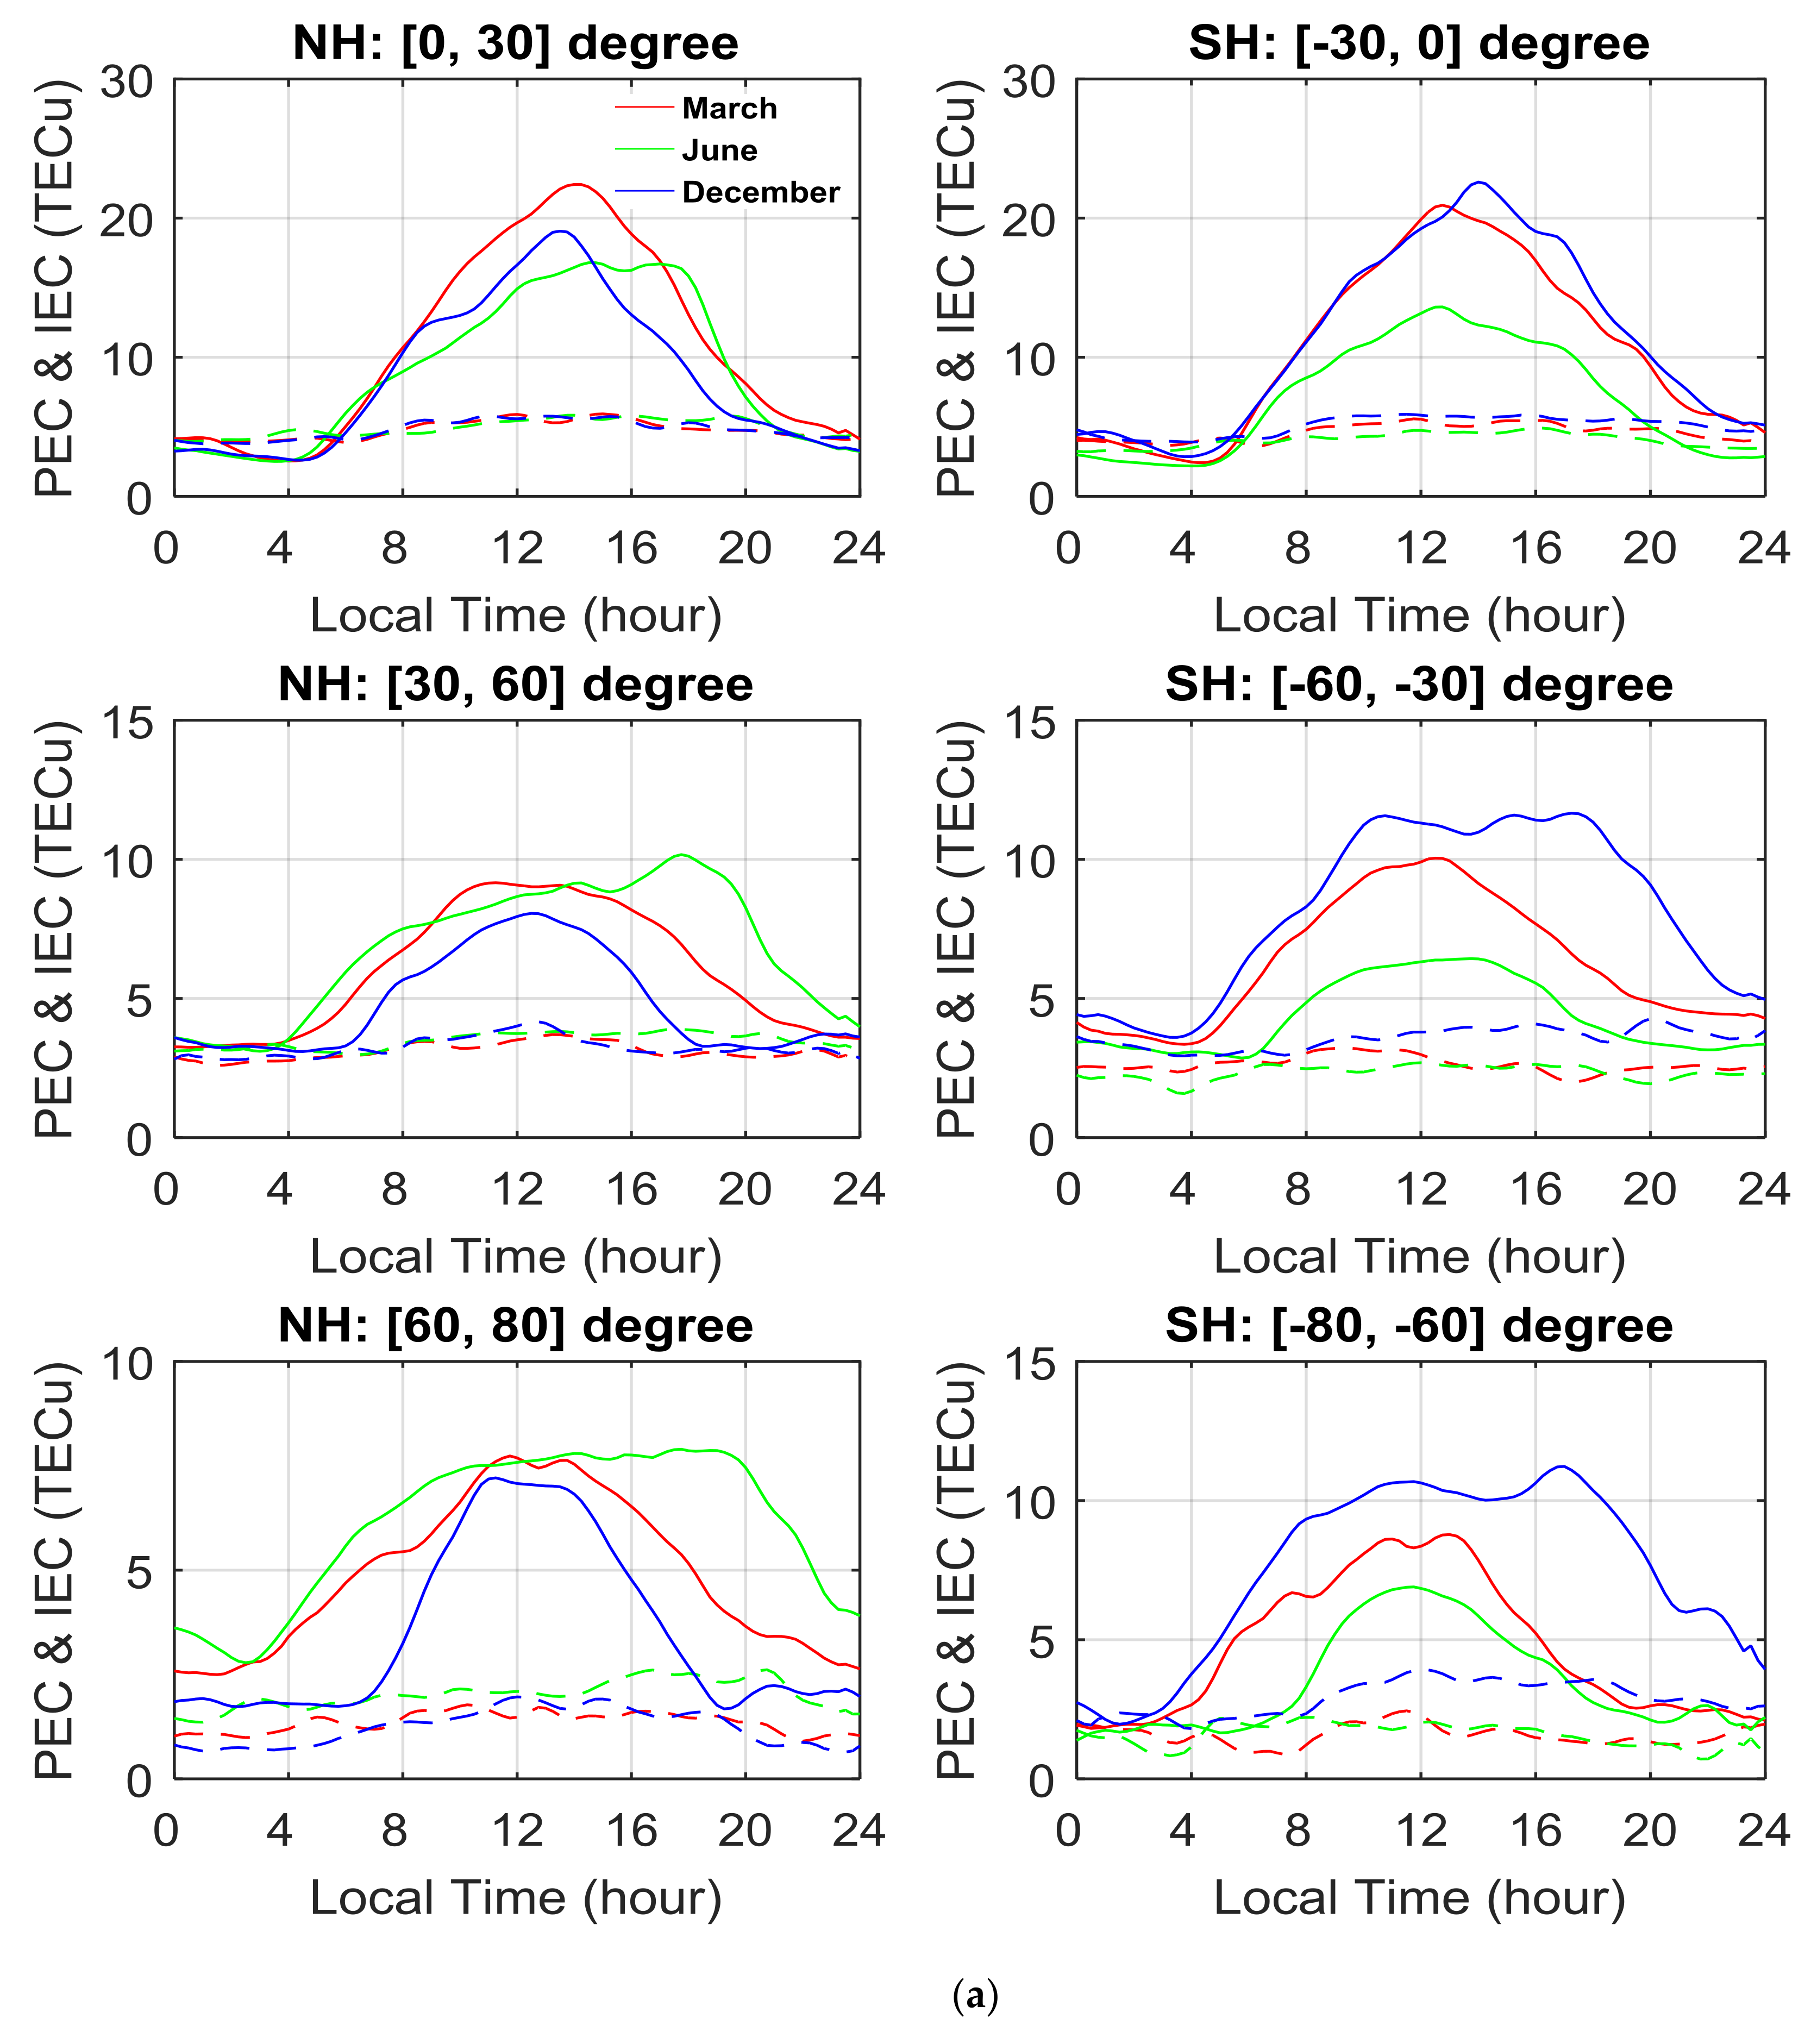
As shown in Figure 6 and Figure 7a,b, PEC shows clear latitude and local time variations: PEC is mainly distributed in a banded region within ±40° of the equator, with the maximum value occurring at low latitudes and reducing with increasing latitude. PEC exhibits diurnal variation, with higher values during the day (peaking values around 12:00–20:00 LT) than during the night (minimum values around 02:00–05:00 LT). This kind of PEC diurnal variation pattern is related to strong coupling between the plasmasphere and the ionosphere [12,38], Seasonal variations of the plasmasphere are weaker than those in the ionosphere; the PEC maximum seasonal averaged value is ~6 TECu in 2009, and ~8 TECu in 2011. Moreover, during the June and December solstice, PEC values at mid-high latitudes are higher in the summer hemisphere than in the winter hemisphere, which is similar to the hemispheric asymmetry observed in the ionosphere. The LT variation of mean electron contents in the ionosphere–plasmasphere system during the solstices and the spring equinox are represented in Figure 8a,b. The IEC was obtained from the GIM-derived vTEC, minus the PEC processed by bias correction (i.e., IEC = TEC − PEC). The mean values of IEC and PEC for low, middle and high geomagnetic latitudes in each hemisphere were calculated every fifteen minutes over three periods, namely, March equinox, June solstice, and December solstice.
The variation of PEC with LT is significantly weaker than that of IEC (Figure 8a,b). For mid and high latitudes in both hemispheres, IEC is systematically larger for the local summer solstice than for the local winter solstice, indicating that the winter anomaly phenomenon is absent in the ionosphere. In the plasmasphere, a similar phenomenon can also be observed at mid and high latitudes, and also observed during afternoon–evening period at low latitudes of the southern hemisphere (SH). Therefore, the winter anomaly is also absent in the plasmasphere. Our results are consistent with previous investigations based on measurements and/or models under solar minimum conditions [10,39,40]. It is also noted that the PEC increases from low (2009) to high (2011) solar activity conditions, but the growth magnitude is negligibly small compared with the large IEC increasement (Figure 7a,b and Figure 8a,b), indicating that the large IEC changes with solar conditions are not reflected in the plasmasphere via a direct plasma transport between them.
Furthermore, PEC magnitude is much smaller than IEC magnitude, whereas the dispersion between them is significantly smaller during the night than during the day: PEC can sometimes exceed IEC for a few hours around sunrise at low latitudes. Hence, to specifically explore the effect of PEC on TEC (i.e., IEC = TEC − PEC), the PEC percentage contribution was defined as the contribution of PEC to GNSS-derived TEC (PEC/TEC, in %).
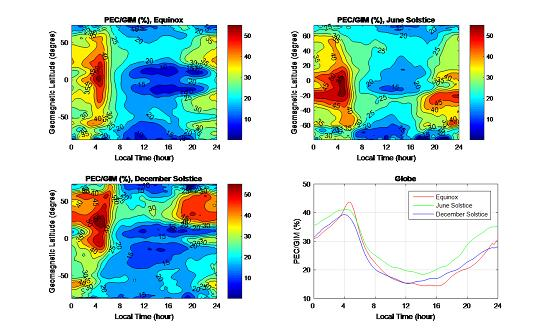
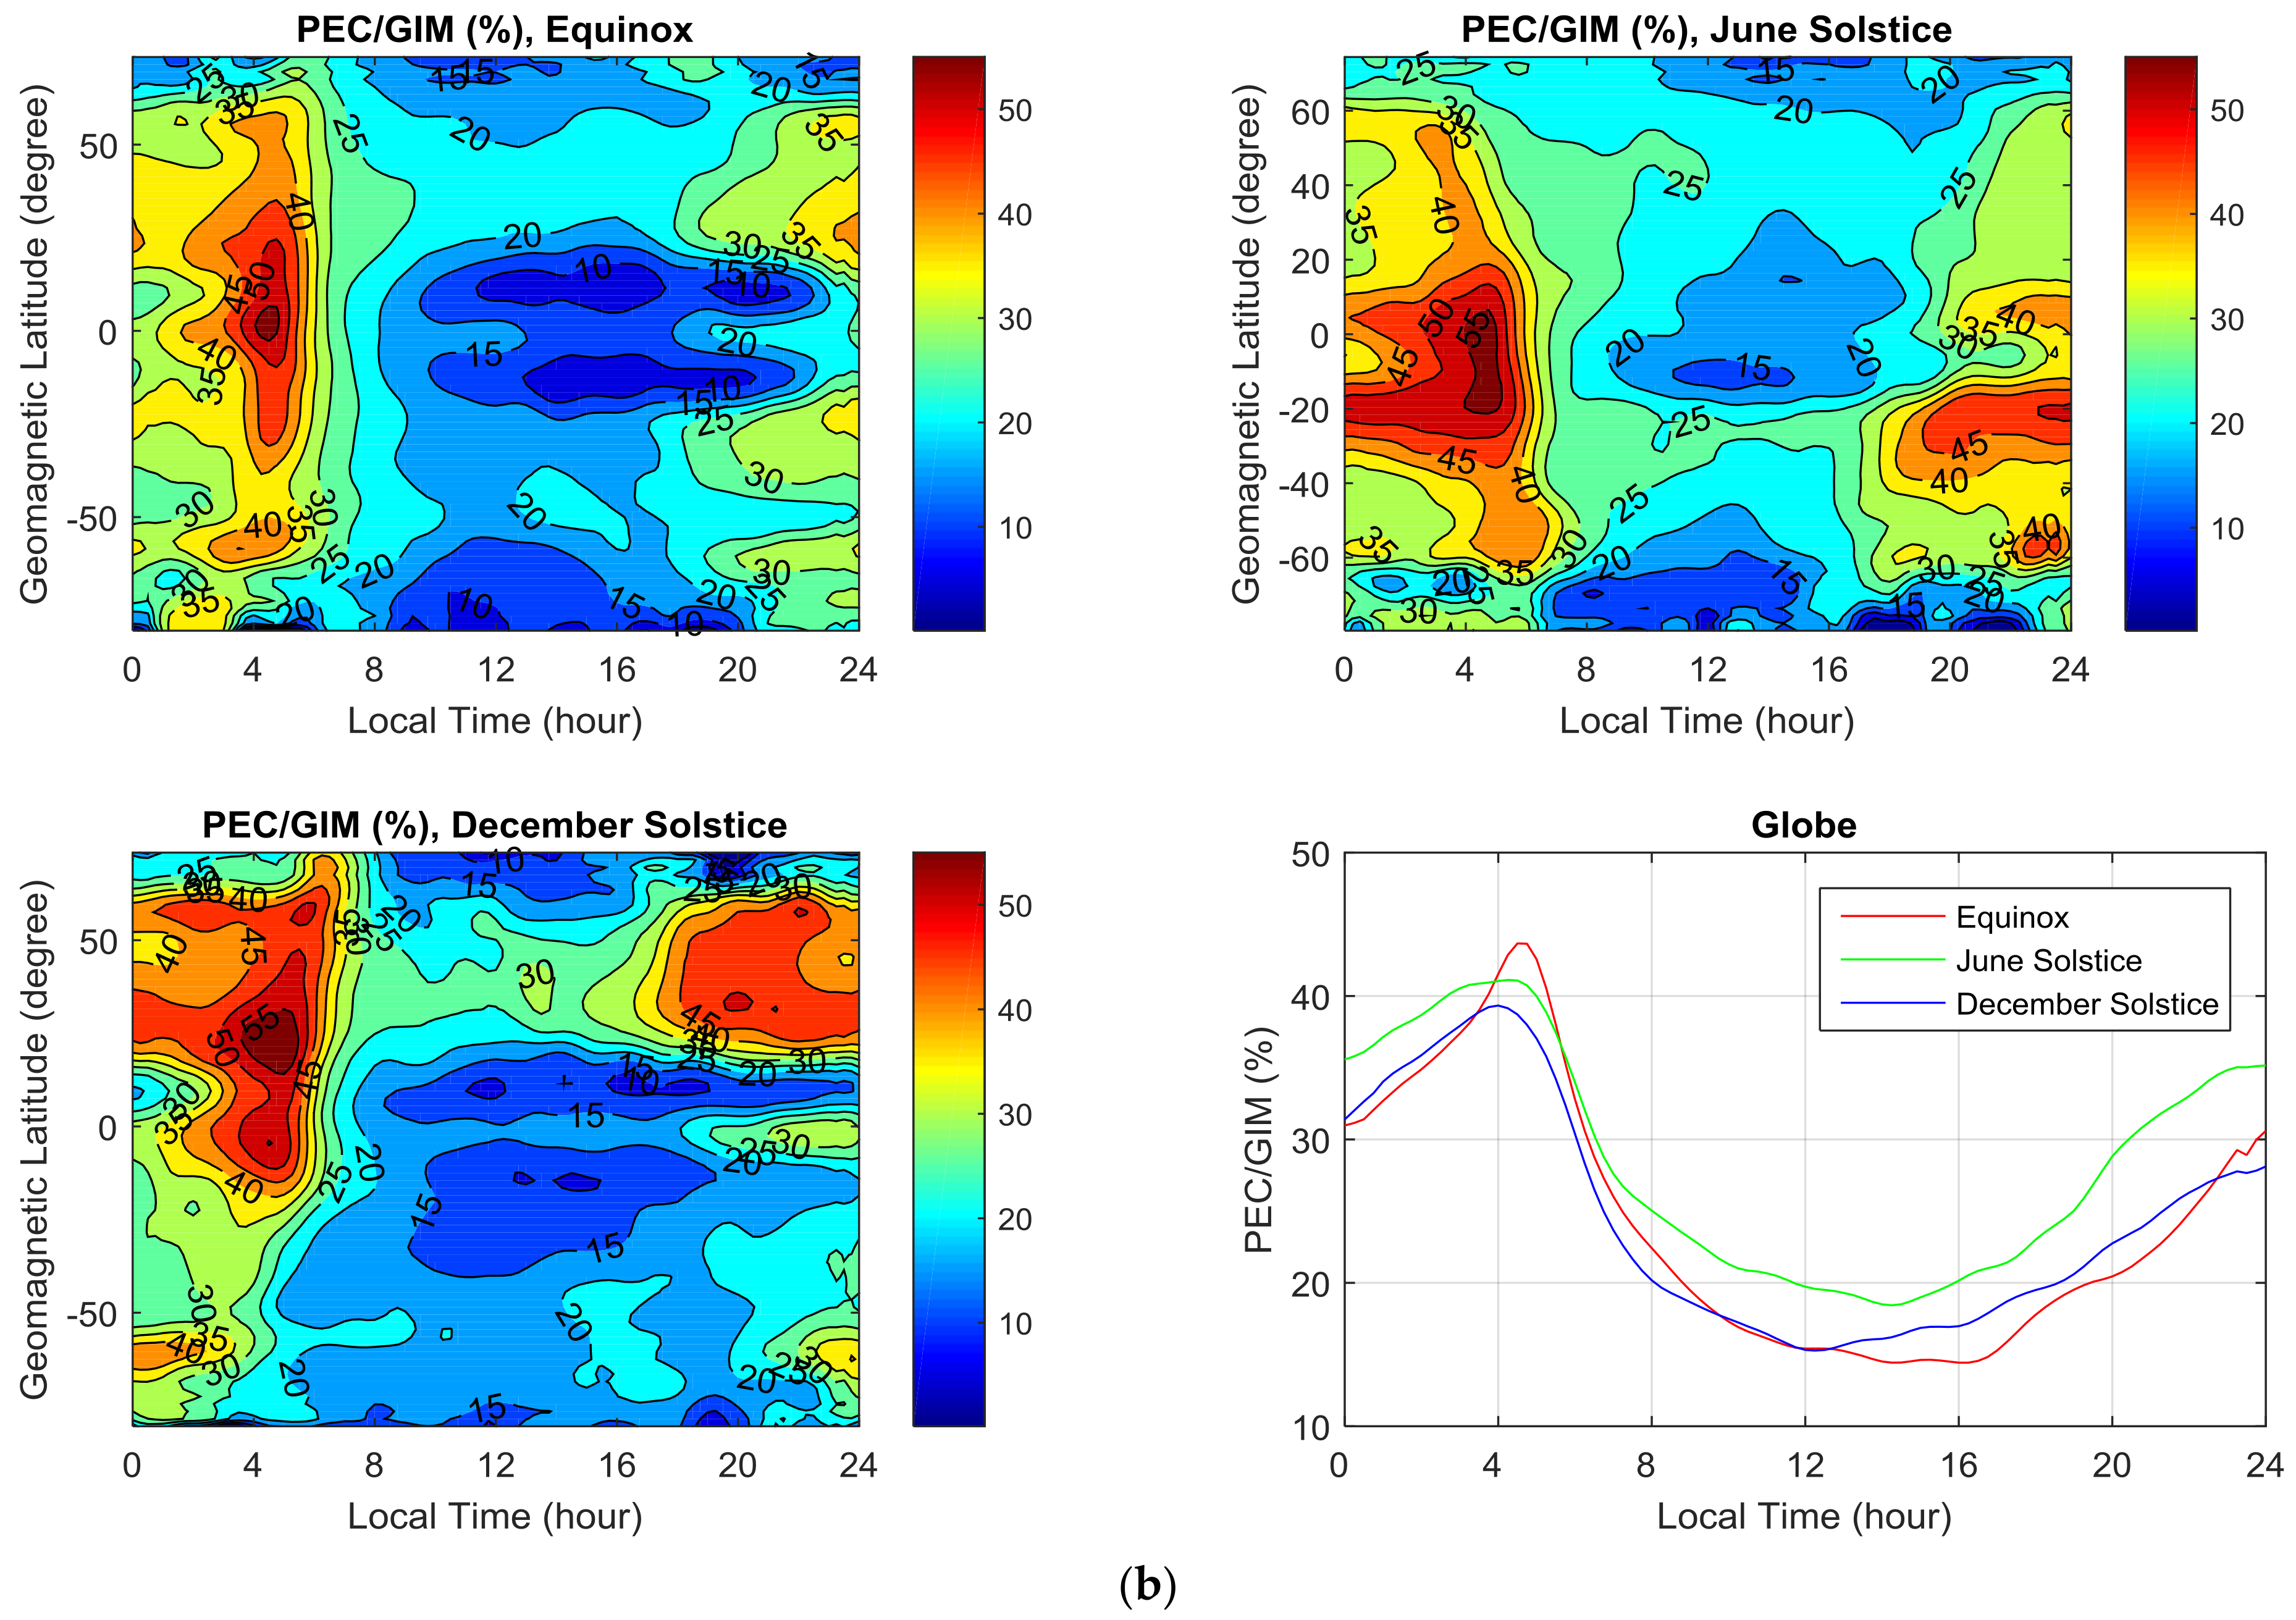
Figure 9a,b shows the percentage contribution of PEC to GNSS-derived vTEC with LT and latitude variations in 2009 and 2011. The PEC percentage contribution is most significant during nighttime for all seasons, and lower during daytime, which is opposite to the PEC diurnal variation pattern. The percentages during nighttime hours are generally 40–60%, while the daytime percentages are approximately 15–30%. Both daytime and nighttime percentages are much higher in June solstice. Moreover, the percentage contribution increases as latitude decreases, with the maximum contribution occurring at low latitudes during the night. The percentage contribution of PEC at mid-high latitudes is significantly higher in the winter hemisphere than in the summer hemisphere, which is opposite to the normal PEC summer-winter difference. In addition, as the solar activity increases, the PEC enhances, but the PEC percentage contribution does not increase with the increasing solar activity. Instead, its maximum contribution decreases from almost 70% in low solar activity (2009) to ~50% in high solar activity (2011) in the early morning and nighttime sectors.
5. Discussion
We compare vTEC between GNSS-based GIM model and T/J mission for 2009 and 2011. To minimize interpolation errors on GIMs, the comparisons are only performed over T/J and GNSS overlapping areas close to IGS stations.
From the mean maps and the GNSS-derived vTEC, we find that the daily bias for different solar activity conditions is very stable and it can be regarded as the systematic bias. We conclude that systematic biases arise from T/J vTEC and result in a greater T/J vTEC than GNSS-derived vTEC. Although systematic biases in Figure 5a–d are somewhat different for different datasets, the bias magnitudes are consistent with previous investigations [18,19,20,21,22,23]. What is responsible for the different systematic biases of T/J vTEC? For example, the systematic bias from JASON2 is not the same as that from JASON1. However, it should be noted that the SSB corrections of radar altimeters differ between JASON2 and JASON1, and we suggest that systematic biases may arise from SSB corrections. We know that SSB corrections predominantly account for two types of error: EM bias and tracker bias. The EM bias is a physical property of the oceans and the radar wavefront, and thus common to altimeters with the same frequency [41,42]. As both JASON1 and JASON2 measure the same sea state with identical frequency, the EM bias is identical for JASON1 and JASON2 for the same period. This leaves the tracker bias between the two altimeters. The tracker bias is a purely instrumental effect, which is unique to each instrument; hence, we suggest that the different systematic biases of JASON2 and JASON1 arise mainly from the tracker biases of SSB between the altimeters, so we should carefully use the systematic bias from JASON1 and JASON2 to extract PEC.
Another feature that should be noted is that the systematic biases of CODE-JASON2 and JPL-JASON2 (and of CODE-JASON1 and JPL-JASON1) are not identical. This may be related to different GIM modeling algorithms used for CODE and JPL, for example, the methods for CODE and JPL to remove the differential code biases are different. From statistics of the difference between T/J vTEC and GNSS vTEC for almost five years (see Table 1 of Hernández-Pajares et al. [43]), we can infer that the difference between CODE GIM and JPL GIM is insufficient, no more than 2 TECu (JPL minus CODE). Moreover, the GIM-based interpolation vTEC from CODE and JPL is consistent with that of the GPS dual-frequency measurements, and the accuracy of GIM-derived vTEC in our study is at most within 2 TECu, because the T/J and GNSS overlapping areas have already been selected to minimize interpolation errors on GIMs and the determination of the GIM-derived vTEC should not be so affected by the interpolation scheme. Therefore, we believe that small difference in the CODE GIM and JPL GIM will not significantly affect the final PEC extraction. Moreover, the PEC distributions and magnitudes (left and right column of Figure 6 and Figure 7) do not differ significantly, and the results agree with previous studies using other methods and data [2,11,16,39]. This indicates that potential errors from CODE GIM and JPL GIM in our study will have a negligible impact on final PEC extraction. In addition, the single layer height (or called the ionospheric effective height, IEH) is a very key parameter in TEC under the widely used single layer model (SLM) assumption [44,45], but actually the optimal plasmaspheric effective height is considerably greater than the commonly adopted value (usually 450 km) in GIM vTEC determination [46,47]. That means the single layer height (450 km) used in GIM calculation is not suitable for estimating the PEC (included in vTEC from the ground-based receiver to the GNSS satellite) above T/J satellite orbit altitude any more, and it leads to smaller PEC than the actual one, so the PEC error may exist in the systematic bias and the extracted PEC. However, fortunately, this potential PEC error induced by the inappropriate single layer height is very small (results not shown here), and did not affect our final PEC results.
After removing the averaged systematic bias for each season, the plasmaspheric component above the T/J satellite altitude was obtained, enabling analysis of PEC and plasmasphere contribution to the ionosphere TEC for different latitudes, local times, and seasons. Although there is a possibility to underestimate or overestimate the PEC values using the calculated systematic bias, our selected zone is surrounded by GPS stations, and we believe that the general morphology of the resulting PEC would not be effected.
The plasmasphere shows clear latitude and local time variations, as well as diurnal variation. The PEC variation in the plasmasphere (higher during the day than at night) is not as large as that in the ionosphere, and the PEC pattern is mainly driven by coupling to the ionosphere via plasmaspheric flux along magnetic field lines [3,11,39]: During the day, the PEC in the plasmasphere is enhanced, and upward plasma flow from the underlying ionosphere fills plasmaspheric flux tubes when the ionospheric density and temperature are high enough to produce a negative O+ pressure gradient with altitude. This negative pressure gradient competes with the downward gravitational force and results in upward plasma flow to achieve a diffusive equilibrium. On the other hand, there is almost no remixing to deplete the PEC in the plasmasphere. However, low PEC during the night is caused by the downward plasmaspheric flux being transported back to the ionosphere, which helps to maintain the nighttime ionosphere.
It should be noted that the magnitude of PEC is much lower than that of the IEC, and the PEC percentage contribution is most significant at night (up to 40–60%), especially at low latitudes, whereas its contribution is lower during the day (approximately 15–30%). This is the opposite phenomenon to the PEC diurnal variation pattern but is expected, because IEC has a constant diurnal variation whereby values are larger during the day. Furthermore, the dispersion between the plasmasphere and ionosphere is significantly smaller, and PEC may exceed IEC around sunrise at low latitudes, which benefits the higher nighttime PEC contribution [9,36]. In addition, the PEC characteristics is different from the ionosphere, and the PEC growth magnitude is small with increasing solar activity though the IEC greatly increases, suggesting that the coupling processes linking these two regions seem not to be linear. In other words, the large IEC changes with solar conditions are not reflected in the plasmasphere via a direct plasma transport between them. This may be because, besides the dominant role of ionospheric O+ density on the plasmaspheric flux, other parameters such as neutral hydrogen density, plasma and neutral temperatures also affect the plasmaspheric flux [3,11]. Although the PEC increases with solar activity to some degree, the PEC percentage contribution does not increase with the increasing solar activity. Instead, its maximum contribution decreases from almost 70% in low solar activity (2009) to ~50% in high solar activity (2011) in the early morning and nighttime sectors, this result may indicate that the plasmaspheric contribution to the maintenance of the nighttime ionosphere does not increase with solar activity. Another interesting feature is that the percentage contribution of PEC at mid-high latitudes is significantly higher in the winter hemisphere than that in the summer hemisphere, whereas PEC value at mid-high latitudes is relatively larger in the summer hemisphere than that in the winter hemisphere.
6. Conclusions
We performed a comprehensive comparison of vertical total electron content (vTEC) for TOPEX/JASON (T/J) and GNSS overlapping areas under low solar activity condition (2009) and high solar activity condition (2011). Results show that the daily systematic bias (T/J vTEC > GNSS-derived vTEC) for both low (2009) and high (2011) solar activity condition is consistent, and the systematic bias for JASON2 and JASON1 is different. We suggest that systematic biases predominantly arise from the sea state bias (SSB), especially the tracker bias. The PEC error above the T/J orbit altitude induced by the inappropriate single layer height may exist in the systematic bias and the extracted PEC, whereas the potential PEC error magnitude is very small, and it will not affect our final PEC results. Then, we introduce a methodology to extract the PEC based on the zero assumption: after removing the systematic bias, PEC can be inferred from residuals between GNSS-derived vTEC and T/J vTEC. Finally, the overall characteristics of the plasmasphere component for different local times, latitudes, and seasons are investigated. PEC varies less in the plasmasphere than in the ionosphere, but can sometimes exceed the ionosphere electron content (IEC) for a few hours around sunrise at low latitudes. Moreover, the PEC percentage contribution is most significant at night (up to 40–60%), especially at low latitudes, whereas it is lower during daytime (approximately 15–30%). This is opposite to the PEC diurnal variation pattern. In addition, the PEC growth magnitude is small with increasing solar activity, although the IEC greatly increases, and the PEC percentage contribution does not increase with the solar activity. Another interesting feature is that the contribution of PEC at mid-high latitudes is significantly higher in the winter hemisphere than in the summer hemisphere, whereas PEC at mid-high latitudes is larger in the summer hemisphere.
Acknowledgments
This work was supported by the National Key Research and Development Program of China (No. 2016YFB0501803), the National Natural Science Foundation of China (No. 41574028), the Natural Science Foundation for Distinguished Young Scholars of Hubei Province of China (No. 2015CFA036), the National Science Foundation for Young Scientists of China (41604002), and Li Jiancheng academician workstation (2015IC015). The TOPEX/Jason TEC data were obtained from NASA (ftp://podaacftp.jpl.nasa.gov/), and the GIMs were obtained from CDDIS (ftp://cddis.nasa.gov/pub/gps/products/ionex).
Author Contributions
All authors made great contributions to the work. Lei Liu led manuscript writing and contributed to the data analysis and research design. Yibin Yao and Jian Kong supervised this study, contributed to the research design and served as the corresponding author. Lei Liu and Lulu Shan contributed to data processing, analysis and discussion.
Conflicts of Interest
The authors declare no conflict of interest.
References
- Gallagher, D.L.; Craven, P.D.; Comfort, R.H. Global core plasma model. J. Geophys. Res. Space Phys. 2000, 105, 18819–18833. [Google Scholar] [CrossRef]
- Cherniak, I.V.; Zakharenkova, I.E.; Krankowski, A.; Shagimuratov, I.I. Plasmaspheric electron content derived from GPS TEC and FORMOSAT-3/COSMIC measurements: Solar minimum condition. Adv. Space Res. 2012, 50, 427–440. [Google Scholar] [CrossRef]
- Shim, J.S.; Jee, G.; Scherliess, L. Climatology of plasmaspheric total electron content obtained from Jason 1 satellite. J. Geophys. Res. Space Phys. 2017, 122, 1611–1623. [Google Scholar] [CrossRef]
- Webb, P.A.; Essex, E.A. A dynamic global model of the plasmasphere. J. Atmos. Sol.-Terr. Phys. 2004, 66, 1057–1073. [Google Scholar] [CrossRef]
- Reinisch, B.W.; Nsumei, P.; Huang, X.; Bilitza, D.K. Modeling the F2 topside and plasmasphere for IRI using IMAGE/RPI and ISIS data. Adv. Space Res. 2007, 39, 731–738. [Google Scholar] [CrossRef]
- Anghel, A.; Carrano, C.; Komjathy, A.; Astilean, A.; Letia, T. Kalman filter-based algorithms for monitoring the ionosphere and plasmasphere with GPS in near-real time. J. Atmos. Sol.-Terr. Phys. 2009, 71, 158–174. [Google Scholar] [CrossRef]
- Zhang, X.; Tang, L. Daily global plasmaspheric maps derived from cosmic GPS observations. IEEE Trans. Geosci. Remote Sens. 2014, 52, 6040–6046. [Google Scholar] [CrossRef]
- Chen, P.; Yao, Y.; Li, Q.; Yao, W. Modeling the plasmasphere based on LEO satellites onboard GPS measurements. J. Geophys. Res. Space Phys. 2017, 122, 1221–1233. [Google Scholar] [CrossRef]
- Yizengaw, E.; Moldwin, M.B.; Galvan, D.; Iijima, B.A.; Komjathy, A.; Mannucci, A.J. Global plasmaspheric TEC and its relative contribution to GPS TEC. J. Atmos. Sol.-Terr. Phys. 2008, 70, 1541–1548. [Google Scholar] [CrossRef]
- González-Casado, G.; Juan, J.M.; Sanz, J.; Rovira-Garcia, A.; Aragon-Angel, A. Ionospheric and plasmaspheric electron contents inferred from radio occultations and global ionospheric maps. J. Geophys. Res. Space Phys. 2015, 120, 5983–5997. [Google Scholar] [CrossRef] [Green Version]
- Lee, H.B.; Jee, G.; Kim, Y.H.; Shim, J.S. Characteristics of global plasmaspheric TEC in comparison with the ionosphere simultaneously observed by Jason-1 satellite. J. Geophys. Res. Space Phys. 2013, 118, 935–946. [Google Scholar] [CrossRef]
- Zhang, M.-L.; Liu, L.-B.; Wan, W.-X.; Ning, B.-Q. Variation of the plasmaspheric electron content derived from the podTEC observations of COSMIC LEO satellites to GPS signals. Chin. J. Geophys.-Chin. Ed. 2016, 59, 1–7. [Google Scholar]
- Belehaki, A.; Jakowski, N.; Reinisch, B.W. Plasmaspheric electron content derived from GPS TEC and digisonde ionograms. Adv. Space Res. 2004, 33, 833–837. [Google Scholar] [CrossRef]
- Zhang, M.L. An investigation on plasmaspheric electron content derived from ISR and GPS observations at Millstone Hill. Chin. J. Geophys. 2013, 56, 738–745. [Google Scholar]
- Jee, G.; Lee, H.B.; Kim, Y.H.; Chung, J.K.; Cho, J. Assessment of GPS global ionosphere maps (GIM) by comparison between CODE GIM and TOPEX/Jason TEC data: Ionospheric perspective. J. Geophys. Res. Space Phys. 2010, 115. [Google Scholar] [CrossRef]
- Chen, P.; Yao, Y. Research on global plasmaspheric electron content by using LEO occultation and GPS data. Adv. Space Res. 2015, 55, 2248–2255. [Google Scholar] [CrossRef]
- Chelton, D.B.; Ries, J.C.; Haines, B.J.; Fu, L.L.; Callahan, P.S. Satellite altimetry. In Satellite Altimetry and Earth Sciences; Fu, L.L., Cazenave, A., Eds.; Academic: London, UK, 2001; pp. 57–64. ISBN 0-12-269545-3. [Google Scholar]
- Codrescu, M.V.; Beierle, K.L.; Fuller-Rowell, T.J.; Palo, S.E.; Zhang, X. More total electron content climatology from TOPEX/Poseidon measurements. Radio Sci. 2001, 36, 325–333. [Google Scholar] [CrossRef]
- Orús, R.; Hernández-Pajares, M.; Juan, J.M.; Sanz, J.; Garcıa-Fernández, M. Performance of different TEC models to provide GPS ionospheric corrections. J. Atmos. Sol.-Terr. Phys. 2002, 64, 2055–2062. [Google Scholar] [CrossRef]
- Meza, A.M.; Diaz, A.R.; Brunini, C.A.; Van Zele, M.A. Systematic behavior of semiempirical global ionospheric models in quiet geomagnetic conditions. Radio Sci. 2002, 37. [Google Scholar] [CrossRef]
- Hernández-Pajares, M. IGS IonosphereWGstatus report: Performance of IGS Ionosphere TEC Maps-Position Paper. In Proceedings of the IGS Technical Meeting, Bern, Switzerland, 29 February–5 March 2004. [Google Scholar]
- Brunini, C.; Meza, A.; Bosch, W. Temporal and spatial variability of the bias between TOPEX-and GPS-derived total electron content. J. Geodesy 2005, 79, 175–188. [Google Scholar] [CrossRef]
- Azpilicueta, F.; Brunini, C. Analysis of the bias between TOPEX and GPS vTEC determinations. J. Geodesy 2009, 83, 121–127. [Google Scholar] [CrossRef]
- Feltens, J.; Schaer, S. IGS products for the ionosphere. In Proceedings of the IGS Analysis Center Workshop, ESA/ESOC, Darmstadt, Germany, 28 May 1998; pp. 225–232. [Google Scholar]
- Komjathy, A.; Langley, R.B.; Bilitza, D. Ingesting GPS-derived TEC data into the International Reference Ionosphere for single frequency altimeter ionospheric delay corrections. Adv. Space Res. 1998, 22, 793–801. [Google Scholar] [CrossRef]
- Hernández-Pajares, M.; Juan, J.M.; Sanz, J. New approaches in global ionospheric determination using ground GPS data. J. Atmos. Sol.-Terr. Phys. 1999, 61, 1237–1247. [Google Scholar] [CrossRef]
- Schaer, S. Mapping and Predicting the Earth’s Ionosphere Using the Global Positioning System. Ph.D. Thesis, Astronomical Institutes, University of Bern, Berne, Switzerland, 1999. [Google Scholar]
- Feltens, J. Development of a new three-dimensional mathematical ionosphere model at European Space Agency/European Space Operations Centre. Space Weather 2007, 5, 1–17. [Google Scholar] [CrossRef]
- Mannucci, A.J.; Wilson, B.D.; Yuan, D.N.; Ho, C.H.; Lindqwister, U.J.; Runge, T.F. A global mapping technique for GPS-derived ionospheric total electron content measurements. Radio Sci. 1998, 33, 565–582. [Google Scholar] [CrossRef]
- Nykiel, G.; Zanimonskiy, Y.M.; Yampolski, Y.M.; Figurski, M. Efficient usage of dense GNSS networks in central europe for the visualization and investigation of ionospheric TEC variations. Sensors 2017, 17, 2298. [Google Scholar] [CrossRef] [PubMed]
- Fu, L.L.; Christensen, E.J.; Yamarone, C.A.; Lefebvre, M.; Menard, Y.; Dorrer, M.; Escudier, P. TOPEX/POSEIDON mission overview. J. Geophys. Res. Oceans 1994, 99, 24369–24381. [Google Scholar] [CrossRef]
- Imel, D. Evaluation of the TOPEX dual-frequency Ionosphere correction. J. Geophys. Res. 1994, 99, 24895–24906. [Google Scholar] [CrossRef]
- Jee, G.; Schunk, R.W.; Scherliess, L. Analysis of TEC data from the TOPEX/Poseidon mission. J. Geophys. Res. Space Phys. 2004, 109. [Google Scholar] [CrossRef]
- Scharroo, R.; Smith, W.H.F. A global positioning system–based climatology for the total electron content in the ionosphere. J. Geophys. Res. Space Phys. 2010, 115. [Google Scholar] [CrossRef]
- Zlotnicki, V. Correlated environmental corrections in TOPEX/POSEIDON, with a note on ionospheric accuracy. J. Geophys. Res. Oceans 1994, 99, 24907–24914. [Google Scholar] [CrossRef]
- Hernández-Pajares, M.; Roma-Dollase, D.; Krankowski, A.; García-Rigo, A.; Orús-Pérez, R. Methodology and consistency of slant and vertical assessments for ionospheric electron content models. J. Geodesy 2017, 91, 1405–1414. [Google Scholar] [CrossRef]
- Sardon, E.; Rius, A.; Zarraoa, N. Estimation of the transmitter and receiver differential biases and the ionospheric total electron content from Global Positioning System observations. Radio Sci. 1994, 29, 577–586. [Google Scholar] [CrossRef]
- Singh, A.K.; Singh, R.P.; Siingh, D. State studies of Earth’s plasmasphere: A review. Planet. Space Sci. 2011, 59, 810–834. [Google Scholar] [CrossRef]
- Chen, P.; Yao, Y.; Yao, W. Global ionosphere maps based on GNSS, satellite altimetry, radio occultation and DORIS. GPS Solut. 2017, 21, 639–650. [Google Scholar] [CrossRef]
- Nanan, B.; Chen, C.Y.; Rajesh, P.K.; Liu, J.Y.; Bailey, G.J. Modeling and observations of the low latitude ionosphere-plasmasphere system at long deep solar minimum. J. Geophys. Res. Atmos. 2012, 117, 8316. [Google Scholar] [CrossRef]
- Tran, N.; Labroue, S.; Philipps, S.; Bronner, E.; Picot, N. Overview and update of the sea state bias corrections for the Jason-2, Jason-1 and TOPEX missions. Mar. Geodesy 2010, 33, 348–362. [Google Scholar] [CrossRef]
- Hausman, J.; Zlotnicki, V. Sea state bias in radar altimetry revisited. Mar. Geodesy 2010, 33, 336–347. [Google Scholar] [CrossRef]
- Hernández-Pajares, M.; Juan, J.M.; Sanz, J.; Orus, R.; Garcia-Rigo, A.; Feltens, J.; Komjathy, A.; Schaer, S.C.; Krankowski, A. The IGS VTEC maps: A reliable source of ionospheric information since 1998. J. Geodesy 2009, 83, 263–275. [Google Scholar] [CrossRef]
- Nava, B.; Radicella, S.M.; Leitinger, R.; Coïsson, P. Use of total electron content data to analyze ionosphere electron density gradients. Adv. Space Res. 2007, 39, 1292–1297. [Google Scholar] [CrossRef]
- Li, M.; Yuan, Y.; Zhang, B.; Wang, N.; Li, Z.; Liu, X.; Zhang, X. Determination of the optimized single-layer ionospheric height for electron content measurements over China. J. Geodesy 2018, 92, 169–183. [Google Scholar] [CrossRef]
- Birch, M.J.; Hargreaves, J.K.; Bailey, G.J. On the use of an effective ionospheric height in electron content measurement by GPS reception. Radio Sci. 2002, 37. [Google Scholar] [CrossRef]
- Zhong, J.; Lei, J.; Dou, X.; Yue, X. Assessment of vertical TEC mapping functions for space-based GNSS observations. GPS Solut. 2016, 20, 353–362. [Google Scholar] [CrossRef]
Figure 1.
IGS stations (blue pentagram for CODE, magenta circle for JPL) used to compute the GIM, and JASON2 satellite footprint locations (green lines are close to IGS stations, red lines vice versa) for a 10-day cycle from Day 010 to 020 in 2009. The vTEC interpolated from GIMs based on these IGS stations were selected at the location and time of T/J satellite orbits.

Figure 2.
The std of the differences between the GIM-based vTEC and the GPS-based vTEC from: PRDS station (top); and ALIC station (bottom).
Figure 2.
The std of the differences between the GIM-based vTEC and the GPS-based vTEC from: PRDS station (top); and ALIC station (bottom).

Figure 3.
Std of the residuals regarding JASON2 vTEC for two cases (CLOSE to and FAR from IGS sites, respectively) in 2009, as a function of the geographic latitude.
Figure 3.
Std of the residuals regarding JASON2 vTEC for two cases (CLOSE to and FAR from IGS sites, respectively) in 2009, as a function of the geographic latitude.

Figure 4.
Difference between CODE/JPL GIM and JASON2 vTEC averaged over three seasons (Equinox, June solstice, and December solstice) for 2009, mapped against geomagnetic latitude and local time coordinates (with 2° × 0.25 h bins).
Figure 4.
Difference between CODE/JPL GIM and JASON2 vTEC averaged over three seasons (Equinox, June solstice, and December solstice) for 2009, mapped against geomagnetic latitude and local time coordinates (with 2° × 0.25 h bins).


Figure 5.
(a) Daily minimum bias variability for CODE-JASON2 and JPL-JASON2 as a function of DOY in 2009. (b) Same as (a), but in 2011. (c) Same as (a), but for CODE-JASON1 and JPL-JASON1. (d) Daily minimum bias variability for CODE-JASON1 and JPL-JASON1 as a function of DOY in 2011.
Figure 5.
(a) Daily minimum bias variability for CODE-JASON2 and JPL-JASON2 as a function of DOY in 2009. (b) Same as (a), but in 2011. (c) Same as (a), but for CODE-JASON1 and JPL-JASON1. (d) Daily minimum bias variability for CODE-JASON1 and JPL-JASON1 as a function of DOY in 2011.


Figure 6.
Seasonal average of plasmasphere maps for CODE-JASON2 and JPL-JASON2 in 2009, after subtracting the systematic bias, mapped against geomagnetic latitudes and local time coordinates.
Figure 6.
Seasonal average of plasmasphere maps for CODE-JASON2 and JPL-JASON2 in 2009, after subtracting the systematic bias, mapped against geomagnetic latitudes and local time coordinates.


Figure 7.
(a) Same as Figure 6, but for CODE-JASON1 and JPL-JASON1. (b) Seasonal average of plasmasphere maps for JPL–JASON1 and JPL-JASON2 in 2011, after subtracting the systematic bias, mapped against geomagnetic latitudes and local time coordinates.
Figure 7.
(a) Same as Figure 6, but for CODE-JASON1 and JPL-JASON1. (b) Seasonal average of plasmasphere maps for JPL–JASON1 and JPL-JASON2 in 2011, after subtracting the systematic bias, mapped against geomagnetic latitudes and local time coordinates.


Figure 8.
LT variation of the mean electron content in the ionosphere (IEC, solid lines) and the plasmasphere (PEC, dotted lines) for different geomagnetic latitude bands in each hemisphere during June and December solstices and the March equinox in: (a) 2009; and (b) 2011. NH and SH refer to Northern Hemisphere and Southern Hemisphere, respectively.


Figure 9.
Percentage contribution of PEC to GNSS-derived vTEC with LT and geomagnetic latitude during the Equinox, and June and December solstices of: (a) 2009; and (b) 2011.
Figure 9.
Percentage contribution of PEC to GNSS-derived vTEC with LT and geomagnetic latitude during the Equinox, and June and December solstices of: (a) 2009; and (b) 2011.


© 2018 by the authors. Licensee MDPI, Basel, Switzerland. This article is an open access article distributed under the terms and conditions of the Creative Commons Attribution (CC BY) license (http://creativecommons.org/licenses/by/4.0/).
Share and Cite
MDPI and ACS Style
Liu, L.; Yao, Y.; Kong, J.; Shan, L. Plasmaspheric Electron Content Inferred from Residuals between GNSS-Derived and TOPEX/JASON Vertical TEC Data. Remote Sens. 2018, 10, 621. https://doi.org/10.3390/rs10040621
AMA Style
Liu L, Yao Y, Kong J, Shan L. Plasmaspheric Electron Content Inferred from Residuals between GNSS-Derived and TOPEX/JASON Vertical TEC Data. Remote Sensing. 2018; 10(4):621. https://doi.org/10.3390/rs10040621
Chicago/Turabian StyleLiu, Lei, Yibin Yao, Jian Kong, and Lulu Shan. 2018. "Plasmaspheric Electron Content Inferred from Residuals between GNSS-Derived and TOPEX/JASON Vertical TEC Data" Remote Sensing 10, no. 4: 621. https://doi.org/10.3390/rs10040621
Note that from the first issue of 2016, this journal uses article numbers instead of page numbers. See further details here.