Review

Spatiotemporal Fusion of Multisource Remote Sensing Data: Literature Survey, Taxonomy, Principles, Applications, and Future Directions

Department of Land Surveying and Geo-Informatics, The Hong Kong Polytechnic University, Kowloon, Hong Kong, China
*
Author to whom correspondence should be addressed.
Remote Sens. 2018, 10(4), 527; https://doi.org/10.3390/rs10040527
Submission received: 7 February 2018 / Revised: 18 March 2018 / Accepted: 27 March 2018 / Published: 29 March 2018

Abstract

:
Satellite time series with high spatial resolution is critical for monitoring land surface dynamics in heterogeneous landscapes. Although remote sensing technologies have experienced rapid development in recent years, data acquired from a single satellite sensor are often unable to satisfy our demand. As a result, integrated use of data from different sensors has become increasingly popular in the past decade. Many spatiotemporal data fusion methods have been developed to produce synthesized images with both high spatial and temporal resolutions from two types of satellite images, frequent coarse-resolution images, and sparse fine-resolution images. These methods were designed based on different principles and strategies, and therefore show different strengths and limitations. This diversity brings difficulties for users to choose an appropriate method for their specific applications and data sets. To this end, this review paper investigates literature on current spatiotemporal data fusion methods, categorizes existing methods, discusses the principal laws underlying these methods, summarizes their potential applications, and proposes possible directions for future studies in this field.

Graphical Abstract

1. Introduction

Dense time-series data from satellites are highly desired for studying dynamics of our Earth systems. For instance, dense time-series data contain the temporal information of objects on the land surface, which are extremely helpful for discriminating different land cover types [1], monitoring vegetation seasonality [2], modeling the carbon sequestration [3], estimating crop yields [4], exploring the human-nature interactions [5], and revealing the ecosystem-climate feedback [6]. Time series-based studies have become extremely popular in this decade because the number of free satellite images available to the public are increasing. For example, all Landsat data have been available at no charge since 2008 and now data from a new satellite, Sentinel-2, are also free of charge. Additionally, a free cloud computing platform, Google Earth Engine (GEE), currently promotes the use of time-series satellite data for large area monitoring of land and water dynamics because it has super ability to process massive satellite images [7].
However, these available satellite images still cannot satisfy our needs for studying high-frequency change in heterogeneous landscapes, such as monitoring the progress of construction work in cities and producing real-time map of urban hazards (e.g., landslides and floods). These studies need satellite images with high frequency as well as high spatial resolution. Due to the tradeoff between scanning swath and pixel size, existing satellites are hard to obtain images with both high temporal resolution (or temporal frequency) and high spatial resolution [8]. Table 1 lists most of the existing multispectral satellite sensors with spatial resolution larger than 10 m. The commercial satellites with very high spatial resolutions, e.g., meter to sub-meter, are not included in Table 1 since they can be costly to composite time-series data. From Table 1, we can see that high-frequency data have coarse spatial resolutions, such as AVHRR, MODIS and SeaWiFS which collects daily images, but their spatial resolutions range from 250 m to 1000 m. On the other hand, the sub 100 m sensors, such as ASTER, Landsat (TM, ETM+, OLI), and Sentinel-2 MSI, have a relatively long revisit cycle, e.g., longer than 10 days. In addition, optical satellite images are contaminated by clouds, cloud shadows, and other atmospheric conditions. These contaminations further hinder the acquisition of dense time series data from sub 100 m sensors, especially in cloudy regions such as tropical and subtropical areas [9]. Although new technologies developed in recent years, such as Unmanned Aerial Vehicles (UAVs), provide a valuable supplement to traditional satellites, scientists still face challenges when studying land surface dynamics of the complex environment over a long period (e.g., several decades) because only satellite images documented the early years. For example, Landsat images are the only data source appropriate for studying any land cover changes in the past 40 years because of their relatively high spatial resolution and long-term archives since 1972. Therefore, how to integrate images from multiple satellites to generate high-quality dense time-series data becomes an urgent task for studies which require observations with high frequency and high spatial resolution.
Spatiotemporal data fusion is a feasible solution for the aforementioned problem. Spatiotemporal data fusion is a type of methodology for fusing satellite images from two sensors, sensor one with very high frequency but coarse spatial resolution such as MODIS and AVHRR, and sensor two with very high spatial resolution but lower frequency such as Landsat and Sentinel-2. The output of spatiotemporal data fusion is the synthesized images with temporal frequency of sensor one and spatial resolution of sensor two (Figure 1). It can also integrate two sensors with similar spatial and temporal resolutions to generate consistent observations, such as harmonizing Landsat and Sentinel-2 images [10]. Spatiotemporal data fusion provides a better dataset with higher spatial and temporal resolutions and thus it is a feasible and effective tool to overcome the limitations of current satellites. It is needed to point out that spatiotemporal data fusion is different from the traditional image fusion in the remote sensing field. Traditional data fusion focuses more on combining high-resolution panchromatic band and low-resolution multispectral bands from the same sensor and both data sets are acquired at the same time. Traditional data fusion technologies include Brovey transformation, the intensity-hue-saturation (IHS) transformation, principal component substation, wavelet decomposition, and Gram-Schmidt spectral sharpening method [11]. The major difference between traditional data fusion and spatiotemporal data fusion is that traditional data fusion cannot improve the temporal frequency of the original images.
Spatiotemporal data fusion has experienced a fast development in the past decade. Up to the end of 2017, 44 different spatiotemporal data fusion methods have been published in major refereed journals in the field of remote sensing and the number of new methods increased dramatically since 2013 (Figure 2a). The total citations of these 58 papers is 2, 112 in Web of Science and shows a dramatic increase yearly (Figure 2b). The spatial and temporal adaptive reflectance fusion model (STARFM) developed in 2006 is the first operational algorithm with free code for users. It has been widely used and became the basis for many other methods which partially explains the increase in both new spatiotemporal fusion methods and citations after 2006. Although spatiotemporal data fusion garnered a lot of attention in recent years, to our knowledge there is no thorough review article to summarize the progress on this topic. Zhang et al. generalized the spatiotemporal data fusion methods developed up to November 2014 [12]. Chen et al. did a comparison among four spatiotemporal data fusion methods [13]. Gao et al. reviewed STARFM and two extended methods as well as their applications in vegetation monitoring [14]. It is urgent to survey the current literature to guide future research on this topic.
This review investigates literature on current spatiotemporal data fusion methods, categorizes existing methods, discusses the principal laws underlying these methods, summarizes their applications, presents the key issues, and proposes possible directions of future studies on this topic.

2. Literature Survey

We collected spatiotemporal data fusion methods published in refereed journals of the remote sensing field. These 58 papers were published in 11 major international journals in the field of remote sensing (Table 2). Methods published in conference proceedings or other journals may have been omitted in this literature analysis, but majority of existing spatiotemporal data fusion methods should be included in Table 2. Among these 11 journals, 15 out of 58 methods were published in Remote Sensing of Environment, a top journal in the field of remote sensing, which confirms that as one of new data processing techniques, spatiotemporal data fusion has attracted a lot of attention and has been widely accepted by the remote sensing community. It should be noted that papers on spatiotemporal data fusion applications were not included in this section. They are discussed in Section 5. For convenience, papers introducing new spatiotemporal fusion methods are referred as methodology papers hereinafter, and papers only applying spatiotemporal fusion methods to study scientific or practical problems are referred as application papers.
Currently, “spatiotemporal data fusion” is a term commonly used to name this type of data fusion technology. This term can well distinguish this type of fusion methods from traditional pan-sharpening methods which only improve images in spatial and spectral domains. However, in the early years, the names are quite inconsistent. Developers named their methods in different ways. This can be reflected by the words used in the titles (Figure 3a) and keywords of the 58 methodology papers (Figure 3b). “fusion”, “spatial”, and “temporal” are frequent words used in titles and keywords which exactly reflect the nature of spatiotemporal data fusion, i.e., technology to improve spatial and temporal resolutions of multi-source satellite images. “MODIS” and “Landsat” are also frequently used in the titles and keywords, suggesting that most spatiotemporal data fusion models were proposed to fuse MODIS and Landsat data or used them as representatives of coarse images and fine images respectively. Although most spatiotemporal fusion methods were applied to data from satellites listed in Table 1, it is worthwhile to mention that spatiotemporal fusion methods can also fuse high-resolution images from commercial satellites, especially for small-scale studies. For instance, the 5 m RapidEye images was fused with 30 m Landsat images to improve the detection of local forest disturbance [71].
The literature citation map was plotted by VOSViewer (Figure 4). The most cited paper is the one developing STARFM [8] which has been cited by most other methodology papers. Other high-citation papers include ones developing ESTARFM [11], STAARCH [27], and a semi-physical fusion method [19]. These papers are in the center of the citation map.

3. Taxonomy

In a previous work [26], typical spatiotemporal data fusion methods were classified into three groups: unmixing-based, weight function-based, and dictionary-pair learning-based. However, this classification scheme cannot cover all spatiotemporal fusion methods. In the current review, existing spatiotemporal data fusion methods are categorized into five groups based on the specific techniques used to link coarse and fine images: unmixing-based, weight function-based, Bayesian-based, learning-based, and hybrid methods (Table 3). For convenience, the images with coarse spatial resolution but high frequency are referred as “coarse images” and pixels in these images as “coarse pixels”, while the images with high spatial resolution but low frequency are called “fine images” and their pixels, “fine pixels”. All the existing methods need to input one or more pairs of coarse and fine images and a coarse image at prediction date. The output is a synthetic fine image at prediction date.
Unmixing-based methods estimate the value of fine pixels through unmixing the coarse pixels based on the linear spectral mixing theory. The multisensor multiresolution technique (MMT) proposed by Zhukov, Oertel, Lanzl, and Reinhäckel (1999) is perhaps the first unmixing-based method to fuse satellite images acquired at different times and with different spatial resolutions. Other unmixing-based methods can be considered as improved versions of MMT. There are four steps in MMT to predict a fine-resolution image: (1) classify the input fine image to define endmembers; (2) compute endmember fractions of each coarse pixel; (3) unmix the coarse pixels at the prediction date within a moving window; (4) assign unmixed reflectance to fine pixels [31]. MMT has two major challenges: large errors in the spectral unmixing and lack of within-class variability for fine pixels inside one coarse pixel. The subsequent unmixing-based methods are geared towards addressing these two challenges. For instance, LAC-GAS NDVI integration method used locally calibrated multivariate regression models to better reserve the within-class NDVI spatial variability [52]. Zurita-Milla et al. introduced constraints into the linear unmixing process to ensure that the solved reflectance values were positive and within an appropriate range [57]. STDFA estimated reflectance change through unmixing endmember reflectance at both input and prediction date in a moving window and then added the estimated change back to the base fine-resolution image to get the prediction [63]. STDFA was further improved by using adaptive moving window size [66]. The Landsat-MERIS fusion method modified the cost function to prevent the solved endmember reflectance from being greatly different from a predefined endmember reflectance [62]. OB-STVIUM employed multi-data segmentation to better define the endmember fractions for improving the estimation of the fine-scale pixel values [17].
Weight function-based methods estimate fine pixel values through combining information of all input images by weight functions. Up to present, this category has the most methods developed (Table 3). The spatial and temporal adaptive reflectance fusion model (STARFM) is the weight function-based method developed first [8]. STARFM assumes that changes of reflectance are consistent and comparable at coarse and fine resolutions if pixels in coarse-resolution images are “pure” pixels, in that, one coarse pixel only includes one land cover type. In this case, changes derived from coarse pixels can be directly added to pixels in fine-resolution images to get the prediction. However, this ideal situation cannot be satisfied when coarse pixels are mixed, having a mixture of different land cover types. Therefore, STARFM predicts pixels with a function that gives a higher weight to purer coarse pixels based on information from neighboring fine pixels. Given its simplicity and code available to the public, STARFM has been a popular method with 398 citations. However, it has two major issues: the assumption is not valid in heterogeneous landscapes and the weight function is empirical. Most other weight function-based methods improved STARFM with regards to the above two issues, or modified STARFM to fusion other products, such as land surface temperature (LST) [21], vegetation indices [50] and classification results [39], instead of reflectance. For example, the spatial temporal adaptive algorithm for mapping reflectance change (STAARCH) detects the change points from dense time series of coarse images to improve STARFM’s performance when land cover type change exists [27]. Enhanced STARFM (ESTARFM) introduces a conversion coefficient to improve STARFM’s accuracy in heterogeneous areas [11]. SADFAT modified STARFM to blend LST data by considering annual temperature cycle and urban thermal landscape heterogeneity [21]. The original STARFM was also modified to an operational framework by integrating BRDF correction, automatic co-registration, and automatic selection of input data pairs [33]. ATPPK-STARFM first downscales 500 m MODIS images to 250 m before implementation of STARFM to increase the performance in abrupt changes and heterogeneous landscapes [67]. ISKRFM integrates image inpainting and steering kernel regression to detect land-cover changed regions and determine the weight function. These two steps improve the land cover issue and empirical weight function in the original STARFM method [56].
Bayesian-based methods use Bayesian estimation theory to fuse images in a probabilistic manner. In the Bayesian framework, the spatiotemporal fusion can be considered as a maximum a posterior (MAP) problem, i.e., the goal of spatiotemporal data fusion is to obtain the desirable fine image at the prediction date by maximizing its conditional probability relative to the input fine and coarse images [38]. Bayesian framework provides more flexibility in modeling the relationships between the input and predicted images using defined principles which allows an intuitive interpretation of fusion processes [70]. In Bayesian-based data fusion, the key is how to model the relationship between observed images (i.e., the input images) and unobserved image (i.e., the image to be predicted). In spatiotemporal data fusion, there are two types of relationships. One is the relationship between observed coarse image and fine image observed at the same date which we name as scale model, and the other one is the relationship between coarse images observed at different dates which we name as temporal model. The scale model incorporates knowledge of point spread function which maps the pixels of fine image to the pixels of the coarse image [42]. The temporal model describes the dynamics of land surface, including both gradual change such as vegetation seasonality and sudden land cover change such as forest fires and floods. Existing Bayesian-based spatiotemporal data fusion methods used different methods to model these relationships. In the Bayesian Maximum Entropy (BME) method, covariance functions were used to link coarse the Advanced Microwave Scanning Radiometer for Earth observing system (AMSR-E) sea surface temperature (SST) with 25 km resolution and fine MODIS SST with 4 km resolution [20]. In a unified fusion method, the low-pass filtering method was used to model the relationship between coarse and fine images and a linear model to model the temporal relationship [70]. In the NDVI-BSFM method, linear mixing model was used to link MODIS and Landsat NDVI and multi-year average NDVI time series was used to represent the temporal relationship [46]. In a recent Bayesian data fusion approach, integration of bilinear interpolation of coarse image and high-pass frequencies of fine image were used to model the scale model, and the joint covariance from the observed coarse images was employed as temporal model [42].
Learning-based methods employ machine learning algorithms to model the relationship between observed coarse-fine image pairs and then predict the unobserved fine images. Up to date, dictionary-pair learning [29], extreme learning [58], regression tree [69], random forest [49], deep convolutional neural networks [68], and artificial neural network [15] have been used for spatiotemporal data fusion. Dictionary-pair learning-based algorithms establish correspondences between fine- and coarse-resolution images based on their structural similarity which can be used to capture the main features, including land cover type changes, in the predictions. The Sparse-representation-based SpatioTemporal reflectance Fusion Model (SPSTFM) is perhaps the first to bring dictionary-pair learning techniques from natural image super-resolution to spatiotemporal data fusion [29]. SPSTFM establishes a correspondence between the change of two coarse and fine image pairs. Following SPSTFM, Song and Huang developed another dictionary-pair learning-based fusion method which uses only one pair of fine- and coarse-resolution images [35]. This method trains a dictionary pair on the input fine- and coarse-resolution image pair, and then downscales the coarse-resolution image at the prediction date by a sparse coding technique. To solve the problem of insufficient prior knowledge in the sparse representation, a new spatiotemporal fusion model is constructed with the semi-coupled dictionary learning and structural sparsity [48]. Furthermore, the explicit down-sampling process from fine to coarse images were considered by compressed sensing which can further improve accuracy of the dictionary-based spatiotemporal fusion [37]. The error-bound-regularized sparse coding (EBSPTM) method is another dictionary-pair learning method which imposes a regularization on the error bounds of the dictionary perturbations to model the possible perturbations of the overcomplete dictionary [32]. The wavelet-artificial intelligence fusion approach (WAIFA) couples wavelet transform with artificial neural network to blend MODIS and Landsat land surface temperature data [15]. The main improvement of WAIFA is that the artificial neural network can cope with the non-linear nature of the land surface temperature data. The extreme learning machine (ELM) method uses a powerful learning technique, extreme learning machine, to build a feature mapping function between raw pixels of coarse and fine images. Compared with SPSTFM, ELM achieves a better performance and uses less computing time [58].
Hybrid methods integrate two or more technologies from the above four categories. The aim is to improve the performance of spatiotemporal data fusion through combining the advantages of different methods. One representative of this kind is the Flexible Spatiotemporal Data Fusion (FSDAF) developed recently. FSDAF combined ideas from unmixing-based methods and the weighted function-based methods, as well as spatial interpolation. As a result, FSDAF is capable of fusing images in challenging scenarios, i.e., heterogeneous landscapes and abrupt land cover changes occurring between the input images and prediction. For the highly mixed pixels, their reflectance change can be estimated through solving the linear mixing equations. For the abrupt land cover changes, the spatial interpolation can capture it as long as it is shown in the coarse image. The idea of FSDAF was recently adapted by the BLEed Spatiotemporal Temperature (BLEST) method for fusing land surface temperature with different spatial resolutions [28]. The weight function was further used to combine the unmixing results and spatial interpolation to reduce the uncertainties. Another example is the spatial and temporal reflectance unmixing model (STRUM), which directly unmixed the change of coarse pixels by Bayesian theory to estimate the change of fine-resolution endmembers and then use the idea of STARFM to create the fused image using moving windows [24]. A recently developed method, Spatial-Temporal remotely sensed Images and land cover Maps Fusion Model (STIMFM), integrates the spectral linear mixing model and Bayesian framework for fusing multi-temporal coarse images and a few land cover maps from fine images to directly produce a series of fine-resolution land cover maps [22].

4. Principle Laws

Several fundamental laws or assumptions were used in existing spatiotemporal data fusion methods although they are not often clearly stated. This section highlights and discusses these laws in detail. The most common application scenario is that two coarse images at t1 and t2, and a fine image at t1 are collected. We want to predict a fine image at t2 by fusing the three collected images. Some notations and definitions are given here for convenience.
m: the number of fine pixels (also named as subpixels) within one coarse pixel;
(xi, yi): coordinate index of the ith pixel;
C1(xi, yi, b) and C2(xi, yi, b): band b value of coarse pixel (e.g., MODIS) at location (xi, yi) observed at t1 and t2 respectively;
F1(xi, yi, b) and F2(xi, yi, b): band b value of fine pixel (e.g., Landsat) at location (xi, yi) observed at t1 and t2 respectively;
F1(xij, yij, b) and F2(xij, yij, b): band b value of the jth fine pixel within the coarse pixel at location (xi, yi) observed at t1 and t2 respectively;
fc(xi, yi): the fraction of class c of the coarse pixel (xi, yi);
F(c, b): the band b value of endmember class c at fine scale;
ΔC(xi, yi, b): change of band b value of the (xi, yi) coarse pixel between t1 and t2;
ΔF(xij, yij, b): change of band b value of the jth fine pixel inside the coarse pixel (xi, yi) between t1 and t2;
ΔF(c, b): change of band b value of class c at fine resolution between t1 and t2.

4.1. Linear Mixing Model

The linear mixing model can be used to link the pixels in the coarse image and fine image by the equation below:
C ( x i , y i , b ) = 1 m j = 1 m F ( x i j , y i j , b ) + ε
For each coarse pixel, its pixel value is equal to the average of all internal fine pixels adding a bias factor ε which is the systematic difference between two sensors. It can be caused by difference in bandwidth, solar geometry, and viewing angles [11]. The basic assumption for the linear mixing model is that the variable is linearly additive. For optical satellite images, the raw images record the radiance, and is often converted to reflectance for end users. Both radiance and reflectance of individual spectral bands are linearly additive. However, some higher-level products derived from the raw data are not linearly additive, such as some vegetation indices (e.g., NDVI, EVI) and land surface temperature. Existing studies show that using linear mixing model to link these products at different scales may not introduce significant errors [72,73], so some existing methods also use linear mixing model for fusing these high-level products, such as the NDVI-LMGM model for fusing MODIS and Landsat NDVI products [43], and the SADFAT for fusing LST products [21].
Although linear mixing model is the start point of many spatiotemporal fusion methods, it is used in two fashions. In the unmixing-based method [57,62,63], the internal fine pixels are aggregated into several land cover classes. Then, Equation (1) can be rewritten as:
C ( x i , y i , b ) = c = 1 l f c ( x i , y i ) × F ( c , b )
In this equation, fraction of land cover types fc(xi, yi) can be estimated from the classification map of the given fine image at t1 or any fine-scale land cover maps, and this fraction is assumed to be stable across different times. The endmember’s spectral values of each land cover F(c, b) can be estimated through solving the linear equation system composed by multiple coarse pixels:
[ C ( x 1 , y 1 , b ) C ( x i , y i , b ) C ( x n , y n , b ) ] = [ f 1 ( x 1 , y 1 ) f 2 ( x 1 , y 1 ) f l ( x 1 , y 1 ) f 1 ( x i , y i ) f 2 ( x i , y i ) f l ( x i , y i ) f 1 ( x n , y n ) f 2 ( x n , y n ) f l ( x n , y n ) ] [ F ( 1 , b ) F ( c , b ) F ( l , b ) ]
All the pixel values of coarse and fine images in Equations (1)–(3) can be replaced by the pixel value change between t1 and t2. As a result, the temporal change at fine-scale ΔF(c, b) can be estimated by solving the linear equation system. For the unmixing-based methods, their efforts are input for how to select more appropriate coarse pixels to compose the linear equation system, how to improve the accuracy of solving the equation system, how to distribute the solved endmember values to fine pixels, how to compensate the residuals and how to add the inner-class variations to the fused results.
Linear mixing model is also the basis of many weighted function-based methods. Unlike the unmixing-based methods, weighted function-based methods do not solve the linear mixing equation system. They use further assumptions to simplify the mixing equation, so that the temporal change of the internal fine pixels can be directly estimated from the corresponding coarse pixel. For example, STARFM just simply assumes that the temporal change of all internal fine pixels is equal to the corresponding coarse pixel:
F 2 ( x i j , y i j , b ) F 1 ( x i j , y i j , b ) = C 2 ( x i , y i , b ) C 1 ( x i , y i , b )
Equation (4) is a specific case of Equation (1) if we assume that all internal fine pixels have same temporal change. This assumption is only valid when all internal fine pixels are from same land cover type, i.e., the corresponding coarse pixel is “pure” pixel. The subsequent enhanced versions of STARFM try to improve Equation (4) to make it capable of estimating temporal change more accurately. For example, ESTARFM introduced a conversion coefficient to adjust the temporal change from coarse pixels to fine pixels [11] and STAARCH selected optimal input fine images through the change detection on dense time series of coarse images [27].

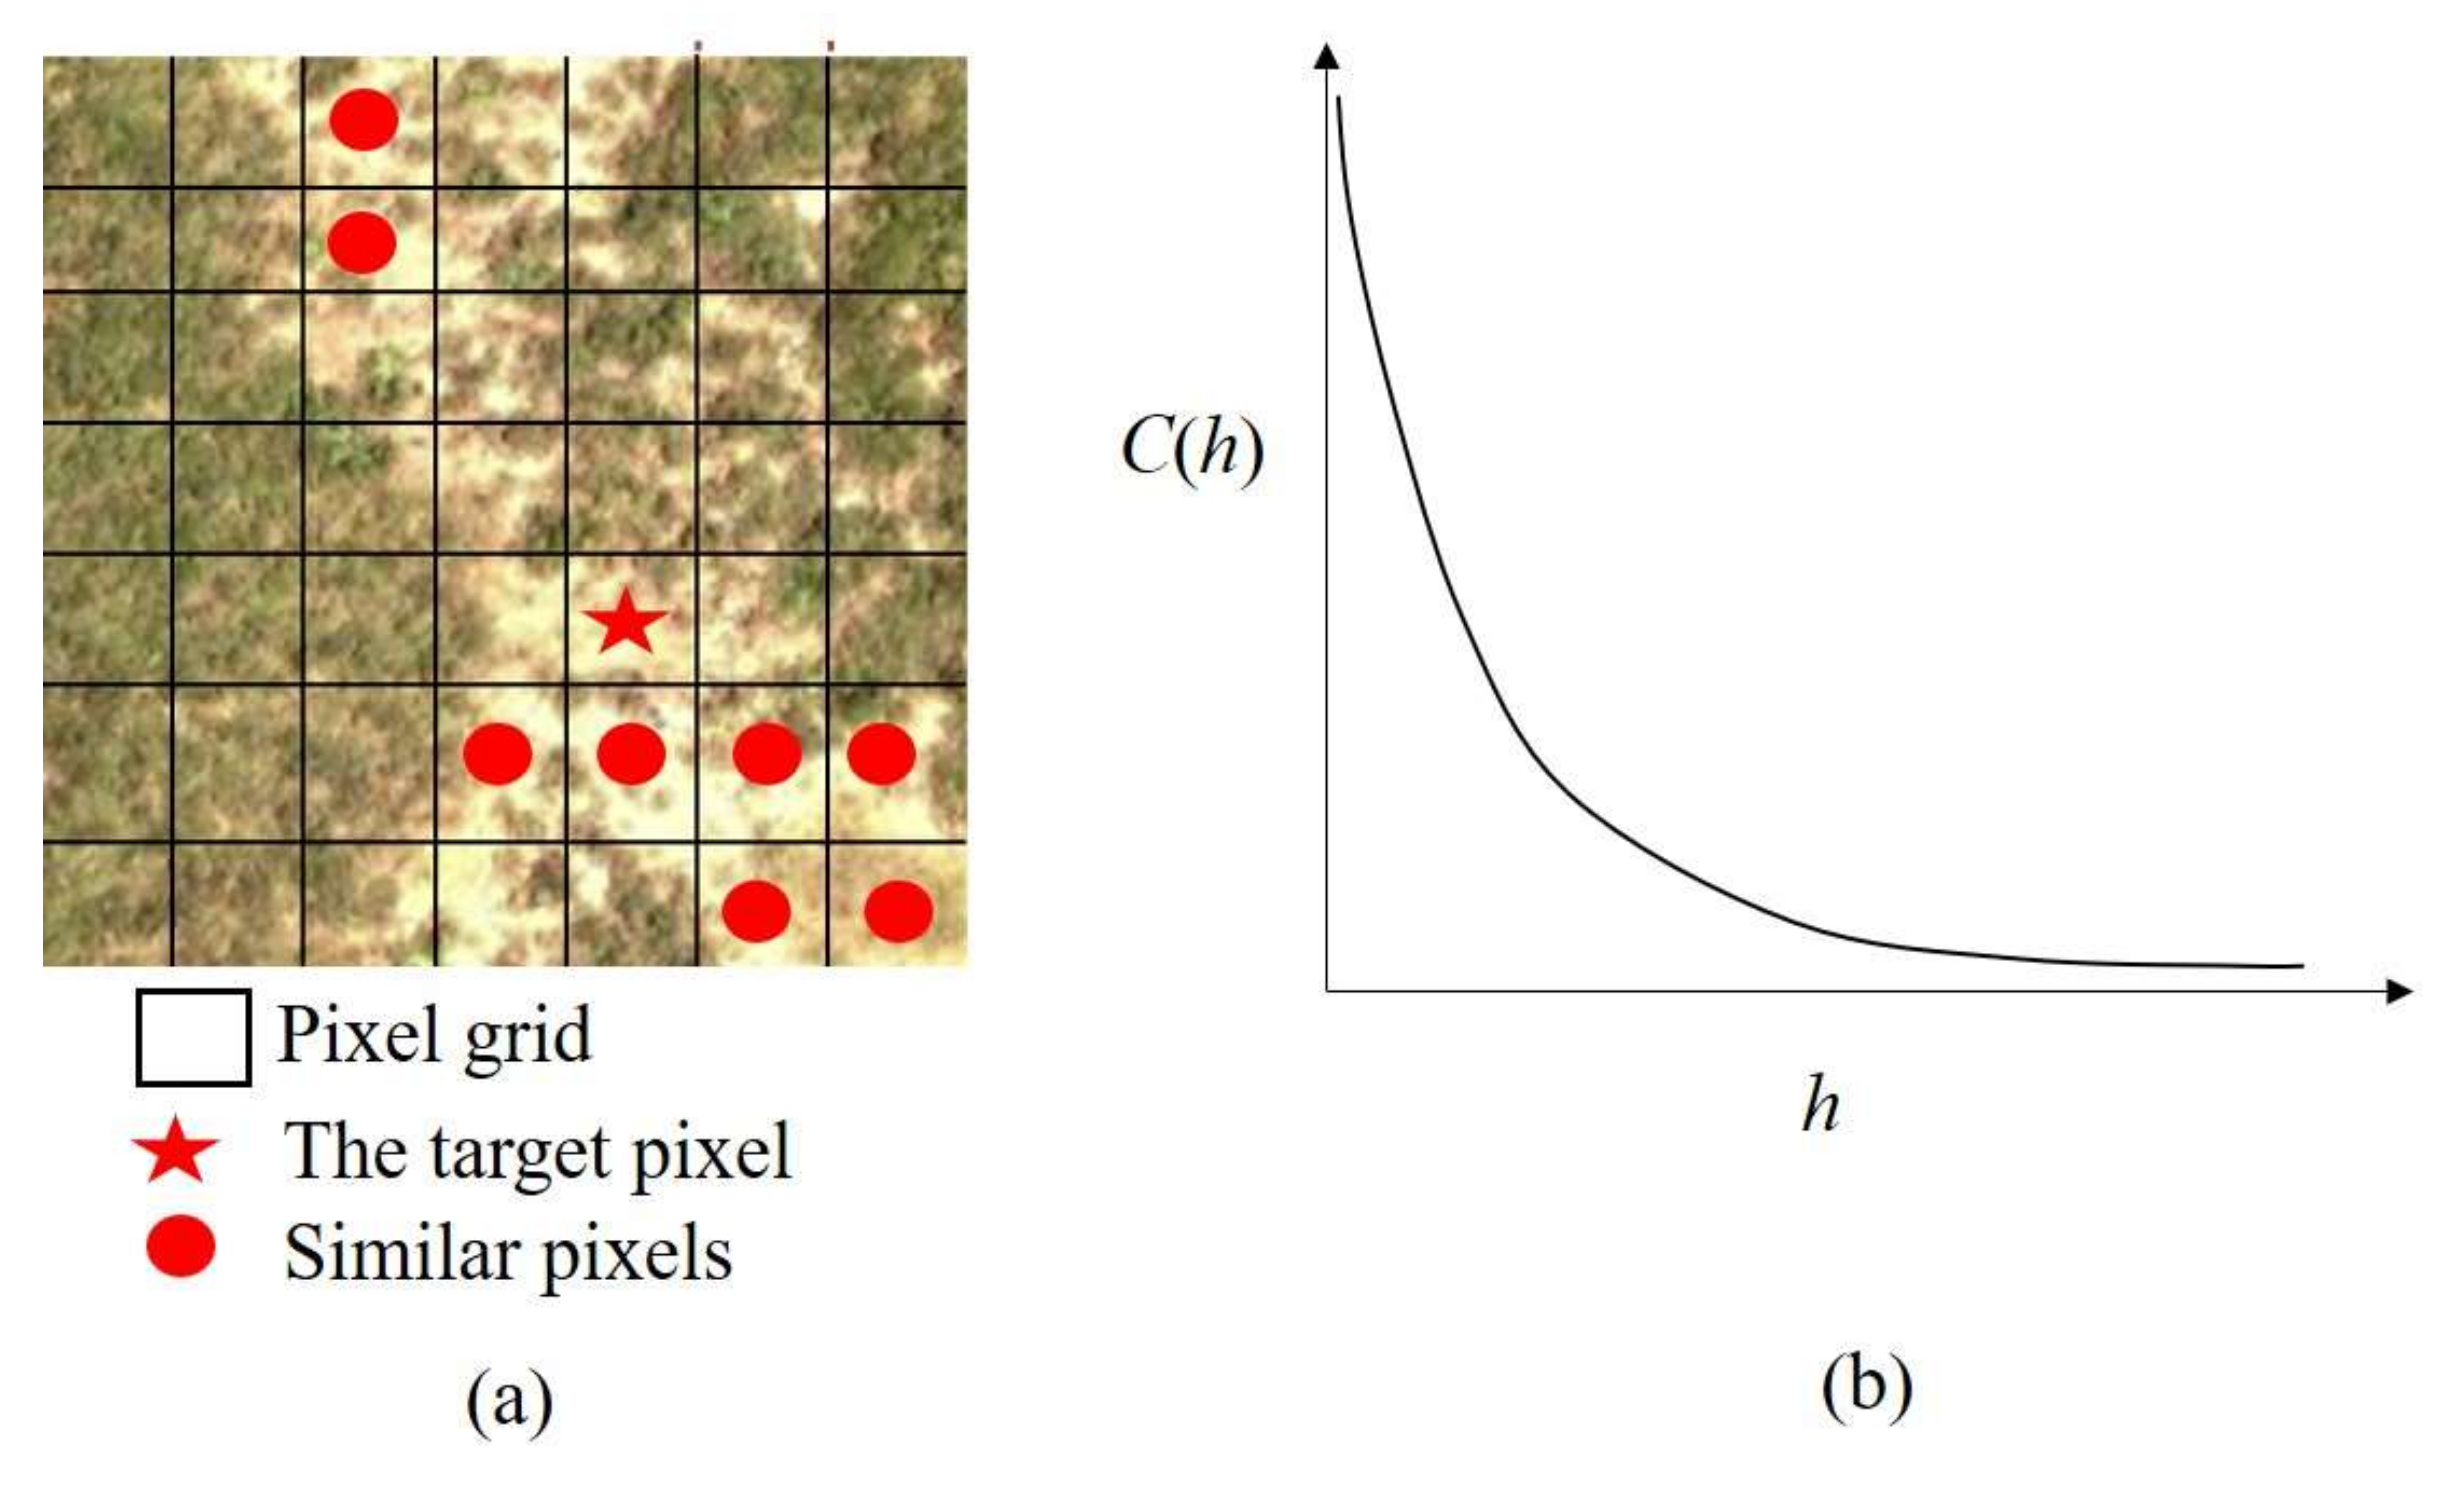
4.2. Spatial Dependence

Spatial dependence is a rule used by nearly all spatiotemporal fusion algorithms. According to Tobler’s first law of geography, everything is related but nearby things are more related [74]. Satellite images observe the spectral information of objects on land surface. It is very reasonable to assume that nearby objects have similar spectral characteristics if they are from the same land cover. The pixels of these objects are named as similar pixels in the STARFM method and other STARFM-like methods (Figure 5a) [8,11,26]. Similar pixels exhibit spatial dependence, for example, in a forest region, neighboring pixels are more likely from the same tree species and have similar structural attributes, such as tree height and stem density. As a result, these pixels have higher similarity in spectral characteristics, and higher consistency in temporal change across time. In Geostatistics, for similar pixels with a spatial distance h, the spatial dependence can be estimated as covariance C(h) [75]:
C ( h ) = 1 n ( h ) d i j = h [ ( F 1 ( x i , y i , b ) F ¯ ) ( F 1 ( x j , y j , b ) F ¯ ) ]
where n(h) is the number of similar pixel pairs with distance h, dij is the spatial distance between ith and jth similar pixels, and F ¯ is the average value of these similar pixels. Normally, the covariance is different at each spatial distance as depicted by the curve in Figure 5b. The covariance decreases with distance until a saturated point is reached.
In STARFM and all STARFM-like algorithms, they use the spatial dependence property to reduce the uncertainty and block effect of fusion results, but they do not use covariance in Equation (5) to describe the spatial dependence. For simplification, these algorithms use the inverse distance (1/h) as the alternative of the covariance function. The initial fused result of an individual pixel has a lot of uncertainties due to the error in geo-referencing between two types of images and image noises, however, combining fused results of all similar pixels can average out abnormal prediction of an individual pixel. The spatial dependence is used to weight these similar pixels when they are combined [8,11]. For methods such as FSDAF, most of the calculations are implemented within each coarse pixel, which may lead to the block effect in the fused image, i.e., showing the footprint of coarse pixels in the fused fine image. To mitigate this block effect, predictions of similar pixels from a moving window covering several coarse pixels are combined using spatial dependence as the weight [26].
In unmixing-based methods, the spatial dependence property of satellite images is used to solve fine-scale endmember values. To successfully estimate the unknown variables in the linear equations (Equation (3)), the number of coarse pixels must be equal or larger than the number of land cover classes. Assuming nearby coarse pixels should have high similarity in endmember values due to spatial dependence, then, a given coarse pixel and its spatially neighboring coarse pixels are employed to compose the equation system in Equation (3) to estimate its fine-scale endmember values [43].

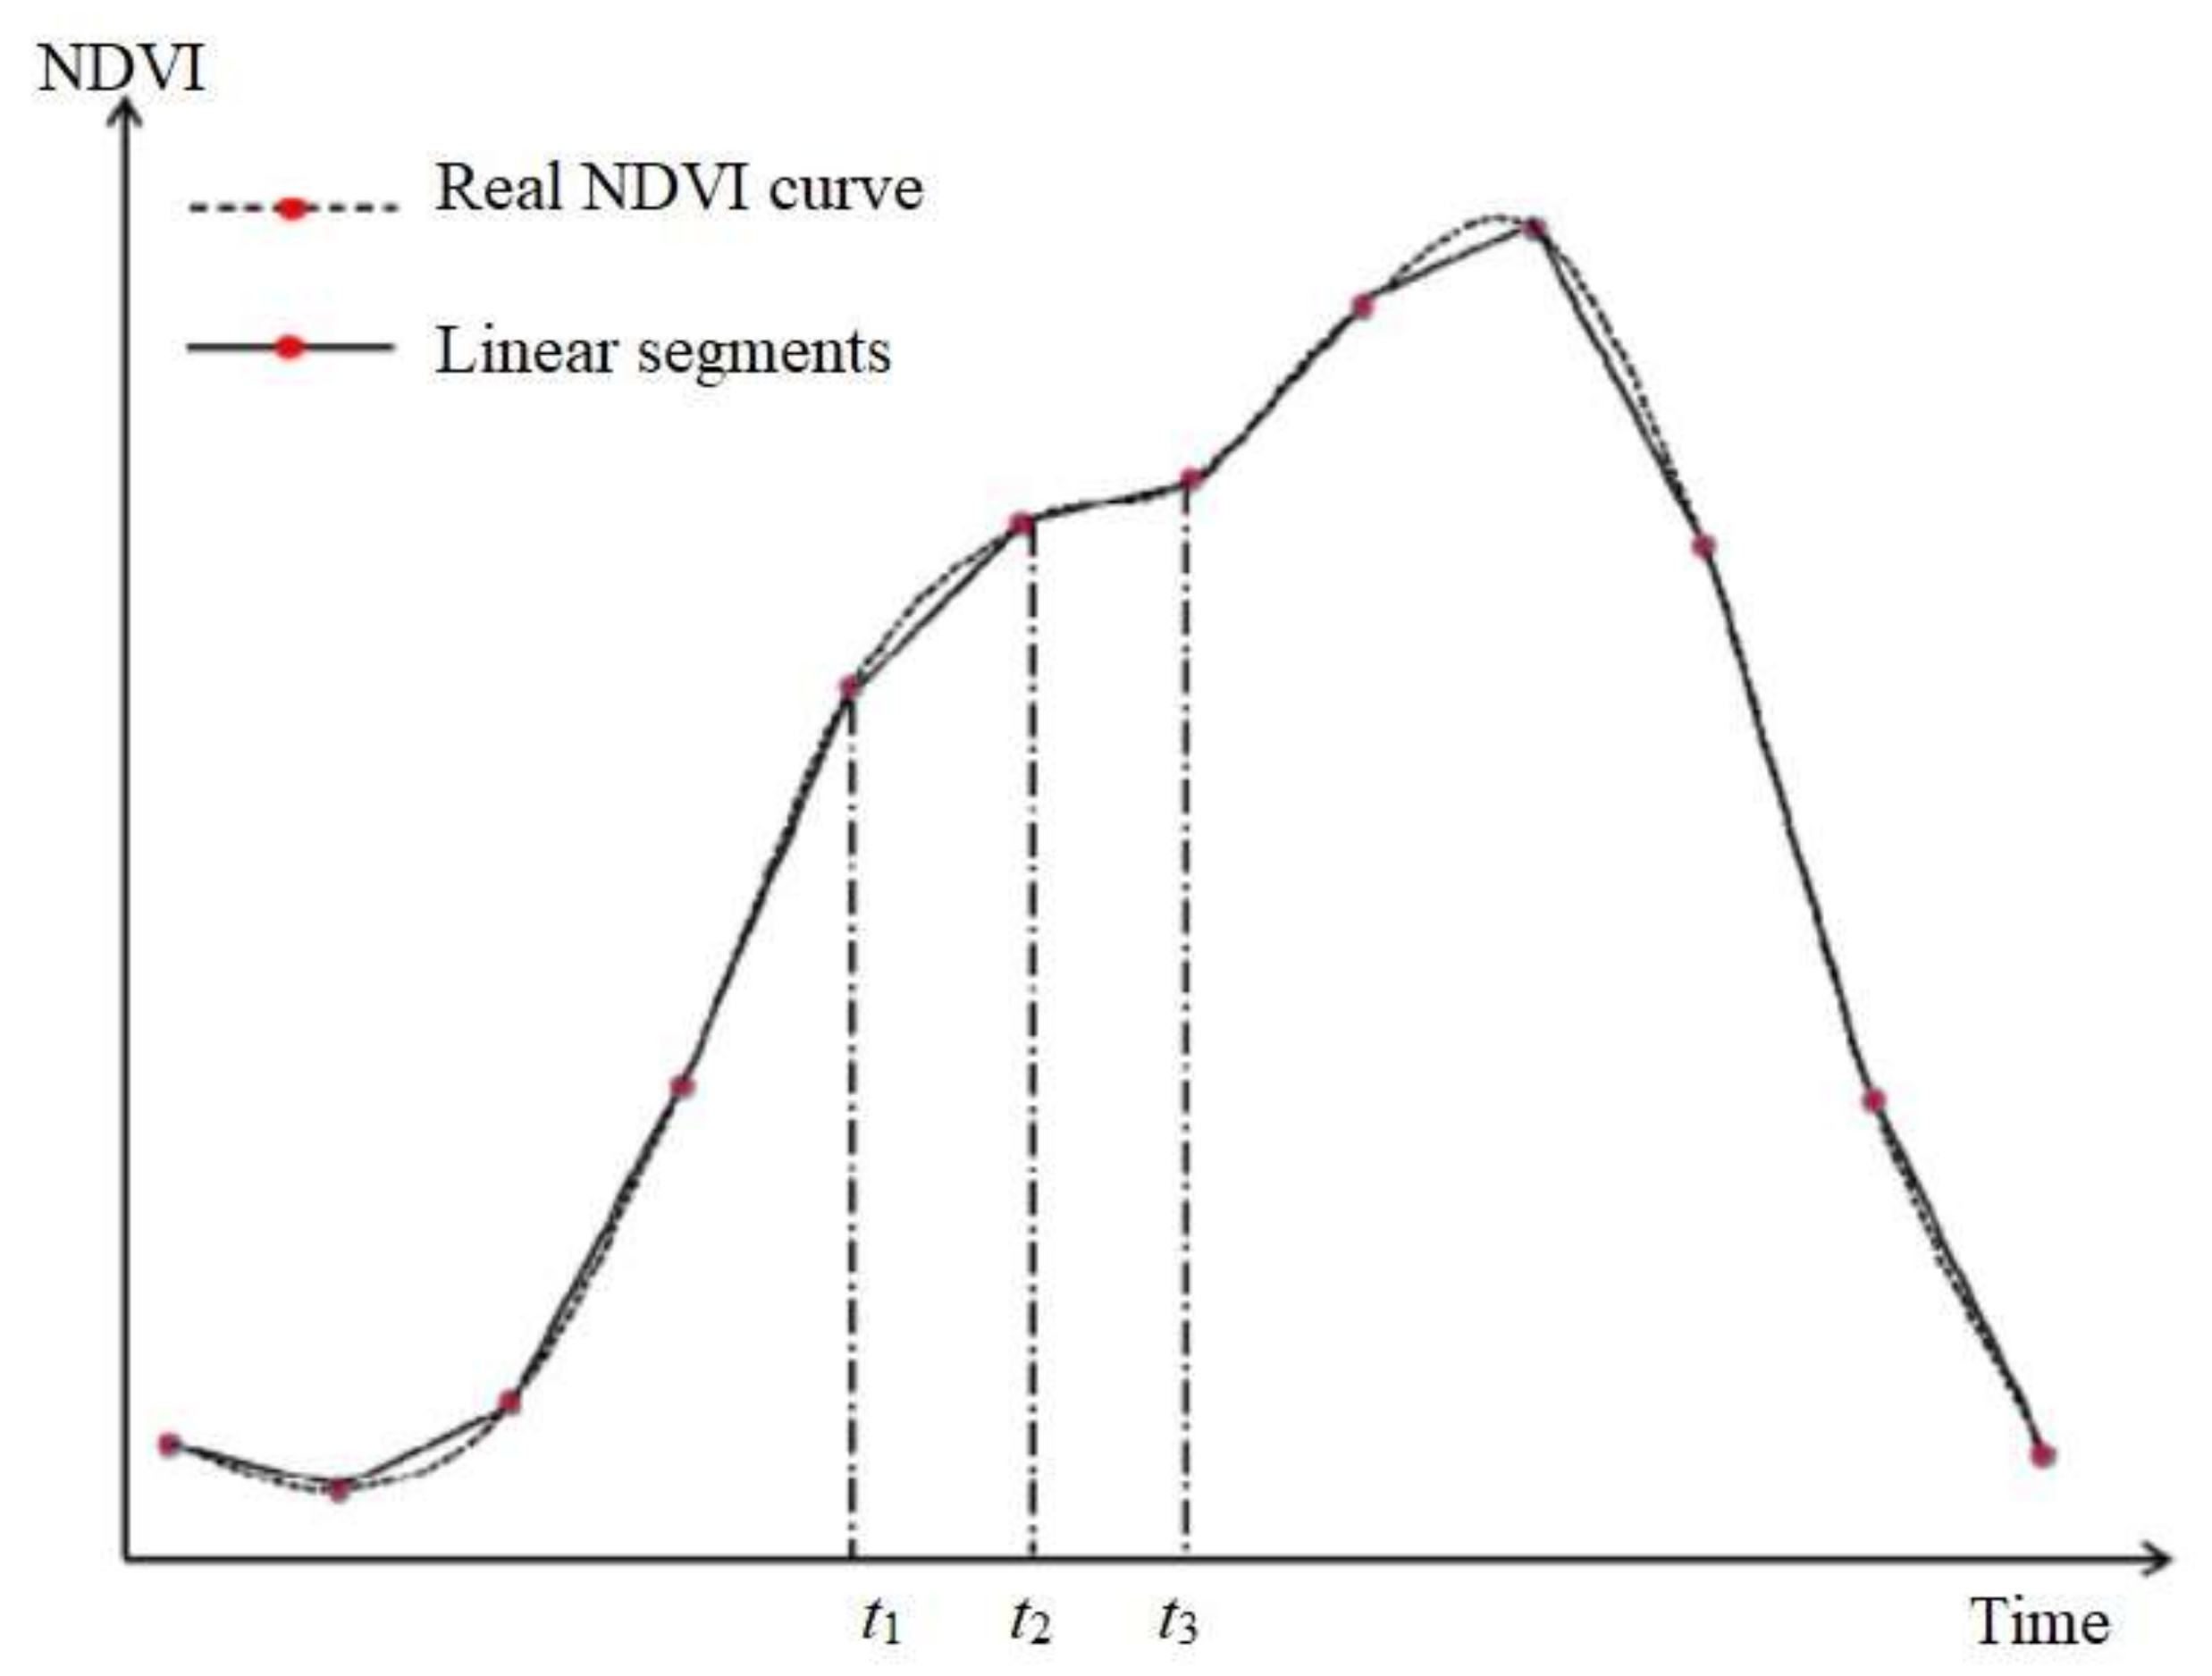
4.3. Temporal Dependence

Temporal dependence means the spectral value of a pixel at t2 is correlated to that at t1. In other words, pixel value at t2 can be estimated as a function of pixel value at t1. Figure 6 shows a temporal profile of NDVI of a pixel. Although the temporal profile is not a linear function, it can be divided into many short linear sections. The whole profile can be considered as a combination of all these linear sections. With this simplification, the temporal relationship can be expressed as:
F 2 ( x i , y i , b ) = α ( x i , y i , b ) F 1 ( x i , y i , b ) + β ( x i , y i , b )
or
F 2 ( x i , y i , b ) = F 1 ( x i , y i , b ) + β ( x i , y i , b ) , i f α ( x i , y i , b ) = 1
where α ( x i , y i , b ) and β ( x i , y i , b ) are two coefficients for the pixel (xi, xj) of band b. Both Equations (6) and (7) are used in existing spatiotemporal data fusion methods. Here, the key is to estimate two coefficients. Different spatiotemporal methods employ different strategies. STARFM employs Equation (7) and estimates β ( x i , y i , b ) directly from coarse pixels using C 2 ( x i , y i , b ) C 1 ( x i , y i , b ) assuming this coefficient is same between coarse images and fine images if the coarse pixels are pure pixels, i.e., only including one land cover type [8]. This assumption is not valid for many cases in reality, so ESTARFM added a conversion coefficient V to adjust the estimation from coarse pixels using V [ C 2 ( x i , y i , b ) C 1 ( x i , y i , b ) ] [11]. In a method developed recently for fusing Sentinel-2 and Sentinel-3 images, Equation (6) is used and the two coefficients are estimated from coarse pixels in a moving window using least square regression [16]. This method assumes the coefficients in Equation (6) are scale invariant and uses a residual compensation step to reduce the errors induced by this assumption.

5. Applications

5.1. Agriculture

Crop progress and yield are affected by environmental conditions (e.g., groundwater or soil types) and climatic conditions (e.g., precipitation and temperature ) [76,77]. Those factors vary with time and space. Coarse satellite images, such as MODIS and AVHRR, which can provide daily data were widely used to monitor the crop growth from the sowing to maturing stages and thus estimate the yield [78,79,80,81]. Although the short revisit cycle of these images can successfully monitor rapid dynamics in agriculture, the coarse resolution is often inadequate for highly heterogeneous areas such as agricultural landscapes in south China. In recent years, the high spatial and temporal resolution images generated by spatiotemporal data fusion have been explored to improve agricultural studies, such as, crop yield and gross primary productivity (GPP) estimation, crop growth monitoring and management [82,83,84,85].
As the most popular applications in agriculture remote sensing, crop yield, biomass and GPP estimation, can reflect the superiority of spatiotemporal data fusion methods. For example, a study in China blended HJ-1 CCD and MODIS images by the Spatial and Temporal Adaptive Vegetation index Fusion Model (STAVFM) to predict crop biomass. Its result shows that the correlation between winter wheat biomass estimated by STAVFM and actual observations is very high (R2 reaches 0.876) [84]. Similarly, GPP estimated from field observation and from Landsat-MODIS fused images shows a strong agreement in wheat (R2 = 0.85, p ≤ 0.01) and sugarcane (R2 = 0.86, p ≤ 0.01) in India [86]. In addition, timely monitoring of crop growth is important for farming management [87]. Synthesized data could be used to provide near real-time estimate of external conditions (e.g., water and soil conditions) and internal attributes (e.g., leaf chlorophyll and protein content) of crops. For instance, soil evapotranspiration (ET), a key factor for crop growth, were estimated from fused ASTER-MODIS images by STARFM and compared with daily ET field observations. The results indicate that the bias and root mean squared error (RMSE) of ET estimated from fused images are smaller than a satellite-based ET product, especially in maize and vegetable sites [88].

5.2. Ecology

Traditionally, data collected from field survey are the main source for ecological studies. However, field data can hardly cover large areas and over long time periods [89,90]. Fortunately, many studies suggest that satellite images, in particular images generated by spatiotemporal data fusion, have a great potential for ecological applications [14,91,92], such as, ecological variables estimation (e.g., vegetation index and biomass), ecosystem dynamics monitoring (e.g., phenology of forest, grassland, dryland and wetland) and disturbances detecting (e.g., wildfires and tree disease) in ecosystems.
The improvement of using spatiotemporal data fusion has been demonstrated by several studies. For LAI modeling, the R2 and RMSE between LAI derived from fused MODIS and Landsat images and ground measurement can reach 0.977 and 0.1585 m2m−2 (p < 0.005), and such results are more accurate than MODIS LAI standard products [93]. For biomass estimation, synthetic NDVI time series from fusing MODIS-Landsat by STARFM can obtain accurate grassland biomass (R2 = 0.77, RMSE = 17.22 g/m2). It is more accurate than using NDVI from MODIS alone (R2 = 0.73, RMSE = 30.61 g/m2) [94]. For vegetation phenology detection, the synthetic EVI time series through fusing MODIS and Landsat images during 2005–2009 by STARFM can well characterize dryland vegetation phenology in Arizona, USA [95]. For forest disturbances detecting, data fusion also shows its superiority. To map forest disturbance, Landsat and MODIS reflectance data were fused using STAARCH. Compared with validation datasets, the spatial precision can reach 93% in Canada [27] and 89–92% in mixed forests of USA [96].

5.3. Land Cover Classification

Satellite images have been widely used for land cover classification. However, errors in land cover classification are unavoidable if different land covers have similar spectral characteristics in satellite images. For example, most land cover types of vegetation, such as grassland, farming land and forest, have very similar spectral signals in the summer season; it is impossible to accurately differentiate these land cover types using only summer satellite images [97]. Data generated by spatiotemporal data fusion can improve the accuracy from two aspects: high frequency and high spatial resolution. High frequency can obtain temporal information of different land cover types which is a valuable supplement to spectral information, and high spatial resolution can reduce the number of mixed pixels.
A study applied and compared two data fusion models, STARFM and ESTARFM, in generating synthetic images from Landsat and MODIS for mapping flooded areas. Results show that both fusion methods can get flood maps with much higher accuracy than those only using MODIS images [98]. Another study classified the land cover using seven phenological parameters derived from NDVI with high spatial and temporal resolutions. The NDVI data was generated by STARFM fusing GF-1 and MODIS NDVI dataset in Hebei Province of China. The overall classification accuracy of using fused data is 88.8%, which represents an increase of 9.3 percentage compared to GF-1 spectral data alone [99]. A recent study fusing Landsat with MODIS, China Environment 1A series (HJ-1A), and Advanced Spaceborne Thermal Emission and Reflection (ASTER) digital elevation model (DEM) data, showed that the fused data, integrating temporal, spectral, angular, and topographic features can get better land cover classification accuracy than the original data from an individual source [100].

6. Issues and Future Directions

6.1. Precise Image Alignment

Spatiotemporal data fusion is implemented on images from two different satellite sensors. These images have many differences although they have similar spectral configuration. These differences include spatial resolution, band width, spectral response function, atmospheric conditions, solar geometry and viewing angle. In addition, with the fast development of UAVs witnessed in recent years, fusing UAV images with satellite images is needed in the future. However, the difference between UAV and satellite images is even larger than that between two satellite sensors [101]. Theoretically, spatiotemporal data fusion requires that the coarse pixel and its internal fine pixels observe the same piece of land surface with same observing geometry. A precise image alignment is then required to mitigate the differences between the two types of images. Specifically, differences in band width, spectral response function, and even atmospheric condition (when the image size is small) more than likely cause systematic bias between the two types of images. This systematic bias can be reduced through relative calibration, such as using a linear regression or histogram matching method. However, most spatiotemporal data fusion methods, such as STARFM and ESTARFM, already take the systematic bias into account, so systematic bias is not a factor affecting the fusion accuracy very much. Different solar geometry and viewing angles of two sensors lead to pixel-wise difference because of the BRDF effect. For example, MODIS has a larger swath with larger viewing angles than Landsat, and its sun elevation is also a little bit different from Landsat. BRDF effect causes both MODIS and Landsat to not observe the exactly same part of Landsat surface. Pixel-wise difference is hard to remove during the data fusion process. As a result, BRDF adjustment may be a necessary preprocessing step to improve the accuracy of data fusion, although it is often ignored in most studies. Lastly, different spatial resolution is the reason for spatiotemporal data fusion, but it also brings the most difficult part in geo-registration between two types of images. Geo-registration error is the major error source in data fusion. Existing studies use both manual method and automatic method for geo-registration, but the accuracy cannot reach fine-pixel level. Future studies can consider developing spatiotemporal fusion methods which are less sensitive to the above differences between two sensors, especially the geo-registration error.

6.2. Difficulty in Retrieving Land Cover Change

Currently, the most difficult case of spatiotemporal data fusion is the abrupt land cover change happening during the fusion period. The abrupt change is recorded in two coarse images at t1 and t2, but the fine image at t1 is prior to the change. A successful fused result of the fine image at t2 should reflect the magnitude and extent of the change at fine resolution. Figure 7 shows such a case with flood event happening during fusion period. This event was recorded in the coarse images (c) and (d), but the boundary of flooded area is blurring due to the coarse resolution. Quite a few spatiotemporal data fusion methods were developed to improve the fusion results for this challenging case. For example, FSDAF employs the thin plate spine (TPS) to downscale the coarse image to the fine resolution and then uses the result to guide the residual distribution for pixels experiencing land cover change. This strategy works well for land cover change visible in coarse image but it may not be able to recover tiny land cover change in coarse subpixels [26]. In addition, the flooded area in Figure 7 has quite a smooth and regular boundary. FSDAF can capture the boundary for this case well but it is unknown if it can capture the boundary of land cover change with irregular shapes. The machine learning-based methods may be able to capture land cover changes. For example, the one-pair learning method using sparse representation can capture land cover change in the fused image although the boundary is a little bit blurred. The problem with this method is that it also blurs the land cover boundaries without change (see Figure 3 in the paper [35]). Now, deep learning has been successfully applied to image classification, object recognition, and information mining [102,103]. It is possible to model complex relationships between input coarse and fine images and the trained model could be used to predict the fine image. In the future, we could see studies using deep learning to fuse images with different resolutions.

6.3. Standard Method and Dataset for Accuracy Assessment

Accuracy assessment of fused results is an urgent issue for spatiotemporal data fusion field. There are two challenges: no widely accepted assessment method and no standard data sets. Basically, accuracy assessment is the evaluation of the similarity between fused and a true image (it is a known fine image at the prediction date). The similarity includes two aspects: the closeness of spectral values of the fused image to the true image, and the spatial details the fused image reserved compared with the true image. For the accuracy assessment methods, most existing studies use some global accuracy indices, including RMSE, the correlation coefficient, absolute difference, and relative difference. However, these indices most likely reflect the image-level spectral similarity rather than pixel-wise spatial details. In a current study of assessing downscaled results of thermal images, a new index was proposed [104]. A similar idea can be extended to evaluate accuracy of spatiotemporal data fusion. In addition, a standard dataset is important for the comparison among different spatiotemporal data fusion methods. As listed in Table 3, more than 40 spatiotemporal data fusion methods have been proposed. There is a need to have a cross-comparison to guide users to select the most suitable method for their specific cases. This standard dataset should include the most challenging cases in spatiotemporal data fusion, such as images with heterogeneous land surface and experiencing abrupt land cover change during the fusion period. A study used MODIS and Landsat images in two sites with contrasting spatial and temporal variability to compare STARFM and ESTARFM, and they released the dataset for public use [105]. This dataset has been used to test performance of some newly developed spatiotemporal data fusion methods [26,43]. This dataset can be used as a starting point to develop a future standard dataset for testing the performance of spatiotemporal data fusion methods.

6.4. Efficiency Improvement

Low computing efficiency is a key factor which limits the wide application of spatiotemporal fusion methods. There are two reasons for the low computing efficiency of most spatiotemporal data fusion methods: pixel-wise calculation and moving window strategy. For weight function-based methods, they need to compute the weights from spatial, spectral, and temporal perspectives for each fine pixel. For the unmixing-based methods, they need to estimate the endmember values for each coarse pixel. In other words, pixel-wise calculation is used to model the local rules linking coarse and fine images. Meanwhile, many calculations are implemented within moving windows. Moving window is commonly used by STARFM-like methods to search for similar pixels. The demand of computing time of these methods increases dramatically with the size of moving window. Due to the above complexity, in terms of calculation, most existing spatiotemporal data fusion methods, applied to an image size of one Landsat scene, need several hours and sometimes more than one day to obtain the fused image when using a personal computer. This efficiency is acceptable for small study areas or when a limited number of images need to be fused. The efficiency must be largely improved for studies that cover large areas and long-length time series. There are two possible ways to improve the efficiency: (1) balancing the pixel-wise calculation and block-wise (or image-wise) calculation based on the homogeneity of the fused images; and (2) using more advanced programming strategies, such as parallel computing and GPU computing.

7. Summary

Due to the tradeoff between swath and pixel size, most current satellites cannot provide data with both high spatial and temporal resolutions. However, this type of data is needed for many studies which monitor the land surface dynamics over complex areas and with rapid change. Spatiotemporal data fusion methods have been proposed to combine images from different satellites to solve the limitation of a single satellite. However, the development of this methodology is quite disorderly although more than 40 methods have been proposed in the past two decades. This study critically reviewed existing methods for spatiotemporal data fusion. The facts of the authors, journals, and citations were summarized. The main accomplishments of this review are as follows:
  • Existing spatiotemporal data fusion methods were grouped into five categories based on the specific methodology for linking coarse and fine images. These five categories include unmixing-based, weight function-based, Bayesian-based, learning-based, and hybrid methods. Currently, there is no agreement reached about which method is superior. More inter-comparisons among those categories are needed to reveal the pros and cons of the different methods.
  • The main principles underlying existing spatiotemporal data fusion methods were explained. These principles include spectral mixing model, spatial dependence, and temporal dependence. Existing spatiotemporal data fusion methods used above principles and employed different mathematic tools to simplify these principles to make the developed methods implementable.
  • The major applications of spatiotemporal data fusion were reviewed. Spatiotemporal data fusion can be applied to any study which needs satellite images with high frequency and high spatial resolution. Most current applications are in the field of agriculture, ecology, and land surface process.
  • The issues and directions of further development of spatiotemporal data fusion methods were discussed. Spatiotemporal data fusion is one of the youngest research topics in the remote sensing field. There is still a lot of space for further improvements. Four issues were listed which are worth addressing in future studies: the high demand of data preprocessing, the difficulties in retrieving abrupt land cover change, the lack of an accuracy assessment method and data sets and low computing efficiency.

Acknowledgments

This study was supported by the National Natural Science Foundation of China (Project No.41701378), the Research Grants Council of Hong Kong (Project No.25222717), and the research grant from The Hong Kong Polytechnic University (project no.1-ZE6Q). Lastly, special thanks to Yu Liu and Zheyan Shen for their contribution on the section of spatiotemporal data fusion applications.

Author Contributions

Xiaolin Zhu conceived, designed, and wrote the paper, with the help of the co-authors (Fangyi Cai, Jiaqi Tian and Trecia Kay-Ann Williams).

Conflicts of Interest

The authors declare no conflict of interests. The founding sponsors had no role in the design of the study; in the collection, analyses, or interpretation of data; in the writing of the manuscript, and in the decision to publish the results.

References

  1. Schneider, A. Monitoring land cover change in urban and peri-urban areas using dense time stacks of Landsat satellite data and a data mining approach. Remote Sens. Environ. 2012, 124, 689–704. [Google Scholar] [CrossRef]
  2. Shen, M.; Tang, Y.; Chen, J.; Zhu, X.; Zheng, Y. Influences of temperature and precipitation before the growing season on spring phenology in grasslands of the central and eastern Qinghai-Tibetan Plateau. Agric. For. Meteorol. 2011, 151, 1711–1722. [Google Scholar] [CrossRef]
  3. Lees, K.J.; Quaife, T.; Artz, R.R.E.; Khomik, M.; Clark, J.M. Potential for using remote sensing to estimate carbon fluxes across northern peatlands—A review. Sci. Total Environ. 2013, 615, 857–874. [Google Scholar] [CrossRef] [PubMed]
  4. Johnson, M.D.; Hsieh, W.W.; Cannon, A.J.; Davidson, A.; Bédard, F. Crop yield forecasting on the Canadian Prairies by remotely sensed vegetation indices and machine learning methods. Agric. For. Meteorol. 2016, 218–219, 74–84. [Google Scholar] [CrossRef]
  5. Li, X.; Zhou, Y.; Asrar, G.R.; Mao, J.; Li, X.; Li, W. Response of vegetation phenology to urbanization in the conterminous United States. Glob. Chang. Biol. 2016, 23, 2818–2830. [Google Scholar] [CrossRef]
  6. Liu, Q.; Fu, Y.H.; Zhu, Z.; Liu, Y.; Liu, Z.; Huang, M.; Janssens, I.A.; Piao, S. Delayed autumn phenology in the Northern Hemisphere is related to change in both climate and spring phenology. Glob. Chang. Biol. 2016, 22, 3702–3711. [Google Scholar] [CrossRef] [PubMed]
  7. Gorelick, N.; Hancher, M.; Dixon, M.; Ilyushchenko, S.; Thau, D.; Moore, R. Google Earth Engine: Planetary-scale geospatial analysis for everyone. Remote Sens. Environ. 2017, 202, 18–27. [Google Scholar] [CrossRef]
  8. Gao, F.; Masek, J.; Schwaller, M.; Hall, F. On the Blending of the Landsat and MODIS Surface Reflectance: Predicting Daily Landsat Surface Reflectance. IEEE Trans. Geoscie. Remote Sens. 2006, 44, 2207–2218. [Google Scholar]
  9. Ju, J.; Roy, D.P. The availability of cloud-free Landsat ETM+ data over the conterminous United States and globally. Remote Sens. Environ. 2008, 112, 1196–1211. [Google Scholar] [CrossRef]
  10. Storey, J.; Roy, D.P.; Masek, J.; Gascon, F.; Dwyer, J.; Choate, M. A note on the temporary misregistration of Landsat-8 Operational Land Imager (OLI) and Sentinel-2 Multi Spectral Instrument (MSI) imagery. Remote Sens. Environ. 2016, 186, 121–122. [Google Scholar] [CrossRef]
  11. Zhu, X.; Chen, J.; Gao, F.; Chen, X.; Masek, J.G. An enhanced spatial and temporal adaptive reflectance fusion model for complex heterogeneous regions. Remote Sens. Environ. 2010, 114, 2610–2623. [Google Scholar] [CrossRef]
  12. Zhang, H.K.; Huang, B.; Zhang, M.; Cao, K.; Yu, L. A generalization of spatial and temporal fusion methods for remotely sensed surface parameters. Int. J. Remote Sens. 2015, 36, 4411–4445. [Google Scholar] [CrossRef]
  13. Chen, B.; Huang, B.; Xu, B. Comparison of spatiotemporal fusion models: A review. Remote Sens. 2015, 7, 1798–1835. [Google Scholar] [CrossRef]
  14. Gao, F.; Hilker, T.; Zhu, X.; Anderson, M.; Masek, J.; Wang, P.; Yang, Y. Fusing Landsat and MODIS Data for Vegetation Monitoring. IEEE Geosci. Remote Sens. Mag. 2015, 3, 47–60. [Google Scholar] [CrossRef]
  15. Moosavi, V.; Talebi, A.; Mokhtari, M.H.; Shamsi, S.R.F.; Niazi, Y. A wavelet-artificial intelligence fusion approach (WAIFA) for blending Landsat and MODIS surface temperature. Remote Sens. Environ. 2015, 169. [Google Scholar] [CrossRef]
  16. Wang, Q.; Atkinson, P.M. Spatio-temporal fusion for daily Sentinel-2 images. Remote Sens. Environ. 2018, 204, 31–42. [Google Scholar] [CrossRef]
  17. Lu, M.; Chen, J.; Tang, H.; Rao, Y.; Yang, P.; Wu, W. Land cover change detection by integrating object-based data blending model of Landsat and MODIS. Remote Sens. Environ. 2016, 184, 374–386. [Google Scholar] [CrossRef]
  18. Hwang, T.; Song, C.; Bolstad, P.V.; Band, L.E. Downscaling real-time vegetation dynamics by fusing multi-temporal MODIS and Landsat NDVI in topographically complex terrain. Remote Sens. Environ. 2011, 115, 2499–2512. [Google Scholar] [CrossRef]
  19. Roy, D.P.; Ju, J.; Lewis, P.; Schaaf, C.; Gao, F.; Hansen, M.; Lindquist, E. Multi-temporal MODIS-Landsat data fusion for relative radiometric normalization, gap filling, and prediction of Landsat data. Remote Sens. Environ. 2008, 112, 3112–3130. [Google Scholar] [CrossRef]
  20. Li, A.; Bo, Y.; Zhu, Y.; Guo, P.; Bi, J.; He, Y. Blending multi-resolution satellite sea surface temperature (SST) products using Bayesian maximum entropy method. Remote Sens. Environ. 2013, 135, 52–63. [Google Scholar] [CrossRef]
  21. Weng, Q.; Fu, P.; Gao, F. Generating daily land surface temperature at Landsat resolution by fusing Landsat and MODIS data. Remote Sens. Environ. 2014, 145, 55–67. [Google Scholar] [CrossRef]
  22. Li, X.; Ling, F.; Foody, G.M.; Ge, Y.; Zhang, Y.; Du, Y. Generating a series of fine spatial and temporal resolution land cover maps by fusing coarse spatial resolution remotely sensed images and fine spatial resolution land cover maps. Remote Sens. Environ. 2017, 196, 293–311. [Google Scholar] [CrossRef]
  23. Wu, P.; Shen, H.; Zhang, L.; Göttsche, F.M. Integrated fusion of multi-scale polar-orbiting and geostationary satellite observations for the mapping of high spatial and temporal resolution land surface temperature. Remote Sens. Environ. 2015, 156, 169–181. [Google Scholar] [CrossRef]
  24. Gevaert, C.M.; García-Haro, F.J. A comparison of STARFM and an unmixing-based algorithm for Landsat and MODIS data fusion. Remote Sens. Environ. 2015, 156, 34–44. [Google Scholar] [CrossRef]
  25. Mizuochi, H.; Hiyama, T.; Ohta, T.; Fujioka, Y.; Kambatuku, J.R.; Iijima, M.; Nasahara, K.N. Development and evaluation of a lookup-table-based approach to data fusion for seasonal wetlands monitoring: An integrated use of AMSR series, MODIS, and Landsat. Remote Sens. Environ. 2017, 199, 370–388. [Google Scholar] [CrossRef]
  26. Zhu, X.; Helmer, E.H.; Gao, F.; Liu, D.; Chen, J.; Lefsky, M.A. A flexible spatiotemporal method for fusing satellite images with different resolutions. Remote Sens. Environ. 2016, 172, 165–177. [Google Scholar] [CrossRef]
  27. Hilker, T.; Wulder, M.A.; Coops, N.C.; Linke, J.; McDermid, G.; Masek, J.G.; Gao, F.; White, J.C. A new data fusion model for high spatial- and temporal-resolution mapping of forest disturbance based on Landsat and MODIS. Remote Sens. Environ. 2009, 113, 1613–1627. [Google Scholar] [CrossRef]
  28. Quan, J.; Zhan, W.; Ma, T.; Du, Y.; Guo, Z.; Qin, B. An integrated model for generating hourly Landsat-like land surface temperatures over heterogeneous landscapes. Remote Sens. Environ. 2018, 206, 403–423. [Google Scholar] [CrossRef]
  29. Huang, B.; Song, H. Spatiotemporal Reflectance Fusion via Sparse Representation. EEE Trans. Geosci. Remote Sens. 2012, 50, 3707–3716. [Google Scholar] [CrossRef]
  30. Cheng, Q.; Liu, H.; Shen, H.; Wu, P.; Zhang, L. A Spatial and Temporal Non-Local Filter Based Data Fusion Method. IEEE Trans. Geosci. Remote Sens. 2017, 55, 4476–4488. [Google Scholar] [CrossRef]
  31. Zhukov, B.; Oertel, D.; Lanzl, F.; Reinhäckel, G. Unmixing-based multisensor multiresolution image fusion. IEEE Trans. Geosci. Remote Sens. 1999, 37, 1212–1226. [Google Scholar] [CrossRef]
  32. Wu, B.; Huang, B.; Zhang, L. An Error-Bound-Regularized Sparse Coding for Spatiotemporal Reflectance Fusion. IEEE Trans. Geosci. Remote Sens. 2015, 53, 6791–6803. [Google Scholar] [CrossRef]
  33. Wang, P.; Gao, F.; Masek, J.G. Operational data fusion framework for building frequent landsat-like imagery. IEEE Trans. Geosci. Remote Sens. 2014, 52, 7353–7365. [Google Scholar] [CrossRef]
  34. Wang, Q.; Blackburn, G.A.; Onojeghuo, A.O.; Dash, J.; Zhou, L.; Zhang, Y.; Atkinson, P.M. Fusion of Landsat 8 OLI and Sentinel-2 MSI Data. IEEE Trans. Geosci. Remote Sens. 2017, 55, 3885–3899. [Google Scholar] [CrossRef]
  35. Song, H.; Huang, B. Spatiotemporal Satellite Image Fusion Through One-Pair Image Learning. IEEE Trans. Geosci. Remote Sens. 2013, 51, 1883–1896. [Google Scholar] [CrossRef]
  36. Malleswara Rao, J.; Rao, C.V.; Senthil, K.; Lakshmi, B.; Dadhwal, V.K.; Rao, J.M.; Rao, C.V.; Kumar, A.S.; Lakshmi, B.; Dadhwal, V.K. Spatiotemporal Data Fusion Using Temporal High-Pass Modulation and Edge Primitives. IEEE Trans. Geosci. Remote Sens. 2015, 53, 5853–5860. [Google Scholar] [CrossRef]
  37. Wei, J.; Wang, L.; Liu, P.; Chen, X.; Li, W.; Zomaya, A.Y. Spatiotemporal Fusion of MODIS and Landsat-7 Reflectance Images via Compressed Sensing. IEEE Trans. Geosci. Remote Sens. 2017, 55, 7126–7139. [Google Scholar] [CrossRef]
  38. Shen, H.; Meng, X.; Zhang, L. An Integrated Framework for the Spatio-Temporal-Spectral Fusion of Remote Sensing Images. IEEE Trans. Geosci. Remote Sens. 2016, 54, 7135–7148. [Google Scholar] [CrossRef]
  39. Guan, X.; Liu, G.; Huang, C.; Liu, Q.; Wu, C.; Jin, Y.; Li, Y. An Object-Based Linear Weight Assignment Fusion Scheme to Improve Classification Accuracy Using Landsat and MODIS Data at the Decision Level. IEEE Trans. Geosci. Remote Sens. 2017, 55, 6989–7002. [Google Scholar] [CrossRef]
  40. Tao, X.; Liang, S.; Wang, D.; He, T.; Huang, C. Improving Satellite Estimates of the Fraction of Absorbed Photosynthetically Active Radiation Through Data Integration: Methodology and Validation. IEEE Trans. Geosci. Remote Sens. 2017, 56, 2107–2118. [Google Scholar] [CrossRef]
  41. Zhao, C.; Gao, X.; Emery, W.J.; Wang, Y.; Li, J. An Integrated Spatio-Spectral-Temporal Sparse Representation Method for Fusing Remote-Sensing Images With Different Resolutions. IEEE Trans. Geosci. Remote Sens. 2018. [Google Scholar] [CrossRef]
  42. Xue, J.; Leung, Y.; Fung, T. A Bayesian Data Fusion Approach to Spatio-Temporal Fusion of Remotely Sensed Images. Remote Sens. 2017, 9, 1310. [Google Scholar] [CrossRef]
  43. Rao, Y.; Zhu, X.; Chen, J.; Wang, J. An Improved Method for Producing High Spatial-Resolution NDVI Time Series Datasets with Multi-Temporal MODIS NDVI Data and Landsat TM/ETM+ Images. Remote Sens. 2015, 7, 7865–7891. [Google Scholar] [CrossRef]
  44. Zhang, W.; Li, A.; Jin, H.; Bian, J.; Zhang, Z.; Lei, G.; Qin, Z.; Huang, C. An Enhanced Spatial and Temporal Data Fusion Model for Fusing Landsat and MODIS Surface Reflectance to Generate High Temporal Landsat-Like Data. Remote Sens. 2013, 5, 5346–5368. [Google Scholar] [CrossRef]
  45. Fu, D.; Chen, B.; Wang, J.; Zhu, X.; Hilker, T. An improved image fusion approach based on enhanced spatial and temporal the adaptive reflectance fusion model. Remote Sens. 2013, 5, 6346–6360. [Google Scholar] [CrossRef]
  46. Liao, L.; Song, J.; Wang, J.; Xiao, Z.; Wang, J. Bayesian method for building frequent landsat-like NDVI datasets by integrating MODIS and landsat NDVI. Remote Sens. 2016, 8, 452. [Google Scholar] [CrossRef]
  47. Wang, J.; Huang, B. A Rigorously-Weighted Spatiotemporal Fusion Model with Uncertainty Analysis. Remote Sens. 2017, 9, 990. [Google Scholar] [CrossRef]
  48. Wei, J.; Wang, L.; Liu, P.; Song, W. Spatiotemporal fusion of remote sensing images with structural sparsity and semi-coupled dictionary learning. Remote Sens. 2017, 9, 21. [Google Scholar] [CrossRef]
  49. Ke, Y.; Im, J.; Park, S.; Gong, H. Downscaling of MODIS One kilometer evapotranspiration using Landsat-8 data and machine learning approaches. Remote Sens. 2016, 8, 215. [Google Scholar] [CrossRef]
  50. Liao, C.; Wang, J.; Pritchard, I.; Liu, J.; Shang, J. A spatio-temporal data fusion model for generating NDVI time series in heterogeneous regions. Remote Sens. 2017, 9, 1125. [Google Scholar] [CrossRef]
  51. Xu, C.; Qu, J.; Hao, X.; Cosh, M.; Prueger, J.; Zhu, Z.; Gutenberg, L. Downscaling of Surface Soil Moisture Retrieval by Combining MODIS/Landsat and In Situ Measurements. Remote Sens. 2018, 10, 210. [Google Scholar] [CrossRef]
  52. Maselli, F.; Rembold, F. Integration of LAC and GAC NDVI data to improve vegetation monitoring in semi-arid environments. Int. J. Remote Sens. 2002, 23, 2475–2488. [Google Scholar] [CrossRef]
  53. Bhattarai, N.; Quackenbush, L.J.; Dougherty, M.; Marzen, L.J. A simple Landsat–MODIS fusion approach for monitoring seasonal evapotranspiration at 30 m spatial resolution. Int. J. Remote Sens. 2015, 36, 115–143. [Google Scholar] [CrossRef]
  54. Shen, H.; Wu, P.; Liu, Y.; Ai, T.; Wang, Y.; Liu, X. A spatial and temporal reflectance fusion model considering sensor observation differences. Int. J. Remote Sens. 2013, 34, 4367–4383. [Google Scholar] [CrossRef]
  55. Rao, C.V.; Malleswara Rao, J.; Senthil Kumar, A.; Dadhwal, V.K. Fast spatiotemporal data fusion: Merging LISS III with AWiFS sensor data. Int. J. Remote Sens. 2014, 35, 8323–8344. [Google Scholar] [CrossRef]
  56. Wu, B.; Huang, B.; Cao, K.; Zhuo, G. Improving spatiotemporal reflectance fusion using image inpainting and steering kernel regression techniques. Int. J. Remote Sens. 2017, 38, 706–727. [Google Scholar] [CrossRef]
  57. Zurita-Milla, R.; Clevers, J.G.P.W.; Schaepman, M.E. Unmixing-based landsat TM and MERIS FR data fusion. IEEE Geosci. Remote Sens. Lett. 2008, 5, 453–457. [Google Scholar] [CrossRef] [Green Version]
  58. Liu, X.; Deng, C.; Wang, S.; Huang, G.-B.; Zhao, B.; Lauren, P. Fast and Accurate Spatiotemporal Fusion Based Upon Extreme Learning Machine. IEEE Geosci. Remote Sens. Lett. 2016, 13, 2039–2043. [Google Scholar] [CrossRef]
  59. Huang, B.; Wang, J.; Song, H.; Fu, D.; Wong, K. Generating High Spatiotemporal Resolution Land Surface Temperature for Urban Heat Island Monitoring. IEEE Geosci. Remote Sens. Lett. 2013, 10, 1011–1015. [Google Scholar] [CrossRef]
  60. Xu, Y.; Huang, B.; Xu, Y.; Cao, K.; Guo, C.; Meng, D. Spatial and Temporal Image Fusion via Regularized Spatial Unmixing. IEEE Geosci. Remote Sens. Lett. 2015, 12, 1362–1366. [Google Scholar] [CrossRef]
  61. Houborg, R.; McCabe, M.F.; Gao, F. A Spatio-Temporal Enhancement Method for medium resolution LAI (STEM-LAI). Int. J. Appl. Earth Obs. Geoinf. 2016, 47, 15–29. [Google Scholar] [CrossRef]
  62. Amorós-López, J.; Gómez-Chova, L.; Alonso, L.; Guanter, L.; Zurita-Milla, R.; Moreno, J.; Camps-Valls, G. Multitemporal fusion of Landsat/TM and ENVISAT/MERIS for crop monitoring. Int. J. Appl. Earth Obs. Geoinf. 2013, 23, 132–141. [Google Scholar] [CrossRef]
  63. Niu, Z. Use of MODIS and Landsat time series data to generate high-resolution temporal synthetic Landsat data using a spatial and temporal reflectance fusion model. J. Appl. Remote Sens. 2012, 6, 63507. [Google Scholar] [CrossRef]
  64. Hazaymeh, K.; Hassan, Q.K. Spatiotemporal image-fusion model for enhancing the temporal resolution of Landsat-8 surface reflectance images using MODIS images. J. Appl. Remote Sens. 2015, 9, 96095. [Google Scholar] [CrossRef]
  65. Xie, D.; Zhang, J.; Zhu, X.; Pan, Y.; Liu, H.; Yuan, Z.; Yun, Y. An Improved STARFM with Help of an Unmixing-Based Method to Generate High Spatial and Temporal Resolution Remote Sensing Data in Complex Heterogeneous Regions. Sensors 2016, 16, 207. [Google Scholar] [CrossRef] [PubMed]
  66. Wu, M.; Huang, W.; Niu, Z.; Wang, C. Generating Daily Synthetic Landsat Imagery by Combining Landsat and MODIS Data. Sensors 2015, 15, 24002–24025. [Google Scholar] [CrossRef] [PubMed]
  67. Wang, Q.; Zhang, Y.; Onojeghuo, A.O.; Zhu, X.; Atkinson, P.M. Enhancing Spatio-Temporal Fusion of MODIS and Landsat Data by Incorporating 250 m MODIS Data. IEEE J. Sel. Top. Appl. Earth Obs. Remote Sens. 2017, 10, 4116–4123. [Google Scholar] [CrossRef]
  68. Song, H.; Liu, Q.; Wang, G.; Hang, R.; Huang, B. Spatiotemporal Satellite Image Fusion Using Deep Convolutional Neural Networks. IEEE J. Sel. Top. Appl. Earth Observ. Remote Sens. 2018, 11, 821–829. [Google Scholar] [CrossRef]
  69. Boyte, S.P.; Wylie, B.K.; Rigge, M.B.; Dahal, D. Fusing MODIS with Landsat 8 data to downscale weekly normalized difference vegetation index estimates for central Great Basin rangelands, USA. GIScience Remote Sens. 2018, 55, 376–399. [Google Scholar] [CrossRef]
  70. Huang, B.; Zhang, H.; Song, H.; Wang, J.; Song, C. Unified fusion of remote-sensing imagery: Generating simultaneously high-resolution synthetic spatial–temporal–spectral earth observations. Remote Sens. Lett. 2013, 4, 561–569. [Google Scholar] [CrossRef]
  71. Gärtner, P.; Förster, M.; Kleinschmit, B. The benefit of synthetically generated RapidEye and Landsat 8 data fusion time series for riparian forest disturbance monitoring. Remote Sens. Environ. 2016, 177, 237–247. [Google Scholar] [CrossRef]
  72. Aman, A.; Randriamanantena, H.P.; Podaire, A.; Frouin, R. Upscale Integration of Normalized Difference Vegetation Index: The Problem of Spatial Heterogeneity. IEEE Trans. Geosci. Remote Sens. 1992, 30, 326–338. [Google Scholar] [CrossRef]
  73. Kerdiles, H.; Grondona, M.O. NOAA-AVHRR NDVI decomposition and subpixel classification using linear mixing in the argentinean pampa. Int. J. Remote Sens. 1995, 16, 1303–1325. [Google Scholar] [CrossRef]
  74. Tobler, W.R. A Computer Movie Simulating Urban Growth in the Detroit Region. Econ. Geogr. 1970, 46, 234–240. [Google Scholar] [CrossRef]
  75. Zhu, X.; Liu, D.; Chen, J. A new geostatistical approach for filling gaps in Landsat ETM+ SLC-off images. Remote Sens. Environ. 2012, 124, 49–60. [Google Scholar] [CrossRef]
  76. Mueller, N.D.; Gerber, J.S.; Johnston, M.; Ray, D.K.; Ramankutty, N.; Foley, J.A. Closing yield gaps through nutrient and water management. Nature 2012, 490, 254–257. [Google Scholar] [CrossRef] [PubMed]
  77. Foley, J.A.; Ramankutty, N.; Brauman, K.A.; Cassidy, E.S.; Gerber, J.S.; Johnston, M.; Mueller, N.D.; O’Connell, C.; Ray, D.K.; West, P.C.; et al. Solutions for a cultivated planet. Nature 2011, 478, 337–342. [Google Scholar] [CrossRef] [PubMed]
  78. Lobell, D.B. The use of satellite data for crop yield gap analysis. Field Crops Res. 2013, 143, 56–64. [Google Scholar] [CrossRef]
  79. Allen, R.; Irmak, A.; Trezza, R.; Hendrickx, J.M.H.; Bastiaanssen, W.; Kjaersgaard, J. Satellite-based ET estimation in agriculture using SEBAL and METRIC. Hydrol. Process. 2011, 25, 4011–4027. [Google Scholar] [CrossRef]
  80. Li, L.; Zhao, Y.; Fu, Y.; Pan, Y.; Yu, L.; Xin, Q. High resolution mapping of cropping cycles by fusion of landsat and MODIS data. Remote Sens. 2017, 9, 1232. [Google Scholar] [CrossRef]
  81. Peng, Y.; Gitelson, A.A.; Sakamoto, T. Remote estimation of gross primary productivity in crops using MODIS 250m data. Remote Sens. Environ. 2013, 128, 186–196. [Google Scholar] [CrossRef]
  82. Son, N.T.; Chen, C.F.; Chang, L.Y.; Chen, C.R.; Sobue, S.I.; Minh, V.Q.; Chiang, S.H.; Nguyen, L.D.; Lin, Y.W. A logistic-based method for rice monitoring from multi-temporal MODIS-landsat fusion data. Eur. J. Remote Sens. 2016, 49, 39–56. [Google Scholar] [CrossRef]
  83. Zheng, Y.; Wu, B.; Zhang, M.; Zeng, H. Crop Phenology Detection Using High Spatio-Temporal Resolution Data Fused from SPOT5 and MODIS Products. Sensors 2016, 16, 2099. [Google Scholar] [CrossRef] [PubMed]
  84. Meng, J.; Du, X.; Wu, B. Generation of high spatial and temporal resolution NDVI and its application in crop biomass estimation. Int. J. Digit. Earth 2013, 6, 203–218. [Google Scholar] [CrossRef]
  85. Gao, F.; Anderson, M.C.; Zhang, X.; Yang, Z.; Alfieri, J.G.; Kustas, W.P.; Mueller, R.; Johnson, D.M.; Prueger, J.H. Toward mapping crop progress at field scales through fusion of Landsat and MODIS imagery. Remote Sens. Environ. 2017, 188, 9–25. [Google Scholar] [CrossRef]
  86. Singh, D. Generation and evaluation of gross primary productivity using Landsat data through blending with MODIS data. Int. J. Appl. Earth Obs. Geoinf. 2011, 13, 59–69. [Google Scholar] [CrossRef]
  87. Wang, X.; Jia, K.; Liang, S.; Li, Q.; Wei, X.; Yao, Y.; Zhang, X.; Tu, Y. Estimating Fractional Vegetation Cover from Landsat-7 ETM+ Reflectance Data Based on a Coupled Radiative Transfer and Crop Growth Model. IEEE Trans. Geosci. Remote Sens. 2017, 55, 5539–5546. [Google Scholar] [CrossRef]
  88. Li, Y.; Huang, C.; Hou, J.; Gu, J.; Zhu, G.; Li, X. Mapping daily evapotranspiration based on spatiotemporal fusion of ASTER and MODIS images over irrigated agricultural areas in the Heihe River Basin, Northwest China. Agric. For. Meteorol. 2017, 244–245, 82–97. [Google Scholar] [CrossRef]
  89. Meyer, S.T.; Koch, C.; Weisser, W.W. Towards a standardized Rapid Ecosystem Function Assessment (REFA). Trends Ecol. Evol. 2015, 30, 390–397. [Google Scholar] [CrossRef] [PubMed]
  90. Pettorelli, N.; Schulte to Bühne, H.; Tulloch, A.; Dubois, G.; Macinnis-Ng, C.; Queirós, A.M.; Keith, D.A.; Wegmann, M.; Schrodt, F.; Stellmes, M.; et al. Satellite remote sensing of ecosystem functions: Opportunities, challenges and way forward. Remote Sens. Ecol. Conserv. 2017, 1–23. [Google Scholar] [CrossRef]
  91. Nagendra, H.; Lucas, R.; Honrado, J.P.; Jongman, R.H.G.; Tarantino, C.; Adamo, M.; Mairota, P. Remote sensing for conservation monitoring: Assessing protected areas, habitat extent, habitat condition, species diversity, and threats. Ecol. Indic. 2013, 33, 45–59. [Google Scholar] [CrossRef]
  92. Pettorelli, N.; Laurance, W.F.; O’Brien, T.G.; Wegmann, M.; Nagendra, H.; Turner, W. Satellite remote sensing for applied ecologists: Opportunities and challenges. J. Appl. Ecol. 2014, 51, 839–848. [Google Scholar] [CrossRef]
  93. Wu, M.; Wu, C.; Huang, W.; Niu, Z.; Wang, C. High-resolution Leaf Area Index estimation from synthetic Landsat data generated by a spatial and temporal data fusion model. Comput. Electron. Agric. 2015, 115, 1–11. [Google Scholar] [CrossRef]
  94. Zhang, B.; Zhang, L.; Xie, D.; Yin, X.; Liu, C.; Liu, G. Application of synthetic NDVI time series blended from landsat and MODIS data for grassland biomass estimation. Remote Sens. 2016, 8, 10. [Google Scholar] [CrossRef]
  95. Walker, J.J.; de Beurs, K.M.; Wynne, R.H. Dryland vegetation phenology across an elevation gradient in Arizona, USA, investigated with fused MODIS and Landsat data. Remote Sens. Environ. 2014, 144, 85–97. [Google Scholar] [CrossRef]
  96. Tran, T.V.; de Beurs, K.M.; Julian, J.P. Monitoring forest disturbances in Southeast Oklahoma using Landsat and MODIS images. Int. J. Appl. Earth Obs. Geoinf. 2016, 44, 42–52. [Google Scholar] [CrossRef]
  97. Senf, C.; Leitão, P.J.; Pflugmacher, D.; van der Linden, S.; Hostert, P. Mapping land cover in complex Mediterranean landscapes using Landsat: Improved classification accuracies from integrating multi-seasonal and synthetic imagery. Remote Sens. Environ. 2015, 156, 527–536. [Google Scholar] [CrossRef]
  98. Zhang, F.; Zhu, X.; Liu, D. Blending MODIS and Landsat images for urban flood mapping. Int. J. Remote Sens. 2014, 35, 3237–3253. [Google Scholar] [CrossRef]
  99. Kong, F.; Li, X.; Wang, H.; Xie, D.; Li, X.; Bai, Y. Land cover classification based on fused data from GF-1 and MODIS NDVI time series. Remote Sens. 2016, 8, 741. [Google Scholar] [CrossRef]
  100. Chen, B.; Huang, B.; Xu, B. Multi-source remotely sensed data fusion for improving land cover classification. ISPRS J. Photogramm. Remote Sens. 2017, 124, 27–39. [Google Scholar] [CrossRef]
  101. Kakooei, M.; Baleghi, Y. Fusion of satellite, aircraft, and UAV data for automatic disaster damage assessment. Int. J. Remote Sens. 2017, 38, 2511–2534. [Google Scholar] [CrossRef]
  102. Chen, Y.; Lin, Z.; Zhao, X.; Wang, G.; Gu, Y. Deep learning-based classification of hyperspectral data. IEEE J. Sel. Top. Appl. Earth Obs. Remote Sens. 2014, 7, 2094–2107. [Google Scholar] [CrossRef]
  103. Lecun, Y.; Bengio, Y.; Hinton, G. Deep learning. Nature 2015, 521, 436–444. [Google Scholar] [CrossRef] [PubMed]
  104. Gao, L.; Zhan, W.; Huang, F.; Zhu, X.; Zhou, J.; Quan, J.; Du, P.; Li, M. Disaggregation of remotely sensed land surface temperature: A simple yet flexible index (SIFI) to assess method performances. Remote Sens. Environ. 2017, 200, 206–219. [Google Scholar] [CrossRef]
  105. Emelyanova, I.V.; McVicar, T.R.; Van Niel, T.G.; Li, L.T.; van Dijk, A.I.J.M. Assessing the accuracy of blending Landsat–MODIS surface reflectances in two landscapes with contrasting spatial and temporal dynamics: A framework for algorithm selection. Remote Sens. Environ. 2013, 133, 193–209. [Google Scholar] [CrossRef]
Figure 1. The input and output of spatiotemporal data fusion.
Remotesensing 10 00527 g001
Figure 2. (a) Yearly literature counts of journal papers introducing spatiotemporal data fusion methods and (b) citation counts of these papers in Web of Science. The search was conducted on 10 March 2018.
Remotesensing 10 00527 g002
Figure 3. (a) A tag cloud of the literature titles of the 58 papers introducing new spatiotemporal fusion methods, where a larger font and darker color denote a higher frequency; and (b) count of keywords with frequency larger than 4.
Remotesensing 10 00527 g003
Figure 4. Citation map of the literature in Table 2. The size of nodes indicates the count of citations. The citation relationship was derived from Web of Science.
Remotesensing 10 00527 g004
Figure 5. (a) Diagram of similar pixels and (b) shape of normal covariance functions.
Remotesensing 10 00527 g005
Figure 6. Schematic diagram of a NDVI curve and its linear segments (derived from paper [43]).
Remotesensing 10 00527 g006
Figure 7. An example of flood event happening during spatiotemporal data fusion: using (a), (c), and (d) to predict (b).
Remotesensing 10 00527 g007
Table 1. Existing satellite sensors collecting multispectral images with spatial resolution larger than 10 m.
SatelliteSensorSpatial ResolutionRevisit CycleOperational Period
NOAAAVHRR1.1 km12 hFrom 1978
Terra/AquaMODISBand 1–2: 250 m1 dayFrom 2000
Band 3–7: 500 m
Band 8–36: 1000 m
TerraASTERVNIR: 15 m16 daysFrom Dec-1999
SWIR: 30 m
TIR: 90 m
LandsatMSS (Landsat 1–3)79 m18 daysFrom 1972 to 1983
MSS+TM(Landsat5)VNIR: 30 m16 daysFrom 1984 to 2013
TIR: 120 m
ETM+(Landsat-7)VNIR: 30 m16 daysFrom 1999
TIR: 60 m
OLI(Landsat-8)VNIR: 30 m16 daysFrom 2013
TIR: 100 m
OrbView-2Sealifts1 km1 dayFrom 1997
SPOTHRV(SPOT1–3)20 m26 days (VGT 1 day)From 1986
VGT(SPOT-4)1.15 km
HRG/HRS/VGT(SPOT-5)HRG-VNIR: 10 m
HRG-SWIR: 20 m
ENVISATMERIS300 m35 daysFrom 2002 to 2012
Sentinel-2MSI10 m: (VNIR) B2,3,4,810 days with one satellite and 5 days with 2 satellitesFrom Jun-2015
20 m: B5,6,7,8A,11,12
60 m: B1,9,10
HJ-1A/1BMulti-spectral sensor30 m31 daysFrom 2009
TH-1Multi-spectral sensor10 m58 daysFrom Aug-2010
BJ-1Multi-spectral sensor32 m From Oct-2005
CBERS-01/02Multi-spectral sensorMulti-spectral-CCD: 19.5 m26 daysCBERS-01: From 1999 to 2002
Multi-spectral-IRMSS: 78 m/156 m26 daysCBERS-02: From Oct-2003
ZY-1 02BMulti-spectral sensor20 m26 daysFrom Sep-2007
ZY-1 02CMulti-spectral sensor10 m55 daysFrom Apr-2012
SJ-9AMulti-spectral sensor10 m69 daysFrom Oct-2012
ALOSAVNIR-210 m46 daysFrom 2006 to 2011
ADEOSMulti-spectral sensor700 m41 daysFrom 1996 to 1997
JERS-1OPS18 m44 daysFrom 1992 to 1998
IRS-1A/1BLISS-I/LISS-II/LISS-A/LISS-B72.5 m(LISS-I); 36 m(LISS-II)22 daysFrom 1988
IRS-1C/1DLISS-III23.5 m; 70 m24 daysFrom 1995 to 2010
IRS-P3WiFS/MOS188 m(WiFS); 1500 m/520 m/ 550 m(MOS)5 daysFrom 1996 to 2004
IRS-P6LISS-IV/LISS-III/AWiFS5.8 m(LISS-IV)/23.5 m(LISS-III)/70 m(AWiFS)24 daysFrom 2003
THEOSMulti-spectral sensor15 m26 daysFrom Oct-2008
Table 2. Number of methodology papers of spatiotemporal data fusion published in 11 major journals in the field of remote sensing. The search was conducted on 10 March 2018.
Source TitlesRecordsPercentageLiterature
Remote Sensing of Environment1525.86%[11,15,16,17,18,19,20,21,22,23,24,25,26,27,28]
IEEE Transactions on Geoscience and Remote Sensing1424.14%[8,29,30,31,32,33,34,35,36,37,38,39,40,41]
Remote Sensing1017.24%[42,43,44,45,46,47,48,49,50,51]
International Journal of Remote Sensing58.62%[52,53,54,55,56]
IEEE Geoscience and Remote Sensing Letters46.90%[57,58,59,60]
International Journal of Applied Earth Observation and Geoinformation23.45%[61,62]
Journal of Applied Remote Sensing23.45%[63,64]
Sensors23.45%[65,66]
IEEE Journal of Selected Topics in Applied Earth Observations and Remote Sensing23.45%[67,68]
GIScience and Remote Sensing11.72%[69]
Remote Sensing Letters11.72%[70]
TOTAL58100%
Table 3. Categories of the existing spatiotemporal data fusion methods.
CategoryMethods 1 and References
Unmixing-basedMMT [31]; LAC-GAC NDVI integration [52]; Landsat-MERIS fusion method [62]; ESTDFM [44]; STDFA [63]; MSTDFA [66]; OB-STVIUM [17]; MERIS-Landsat fusion [57]
Weight function-basedSTARFM [8]; semi-physical fusion approach [19]; ESTARFM [11]; STAARCH [27]; SADFAT [21]; Topographically corrected downscaling [18]; STITFM [23]; STARFM-Sensor difference [54]; mESTARFM [45]; Bilateral Filter method [59]; ET fusion model [53]; STI-FM [64]; operational STARFM [33]; Three-step method [16]; STEM-LAI [61]; ATPPK [34]; ATPPK-STARFM [67]; STNLFFM [30]; Fast spatiotemporal fusion [55]; RWSTFM [47]; DBUX [25]; ISKRFM [56]; Temporal high-pass modulation and edge primitives method [36]; Decision-level fusion [39]; STVIFM [50]; Soil moisture downscaling [51]
Bayesian-basedBME [20]; Unified fusion [70]; NDVI-BSFM [46]; Bayesian data fusion approach [42]; Spatio-Temporal-Spectral fusion framework [38]
Learning-basedSPSTFM [29]; One-pair image learning method [35]; EBSPTM [32]; ELM-based method [58]; WAIFA [15]; bSBL-SCDL [48]; CSSF [37]; Regression tree-based method [69]; Evapotranspiration downscaling [49]; STFDCNN [68]; MRT [40]; Integrated sparse representation-based fusion [41]
HybridFSDAF [26]; NDVI-LMGM [43]; Regularized spatial unmixing method [60]; STIMFM [22]; STRUM [24]; USTARFM [65]; BLEST [28]
1 Names of these methods were extracted from the literature. If the methods were not named in the literature, the words describing the methods’ major characteristics were used to name them here.

