Spatial Rice Yield Estimation Based on MODIS and Sentinel-1 SAR Data and ORYZA Crop Growth Model


 , ,
, ,  ,
,  ,
,
Abstract
:
1. Introduction
2. Study Site and Data
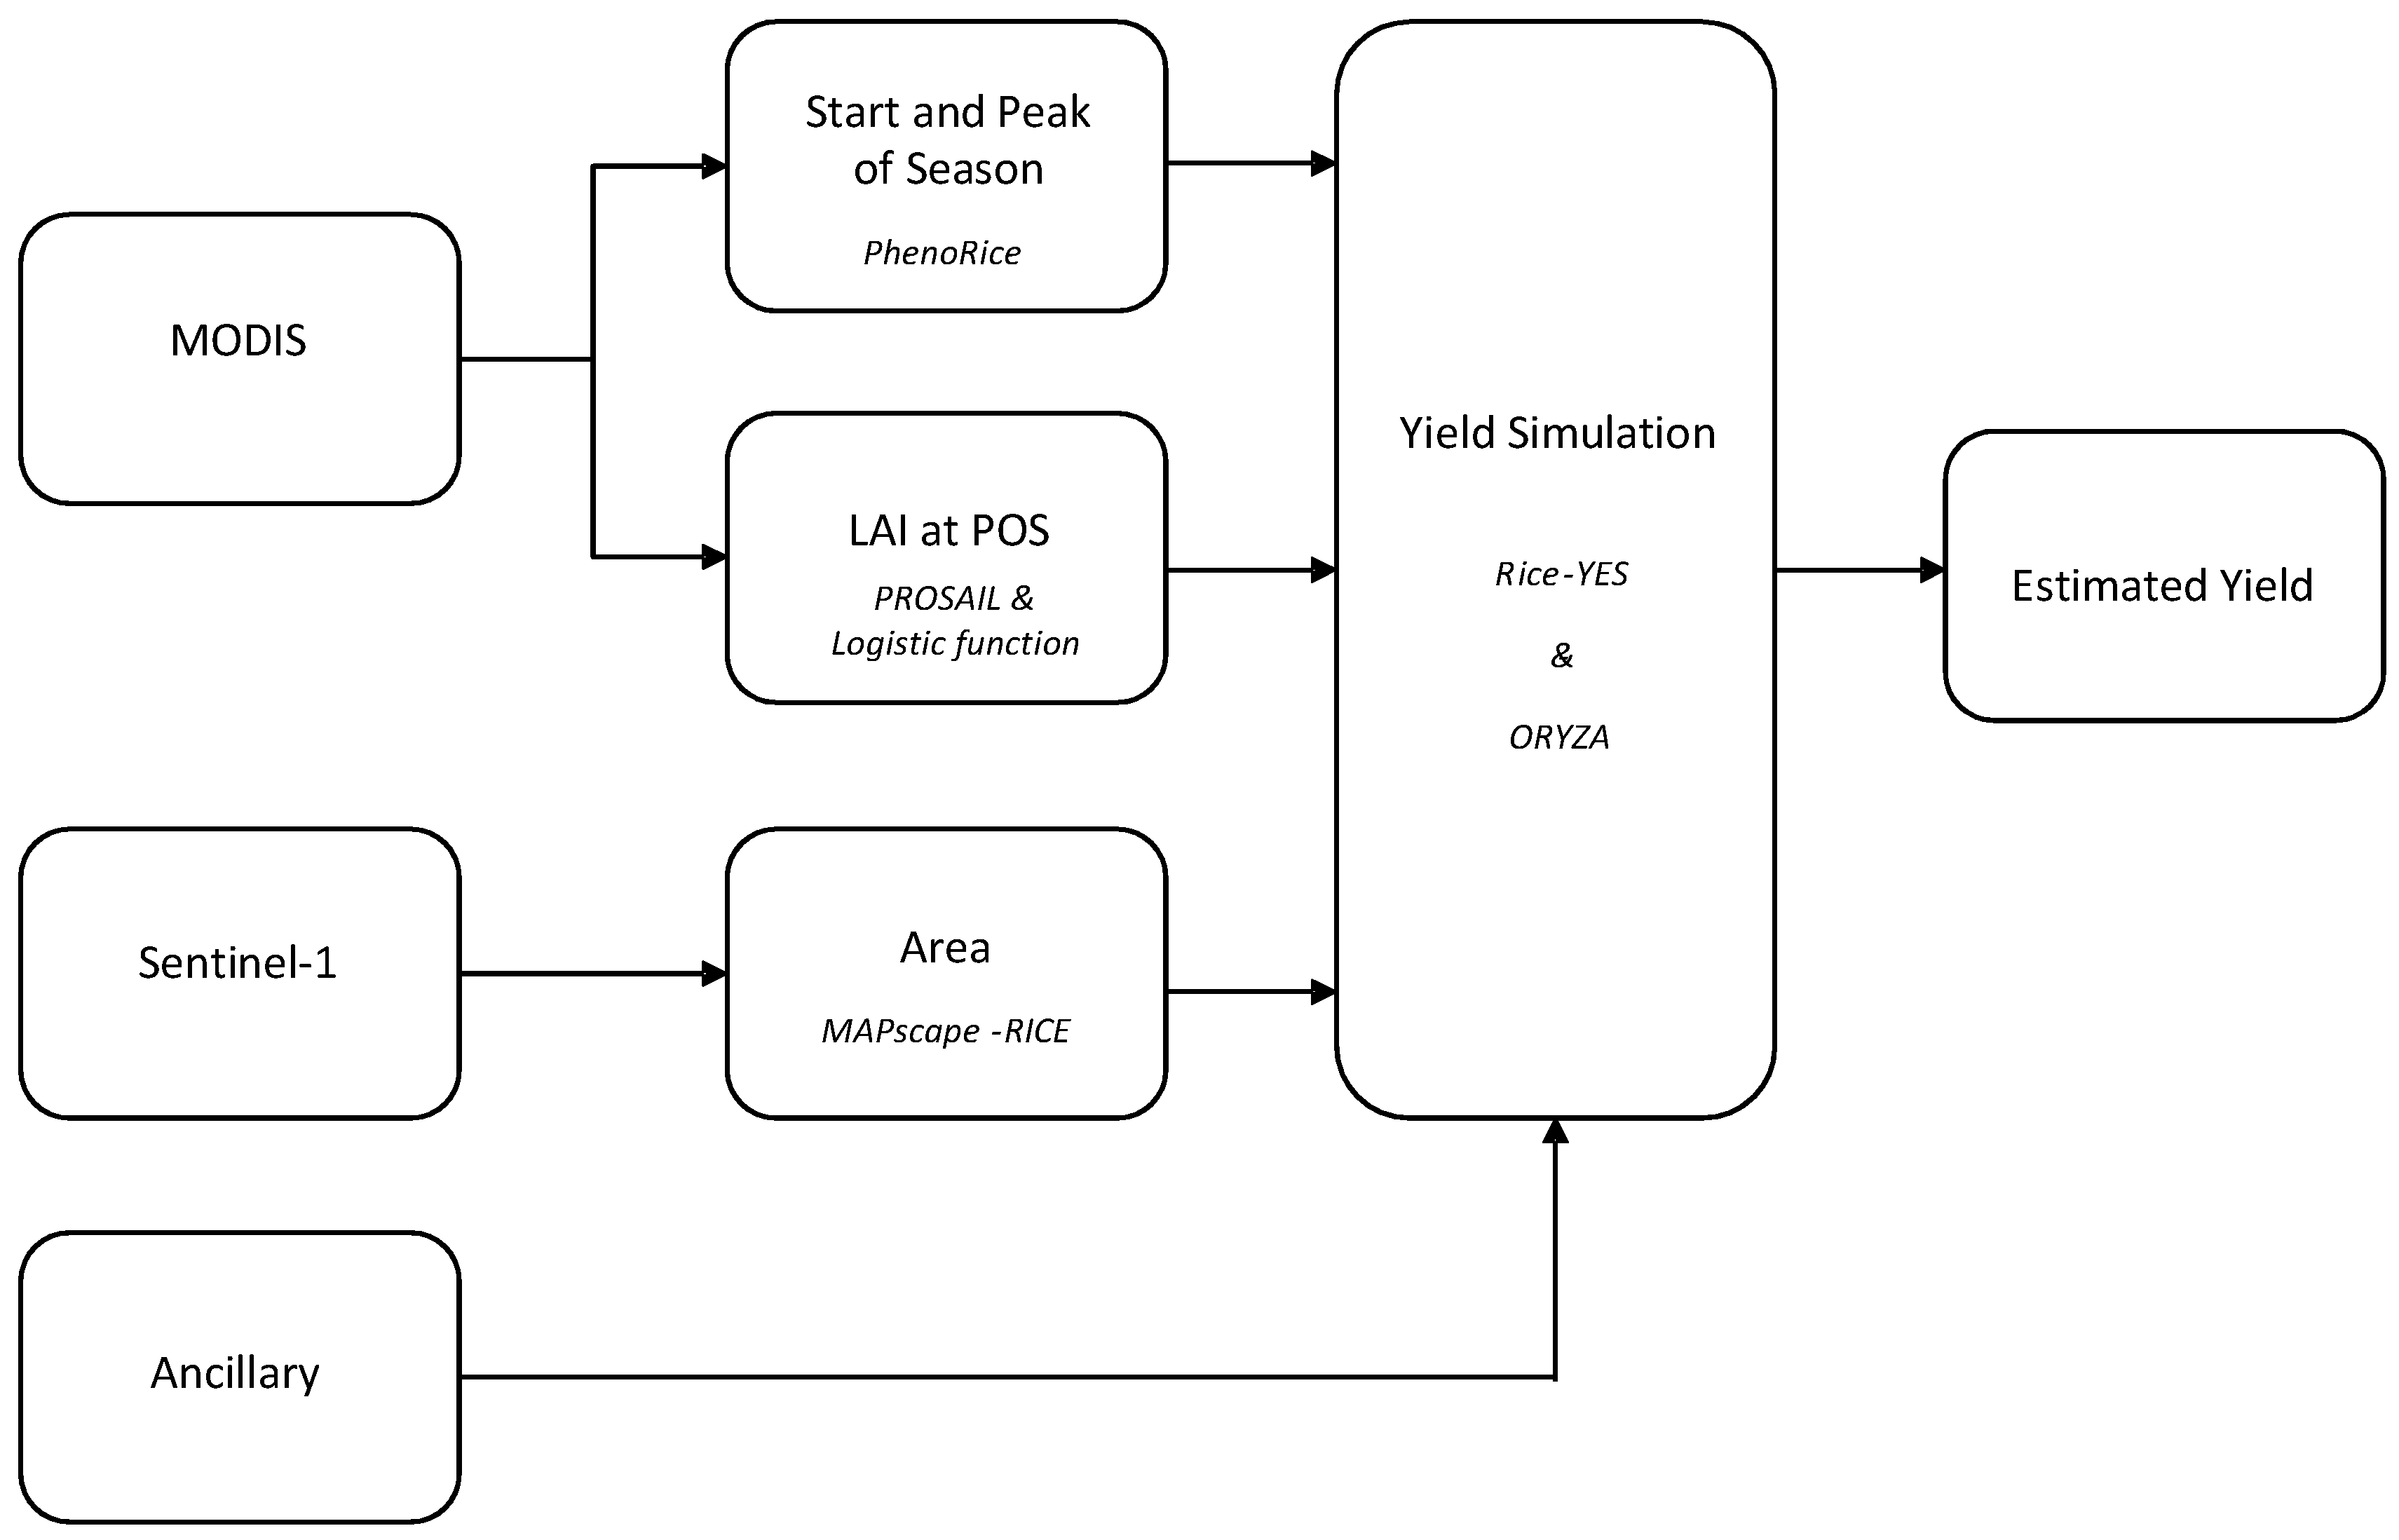
3. System Description
- i
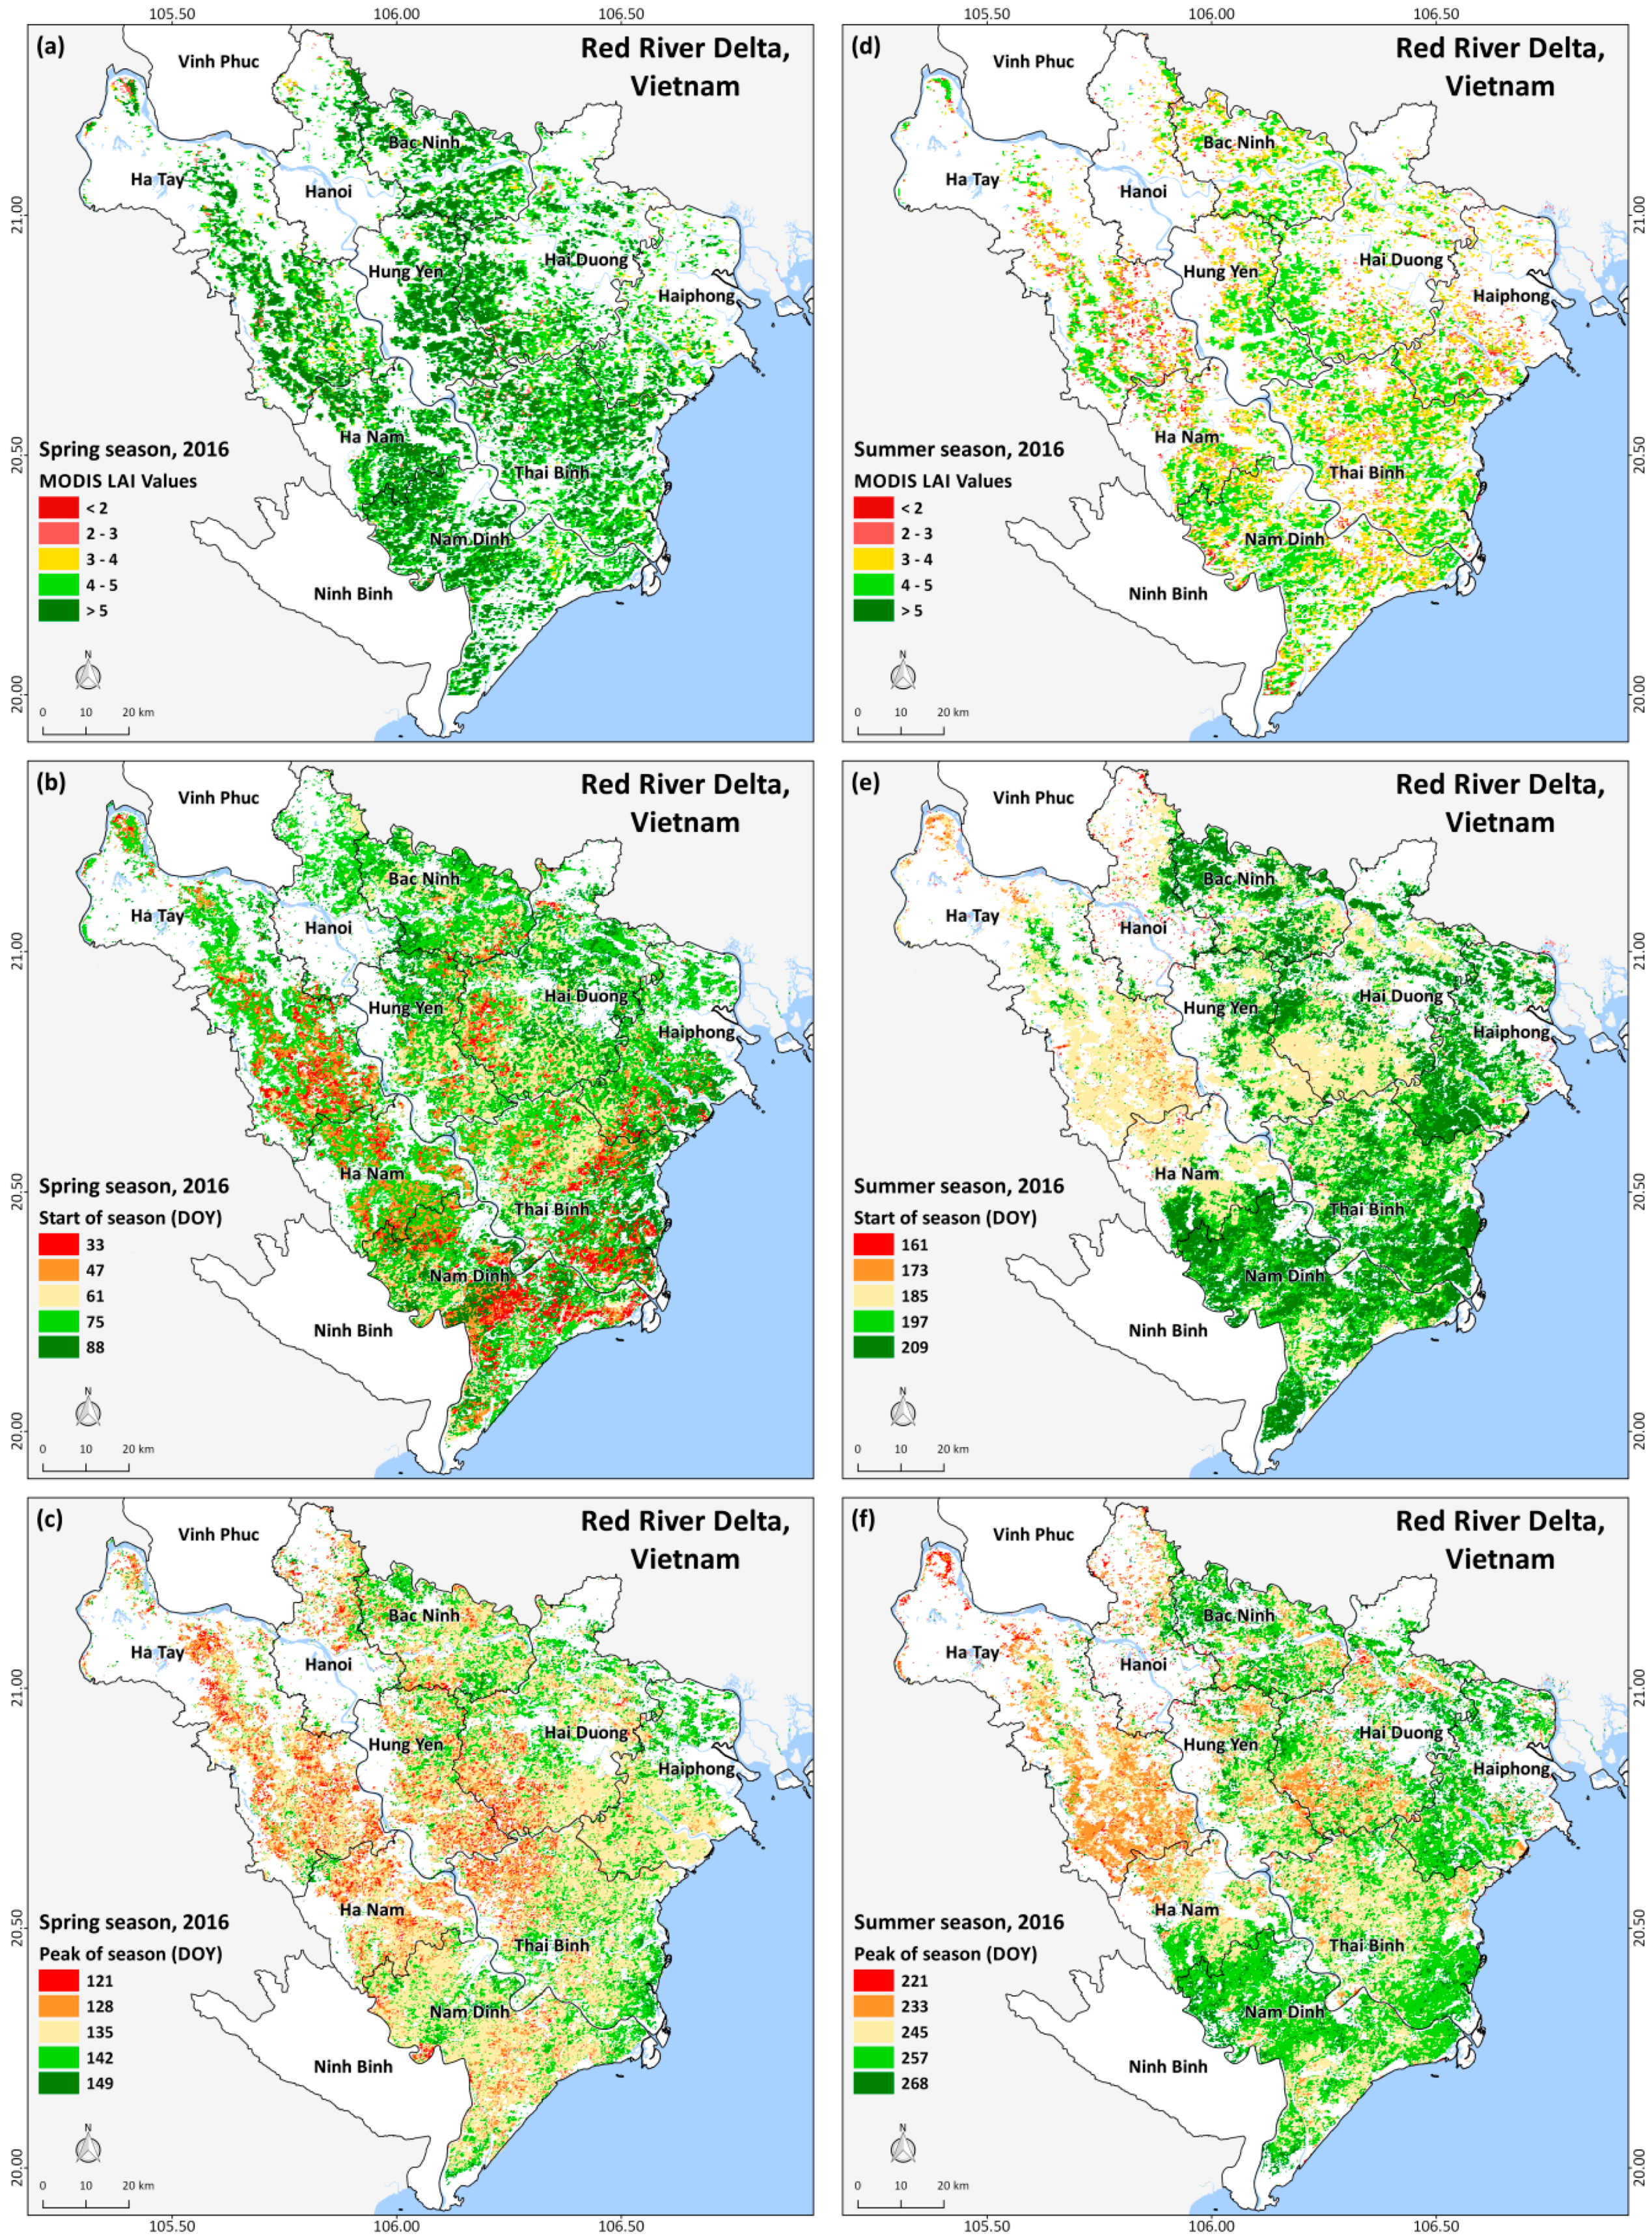
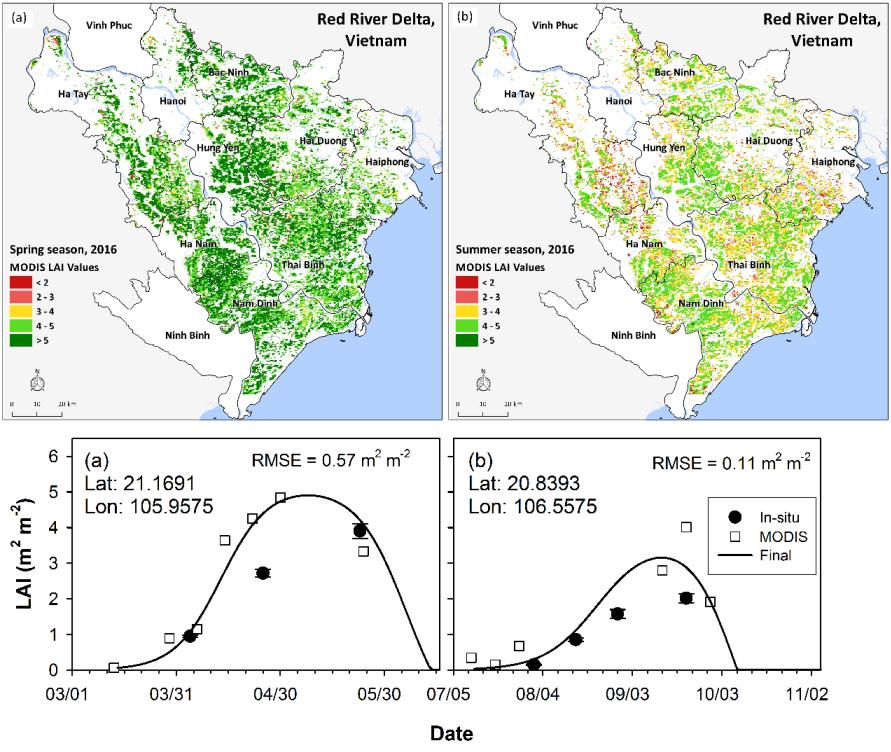
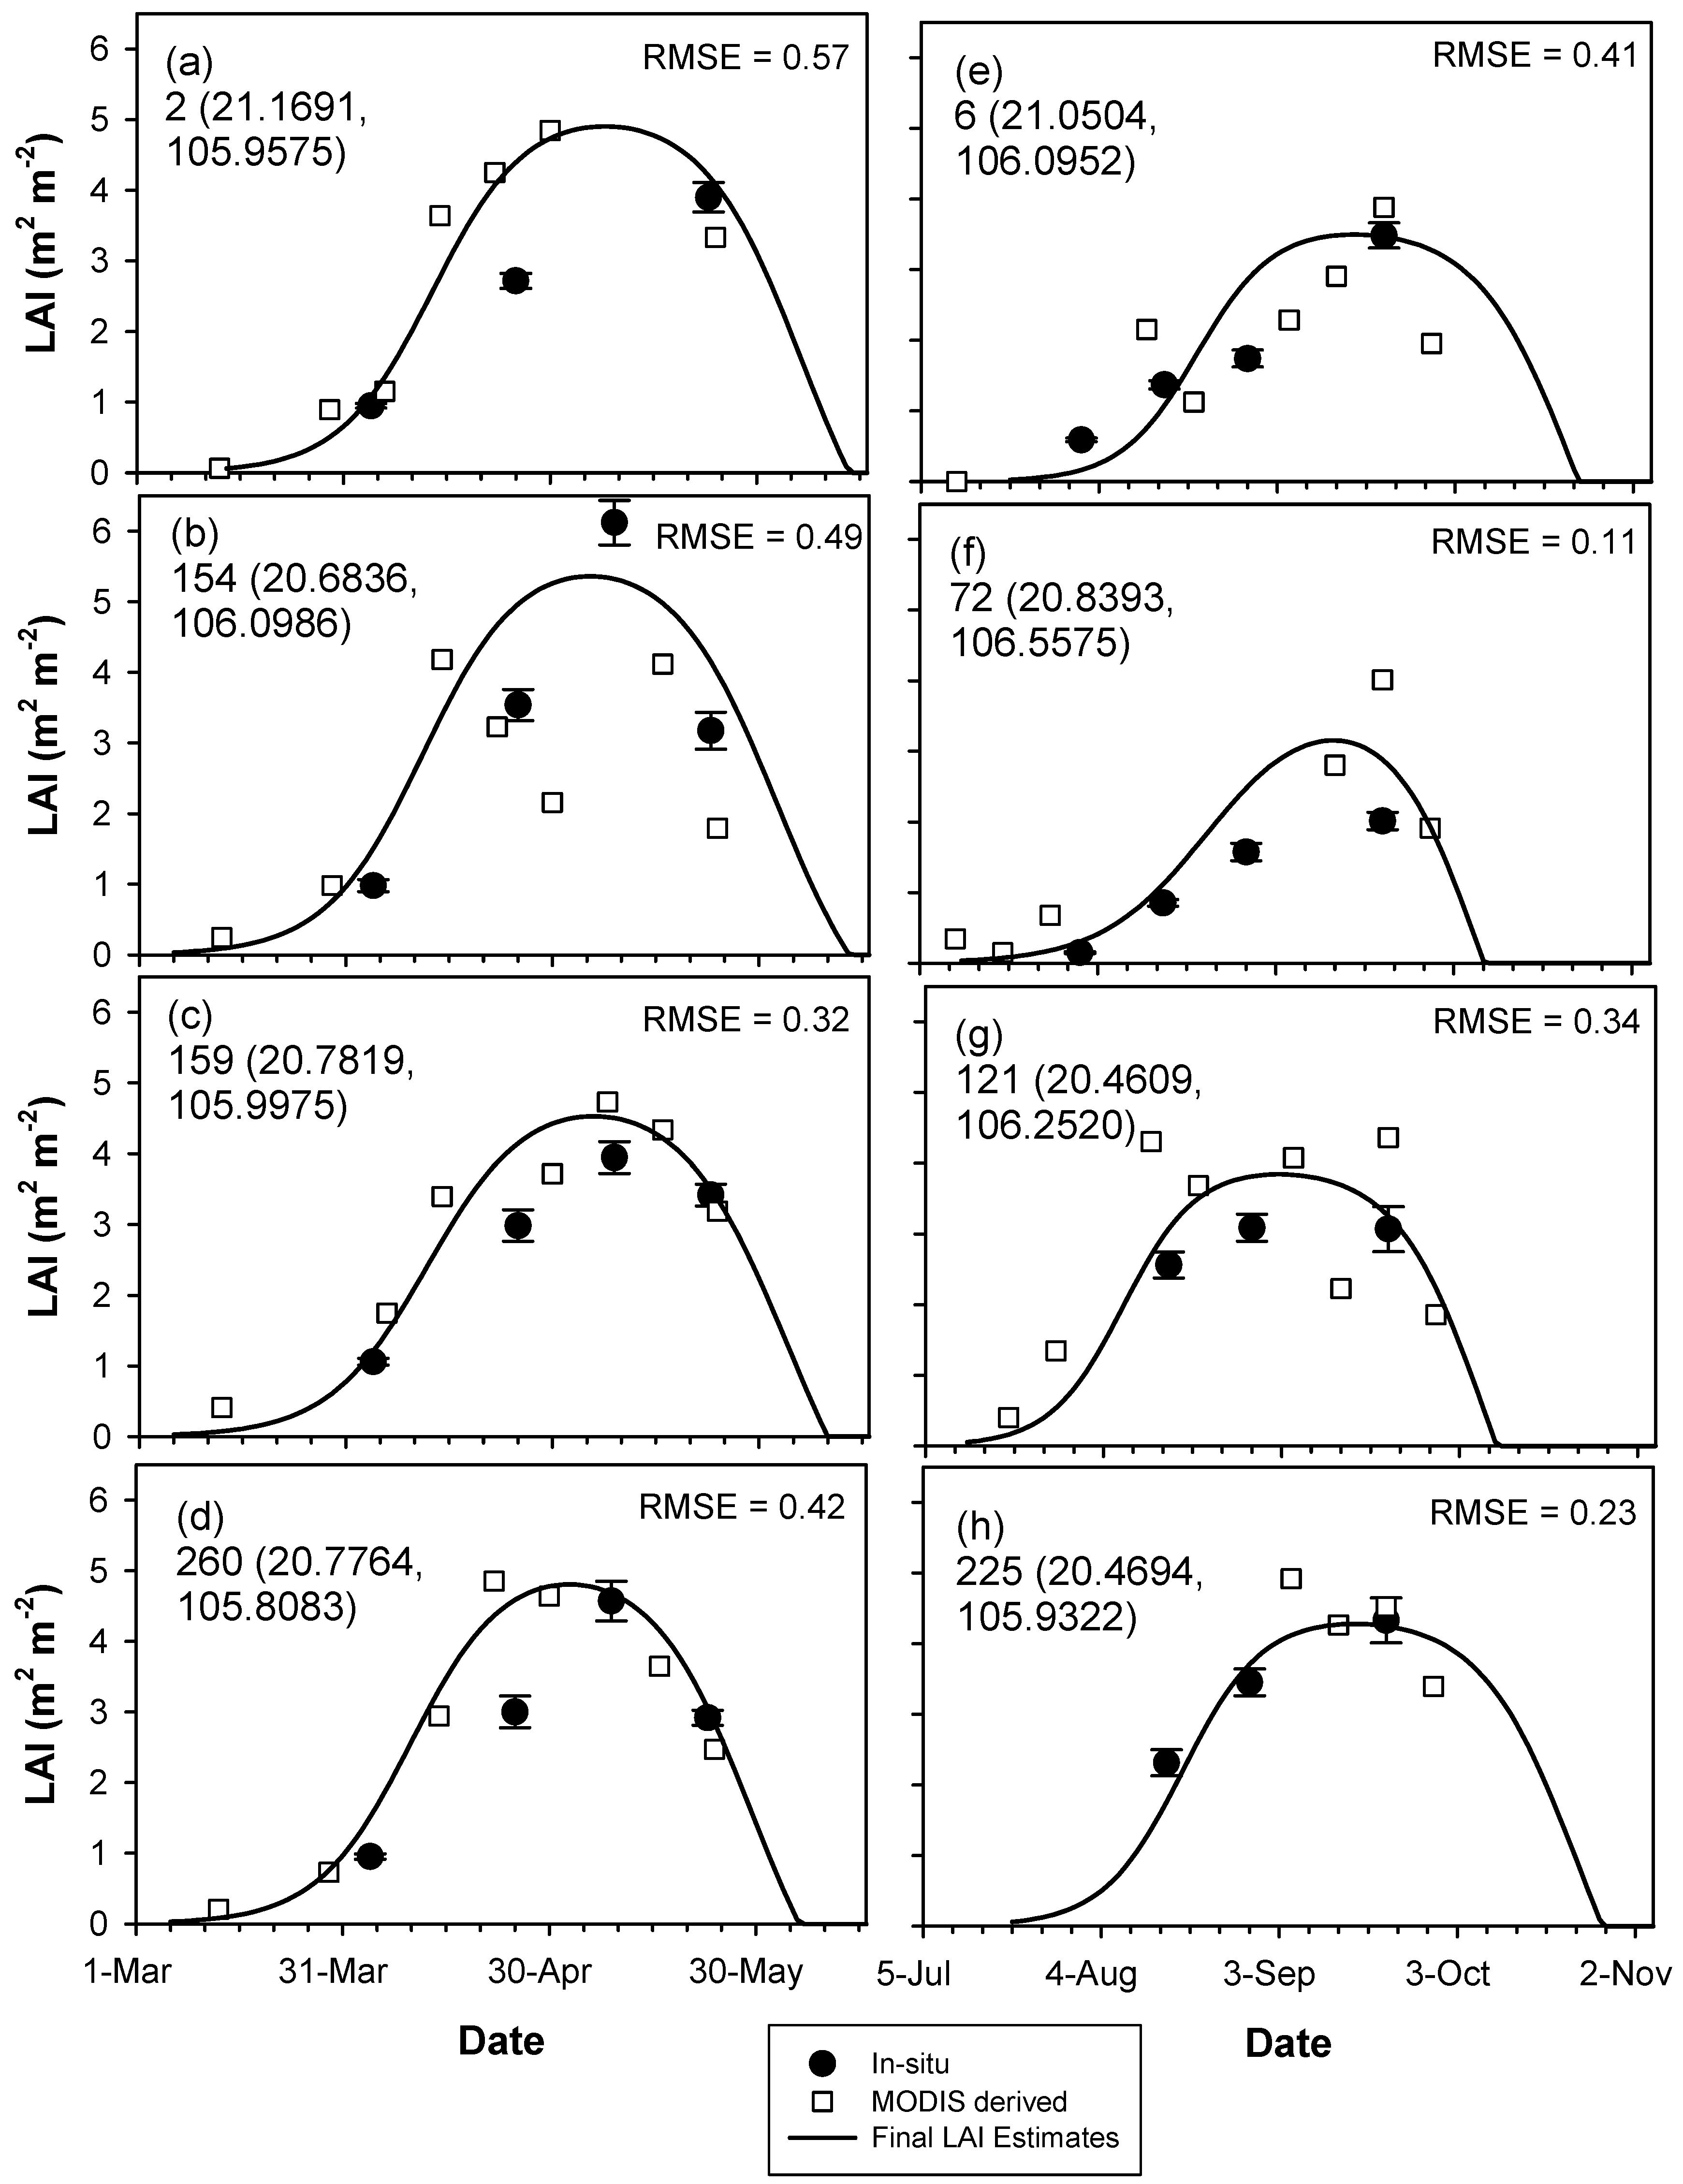
- Seasonality information: The selected seasonal drivers of crop growth are: (i) start and peak of season (SOS and POS) derived from MODIS using the rule-based PhenoRice algorithm [40]; and (ii) multitemporal leaf area index (LAI) estimates derived from MODIS reflectance data using a hybrid approach exploiting machine learning algorithms fed with the synthetic database generated from the PROSAIL Radiative Transfer Model (RTM) [41]. These estimations are then fitted into a logistic function for LAI [42].
- ii
- Rice area maps are derived from Sentinel-1 SAR data using MAPScape-Rice [26].
- iii
3.1. MODIS Rice Information Retrieval
3.1.1. Estimation of Rice Start and Peak of Season
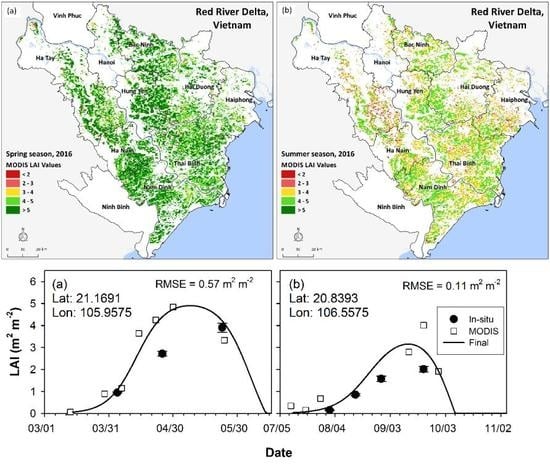
3.1.2. LAI Retrieval
3.2. SAR Sentinel-1 Data Processing
3.2.1. Identification of Rice Cultivated Areas
- Rice exclusion condition: The average σ° is lower/higher than expected, or average σ° is below a minimum value for longer than expected or variation of σ° larger than expected.
- Presence of flooding conditions at the start of season (SOS): The temporal series is analyzed starting from the first image acquisition to identify when σ° drops below a maximum value for SOS flooding; this time is set as SOS.
- Confirmation of rice presence: After flooding detection, rice presence is confirmed if σ° increases after SOS, which is consistent with the expected value for rice crops (rapid growth of rice biomass after flooding).
- Late rice condition: When the length of the S-1A time series after detected SOS is shorter than expected, rice is classified as being sown late in the season.
- New rice/crop season: An unexpected drop in σ° after SOS, which suggests a new flood or a new crop season. Note that, if Rule 2 is not met during the entire temporal series, another rule allows one to determine whether flooding occurred before the first Sentinel-1A acquisition. If σ° variation is above a pre-defined value, which is expected for rice, and σ° decreases after the maximum value, the pixel is classified as early rice.
3.2.2. LAI Retrieval
3.3. Yield Simulation from Crop Model and EO Product Integration
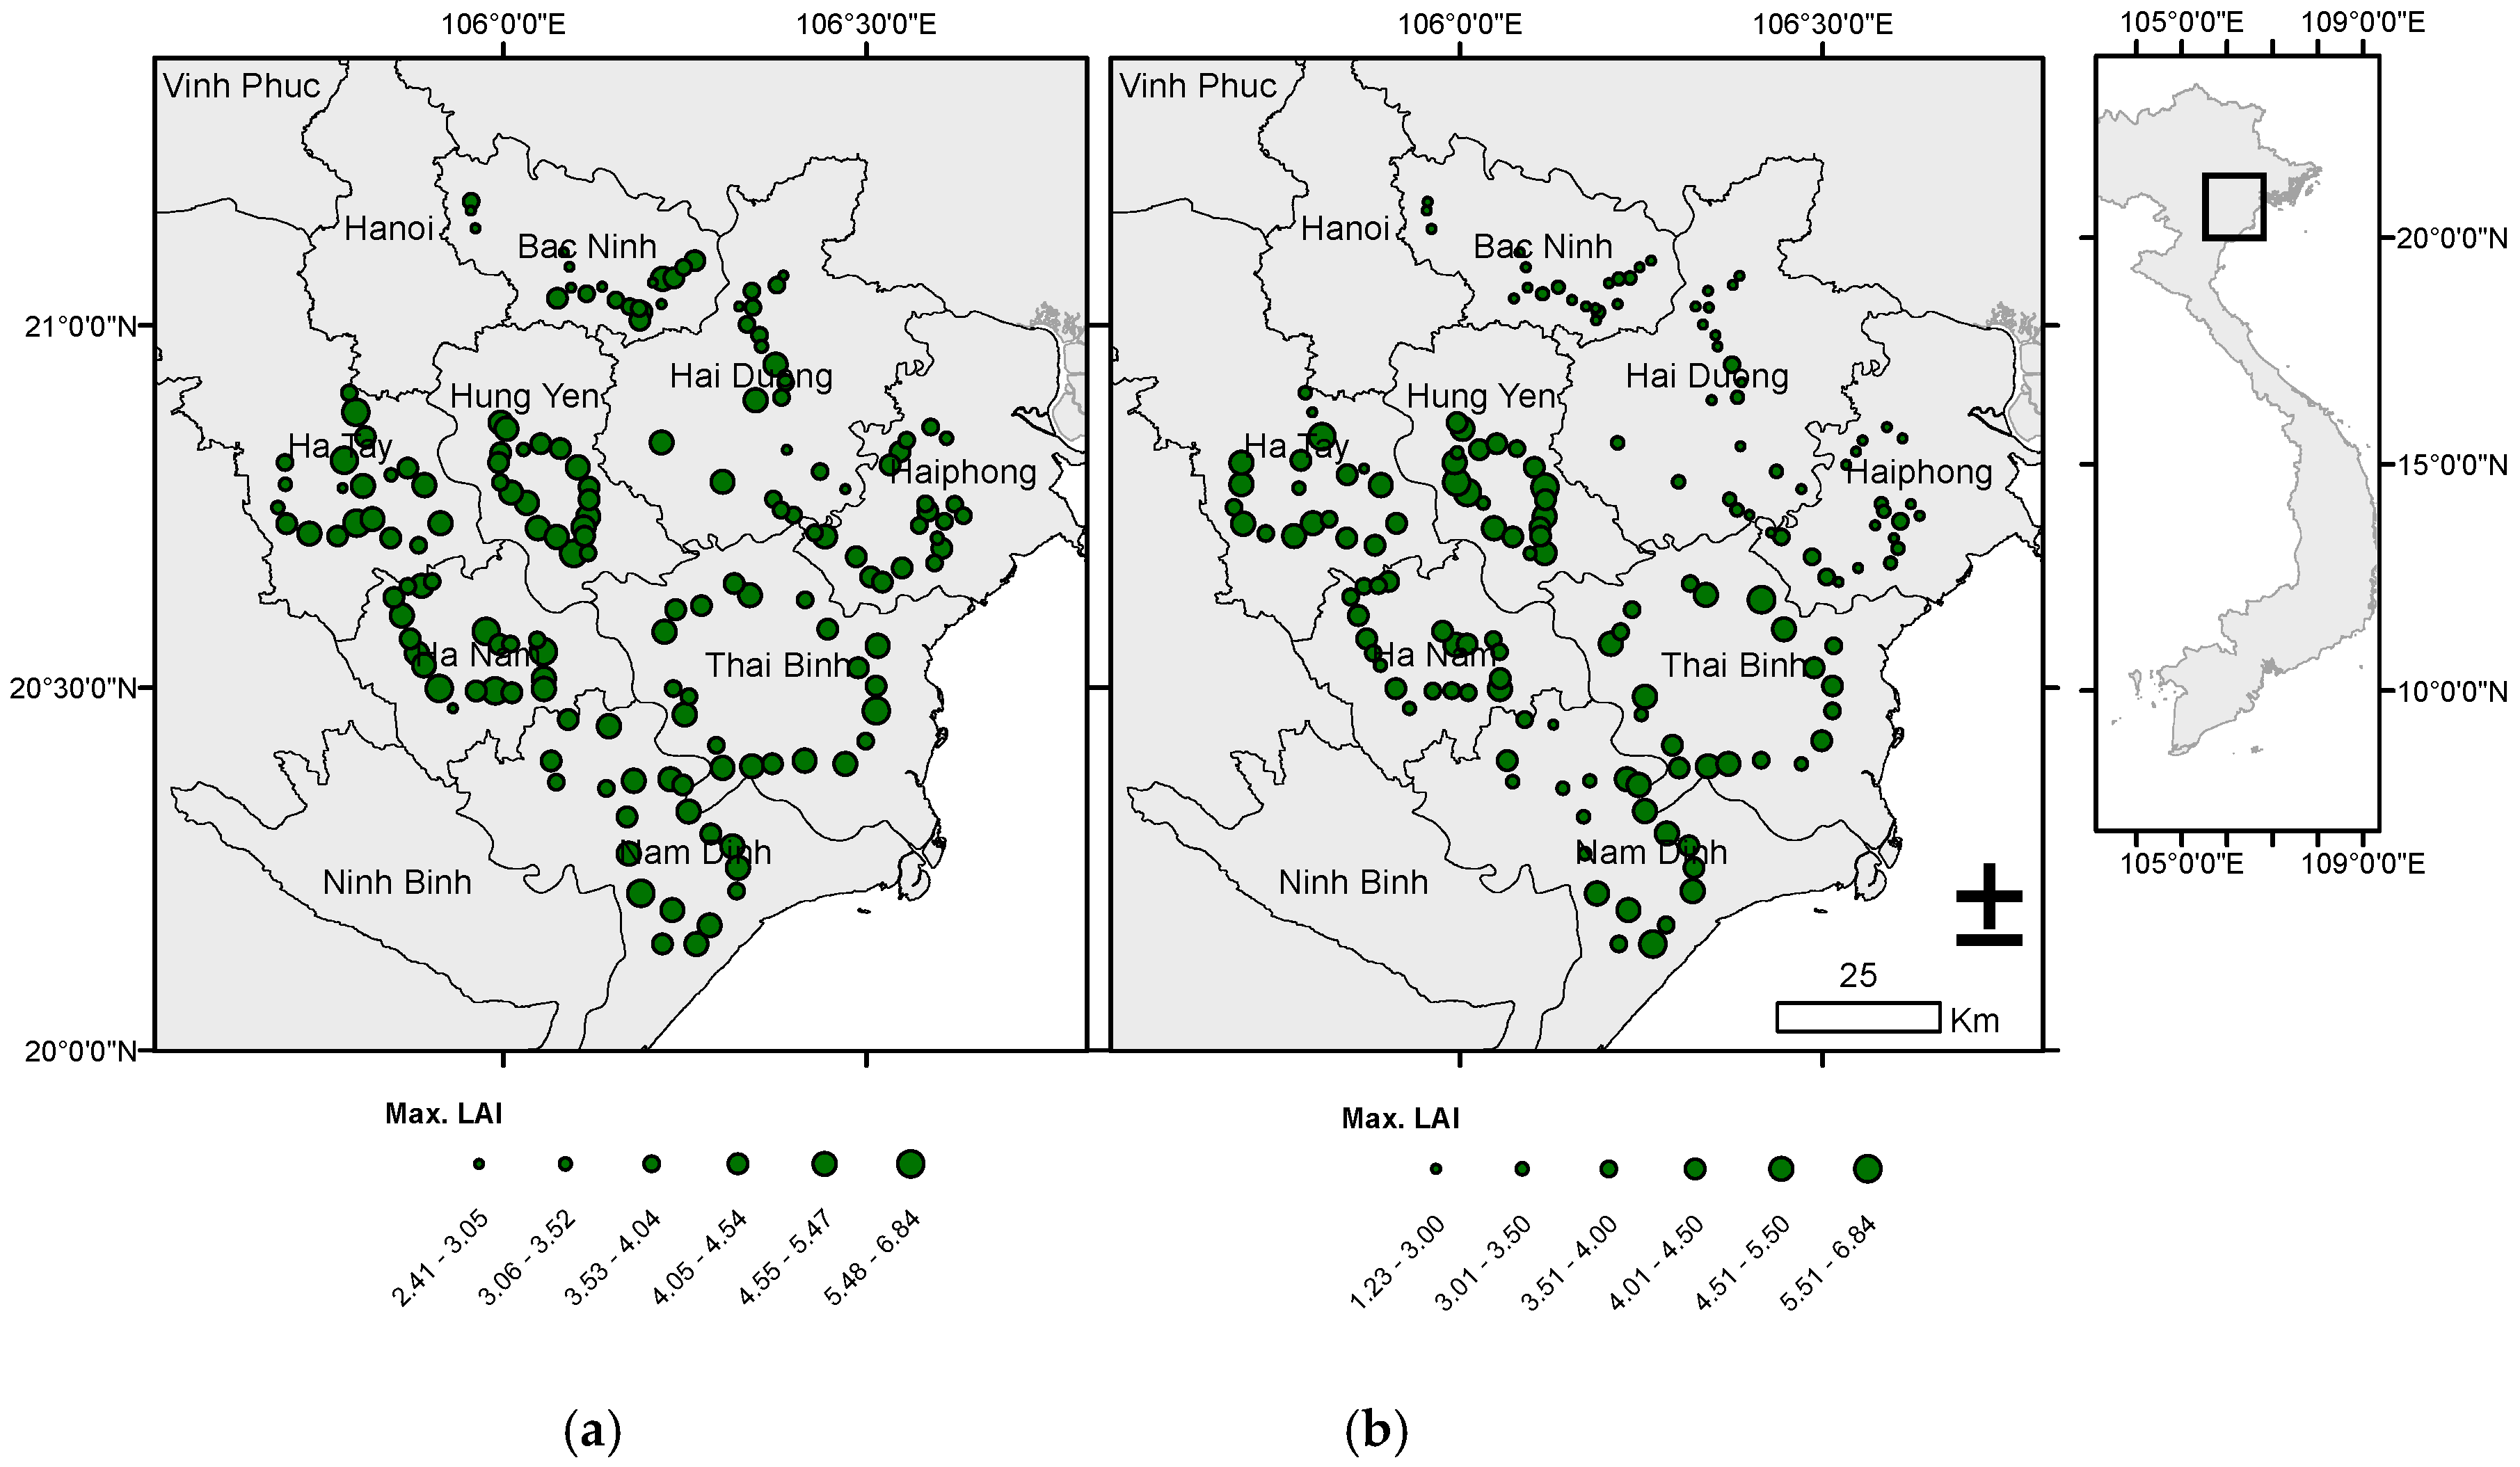
4. Product Validation and Inter-Comparison
5. Results
6. Discussion
7. Conclusions
Acknowledgments
Author Contributions
Conflicts of Interest
References
- Nagayet, O. Small Farms: Current Status and Key Trends. In The Future of Small Farms, Proceedings of a Research Workshop, Wye, UK, 26–29 June 2005; International Food Policy Research Institute: Washington, DC, USA, 2005; pp. 355–367. [Google Scholar]
- O’Brien, K.; Leichenko, R.; Kelkar, U.; Venema, H.; Aandahl, G.; Tompkins, H.; Javed, A.; Bhadwal, S.; Barg, S.; Nygaard, L.; et al. Mapping vulnerability to multiple stressors: Climate change and globalization in India. Glob. Environ. Chang. 2004, 14, 303–313. [Google Scholar] [CrossRef]
- Morton, J.F. The impacts of climate change on smallholder and subsistence agriculture. Proc. Natl. Acad. Sci. USA 2007, 104, 19680–19685. [Google Scholar] [CrossRef] [PubMed]
- Intergovernmental Panel on Climate Change. Climate Change 2007: Impacts, Adaptation and Vulnerability. Contribution of Working Group II to the Fourth Assessment Report of the Intergovernmental Panel on Climate Change; Parry, M.L., Canziani, O.F., Palutikof, J.P., van der Linden, P.J., Hanson, C.E., Eds.; Cambridge University Press: Cambridge, UK, 2007. [Google Scholar]
- Mendelsohn, R. The impact of climate change on agriculture in developing countries. J. Nat. Resour. Policy Res. 2009, 1, 5–19. [Google Scholar] [CrossRef]
- Miranda, M.J.; Gonzalez-Vega, C. Systemic risk, index insurance, and optimal management of agricultural loan portfolios in developing countries. Am. J. Agric. Econ. 2011, 93, 399–406. [Google Scholar] [CrossRef]
- Shannon, H.D.; Motha, R.P. Managing weather and climate risks to agriculture in North America, Central America and the Caribbean. Weather Clim. Extremes 2015, 10, 50–56. [Google Scholar] [CrossRef]
- Swain, M. Crop Insurance for Adaptation to Climate Change in India; Asia Research Centre Working Paper; London School of Economics and Political Science: London, UK, 2014. [Google Scholar]
- Miranda, M.J.; Farrin, K. Index insurance for developing countries. Appl. Econ. Perspect. Policy 2012, 34, 391–427. [Google Scholar] [CrossRef]
- Carter, M.R.; Galarza, F.; Boucher, S. Underwriting Area-Based Yield Insurance to Crowd-In Credit Supply and Demand; Working Paper No. 07-003; Department of Agricultural and Resource Economics, University of California: Davis, CA, USA, 2007. [Google Scholar]
- Dillon, C.R.; Mjelde, J.W.; McCarl, B.A. Biophysical simulation in support of crop production decisions: A case study in the Blacklands regions of Texas. South. J. Agric. Econ. 1989, 21, 73–86. [Google Scholar] [CrossRef]
- Löw, F.; Biradar, C.; Fliemann, E.; Lamers, J.P.A.; Conrad, C. Assessing gaps in irrigated agricultural productivity through satellite earth observations—A case study of the Fergana Valley, Central Asia. Int. J. Appl. Earth Obs. Geoinf. 2017, 57, 118–134. [Google Scholar] [CrossRef]
- Hamar, D.; Ferencz, C.S.; Lichtenberger, J.; Tarcsai, G.Y.; Ferencz Árkos, I. Yield estimation for corn and wheat in the Hungarian Great Plain using Landsat MSS data. Int. J. Remote Sens. 1996, 17, 1689–1699. [Google Scholar] [CrossRef]
- Clevers, J.G.P.W. A simplified approach for yield prediction of sugar beet based on optical remote sensing data. Remote Sens. Environ. 1997, 61, 221–2280. [Google Scholar] [CrossRef]
- Ferencz, C.; Bognár, P.; Lichtenberger, J.; Hamar, D.; Tarcsai, G.; Timár, G.; Ferencz Árkos, I. Crop yield estimation by satellite remote sensing. Int. J. Remote Sens. 2004, 25, 4113–4149. [Google Scholar] [CrossRef]
- Doraiswamy, P.C.; Sinclair, T.R.; Hollinger, S.; Akhmedov, B.; Stern, A.; Prueger, J. Application of MODIS derived parameters for regional crop yield assessment. Remote Sens. Environ. 2005, 97, 192–202. [Google Scholar] [CrossRef]
- Prasad, A.K.; Chai, L.; Singh, R.P.; Kafatos, M. Crop yield estimation model for Iowa using remote sensing and surface parameters. Int. J. Appl. Earth Obs. Geoinf. 2006, 8, 26–33. [Google Scholar] [CrossRef]
- Bolton, D.K.; Friedl, M.A. Forecasting crop yield using remotely sensed vegetation indices and crop phenology metrics. Agric. For. Meteorol. 2013, 173, 74–84. [Google Scholar] [CrossRef]
- Koide, N.; Robertson, A.; Ines, A.; Qian, J.H.; DeWitt, D.; Lucero, A. Prediction of rice production in the Philippines using seasonal climate forecasts. J. Appl. Meteorol. Clim. 2013, 552–569. [Google Scholar] [CrossRef]
- Lansigan, F. Evaluating the effects of anticipated climate change on rice production in the Philippines. J. Agric. Met. 1993, 48, 779–782. [Google Scholar] [CrossRef]
- Fang, H.; Liang, S.; Hoogenboom, G.; Teasdale, J.; Cavigelli, M. Corn-yield estimation through assimilation of remotely sensed data into the CSM-CERES-Maize model. Int. J. Remote Sens. 2008, 29, 3011–3032. [Google Scholar] [CrossRef]
- Maki, M.; Sekiguchi, K.; Homma, K.; Hirooka, Y.; Oki, K. Estimation of rice yield by SIMRIW-RS, a model that integrates remote sensing data into a crop growth model. J. Agric. Met. 2017, 73, 2–8. [Google Scholar] [CrossRef]
- Benedetti, R.; Rossini, P. On the use of NDVI profiles as a tool for agricultural statistics: The case study of wheat yield estimate and forecast in Emilia Romagna. Remote Sens. Environ. 2003, 45, 311–326. [Google Scholar] [CrossRef]
- Fuller, D.O. Trends in NDVI time series and their relation to rangeland and crop production in Senegal, 1987–1993. Int. J. Remote Sens. 1998, 19, 2013–2018. [Google Scholar] [CrossRef]
- Zhang, X.; Zhang, Q. Monitoring interannual variation in global crop yield using long-term AVHRR and MODIS observations. ISPRS J. Photogramm. Remote Sens. 2016, 114, 191–205. [Google Scholar] [CrossRef]
- Nelson, A.; Setiyono, T.; Rala, A.B.; Quicho, E.D.; Raviz, J.V.; Abonete, P.J.; Maunahan, A.A.; Garcia, C.A.; Bhatti, H.Z.M.; Villano, L.S.; et al. Toward an operational SAR-based rice monitoring system in Asia: Examples from 13 demonstration sites across Asia in the RIICE project. Remote Sens. 2014, 6, 10773–10812. [Google Scholar] [CrossRef]
- Li, T.; Angeles, O.; Marcaida, M., III; Manalo, E.; Manalili, M.P.; Radanielson, A.; Mohanty, S. From ORYZA2000 to ORYZA (v3): An improved simulation model for rice in drought and nitrogen-deficient environments. Agric. For. Meteorol. 2017, 237, 246–256. [Google Scholar] [CrossRef] [PubMed]
- Setiyono, T.D.; Holecz, F.; Khan, N.I.; Barbieri, M.; Quicho, E.; Collivignarelli, F.; Maunahan, A.; Gatti, L.; Romuga, G.C. Synthetic Aperture Radar (SAR)-based paddy rice monitoring system: Development and application in key rice producing areas in Tropical Asia. IOP Conf. Ser. Earth Environ. Sci. 2017, 54, 1–15. [Google Scholar] [CrossRef]
- Kang, M.G. Innovative Agricultural Insurance Products and Schemes; Agricultural Management, Marketing and Finance Occasional Paper 12; Food and Agriculture Organization of the United Nations: Rome, Italy, 2007. [Google Scholar]
- Barnett, B.J.; Black, J.R.; Hu, Y.; Skees, J.R. Is area yield insurance competitive with farm yield insurance? J. Agric. Resour. Econ. 2005, 30, 285–301. [Google Scholar]
- Saint, G. SPOT 4 VEGETATION system: Association with high resolution data for multiscale studies. Adv. Space Res. 1996, 17, 107–110. [Google Scholar] [CrossRef]
- Justice, C.O.; Vermote, E.; Townshend, J.R.G.; Defries, R.; Roy, D.P.; Hall, D.K.; Salomonson, V.V.; Privette, J.L.; Riggs, G.; Strahler, A.; et al. The moderate resolution imaging spectroradiometer (MODIS): Land remote sensing for global change research. IEEE Trans. Geosci. Remote Sens. 1998, 36, 1228–1249. [Google Scholar] [CrossRef]
- Didan, K. MOD13Q1 MODIS/Terra Vegetation Indices 16-Day L3 Global 250m SIN Grid V006. NASA EOSDIS Land Processes DAAC, 2015. Available online: https://lpdaac.usgs.gov/node/844 (accessed on 20 March 2017).
- Rouse, J.W., Jr.; Haas, R.H.; Schell, J.A.; Deering, D.W. Monitoring the Vernal Advancement and Retrogradation (Green Wave Effect) of Natural Vegetation; Progress Report RSC 1978-1; Remote Sensing Center, Texas A&M University: College Station, TX, USA, 1973. [Google Scholar]
- Huete, A.; Didan, K.; Miura, T.; Rodriguez, E.P.; Gao, X.; Ferreira, L.G. Overview of the radiometric and biophysical performance of the MODIS vegetation indices. Remote Sens. Environ. 2002, 83, 195–213. [Google Scholar] [CrossRef]
- Torres, R.; Snoeji, P.; Geudtner, D.; Bibby, D.; Davidson, M.; Attema, E.; Potin, P.; Rommen, B.; Floury, N.; Brown, M.; et al. GMES Sentinel-1 mission. Remote Sens. Environ. 2012, 120, 9–24. [Google Scholar] [CrossRef]
- Bouman, B.A.M.; Kropff, M.J.; Tuong, T.P.; Wopereis, M.C.S.; Ten Berge, H.F.M.; van Laar, H.H. ORYZA2000: Modeling Lowland Rice; International Rice Research Institute, Los Baños, Philippines, and Wageningen University and Research Centre: Wageningen, The Netherlands, 2001. [Google Scholar]
- Anokwa, Y.; Hartung, C.; Brunette, W.; Borriello, G.; Lerer, A. Open source data collection in the developing world. Computer 2009, 42, 97–99. [Google Scholar] [CrossRef]
- Confalonieri, R.; Foi, M.; Casa, R.; Aquaro, S.; Tona, E.; Peterle, M.; Boldini, A.; De Carli, G.; Ferrari, A.; Finotto, G.; et al. Development of an app for estimating leaf area index using a smartphone: Trueness and precision determination and comparison with other indirect methods. Comput. Electron. Agric. 2013, 96, 67–74. [Google Scholar] [CrossRef]
- Boschetti, M.; Busetto, L.; Manfron, G.; Laborte, A.G.; Asilo, S.; Pazhanivelan, S.; Nelson, A. PhenoRice: A method for automatic extraction of spatio-temporal information on rice crops using satellite data time series. Remote Sens. Environ. 2017, 194, 347–365. [Google Scholar] [CrossRef]
- Campos-Taberner, M.; García-Haro, F.; Camps-Valls, G.; Grau-Muedra, G.; Nutini, F.; Busetto, L.; Katsantonis, D.; Stavrakoudis, D.; Minakou, C.; Gatti, L.; et al. Exploitation of SAR and optical Sentinel data to detect rice crop and estimate seasonal dynamics of leaf area index. Remote Sens. 2017, 9, 248. [Google Scholar] [CrossRef]
- Setiyono, T.D.; Weiss, A.; Specht, J.E.; Cassman, K.G.; Dobermann, A. Leaf area index simulation in soybean grown under near-optimal conditions. Field Crop. Res. 2008, 108, 82–92. [Google Scholar] [CrossRef]
- Boschetti, M.; Nutini, F.; Manfron, G.; Brivio, P.A.; Nelson, A. Comparative analysis of normalised difference spectral indices derived from MODIS for detecting surface water in flooded rice cropping Systems. PLoS ONE 2014, 9, e88741. [Google Scholar] [CrossRef] [PubMed]
- Jacquemoud, S.; Verhoef, W.; Baret, F.; Bacour, C.; Zarco-Tejada, P.J.; Asner, G.P.; François, C.; Ustin, S.L. PROSPECT+SAIL models: A review of use for vegetation characterization. Remote Sens. Environ. 2009, 113, S56–S66. [Google Scholar] [CrossRef]
- Baret, F.; Hagolle, O.; Geiger, B.; Bicheron, P.; Miras, B.; Huc, M.; Berthelot, B.; Niño, F.; Weiss, M.; Samain, O.; et al. LAI, fAPAR and fCover CYCLOPES global products derived from VEGETATION Part 1: Principles of the algorithm. Remote Sens. Environ. 2007, 110, 275–286. [Google Scholar] [CrossRef] [Green Version]
- Rasmussen, C.E.; Williams, C.K. Gaussian Processes for Machine Learning; The MIT Press: Cambridge, MA, USA, 2006. [Google Scholar]
- Campos-Taberner, M.; García-Haro, F.J.; Moreno, A.; Gilabert, M.A.; Sanchez-Ruiz, S.; Martinez, B.; Camps-Valls, G. Mapping leaf area index with a smartphone and Gaussian processes. IEEE Geosci. Remote Sens. Lett. 2015, 12, 2501–2505. [Google Scholar] [CrossRef]
- Setiyono, T.D.; Bastidas, A.M.; Cassman, K.G.; Weiss, A.; Dobermann, A. Nodal leaf area distribution in soybean plants grown in high yield environments. Agron. J. 2011, 103, 1–8. [Google Scholar] [CrossRef]
- Attema, E.P.W.; Ulaby, F.T. Vegetation modeled as a water cloud. Radio Sci. 1978, 13, 357–364. [Google Scholar] [CrossRef]
- Shen, S.H.; Yang, S.B.; Li, B.B.; Zhao, X.Y.; Tan, B.X.; Li, Z.Y.; Le Toan, T. Study on ENVISAT ASAR data assimilation in rice growth model for yield estimation. Int. Arch. Photogramm. Remote Sens. Spat. Inf. Sci. 2009, 37, 951–956. [Google Scholar]
- Setiyono, T.D.; Quicho, E.D.; Romuga, G.C. Rice Yield Estimation (Rice-YES) User Manual; International Rice Research Institute: Los Baños, Philippines, 2017. [Google Scholar]
- Tan, J.; Cui, Y.; Luo, Y. Global sensitivity analysis of outputs over rice-growth process in ORYZA model. Environ. Model. Sofw. 2016, 83, 36–46. [Google Scholar] [CrossRef]
- Congalton, R.G. Accuracy assessment and validation of remotely sensed and other spatial information. Int. J. Wildl. Fire 2001, 10, 321–328. [Google Scholar] [CrossRef]
- Janssen, P.H.M.; Heuberger, P.S.C. Calibration of process-oriented models. Ecol. Model. 1995, 83, 55–66. [Google Scholar] [CrossRef]
- Campos-Taberner, M.; García-Haro, F.J.; Confalonieri, R.; Martńez, B.; Moreno, A.; Sánchez-Ruiz, S.; Gilabert, M.A.; Camacho, F.; Boschetti, M.; Busetto, L. Multitemporal monitoring of plant area index in the Valencia rice district with PocketLAI. Remote Sens. 2016, 8, 202. [Google Scholar] [CrossRef]
- Campos-Taberner, M.; García-Haro, F.J.; Camps-Valls, G.; Grau-Muedra, G.; Nutini, F.; Crema, A.; Boschetti, M. Multitemporal and multiresolution leaf area index retrieval for operational local rice crop monitoring. Remote Sens. Environ. 2016, 187, 102–118. [Google Scholar] [CrossRef]
- Nelson, A.D.; Boschetti, M.; Manfron, G.; Holecz, F.; Collivignarelli, F.; Gatti, L.; Barbieri, M.; Villano, L.; Chandna, P.; Setiyono, T. Combining Moderate-Resolution Time-Series RS Data from SAR and Optical Sources for Rice Crop Characterisation: Examples from Bangladesh. In Land Applications of Radar Remote Sensing; Holecz, F., Pasquali, P., Milisavljevic, N., Closson, D., Eds.; InTech: Rijeka, Croatia, 2014. [Google Scholar]


| Parameter | Min | Max | Mean | Std | Type | |
|---|---|---|---|---|---|---|
| Canopy | LAI (m2 m−2) | 0 | 6 | 3 | 2 | Gaussian (*) |
| ALA (°) | 30 | 80 | 60 | 20 | Gaussian | |
| Hs | 0.1 | 0.5 | 0.2 | 0.2 | Gaussian | |
| vCover | 0.5 | 1.0 | 1.0 | 0.2 | Truncated Gaussian (*) | |
| Leaf | N | 1.2 | 2.2 | 1.5 | 0.3 | Gaussian |
| Cab (µg cm−2) | 20 | 90 | 45 | 30 | Gaussian | |
| Cdm (g cm−2) | 0.005 | 0.03 | 0.01 | 0.008 | Gaussian | |
| CWREL | 0.6 | 0.8 | - | - | Uniform | |
| Soil | βS | 0.30 | 1.20 | 0.90 | 0.25 | Gaussian |
| 2016 Spring Season | 2016 Summer Season | |||||||
|---|---|---|---|---|---|---|---|---|
| Survey Data | Survey Data | |||||||
| R | NR | Accuracy | R | NR | Accuracy | |||
| Classified data | R | 302 | 9 | 97.1% | R | 216 | 0 | 100% |
| NR | 31 | 86 | 73.5% | NR | 13 | 17 | 56.7% | |
| Accuracy | 90.7% | 90.5% | 90.7% | 94.3% | 100% | 94.7% | ||
| Average producers’ accuracy | 90.6% | 97.2% | ||||||
| Average users’ accuracy | 85.3% | 78.3% | ||||||
| Overall accuracy | 90.7% | 94.7% | ||||||
| Kappa Index | 0.81 | 0.89 | ||||||
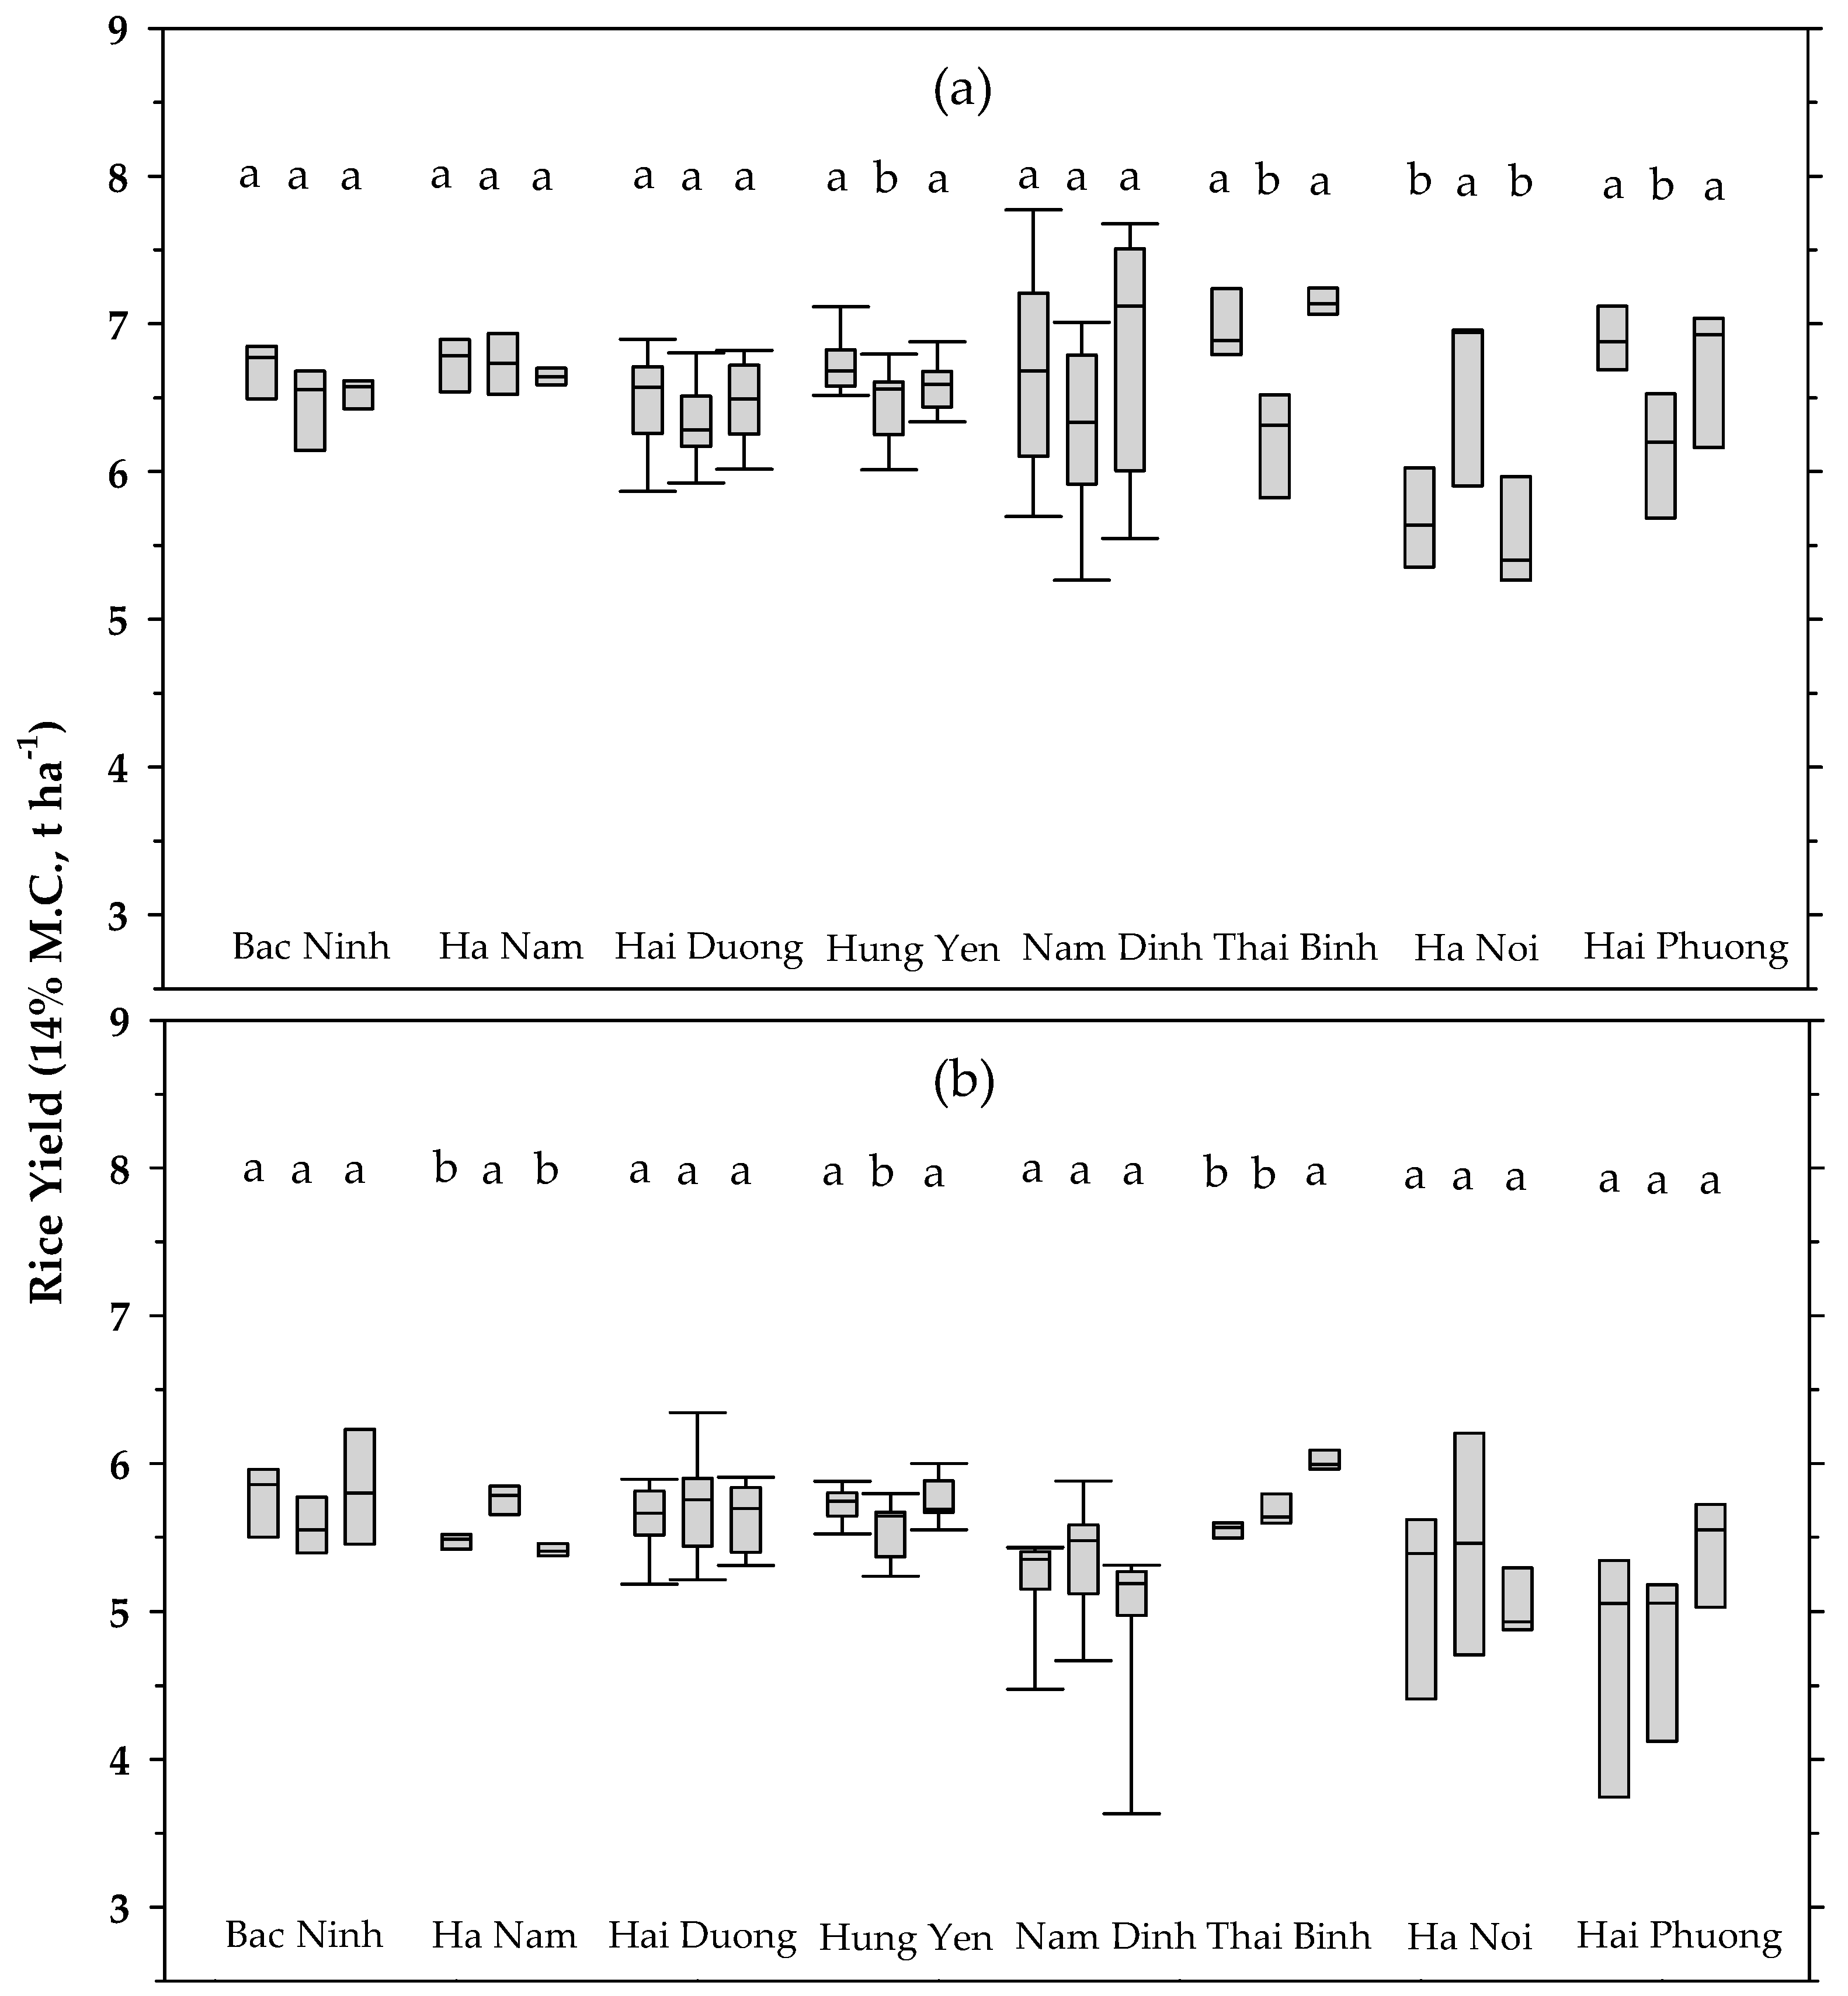
| Province | Rice Yield (14% MC) t ha−1 | |||||
|---|---|---|---|---|---|---|
| 2016 Spring Season | 2016 Summer Season | |||||
| MODIS | Sentinel-1 | Reported | MODIS | Sentinel-1 | Reported | |
| Bac Ninh | 6.71 | 6.39 | 6.50 | 5.85 | 5.60 | 5.71 |
| Ha Nam | 6.74 | 6.78 | 6.63 | 5.49 | 5.80 | 5.53 |
| Ha Noi | 5.66 | 6.81 | 6.07 | 5.56 | 5.51 | 5.52 |
| Hai Duong | 6.43 | 6.28 | 6.44 | 5.68 | 5.77 | 5.54 |
| Hai Phong | 6.84 | 6.17 | 6.95 | 5.25 | 5.11 | 5.63 |
| Hung Yen | 6.72 | 6.44 | 6.58 | 5.75 | 5.58 | 5.80 |
| Nam Dinh | 6.77 | 6.35 | 6.92 | 5.31 | 5.43 | 5.16 |
| Thai Binh | 6.94 | 6.14 | 7.14 | 5.58 | 5.66 | 5.24 |
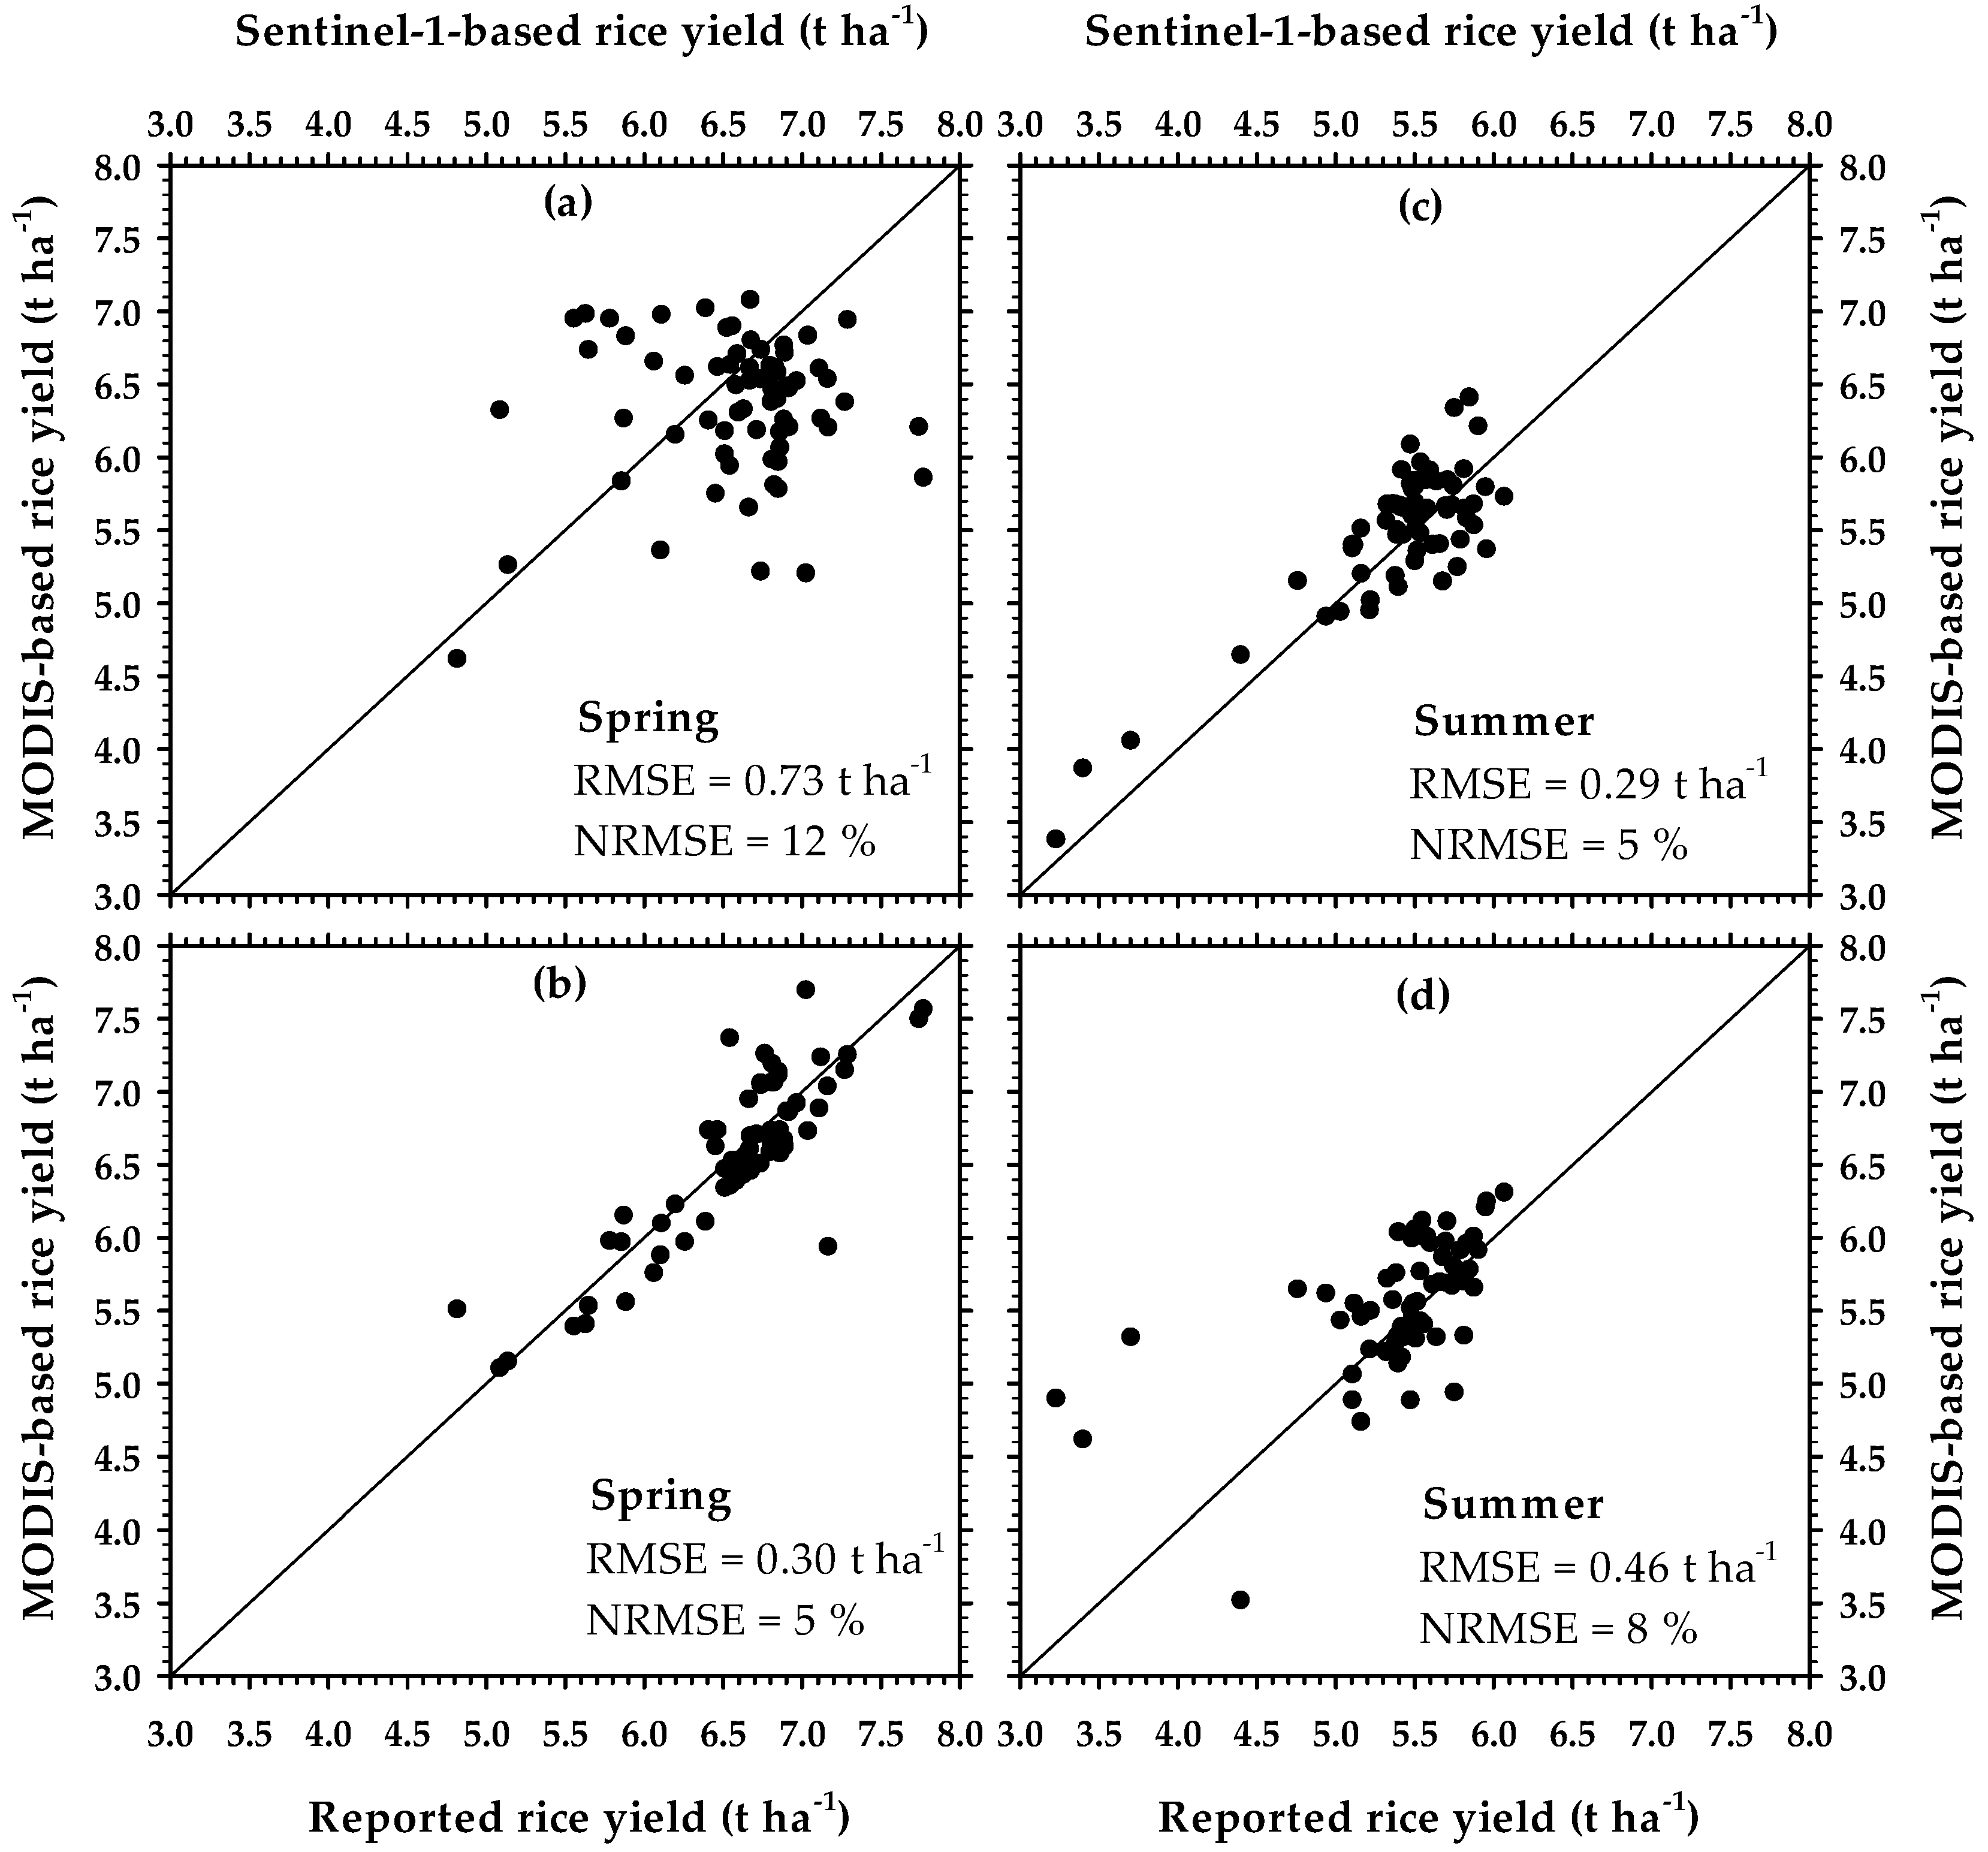
| Mean 1 | 6.60 a | 6.42 a | 6.65 a | 5.56 a | 5.56 a | 5.52 a |
| RMSE 2 (t ha−1) | 0.59 | 0.20 | 0.17 | 0.20 | ||
| NRMSE 2 (%) | 9 | 3 | 3 | 4 | ||
© 2018 by the authors. Licensee MDPI, Basel, Switzerland. This article is an open access article distributed under the terms and conditions of the Creative Commons Attribution (CC BY) license (http://creativecommons.org/licenses/by/4.0/).
Share and Cite
Setiyono, T.D.; Quicho, E.D.; Gatti, L.; Campos-Taberner, M.; Busetto, L.; Collivignarelli, F.; García-Haro, F.J.; Boschetti, M.; Khan, N.I.; Holecz, F. Spatial Rice Yield Estimation Based on MODIS and Sentinel-1 SAR Data and ORYZA Crop Growth Model. Remote Sens. 2018, 10, 293. https://doi.org/10.3390/rs10020293
Setiyono TD, Quicho ED, Gatti L, Campos-Taberner M, Busetto L, Collivignarelli F, García-Haro FJ, Boschetti M, Khan NI, Holecz F. Spatial Rice Yield Estimation Based on MODIS and Sentinel-1 SAR Data and ORYZA Crop Growth Model. Remote Sensing. 2018; 10(2):293. https://doi.org/10.3390/rs10020293
Chicago/Turabian StyleSetiyono, Tri D., Emma D. Quicho, Luca Gatti, Manuel Campos-Taberner, Lorenzo Busetto, Francesco Collivignarelli, Francisco Javier García-Haro, Mirco Boschetti, Nasreen Islam Khan, and Francesco Holecz. 2018. "Spatial Rice Yield Estimation Based on MODIS and Sentinel-1 SAR Data and ORYZA Crop Growth Model" Remote Sensing 10, no. 2: 293. https://doi.org/10.3390/rs10020293
APA StyleSetiyono, T. D., Quicho, E. D., Gatti, L., Campos-Taberner, M., Busetto, L., Collivignarelli, F., García-Haro, F. J., Boschetti, M., Khan, N. I., & Holecz, F. (2018). Spatial Rice Yield Estimation Based on MODIS and Sentinel-1 SAR Data and ORYZA Crop Growth Model. Remote Sensing, 10(2), 293. https://doi.org/10.3390/rs10020293