Vertical Displacements Driven by Groundwater Storage Changes in the North China Plain Detected by GPS Observations


1
School of Water Resources and Hydropower Engineering, Wuhan University, Wuhan 430072, China
2
Hubei Subsurface Multi-Scale Imaging Key Laboratory, Institute of Geophysics & Geomatics, China University of Geosciences (Wuhan), Wuhan 430074, China
3
School of Geodesy and Geomatics, Wuhan University, Wuhan 430079, China
4
Institute of Seismology, China Earthquake Administration & Hubei Earthquake Administration, Wuhan 430071, China
*
Author to whom correspondence should be addressed.
Remote Sens. 2018, 10(2), 259; https://doi.org/10.3390/rs10020259
Submission received: 19 December 2017
/
Revised: 1 February 2018
/
Accepted: 4 February 2018
/
Published: 7 February 2018
(This article belongs to the Special Issue Multi-Constellation Global Navigation Satellite Systems: Methods and Applications)
Abstract
:The North China Plain (NCP) has been experiencing the most severe groundwater depletion in China, leading to a broad region of vertical motions of the Earth’s surface. This paper explores the seasonal and linear trend variations of surface vertical displacements caused by the groundwater changes in NCP from 2009 to 2013 using Global Positioning System (GPS) and Gravity Recovery and Climate Experiment (GRACE) techniques. Results show that the peak-to-peak amplitude of GPS-derived annual variation is about 3.7~6.0 mm and is highly correlated (R > 0.6 for most selected GPS stations) with results from GRACE, which would confirm that the vertical displacements of continuous GPS (CGPS) stations are mainly caused by groundwater storage (GWS) changes in NCP, since GWS is the dominant component of total water storage (TWS) anomalies in this area. The linear trends of selected bedrock-located IGS CGPS stations reveal the distinct GWS changes in period of 2009–2010 (decrease) and 2011–2013 (rebound), which are consistent with results from GRACE-derived GWS anomalies and in situ GWS observations. This result implies that the rate of groundwater depletion in NCP has slowed in recent years. The impacts of geological condition (bedrock or sediment) of CGPS stations to their results are also investigated in this study. Contrasted with the slight linear rates (−0.69~1.5 mm/a) of bedrock-located CGPS stations, the linear rates of sediment-located CGPS stations are between −44 mm/a and −17 mm/a. It is due to the opposite vertical displacements induced by the Earth surface’s porous and elastic response to groundwater depletion. Besides, the distinct renewal characteristics of shallow and deep groundwater in NCP are discussed. The GPS-based vertical displacement time series, to some extent, can reflect the quicker recovery of shallow unconfined groundwater than the deep confined groundwater in NCP; through one month earlier to attain the maximum height for CGPS stations nearby shallow groundwater depression cones than those nearby deep groundwater depression cones.

1. Introduction
Groundwater resources are essential to urban and agricultural needs in North China Plain (NCP), where the precipitation is low, and more than 70–80% of fresh water comes from groundwater [1], and agricultural irrigation almost consumes 70% of total water supply [2]. Historical exploitation of groundwater has caused a remarkable decline in groundwater storage (GWS) in NCP, which is referred to as groundwater depletion and has been verified by many previous studies [3,4,5,6]. Large-scale GWS changes exert loading and unloading of the Earth’s surface, inducing vertically downward and upward displacements of the Earth’s crust and uppermost mantle [7,8,9]. It should be noted that the ground surface subsidence induced by mining excavation is not discussed by this paper [10,11].
With the advances in space geodetic sensors, modern space geodetic measurements can quantify both total water storage (TWS) variations with the Gravity Recovery and Climate Experiment (GRACE) and Earth surface displacements with the Global Positioning System (GPS) [12,13,14,15]. Previous studies have provided significant insights into the seasonal and long-term vertical displacements in NCP by using GPS and GRACE data. For instance, Liu et al. (2014) [16] found that the GPS- and GRACE-derived secular trends and seasonal signals are in good agreement, respectively, with an uplift magnitude of 1–2 mm/year and a correlation of 85.0–98.5%; Wang et al. (2017) [17] identified that the average correlation and weighted root-mean-squares (WRMS) reduction between GPS and GRACE are 75.6% and 28.9%.These previous studies have focused on comparison, cross-validation of GPS, and GRACE results.
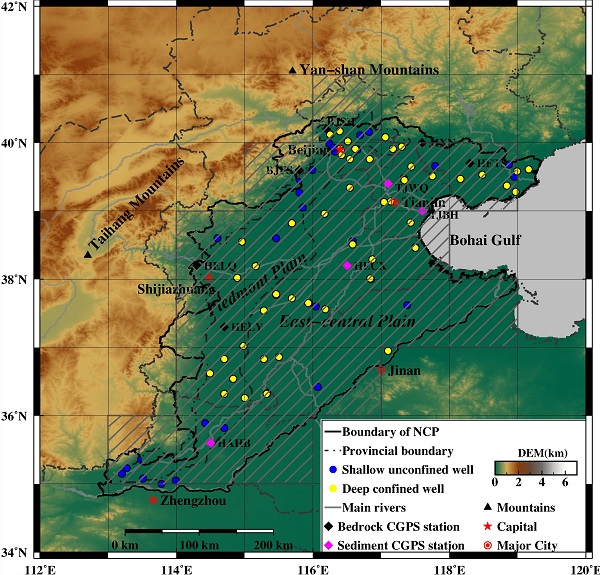
According to the distinct hydrogeological settings within the quaternary sediments [18,19], the plain area of NCP can be divided into the piedmont plain (PP) and the east central plain (ECP, alluvial and coastal plains) (Figure 1), where water supply mainly depends on shallow fresh groundwater stored in the shallow unconfined aquifers and deep confined aquifers, respectively. However, the shallow groundwater in PP and deep groundwater in ECP with different characteristics over the heterogeneous aquifer systems have not been studied either from the perspective of GPS displacement monitoring field or from the view of GRACE hydrological applications; this study attempts to explore the different influences of shallow groundwater and deep groundwater on GPS results.
In this paper, in contrast to previous studies, except for seasonal and long-term vertical displacement due to dynamic hydrological processes and groundwater depletion, the capability of GPS to detect the different impacts of shallow and deep groundwater in NCP, as well as the influence of distinct the geological conditions (bedrock or sediment) of continuous GPS (CGPS) stations, are also deeply investigated and discussed. In this study, the assessment will be based on GPS data from the Crustal Movement Observation Network of China (CMONOC, Figure 1 shows the locations of selected CGPS stations), level-2 Release-05 (RL05) GRACE data from the University of Texas Center for Space Research (UTCSR), Global Land Data Assimilation System (GLDAS) hydrologic model simulations, and in situ groundwater-level observations of both shallow unconfined and deep confined aquifers.
2. Data and Methods
2.1. GPS Data
GPS can measure the crustal deformation at millimeter-level accuracy, due to the recent improvements of GPS processing strategies [20,21]. Ten former and current CGPS stations in NCP (Figure 1) are analyzed in this study. Three of them (BJFS, BJSH, JIXN) are from the International GNSS Service (IGS), and others are from CMONOC [22]. All the CGPS stations are equipped with multi-frequency receivers, with a sampling rate of 30 s. The specific information of selected CGPS stations are listed in Table 1, including their topographic features (PP or ECP) and basement type (bedrock or sediment). In this study, the rinex files of the three IGS stations, from 2009 to 2013, are used, and that of other CGPS stations are from 2010 to 2013, since these stations began to collect data from 2010. GAMIT software 10.4 is employed in “baseline mode” to process the GPS data [23], to obtain GPS daily, loosely constrained coordinates, and covariance. In this procedure, Solid-Earth tides and pole tides are corrected by models recommended by the International Earth Rotation Service (IERS) [24]. In addition, Finite Element Solutions 2004 (FES2004) ocean tidal loading corrections and absolute phase-center corrections for satellites and antenna, as issued by International GNSS Service (IGS) [25], are used to correct corresponding errors. The tropospheric delays are modeled using the Global Mapping Function (GMF) [26] every two hours and the first order ionospheric delays are eliminated by means of the ionosphere-free linear combination. Gross error rejection is implemented to the baseline resolutions, and a sequential Kalman filter method is employed to combine regional, loosely constrained solutions with global solutions obtained from SOPAC (http://sopac.ucsd.edu) using GLOBK software 10.4. Finally, the datum transformation is performed to obtain a station coordinate time series with respect to the ITRF2008 using 45 global distributed IGS stations [27]. According to the above GPS data processing strategy, the daily vertical coordinate time series of the selected CGPS stations is obtained.
2.2. TWS and GWS Variations Derived from GRACE
Spherical harmonic coefficients of the Earth’s gravity field estimated from GRACE data [28,29] and load Love numbers can be used to model the TWS variations [30] and vertical surface displacements [31] caused by changing water mass loading. The monthly GRACE Level-2 RL05 solution GSM gravity data product, in the form of spherical harmonic coefficients (SHCs) provided from the UTCSR, whose period is from January 2009 to December 2013, up to degree 96, are used. C20 terms are replaced with the results from observations of Satellite Laser Ranging [32]. Due to the fact that the reference frame origin used in the GRACE gravity field determination is the Earth’s center of mass, GRACE gravity field cannot determine the degree-1 terms variations (geocenter motion), whereas GPS data contain degree-1 terms; therefore, in order to be consistently comparable to the GPS time series, we replace the degree-1 components in GRACE with the results derived by Swenson et al. (2008) [33].
First, the average mean gravity field model between 2009 and 2013 is removed from the data product. Then, the destriping method P3M6 of Chen et al. (2007) [34] and Gaussian smoothing with averaging radius of 300 KM are employed to the SHCs of the gravity fields, in the purpose of reducing the north-south stripes and errors at high degrees. Finally, the TWS variations, in the form of equivalent water height, and vertical surface displacements due to changes in mass loading, can be, respectively, expressed in terms of residual SHCs of gravity field and load Love numbers as follows [30,31]:
in which and are the variation of equivalent water height and surface displacement in the radial direction at geocentric colatitude and geocentric longitude , respectively; and are the mean radius and density of the Earth, respectively; is water density; is fully normalized Legendre function of degree and order ; and represent the residual spherical harmonic coefficients of the destriped and smoothed gravity field from which the average gravity field between 2009 and 2013 have been removed; and are Load Love numbers at degree . Here, the load Love numbers from Farrell [7] are adopted.
Since GRACE observations at small scale regions tend to be attenuated in the post-processing of smoothing, the modeled TWS should be adjusted by scaling factors. Four land surface models (LSMs: Community Land Model, Mosaic, Noah, and Variable Infiltration Capacity model) in GLDAS version 1 [35] are used to calculate scaling factors, by calculating the ratio between the original true TWS and the truncated and filtered TWS [36]. In this study, the average scaling factor in NCP is about 1.22.
At monthly or longer time scales, soil water storage (SWS) and GWS changes account for the majority of TWS changes in NCP; other components such as the snow water equivalent are negligible [4]. Therefore, GWS anomalies are obtained by subtracting the SWS anomalies simulated by hydrologic models from the adjusted GRACE TWS anomalies. The SWS anomalies are also estimated by using the average of simulated soil moisture data (2009–2013) from the four LSMs in GLDAS.
2.3. In Situ Groundwater LEVEL MEASUREMENTS
The in situ monthly groundwater level measurements are obtained from daily observations from 107 monitoring well stations in NCP from 2009 to 2013, including 47 shallow unconfined wells and 60 deep confined wells (provided by Institute of China Geological Environment Monitoring). The groundwater data adopted in this study can provide more spatial details of shallow and deep GWS variations compared with that used in previous similar study of Wang et al. (2017) [17], which contained the monthly groundwater table depth of 20 cities, most of them from a shallow unconfined well. As shown in Figure 1, shallow unconfined wells are mainly distributed in PP, while deep confined wells are mainly located in ECP. We obtain in situ GWS variations by multiplying in situ-measured groundwater level anomalies with the specific yield of each well as obtained from the spatial distribution map of specific yields in NCP provided by the China Geological Survey Bureau [37]. The distribution of the specific yield in NCP ranges widely from ˂0.05 in the coastal plain around the margin of the Bohai Sea to ˃0.2 in the piedmont region of the Taihang Mountains. Based on the isopleth map of specific yields in the NCP and the locations of monitoring well, we conclude that a reasonable range of average values for specific yields was 0.05~0.07, which we use to estimate GWS variations.
3. Results and Discussion
3.1. Seasonal and Secular Signals Revealed by GPS and GRACE
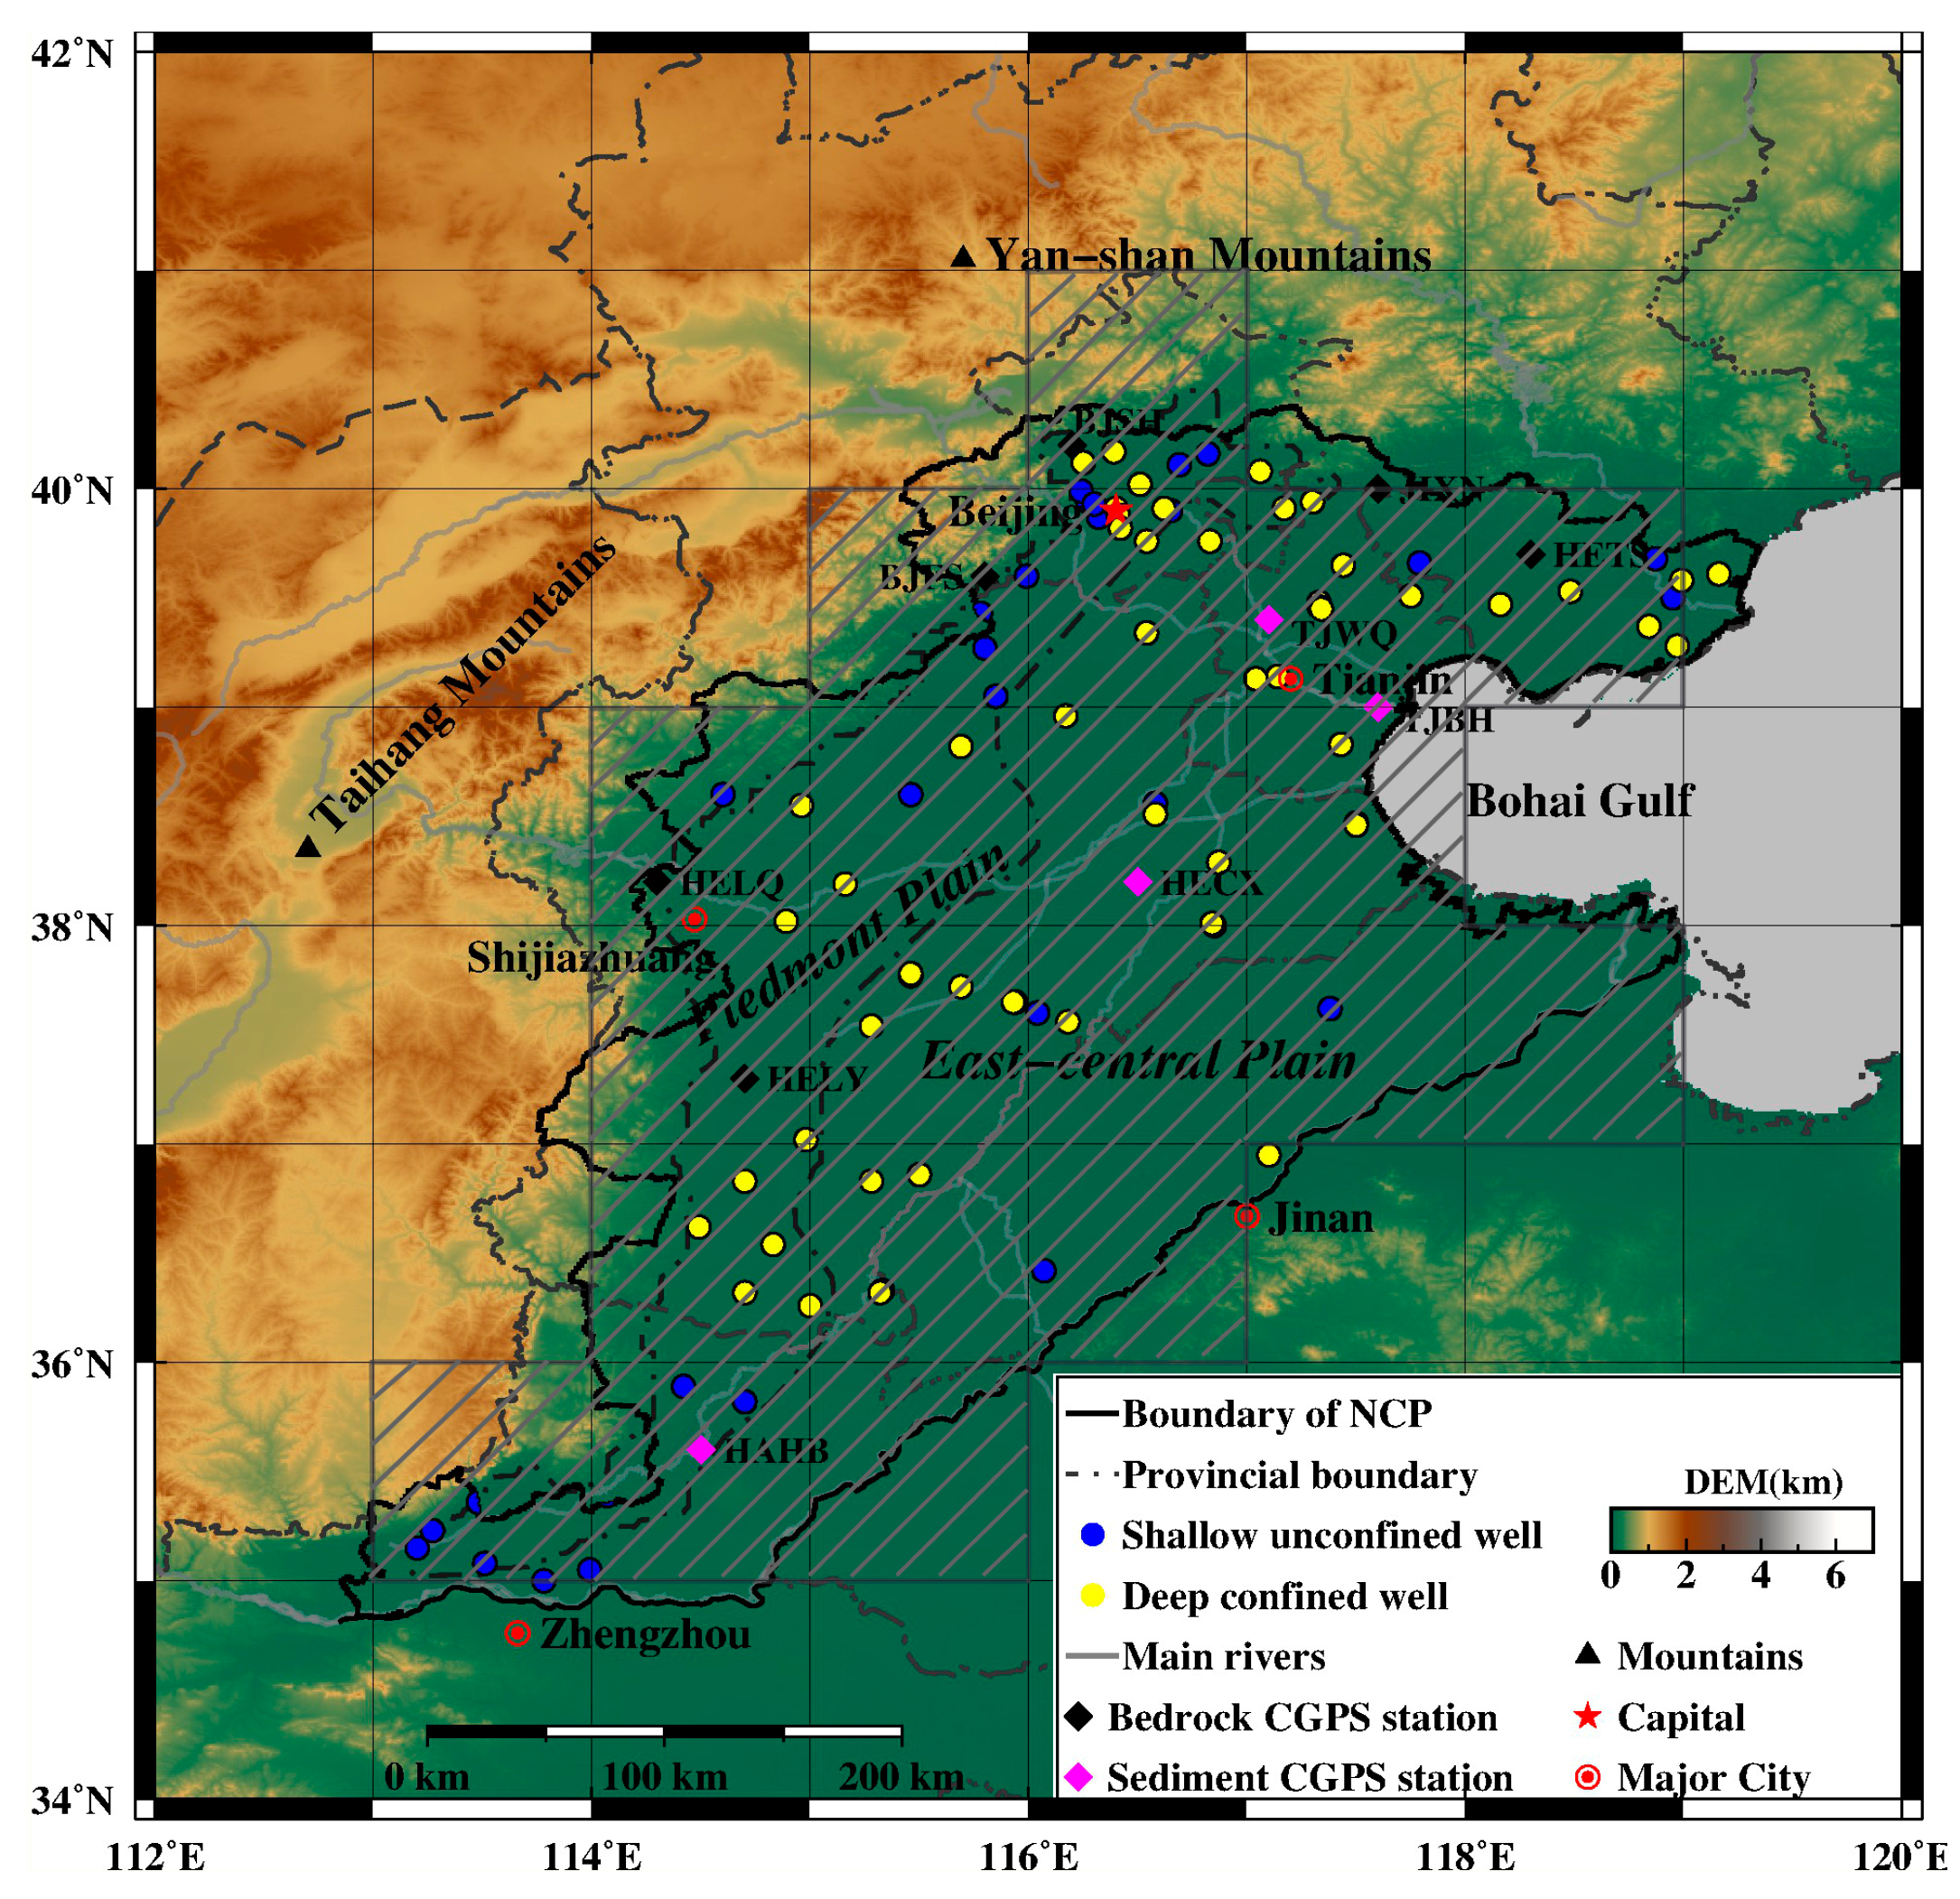
The GPS-measured and GRACE-modeled [31] vertical displacements are fitted with an empirical model including epoch position, speed, and the amplitude and phase of annual and semiannual harmonic components (to model seasonal effects) using least-squares method [38] over the time span from 2009 to 2013. Moreover, the offsets caused by identified equipment changes and earthquakes are removed in GPS analysis, and only stations with, at least, two-and-a-half years of data are included. As shown in Figure 2, both GPS and GRACE results show apparent seasonal variations. GPS and GRACE record coherent vertical crustal seasonal variations from 2009 to 2013 with a high correlation for most selected CGPS stations (R > 0.6, except for BJSH and TJBH) (Table 2). For BJSH and TJBH stations, it can be inferred from Figure 2 (left) that the low correlations are mainly caused by the disagreements in the phases of GPS- and GRACE-derived results. These inconsistences of phases reflect the different local sensitivity of the two techniques. The good correlation between these two geodetic measurements confirms that the seasonal crustal deformation in NCP is mainly caused by the seasonal hydrological mass loading variations, which can be resolved by geodetic measurements of both GPS and GRACE. For all the selected CGPS stations, the annual component is more dominant than the semi-annual one (Figure 2). The peak-to-peak amplitude of GPS- and GRACE-derived annual variation is about 3.7~6.0 mm and 2.5~3.3 mm, respectively (Table 2), which is about two and three times of semi-annual amplitude. Therefore, the following discussions are focused on annual variations.
Table 2 shows the peak-to-peak amplitudes and initial phases of annual vertical displacements derived by GPS and GRACE. The amplitude of annual variation derived from GPS (3.7~6.0 mm) is slightly higher than that from GRACE (2.5~3.3 mm) for all the selected CGPS stations. This is because GPS observes all the earth surface deformation induced by tectonic and non-tectonic (hydrology, atmosphere, ocean et al.) factors, while GRACE just models the hydrological component. Compared to GPS solutions, the spatial coherence of phases from GRACE solutions is more apparent, which indicates that GPS has a strong sensitivity for local surface loading, while the spatial resolution for GRACE is several hundred kilometers. This is also the reason for the small difference of GRACE-derived vertical displacements among selected stations. Besides, the fitting results in Table 2 show that the linear trend rate of GRACE-derived vertical displacements for the whole region is 0.5~0.7 mm/a from 2009 to 2013, which reveals the TWS loss for the entire area of NCP in observation time span. However, the rate of change direction is inconsistent for different GPS stations ranging from −44.0 mm/a to 1.5 mm/a, which should be mainly due to Earth surface’s elastic and porous response to hydrological mass variations and is deeply discussed in Section 3.2.
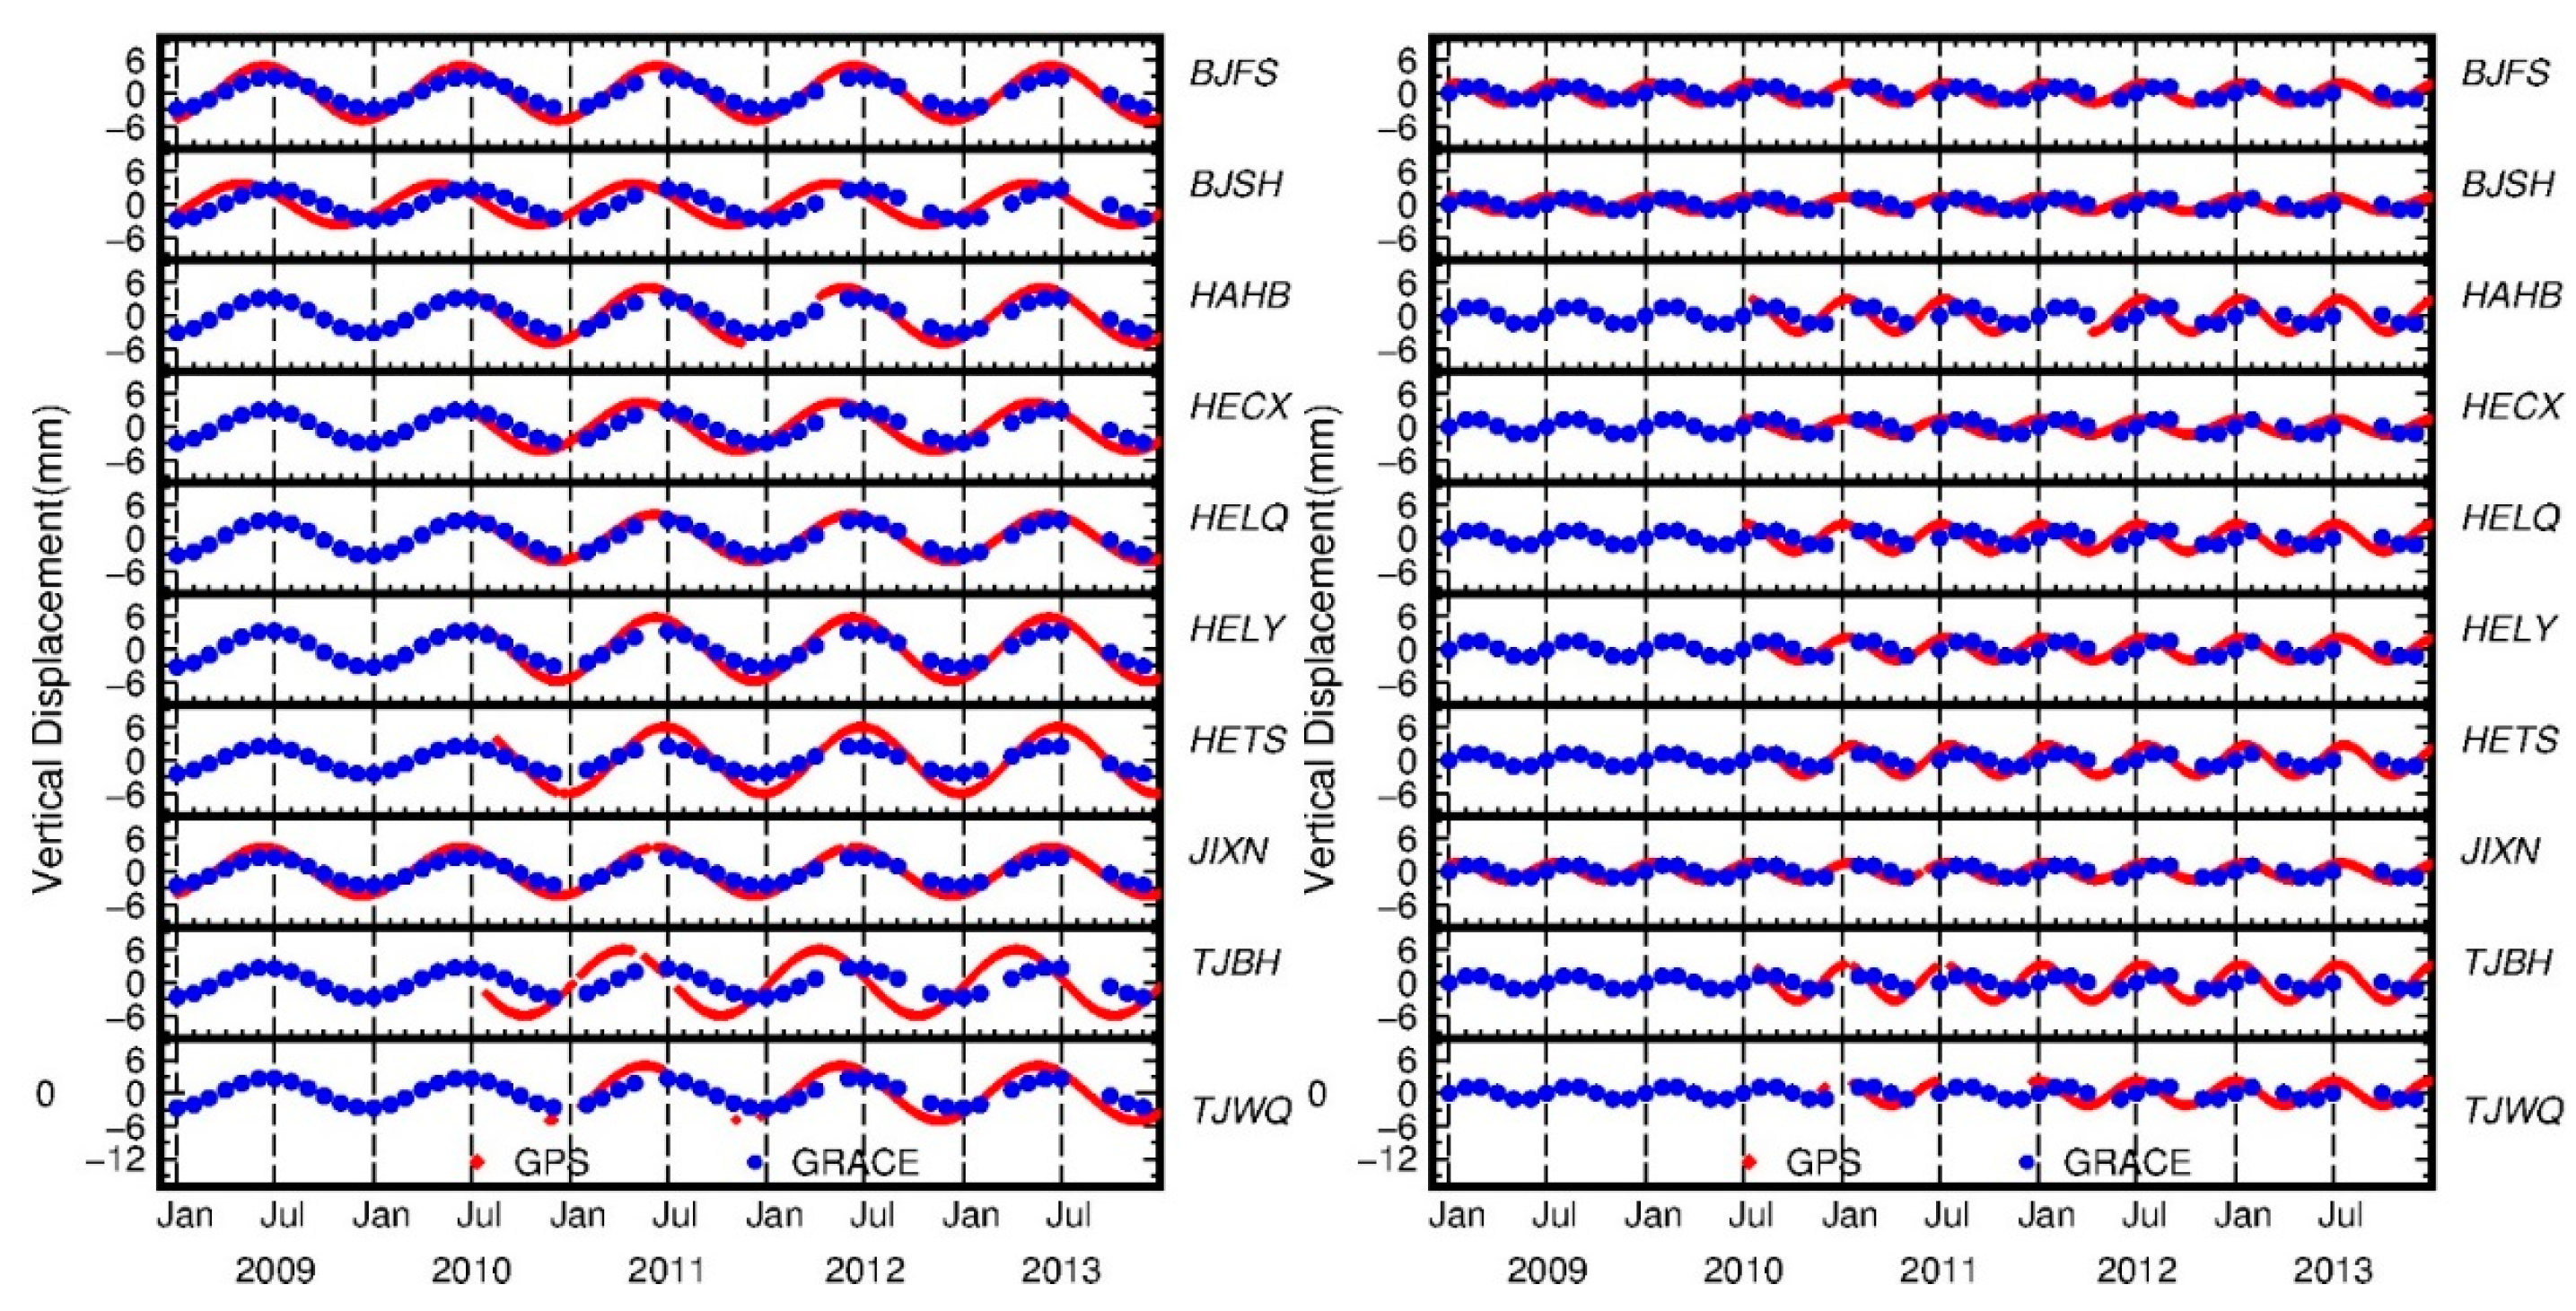
As mentioned above, the good seasonal correlation between GPS and GRACE signals indicates that the long-term uplifts revealed by GRACE solutions are probably true and mixed in the GPS measurements. Figure 3 shows the daily observations of three bedrock-located IGS CGPS stations (BJFS, BJSH, JIXN), since other CGPS stations’ data are only available after July 2010. The long-term linear trends of crustal uplift or subsidence are mainly dominated by surface mass loading and tectonic processes. The analysis of the three IGS CGPS stations (BJFS, BJSH, JIXN) suggests the slight change of linear trend around 2010. From 2009 to 2010, the linear trend of vertical displacements is uplift, which is consistent with the reported results of Wang et al. (2017) [17] and might imply the unloading of hydrological mass in NCP. However, the trend changes to lightly downward or relatively stable after the end of 2010, indicating the increase of hydrological mass loading in this area. These facts reveal that the severe water condition in NCP might has been alleviated in recent years.
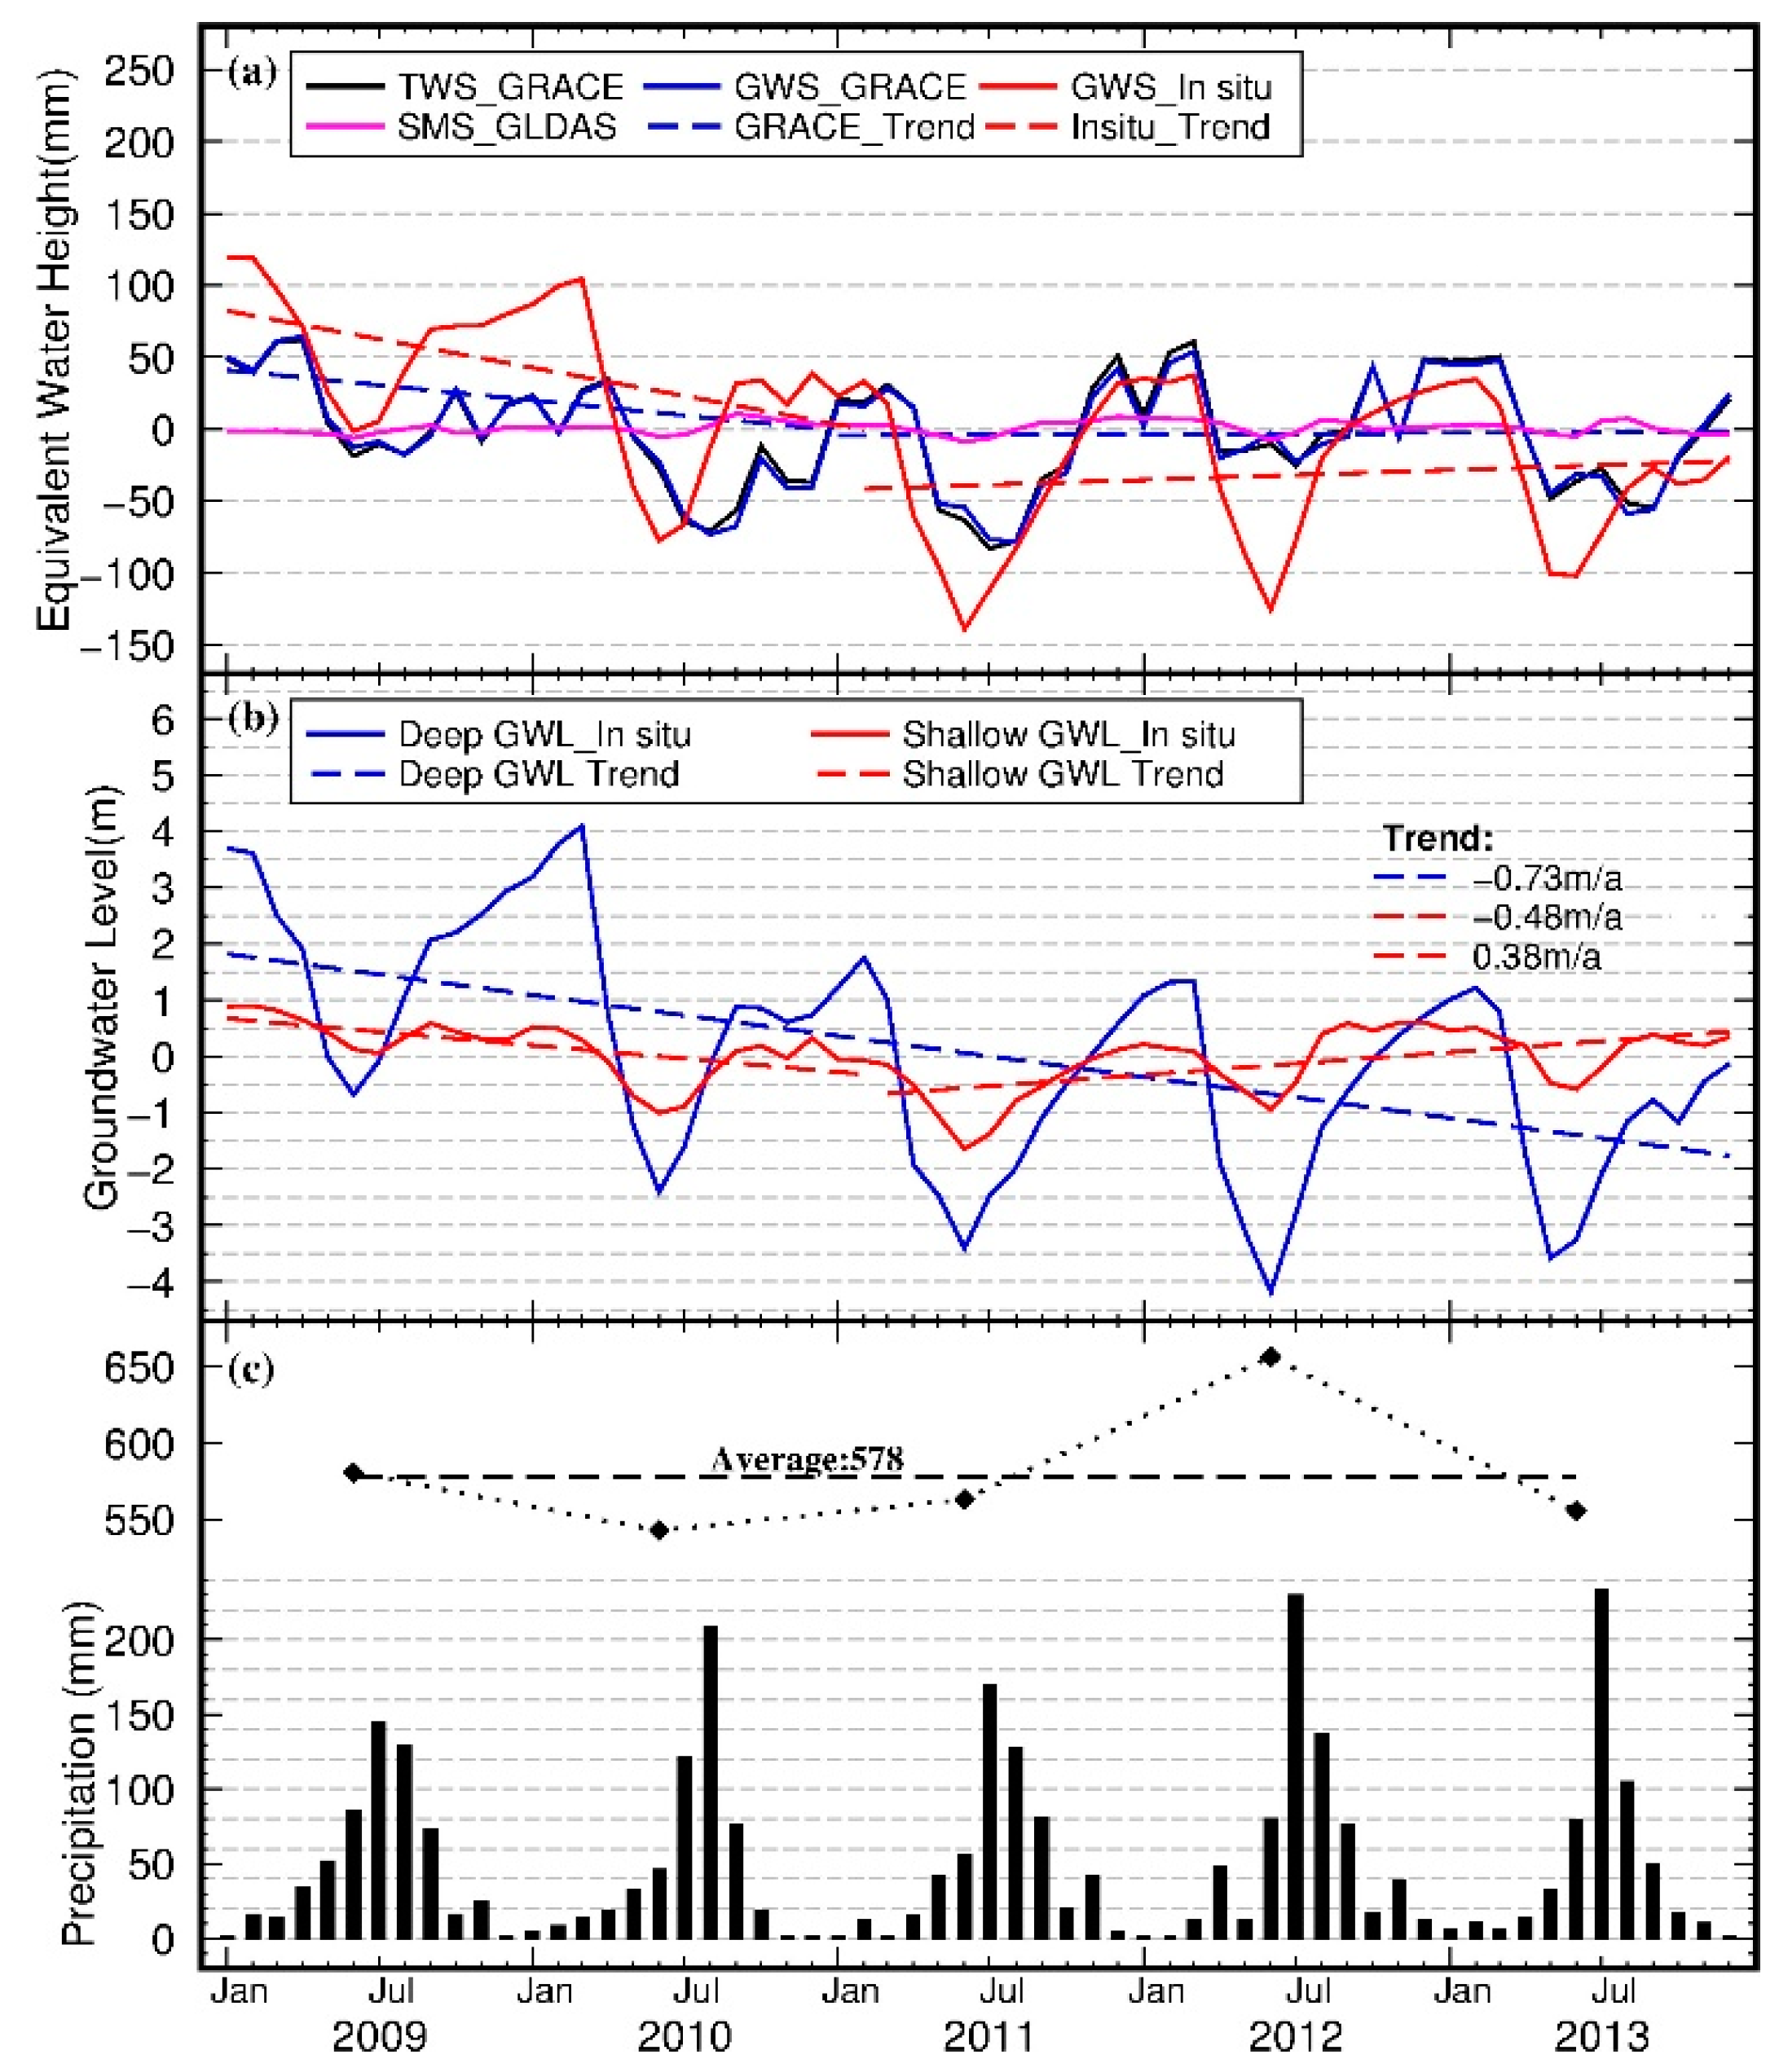
In order to verify and explain the linear trend change of three IGS CGPS results, the GRACE-derived and in situ GWS measurements are also explored. Focusing on Figure 4a, compared to GWS variation, SWS component contributes quite insignificantly to GRACE-derived TWS changes, proving that the total hydrological mass loss in NCP is mainly caused by depletion of GWS. The GRACE-derived GWS monthly anomalies in NCP are correlated with in situ-measured GWS anomalies at a coefficient of R ≈ 63 from 2009 to 2013. However, the relatively high correlation is mainly due to the agreement in the phase of variation. As presented in Figure 4a, from 2009 to 2013, both the GRACE and in situ results show a distinct feature with two distinguishable stages: Stage 1: from 2009 to 2010, with continuously decreasing trend at a rate of about −45 mm/a for both GRACE-derived GWS results and in situ-GWS observations, leading to upward vertical movement of CGPS stations (bedrock); Stage 2, from 2011 to 2013, with slightly rebounded and relatively stable for both GRACE-derived and in situ results, resulting in downward or stable vertical movement of CGPS stations (bedrock). This difference between the two sub-periods (2009–2010 and 2011–2013) could be mainly induced by climate-driven precipitation annual variations in NCP (Figure 4c) and partially owing to the impacts of the implementation of the South-to-North Water Diversion (SNWD) project since 2003, which reflect the influence of the SNWD project on reducing GWS depletion in NCP. Some previous literatures also reported positive impacts on GWS recovery in NCP [39].
3.2. Impacts of Bedrock and Sediment Basement to GPS Results
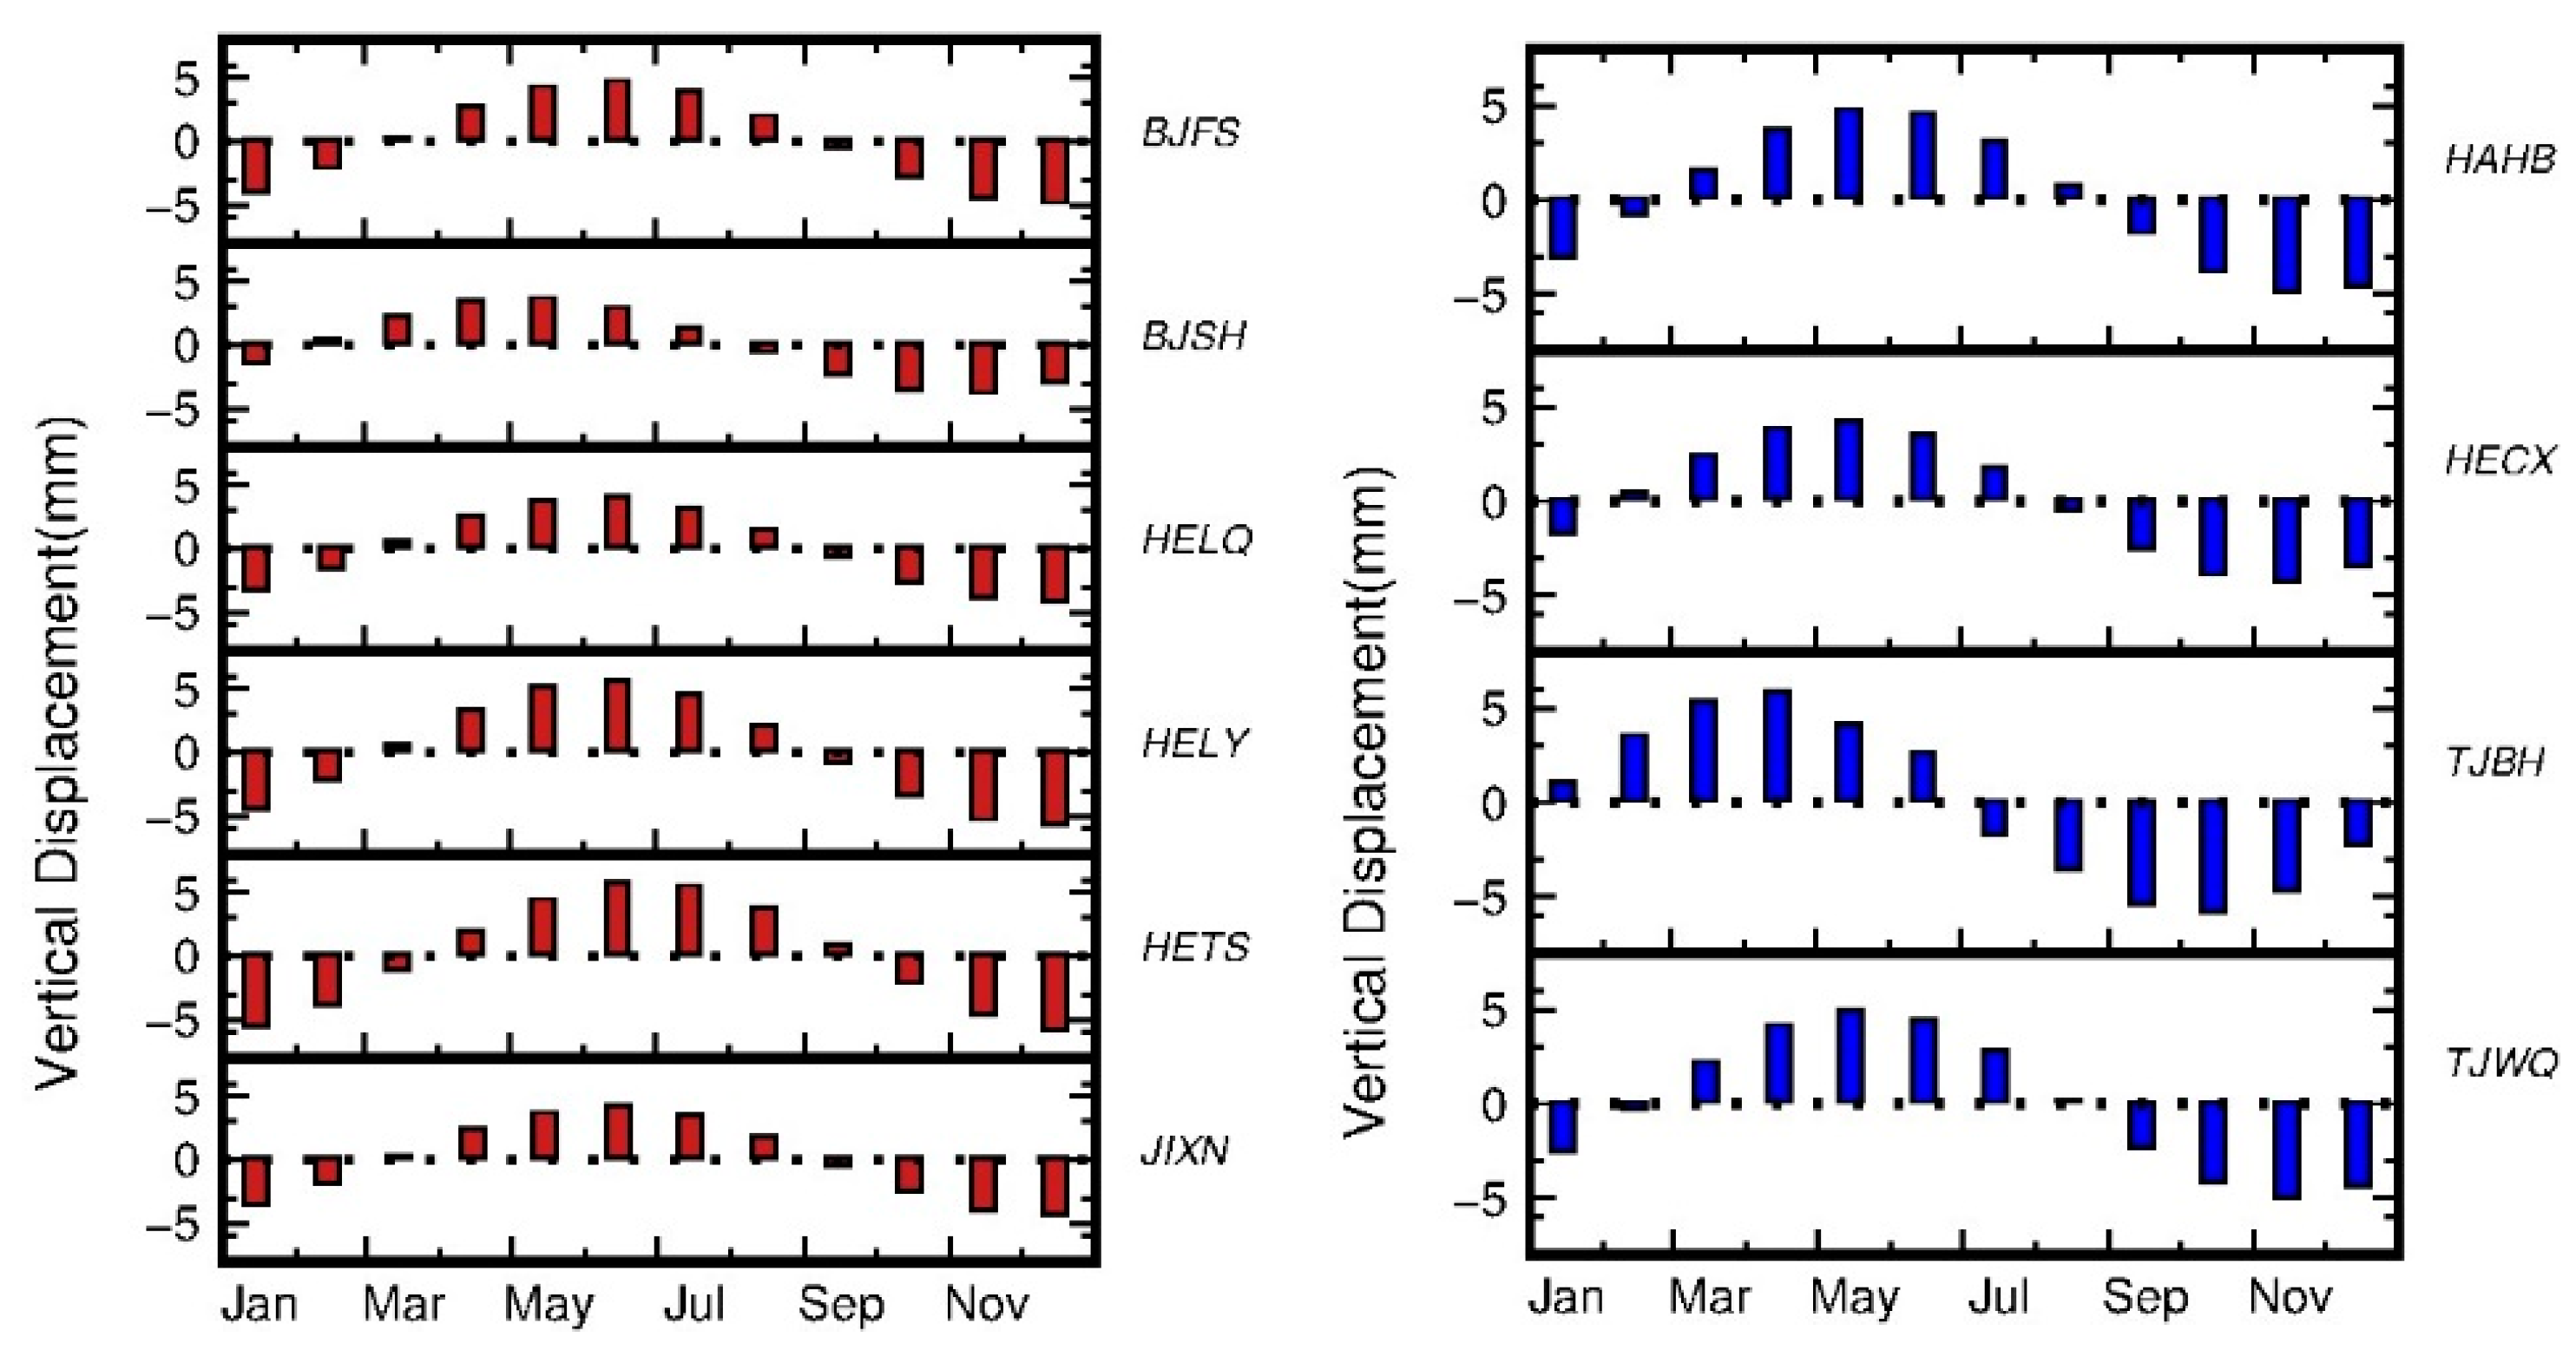
As presented in Table 1, except for HAHB, HECX, TJBH, and TJWQ stations, which are located on soft sediment and mainly distributed over the ECP area, the other CGPS stations are located on bedrock throughout the PP area and north part of ECP. Their monthly vertical displacement variations are displayed in Figure 5. For most bedrock-located CGPS stations (red bars, except for BJSH), whose vertical displacements mainly reflect elastic response of solid Earth’s surface to the loading of hydrological masses in this area, the maximum height occurs around early summer (June), and a minimum height takes place around early winter(December). This temporal pattern of vertical displacement should be mainly determined by the composite impact from agricultural groundwater extraction and climate factors. On one hand, over the whole region of NCP, especially the PP area, water-consumptive winter wheat is widely cultivated and agriculture is highly supported by artificial irrigation, which contribute greatly to groundwater depletion, as Hu et al. (2016) [40] reported that the correlation coefficients between irrigation amount and groundwater level anomalies is about −0.7. In addition, Tan et al. (2012) [41] showed that the maximum agricultural irrigation is concentrated in February to May in this region. On the other hand, precipitation is mainly focused on July and August (Figure 4c), which is stored in aquifers for next spring due to the lower irrigation requirement in those months. Hence, the vertical displacement due to groundwater loading displays a clear seasonal pattern of upward trend from January to June, when the groundwater is continuously extracted for irrigation, and downward trend from July to December, when the groundwater is recharged and accumulated from precipitation.
By contrast, sediment-located CGPS stations (blue bars) respond differently. Those stations attain their maximum height from April to May and minimum height from October to November, about one to two months earlier compared to bedrock-located CGPS stations, which are likely to be attributed to the conjunctive impacts of elastic and porous response of Earth’s surface to groundwater variation. Except for elastic response to groundwater loading and unloading, due to soil pore compression, the Earth’s surface rises when the aquifer is recharged with water and subsides when the groundwater is withdrawn from the aquifer [42], which is opposite to Earth’s elastic response to the loading of groundwater and could obfuscate the effects of hydrological mass variation on position [43,44]. For the CGPS stations located on soft sediment, their vertical positions record not only the Earth’s elastic deformation to groundwater mass loading and unloading, but also the porous response associated with groundwater filling and emptying the aquifers. Thus, for these stations, their vertical displacement variations reflect both elastic and porous responses of Earth’s surface to groundwater changes, while bedrock-located CGPS stations mainly reveal the elastic response. In our study, the five of six bedrock-located CGPS stations in NCP attain their maximum heights at the time of early summer when groundwater is minimum due to large pumping for agricultural usage and low recharge from rainfall, while all the sediment-located CGPS stations attain their maximum heights in late spring, due to opposite influence from Earth’s surface elastic and porous response to groundwater changes.
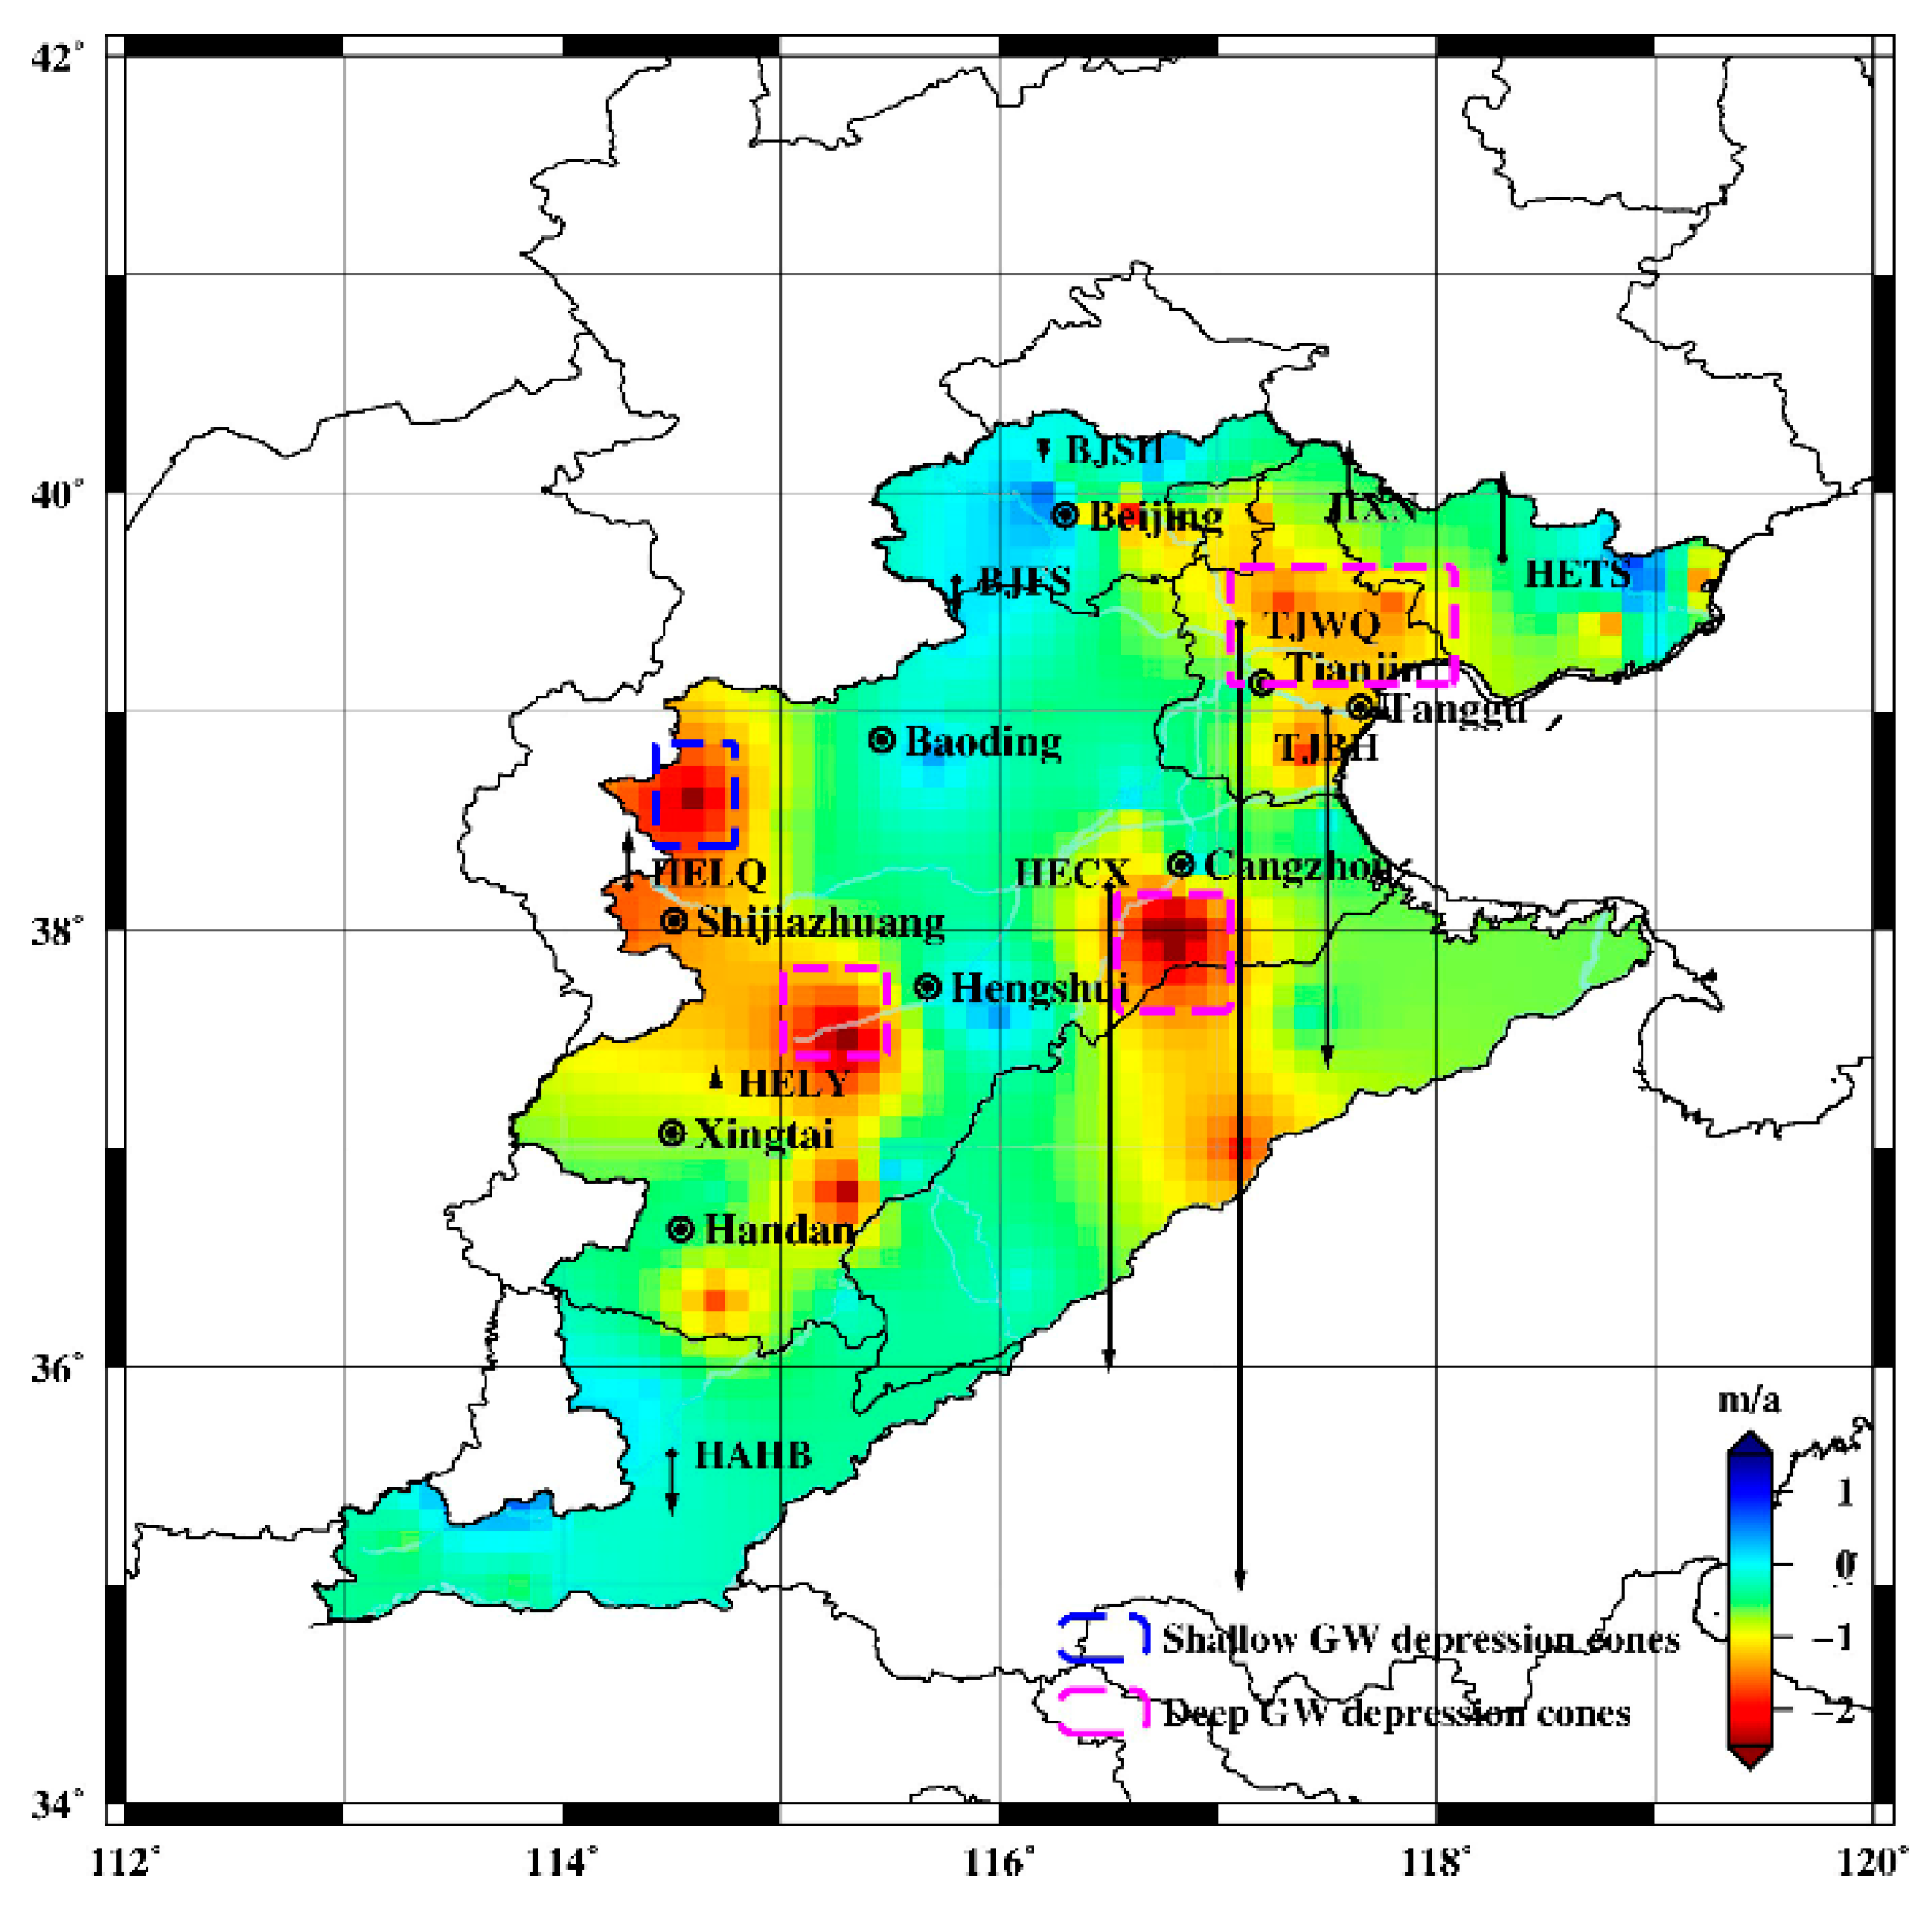
Figure 6 shows distribution of groundwater depression cones across NCP. Shallow groundwater depression cones are mostly distributed in the PP area near Shijiazhuang, while the deep groundwater depression cones are primarily located in ECP, near Cangzhou, Hengshui, and Tianjin. The linear trend of vertical displacements at individual CGPS stations is also shown in Figure 6, the uplift or subsidence of which is distinct in different areas. Most selected bedrock-located CGPS stations in PP and north part of ECP show slight secular trend of −0.69~1.5 mm/a from 2009/2010 to 2013. However, sediment-located CGPS stations in ECP (HECX, TJBH, and TJWQ) show significant subsidence vertical rate at −44~−17 mm/a. The three CGPS stations are located on soft sediments and along the margins of deep groundwater depression cones, near Tianjin or Cangzhou, which have been suffering the most severe groundwater depletion in these areas [45] (Hu et al., 2004). For these stations, as discussed above, their GPS vertical position record both earth’s elastic deformation associated with changes in GWS and pore compaction of groundwater depletion. Hence, it could be concluded that, for the sediment-located stations nearby deep groundwater depression cones, the subsidence caused by pore compaction are much larger than the elastic uplift induced by groundwater depletion. This indicates that the groundwater depletion in deep confined aquifers is the major triggering factor for inducing land subsidence in middle-east plain of NCP, which is consistent with the reported results of Guo et al. 2015 [46].
3.3. Characteristics of Shallow and Deep Groundwater Changes in NCP
Figure 4b shows the monthly variation of deep confined groundwater level and shallow unconfined groundwater level. The rate of shallow groundwater decreases at a rate of −0.48 m/a till the end of 2010 and then rebounds, while deep groundwater declines at a rate of −0.73 m/a up to the end of 2012, indicating that deep groundwater suffers more severe groundwater depletion than shallow groundwater in NCP, which is in agreement with reported results of Hu et al. (2016) [40]. For a better investigation of the shallow and deep groundwater variability, we further compare the in situ groundwater level observations with precipitation. As shown in Figure 4c, the long-term mean precipitation in NCP is 578 mm. The shallow groundwater level decreases when the annual precipitation in NCP is less than the long-term mean (e.g., 2009–2010), whereas it increases when precipitation exceeds the long-term mean (e.g., 2011–2012). The fluctuation of shallow groundwater level consists with the variation of precipitation. For deep groundwater, the situation is quite different; the deep groundwater level continued declining from 2009 to 2012. Overall, it implies that the shallow GWS variability is largely regulated by precipitation, while the deep GWS variability in NCP is less influenced.
The corresponding response of GPS results is the difference between the times when their displacements reach peak value. In order to avoid the influence of geological condition (bedrock or sediment) of CGPS stations, here the discussion is only focused on the bedrock-located CGPS stations. As shown in Figure 5, some CGPS (e.g., BJSH) stations located in PP attain their peaks about one month earlier than the ones (e.g., HETS) located in ECP, which is most likely due to the different depletion situation and renewal characteristics over the heterogeneous aquifers in PP and ECP. For piedmont plain, which is at the feet of Taihang Mountains, the water supply is mainly from the shallow fresh groundwater stored in the upper unconfined aquifers and is largely influenced by precipitation, as discussed before. Besides, the stations in this area can receive more lateral recharge from the Taihang Mountains than the stations in east central plain due to the decrease of hydraulic gradients and transmissivity from the west to east in NCP [39]. We can conclude that, compared with ECP areas, the PP areas are easier to recover from the groundwater extraction because they are more regulated by precipitation and receive more lateral recharge from Taihang Mountains. Therefore, the minimum and maximum of hydrologic mass loading in PP occur earlier than those of ECP, leading to the peak values of some CGPS stations in PP arriving earlier than the ones in ECP.
4. Conclusions
This study demonstrates the potential of GPS to detect vertical displacements induced by groundwater depletion over the heterogeneous aquifers in North China Plain (NCP). Comparisons between GPS-measured and GRACE-modeled seasonal vertical deformation show good correlation after correcting the bias error of GRACE data using the multiplicative factor, which confirms that the seasonal vertical displacements in NCP are mainly caused by groundwater mass loading variation, since the TWS anomalies are mainly caused by GWS variations in this area.
The seasonal vertical displacements of individual CGPS stations reflect the groundwater pumping activities for agriculture irrigation in spring, leading to less water storage in summer than in winter. The extraction of groundwater causes two processes: one is the land subsidence due to compaction of sediments in the aquifer, while the other is the uplift due to the reduction of the surface loading. In our study, the first process probably affects sediment stations rather than bedrock stations. Thus, the linear trend rate of the sediment-located CGPS stations is decreasing and mostly higher (−44~−17 mm/a) than the slight uplift or subsidence rate (−0.69~1.5 mm/a) of the other bedrock-located CGPS stations. Besides, the geological condition (bedrock or sediment) in CGPS stations, as well as their geographical location (PP or ECP) with distinct characteristics of shallow and deep groundwater renewal, differ with regard to the time when CGPS stations attain their maximum height, which has been discussed in Section 3. Both of the GRACE-derived and in situ-observed GWS anomalies show apparent variation from “obviously declining” (2009–2010) to “relatively stable” (2011–2013) in NCP, which also could be inferred from the linear trend changes of vertical displacements of three IGS CGPS stations. These results imply the slowdown of groundwater depletion rate in recent years. Overall, GPS-derived vertical displacements have the ability to detect groundwater variations in NCP. Moreover, to some extent, their result can reveal the distinguished characteristics of groundwater changes in different sub-regions.
Acknowledgments
The authors gratefully appreciate China Earthquake Administration for the GPS data of Crustal Movement Observation Network of China (CMONOC) and NASA via the Center of Space Research (CSR) team for their online accessible monthly GRACE solutions. This research is financially supported by National Natural Science Foundation of China (NSFC) (Grant Nos. 41504016 and 41674017), the Fundamental Research Funds for the Central Universities (Grant No. 2042015kf0021), and Basic Research Foundation 14-02-01 of Key laboratory of Geospace Environment & Geodesy of Ministry of Education, Wuhan University.
Author Contributions
Renli Liu performed main data processing, analysis, and wrote the main manuscript text; Rong Zou provided the technical guidance to the implementation of GAMIT software on GPS data pre-processing and contributed to the revised manuscript; Jiancheng Li provided critical comments and contributed to the final revision of the paper; Caihong Zhang, Bin Zhao, and Yakun Zhang helped with the data processing.
Conflicts of Interest
The authors declare no conflict of interest.
References
- China Water Resources Bulletin. Ministry of Water Resources of China (MWR), Beijing. Available online: http://www.mwr.gov.cn/sj/tjgb/szygb/ (accessed on 19 December 2017).
- Zheng, C.; Liu, J.; Cao, G.; Kendy, E.; Wang, H.; Jia, Y. Can China Cope with Its Water Crissis?-Perspective from the North China Plain. Ground Water 2010, 48, 350–354. [Google Scholar] [CrossRef] [PubMed]
- Moiwo, J.P.; Tao, F.; Lu, W. Analysis of satellite-based and in situ hydro-climatic data depicts water storage depletion in North China Region. Hydrol. Process. 2013, 27, 1011–1020. [Google Scholar] [CrossRef]
- Feng, W.; Zhong, M.; Lemoine, J.M.; Biancale, R.; Hsu, H.T.; Xia, J. Evaluation of groundwater depletion in North China using the Gravity Recovery and Climate Experiment (GRACE) data and ground-based measurements. Water Resour. Res. 2013, 49, 2110–2118. [Google Scholar] [CrossRef]
- Tang, Q.; Zhang, X.; Tang, Y. Anthropogenic impacts on mass change in North China. Geophys. Res. Lett. 2013, 40, 3924–3928. [Google Scholar] [CrossRef]
- Jin, S.G.; Feng, G.P. Large-scale variations of global groundwater from satellite gravimetry and hydrological models, 2002–2012. Glob. Planet. Chang. 2013, 106, 20–30. [Google Scholar] [CrossRef]
- Farrell, W.E. Deformation of the Earth by surface loads. Rev. Geophys. 1972, 10, 761–797. [Google Scholar] [CrossRef]
- Becker, J.M.; Bevis, M. Love’s problem. Geophys. J. Int. 2004, 156, 171–178. [Google Scholar] [CrossRef]
- Tsai, V.C. A model for seasonal changes in GPS positions and seismic wave speed due to thermoelastic and hydrologic variations. J. Geophys. Res. 2011, 116. [Google Scholar] [CrossRef]
- Wang, T.; Zhou, W.; Chen, J.; Xiao, X.; Li, Y.; Zhao, X. Simulation of hydraulic fracturing using particle flow method and application in a coal mine. Int. J. Coal Geol. 2014, 121, 1–13. [Google Scholar] [CrossRef]
- Wang, T.; Hu, W.; Elsworth, D.; Zhou, W.; Zhou, W.; Zhao, X.; Zhao, L. The effect of natural fractures on hydraulic fracturing propagation in coal seams. J. Pet. Sci. Eng. 2017, 150, 180–190. [Google Scholar] [CrossRef]
- Davis, J.L.; Elósegui, P.; Mitrovica, J.X.; Tamisiea, M.E. Climate-driven deformation of the solid Earth from GRACE and GPS. Geophys. Res. Lett. 2004, 31. [Google Scholar] [CrossRef]
- Van Dam, T.; Wahr, J.; Lavallée, D. A comparison of annual vertical crustal displacements from GPS and Gravity Recovery and Climate Experiment (GRACE) over Europe. J. Geophys. Res. 2007, 112. [Google Scholar] [CrossRef]
- Fu, Y.; Freymueller, J. Seasonal and long-term vertical deformation in the Nepal Himalaya constrained by GPS and GRACE measurements. J. Geophys. Res. 2012, 117. [Google Scholar] [CrossRef]
- Zou, R.; Wang, Q.; Freymueller, J.; Poutanen, M.; Cao, X.L.; Zhang, C.H.; Yang, S.M.; He, P. Seasonal hydrological loading in southern Tibet detected by joint analysis of GPS and GRACE. Sensors 2015, 15, 30525–30538. [Google Scholar] [CrossRef] [PubMed]
- Liu, R.L.; Li, J.C.; Fok, H.S.; Shum, C.K.; Li, Z. Earth Surface Deformation in the North China Plain Detected by Joint Analysis of GRACE and GPS Data. Sensors 2014, 14, 19861–19876. [Google Scholar] [CrossRef] [PubMed]
- Wang, L.; Chen, C.; Du, J.; Wang, T. Detecting seasonal and long-term vertical displacement in the North China Plain using GRACE and GPS. Hydrol. Earth Syst. Sci. 2017, 21, 2905–2922. [Google Scholar] [CrossRef]
- Wu, C.; Xu, Q.; Zhang, X.; Ma, Y.H. Palaeochannels on the North China Plain: Types and distributions. Geomorphology 1996, 18, 5–14. [Google Scholar] [CrossRef]
- Wang, G. Groundwater System in Northern China; Geological House: Beijing, China, 2010. [Google Scholar]
- Yu, S.B.; Kuo, L.C.; Punongbayan, R.S.; Ramos, E.G. GPS observation of crustal deformation in the Taiwan-Luzon region. Geophys. Res. Lett. 1999, 26, 923–926. [Google Scholar] [CrossRef]
- Dabove, P.; Manzino, A.M.; Taglioretti, C. GNSS network products for post-processing positioning: Limitations and peculiarities. Appl. Geomat. 2014, 6, 27–36. [Google Scholar] [CrossRef]
- Li, Q.; You, X.Z.; Yang, S.M. A precise velocity field of tectonic deformation in China as inferred from intensive GPS observations. Sci. China Earth Sci. 2012, 55, 695–698. (In Chinese) [Google Scholar] [CrossRef]
- Herring, T.A.; King, R.W.; McClusky, S.C. Introduction to GAMIT/GLOBK; 2015, MIT. Available online: http://www-gpsg.mit.edu/~simon/gtgk/docs.htm (accessed on 19 December 2017).
- Gérard, P.; Brian, L. IERS Conventions (IERS Technical Note; 36), Frankfurt am Main: Verlag des Bundesamts für Kartographie und Geodäsie. 2010. Available online: https://www.iers.org/IERS/EN/Publications/TechnicalNotes/TechnicalNotes.html (accessed on 19 December 2017).
- Schmid, R.; Dach, R.; Collilieux, X.; Jäggi, A.; Schmitz, M.; Dilssner, F. Absolute IGS antenna phase center model igs08.atx: Status and potential improvements. J. Geodesy 2016, 90, 343–364. [Google Scholar] [CrossRef]
- Böhm, J.; Niell, A.; Tregoning, P.; Schuh, H. Global Mapping Function (GMF): A new empirical mapping function based on numerical weather data. Geophys. Res. Lett. 2006, 33. [Google Scholar] [CrossRef]
- Altamimi, Z.; Collilieux, X.; Métivier, L. ITRF2008: An improved solution of the international terrestrial reference frame. J. Geodesy 2011, 85, 457–473. [Google Scholar] [CrossRef] [Green Version]
- Barzaghi, R.; Carrion, D.; Pepe, M.; Prezioso, G. Computing the Deflection of the Vertical for Improving Aerial Surveys: A Comparison between EGM2008 and ITALGEO05 Estimates. Sensors 2016, 16, 1168. [Google Scholar] [CrossRef] [PubMed]
- Lemoine, J.M.; Bruinsma, S.; Loyer, S.; Biancale, R.; Marty, J.C.; Perosanz, F.; Balmino, G. Temporal gravity field models inferred from GRACE data. Adv. Space Res. 2007, 39, 1620–1629. [Google Scholar] [CrossRef]
- Wahr, J.; Molenaar, M.; Bryan, F. Time variability of the Earth’s gravity field: Hydrological and oceanic effects and their possible detection using GRACE. J. Geophys. Res. 1998, 103, 30205–30229. [Google Scholar] [CrossRef]
- Kusche, J.; Schrama, E. Surface mass redistribution inversion from global GPS deformation and Gravity Recovery and Climate Experiment (GRACE) gravity data. J. Geophys. Res. 2005, 110. [Google Scholar] [CrossRef]
- Cheng, M.; Tapley, B.D. Variations in the Earth’s oblateness during the past 28 years. J. Geophys. Res. 2004, 109. [Google Scholar] [CrossRef]
- Swenson, S.; Chambers, D.; Wahr, J. Estimating geocenter variations from a combination of GRACE and ocean model output. J. Geophys. Res. 2008, 113. [Google Scholar] [CrossRef]
- Chen, J.L.; Wilson, C.R.; Tapley, B.D.; Grand, S. GRACE detects coseismic and postseismic deformation from the Sumatra-Andaman earthquake. Geophys. Res. Lett. 2007, 34. [Google Scholar] [CrossRef]
- Rodell, M.; Houser, P.R.; Jambor, U.; Gottschalck, J.; Mitchell, K.; Meng, C.J.; Arsenault, K.; Cosgrove, B.; Radakovich, J.; Bosilovich, M. The global land data assimilation system. Bull. Am. Meteorol. Soc. 2004, 85, 381–394. [Google Scholar] [CrossRef]
- Landerer, F.; Swenson, S. Accuracy of scaled GRACE terrestrial water storage estimates. Water Resour. Res. 2012, 48. [Google Scholar] [CrossRef]
- Zhang, M.J.; Fei, Y.H. Atlas of Groundwater Sustainable Utilization in North China Plain; China Cartographic Publishing House: Beijing, China, 2009. [Google Scholar]
- Nikolaidis, R. Observation of Geodetic and Seismic Deformation with the Global Positioning System. Ph.D. Thesis, University of California San Deigo, San Deigo, CA, USA, 2002; pp. 1–115. [Google Scholar]
- Cao, G.; Zheng, C.; Scanlon, B.R.; Liu, J.; Li, W. Use of flow modeling to assess sustainability of groundwater resources in the North China Plain. Water Resour. Res. 2013, 49, 159–175. [Google Scholar] [CrossRef]
- Hu, X.; Shi, L.; Zeng, J. Estimation of actual irrigation amount and its impact on groundwater depletion: A case study in the Hebei Plain, China. J. Hydrol. 2016, 543, 433–449. [Google Scholar] [CrossRef]
- Tan, X. The Study of Groundwater Recharge in North China Plain. Ph.D. Thesis, Wuhan University, Wuhan, China, 2012. (In Chinese). [Google Scholar]
- Galloway, D.L.; Jones, D.R.; Ingebritsen, S.E. Land Subsidence in the United States; U.S. Geological Survey: Reston, VA, USA, 1999.
- Munekane, H.; Tobita, M.; Takashima, K. Groundwater-induced vertical movements observed in Tsukuba. Geophys. Res. Lett. 2004, 31. [Google Scholar] [CrossRef]
- Ji, K.H.; Herring, T. Correlation between changes in groundwater levels and surface deformation from GPS measurements in the San Gabriel Valley. Geophys. Res. Lett. 2012, 39. [Google Scholar] [CrossRef]
- Hu, R.L.; Yue, Z.Q.; Wang, L.C.; Wang, S.J. Review on current status and challenging issues of land subsidence in China. Eng. Geol. 2004, 76, 65–77. [Google Scholar] [CrossRef]
- Guo, H.P.; Zhang, Z.C.; Cheng, G.M.; Li, W.P.; Li, T.F.; Jiao, J. Groundwater-derived land subsidence in the North China Plain. Environ. Earth Sci. 2015, 74, 1415–1427. [Google Scholar] [CrossRef]
Figure 1.
Study region of NCP with two sub-regions: the piedmont plain and the east central plain. The distribution of CGPS stations (black and magenta diamonds for bedrock and sediment CGPS stations, respectively) and groundwater level monitoring well stations of different types (blue and yellow dots for shallow unconfined and deep confined well, respectively) in the NCP are shown here. 1° × 1° GRACE grids are drawn with oblique lines, following the regional boundary. All the calculations (e.g., GRACE-derived TWS and GWS, GLDAS-modeled SWS, and precipitation) related to the region are based on the extents of GRACE grids. The background is the region’s digital elevation model (DEM) information.

Figure 2.
Annual (left) and semi-annual (right) signals (right) of vertical displacements measured by GPS and modeled by GRACE in NCP.
Figure 2.
Annual (left) and semi-annual (right) signals (right) of vertical displacements measured by GPS and modeled by GRACE in NCP.

Figure 3.
Daily observations and their linear trends (red dashed line) of the vertical displacements at three IGS CGPS stations.
Figure 3.
Daily observations and their linear trends (red dashed line) of the vertical displacements at three IGS CGPS stations.

Figure 4.
(a) The monthly time series of modeled SMS (magenta line) and GRACE-derived TWS (black line) and GWS (blue line) anomalies in NCP from 2009 to 2013. The GRACE-derived GWS anomalies are compared with that from the in situ measurements (red line); (b) observations of groundwater level (GWL) monthly anomalies of deep confined well (blue line) and shallow unconfined well (red line) during 2009 to 2013, and the blue and red dashed line are the linear trend of in situ shallow and deep GWL observations, respectively, with trend rates shown above. (c) Precipitation is shown as the annual total (Figure 4c above) and the monthly observations (Figure 4c below). The precipitation data are provided by the China Meteorological Administration (http://cdc.cma.gov.cn/).

Figure 5.
Histograms of peak uplift phase (binned by month) for selected CGPS stations in NCP, red bars for CGPS stations located on bedrock and blue bars for ones located on sediment.
Figure 5.
Histograms of peak uplift phase (binned by month) for selected CGPS stations in NCP, red bars for CGPS stations located on bedrock and blue bars for ones located on sediment.

Figure 6.
Long-term uplift or decrease rates of selected CGPS stations; note that the length of arrow is only serves as an index. The background is long-term rate of groundwater level anomalies throughout NCP, which is inferred by fitting a continuous, curved surface to the in situ groundwater level observations using GMT program Surface.


Table 1.
Specific information of selected CGPS stations.
| Station Code | Topography and Geomorphology | Station Geologic Characteristic (Basement Type) |
|---|---|---|
| BJFS | Taihang Mt. 1 (PP) | Shale, dry rock, and little slate (Bedrock) |
| BJSH | Taihang Mt. (PP) | Limestone (Bedrock) |
| HAHB | Huang-Huai-Hai Plain (PP&ECP) 2 | Subclay, and sandy soil (Sediment) |
| HECX | Huang-Huai-Hai Plain (ECP) | Sand, gravel, and clay (Sediment) |
| HELQ | Taihang Mt.’ alluvial plain (PP) | Sand, gravel, and clay (Bedrock) |
| HELY | Taihang Mt.’ alluvial plain (PP) | Sand, gravel, and clay (Bedrock) |
| HETS | Yanshan Mt. (ECP) | Ordovician/breccia limestone (Bedrock) |
| JIXN | Yanshan Mt. (ECP) | Sinian limestone (Bedrock) |
| TJBH | Bohai sea plain (ECP) | Sand, gravel, and sandy clay (Sediment) |
| TJWQ | Huang-Huai-Hai Plain (ECP) | Sand, gravel, and sandy clay (Sediment) |
1 Mt. is the abbreviation of Mountains. 2 HAHB is located on the boundary between PP and ECP.
Table 2.
Annual amplitudes and phases, linear trend fit of vertical displacements derived by GPS and GRACE for selected CGPS stations, and their correlation coefficients of annual components.
Table 2.
Annual amplitudes and phases, linear trend fit of vertical displacements derived by GPS and GRACE for selected CGPS stations, and their correlation coefficients of annual components.
| GPS Station | Annual Amplitude (mm) | Annual Phase (Days) | Trend Rate (mm/Year) 2009/2010~2013 | Correlation Coefficients | |||
|---|---|---|---|---|---|---|---|
| GPS | GRACE | GPS | GRACE | GPS | GRACE | ||
| BJFS | 4.9 ± 0.2 | 2.9 ± 0.2 | 294.4 ± 6.4 | 66.3 ± 9.6 | −0.69 ± 0.2 | 0.5 ± 0.1 | 0.87 |
| BJSH | 3.7 ± 0.2 | 2.8 ± 0.2 | 328.2 ± 4.2 | 64.3 ± 10.5 | −0.22 ± 0.2 | 0.5 ± 0.1 | 0.43 |
| HAHB | 5.0 ± 0.3 | 3.2 ± 0.3 | 310.5 ± 6.8 | 74.5 ± 11.2 | −1.1 ± 0.2 | 0.5 ± 0.1 | 0.78 |
| HECX | 4.3 ± 0.3 | 3.0 ± 0.2 | 326.0 ± 6.7 | 74.1 ± 9.8 | −21.4 ± 0.3 | 0.6 ± 0.2 | 0.62 |
| HELQ | 4.2 ± 0.3 | 3.2 ± 0.2 | 298.3 ± 10.3 | 69.0 ± 9.5 | 1.0 ± 0.3 | 0.6 ± 0.1 | 0.86 |
| HELY | 5.7 ± 0.3 | 3.3 ± 0.3 | 297.1 ± 8.1 | 71.4 ± 10.8 | 0.3 ± 0.2 | 0.7 ± 0.1 | 0.89 |
| HETS | 6.0 ± 0.3 | 2.5 ± 0.2 | 279.6 ± 12.5 | 76.3 ± 10.1 | 1.5 ± 0.3 | 0.5 ± 0.1 | 0.99 |
| JIXN | 4.3 ± 0.2 | 2.6 ± 0.2 | 295.0 ± 4.8 | 71.1 ± 9.8 | 0.9 ± 0.3 | 0.5 ± 0.1 | 0.91 |
| TJBH | 6.0 ± 0.4 | 2.7 ± 0.2 | 357.8 ± 9.8 | 76.1 ± 10.4 | −16.9 ± 0.4 | 0.6 ± 0.1 | 0.12 |
| TJWQ | 5.0 ± 0.4 | 2.8 ± 0.2 | 317.3 ± 8.1 | 72.0 ± 10.6 | −44.0 ± 0.5 | 0.6 ± 0.1 | 0.71 |
© 2018 by the authors. Licensee MDPI, Basel, Switzerland. This article is an open access article distributed under the terms and conditions of the Creative Commons Attribution (CC BY) license (http://creativecommons.org/licenses/by/4.0/).
Share and Cite
MDPI and ACS Style
Liu, R.; Zou, R.; Li, J.; Zhang, C.; Zhao, B.; Zhang, Y. Vertical Displacements Driven by Groundwater Storage Changes in the North China Plain Detected by GPS Observations. Remote Sens. 2018, 10, 259. https://doi.org/10.3390/rs10020259
AMA Style
Liu R, Zou R, Li J, Zhang C, Zhao B, Zhang Y. Vertical Displacements Driven by Groundwater Storage Changes in the North China Plain Detected by GPS Observations. Remote Sensing. 2018; 10(2):259. https://doi.org/10.3390/rs10020259
Chicago/Turabian StyleLiu, Renli, Rong Zou, Jiancheng Li, Caihong Zhang, Bin Zhao, and Yakun Zhang. 2018. "Vertical Displacements Driven by Groundwater Storage Changes in the North China Plain Detected by GPS Observations" Remote Sensing 10, no. 2: 259. https://doi.org/10.3390/rs10020259
Note that from the first issue of 2016, this journal uses article numbers instead of page numbers. See further details here.