Regional Inequality in China Based on NPP-VIIRS Night-Time Light Imagery


1
Xinjiang Institute of Ecology and Geography, Chinese Academy of Sciences, Urumqi 830011, China
2
University of Chinese Academy of Sciences, Beijing 100049, China
3
Department of Economics and Management, Yuncheng University, Yuncheng 044000, China
*
Author to whom correspondence should be addressed.
Remote Sens. 2018, 10(2), 240; https://doi.org/10.3390/rs10020240
Submission received: 11 December 2017
/
Revised: 29 January 2018
/
Accepted: 4 February 2018
/
Published: 5 February 2018
(This article belongs to the Special Issue Remote Sensing of Night Lights – Beyond DMSP)
Abstract
:Regional economic inequality is a persistent problem for all nations. Meanwhile, satellite-derived night-time light (NTL) data have been extensively used as an efficient proxy measure for economic activity. This study firstly proposes a new method for correction of the NTL data derived from the Visible Infrared Imaging Radiometer Suite (VIIRS) aboard the Suomi National Polar-orbiting Partnership (Suomi-NPP) satellite and then applies the corrected NTL data to estimate gross domestic product (GDP) at a multi-scale level in China from 2014 to 2017. Secondly, incorporating the two-stage nested Theil decomposition method, multi-scale level regional inequalities are investigated. Finally, by using scatter plots, this paper identifies the relationship between the regional inequality and the level of economic development. The results indicate that: (1) after correction, the NPP-VIIRS NTL data show a statistically positive correlation with GDP, which proves that our correction method is scientifically effective; (2) from 2014 to 2017, overall inequality, within-province inequality, and between-region inequality all declined, However, between-province inequality increased slightly. As for the contributions to overall regional inequality, the within-province inequality was the highest, while the between-province inequality was the lowest; (3) further analysis of within-province inequality reveals that economic inequalities in coastal provinces in China are smaller than in inland provinces; (4) China’s economic development plays an important role in affecting regional inequality, and the extent of influence of economic development on regional inequality is varied across provinces.

1. Introduction
Against the background of globalisation, industrialisation, and urbanisation over the past three decades, China has achieved tremendous economic growth [1]. Since 2010, China’s total GDP has overtaken that of Japan, occupying second place in the world. By the end of 2015, China’s total GDP had already reached 10.92 trillion dollars, which is approximately 60% of that of the United States. China’s GDP per capita also obviously increased from 1978 to 2015, with an annual growth rate of 9.9% [2]. However, China also experienced uneven economic development; spatially evident inequality in the regional wealth distribution has been one of the most outstanding features of regional development in China [3]. In 2015, Tianjin’s GDP per capita (17,104 dollars) was the highest in China, while the lowest was in Gansu, where it was only 4178 dollars. The GDP per capita of Tianjin, the wealthiest province, was nearly 4.1 times more than that of the poorest province. Regional inequality in China is much higher than in some developed countries [4]. For instance, in 2015, Alaska’s GDP per capita (73,474 dollars) was the highest in America, while the lowest was in Mississippi, where it was 35,717 dollars. The GDP per capita of Alaska, the wealthiest province, was nearly 2.1 times more than that of the poorest province. This number is far below the situation in China. The existence of appropriate regional inequality is inevitable, whereas excessive regional inequality is an obstacle to sustainable growth and affects the security and stability of society, weakening the public’s confidence in the government. Regional inequality has become a serious issue that is attracting wide attention from both policy makers and academic scholars. Measuring regional inequality in socioeconomic development is a key step to achieving regional coordinated development. Therefore, the question of how to objectively, accurately, and efficiently measure regional inequality in a timely way is a common problem faced by scholars. The night-time light (NTL) data represent artificial light on the Earth’s surface and are easy to access, are not expensive, and relatively objective. The problem of how to apply NTL data to the study of regional inequality is worth some attention.
In recent decades, a body of literature has measured regional inequality from a range of different perspectives and using various methods, deepening our understanding of the evolution of regional inequality in China. These studies have applied different measures of inequality to assess inequality, including concentration measures, such as the Gini coefficient and the Kakwani Index [5], and entropy measures, such as the Theil and the Atkinson indices [6]. The most popular view is that the interprovincial inequality declined during the 1980s, increased in the 1990s, was relatively stable from the late 1990s to 2004, and has declined thereafter [7]. Meanwhile, some scholars believe that regional inequality is sensitive to geographic scales and regional heterogeneity [8]. Consequently, a multi-scale and multi-mechanism framework has been used to investigate regional inequality [9]. For instance, He et al. [7] analysed regional inequality across regions, provinces, prefectures, and counties in China from 1997 to 2010. They found a convergent trend at the region level and the provincial level, while inter-county inequality revealed two rounds of divergence.
However, most of the previous studies on regional inequality in China have focused on several prominent economic indicators, such as GDP per capita, GNP per capita, and per capita income [10,11]. Questions have been raised time and again about the utility of either GDP or GDP per capita as a sole measure of a region’s economic development [12]. Traditional economic indicators (e.g., GDP and income) that are statistically derived suffer from limitations, such as low temporal resolution, and artificial effects [13]. For example, the sum of GDP in each province is not equal to the national total GDP, and the sum of GDP in each prefecture is not equal to the province’s total GDP. A typical case of this was the GDP of Liaoning, where false statistics boosted the province’s economic data from 2011 to 2014 [14]. In this context, the emergence of remotely sensed NTL data obtained from the Defense Meteorological Satellite Program-Operational Line Scanner (DMSP-OLS) has offered a new viewpoint for explicitly exploring human economic activity from outer space. Since the late 1990s, numerous studies have indicated that the NTL satellite imagery has been shown to be highly related to socioeconomic parameters [15,16,17,18,19,20]. Due to its evident advantages, associated with easy access, low cost, and relative objectivity, some social economists use night light data to study regional inequality [4,21,22,23,24,25]. For instance, Lessmann and Seidel [21] provided a new dataset of regional income inequalities within countries, based on DMSP-OLS satellite NTL data. However, two main problems associated with the DMSP-OLS NTL are low spatial resolution and saturation of pixel values [13]. These drawbacks associated with DMSP-OLS NTL have limited its application for monitoring within the social sciences. Fortunately, a new generation of NTL data from the Visible Infrared Imaging Radiometer Suite (VIIRS) carried by the Suomi National Polar-Orbiting Partnership (NPP) satellite was released by the Earth Observation Group (EOG) in the National Geophysical Data Center (NGDC) of the National Oceanic and Atmospheric Administration (NOAA) in early 2013. Compared with DMSP-OLS data, the NPP-VIIRS data feature a higher spatial resolution (15 arc-second, approximately 500 m) and do not have the issue of over-saturation that exists in the DMSP-OLS data. Many scholars have employed NPP-VIIRS data to estimate economy activity [26], CO2 emissions [27], built-up urban areas [28], urban land expansion [29], and electric power consumption at both national and subnational scales [30]. The evaluation of the NPP-VIIRS NTL in modeling economy activity showed that the total night-time light (TNL) from NPP-VIIRS had a significantly positive linear relationship to the Gross Regional Product (GRP) at both provincial and county level in 2010, being significantly stronger than the relationship between the TNL from DMSP-OLS and GRP [31]. Similar studies were also conducted by Ma et al. [32] and Shi et al. [30]. They also found that VIIRS data were superior to DMSP-OLS data in detecting and estimating socioeconomic dynamics at a multi-scale level. Previous studies have indicated that NPP-VIIRS data can serve as a proxy measure of economic activity, especially in developing countries. For this reason, using NPP-VIIRS NTL data, Zhou et al. [13] quantitatively estimated socioeconomic development inequalities across 30 provinces and municipalities in China in 2012. They suggest that NTL data can provide comprehensive information regarding inequality at multiple levels, which is not possible using traditional statistical sources.
Based on a literature review, it is appropriate to use NPP-VIIRS NTL data to analyse regional inequality. Note, the monthly mosaic of NPP-VIIRS imagery is a preliminary product, which contains light from cities, towns, transportation corridors, gas flares, biomass burning, background noise, and so on. To overcome this shortcoming, Li et al. [31] proposed a simple and approximate process for removing the confounding factors by using DMSP-OLS data, which uses a hypothesis that the lit-up areas in 2010 and 2012 are the same. However, the spatial resolution of DMSP-OLS data and NPP-VIIRS data is very different, and in Li’s paper, a part of information has been lost during the calibration procedure of VIIRS data Therefore, we have proposed a new method for correction of the NPP-VIIRS NTL data and have then studied regional inequality in China using the corrected NTL as agent variables for economic development. Unlike Zhou et al. [13], we are concerned with dynamic change in regional inequality from 2014 to 2017, rather than only in 2012. Finally, we have examined the correlation between province level Theil index and province level NTL per capita by using the scatter plots.
2. Methods and Data
2.1. Methods
2.1.1. Two-Stage Nested Theil Decomposition Method
Compared with other indexes, a major advantage of the Theil index is that it is readily decomposable and can measure the contribution of inequality within regions and inequality between regions in relation to the overall inequality [33]. Consider the following hierarchical structure of China: region-province-prefecture level. Using prefectures as a basic regional unit, the overall regional socioeconomic inequality can be measured by the following Theil index [34]:
where yijk is the NTL of prefecture k in province j in region i, Y is the total NTL of all prefectures, pijk is the population of prefecture k in province j in region i, and P is the total population of all prefectures.
We defined TBR as follows to measure economic inequality between regions,
where yi is the total NTL of region i, pi is the total population of region i.
We defined Tdi as follows to measure between-prefectures’ economic inequality for region i,
Then, the overall inequality index T in Equation (1) can be decomposed into inequality between-prefectures for region i (Tdi) and between regions (TBR), as shown in the following equation.
Furthermore, we defined Tij as follows to measure within-province economic inequality for province j in region i, and defined Tpi as follows to measure between-province income inequality for region i,
where yij is the total NTL of province j in region i, pij is the total population of province j in region i.
Then Tdi in Equation (5) can be further decomposed into
By substituting Tdi in Equation (9) into Equation (6), we obtained the following equation.
Equation (10) is the two-stage Theil inequality decomposition equation, in which the overall regional economic inequality is decomposed into the within-province component (TWP), between-province component (TBP), and between-region component (TBR). The within-province component is a weighted average of within-province income inequalities (Tij), while the between-province component is a weighted average of between-province income inequalities (Tpi).
2.1.2. Correction of the NPP-VIIRS NTL Data
The monthly mosaic of NPP-VIIRS imagery is a preliminary product, which has not been filtered to remove light detections associated with fires, gas flares, volcanoes, and background noise. Therefore, NPP-VIIRS NTL data should be calibrated before they are used to estimate socioeconomic variables. Due to the annual composite of NPP-VIIRS data in 2015, which has undergone an outlier removal process to filter out fires and other ephemeral lights, with background (non-lights) set to zero, it was applied to calibrate the NTL data in 2014, 2015, 2016 and 2017. Moreover, the calibration method which has been well developed by Li et al. [31] is extended to process the NPP-VIIRS NTL data in our study to reduce the discrepancies.
We assume that, when a pixel’s average radiance value is equal to zero in 2015, the pixel’s average radiance value for the others year at the same geographic position should also be equal to zero. We propose a simple and approximate process for removing the confounding factors based on the following process: generate a mask with all positive average radiance value pixels from the annual composite of NPP-VIIRS NTL data in 2015 and multiply the other NPP-VIIRS imagery by the mask to derive a denoised NTL imagery. In addition, according to Shi et al. [30], the pixels with negative average radiance values in NPP-VIIRS data are assigned to 0.
2.2. Data
2.2.1. Visible Infrared Imaging Radiometer Suite Night-Time Light Imagery
The source of all the NTL imageries used in these studies is the EOG, the NGDC of NOAA [35]. Two configurations of the NPP-VIIRS composites are available: the first is called “vcmcfg”, and the second is called “vcmslcfg”. The first excludes any data contaminated by stray light (typically solar illumination) while in the second configuration, data impacted by stray light are corrected but not removed [36]. The second configuration composites include stray light correction, and contains more data in northern latitudes, and is therefore better for more complete spatial and temporal coverage. We selected the second products according to the procedure used by Levin and Zhang [37]. The NPP-VIIRS Day/Night Band (DNB) month composite data were collected from January 2014 to December 2017. In 2014, 2016, and 2017, the lighting data are only available by monthly composites. In 2015, the light data are available by both monthly composites and annual composites. In addition, brightness of artificial NTL that is useful information for quantitatively assessing socio-economic factors is contaminated by seasonal noise, monthly changes in nighttime brightness were correlated with monthly changes in snow cover (which may vary from year to year), and are thus not suitable for analyzing spatial inequalities by using the NTL products of all months [38]. We only chose monthly composites of NPP-VIIRS data from July to September in China. Because of the snow cover area in China from July to September is the least, in other months, snow cover will increase significantly [39]. The average value of the lighting from July to September is used to represent the average lighting intensity of the whole year (Figure 1).
Unlike the DMSP-OLS NTL data, the released NPP-VIIRS NTL data have not been filtered to remove light detections associated with fires, gas flares, volcanoes, and background noise. Fortunately, in 9 March 2017, the annual composites of 2015 were first released with the “vcm” version, which excludes any data impacted by stray light. Further processing has been done on the annual products to screen out ephemeral lights and background (non-lights). We obtained the NPP-VIIRS night-time radiance values by average DNB radiance values’ products named “vcm-orm-ntl” (VIIRS Cloud Mask—Outlier Removed—Night-time Lights) containing cloud-free average radiance values that have undergone an outlier removal process to filter out fires and other ephemeral lights, with background (non-lights) set to zero. The “vcm-orm-ntl” NTL imagery of China in 2015 are shown in Figure 2. All the NTL imagery was reprojected to an Albers Conic Equal Area projection with a spatial resolution of 500 m. The annual composites NTL satellite imagery of 2015 has been shown to be highly related to economic parameters both at province and prefectural levels. The TNL-GDP relationship at the province and prefecture level were evaluated through linear regressions (Figure 3). At the provincial and prefectural level, the R2 values of the TNL from original NPP-VIIRS data and GDP were 0.8610 and 0.8621, respectively. Thus, annual composites NTL satellite imagery of 2015 is a good reference image.
2.2.2. Economic and Demographic Data
The GDP data and population data were obtained from the China Statistical Yearbook for regional economy 2013–2014 [40]. As the China Statistical Yearbook for regional economy is no longer published since 2015, the GDP data and population data in 2015 and 2016 were obtained from the Statistical Yearbooks of every province. To apply NPP-VIIRS NTL data in estimating regional inequality at a multi-scale level, we used China’s provincial and prefecture level administrative regions for analysis. In China, there are three major levels of administrative areas: province, prefecture, and county. In this study, all the provincial regions, except for Hong Kong, Macau, and Taiwan, were selected, resulting in 31 provincial and 341 prefectural regions for analysis (Figure 4). Furthermore, we modified the inconsistencies in the raw statistical data for 2014–2017 that were caused by administrative division adjustments. The boundary data of the administrative divisions of mainland China, including national, provincial, and prefectural boundaries, were obtained from the National Geomatics Centre of China.
3. Results
3.1. Correction Results of NPP-VIIRS NTL Data
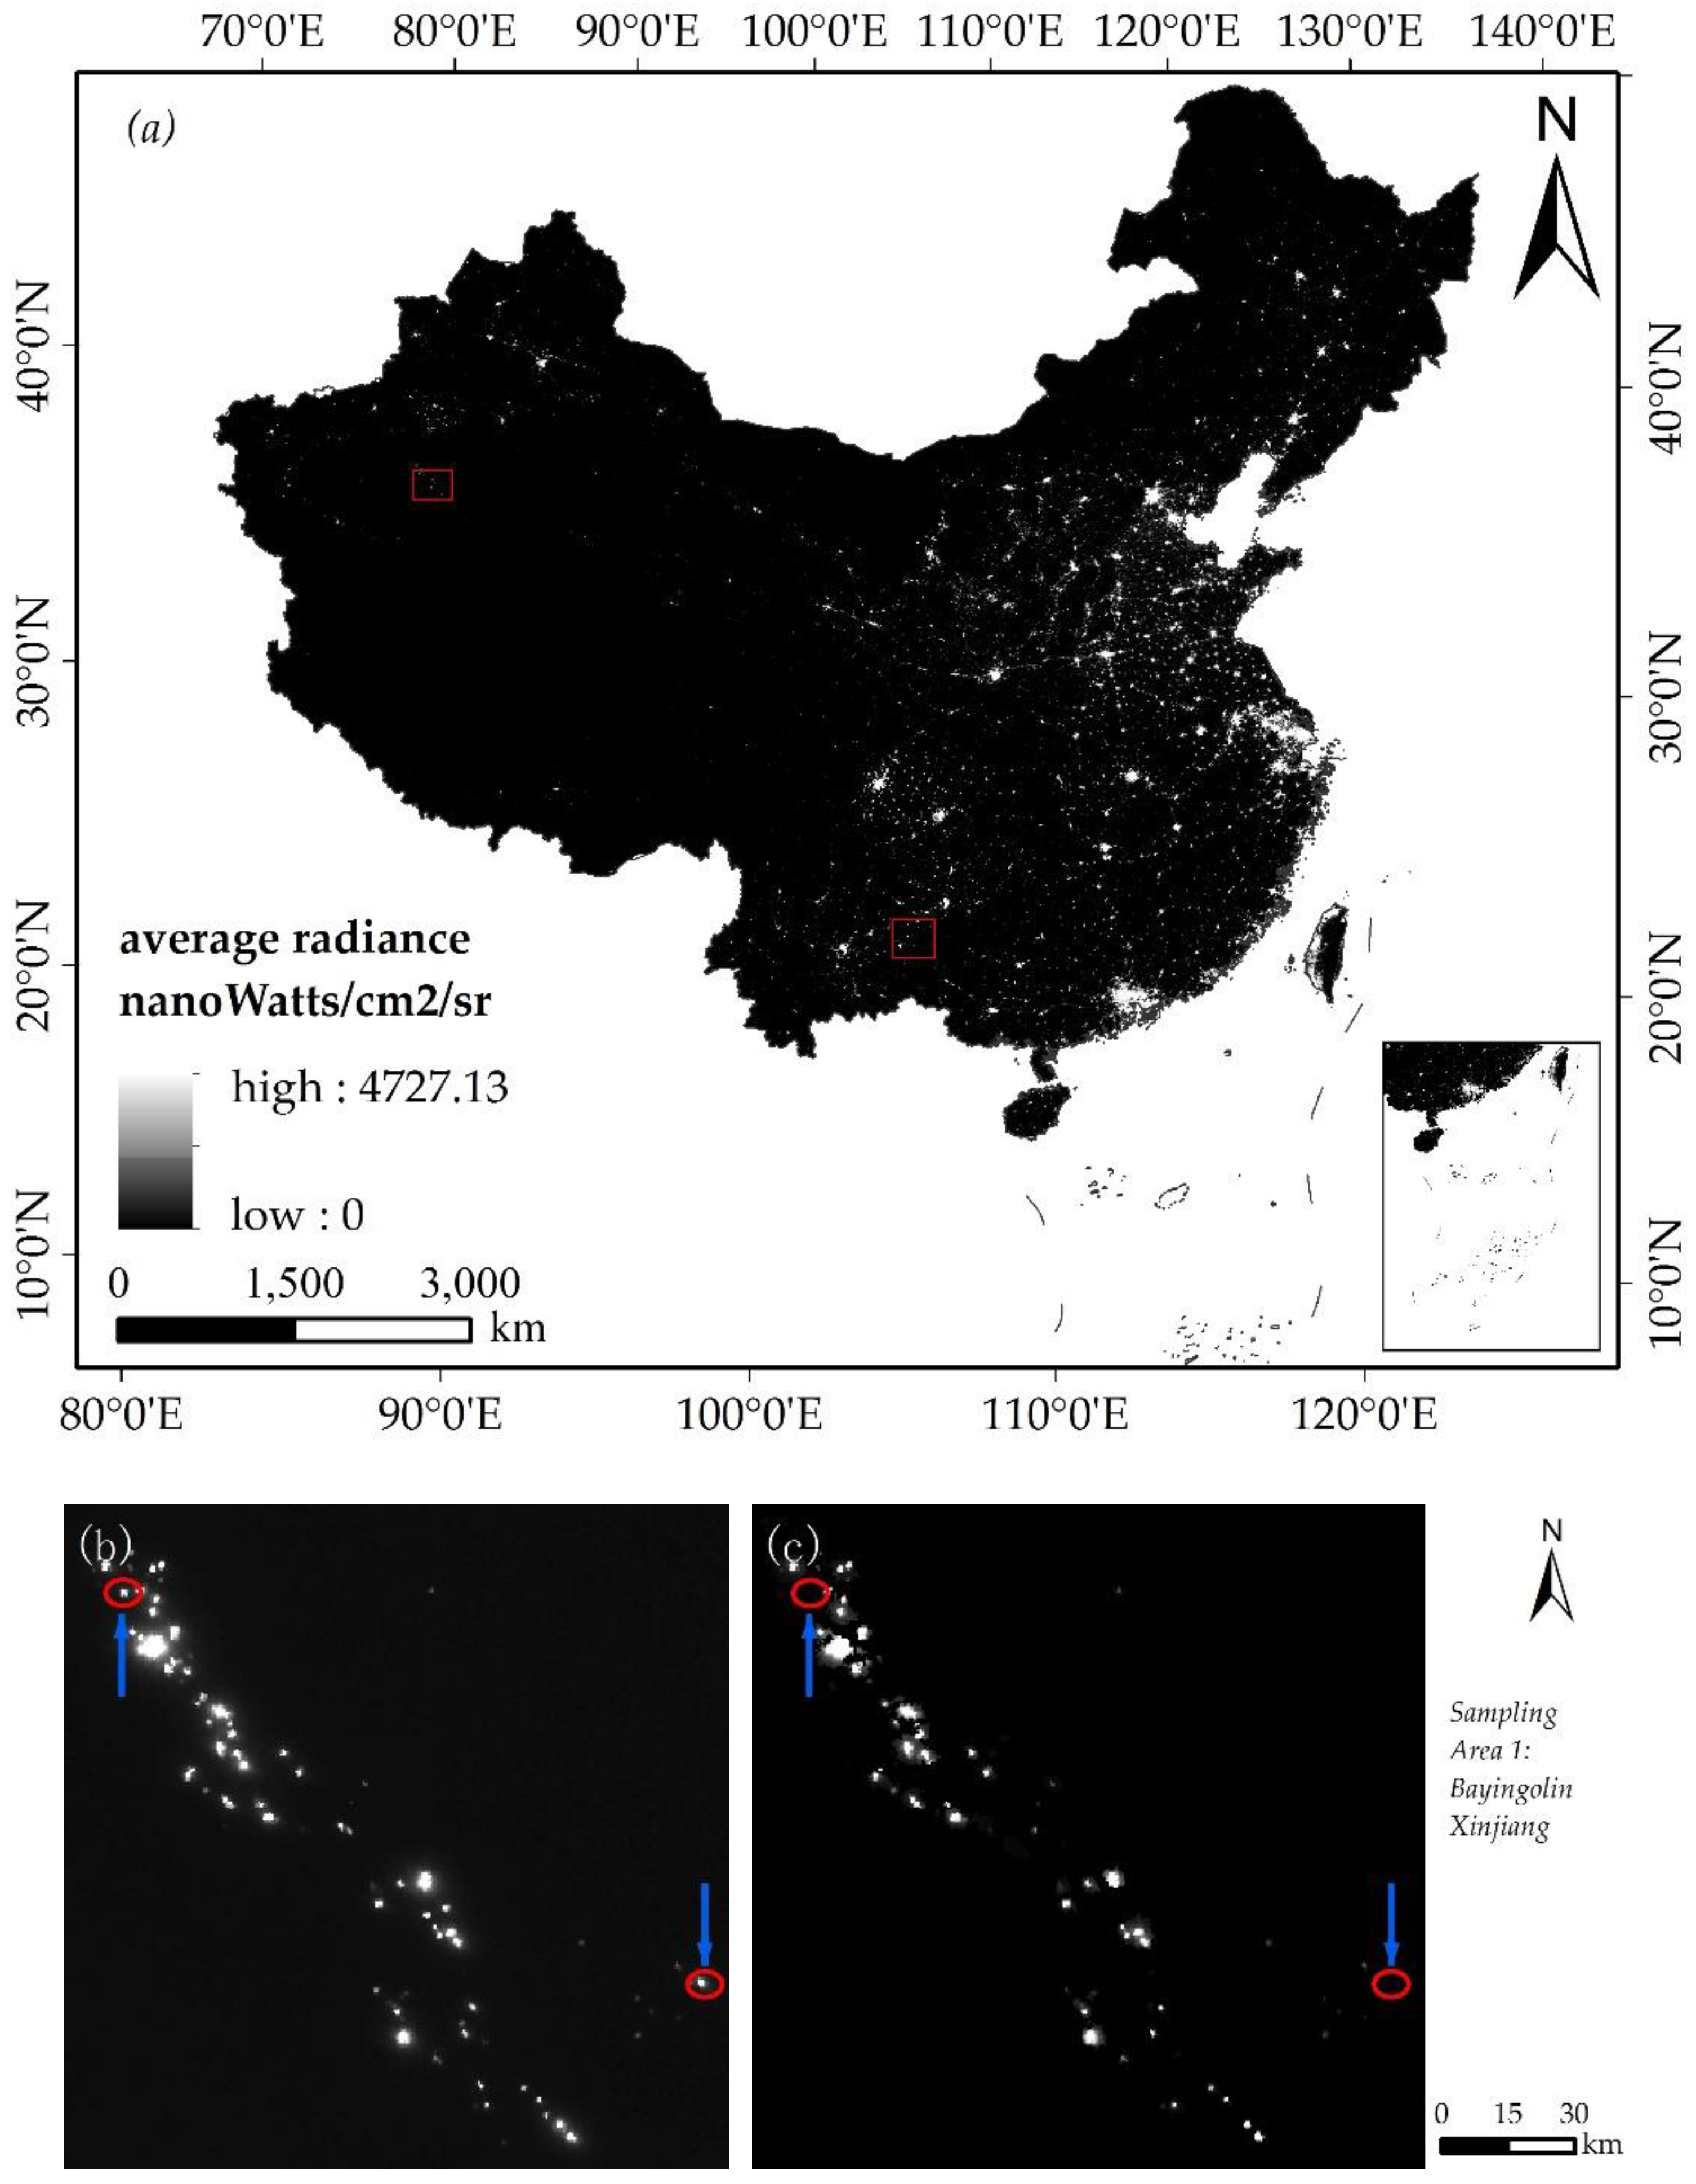
The NTL Data in 2014 after calibration are shown in Figure 5. Figure 5a showed the corrected NPP-VIIRS data of mainland China in 2014. Two sampling areas bounded by red rectangles in Figure 5a were magnified in Figure 5b–e to illustrate the corrected results. Sampling area No.1 in Figure 5 was located in Mongolian Autonomous Prefecture of Bayingolin, Xinjiang. Some bright areas located in the desert (Figure 5b) data became dimmer in the corrected data (Figure 5c). The lit area No.1 indicated by the red circle and blue arrow in Figure 5c was located in Taklimakan Desert. Lights before correction might be caused by occasionally working at night. The sampling area No.2 in Figure 5 was in Hechi, Guangxi Province. The lit area No.2 indicated by the red circle and blue arrow was a county road from Luogeng to Longla, which was removed in the corrected imagery (Figure 5d). The lit area of desert and county road in Figure 5 were not persistent. Comparison results show that our correction method can remove the background noise and short-time lighting from NPP-VIIRS data.
3.2. Accuracy Assessment of GDP Estimation
The accuracy of NTL data was assessed using province-level and prefecture-level statistical GDP. The results of linear regression between TNL and GDP evaluated at both province and prefecture levels are shown in Figure 6. Both at the provincial level and the prefectural level, the R2 value of the TNL from corrected NPP-VIIRS data and GDP was much higher than that of the TNL from original NPP-VIIRS data and GDP. In 2015, for instance, the R2 value of corrected data was 0.8478, whereas that of original data was 0.6605 at the provincial level. Moreover, at the prefectural level, the corrected data also showed a better capacity in estimating GDP. In 2015, for instance, the R2 value of corrected data was 0.8566, whereas that of original data was 0.7367 at the prefecture level. Overall, the statistical relationship between the corrected data and GDP is most significant at both provincial and prefectural levels, indicating that the NTL is suitable and reliable for GDP estimation.
3.3. Decomposition of Theil Inequality Indices
3.3.1. Total Inequality and Its Decomposed Components
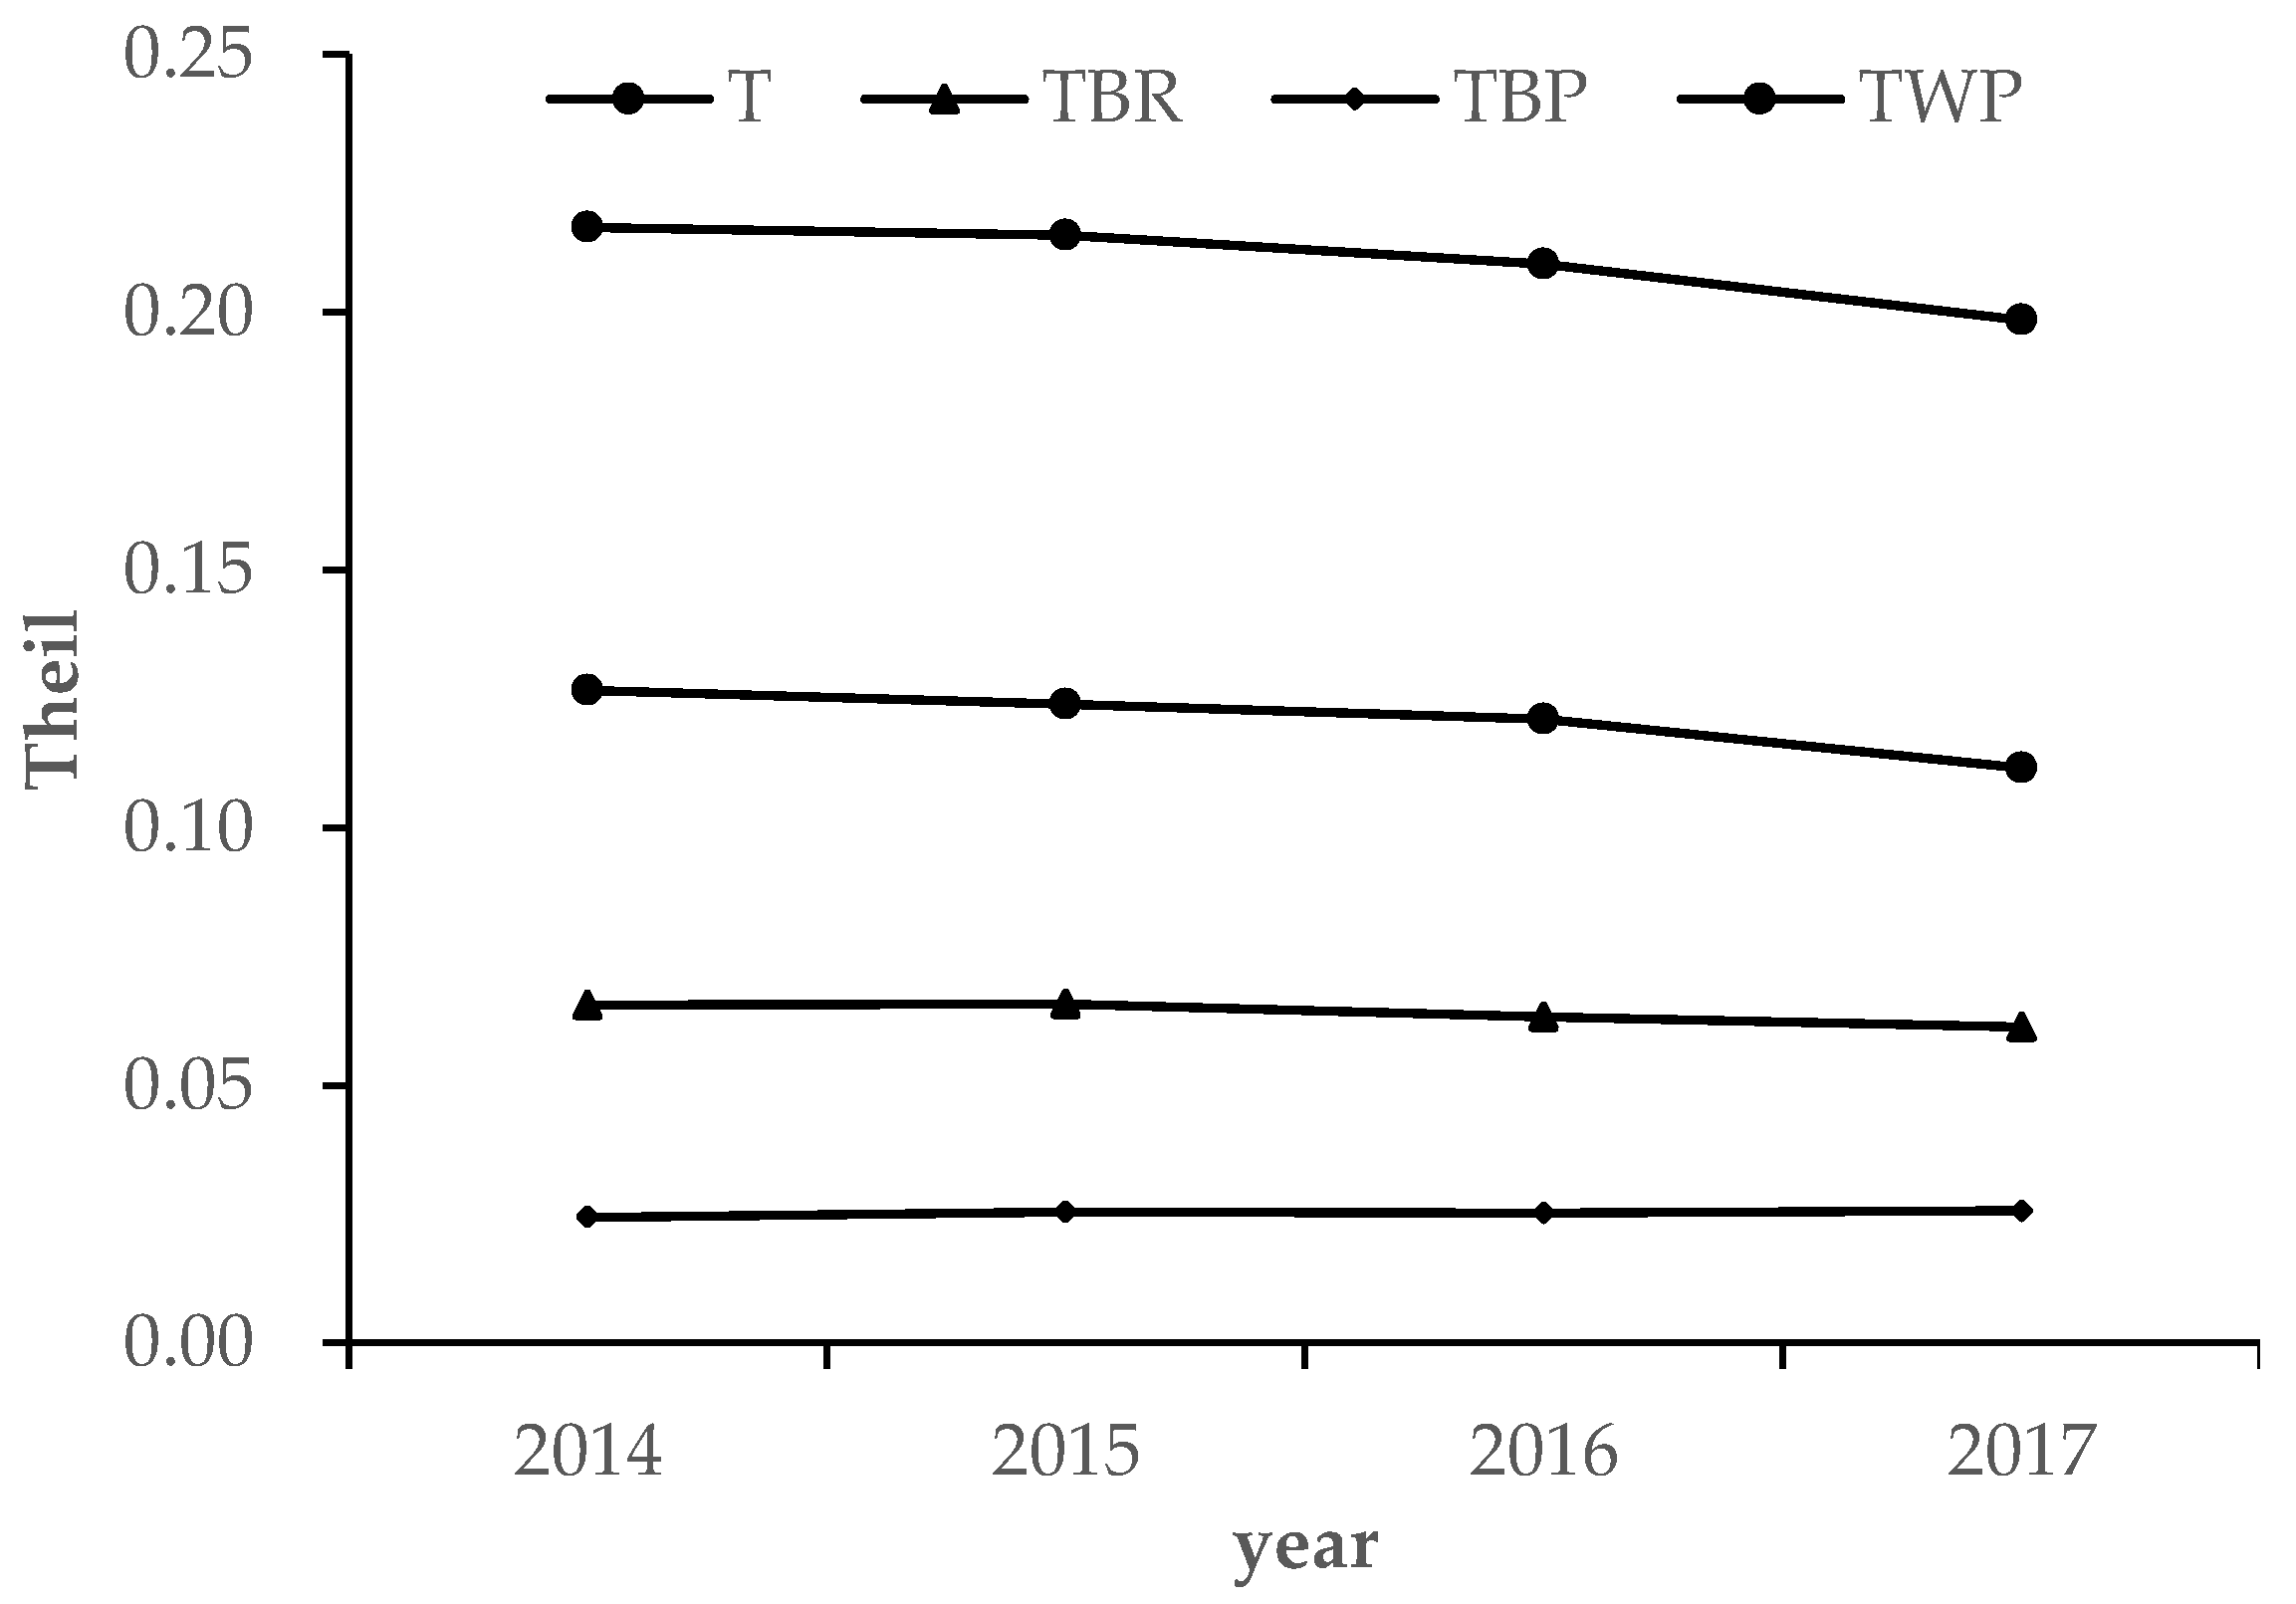
Taking NPP-VIIRS NTL data as a proxy indicator for economic activity and using the Theil index, we investigated regional inequality in China at three levels: region, province, and prefecture. It should be noted that there are no prefecture-level cities under the four centrally administered municipalities: namely Beijing, Shanghai, Tianjin, and Chongqing. To facilitate comparison, these municipalities were merged into corresponding provinces: Beijing and Tianjin were merged into Hebei province, Shanghai was incorporated into Jiangsu province, and Chongqing was merged into Sichuan Province. Using prefecture as a basic regional unit, we calculated overall regional economic inequality and then decomposed the overall regional inequality into within-province, between-province, and between-region components using the Theil index. The results of two-stage nested decomposition for China during 2014–2017 are shown in Figure 7. This figure reveals that overall inequality (T), within-province inequality (Twp), and between-region inequality (TBR) all declined in the study period. However, only between-province inequality (TBP) increased slightly from 2014 to 2017. Moreover, the within-province inequality was the highest, followed by the between-region inequality, while the between-province inequality was the lowest.
Furthermore, to identify the importance of each inequality component—namely between-region, between-province, and within-province—in terms of the total regional inequality, this study employed the contribution rate as an indicator to conduct in-depth research. Evolution of the contribution rate of regional inequality is shown in Figure 8. In 2014, up to 58.49% of overall inequality was caused by the within-province component. Moreover, the between-province and between-region components accounted for 11.24% and 30.27%, respectively, of overall inequality. As shown in Figure 8, there are obvious differences between the tendencies of the three inequality components over 2014–1017. Specifically, the contribution rate of within-province component kept declining, while, in contrast, that of between-province components kept a continuously rising trend. With respect to the contribution rate of the between-region components, it remained relatively stable between 2014 and 2017.
As shown in Figure 8, the contribution rate of between-province inequality to overall inequality is lowest. Between-province inequality reflect the differences between provinces in one economic region. In general, spatial adjacent provinces are more likely to be in the same economic zone in which resource endowment and economic development stage are similar. Consequently, between-province inequalities are generally relatively small. The contribution rate of between-region inequality to overall inequality is approximately 30%. Since 2000, the Western Development Strategy, the Northeast Area Revitalisation Plan, and the rise of central China have been launched to boost economic growth in the western, northern, and central regions. However, the regional gap between different economic zones is still high. It is worth noting that the contribution rate of within-provinces’ inequality is the highest, up to approximately 60%. Thus, the within-provinces inequalities should become a priority.
3.3.2. Economic Inequality within Provinces
In the light of the results in Section 3.3.1, the regional economic inequality in China has been mainly caused by within-province inequality. Therefore, we focused on the within-province inequality and made further effort to explore the underlying causes. To shed light on the temporal variation of economic inequality in each province during the study period, time-series analysis was further conducted for all 26 provinces. Figure 9 illustrates annual changes of the Theil index in those provinces from 2014 to 2017.
Firstly, we analysed the changes of within-provinces’ inequality in each province from 2014 to 2017. As shown in Figure 9, the degree of economic inequality varied widely across provinces. In 2014, Shannxi, Xizang, and Qinghai ranked as the top three, and the Theil indexes in these three provinces were 0.341, 0.334, and 0.273, respectively. In that year, the Theil index in Shannxi was approximately 6.61 times as large as that of Fujian (0.052). In 2017, Shannxi, Qinghai and Gansu ranked as the top three, and the Theil indexes in these three provinces were 0.337, 0.262, and 0.238, respectively. Moreover, what is most impressive is that the Theil index of Shanan was 5.41 times as large as was that of Fujian, whose regional inequality was the lowest (0.043). Furthermore, there are obvious provincial differences in the variation direction of the Theil index from 2014 to 2017. In other words, the Theil index has declined in some provinces but has risen in others. Specifically, the provinces with an increased Theil index include Shanxi, Gansu, and Xinjiang, indicating that the inequality within these three provinces has widened. For example, the Theil index of Gansu has changed remarkably, increasing from 0.197 to 0.238. This shows that the economic inequality in Gansu was gradually expanding over the study period. In contrast, the Theil index has declined in most provinces, such as Liaoning, Jilin, Guangxi, and Xizang, which means that the economic inequality in these provinces has narrowed. What is more, the Theil index of Xizang has obviously decreased, from 0.334 to 0.238. In 2014, the per capita GDP in Lhasa was the largest in Xizang, 3.49 times higher than that of Nagqu. However, this ratio dropped to 3.32 by 2016. This shows that the economic inequality in Xizang continuously diminished.
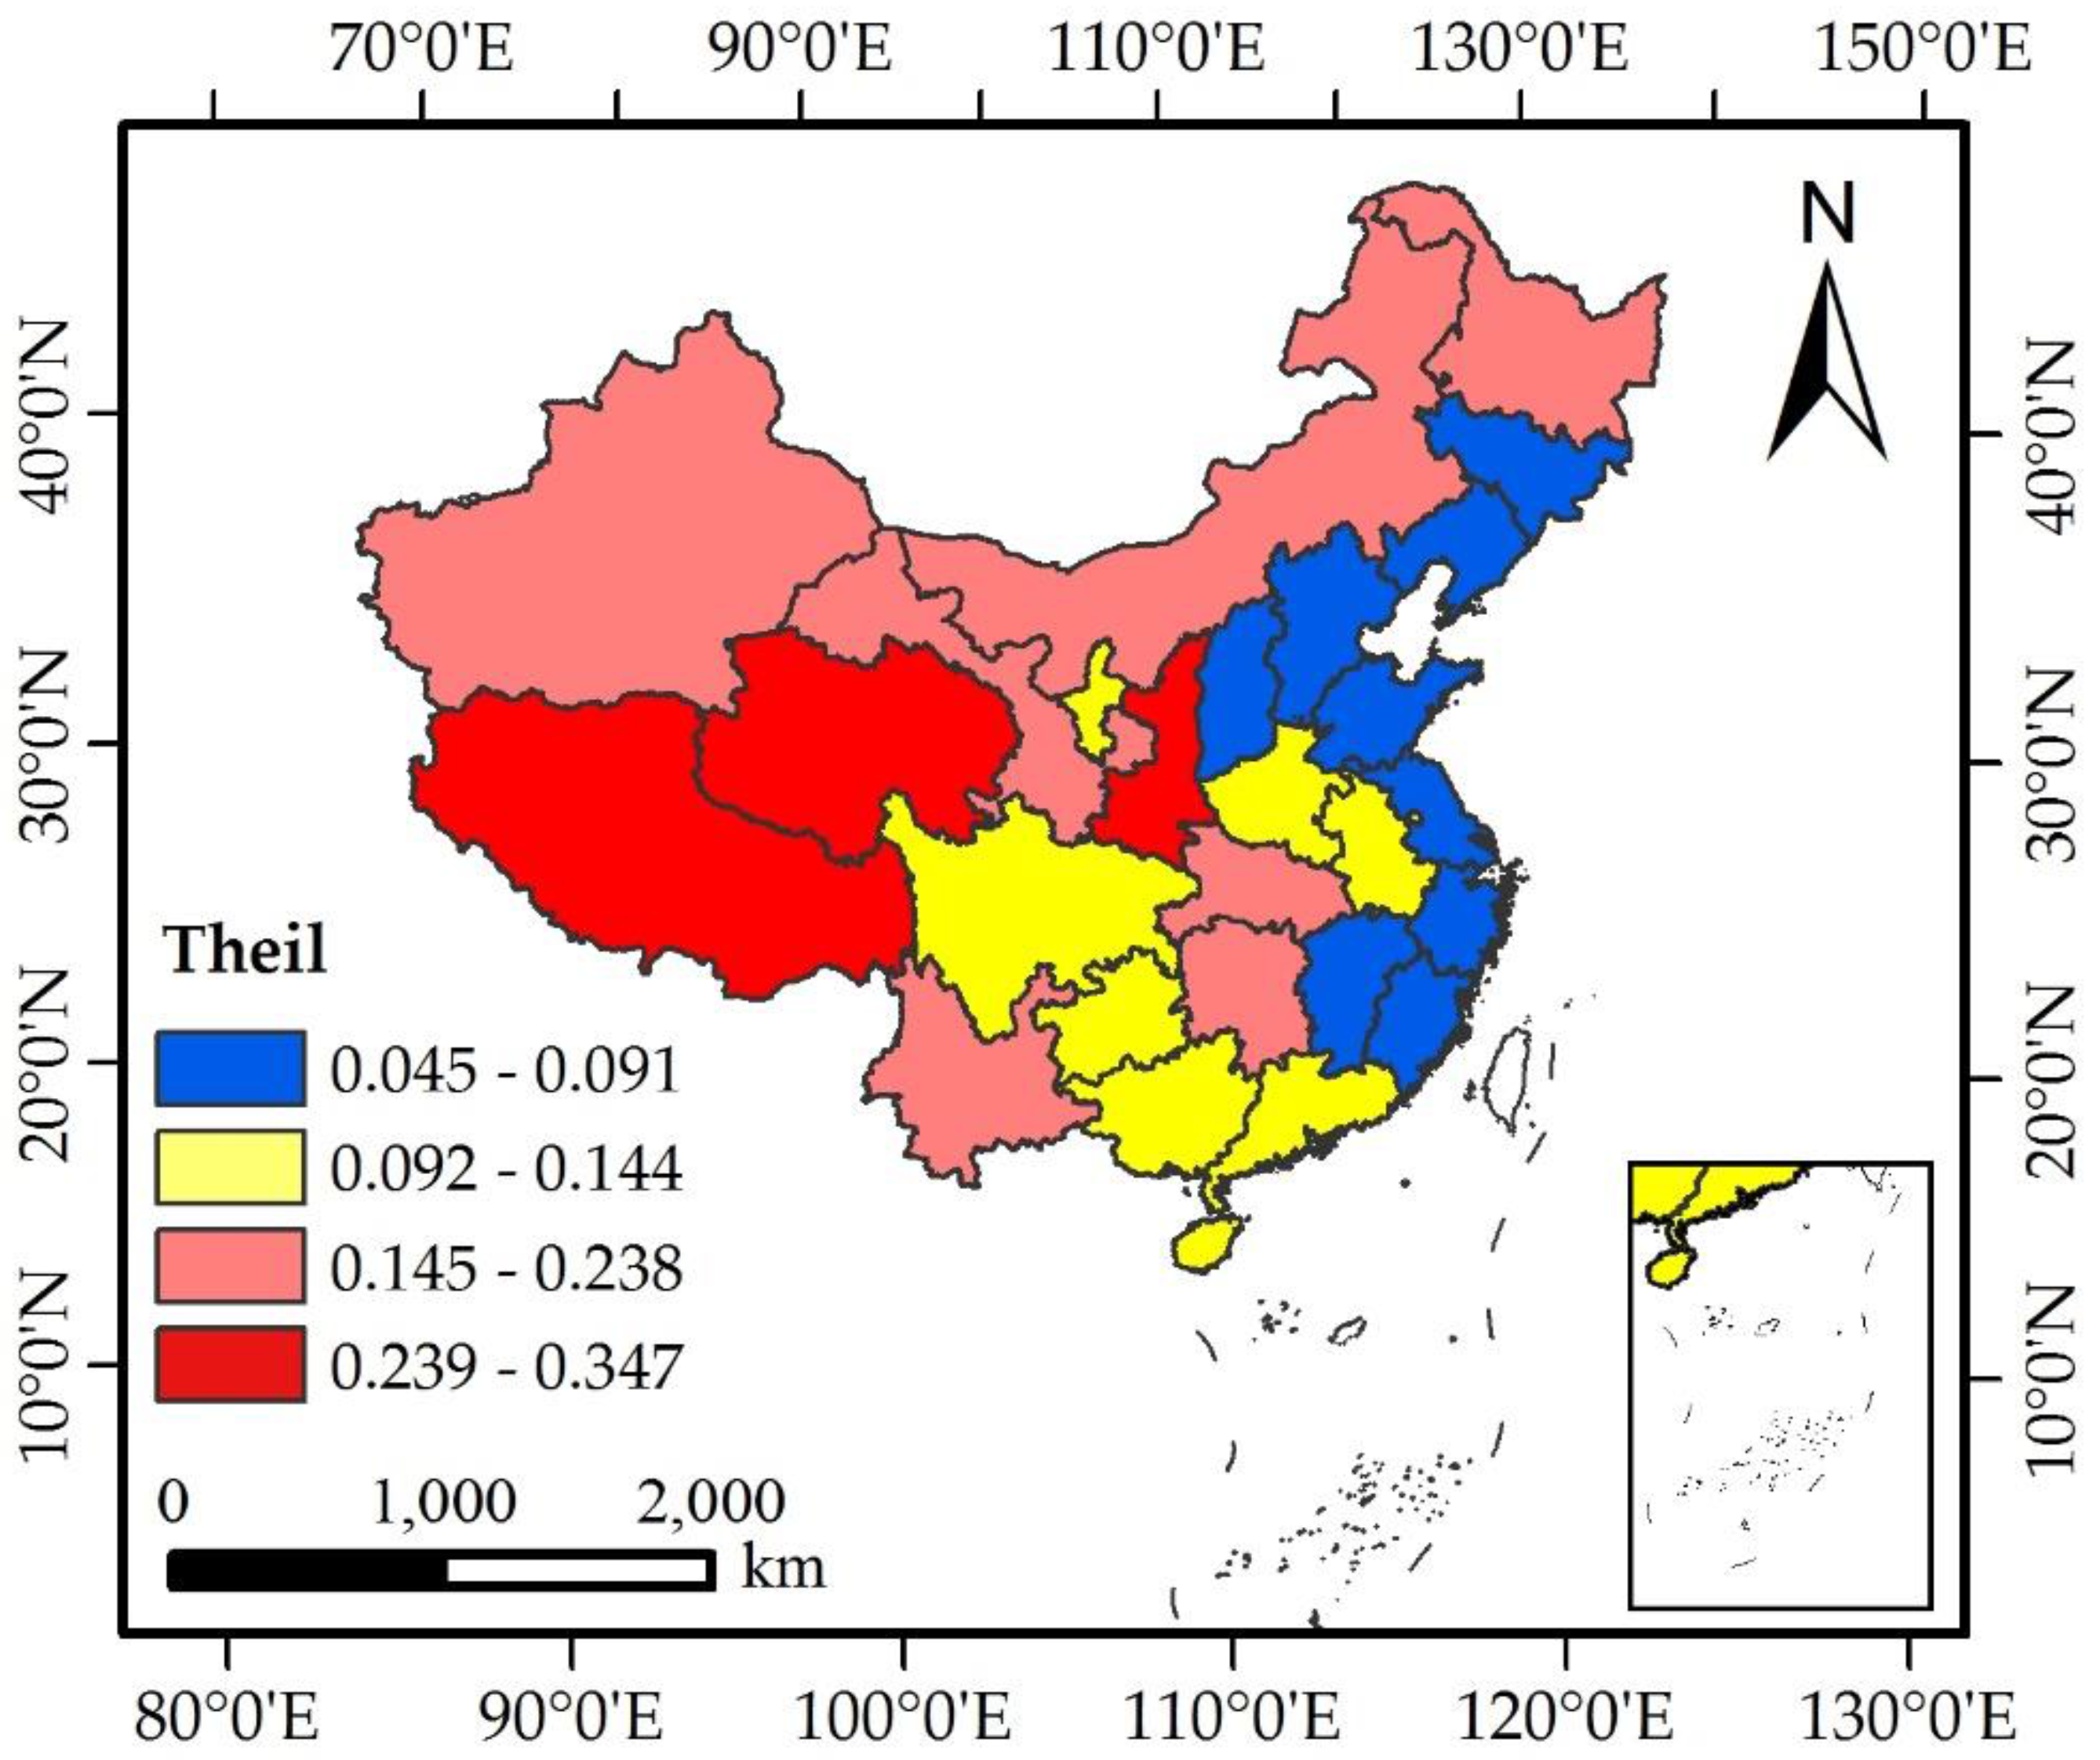
Secondly, the spatial distribution of mean of Theil index in every province was mapped, as shown in Figure 10. The Theil index was classified into four groups using the Jenks Natural Breaks Classification method, which is done by seeking to minimise the average deviation from the class mean while maximising the deviation from the means of the other groups [18]. Great disparities in the Theil index have been identified in China, as shown in Figure 10. There are 12 provinces in the first group with a Theil index from 0.045 to 0.091, indicating that the inequalities in these provinces is the smallest. Moreover, these 12 provinces, including Shandong, Zhejiang, and Jiangsu, are mainly located in Eastern China. The second group with a Theil index of 0.092–0.144 included 9 provinces, which demonstrates that the inequalities in these provinces is relatively small. These provinces, including Guangxi, Guizhou, and Sichuan, are mainly located in Southwest China. As for the third group, it has 7 provinces with a Theil index of 0.145–0.238, showing that the inequalities in these provinces is large. It can be seen from Figure 10 that most of these 7 provinces, including Gansu, Xinjiang, and Shannxi, are located in Northwest China. Regarding the last group, it only included 3 provinces with a Theil index of 0.239–0.347, which reveals that the inequality in Shannxi is the largest.
From the mean of the Theil index in each province during 2014–2017, we found that location played a significant role in shaping China’s uneven economic landscape. As illustrated in Figure 10, economic inequalities in coastal provinces are smaller than are those in inland provinces. This spatial distribution pattern can be explained by the following reasons. Firstly, the natural conditions are harsh in most inland provinces. For instance, the Qinghai–Tibet Plateau and Taklimakan Desert are located in the inland region. Secondly, transportation infrastructure in inland areas is relatively backward, which has hindered the balanced development of these provinces. Thirdly, the ability to attract foreign investment in inland provinces is insufficient, resulting in a serious lack of development funds. In addition, the policy of prioritising central cities in inland provinces has exacerbated economic inequality in these provinces.
Kuznets [41] stated that interpersonal income inequality first increases in the course of economic development, then peaks, and then decreases. This sort of relationship is often called inverted U-shaped, which may also apply to regional inequality [21]. According to the kuznets hypothesis, economic inequality increases at initial level of economic growth and then starts to decrease at a higher level of economic growth. Nevertheless, the kuznets hypothesis has not been verified in every province in China. In particular, the economic inequality of approximately 5/6 provinces has narrowed, while that of the remaining 1/6 provinces has widened. In general, the tendency of economic inequality has not shown a consistent change path in the provinces of China.
3.4. Relationship between Regional Inequality and Economic Development
The level of regional inequality is measured by the Theil index, which is calculated based on NTL imagery. Some additional questions were put forward: What is the relationship between regional inequality and economic development? If regional inequality is affected by economic development, what is the effect mechanism of these two variables? To clarify these problems, we examined the correlation between the Theil index and night light per capita at the province level by using scatter plots of every provinces. Scatter plots of night light per capita and region inequality in different province are listed below. The x axis of all the scatter plots show the night light per capita, unit: nanoWatts/cm2/sr; the y axis indicates the Theil index of the corresponding province, and there is no dimension. Due to the large number of scatter plots, we organized them into a tabular format (Table 1).
As shown in Table 1, the results show that China’s economic development plays an important role in affecting regional inequality. The extent of the influence of economic development on regional inequality varies across provinces. With economic development, regional inequalities are expanding in some provinces, such as Shanxi, Henan, Gansu, Ningxia and Xinjiang. However, the opposite is true in other provinces. It can be seen from Table 1 that both the direction and degree of influence of economic growth on regional inequality are changing with the different stages of economic development. Taking Northwest China as an example, the regional inequalities in 3/5 provinces are widening gradually, accompanied by economic growth. The reason for this situation is twofold: economic location and natural resource endowment. On the one hand, Northwest China lies inland and has adverse natural conditions, weak infrastructure, and backward social development. On the other hand, although mineral resources are abundant in Northwest China, they are unevenly distributed. Furthermore, uneven distribution of mineral resources has led to the gradual expansion of regional inequality. In other words, economic growth in a resource-based region is much higher than is that in other regions that are poor in mineral resources.
4. Discussion
The NTL data records artificial light on the Earth’s surface and can be used as an alternative source for economic modeling. The NPP-VIIRS NTL data were released by the NOAA/NGDC in early 2013. Compared with the DMSP-OLS data, NPP-VIIRS NTL data have a higher spatial resolution and a wider radiometric detection range. However, the drawback of NPP-VIIRS NTL data lies in the background noise which affects the accuracy of the economic modeling. Li et al. [31] proposed a simple and approximate process for removing the confounding factors by using DMSP-OLS data. This method has been recognized by many scholars [13,27,30,42]. However, the spatial resolution of DMSP-OLS data and NPP-VIIRS data are quite different. Following this rational, in this study, instead of DMSP-OLS data, we proposed a simple process for removing the confounding factors by using the NPP-VIIRS data. The results prove that our proposed method is effective for reducing the negative effects which are caused by caused by the lights from oilfield, fires, gas flares, volcanoes, and desert in the original NPP-VIIRS data. Furthermore, the economic inequality in China is studied with the application of the corrected NTL as agent variables. Unlike Zhou et al. [13], this paper focuses on the dynamic change in regional inequality from 2014 to 2017, rather than only in 2012. Moreover, we have examined the correlation between Theil index and NTL per capita at provincial level by using scatter plot. As a result, lower inequality indices are observed in coastal China when comparing with western China, which are similar to the conclusion of Zhou et al. [13]. Some economic researchers who have studied China’s inequality by using traditional statistical data have argued that a convergent trend could be found at both region and provincial level [7]. The results from our research corroborate these findings by using the latest time period. Therefore, our findings also proved that NPP-VIIRS NTL data are capable of providing objectively, accurately, and efficiently measure regional inequality at multiple levels in a timely way.
As a preliminary attempt to investigated regional inequality by using NTL data, some limitations are existed. The limitations of this study are twofold. Firstly, the time resolution of NPP-VIIRS NTL data is low. There are only six years since the NOAA/NGDC began to publish NPP-VIIRS NTL data in April, 2012. However, better understanding of the evolution of regional inequality cannot be obtained without longer time period. Secondly, although the corrected NPP-VIIRS NTL data are highly related to economic parameters at both provincial and prefectural levels, the results still contained some uncertainties. For instance, we assumed that the average radiance value of a lighted pixel are not detected in a later year would not be detected in an early year too. A considerable number of studies have shown that the NTL have a strong correlation with urban built-up area [43]. As one of the prosperous urbanized countries in the world, China has witnessed an unprecedented active stage of urban expansion. However, Long et al. [44]. found that 40 prefectural regions among all 341 prefectural regions were losing their population during 2000–2010. Accordingly, our correction method may cause some errors.
5. Conclusions
Accurate data on GDP at pixel level are needed to comprehend the dynamics of regional economies. In this study, composite annual NPP-VIIRS data were obtained by averaging the pixel brightness of monthly NPP-VIIRS NTL data. Then, by incorporating two-stage nested Theil decomposition and scatter plots, we investigated regional inequality in China from 2014 to 2017 based on NPP-VIIRS NTL data. Several conclusions can be obtained as follows:
- The NPP-VIIRS NTL data were found to exhibit a strong capacity in reflecting the real status of the regional economy. This result is in line with previous studies [13,30]. After correction, the VIIRS NTL data showed a statistically positive correlation with GDP. In every year, the R2 for all years in the study period was above 0.82. This proves that our correction method is scientifically effective.
- The results of two-stage nested Theil decomposition indicate that overall inequality, within-province inequality and between-region inequality in China all declined from 2014 to 2017. However, between-province inequality increased slightly. As for the contributions of these components to the overall regional income, the within-province inequality was the highest, followed by the between-region inequality, while the between-province inequality was the lowest. Moreover, further analysis of within-province inequality reveals that location has played a significant role in shaping China’s uneven economic landscape. Specifically, economic inequalities in coastal provinces are smaller than are those in inland provinces.
- Using scatter plots, we have found that China’s economic development plays an important role in affecting regional inequality. Furthermore, the extent of the influence of economic development on regional inequality varies across provinces. In particular, the regional inequalities in relatively backward areas are more obvious than are those in relatively developed areas.
- Currently, a series of NPP-VIIRS NTL data are released, in particular, annual composite products are being released. As NOAA/NGDC is working to produce more NPP-VIIRS data, further research can be focused on multi-temporal image analysis for revealing the spatiotemporal dynamics of regional inequality in China at multi-scale. In addition, various types of data, such as vegetation index data, land cover data shall be applied to correct the NPP-VIIRS NTL data. In this way, more detailed relationship between corrected NTL data and GDP will be revealed, and application of NTL data in investigating regional inequalities would be more reliable, which are the directions in further research.
Acknowledgments
The current work is supported by the National Natural Science Foundation of China (41571159), Grant Program of Clean Development Mechanism Fund of China (CDMF) (No. 2014092), Chinese Postdoctoral Science Foundation (2016M600121).
Author Contributions
Rongwei Wu and Degang Yang designed research; Rongwei Wu, Degang Yang, Jiefang Dong and Fuqiang Xia performed research; Lu Zhang analyzed the data; Rongwei Wu wrote the paper. All authors have read and approved the final manuscript.
Conflicts of Interest
The authors declare no conflict of interest.
References
- He, C.; Chen, T.; Mao, X.; Zhou, Y. Economic transition, urbanization and population redistribution in China. Habitat Int. 2016, 51, 39–47. [Google Scholar] [CrossRef]
- National Bureau of Statistics of China (NBSC). Chinese Statistics Yearbook; NBSC: Beijing, China, 2016.
- Pedroni, P.; Yao, J.Y. Regional income divergence in China. J. Asian Econ. 2006, 17, 294–315. [Google Scholar] [CrossRef]
- Lu, S.; Guan, X.; Yu, D.; Deng, Y.; Zhou, L. Multi-Scale Analysis of Regional Inequality based on Spatial Field Model: A Case Study of China from 2000 to 2012. ISPRS Int. J. Geo-Inf. 2015, 4, 1982–2003. [Google Scholar] [CrossRef]
- Li, C.; Gibson, J. Rising Regional Inequality in China: Fact or Artifact? World Dev. 2013, 47, 16–29. [Google Scholar] [CrossRef]
- Sun, M.; Fan, C.C. Regional Inequality in China, 1978–2006. Eurasian Geogr. Econ. 2008, 49, 1–18. [Google Scholar] [CrossRef]
- He, S.; Bayrak, M.M.; Lin, H. A comparative analysis of multi-scalar regional inequality in China. Geoforum 2017, 78, 1–11. [Google Scholar] [CrossRef]
- Li, Y.; Wei, Y.H.D. The spatial-temporal hierarchy of regional inequality of China. Appl. Geogr. 2010, 30, 303–316. [Google Scholar] [CrossRef]
- Wei, Y.D. Spatiality of regional inequality. Appl. Geogr. 2015, 61, 1–10. [Google Scholar] [CrossRef]
- Sun, W.; Lin, X.; Liang, Y.; Li, L. Regional Inequality in Underdeveloped Areas: A Case Study of Guizhou Province in China. Sustainability 2016, 8, 1141. [Google Scholar] [CrossRef]
- Ye, X.; Ma, L.; Ye, K.; Chen, J.; Xie, Q. Analysis of Regional Inequality from Sectoral Structure, Spatial Policy and Economic Development: A Case Study of Chongqing, China. Sustainability 2017, 9, 633. [Google Scholar] [CrossRef]
- Ghosh, T.; Anderson, S.; Elvidge, C.; Sutton, P. Using Nighttime Satellite Imagery as a Proxy Measure of Human Well-Being. Sustainability 2013, 5, 4988–5019. [Google Scholar] [CrossRef]
- Zhou, Y.; Ma, T.; Zhou, C.; Xu, T. Nighttime Light Derived Assessment of Regional Inequality of Socioeconomic Development in China. Remote Sens. 2015, 7, 1242–1262. [Google Scholar] [CrossRef]
- Chinese province admits falsifying economic data for years. Governor Chen Qiufa of Liaoning. Available online: http://www.chinadaily.com.cn/kindle/2017-01/18/content_27989234.htm (accessed on 1 October 2017).
- Shi, K.; Chen, Y.; Yu, B.; Xu, T.; Yang, C.; Li, L.; Huang, C.; Chen, Z.; Liu, R.; Wu, J. Detecting spatiotemporal dynamics of global electric power consumption using DMSP-OLS nighttime stable light data. Appl. Energy 2016, 184, 450–463. [Google Scholar] [CrossRef]
- Liu, Z.; He, C.; Zhang, Q.; Huang, Q.; Yang, Y. Extracting the dynamics of urban expansion in China using DMSP-OLS nighttime light data from 1992 to 2008. Landsc. Urban Plan. 2012, 106, 62–72. [Google Scholar] [CrossRef]
- He, C.; Ma, Q.; Liu, Z.; Zhang, Q. Modeling the spatiotemporal dynamics of electric power consumption in Mainland China using saturation-corrected DMSP/OLS nighttime stable light data. Int. J. Digit. Earth 2013, 7, 993–1014. [Google Scholar] [CrossRef]
- Shi, K.; Chen, Y.; Yu, B.; Xu, T.; Chen, Z.; Liu, R.; Li, L.; Wu, J. Modeling spatiotemporal CO2 (carbon dioxide) emission dynamics in China from DMSP-OLS nighttime stable light data using panel data analysis. Appl. Energy 2016, 168, 523–533. [Google Scholar] [CrossRef]
- Ghosh, T.; Elvidge, C.D.; Sutton, P.C.; Baugh, K.E.; Ziskin, D.; Tuttle, B.T. Creating a Global Grid of Distributed Fossil Fuel CO2 Emissions from Nighttime Satellite Imagery. Energies 2010, 3, 1895–1913. [Google Scholar] [CrossRef]
- Coscieme, L.; Pulselli, F.M.; Bastianoni, S.; Elvidge, C.D.; Anderson, S.; Sutton, P.C. A Thermodynamic Geography: Night-Time Satellite Imagery as a Proxy Measure of Emergy. Ambio 2014, 43, 969–979. [Google Scholar] [CrossRef] [PubMed]
- Lessmann, C.; Seidel, A. Regional inequality, convergence, and its determinants—A view from outer space. Eur. Econ. Rev. 2017, 92, 110–132. [Google Scholar] [CrossRef]
- Elvidge, C.D.; Sutton, P.C.; Ghosh, T.; Tuttle, B.T.; Baugh, K.E.; Bhaduri, B.; Bright, E. A global poverty map derived from satellite data. Comput. Geosci. 2009, 35, 1652–1660. [Google Scholar] [CrossRef]
- Xu, H.; Yang, H.; Li, X.; Jin, H.; Li, D. Multi-Scale Measurement of Regional Inequality in Mainland China during 2005–2010 Using DMSP/OLS Night Light Imagery and Population Density Grid Data. Sustainability 2015, 7, 13469–13499. [Google Scholar] [CrossRef]
- Elvidge, C.D.; Baugh, K.E.; Anderson, S.J.; Sutton, P.C.; Ghosh, T. The Night Light Development Index (NLDI): A spatially explicit measure of human development from satellite data. Soc. Geogr. 2012, 7, 23–35. [Google Scholar] [CrossRef]
- Coscieme, L.; Sutton, P.C.; Anderson, S.; Liu, Q.; Elvidge, C.D. Dark Times: Nighttime satellite imagery as a detector of regional disparity and the geography of conflict. GISci. Remote Sens. 2017, 54, 118–139. [Google Scholar] [CrossRef]
- Zhao, M.; Cheng, W.; Zhou, C.; Li, M.; Wang, N.; Liu, Q. GDP Spatialization and Economic Differences in South China Based on NPP-VIIRS Nighttime Light Imagery. Remote Sens. 2017, 9, 673. [Google Scholar] [CrossRef]
- Ou, J.; Liu, X.; Li, X.; Li, M.; Li, W. Evaluation of NPP-VIIRS Nighttime Light Data for Mapping Global Fossil Fuel Combustion CO2 Emissions: A Comparison with DMSP-OLS Nighttime Light Data. PLoS ONE 2015, 10, e0138310. [Google Scholar] [CrossRef] [PubMed]
- Sharma, R.C.; Tateishi, R.; Hara, K.; Gharechelou, S.; Iizuka, K. Global mapping of urban built-up areas of year 2014 by combining MODIS multispectral data with VIIRS nighttime light data. Int. J. Digit. Earth 2016, 9, 1004–1020. [Google Scholar] [CrossRef]
- Gao, B.; Huang, Q.; He, C.; Dou, Y. Similarities and differences of city-size distributions in three main urban agglomerations of China from 1992 to 2015: A comparative study based on nighttime light data. J. Geogr. Sci. 2017, 27, 533–545. [Google Scholar] [CrossRef]
- Shi, K.; Yu, B.; Huang, Y.; Hu, Y.; Yin, B.; Chen, Z.; Chen, L.; Wu, J. Evaluating the Ability of NPP-VIIRS Nighttime Light Data to Estimate the Gross Domestic Product and the Electric Power Consumption of China at Multiple Scales: A Comparison with DMSP-OLS Data. Remote Sens. 2014, 6, 1705–1724. [Google Scholar] [CrossRef]
- Li, X.; Xu, H.; Chen, X.; Li, C. Potential of NPP-VIIRS Nighttime Light Imagery for Modeling the Regional Economy of China. Remote Sens. 2013, 5, 3057–3081. [Google Scholar] [CrossRef]
- Ma, T.; Zhou, C.; Pei, T.; Haynie, S.; Fan, J. Responses of Suomi-NPP VIIRS-derived nighttime lights to socioeconomic activity in China’s cities. Remote Sens. Lett. 2014, 5, 165–174. [Google Scholar] [CrossRef]
- Clarke-Sather, A.; Qu, J.; Wang, Q.; Zeng, J.; Li, Y. Carbon inequality at the sub-national scale: A case study of provincial-level inequality in CO2 emissions in China 1997–2007. Energy Policy 2011, 39, 5420–5428. [Google Scholar] [CrossRef]
- Akita, T. Decomposing regional income inequality in China and Indonesia using two-stage nested Theil decomposition method. Ann. Reg. Sci. 2003, 37, 55–77. [Google Scholar] [CrossRef]
- NEW—2015 VIIRS Nighttime Lights Annual Composite is Available. The Earth Observations Group (EOG). Available online: https://ngdc.noaa.gov/eog/viirs/download_dnb_composites.html (accessed on 1 October 2017).
- Mills, S.; Weiss, S.; Liang, C. VIIRS day/night band (DNB) stray light characterization and correction. Proc. SPIE 2013, 8866. [Google Scholar] [CrossRef]
- Levin, N.; Zhang, Q. A global analysis of factors controlling VIIRS nighttime light levels from densely populated areas. Remote Sens. Environ. 2017, 190, 366–382. [Google Scholar] [CrossRef]
- Levin, N. The impact of seasonal changes on observed nighttime brightness from 2014 to 2015 monthly VIIRS DNB composites. Remote Sens. Environ. 2017, 193, 150–164. [Google Scholar] [CrossRef]
- Liu, J.; Chen, R.; Song, Y. Distribution and Variation of Snow Cover in China. Progress. Inquis. Mutat. Clim. 2012, 8, 364–371. (In Chinese) [Google Scholar] [CrossRef]
- National Bureau of Statistics of China (NBSC). China Statistical Yearbook for Regional Economy, 2013–2015; NBSC: Beijing, China, 2015.
- Kuznets, S. Economic Growth and Income Inequality. Am. Econ. Rev. 1955, 45, 1–28. Available online: http://www.jstor.org/stable/1811581?seq=5#page_scan_tab_contents (accessed on 1 October 2017).
- Dai, Z.; Hu, Y.; Zhao, G. The Suitability of Different Nighttime Light Data for GDP Estimation at Different Spatial Scales and Regional Levels. Sustainability 2017, 9, 305. [Google Scholar] [CrossRef]
- Xu, M.; He, C.; Liu, Z.; Dou, Y. How Did Urban Land Expand in China between 1992 and 2015? A Multi-Scale Landscape Analysis. PLoS ONE 2016, 11, e0154839. [Google Scholar] [CrossRef] [PubMed]
- Long, Y.; Wu, K. Shrinking cities in a rapidly urbanizing China. Environ. Plan. A 2016, 48, 220–222. [Google Scholar] [CrossRef]
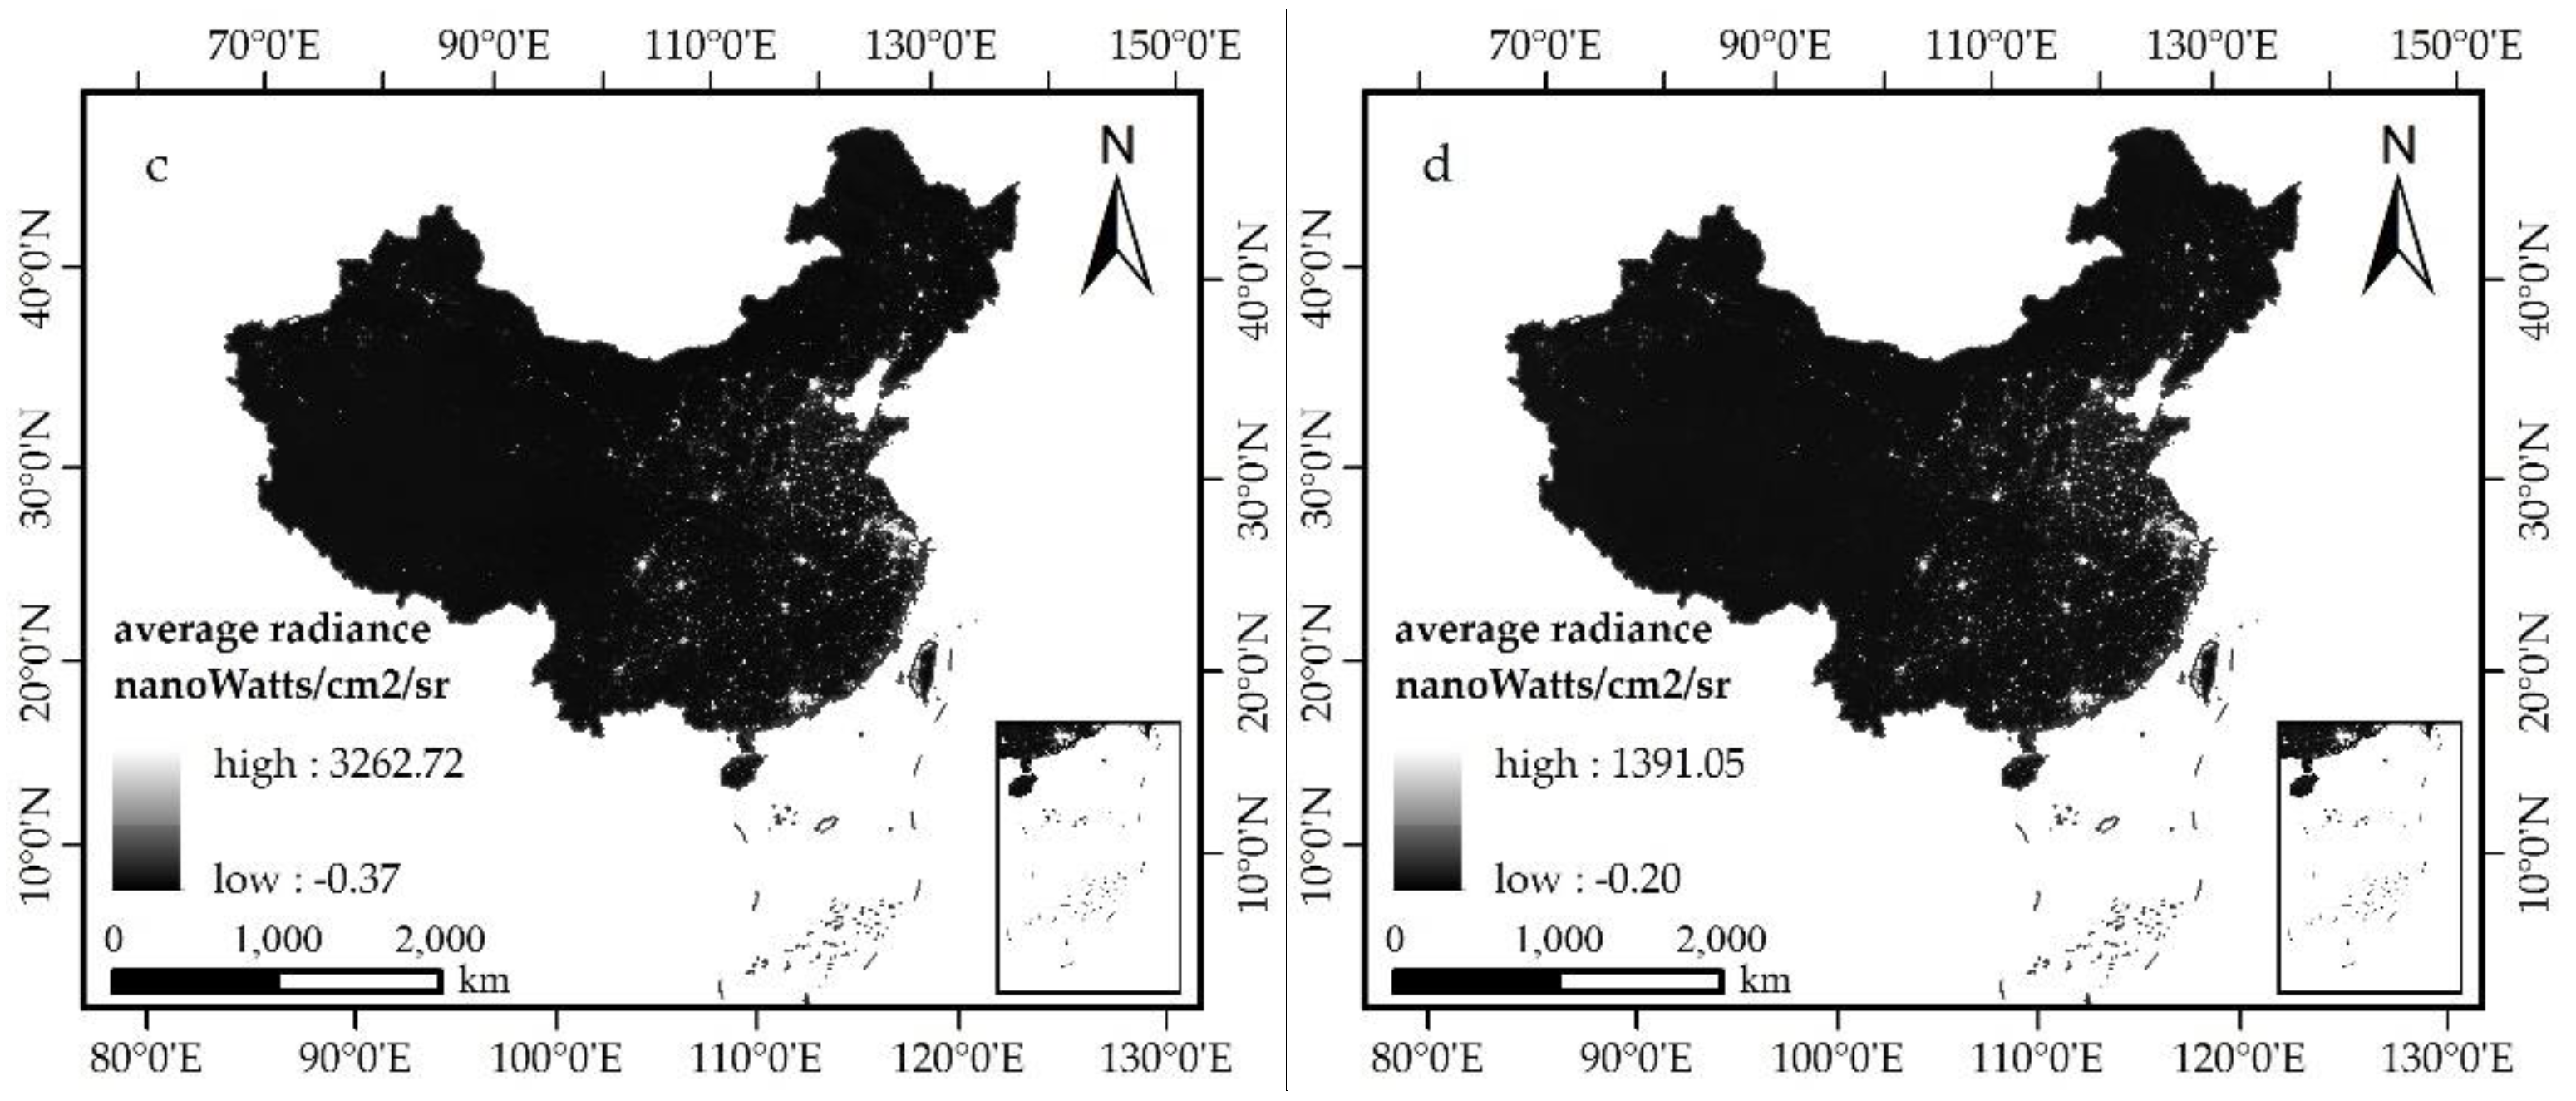
Figure 1.
The monthly average value of the NPP-VIIRS NTL data from July to September of China in 2014 (a), 2015 (b), 2016 (c), 2017 (d).
Figure 1.
The monthly average value of the NPP-VIIRS NTL data from July to September of China in 2014 (a), 2015 (b), 2016 (c), 2017 (d).
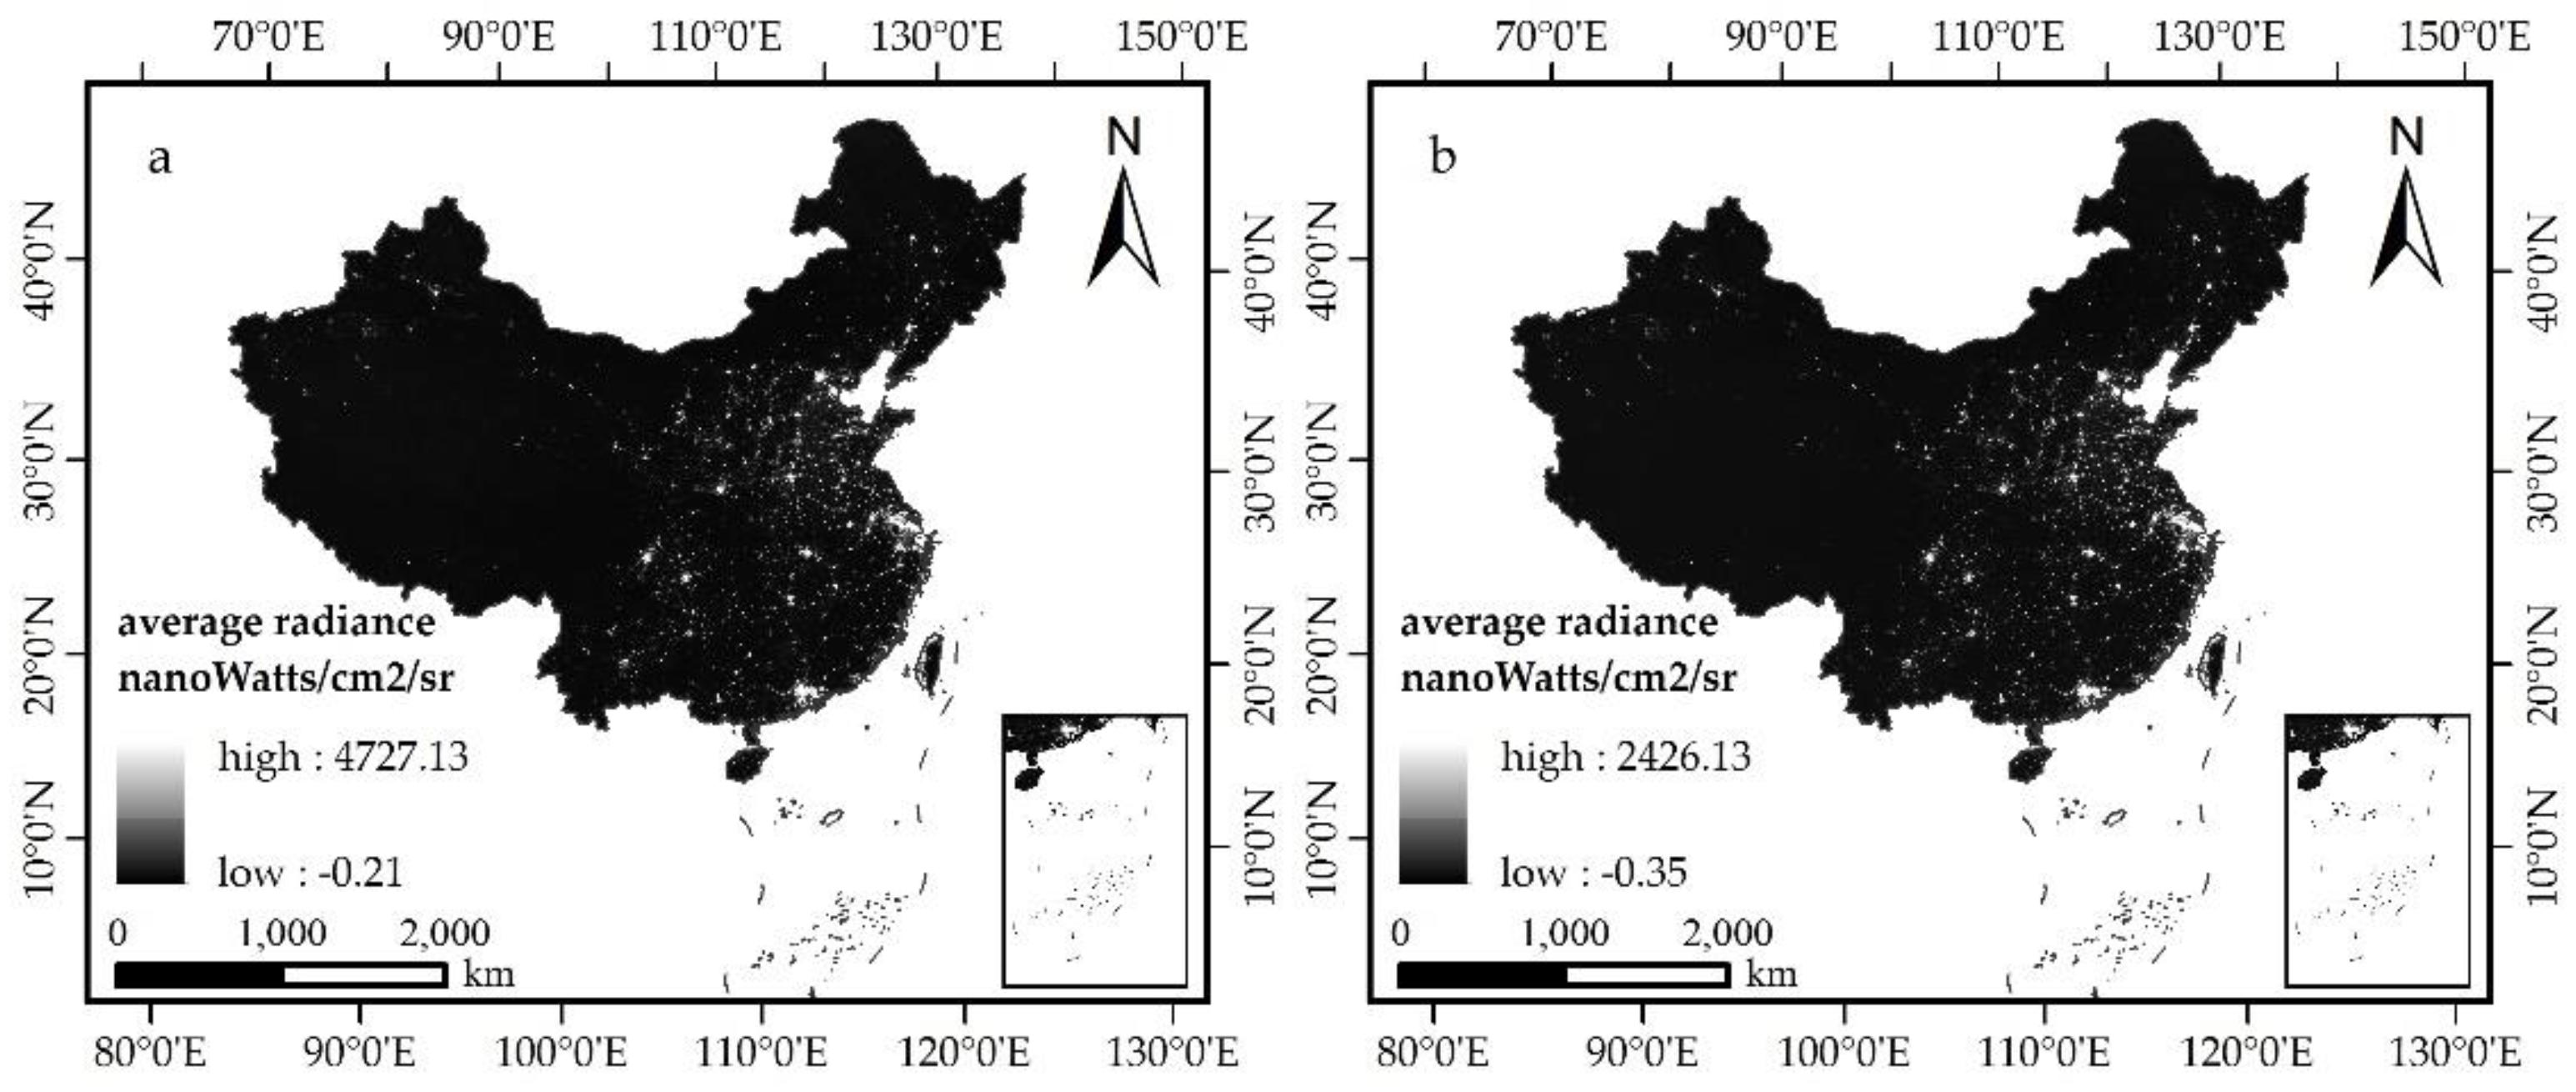

Figure 2.
The annual composites of VIIRS Cloud Mask—Outlier Removed—Night-Time Lights (NPP-VIIRS NTL) data of China in 2015.
Figure 2.
The annual composites of VIIRS Cloud Mask—Outlier Removed—Night-Time Lights (NPP-VIIRS NTL) data of China in 2015.
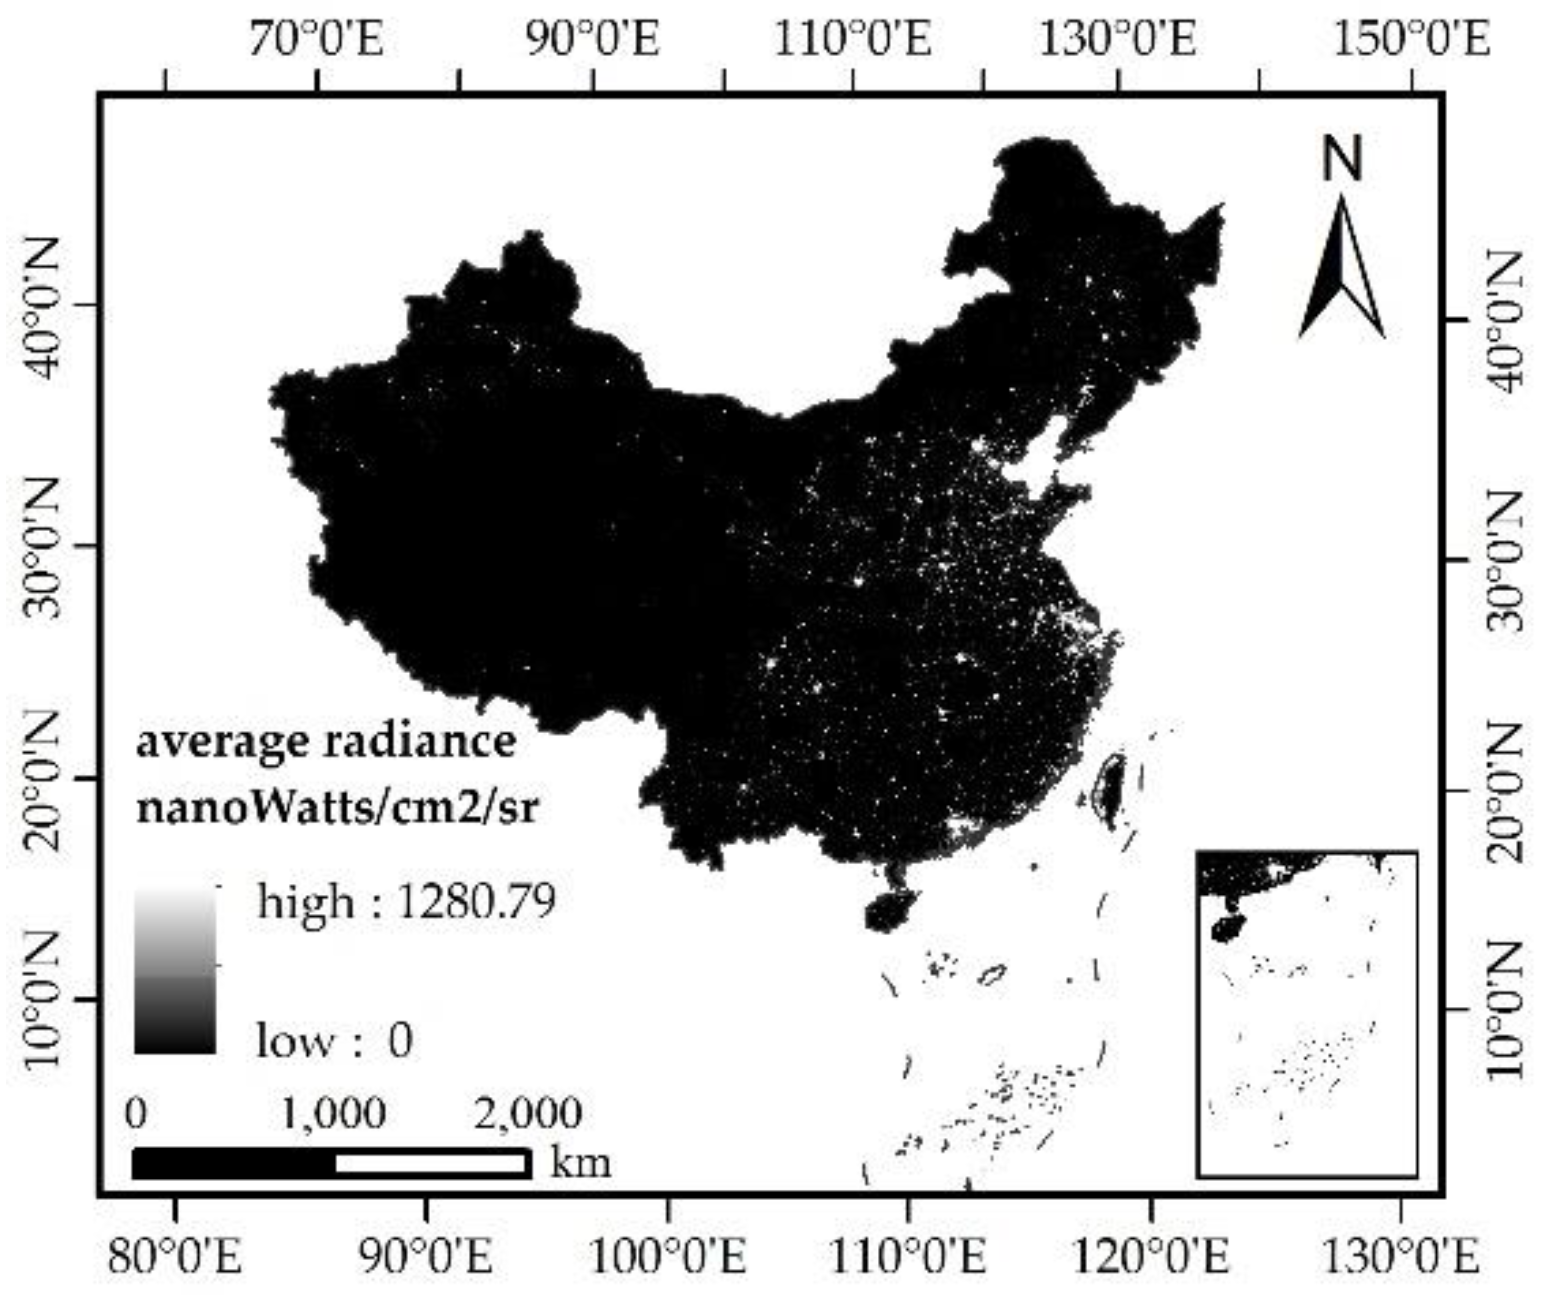
Figure 3.
Scatter plots depicting the relationship between Night-Time Light (NTL) and Gross Domestic Product (GDP), at the provincial (Left) and prefectural (Right) levels in 2015.
Figure 3.
Scatter plots depicting the relationship between Night-Time Light (NTL) and Gross Domestic Product (GDP), at the provincial (Left) and prefectural (Right) levels in 2015.
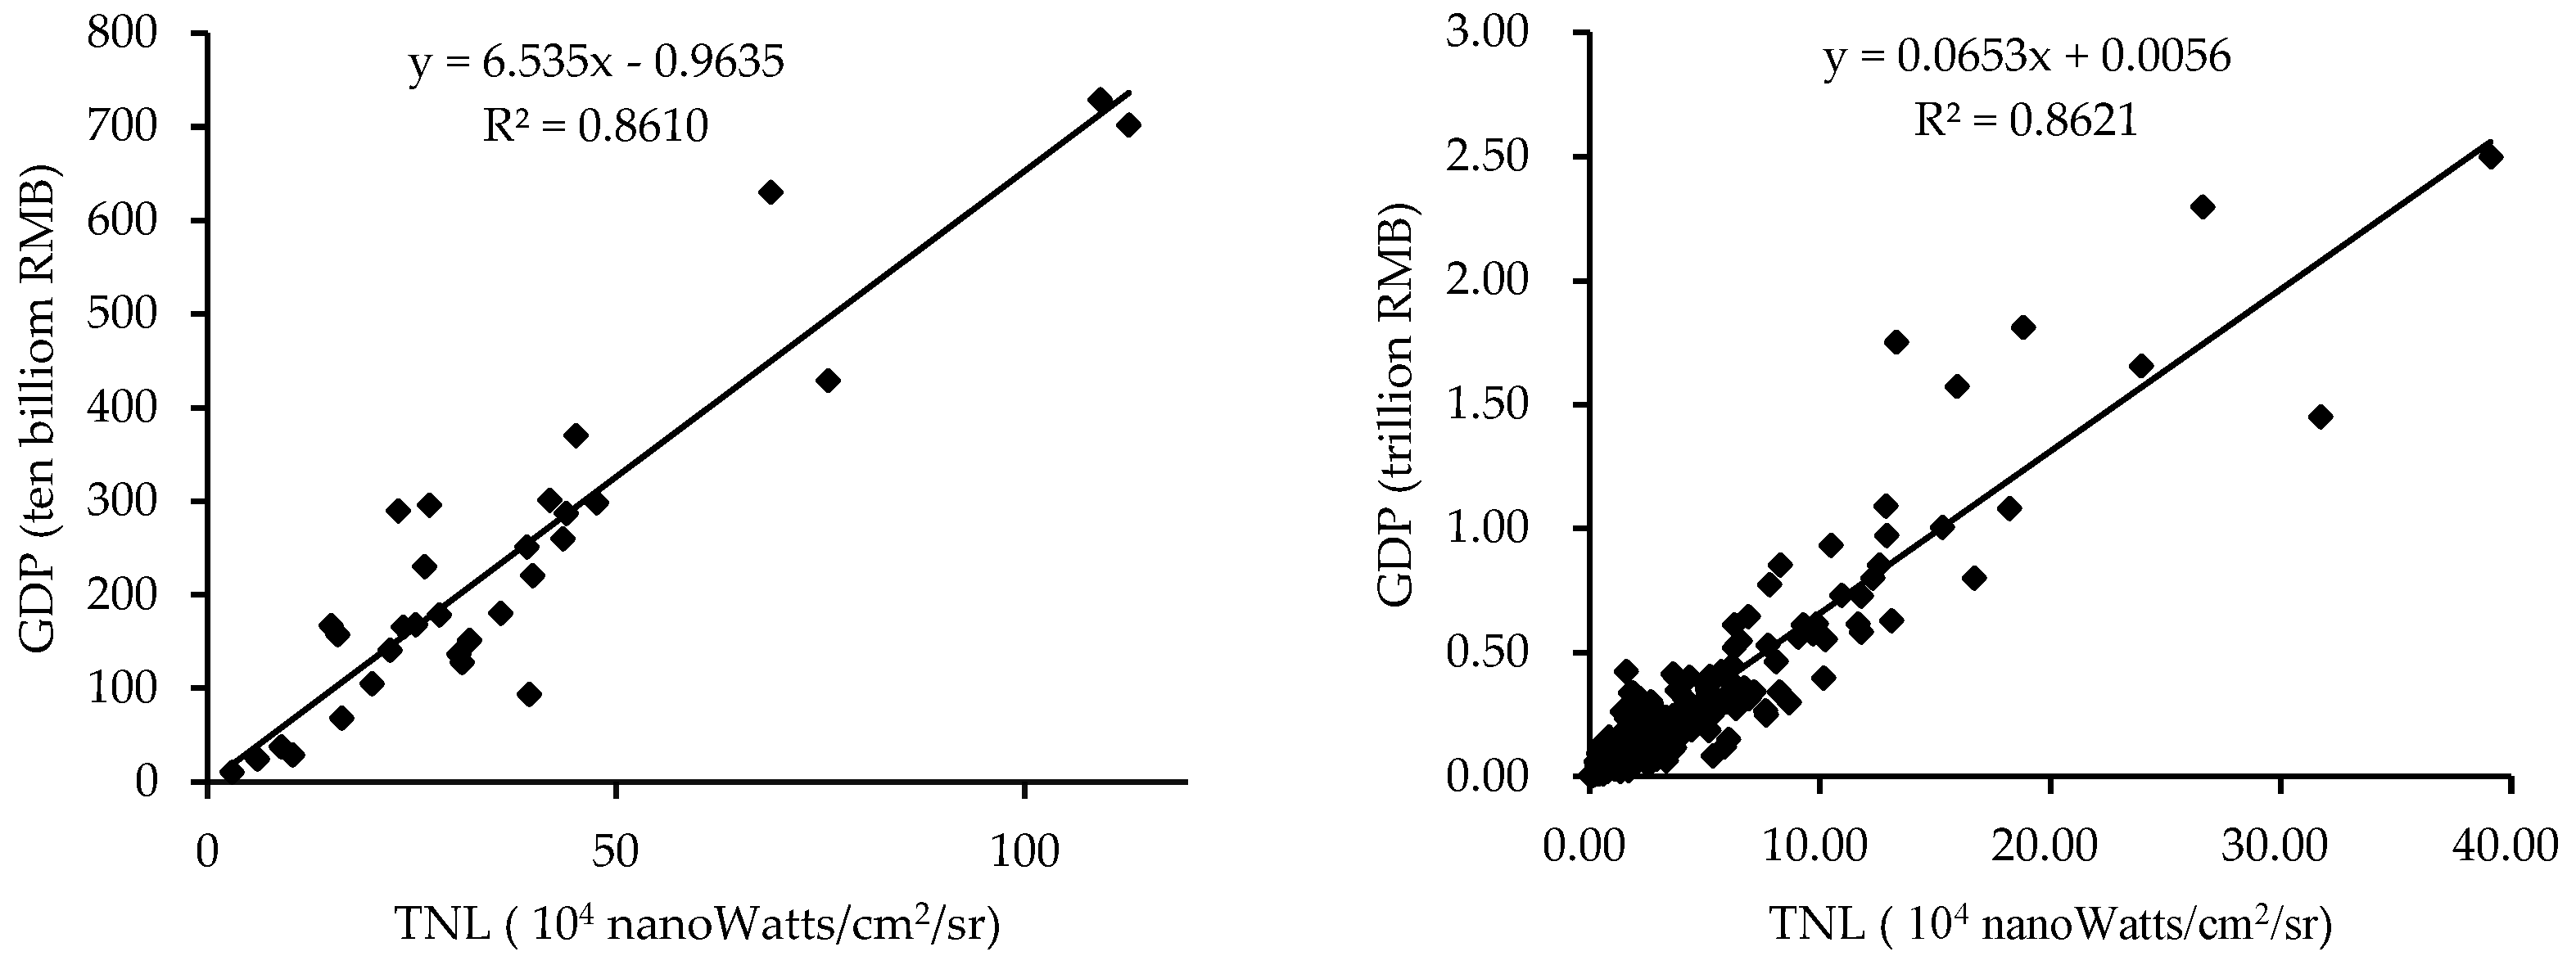
Figure 4.
The 341 prefectural level regions in the 31 provinces for analysis in this study.
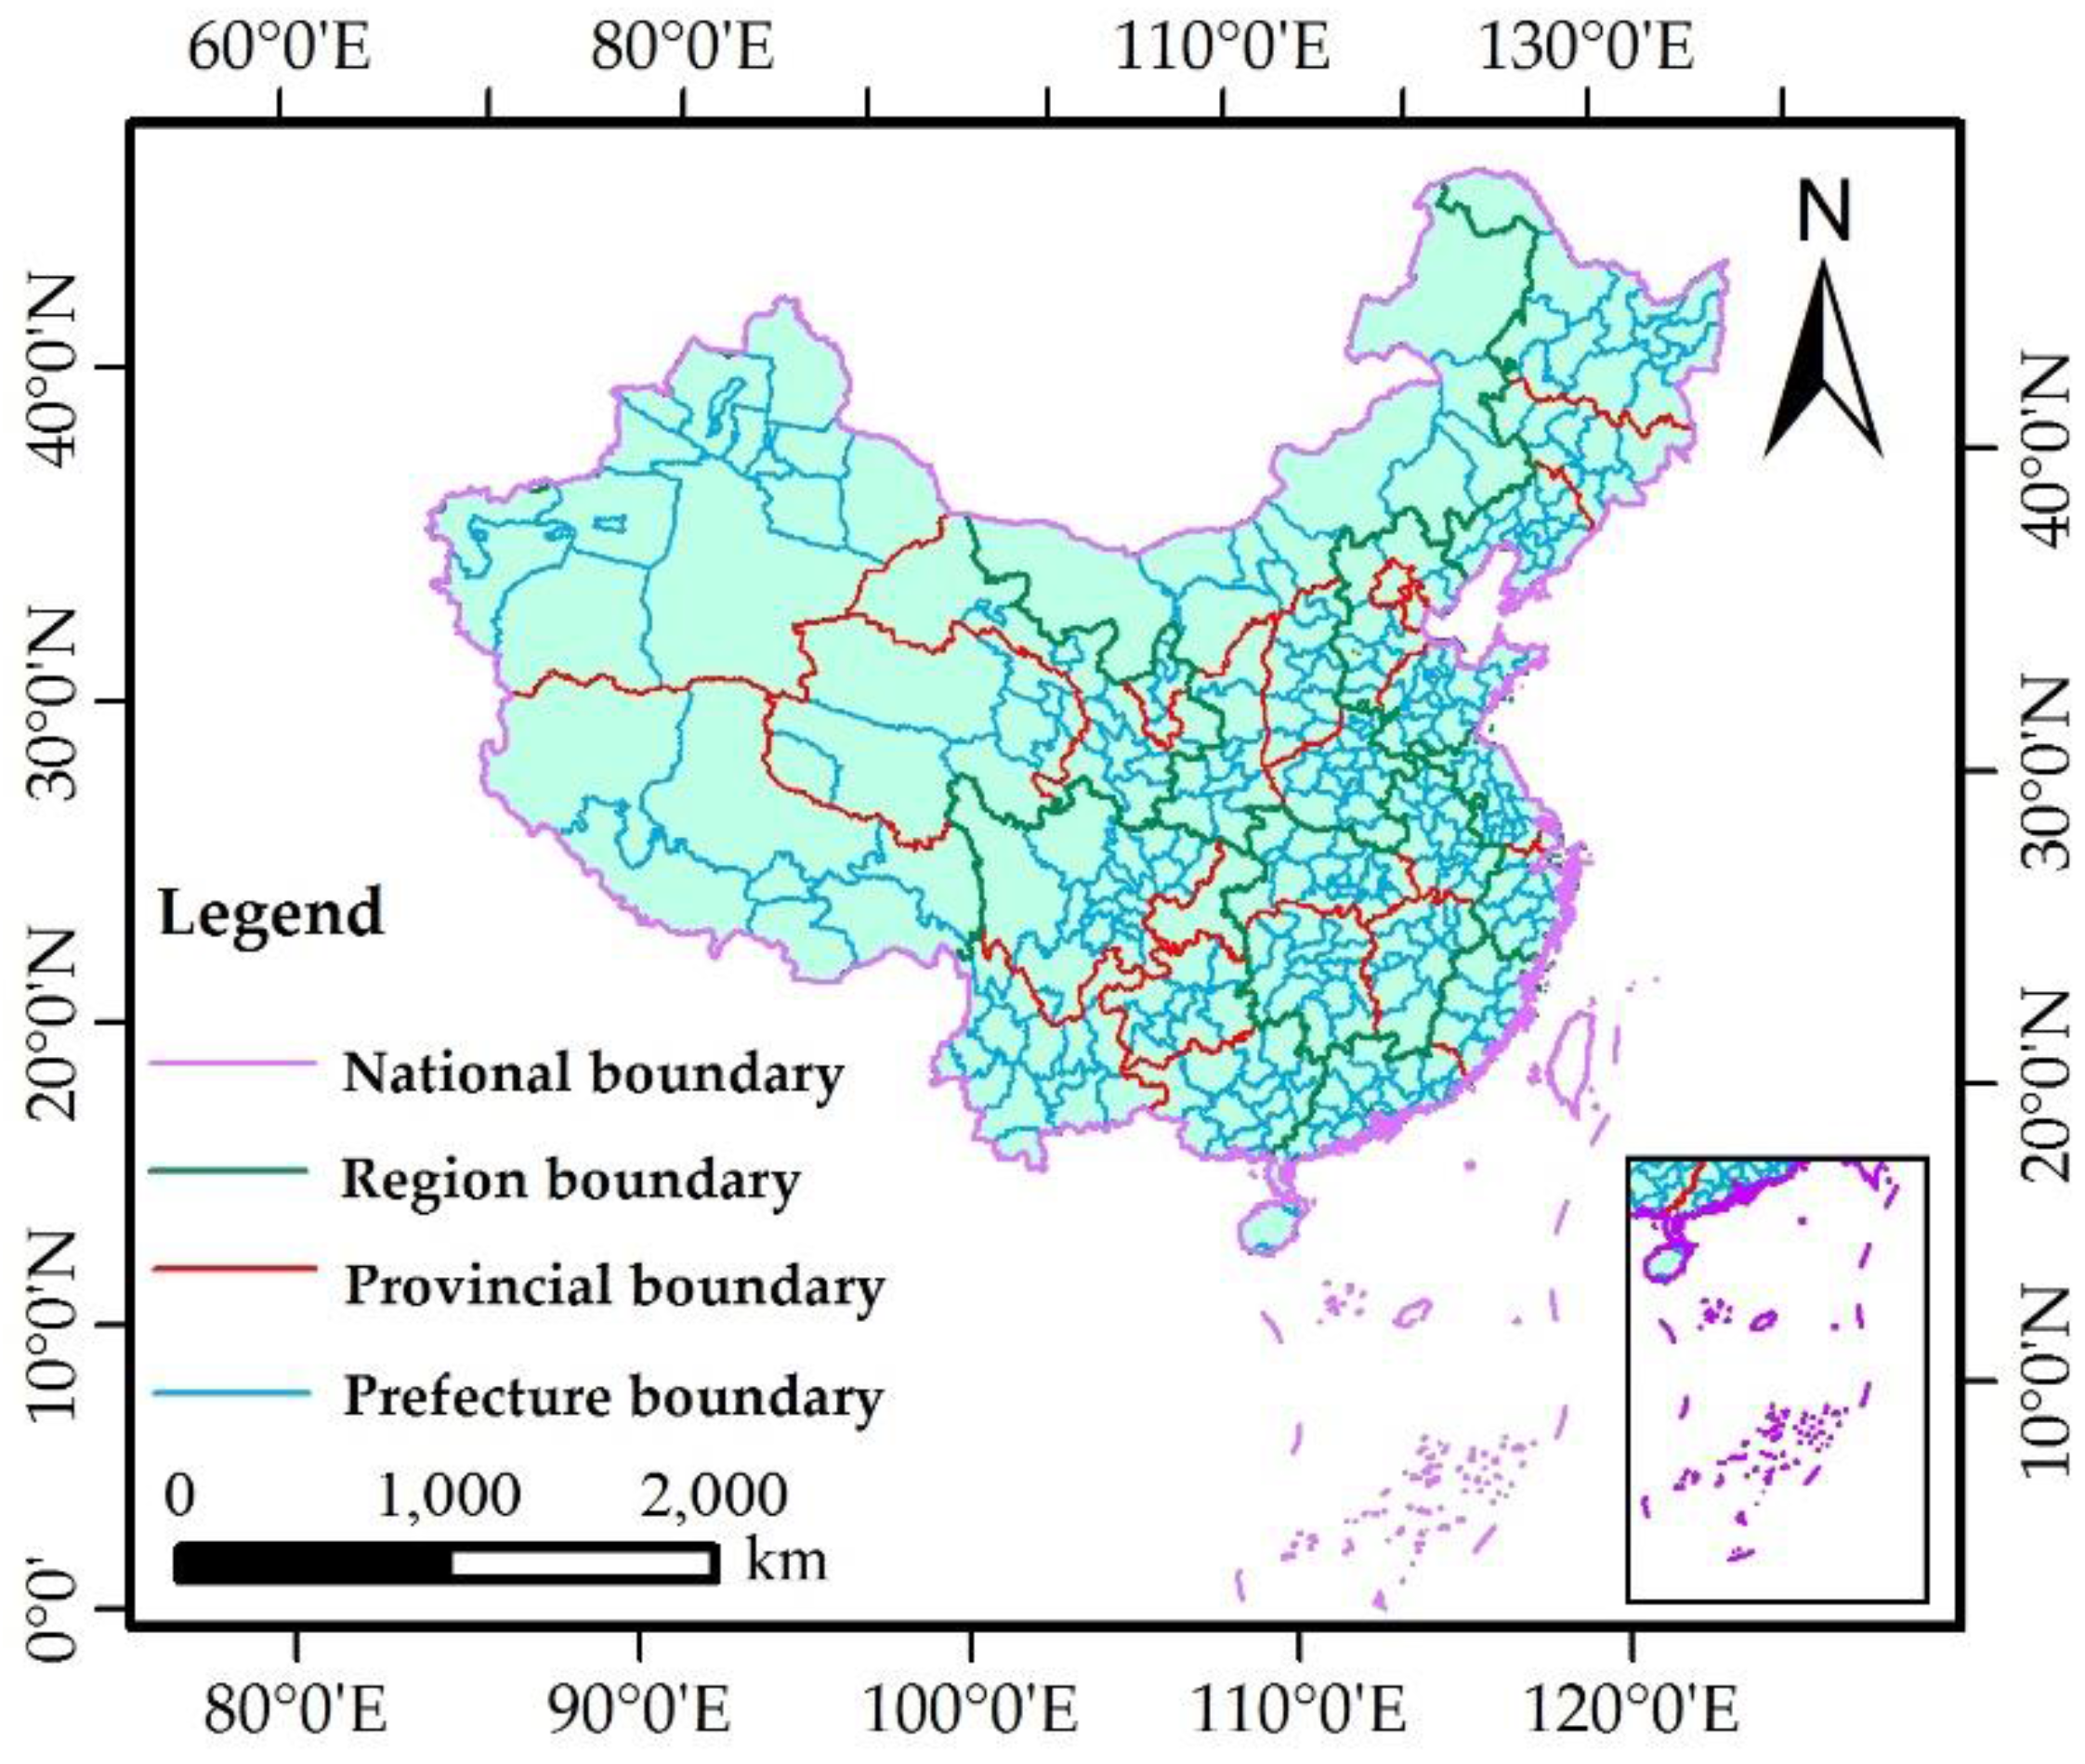
Figure 5.
(a) The corrected NPP-VIIRS NTL data of mainland China in 2014. Two regions bounded by red rectangles are Bayingolin, Xinjiang (sampling area No.1) and Hechi, Guangxi (sampling area No.2). The (b) original and (c) corrected image of sampling area No.1; and the (d) original and (e) corrected image of sampling area No.2). The two example lit areas that were removed during correction are indicated by red circles and blue arrows.

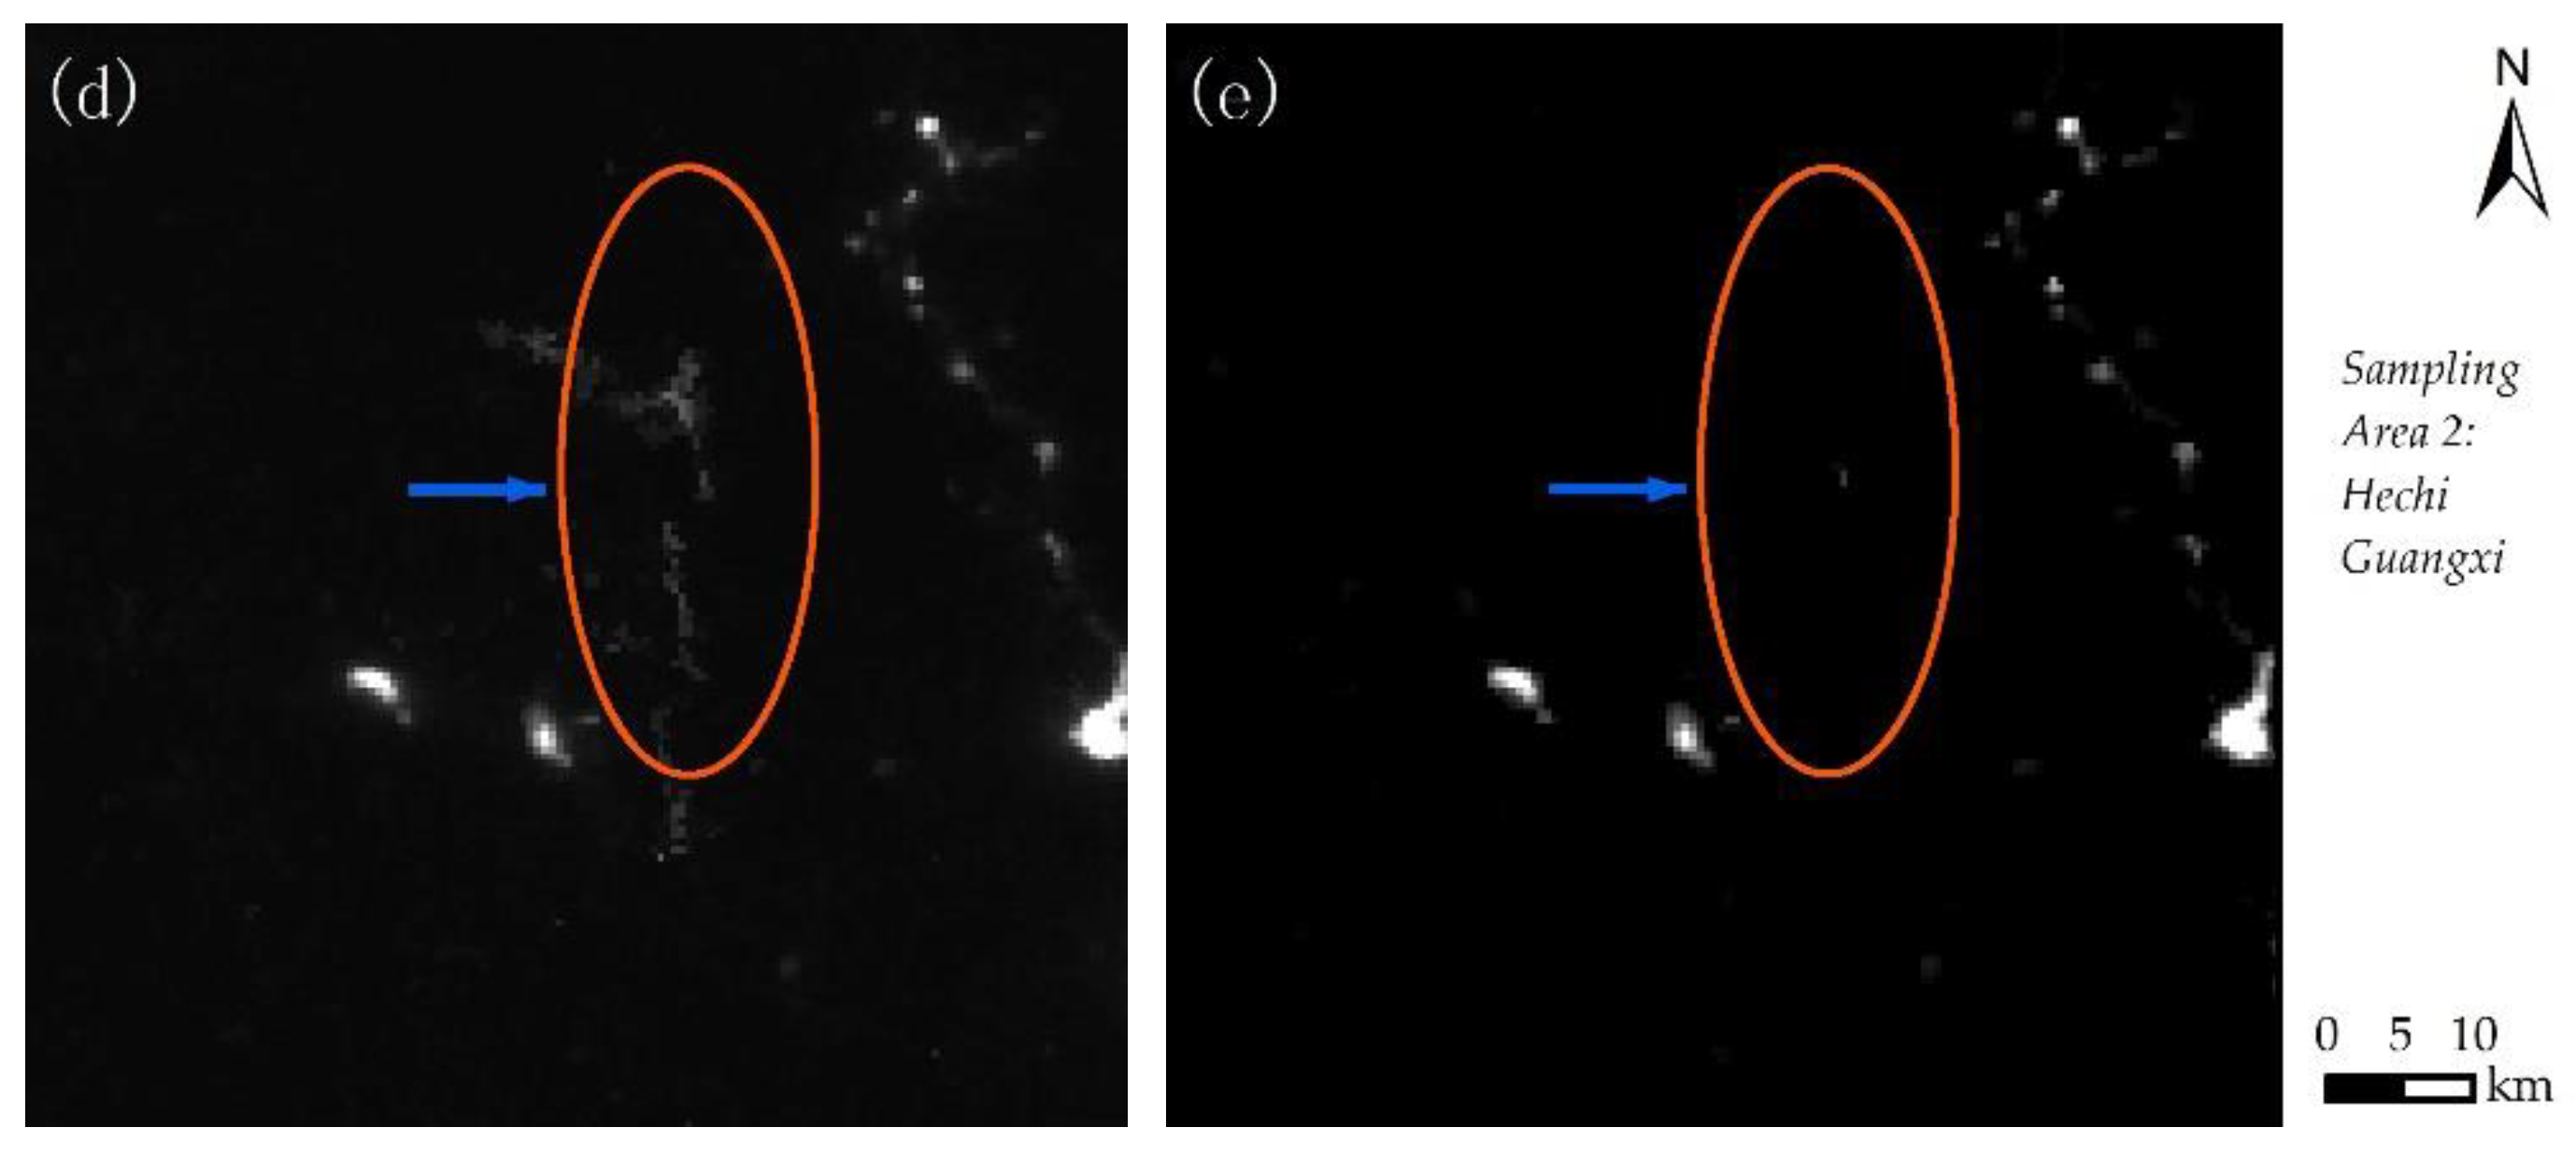
Figure 6.
The scatter diagram of the regression variables at the provincial and prefectural level: (a2014,a2015,a2016) the original NPP-VIIRS NTL data in 2014–2016 versus GDP data in 2014–2016 at the provincial level, (b2014,b2015,b2016) the corrected NPP-VIIRS NTL data in 2014–2016 versus GDP data in 2014–2016 at the provincial level, (c2014,c2015,c2016) the original NPP-VIIRS NTL data in 2014–2016 versus GDP data in 2014–2016 at the prefectural level, (d2014,d2015,d2016) the corrected NPP-VIIRS NTL data in 2014–2016 versus GDP data in 2014–2016 at the prefectural level.
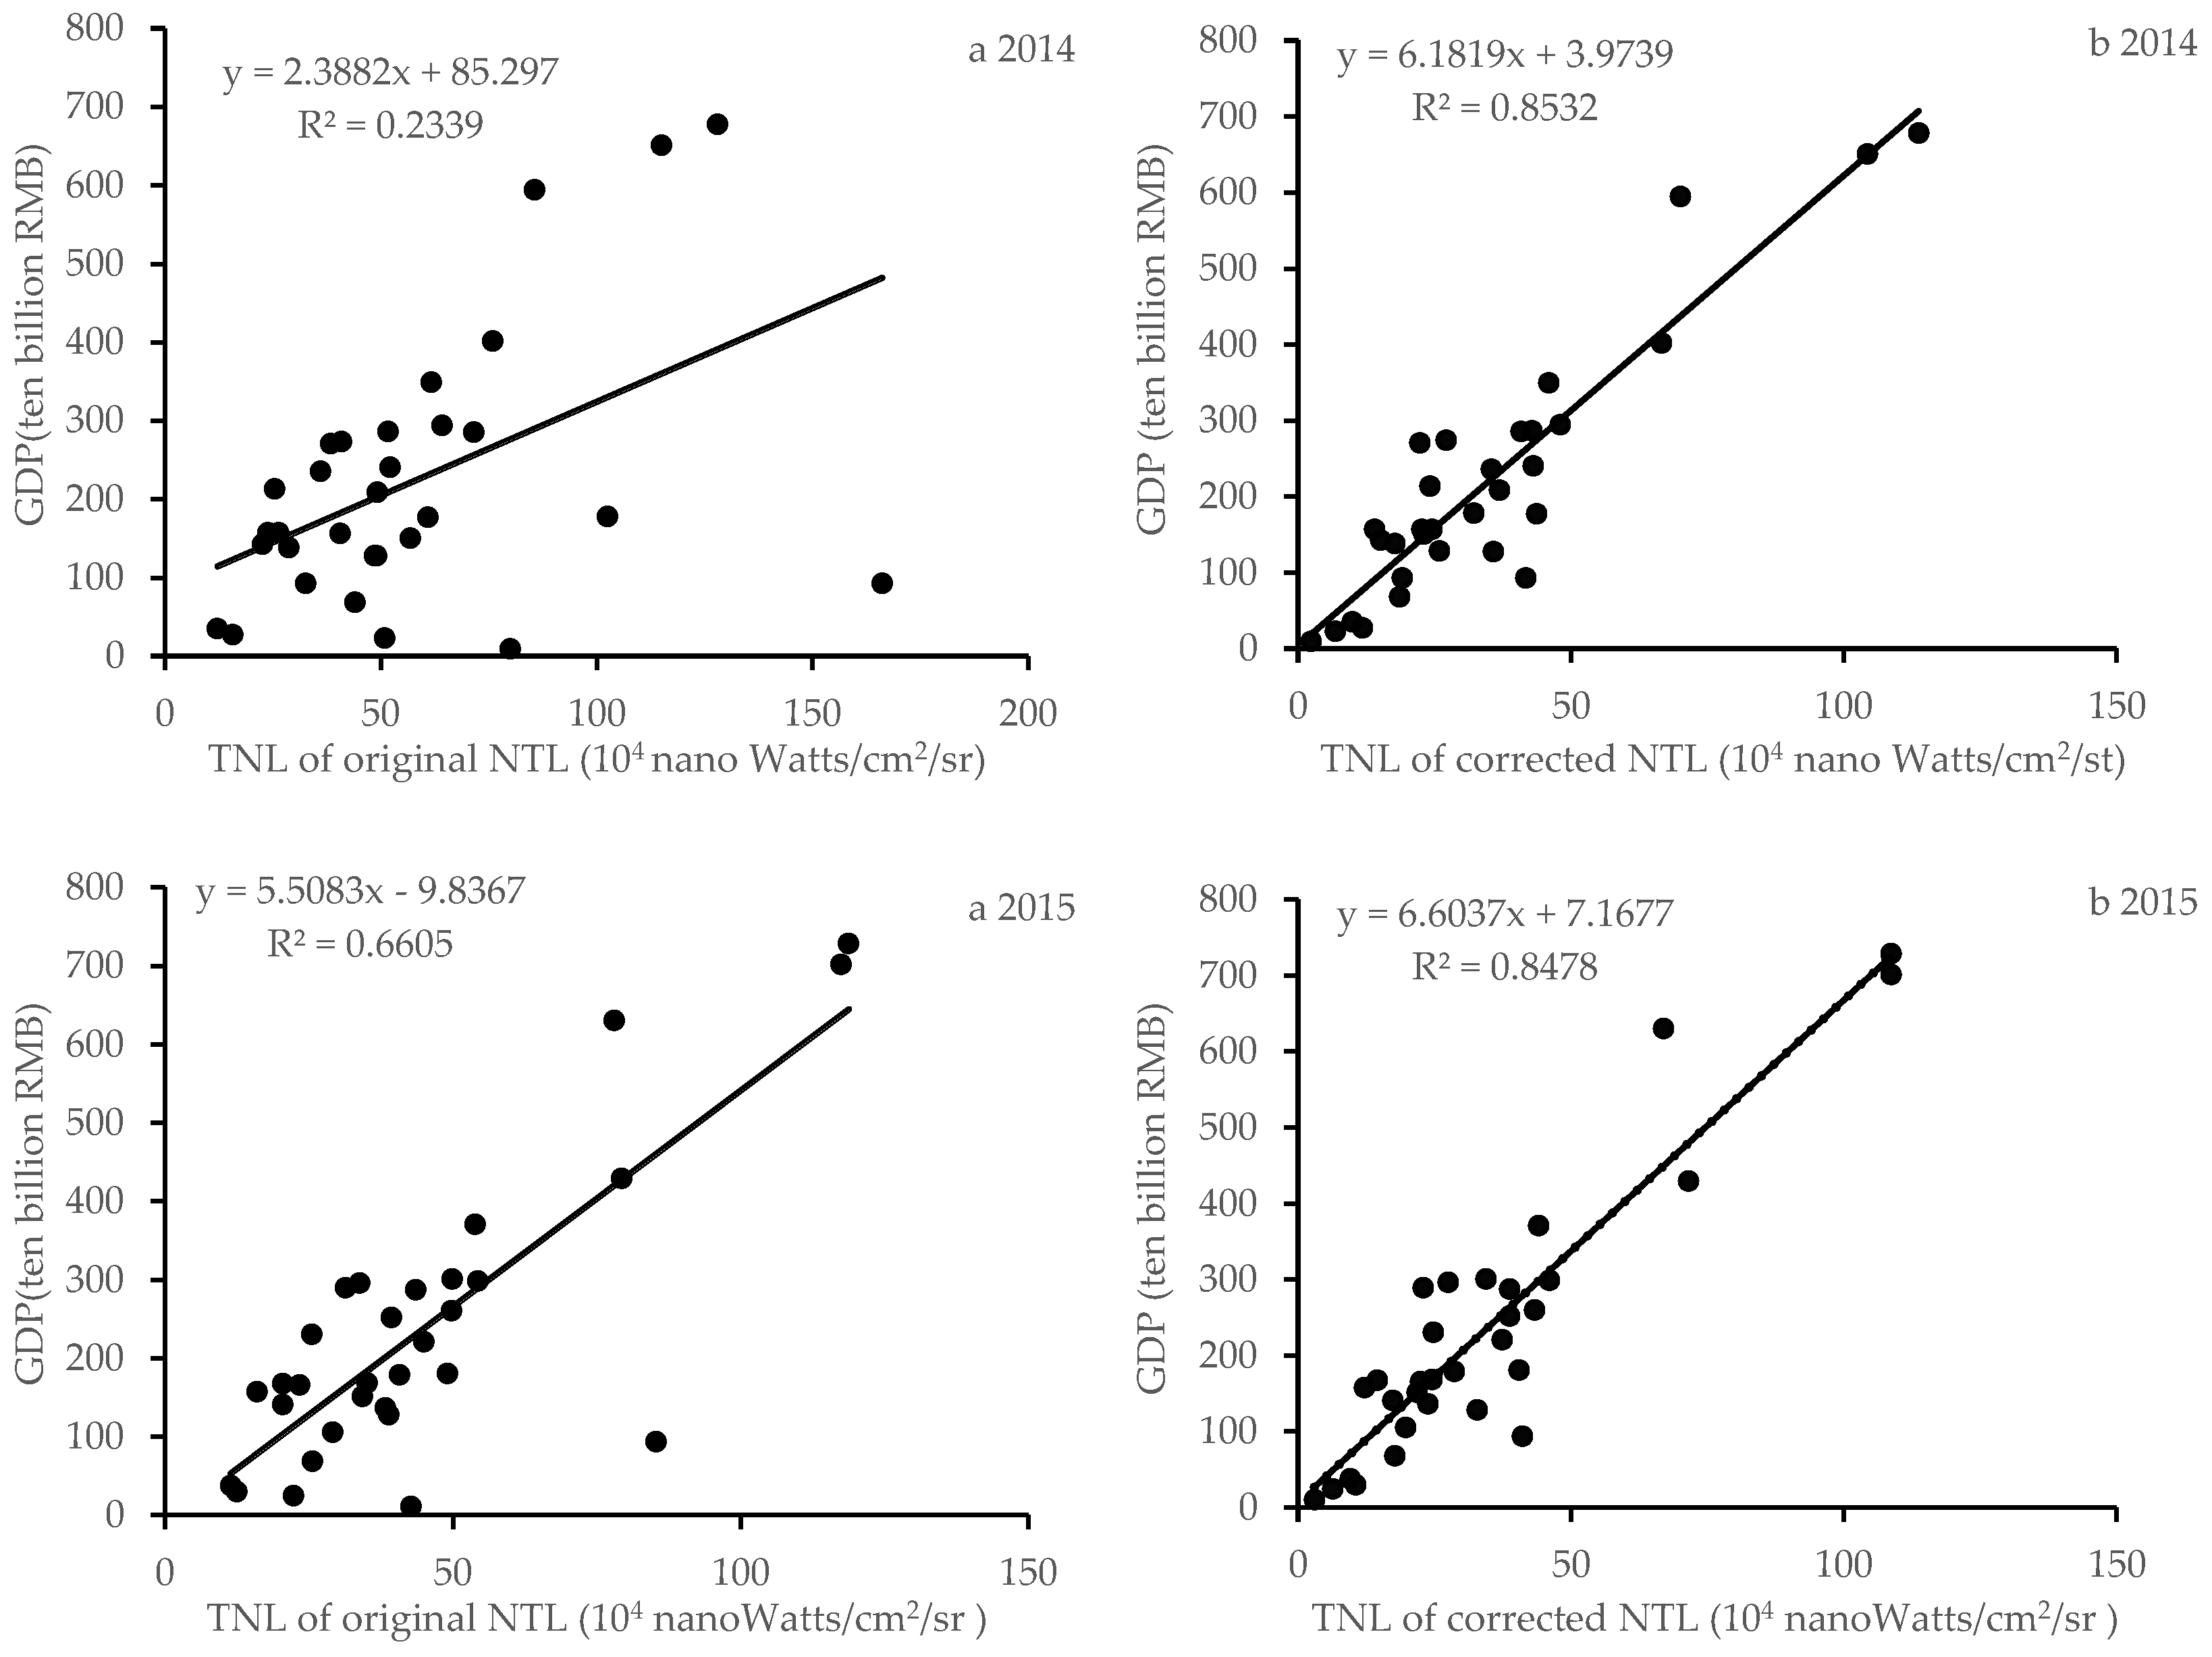
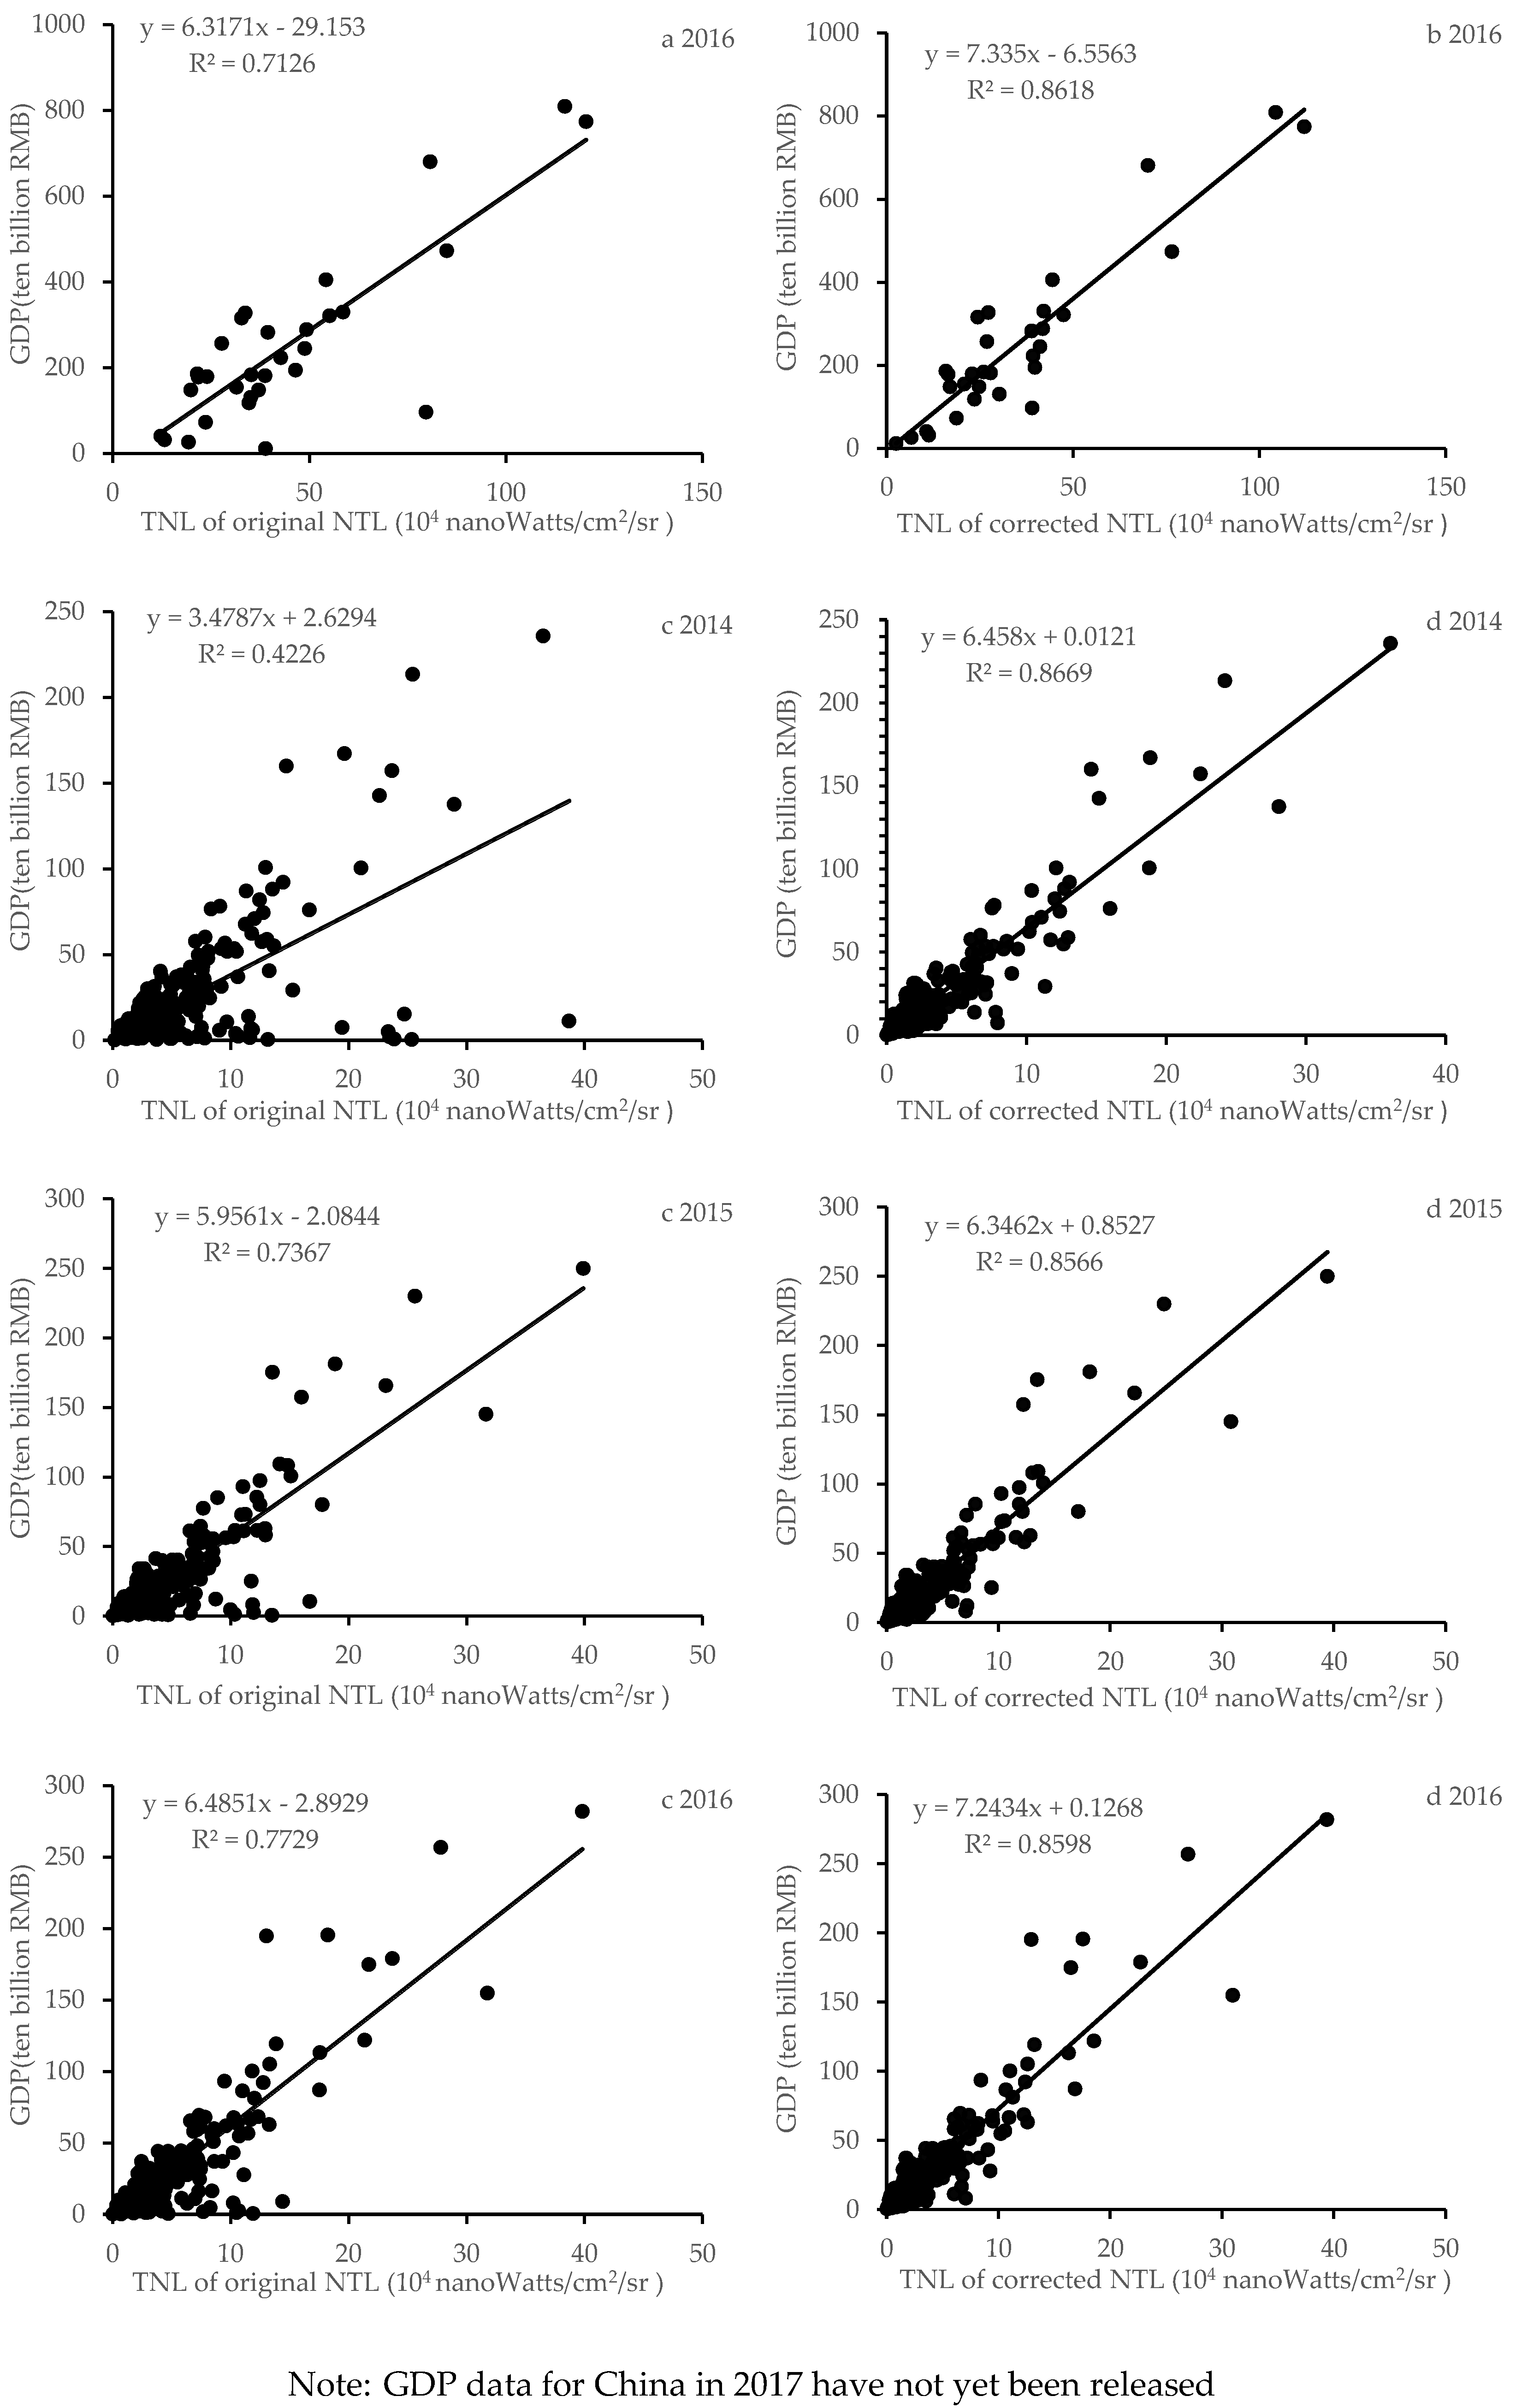
Figure 7.
Evolving trends of the Overall inequality (T), Within-province inequality (TWP), Between-region inequality (TBR), and Between-province inequality (TBP).
Figure 7.
Evolving trends of the Overall inequality (T), Within-province inequality (TWP), Between-region inequality (TBR), and Between-province inequality (TBP).

Figure 8.
Contribution rate of Within-province inequality (TWP), Between-region inequality (TBR), and Between-province inequality (TBP) to overall inequality from 2014 to 2017.
Figure 8.
Contribution rate of Within-province inequality (TWP), Between-region inequality (TBR), and Between-province inequality (TBP) to overall inequality from 2014 to 2017.
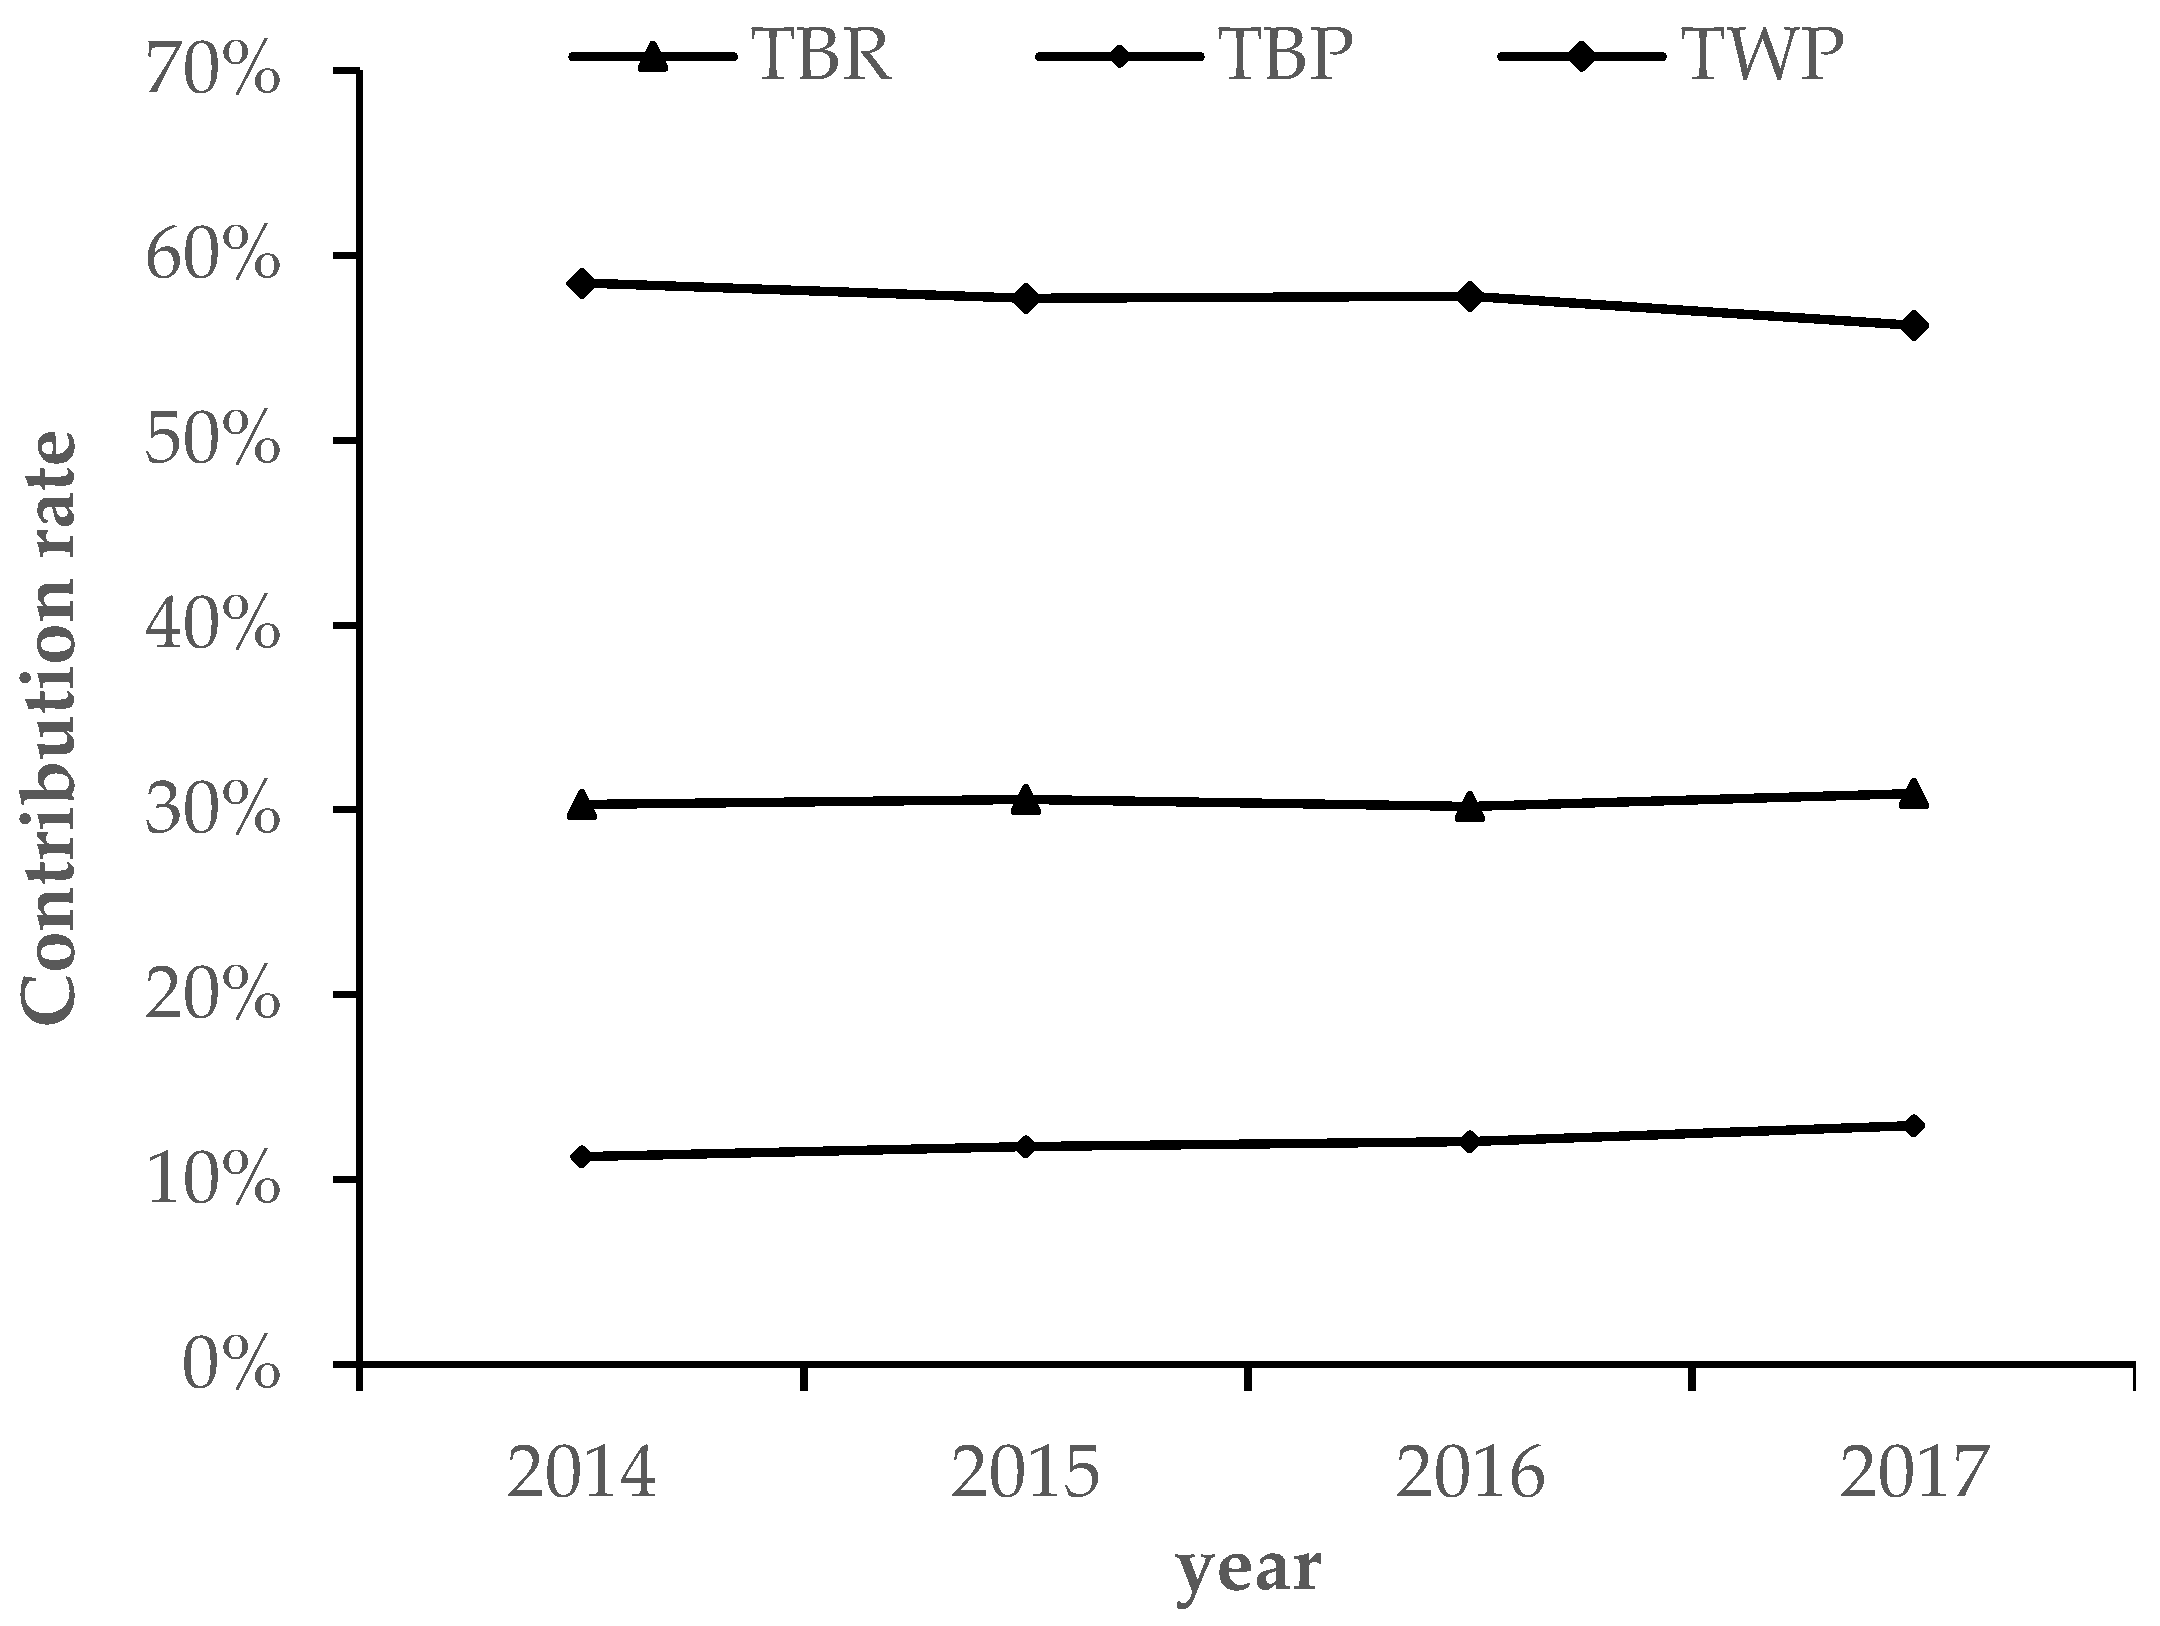
Figure 9.
Theil index of each province in China, 2014–2017.
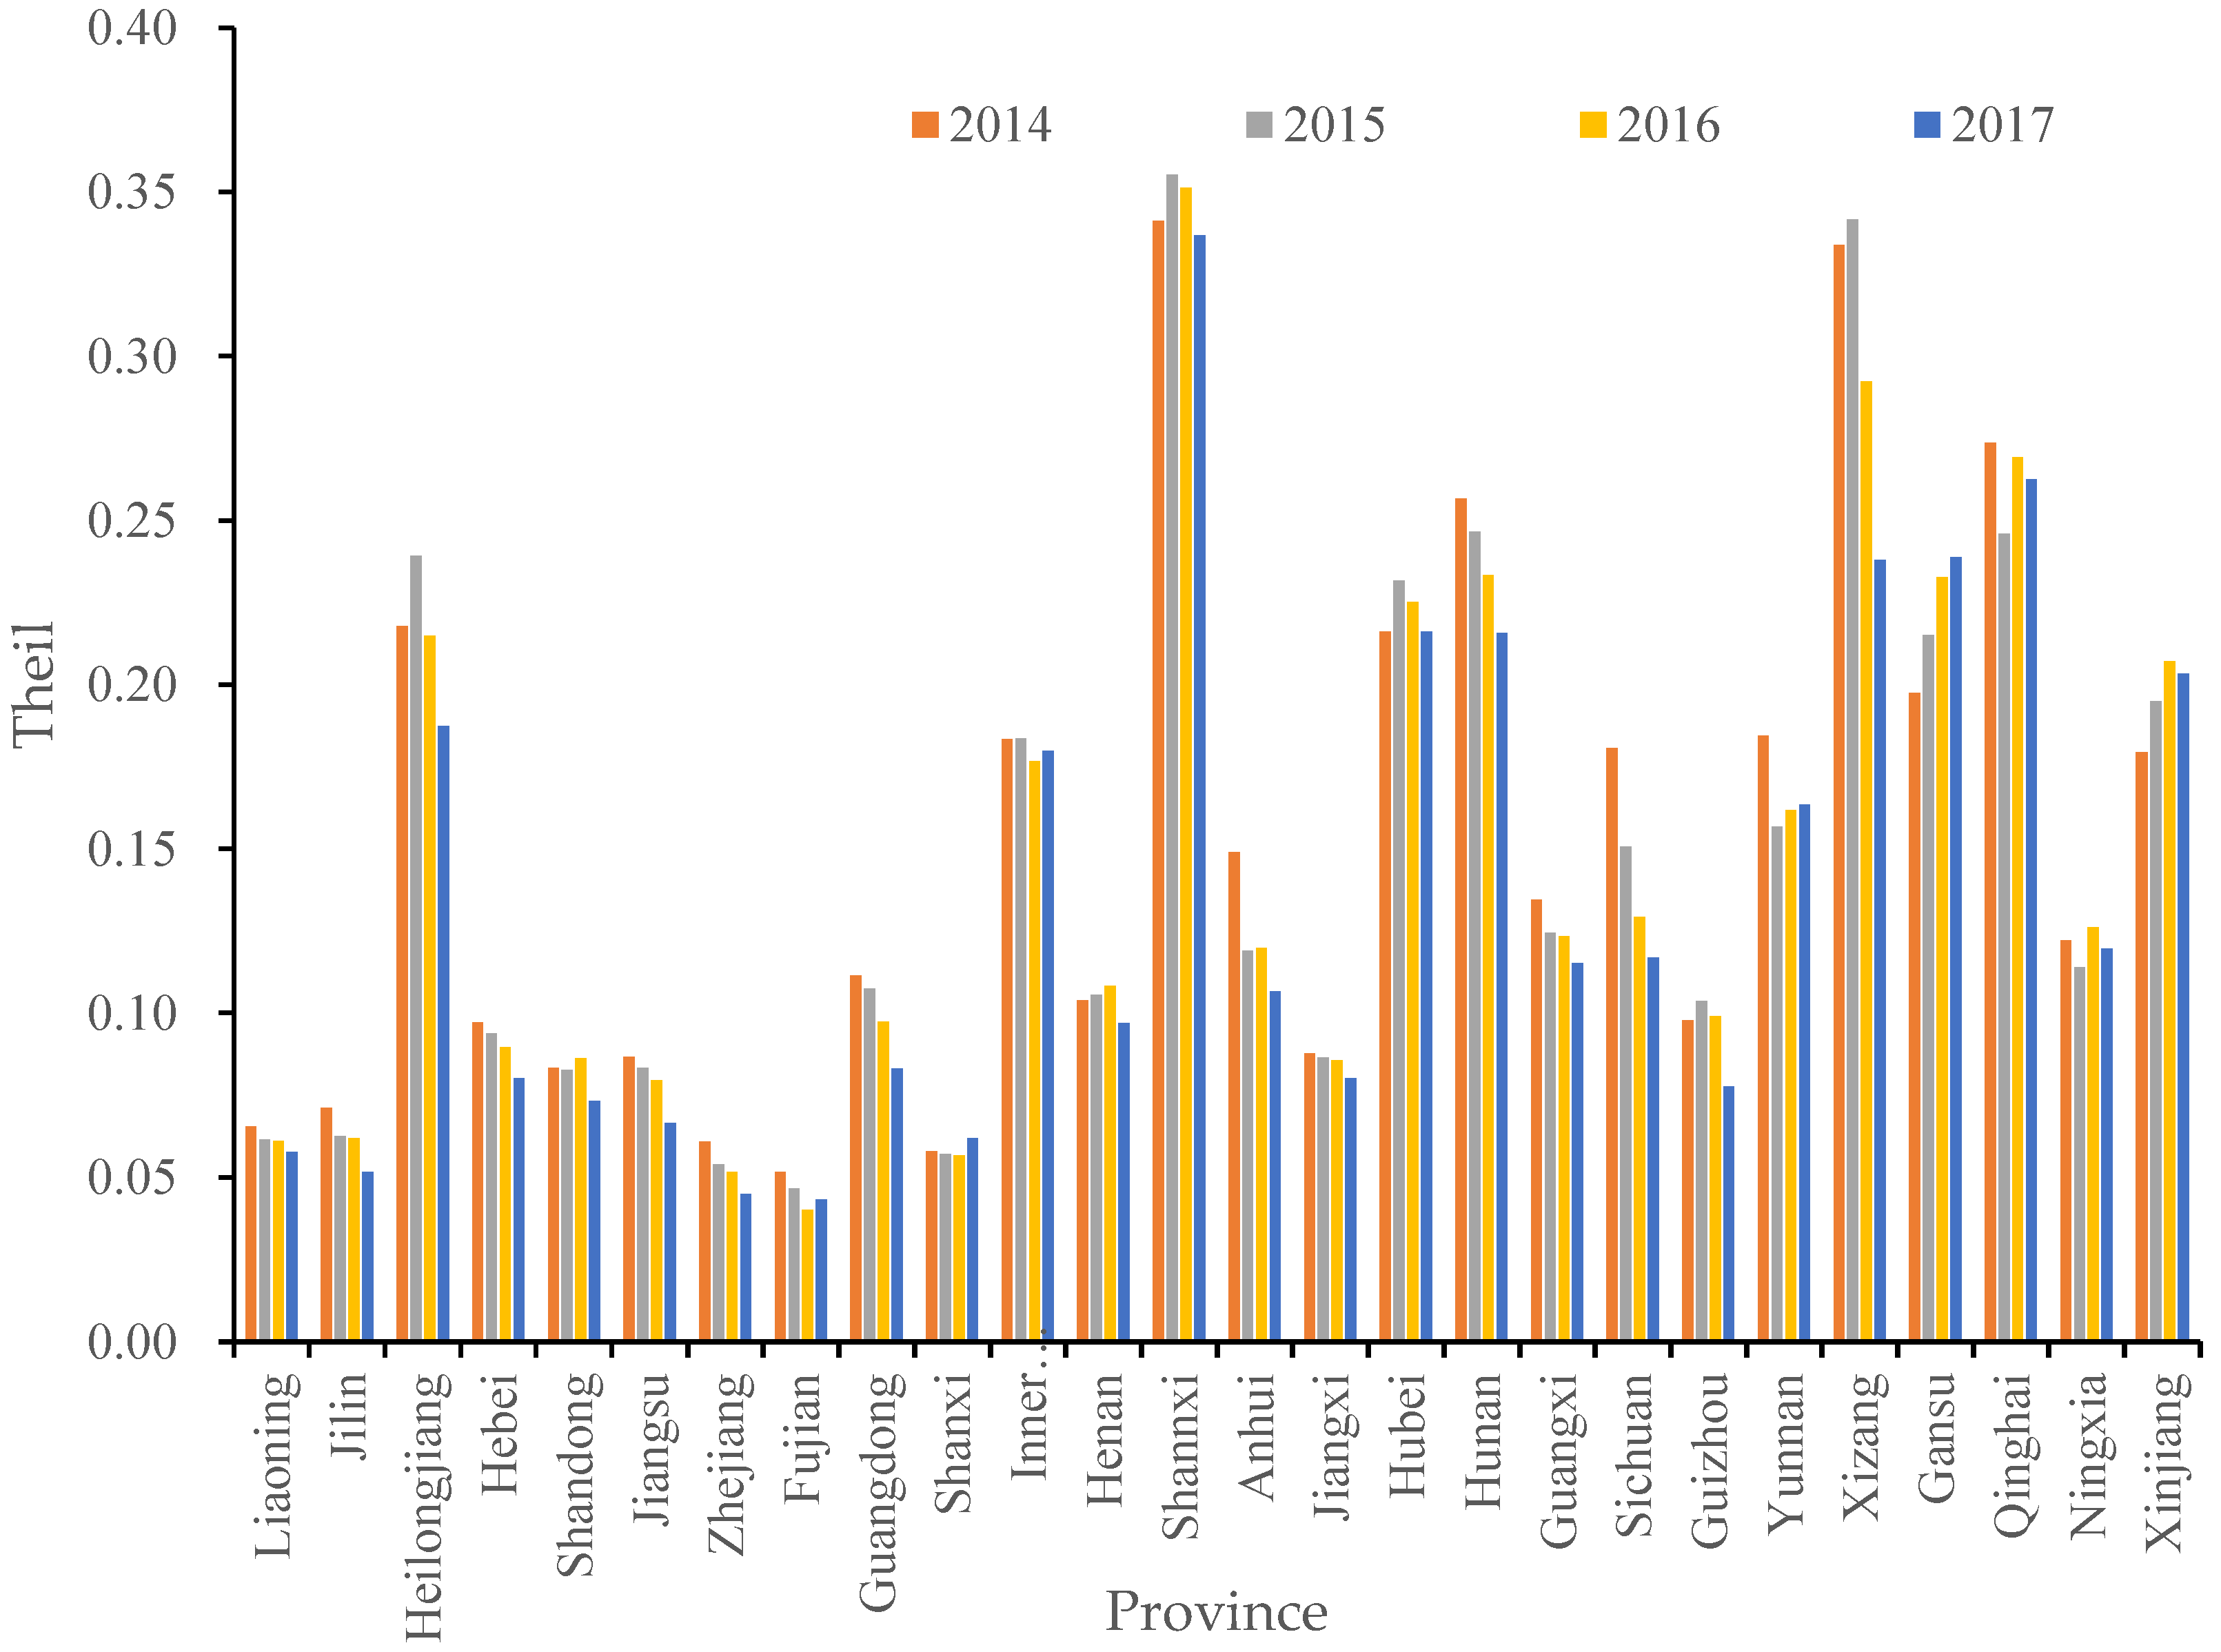
Figure 10.
NTL derived mean Theil index for China’s 30 provinces.

Table 1.
The result of the scatter plot in each province.
| Province | R2 | Formula |
|---|---|---|
| Liaoning | R2 = 0.9430 | y = −0.0003x + 0.0991 |
| Jilin | R2 = 0.9586 | y = −0.0007x + 0.1164 |
| Heilongjiang | R2 = 0.4869 | y = −0.0014x + 0.3177 |
| Hebei | R2 = 0.9571 | y = −0.0007x + 0.1605 |
| Shandong | R2 = 0.4656 | y = −0.0004x + 0.1162 |
| Jiangsu | R2 = 0.9772 | y = −0.0006x + 0.1857 |
| Zhejiang | R2 = 0.9862 | y = −0.0003x + 0.0984 |
| Fujian | R2 = 0.4414 | y = −0.0002x + 0.0697 |
| Guangdong | R2 = 0.9573 | y = −0.0012x + 0.244 |
| Shanxi | R2 = 0.4529 | y = 0.0001x + 0.0434 |
| Inner Monglia | R2 = 0.3667 | y = −9 × 10⁻⁵x + 0.1942 |
| Henan | R2 = 0.5402 | y = 0.0002x + 0.0947 |
| Shannxi | R2 = 0.0344 | y = −1 × 10⁻⁴x + 0.3593 |
| Anhui | R2 = 0.7787 | y = −0.0013x + 0.2219 |
| Jiangxi | R2 = 0.9278 | y = −0.0004x + 0.1015 |
| Hubei | R2 = 0.0071 | y = −9 × 10⁻⁵x + 0.2273 |
| Hunan | R2 = 0.9951 | y = −0.0029x + 0.3534 |
| Guangxi | R2 = 0.9491 | y = −0.0009x + 0.1816 |
| Sichuan | R2 = 0.9835 | y = −0.0045x + 0.403 |
| Guizhou | R2 = 0.5099 | y = −0.0005x + 0.1338 |
| Yunnan | R2 = 0.2847 | y = −0.0006x + 0.2043 |
| Xizang | R2 = 0.6399 | y = −0.0015x + 0.4700 |
| Gansu | R2 = 0.4529 | y = 0.0001x + 0.0434 |
| Qinghai | R2 = 0.0115 | y = −6 × 10⁻⁵x + 0.2716 |
| Ningxia | R2 = 0.0122 | y = 2 × 10⁻⁵x + 0.1164 |
| Xinjiang | R2 = 0.8017 | y = 0.0003x + 0.1323 |
© 2018 by the authors. Licensee MDPI, Basel, Switzerland. This article is an open access article distributed under the terms and conditions of the Creative Commons Attribution (CC BY) license (http://creativecommons.org/licenses/by/4.0/).
Share and Cite
MDPI and ACS Style
Wu, R.; Yang, D.; Dong, J.; Zhang, L.; Xia, F. Regional Inequality in China Based on NPP-VIIRS Night-Time Light Imagery. Remote Sens. 2018, 10, 240. https://doi.org/10.3390/rs10020240
AMA Style
Wu R, Yang D, Dong J, Zhang L, Xia F. Regional Inequality in China Based on NPP-VIIRS Night-Time Light Imagery. Remote Sensing. 2018; 10(2):240. https://doi.org/10.3390/rs10020240
Chicago/Turabian StyleWu, Rongwei, Degang Yang, Jiefang Dong, Lu Zhang, and Fuqiang Xia. 2018. "Regional Inequality in China Based on NPP-VIIRS Night-Time Light Imagery" Remote Sensing 10, no. 2: 240. https://doi.org/10.3390/rs10020240
Note that from the first issue of 2016, this journal uses article numbers instead of page numbers. See further details here.