Article

Temporal Variability and Geographical Origins of Airborne Pollen Grains Concentrations from 2015 to 2018 at Saclay, France

1
Laboratoire des Sciences du Climat et de l’Environnement, Unité Mixte de Recherche CEA-CNRS-UVSQ, 91191 Gif sur Yvette, France
2
Laboratoire d’Aérologie, Université Toulouse III, CNRS, UPS, 31400 Toulouse, France
3
Department of Chemistry and Environmental Research Institute, University College Cork, T12 YN60 Cork, Ireland
4
Dublin Institute of Technology, D08NF82 Dublin, Ireland
5
Réseau National de Surveillance Aérobiologique, Le Plat du Pin, 69690 Brussieu, France
*
Author to whom correspondence should be addressed.
Remote Sens. 2018, 10(12), 1932; https://doi.org/10.3390/rs10121932
Submission received: 29 October 2018 / Revised: 25 November 2018 / Accepted: 28 November 2018 / Published: 1 December 2018
(This article belongs to the Special Issue Atmospheric Pollen/Fungus Remote Sensing)

Abstract

:
The study of the origin and dispersion processes associated with airborne pollen grains are important to understand due to their impacts on health. In this context, a Hirst-type spore trap was utilized over the period 2015–2018 to monitor ambient pollen grains at Saclay, France, a receptor site influenced by both clean air masses originating from the Atlantic Ocean and polluted air masses under anticyclonic conditions. The objective of this work was to use ZeFir (a user-friendly, software tool recently-developed to investigate the geographical origin and point sources of atmospheric pollution) as a method to analyse total and allergenic airborne pollen grain concentrations. Strong interannual variability was exhibited for the total pollen grains concentrations and it was determined that this was mainly driven by Betulaceae pollen, with a general increasing trend displayed. The start of the pollen season was seen to be triggered by particular synoptic conditions after a period of dormancy and two maximums were displayed, one in April and a second in June. Results from the ZeFir tool, fed with on-site hourly meteorological and pollen measurements, demonstrate that the dominant pollen grains inputs to Saclay are favoured by non-prevailing winds originating from East and North in association with dry air, moderate winds, mild temperature and enhanced insolation.

Graphical Abstract

1. Introduction

The concentration of Bioaerosols in the atmosphere, including airborne pollen grains, has been monitored for several decades all over the world and especially in Europe. This is due to their impact on climate and health. [1,2]. In populated areas, pollen concentrations are monitored mainly for allergy prevention purposes [3,4,5]. It is acknowledged that changes in land uses, as well as growing urbanization and global warming is affecting the biosphere and modifying biodiversity [6,7]. Atmospheric concentrations of pollen grains are often associated with reproduction mechanisms, where two major processes are involved. The predominant one is a reproduction mechanism using wind as the dispersion vector, which defines the anemophilous species category; it corresponds to 80% of total pollen grains dispersion [8]. The second one is reproduction using insects as a mechanism for genetic transmission and defines the non-anemophilous species category. Thus concentrations of pollen in the air are generally linked to local flora and meteorological factors, such as temperature, solar irradiance and precipitation [9,10,11]. Indeed, heat waves for example can modify the seasonality and the ambient levels of pollen in the atmosphere [12]. Equally, dry periods followed by intense rain showers have also demonstrated an impact on daily peak values [13]. As a main result, duration, peak intensity and dynamics of the pollen season are affected, along with the size distribution of pollen [14,15]. The identification of the dispersion mechanisms and release of allergenic compounds is a crucial piece of information for environmental health authorities [16,17], many of which are committed to public health care, the study of cross contamination and ecological impacts resulting from global warming [18]. Pollen can also react with other atmospheric allergenic species, aerosols and trace gases within a polluted environment and can thereby exacerbate the human allergic response [19]. The main allergenic pollen grains are emitted from trees and shrubs (Betulaceae, Oleaceae and Cupressaceae) but also from herbaceous plants (Poaceae and Urticaceae). These families occupy large areas in Europe and are continuously studied due to their strong allergenic effects [20]. The seasonality and the variability of the pollen concentrations can be affected by meteorological parameters which are critical for the purpose of accurate forecasting [21,22,23]. Therefore, modelling of the season start, the transport and the dispersion of pollen is directly related to source typology and land use [24,25,26]. Moreover, the source and origin of pollen grains are impacted by agricultural practices as well as urbanization and their changes in space and time [27,28,29]. To identify the origin and the dispersion processes of airborne pollen grains, the most wide-spread approach is to use dispersion models [30,31,32,33]. To date, only few studies have focused on airborne pollen grains origins and point sources using local meteorological data associated with multiple observation sites [34,35,36]. The current work is based on a 4-years dataset of daily monitoring of airborne pollen at Saclay, a peri-urban site in the Paris region which represents 20% of the French population on only 2% of the French territory surface. In this context, the main objective of this study is to investigate the factors regulating the concentrations of total airborne pollen grains paying special attention to the allergenic species in a suburban environment that are affected by polluted air masses. In addition, this work attempted to identify the origins of airborne pollen grains using a commonly-used source receptor model [37,38]. Hence, this paper presents results from the ZeFir model [39], which has been designed to identify gases and aerosol point sources. For the first time, we applied ZeFir to airborne pollen in order to investigate the meteorological mechanisms that trigger the start and the duration of the pollen season and to discriminate the local from the long-range sources, which impact the region of Paris. This last point is particularly important to potentially characterize the periods and the processes involved when pollen is in contact with atmospheric pollutants and the consequences on air quality and thunderstorm asthma events in megacities.

2. Materials and Methods

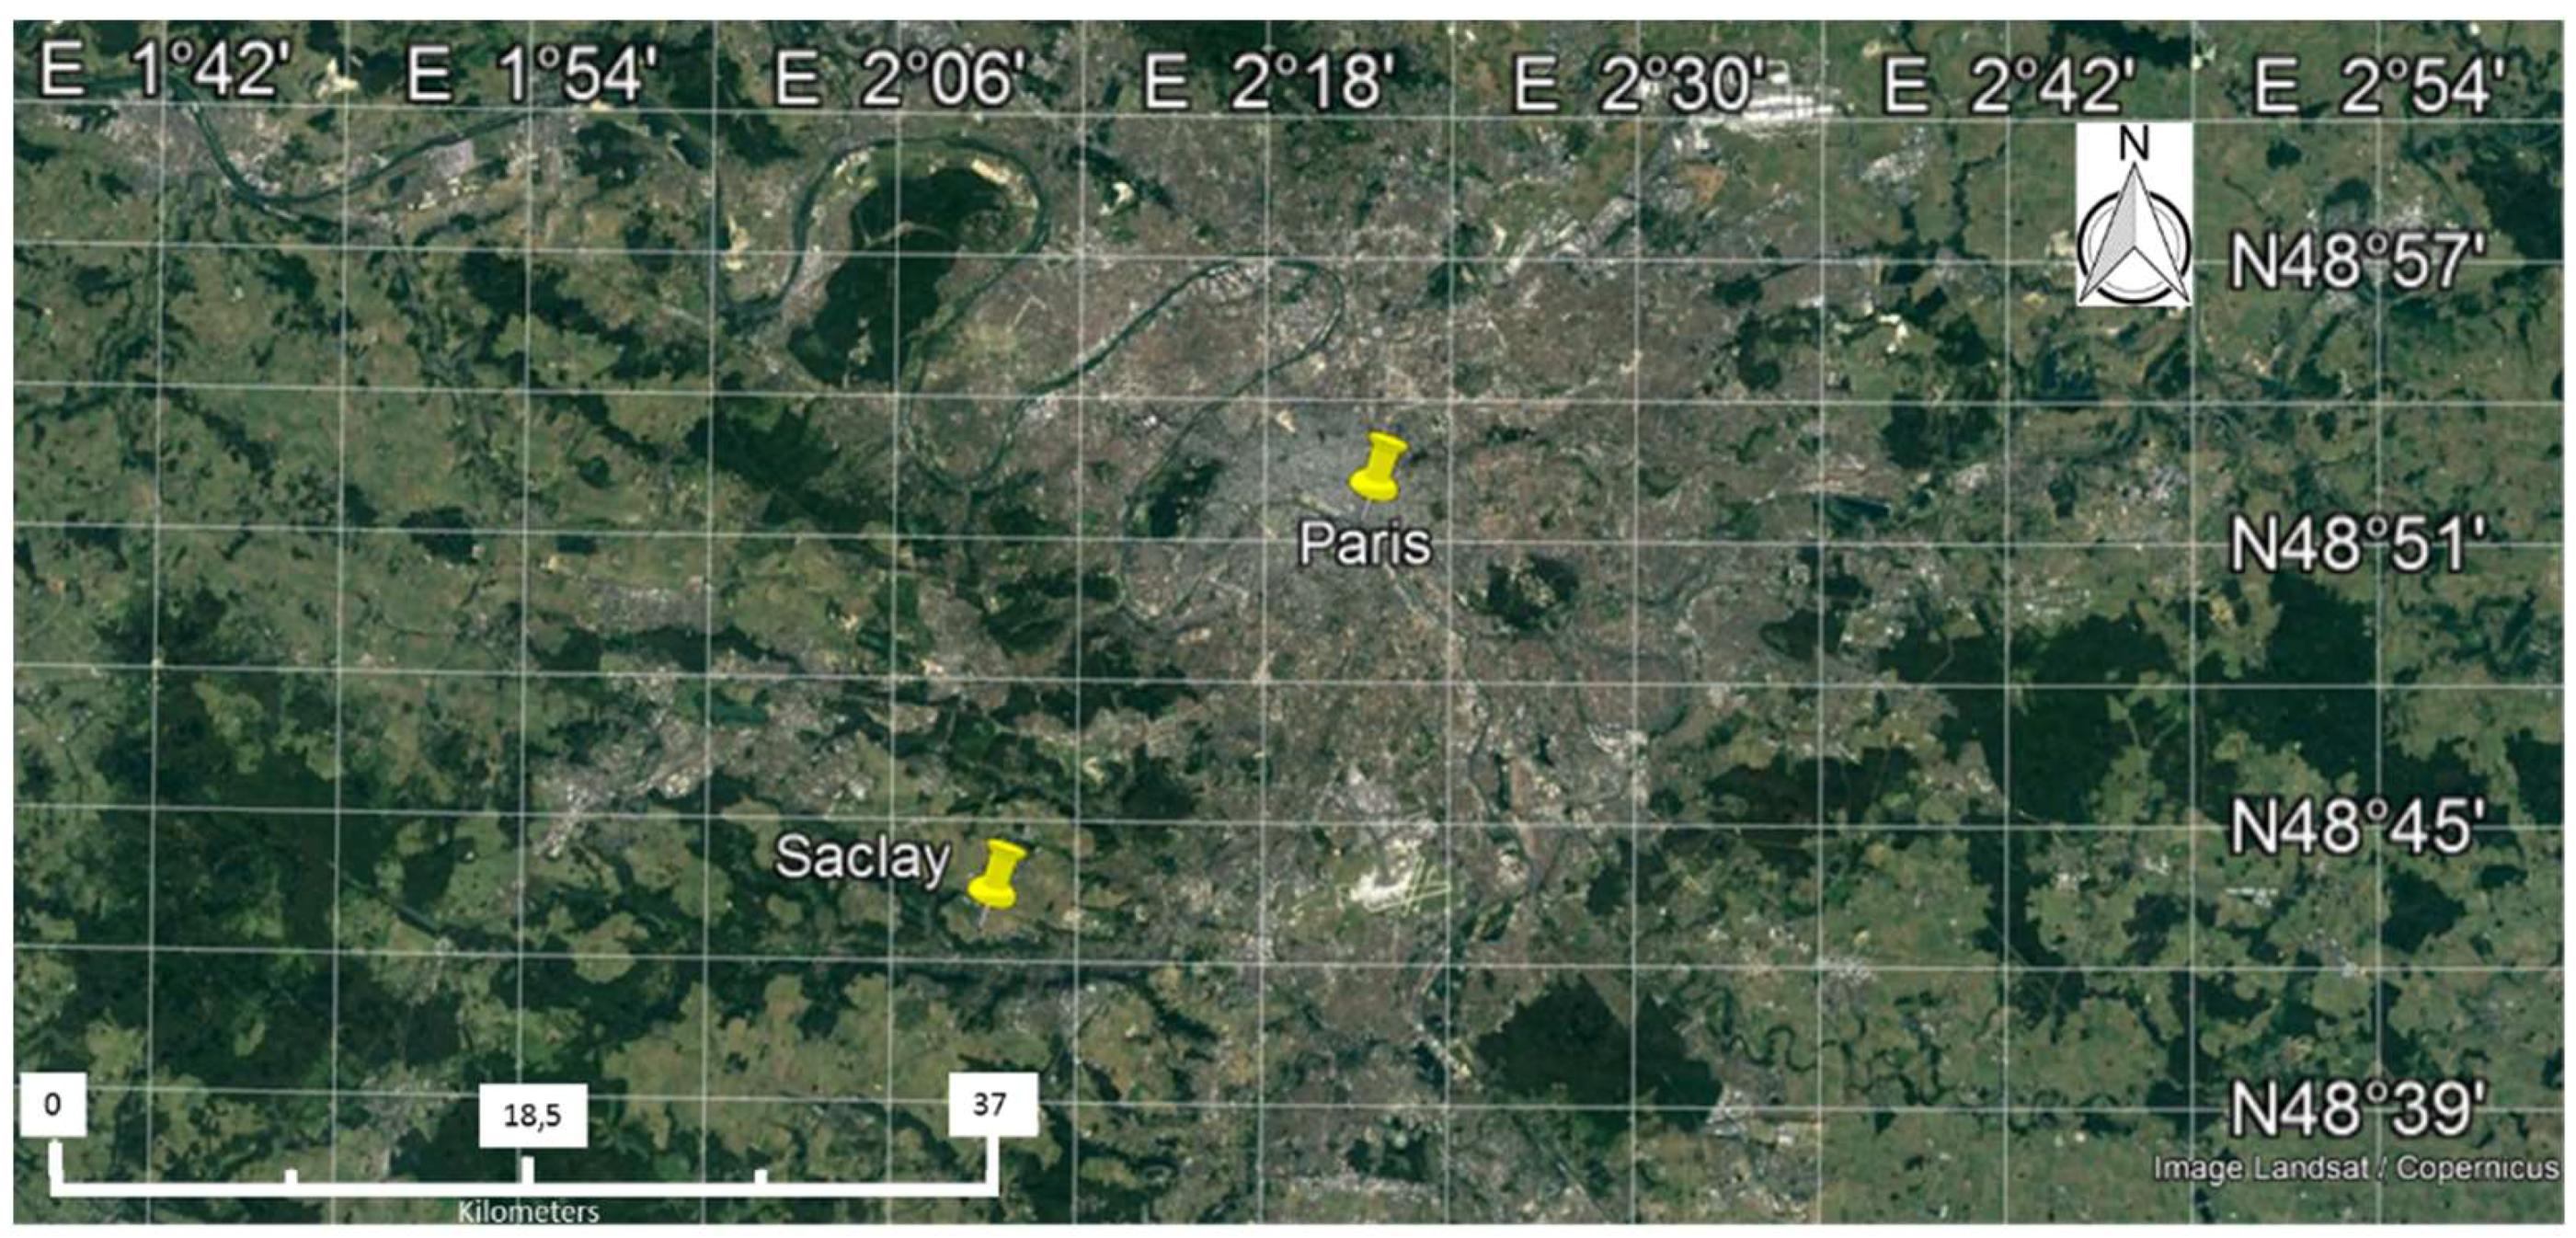
2.1. Experimental Site

The monitoring station is located at Saclay, France (48.7247°N, 2.1488°E), 30 km away from Paris downtown. The sampling site is surrounded by crops, forest, small villages and often stands in the polluted plume of Paris (Figure 1). The observatory is fully equipped for the determination of aerosol and gas-phase chemical composition (SIRTA station from the EU-ACTRIS network, http://www.actris.eu) and bioaerosol studies [40,41]. All sampling inlets are normalized and located at 15 m above the ground. Meteorological parameters such as Wind Speed (WS, m/s), Wind Direction (WD, Degrees°), Temperature (T, °C), Relative Humidity (RH, %) and cumulative Rain (R, mm) are provided by a collocated weather station WXT520 (Vaisala, France).
Airborne concentrations of pollen grains and fungal spores have been continuously monitored since June 2014 at Saclay. The period of observation presented in this study is framed between 1 January 2015 and 30 September 2018. Daily pollen measurements and concentrations were obtained with a Volumetric Impaction Sampler (VIS), via Hirst type spore trap (VPPS 2000, Lanzoni, Bologna, Italy). This instrument can collect particles with an Aerodynamic Diameter (AD) between 2 µm and 200 µm [42,43]. The Counting and identification of the pollen grains were performed by the French Monitoring Network of Aerobiology (Réseau National de Surveillance Aérobiologique, RNSA, Brussieu, France). The RNSA is a member of the European Aeroallergen Network (EAN) and follows the recommendations of [44] concerning the minimum requirements for the counting procedure. The quality assurance (QA) and the quality control (QC) of such measurements were reported in Reference [45] during an International Intercomparison on 15 sites. The standard analytical method used accounts for 10% of the surface area of each daily sample.

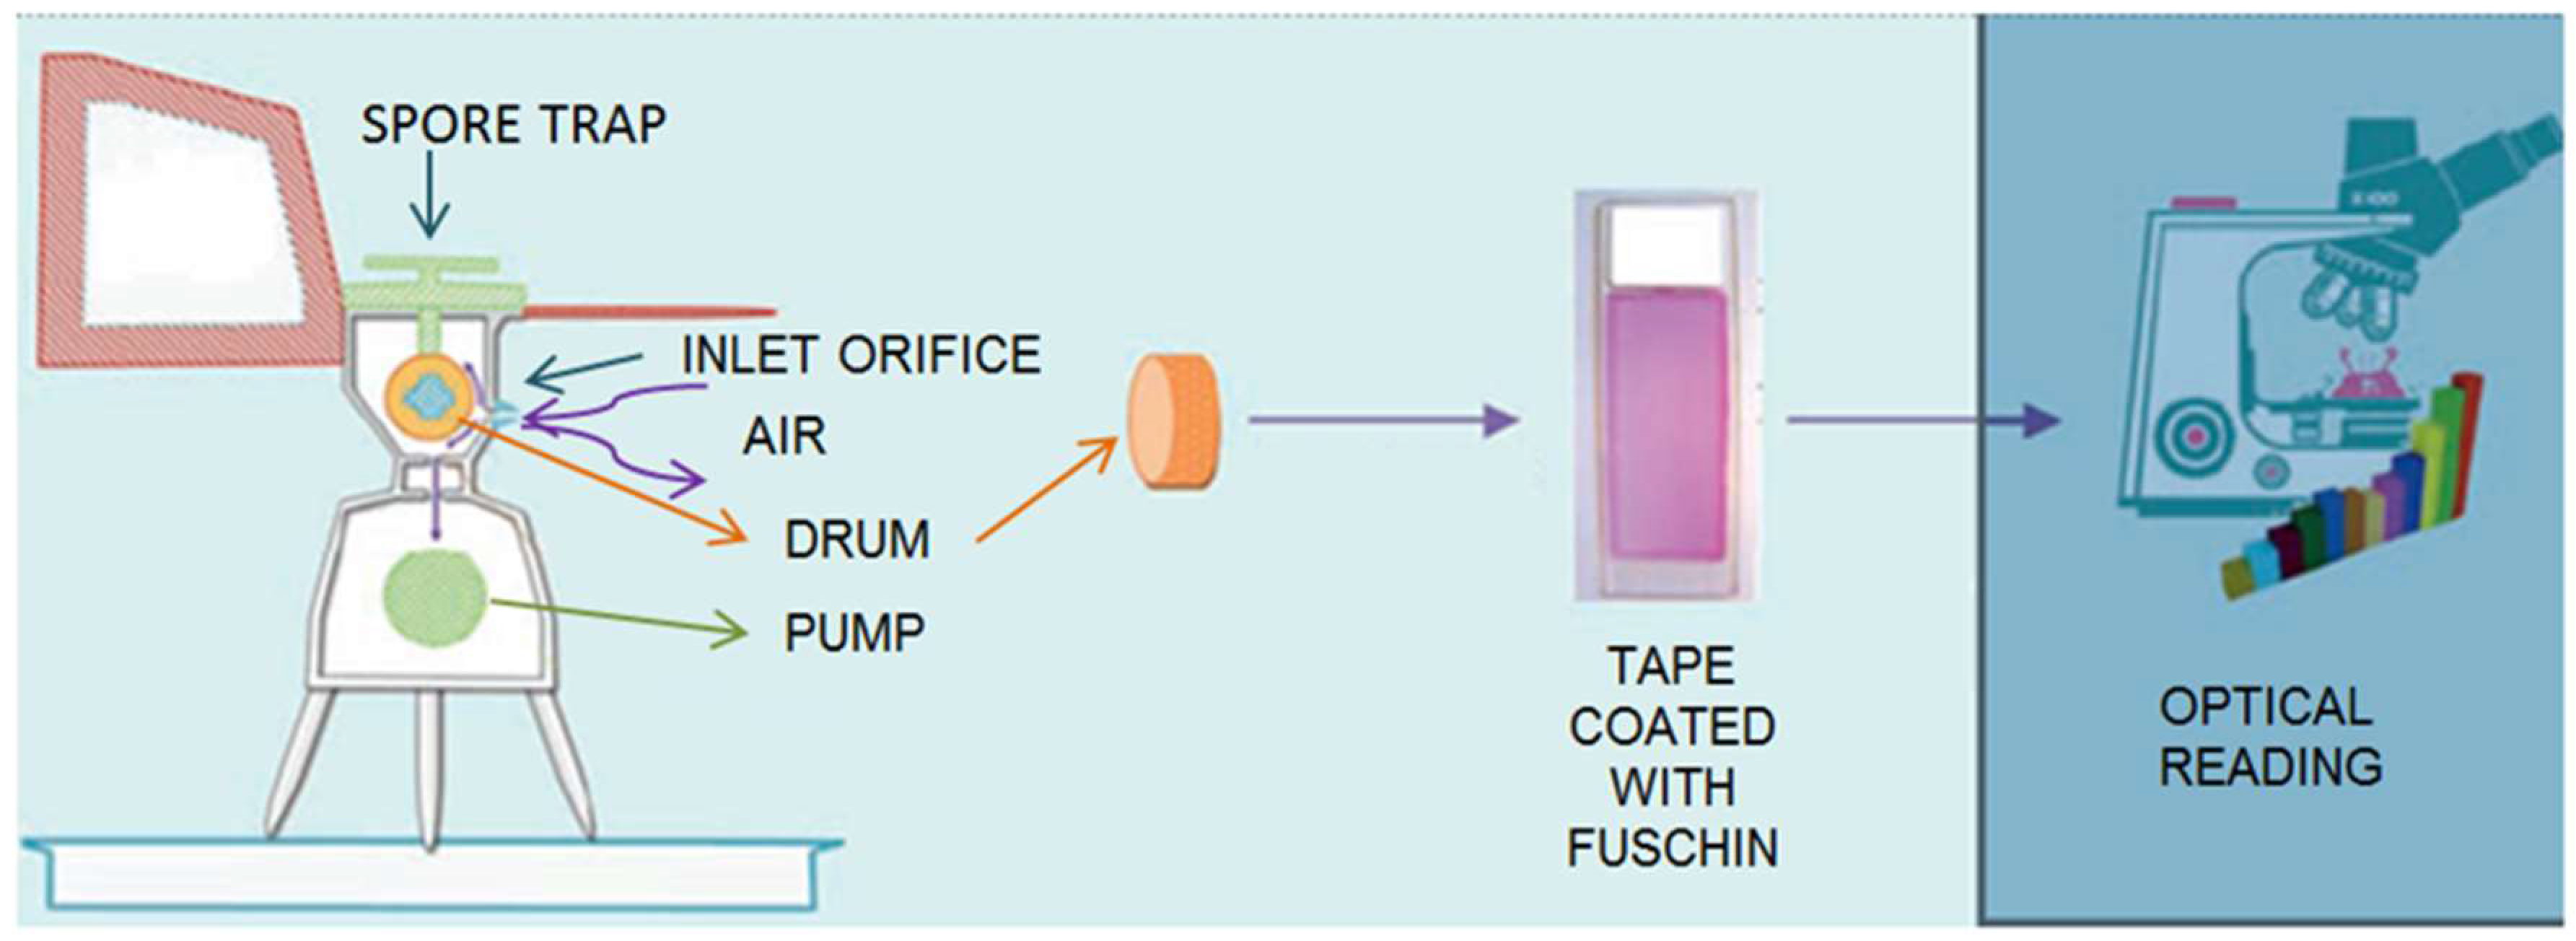
2.2. Pollen Grains Identification and Counting

The VPPS 2000 spore trap was located on the roof of the observatory at 15 m above the ground without any neighbouring vegetation. The air was continuously pumped through a 14 × 2 mm orifice and particulate matter was impacted on a rotating drum containing a 19-mm wide cellophane tape coated with silicone. The drum containing the impacted pollen grains was changed every week at the same time. Sampling was always facing the prevailing winds and the flow rate was 10 L per minute (LPM). A clockwork mechanism rotated the drum continuously at a speed of 2 mm per hour. After 7 days of sampling, the tape, which contained the impacted particles, was removed and cut into seven equal parts. Each part corresponded to one day of sampling and was coloured with a colour-fixing reagent based on Fuchsin (Prolab Diagnostics, Switzerland), facilitating the differentiation of pollen grains from fungal spores via optical microscopy. This optical reading and counting was done using an optical microscope, (Realux, France) at ×400 of magnification (Figure 2). The standardized technique used to count the pollen grains was longitudinal. The results were available in intervals of two-hour averages and were representative of regional concentrations [46,47].
Equation (1) gives the estimated concentration (Q) of the pollen grains sampled.
Q = n (ST/(V × SA),
where: SA is the Analysed Surface of one segment (mm2), V is the sampling volume (m3), ST is the total surface of one segment (mm2) and n the number of counted grains.

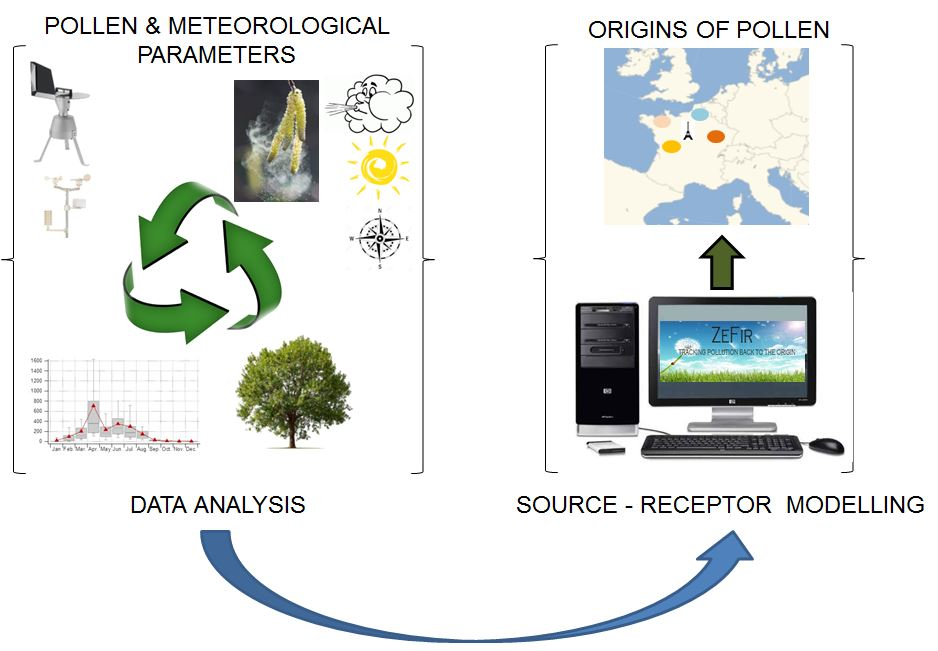
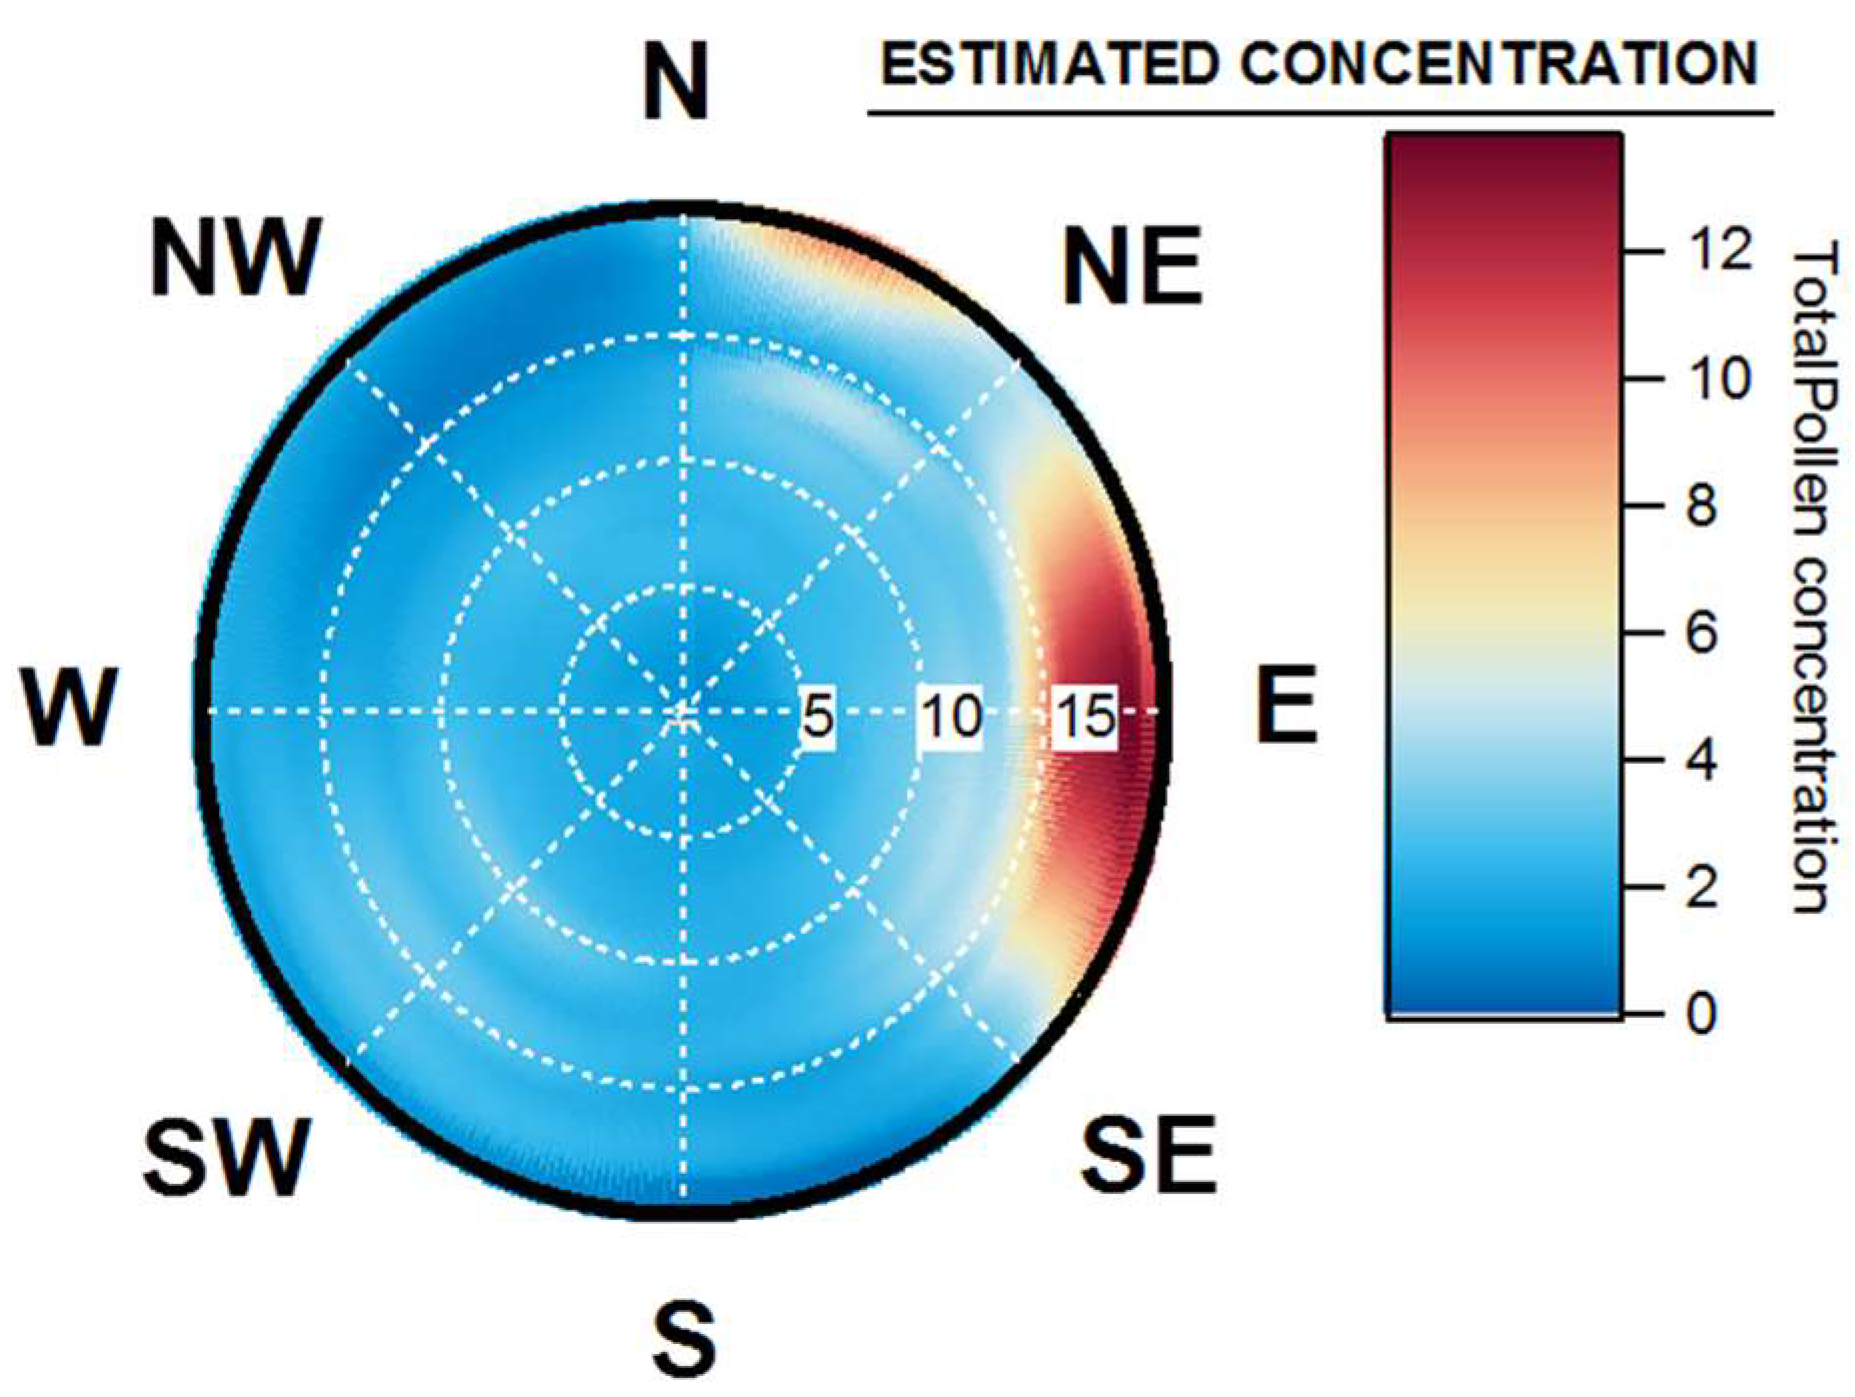
2.3. Geographical Origins

The investigation of the geographical origins of pollen has been performed by coupling ambient concentrations with onsite measured wind data. A Two-dimension Non-parametric Wind Regression (NWR), originally developed by [48], has successfully been applied to various online air quality datasets in the literature. However, to our knowledge, it is the first time this tool designed for air quality applications is applied for the investigation of the geographical origins of atmospheric pollen.
Equation (2) below describes the calculation of NWR.
E ( θ | υ ) = i = 1 N K 1 ( θ W i σ ) K 2 ( υ Υ i h ) C i i = 1 N K 1 ( θ W i σ ) K 2 ( υ Υ i h )
where E is an estimated concentration at a wind direction θ and speed υ; Wi, Yi and Ci are respectively input wind direction, wind speed and concentration data measured at ti; K1 and K2 are two Kernel functions; and σ and h the smoothing factors. The calculation basically consists in a weighing average of concentration, where the weighing coefficients are determined through Kernel functions, whose widths are controlled by σ and h.
In classical NWR as described in Equation (2), fixed σ and h values are applied. However, the (daily) temporal resolution of our dataset (daily averages) makes NWR unsuitable for this study due to atmospheric variability. Indeed, wind data that are associated with concentrations are assumed to be statistically representative but daily mean values of wind speed and direction may not be representative of the variety of wind conditions which could occur during a particular day. Therefore, if wind conditions are not stable at ti, the corresponding concentration should be downweighted to better account for atmospheric stability. For this reason, we chose a variant of NWR, called the Sustained Wind Incidence Method (SWIM) developed by [49]. Although the general principle remains the same, a scalar weight is applied to concentrations, depending notably on wind direction standard deviation.
Equation (3) below describes the calculation of SWIM.
S i = C i Υ i max ( C i Υ i ) δ ¯ δ i
where δ represents wind direction standard deviation. This actually allows to efficiently downweight daily concentration values associated with high atmospheric variability during that day. Wind direction standard deviation was estimated by the 1-pass Yamartino equations [50]. This entire study was performed with ZeFir, a user-friendly tool for wind analysis [39]. More information can be found here: https://sites.google.com/site/ZeFirproject.

3. Results

In this section we present the results on the annual variability, seasonal and daily variability of total pollen grains concentration measured at Saclay. These results are presented as to compare this site to similar sites in the literature and to give context to the work before using Zefir.

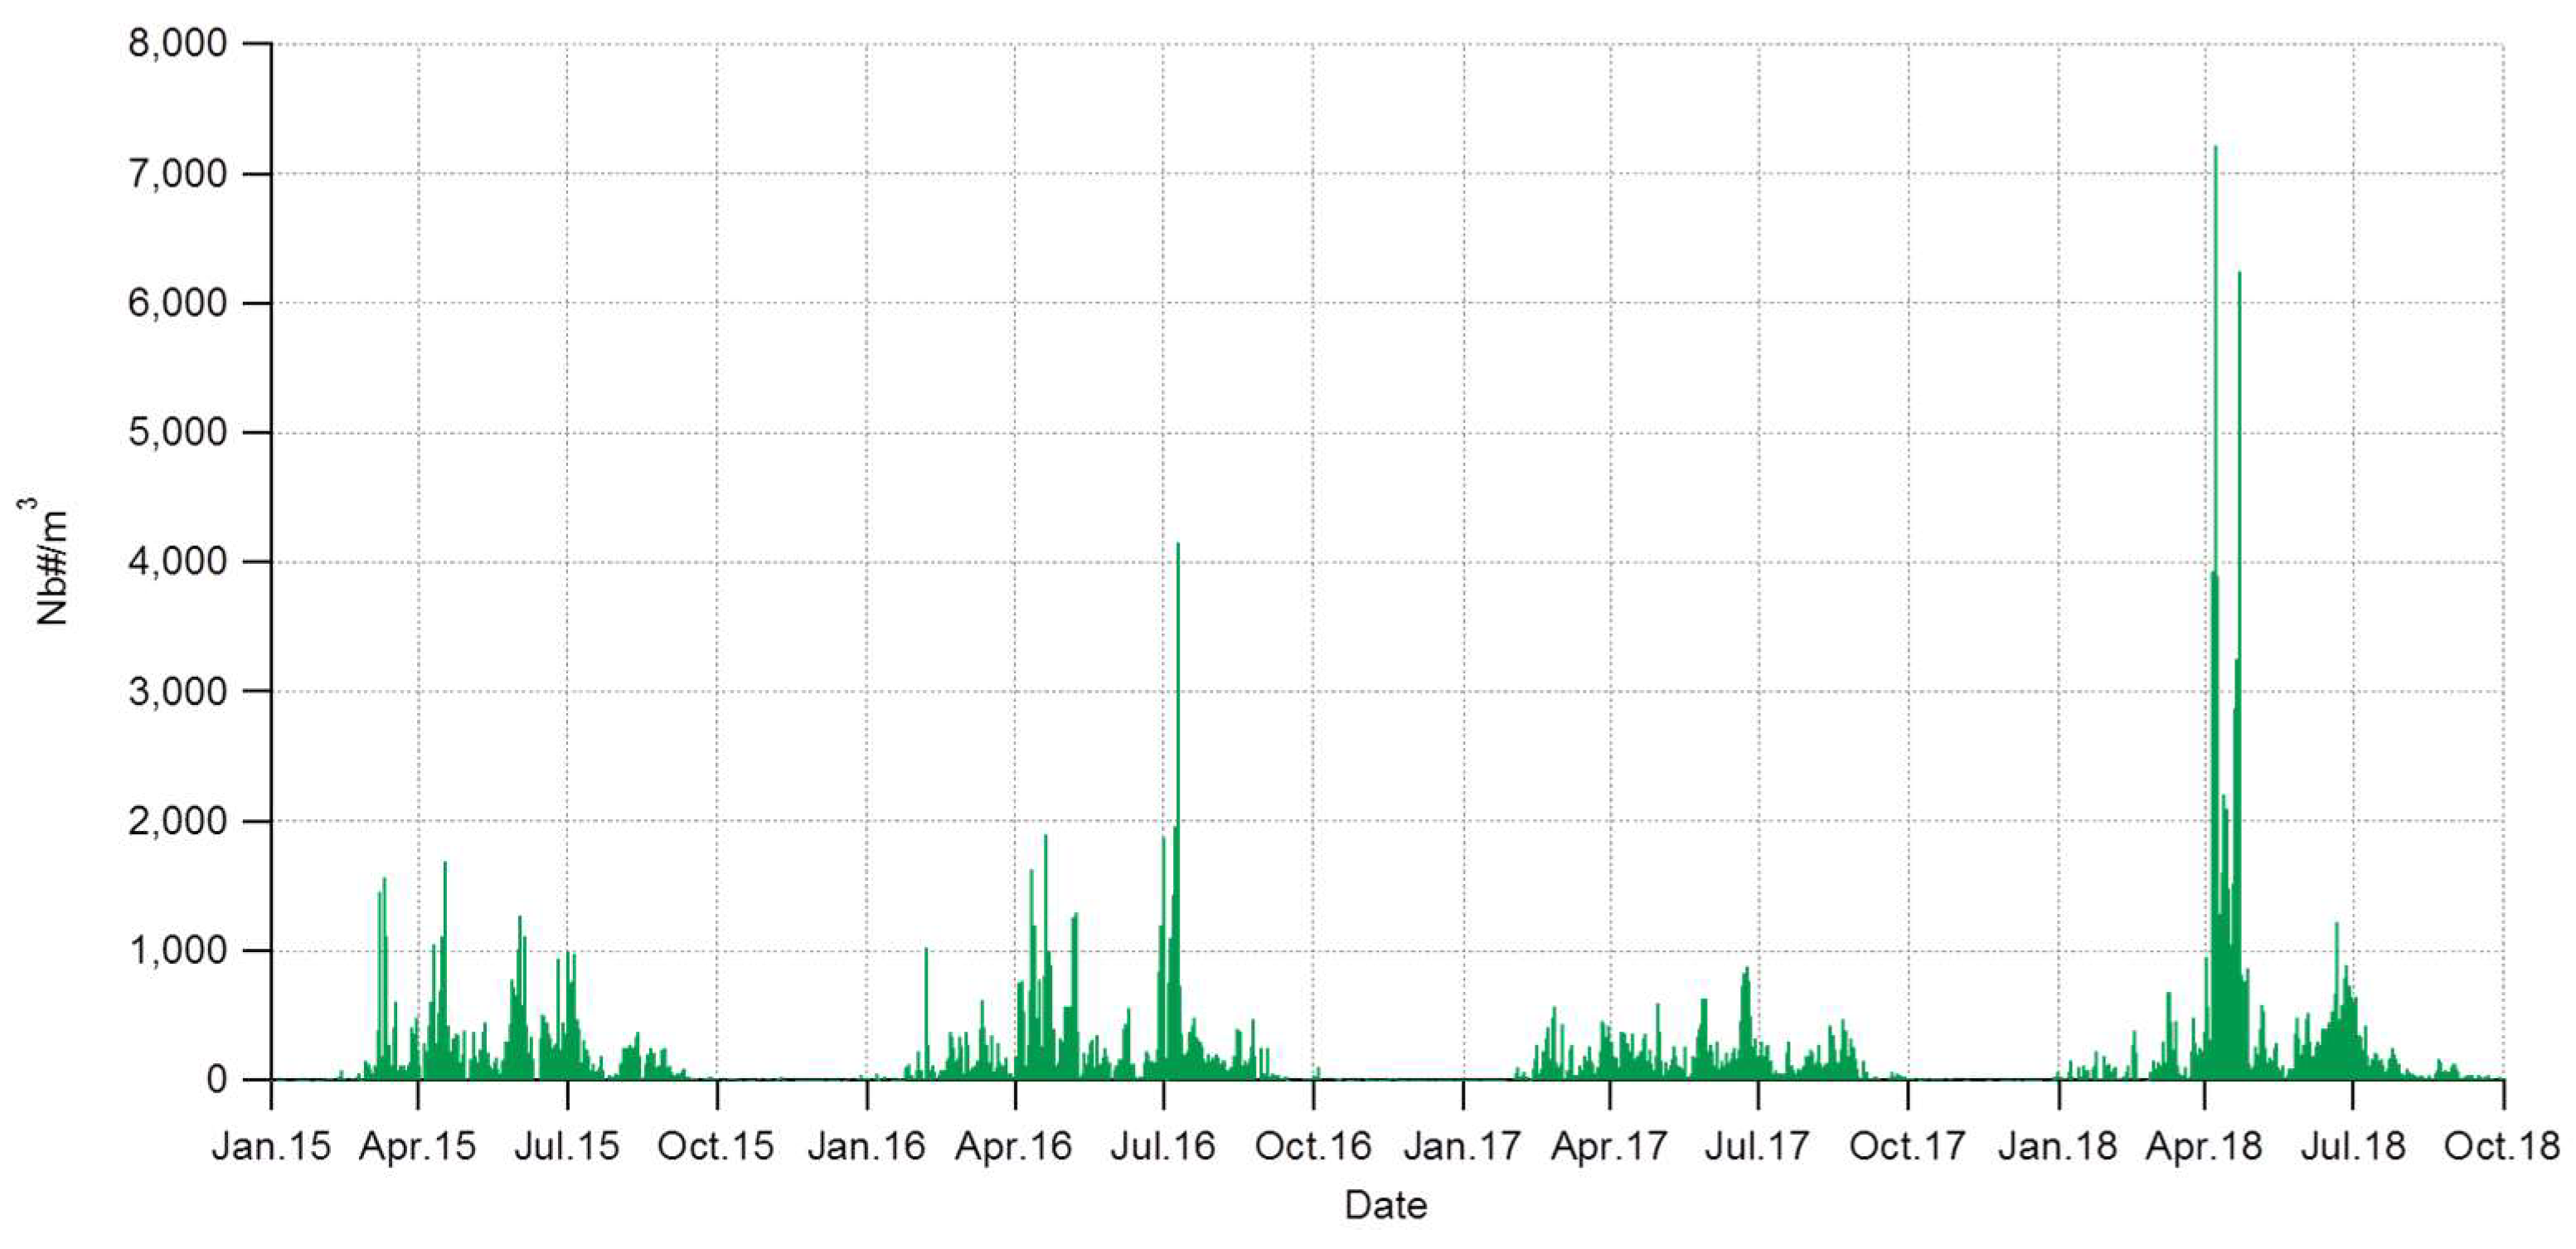
3.1. Interannuality of the Total Pollen Grains

During the four-year observation period presented in this study (2015–2018), 72 taxa were identified in the air of Saclay. The taxa correspond to the lowest taxonomic level, which could be identified in optical microscopy. The results presented in Figure 3 for this period show a clear year-to-year variability, as the total concentration of grains increased from +15% between 2015 and 2016 to +107% between 2017 and 2018. The trend, estimated by regular linear regression using the Annual Pollen Sum (Y) (now called Annual Pollen Integral, APIn) and the year time data (X) showed a global increase in the concentrations (Y = 6.807.7 X + 45,915.5; R2 = 0.20). This result should be refined with at least two more years of observations and compare to similar increasing trends reported in the literature [2].
Our results are in accordance with those observed for total pollen grains records in Europe. For example in Lublin (Poland), the total sum for 2001 was 62163 Nb#/m3 and for 2002 50238 Nb#/m3 [51]. The global increase of pollen grains in the air [52] previously showed an augmentation of 100 grains per year (for Quercus spp). Most of the literature published showed similar results but with a focus on specific species to calculate the trends and biannual variations [11,53,54,55,56].

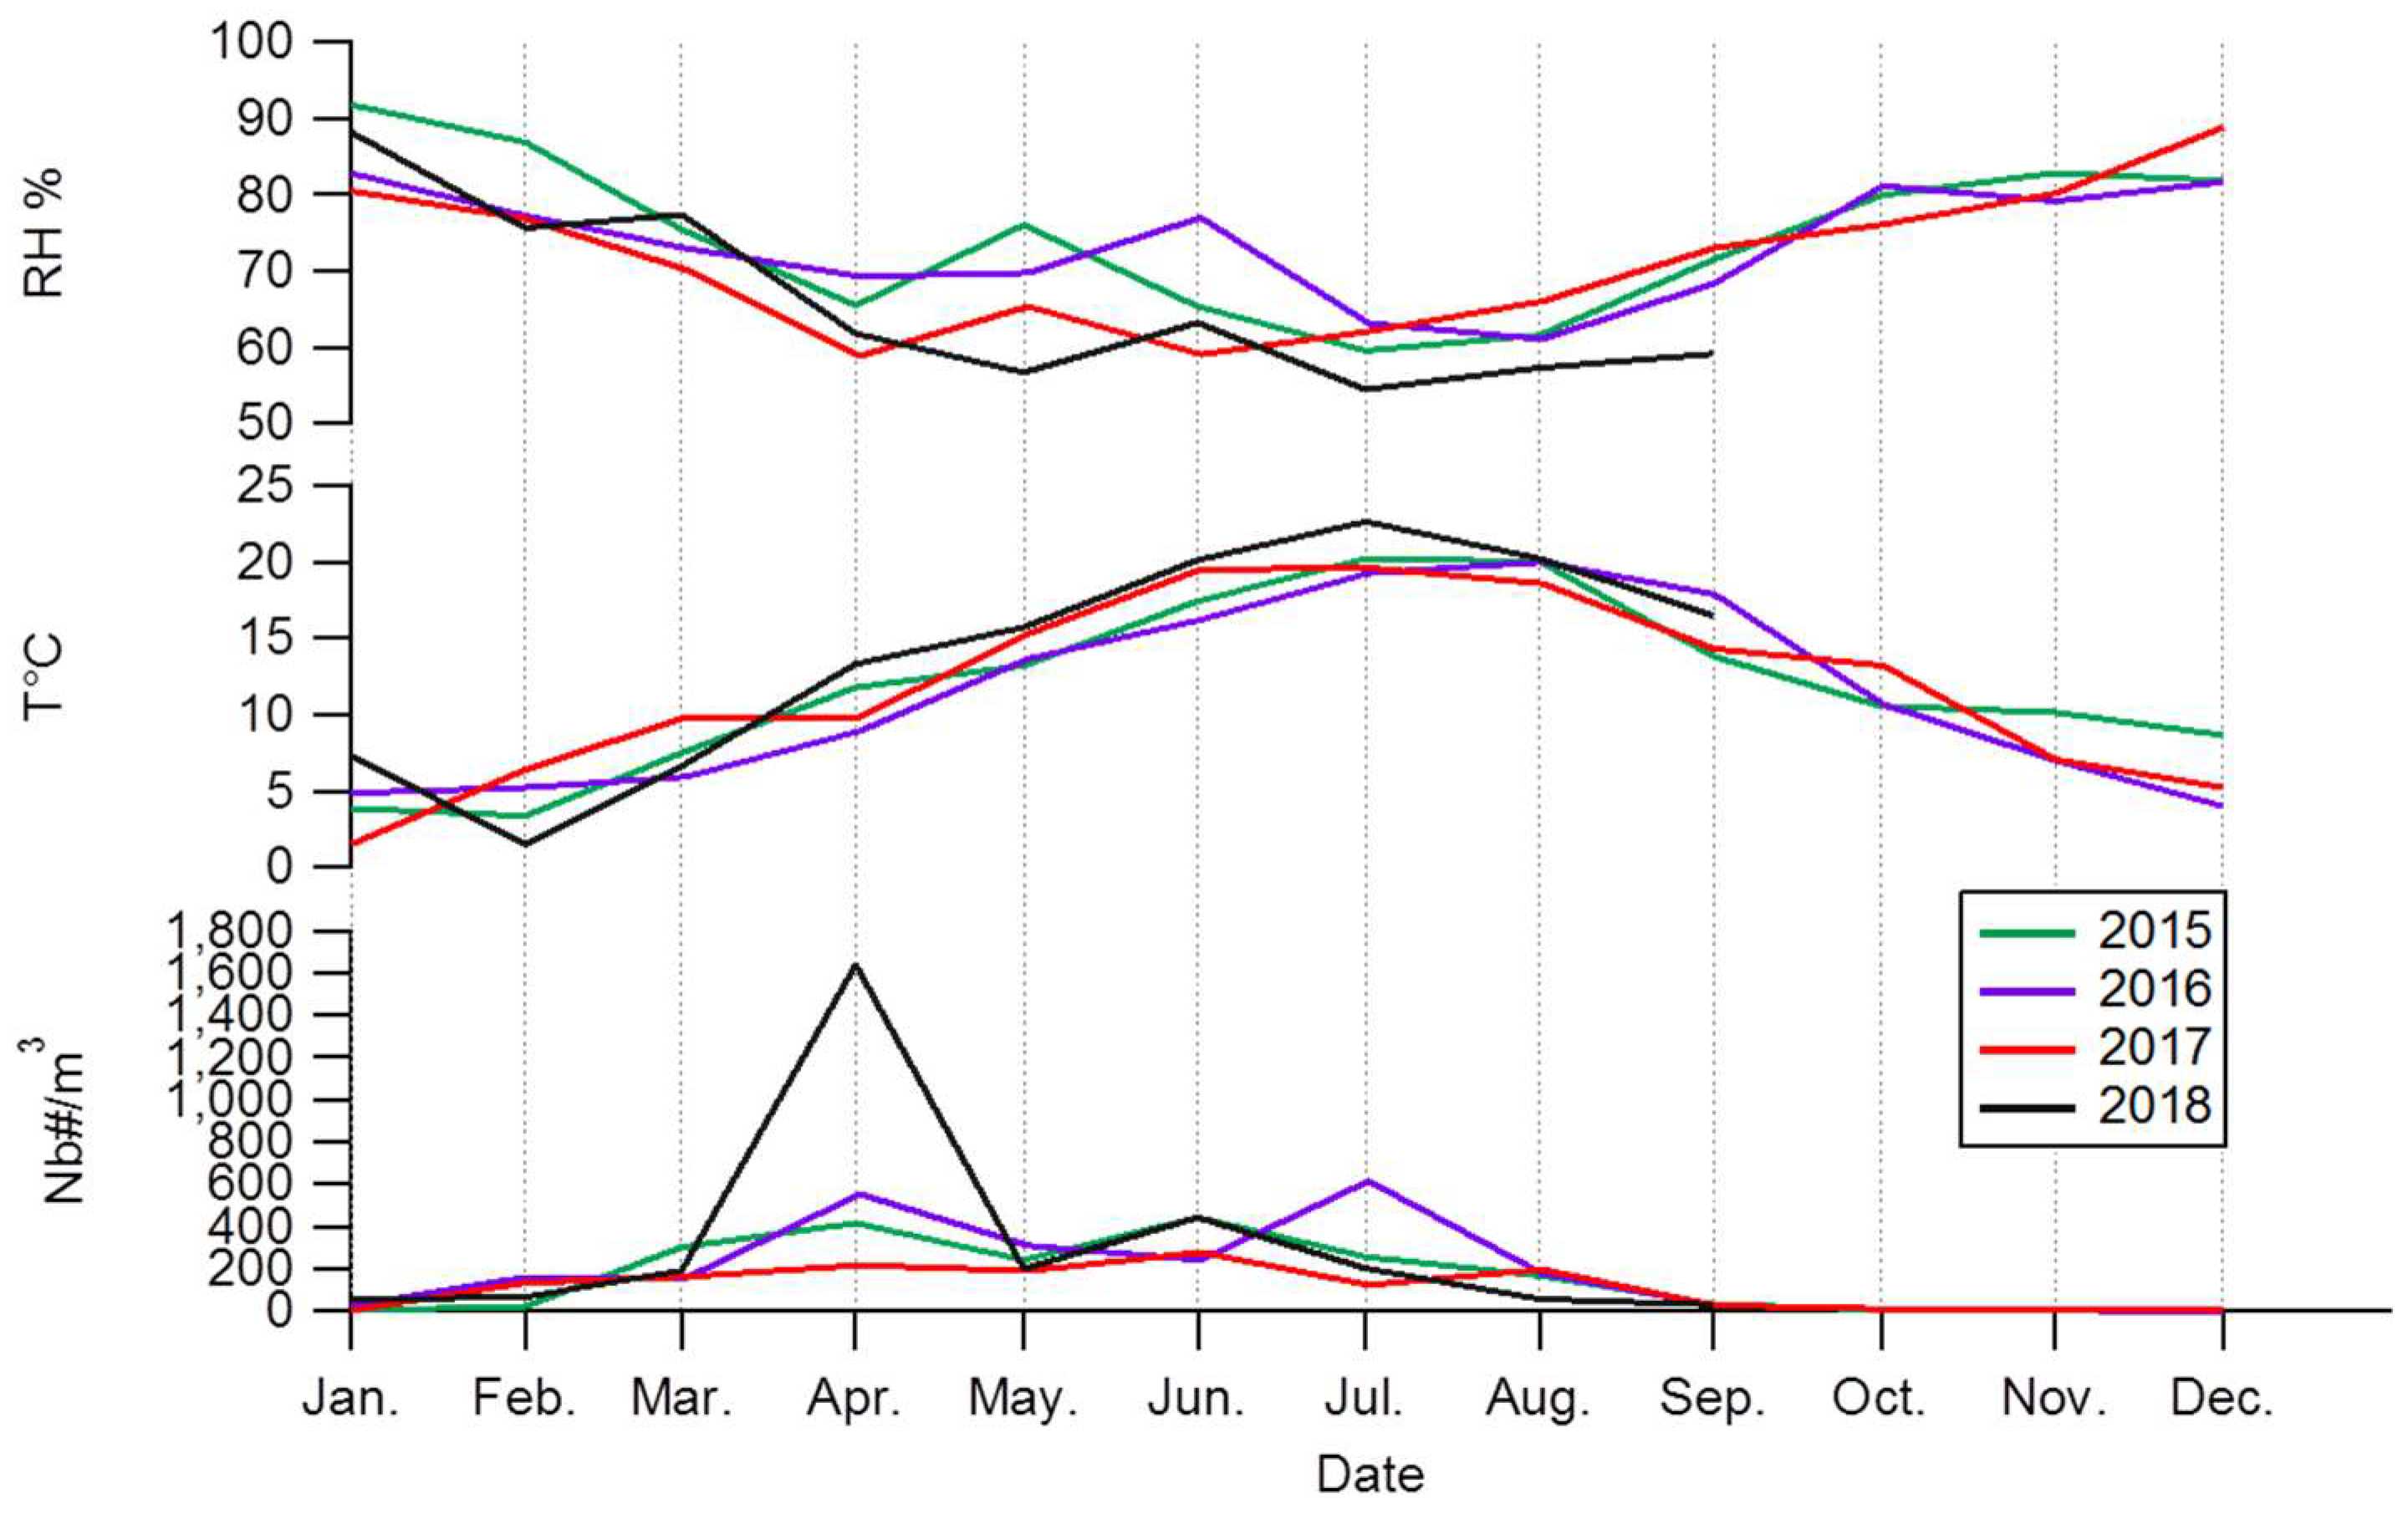
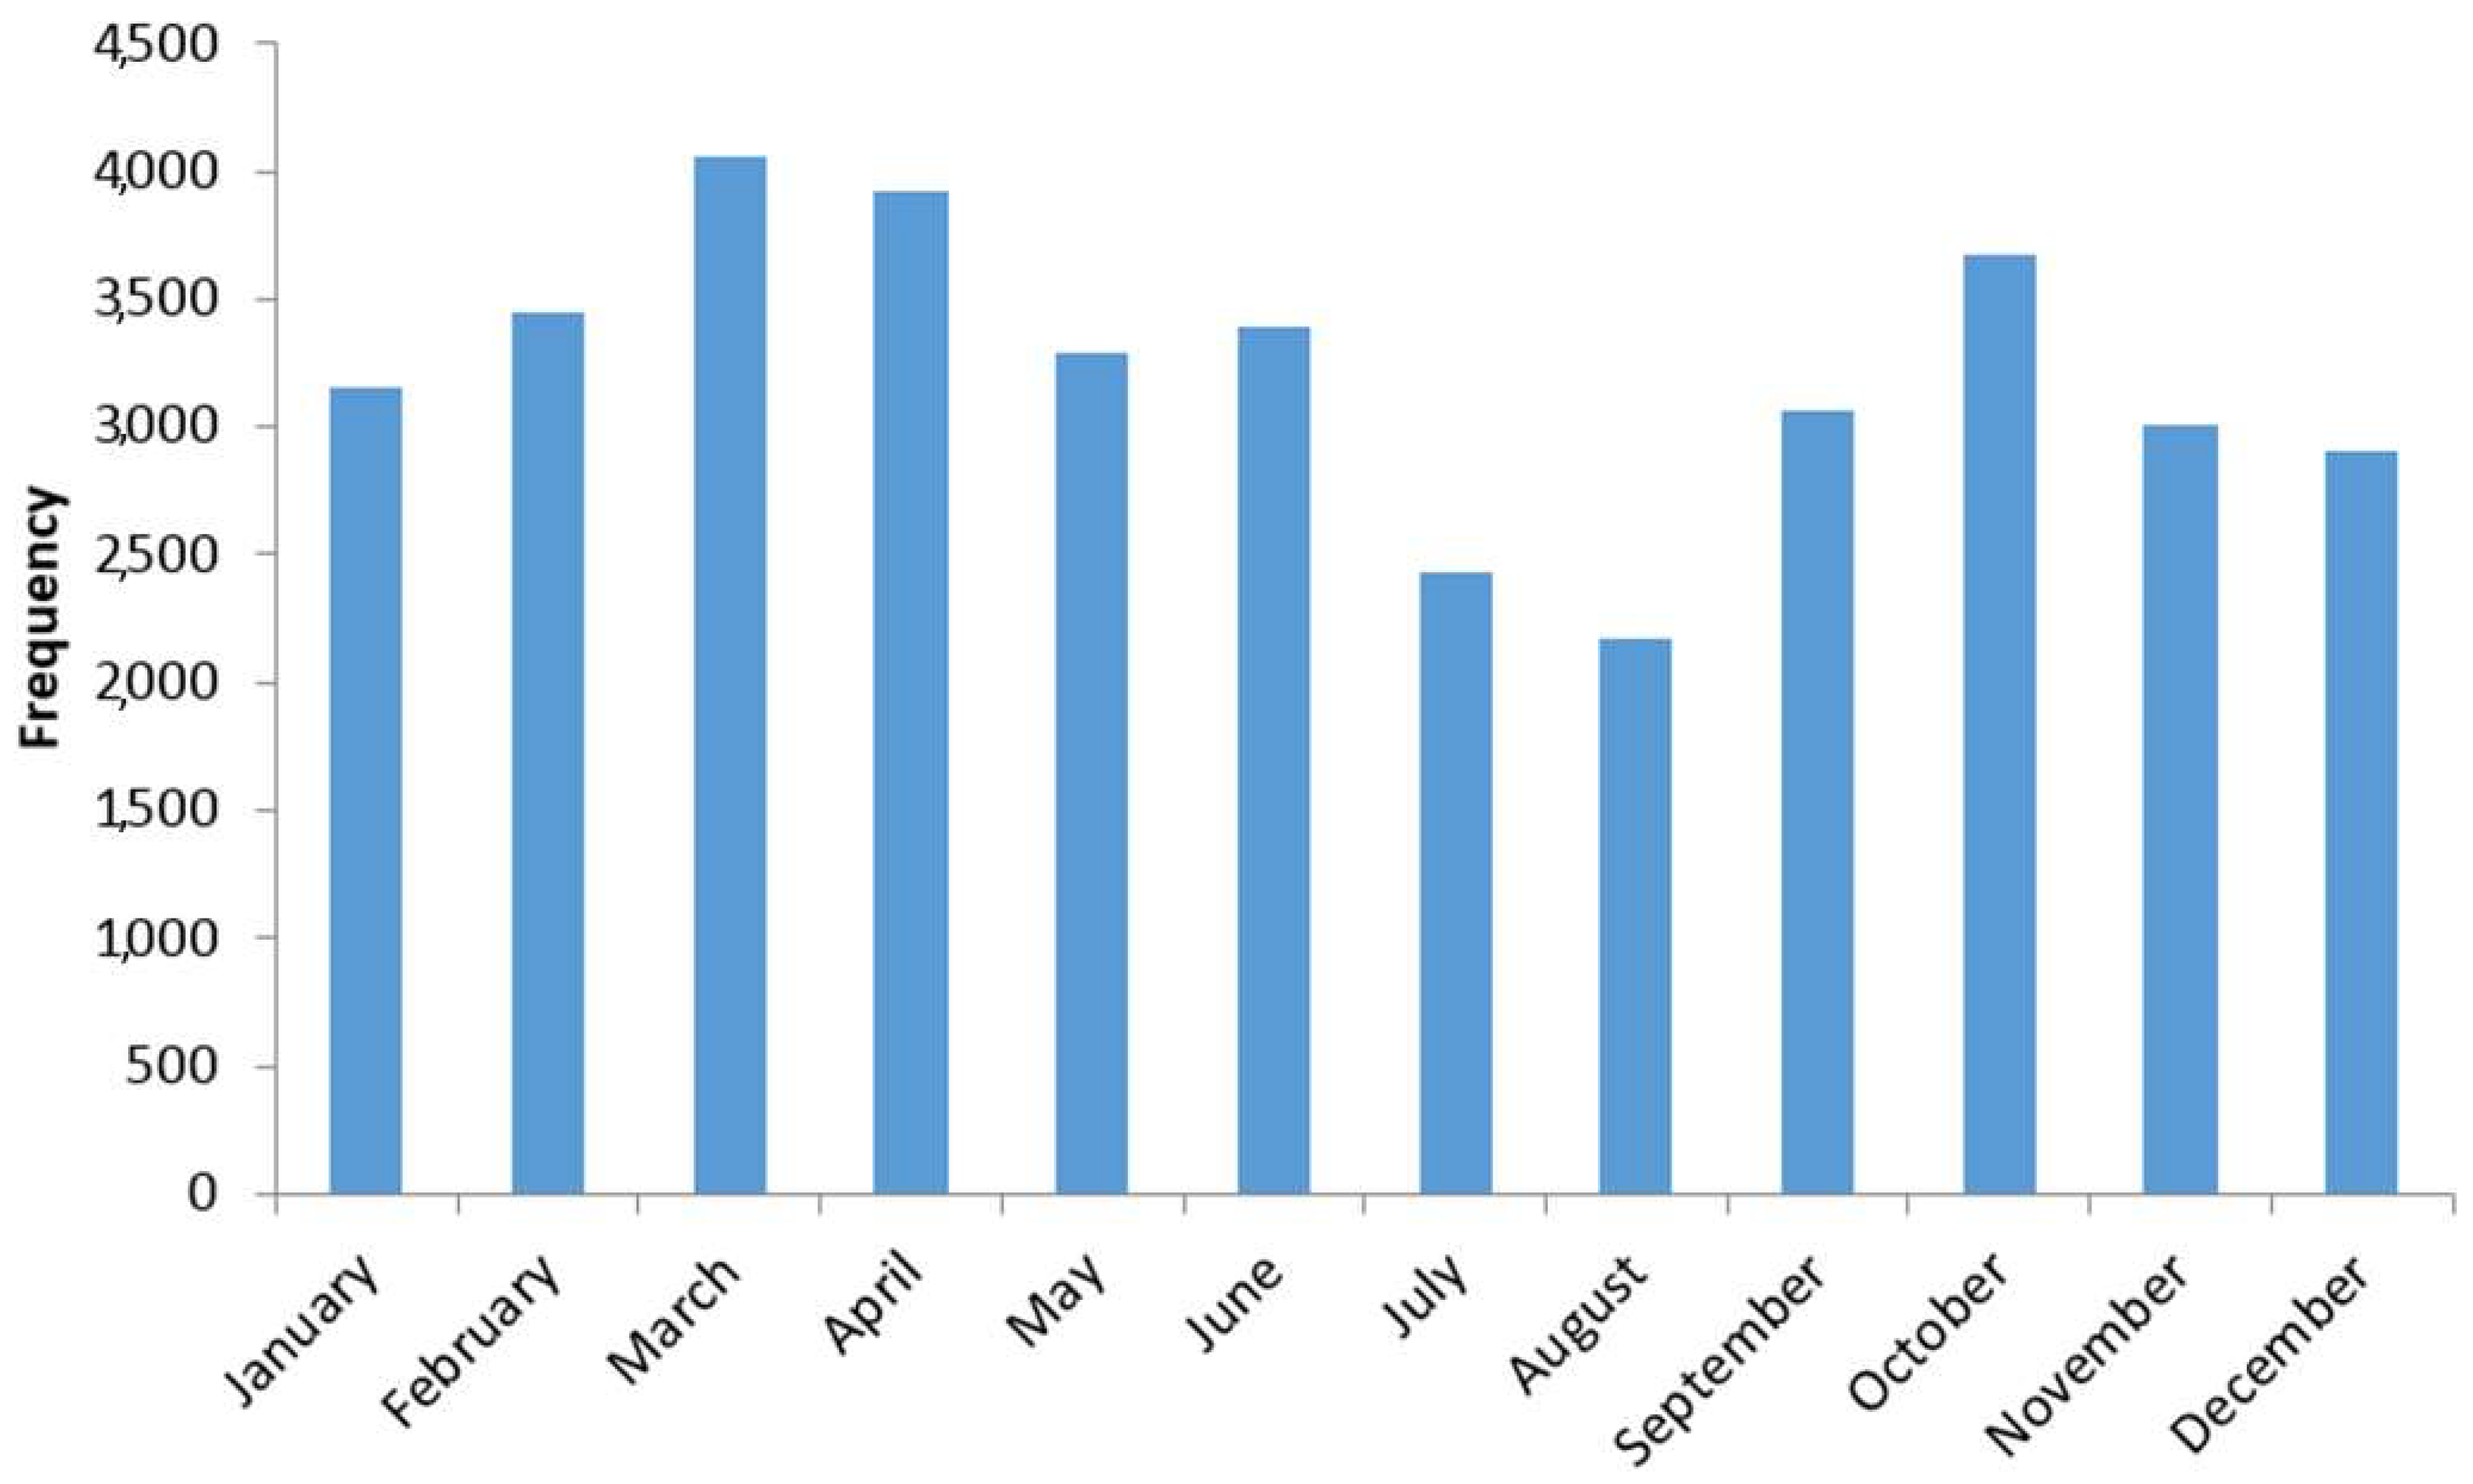
3.2. Seasonality of Total Pollen Grains Concentration at Saclay

The monthly distribution of pollen concentrations averaged over the four years of measurements displays a clear seasonal cycle as illustrated in Figure 4. P90, P75, P25, P10 represent the 90th, 75th, 25th and 10th percentiles respectively. The Main Pollen Season (MPS) is defined as the duration time when pollen is present in the atmosphere in significant concentrations at a location. It defines the main season starts and ends. The MPS used in this work is the period, when the time of the sum of daily mean pollen concentrations reaches 5% of the total sum until the time when the sum reaches 95%. Thus representing 90% of the pollen season.
The monthly mean found for the MPS in our study starts in February (81 Nb#/m3) and ends in September (29 Nb#/m3).
The first maximum was observed in April (703 Nb#/m3) followed by a rapid decrease in May (236 Nb#/m3) and a secondary maximum in June (335 Nb#/m3), followed by a slow decrease during July and August (data available in Table A1). In total, the pollen season is significant over 9 months of the year (from February to September), representing 75% of the year and 98% of the total pollen grains concentrations. It is noteworthy that 2018 exhibits very high concentrations and drives up the statistical values but similar seasonal starts/ends point and variability patterns were also observed for the 2015–2017 dataset.

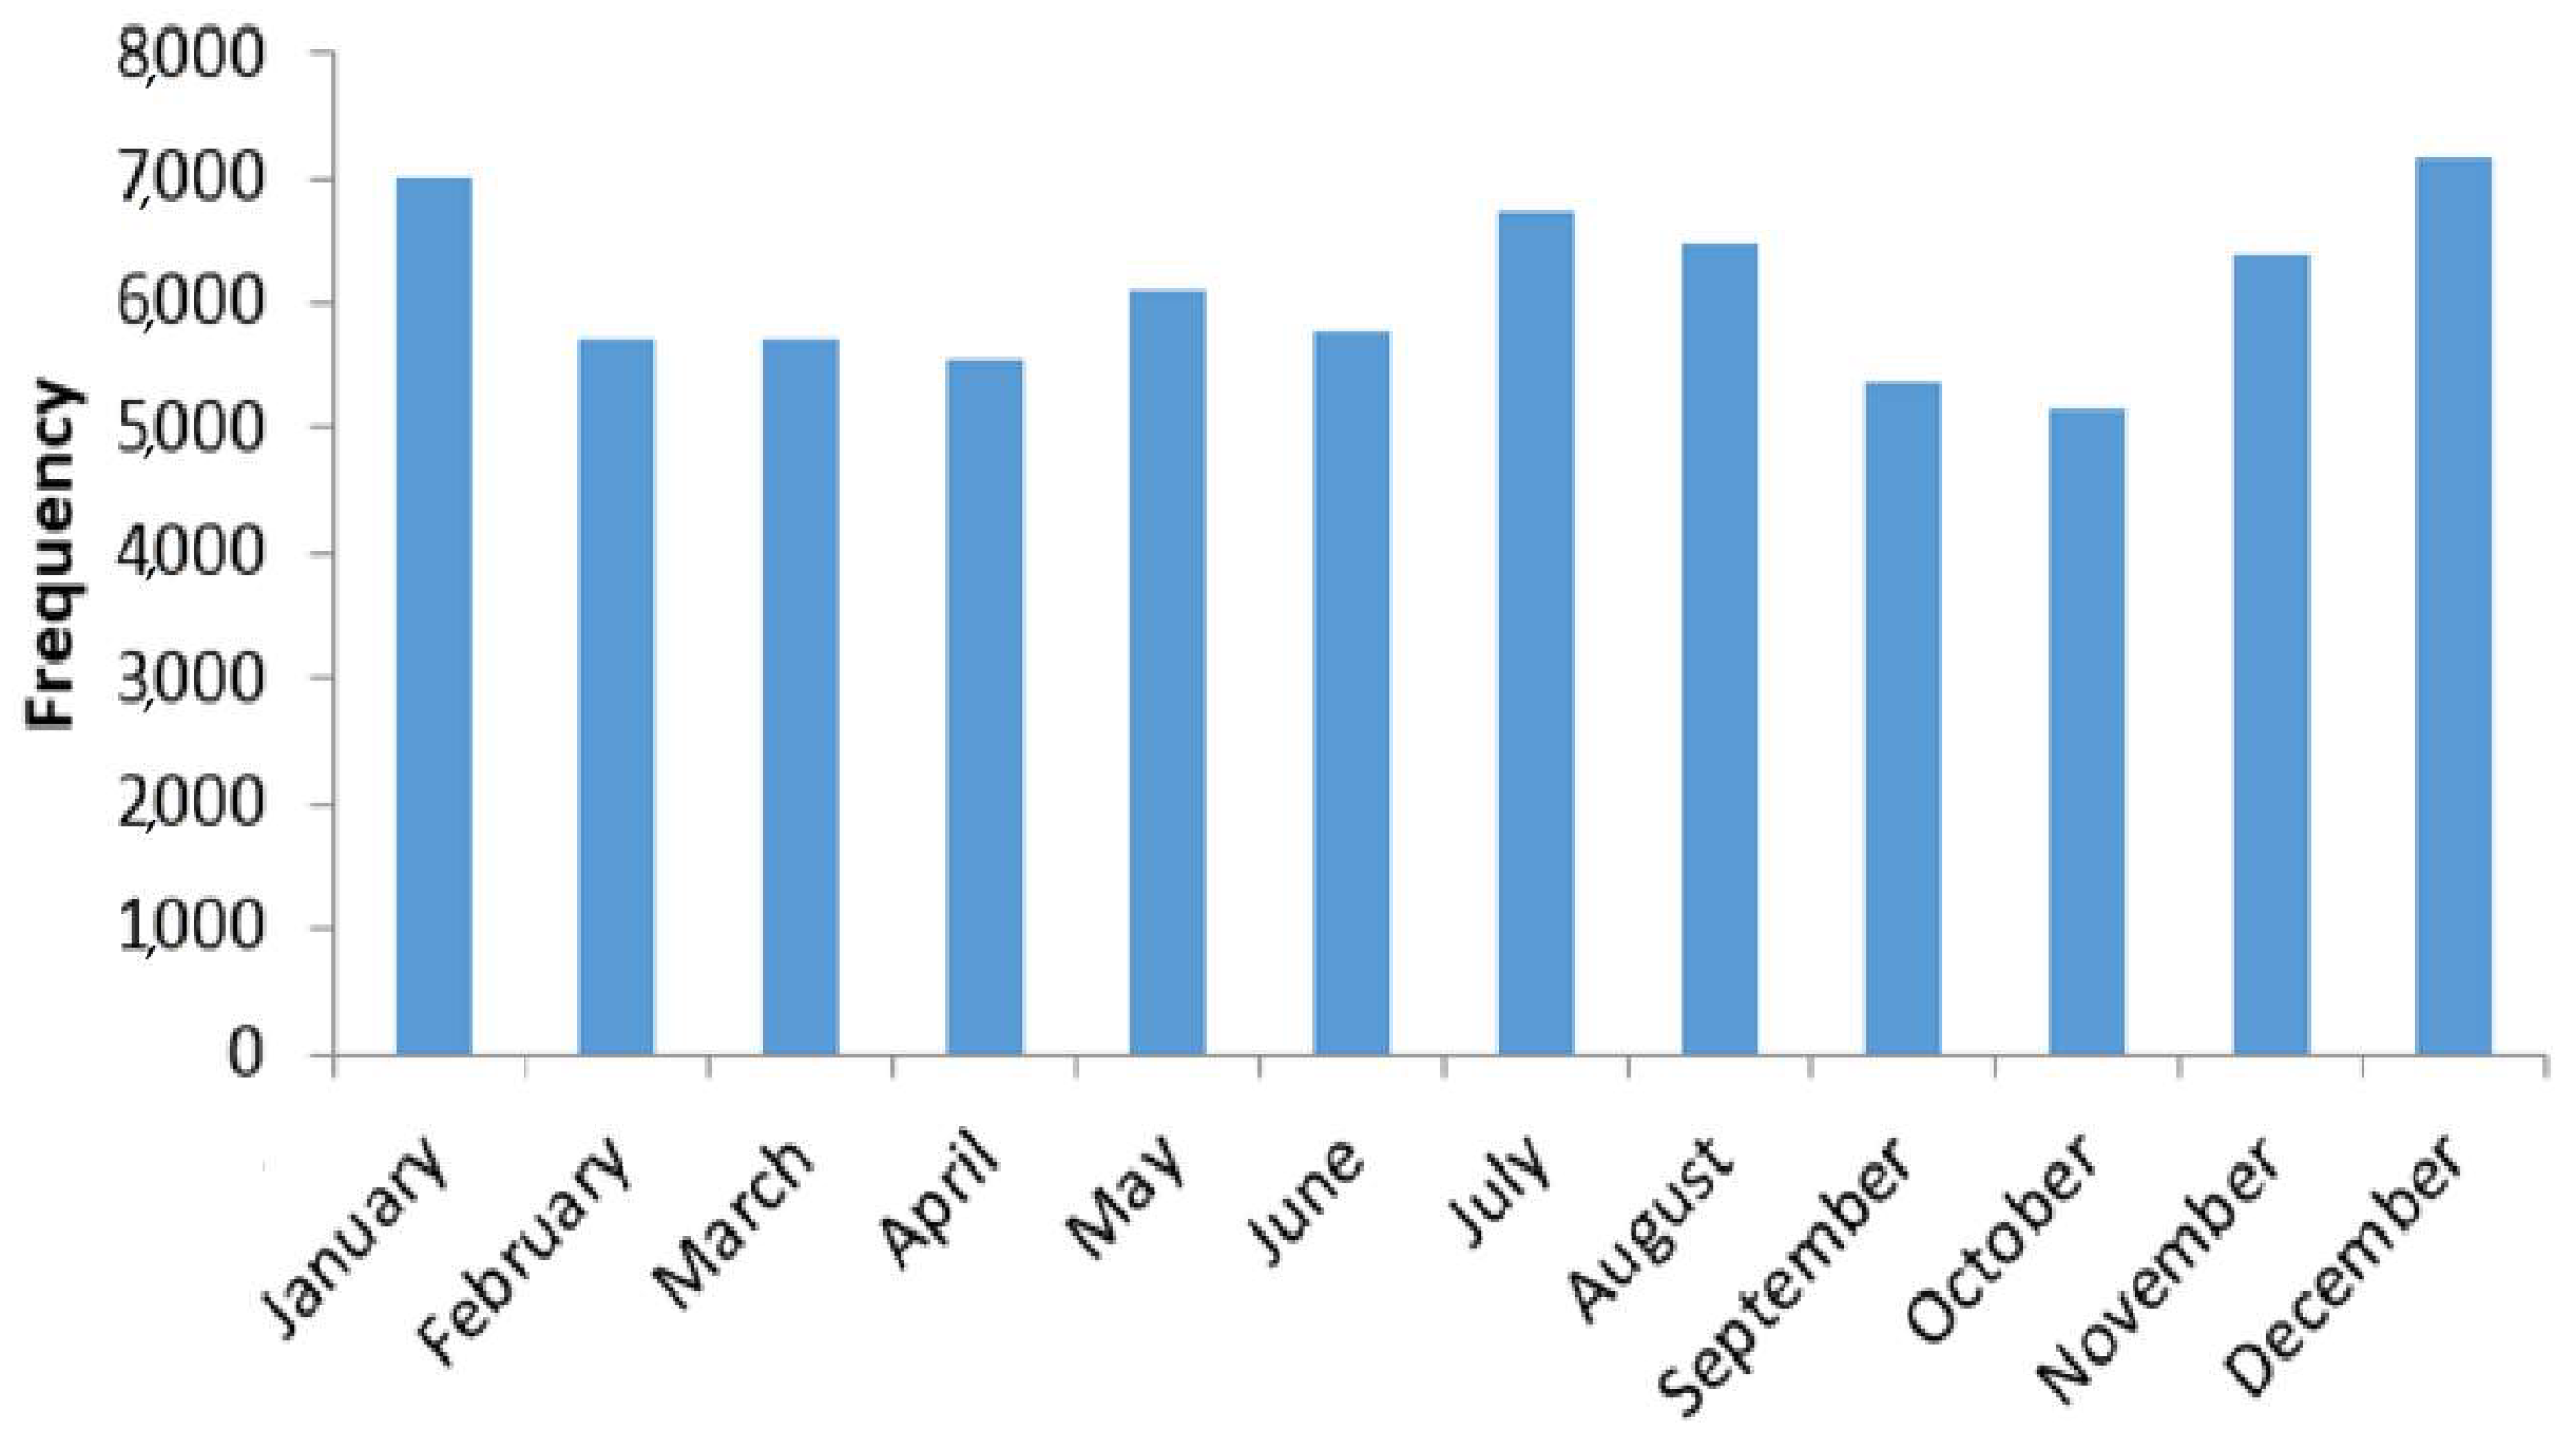
3.3. Daily Variability of Total Pollen Grains Concentration at Saclay

The Start of Pollen Season (SPS) used in this work follows the recommendation of [57] and has been applied to our data set, although this calculation is usually applied to species and not on the total pollen grains concentrations. During the period of observation, concentration exhibits a clear seasonality but also a strong daily variability as is illustrated in Figure 5. The identified pollen are characteristic of a degraded oceanic and semi-continental climate and were representative of this region including the Paris Area [58]. The pollen pattern at Saclay is different from one year to the next and this shall be due to variability of meteorological factors (temperatures, insolation, precipitation), which has been reviewed in Reference [59]. Regarding the MPS, the dates of the start season calculated for each of the four years were the 5 February 2015 (8 Nb#/m3), 6 January 2016 (10 Nb#/m3), 31 January 2017 (6 Nb#/m3) and 9 January 2018 (16 Nb#/m3). The calculation applied here was when the daily moving average on five consecutive days reached 5% of the annual mean [55]. This is in accordance of what is observed from the phenology observations for the early pollen season (Nadine Dupuy, personal communication).
As shown in Figure 5, pollen concentrations can be extremely variable in time and intensity with regard to the annual maxima. As an example, in 2018, from one day to the next the concentrations can be seen to increase by 10 fold or more, an example of which can be seen between April 5th and 6th, 2018, as the daily concentrations spiked from 306 to 3932 Nb#/m3.

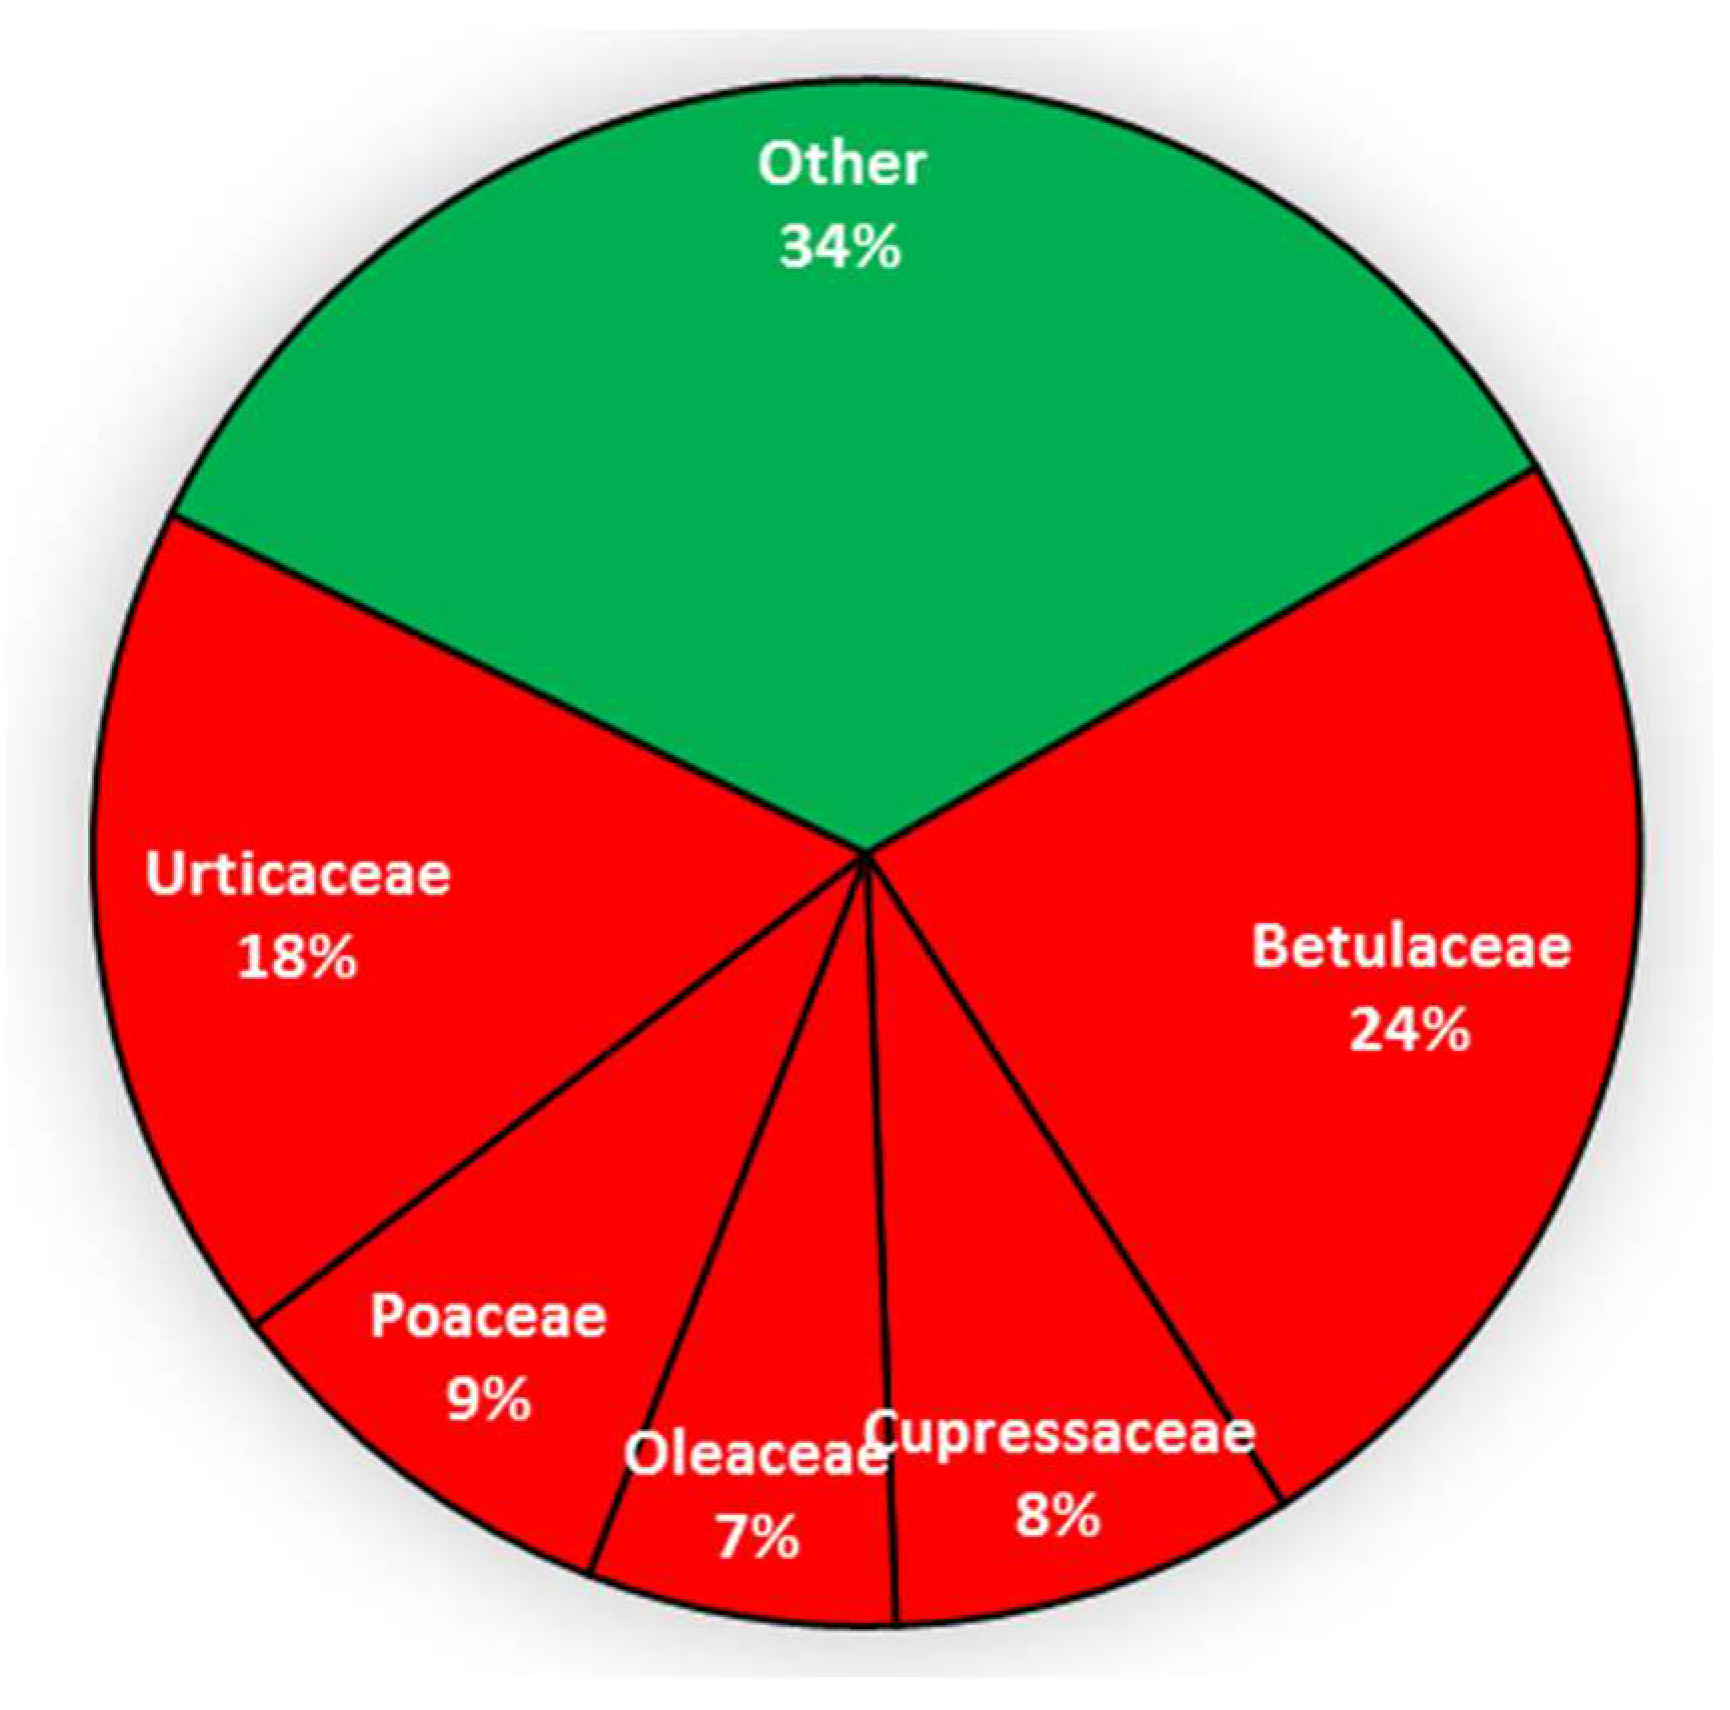
3.4. Allergenic Pollen Grains Abundance and Variability at Saclay

While discussions of total pollen concentrations are of interest, certain pollen species and families can be considered more allergenic than others. In this section, we will focus on five tree species belonging to the Betulaceae and Oleaceae families, two shrub families (Cupressaceae-Taxaceae) and two herbaceous families (Poaceae and Urticaceae) because of their important allergenic properties (Table 1 and Table 2). These pollen species are of particular relevance due to their health impacts [60,61] by the French Ministry of Sanitary Survey in the Paris region. For Poaceae all species are considered allergenic and cannot be accurately distinguished between each other via light microscope, hence all species have been condensed into one grouping.
Figure 6 shows the relative abundance of those 9 allergenic species/families with respect to total pollen grains. Two thirds of the pollen grains can be considered allergenic (highlighted in red in Figure 6), while one third have no known impact on human health. This result indicates that allergenic species strongly drive the pollen pattern in the air at Saclay as that dominate overall concentrations. The tree and shrub pollen species, Alnus, Betula, Carpinus, Corylus, Fraxinus and Juniperus, Cupressus combined together represent 38% of the allergenic pollen, while the grass pollen Poaceae and Urticaceae together account for 27%.
Figure 7 displays the daily concentrations of the 9 allergenic pollen species/types over the 4 seasonal cycles between 2015 and 2018. The activity appears well featured in time exhibiting contrasting patterns: tree pollen first occur from February to May, followed by herbaceous pollen between June and September. It is noticeable that Poaceae disappears at the end of July while Urticaceae values remains high until the end of August, before decreasing in September. Our observations are in accordance with previous reports [62]. Tree and herbaceous pollen are the drivers for the 2 modes we previously reported, in April and June, respectively (Figure 5).
As illustrated by Figure 7, the allergenic species appear and disappear over the years with a repeatable/seasonal pattern. Thus, the allergenic pollen season followed this order: Corylus, Alnus, Cupressaceae-Taxaceae, Fraxinus, Betula, Poaceae and Urticaceae.

4. Discussion

In this section the interannual, seasonal and daily variability of total pollen grains concentrations at Saclay are discussed and compared to the literature. For the purpose of investigating the origins and point sources of pollen grains impacting Saclay, the source-receptor integrated tool ZeFir was run.

4.1. Interannuality and General Increase of Pollen Concentrations

Although limited to 4 years, the strong interannuality of daily total pollen levels at Saclay seems to present a bi-annual cycle mainly influenced by Betulaceae species (Appendix A, Figure A1), in accordance with the results reported by [11,53,63] for Betula. Regarding the literature, the North Atlantic Oscillation (NAO), do not appear to influence the interannuality of Betula [64] but seems to be linked to synoptic weather patterns [19]. The general increase observed in the total pollen grains has also reported by [18], who investigated the effect of eutrophication in urban areas. However, to our knowledge, no clear link has yet been established in the literature with nitrogen originating from crop activities, or with atmospheric nitrogen from polluted environments. The combination of deposited ammonium nitrate attached to soil dust with species sensitive to nitrogen like Urticaceae remains to be investigated. Meanwhile, global warming as a whole has been pointed out by the research community as the key driver for the interannual pattern observed for given species, as reported by [65,66]. To understand the high concentration observed over the APS in 2018 we investigate different meteorological variables and the effect of rain in particular. The main reason why the 2018 APS exhibits very high concentration is the presence of high concentration of Fraxinus (major genus of Oleaceae family) and Betula as it is shown in Figure 7. For 2015, 2016, 2017, 2018, the abundance of Oleaceae was 8%, 2%, 3%, 11%, while the abundance of Betula was 13%, 27%, 13%, 34%, respectively, as illustrated by Figure A8 in Appendix A. The interannuality is therefore primarily driven by Betulaceae. As a winter drought could have had a significant effect on the tree pollen season, the effect of rain on the APS was investigated. It was noted that no strong variation in the total amount of rain was observed for our period of study (Table A3). The annual sum of rain cannot explain the maximum observed in 2018: 2015 (531.5 mm); 2016 (647.5 mm), 2017 (648.7 mm), 2018 (507.8 mm, excluding November and December). Further analysis was undertaken to examine the relationship between rainfall amounts in the 6-month period preceding the start of the flowering period of Betulaceae, that is, from August to January and defined as the Integrated Period (IP) as seen below (Table 3).
The results plotted in Figure 8a show a comparable interannual variability in the precipitation pattern of the IP and in the APS of the following year. A correlation coefficient (R2 = 0.97) was obtained when considering the IP precipitation illustrated in the Figure 8b. This result is consistent with the recent work of [66] and could be useful to estimate the severity of the pollen trees emissions and particularly Betulaceae.
The limited length of our dataset is an obstacle to statistical representativeness and will therefore need to be supported with further similar measurements for the next few years or compared with other observations, like those from the Paris station operated by RNSA.

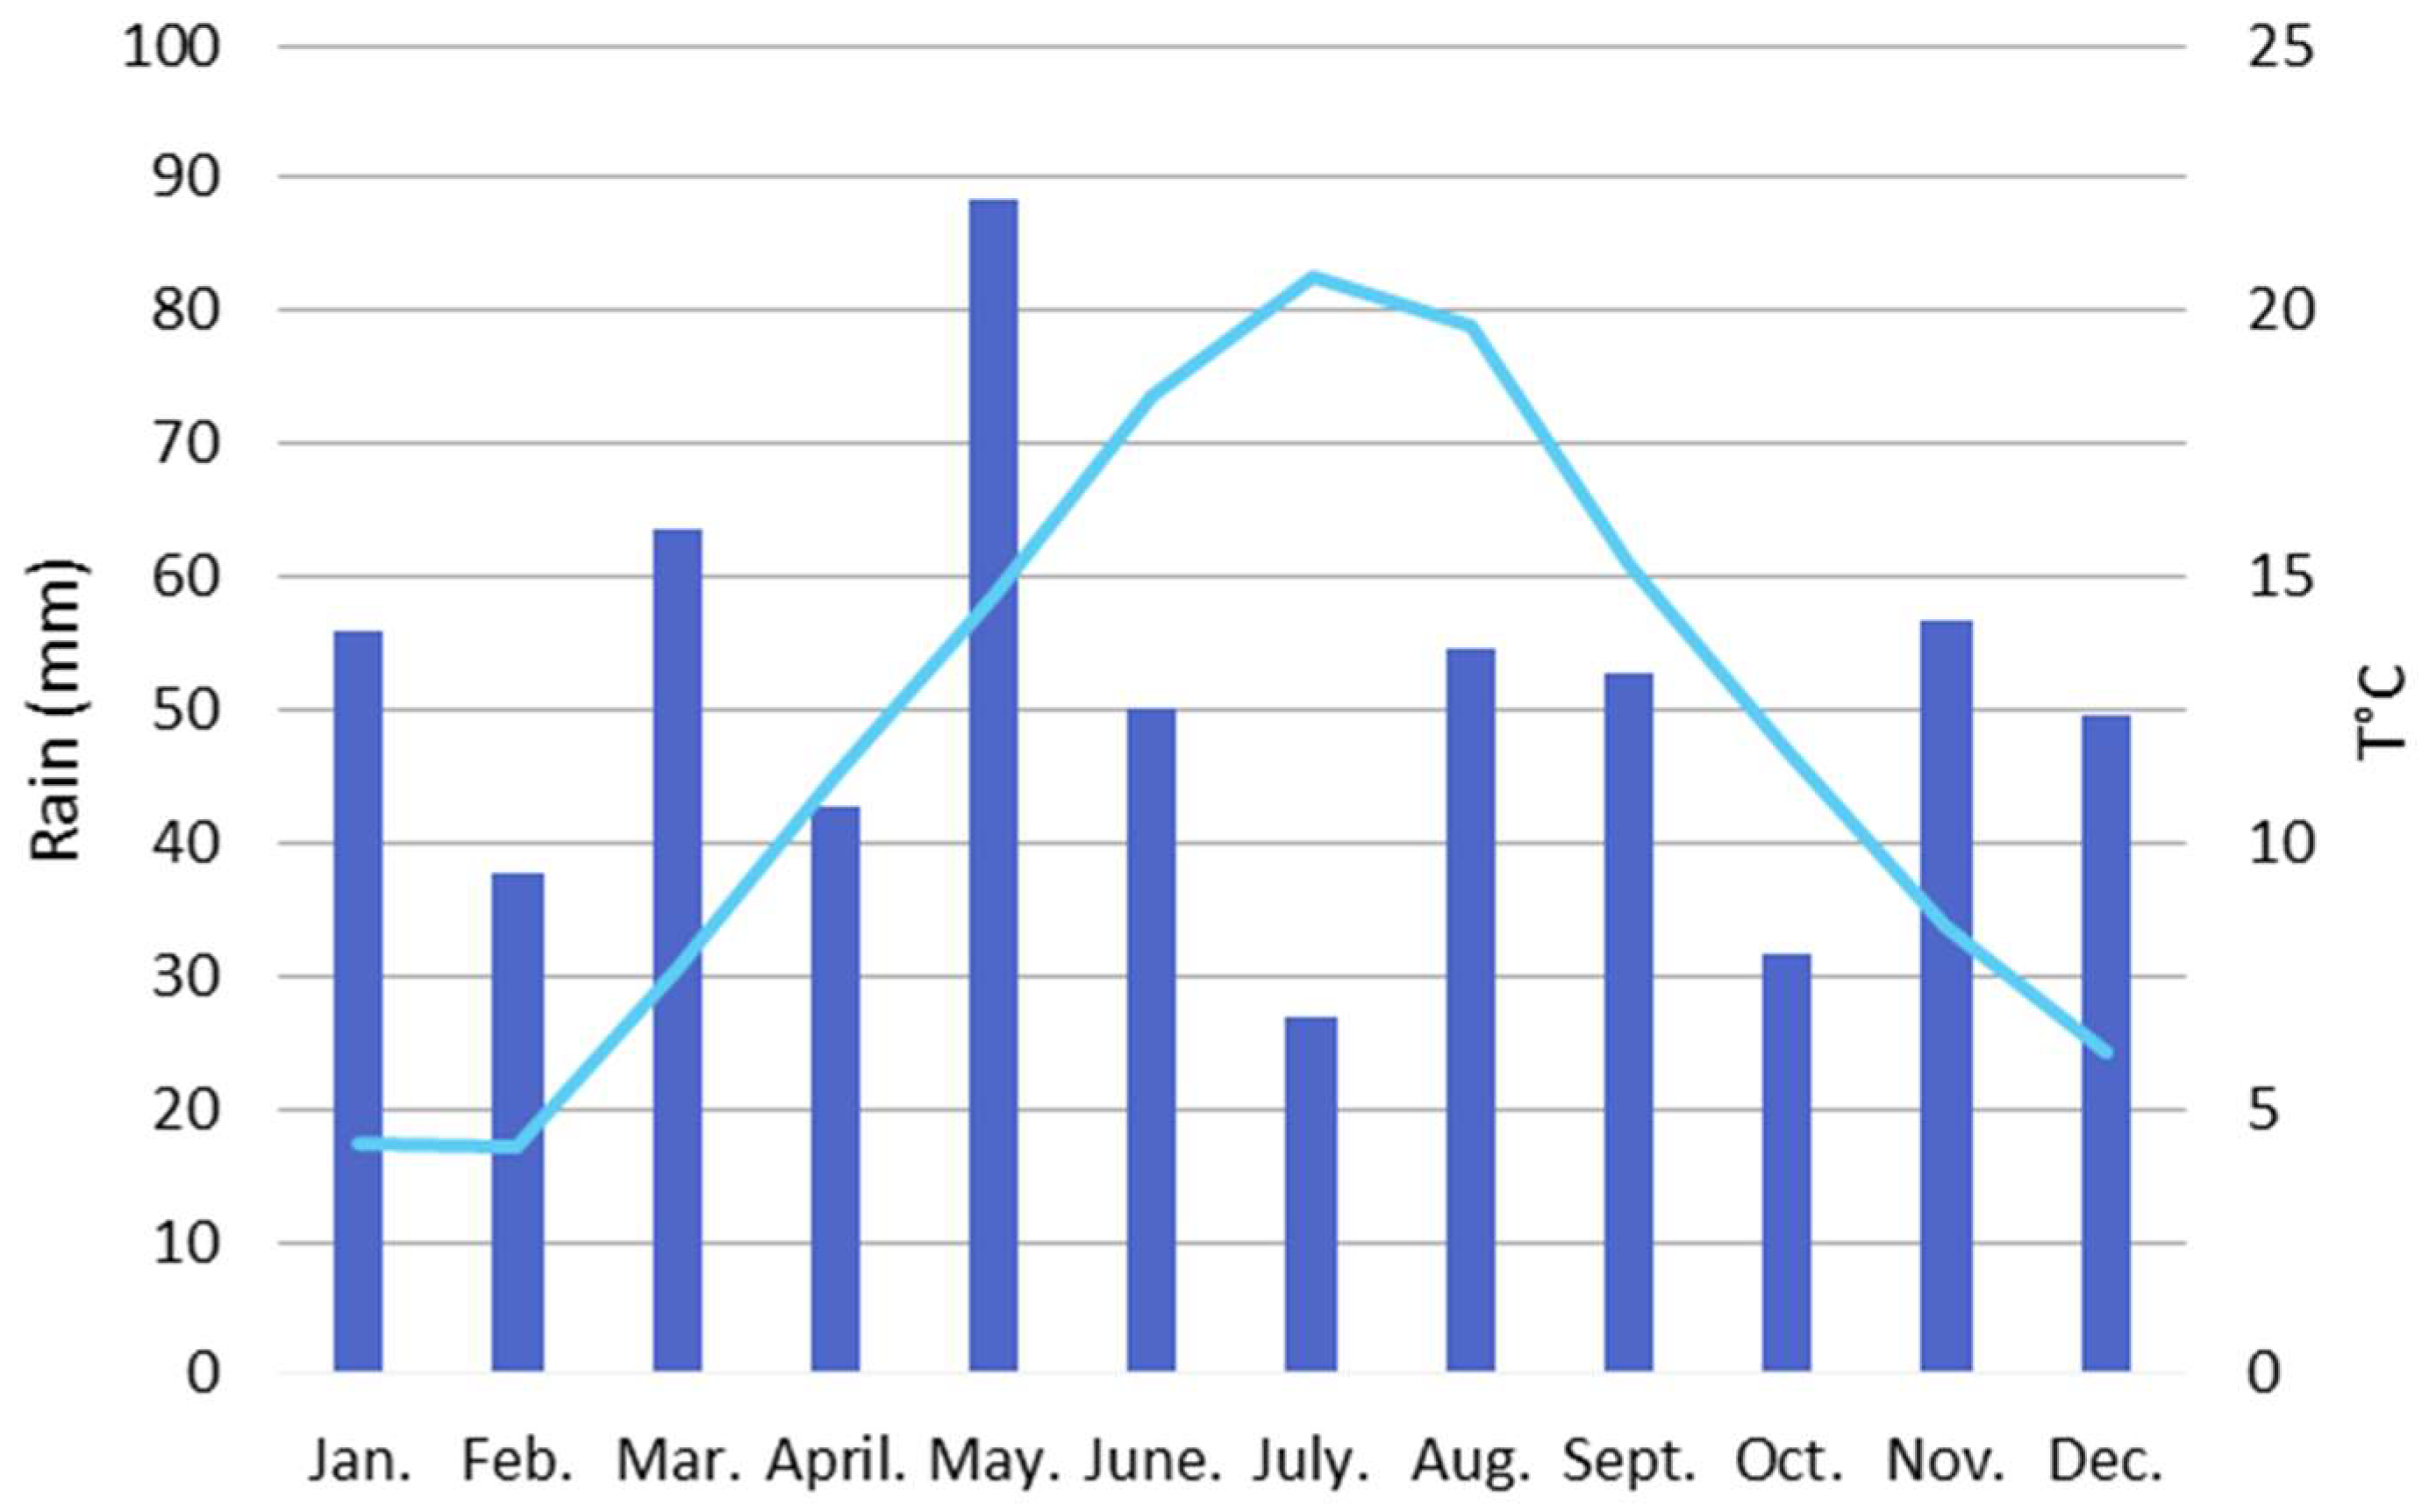
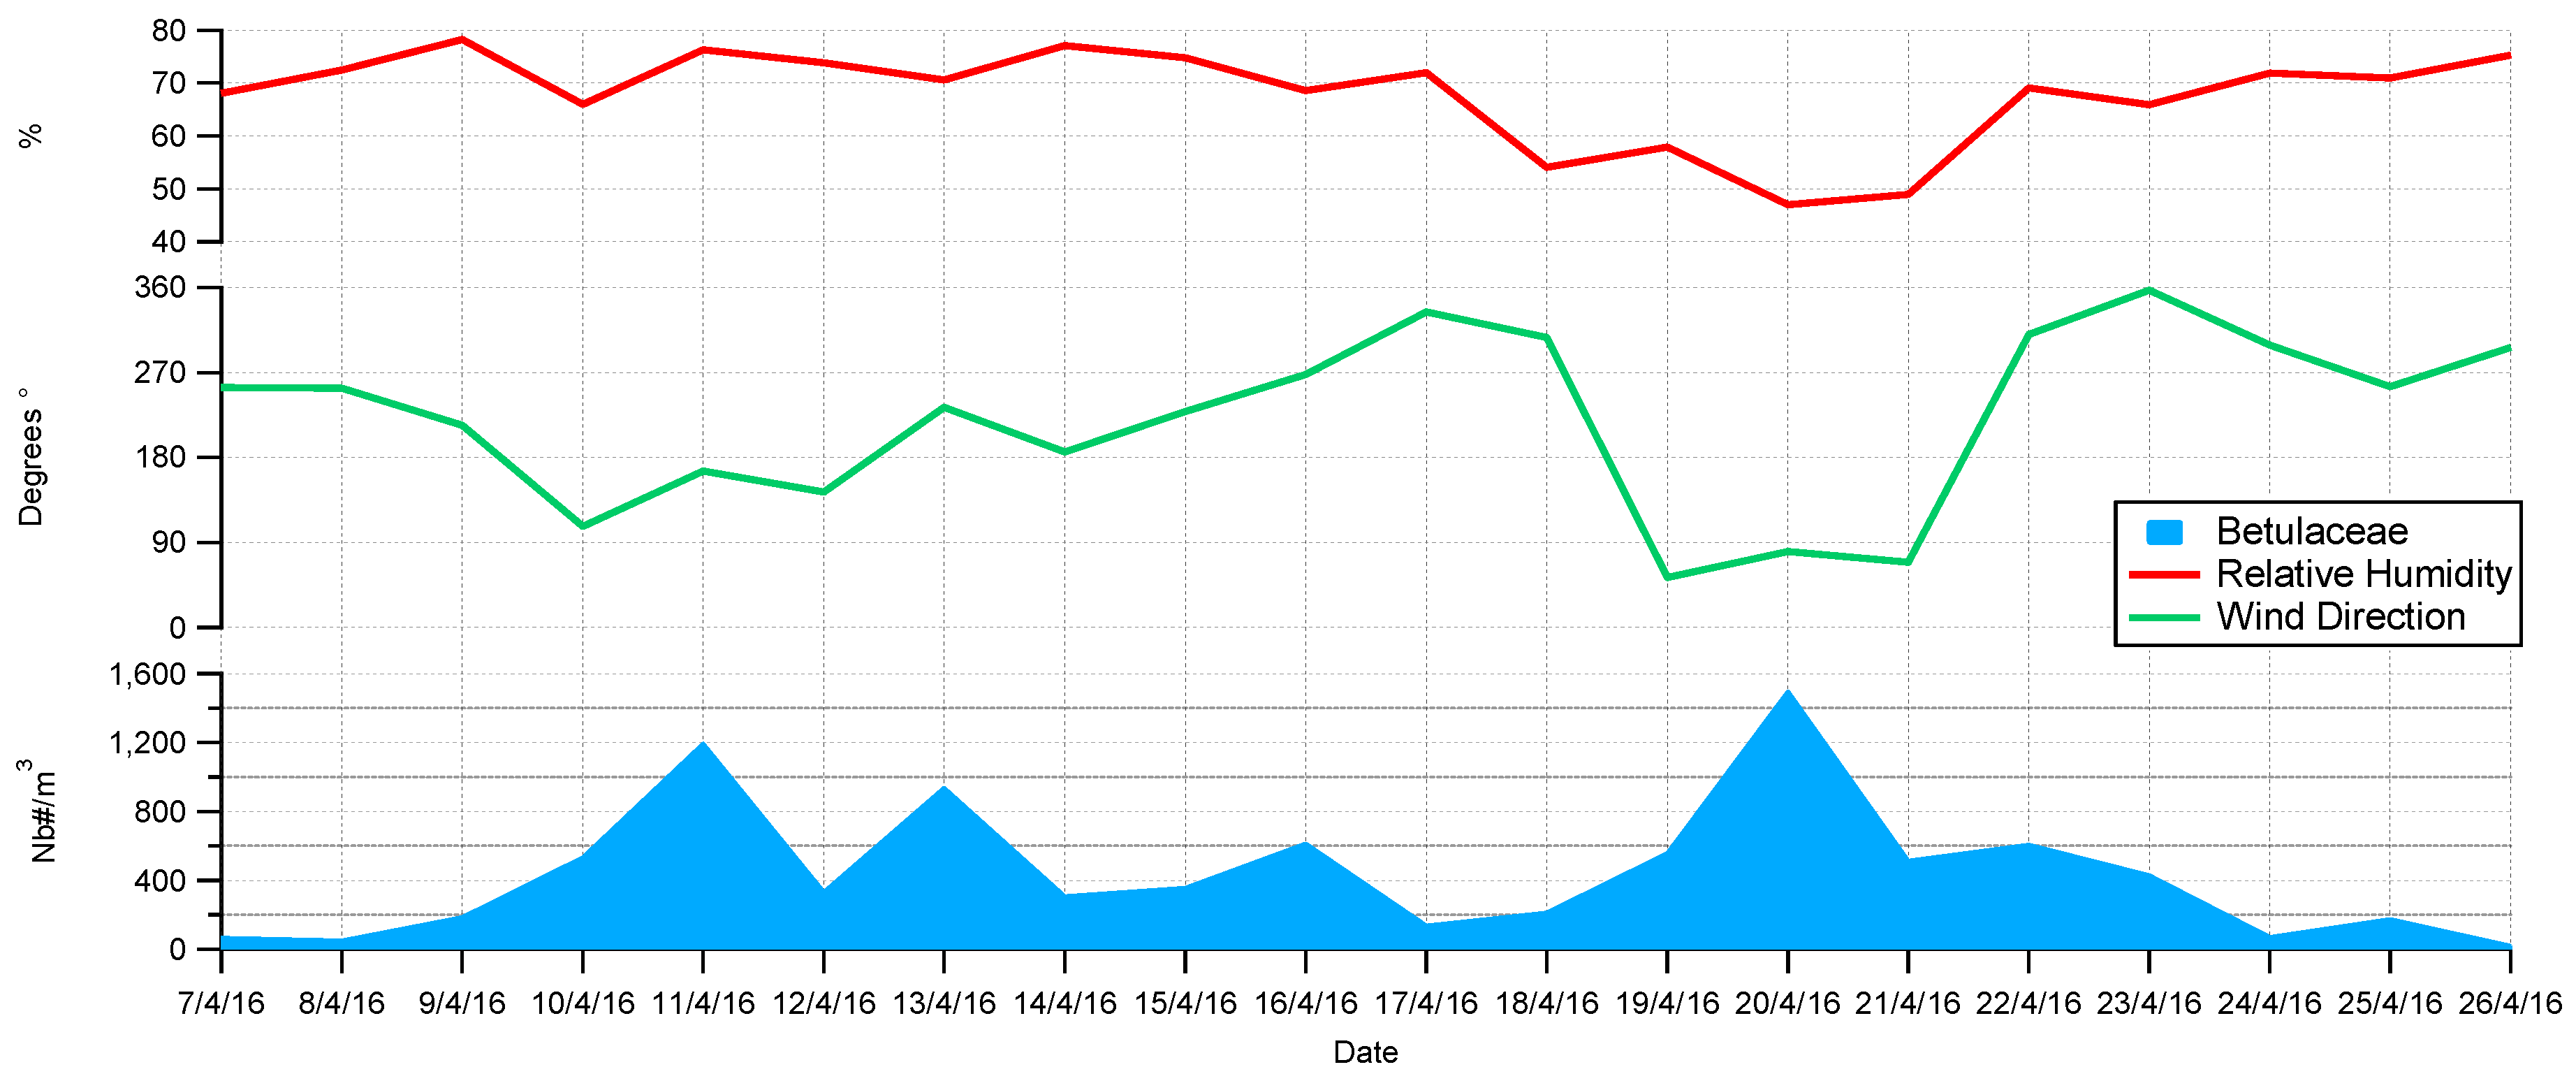
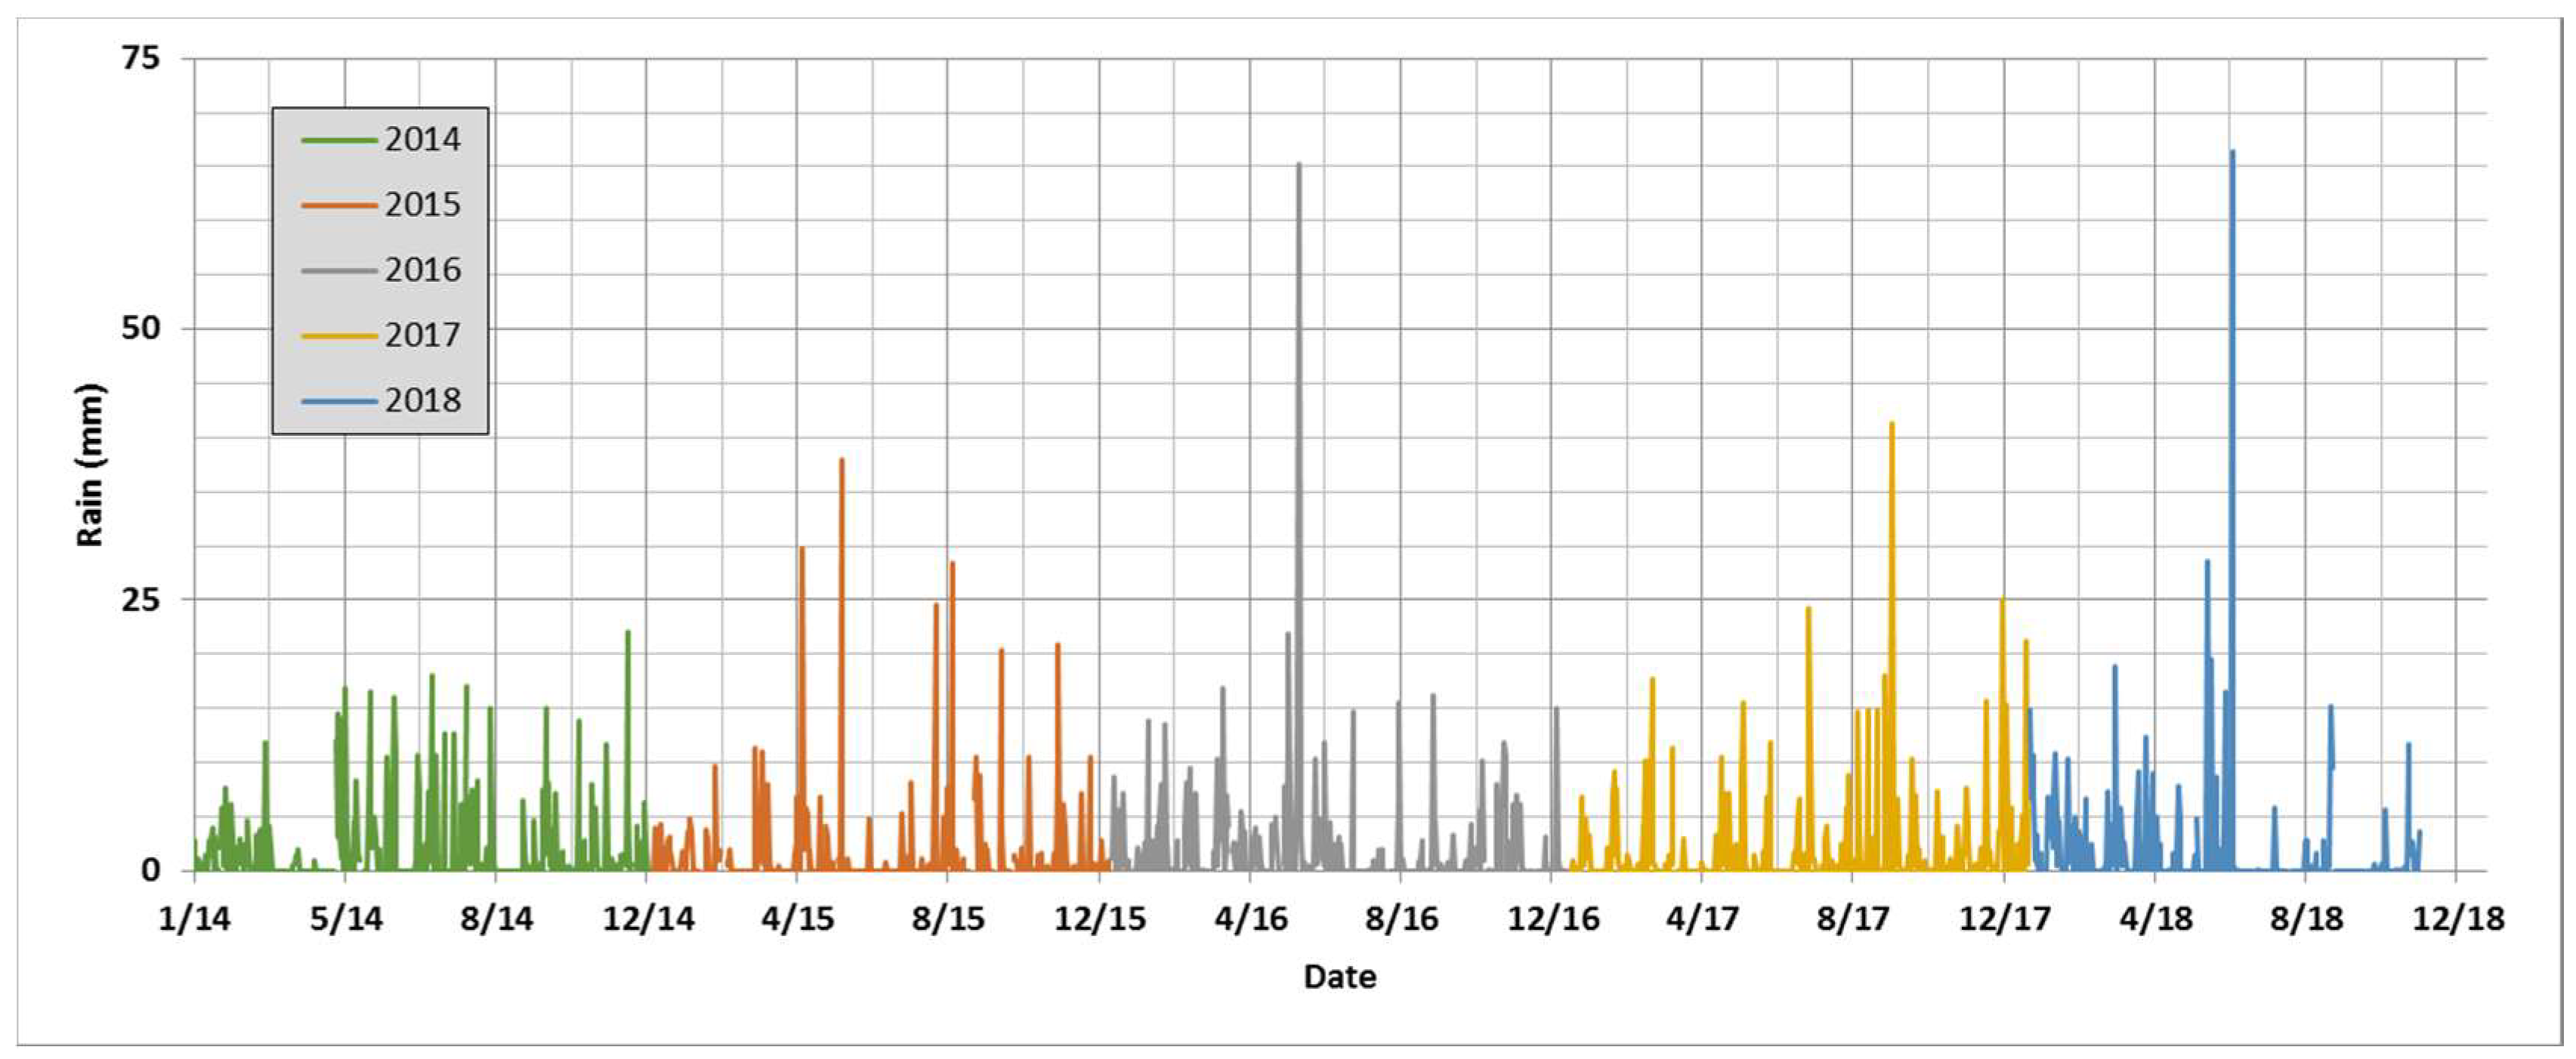
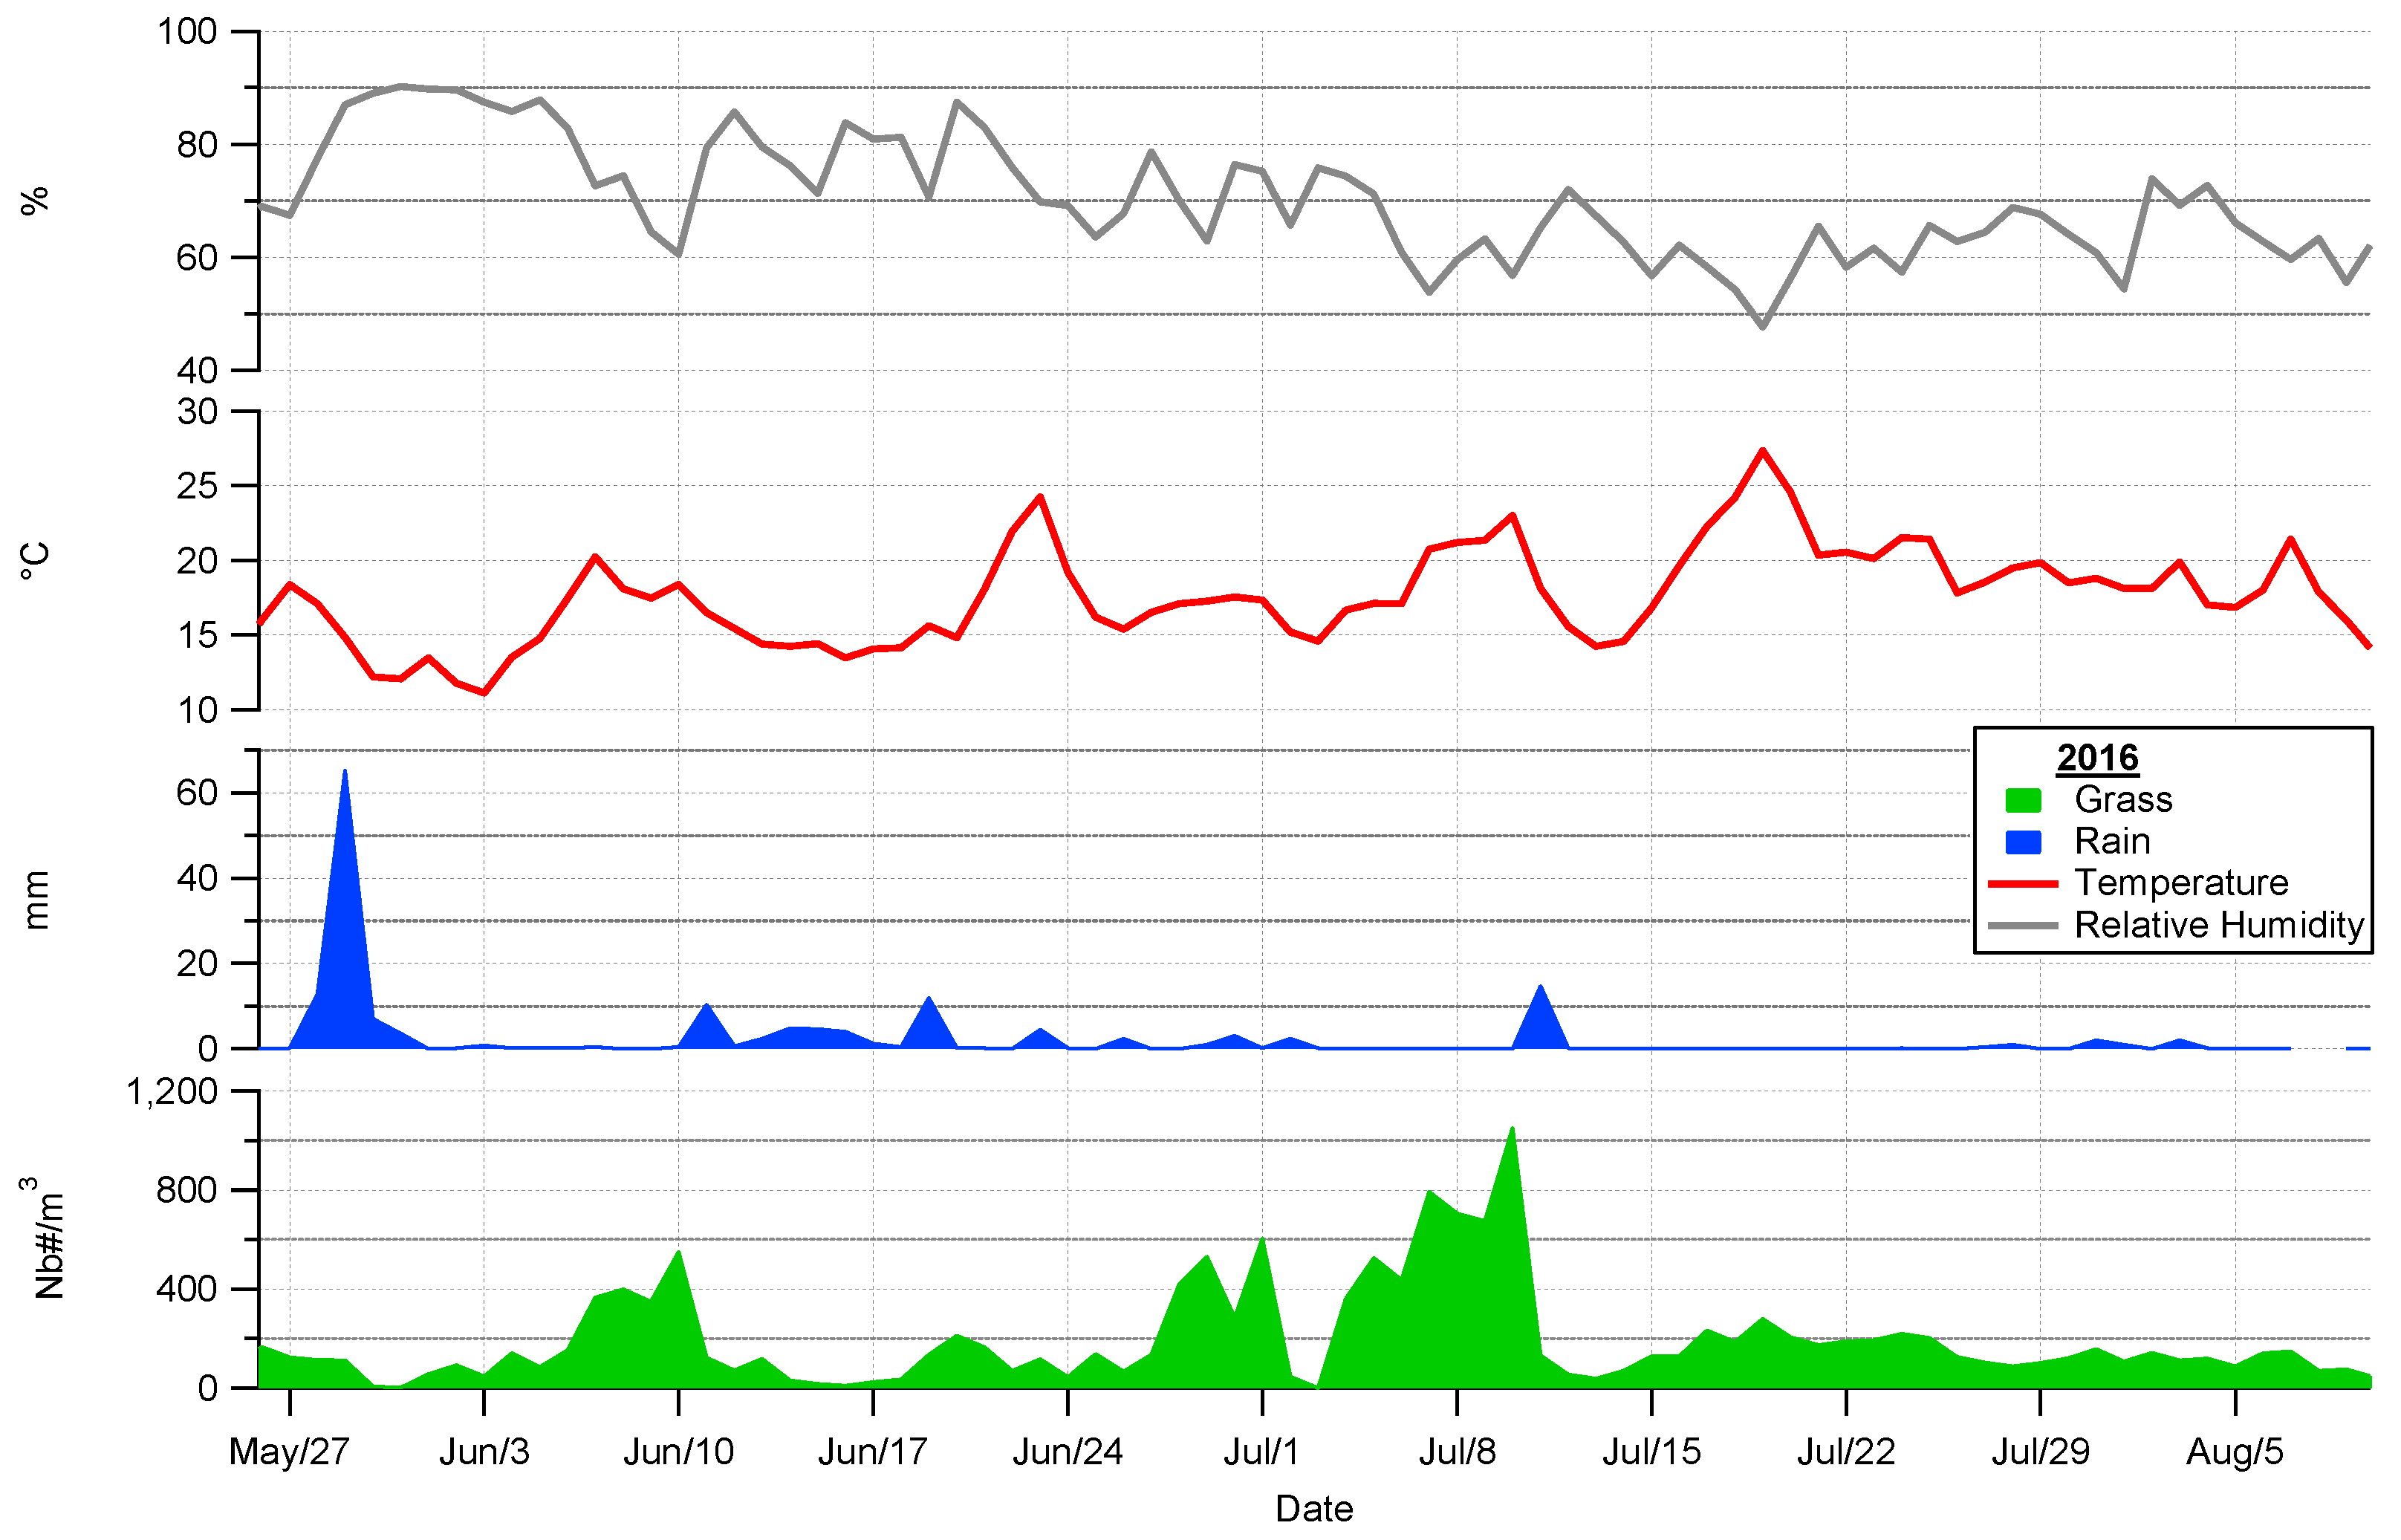
4.2. Pollen Seasonality Related to Air Temperature, Relative Humidity and Rain

Air temperature has been found to be a key factor for determining the start date of the pollen season, while humidity is known to explain variations in the atmospheric loadings [59]. The relationship between air temperature and relative humidity has been well described in the literature. Most of the available results however are related to studies performed on specific species for the purpose of evaluating the start and the dynamics of their seasonal cycle. Figure 9 associates the seasonality of T, RH and pollen found in Saclay over the period of observation. In accordance with previous works [67], warmer winters are followed by early onsets of the growing season. The starts of tree flowering mainly results from a balance between cold winter and warmer temperatures occurring in early spring which would participate to interrupt the vegetative state [63,68].
The main variable associated with the beginning of the pollen season at Saclay is air temperature (more than 6 °C on average) and low relative humidity (below 75% on average). In August, while air temperature is high (more than 21 °C) and relative humidity increases (more than 75%) appear to cause the rapid end of the pollen season. In this study, the start of the pollen season calculated for the total pollen grains concentrations fluctuates on average for 12 days, spanning a period of 3 days to 30 days (e.g., Section 3.2.). However, temperature and relative humidity fail to explain the absolute concentrations of pollen grain. Regarding the decrease of pollen concentrations in May, one explanation can be found in the seasonality of the rainfall (Figure 10). This decrease in concentration could be due to the wet removal of tree pollens which are predominant in the air in this period of the year. Intense rainfalls occurs when the temperature was seen to increase. This double effect (water and temperature) is probably responsible of the enhanced grass growth in early June. The release of grass pollen occurred when the precipitation was generally lower and the temperature higher. Moreover, during this period the weather was unstable and the rain showers were short and intense on a daily basis as illustrated by Figure A7 in Appendix A. This last point could explain the increase of intense peaks due to plant stress during this period as illustrated in the Figure A8 in Appendix A. Interestingly, it does not affect the total concentration of grass pollen which remains relatively stable (Appendix A, Table A2).

4.3. Wind Prevalence at Saclay

Wind pollination is an important feature regarding the seasonality of pollen [69]. In order to better understand the mechanisms of transport of pollen by the wind, we used the ZeFir source-receptor tool, which allows visualization of the possible spatial origins of pollen. At Saclay, prevailing winds come from West to South-West, with speeds generally ranging from 5 to 12 km/h (Figure 11) and are associated with oceanic air masses. A second wind regime is characterized by North (5°) to South East (125°) winds, at speeds ranging from 2 to 7 km/h, bringing rather sunny skies, dry air and higher temperatures.

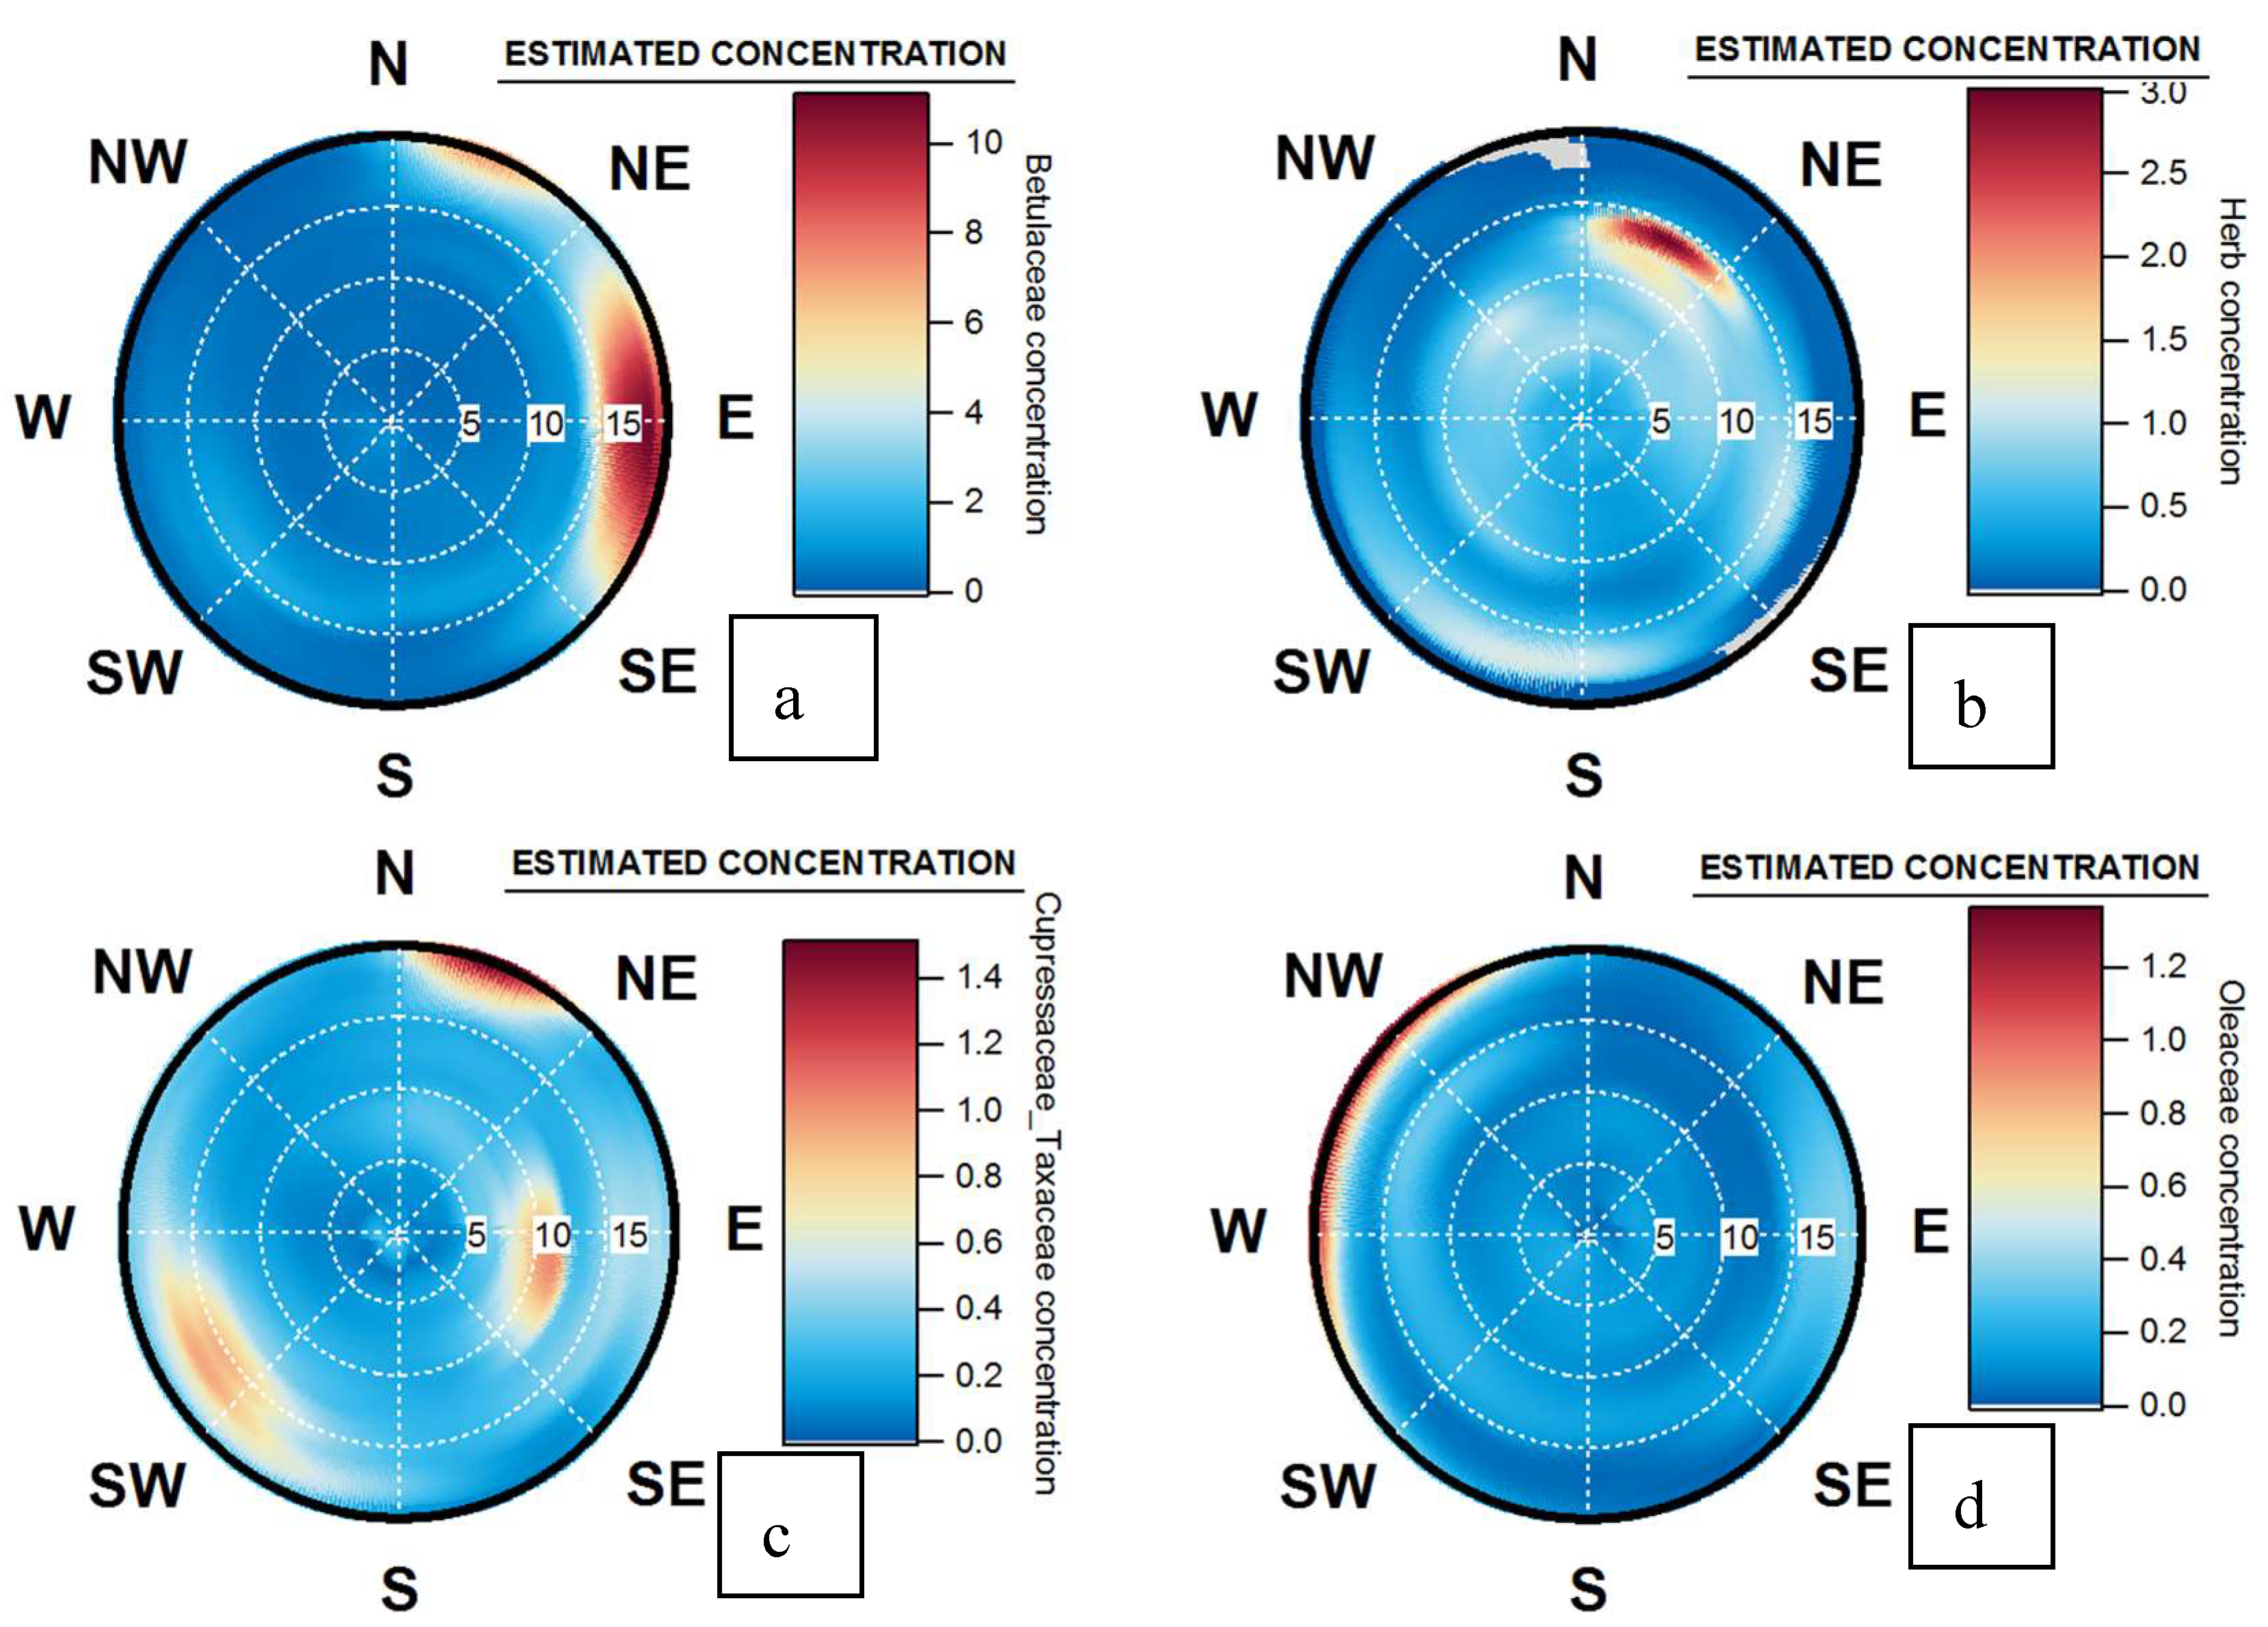
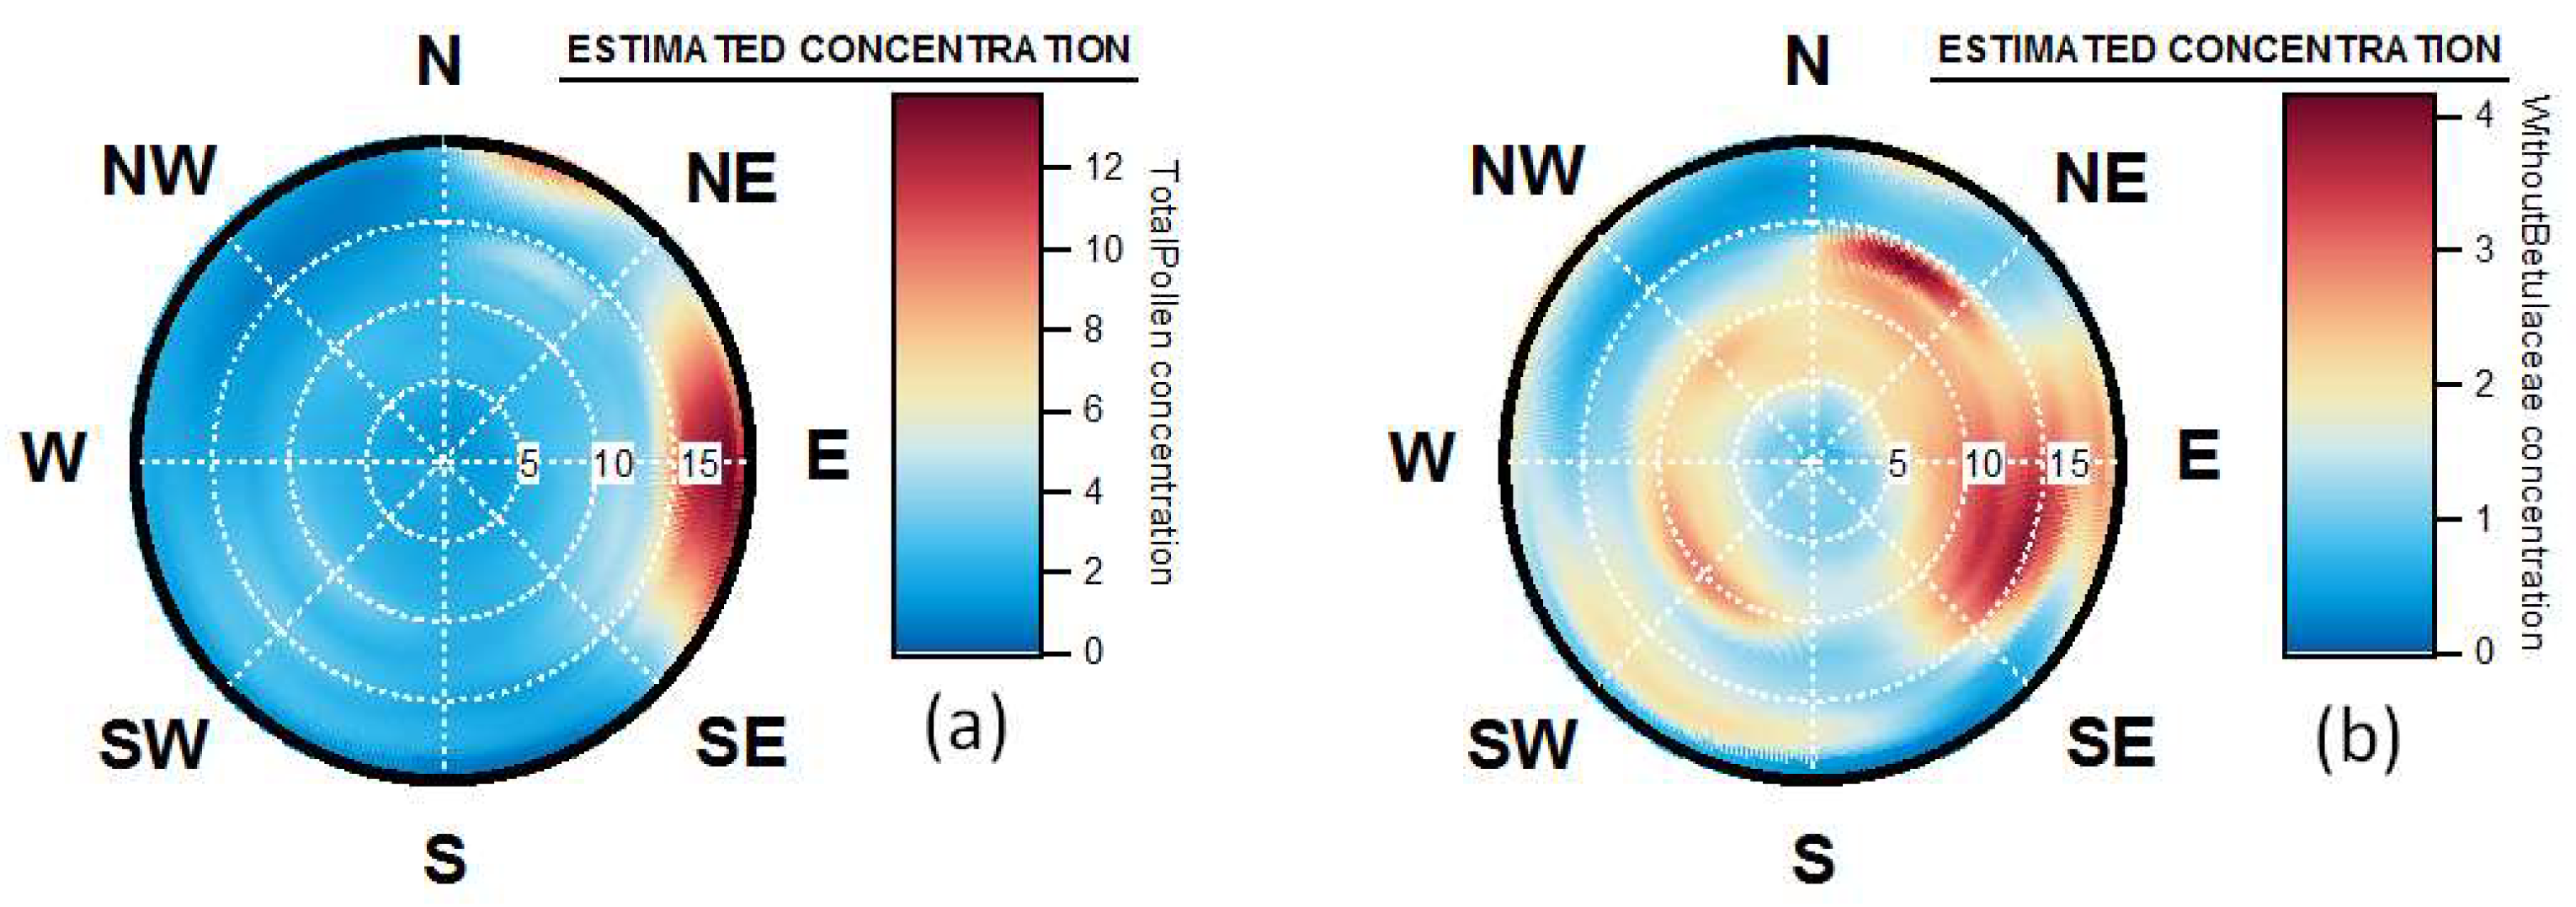
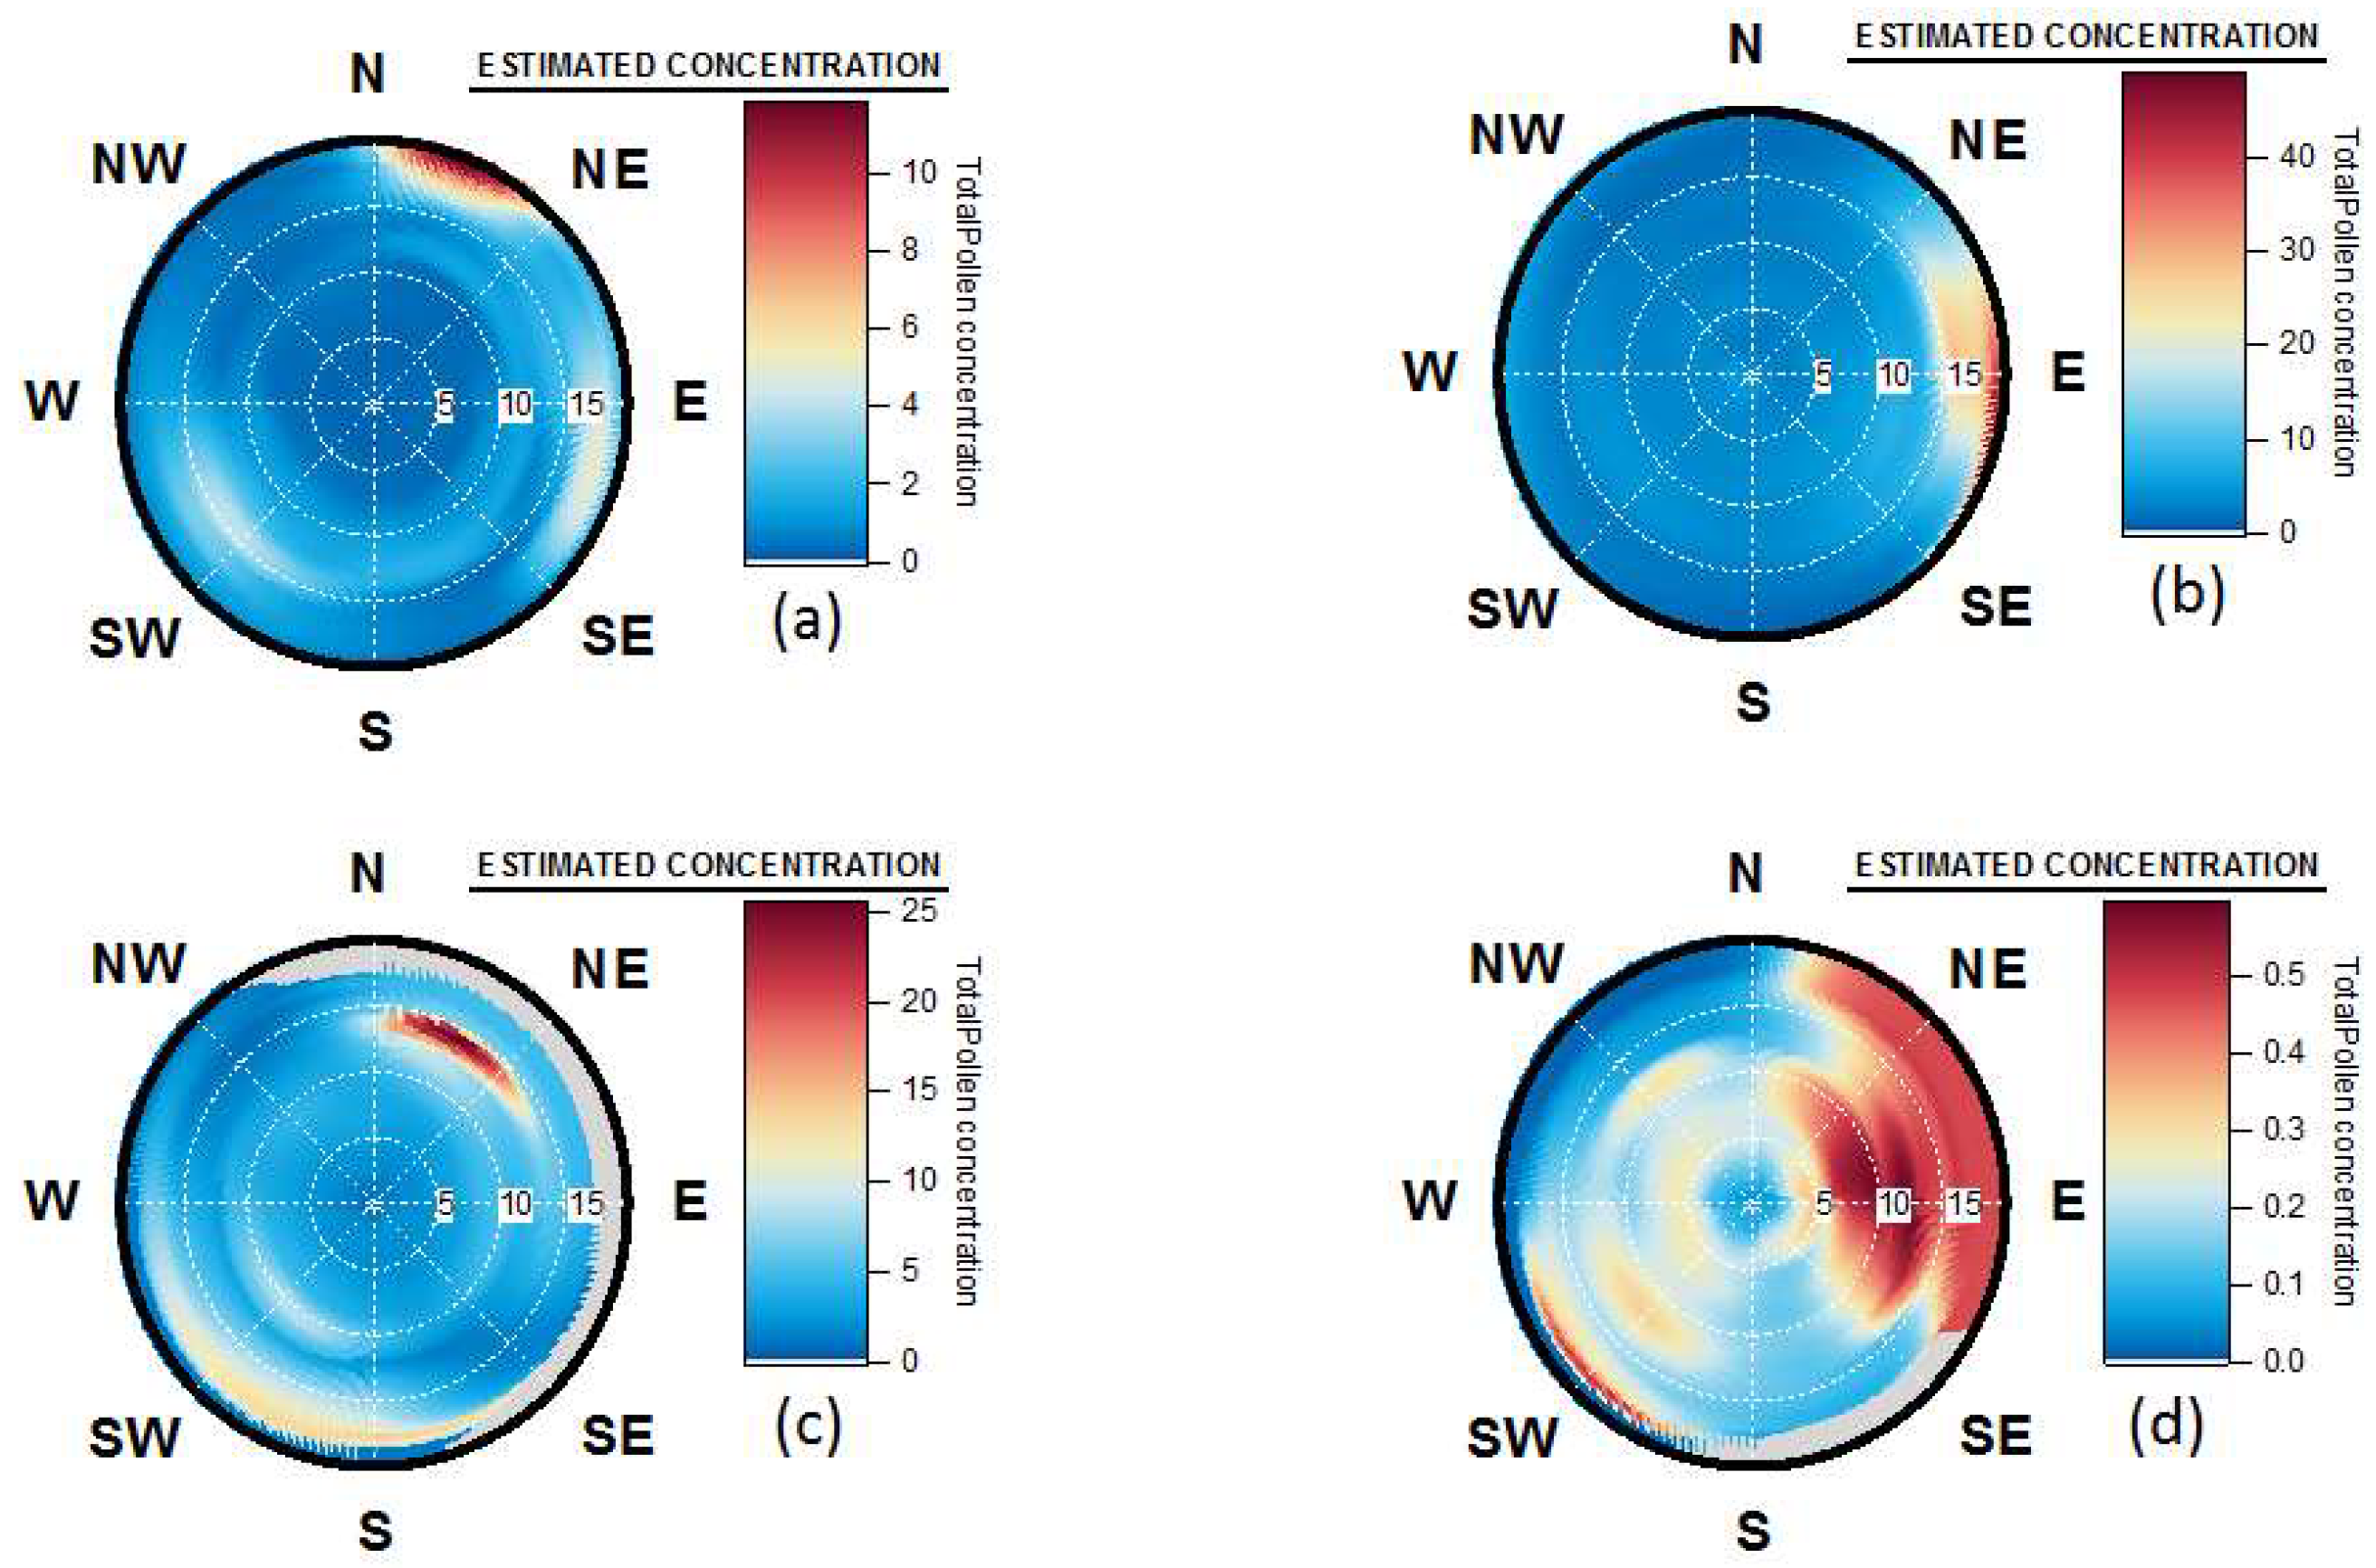
4.4. Origins and Point Sources of Pollen Grains

The calculation using ZeFir from this 4-year dataset led to an interesting discovery regarding the origin of total pollen grains concentrations. Indeed, the model designates a main origin from the northeast to East sector, which is not from that of the prevailing winds that are in the southwestern sector, as illustrated by Figure 12. Thus, contrasting patterns can be clearly seen when comparing Figure 11 and Figure 12. Highest concentrations at wind speeds higher than 15 km/h only suggest that the main pollen events may be advected over Saclay and the Ile-de-France region.
To better understand the origin of allergenic pollens, we tested the model for the different families to which the allergenic species belong. The results of the model indicated that for the Betulaceae family, Figure 13a, the main origin found is from an Easterly direction (60° to 120°) with a second origin from the North (20°) and were associated with strong winds between 15–20 km/h. Equally, for grass, Figure 13b, the main origin comes from the northeast sector (10° to 45°) but is associated with more moderate winds (10 to 15 km/h). For Cupressaceae and Taxaceae since these two families are not distinguishable in optical microscopy the model shows three origins (Figure 13c). The main one linked to Northerly directions (20°) and associated with very strong winds (more than 20 km/h), a second source from the South-East (90° to 110°), connected with moderate winds (less than 10 km/h) and a third in the southwestern sector, accompanied by moderate to strong winds (16 km/h). With regard to the Oleaceae family, the origin is clearly from the northwest to the southwest (Figure 13d)and associated with strong winds exceeding 20 km/h. Figure 13 indicates that the main sources of highly allergenic pollen grains (Betulaceae, Poaceae, Urticaceae), which account for 51% of total pollen concentrations, come from the North and East sectors, while Cupressaceae, Taxaceae and Oleaceae, which represent 14% of this total have several origins from southeast to southwest and northwest. For non-allergenic families (trees, grasses and flowers, which account for 34% of total pollen concentrations), Figure A2 in Appendix A, shows the predominant local/regional origin for such pollen. Knowledge of the geographical origins and variability of these different species is crucial information for a better understanding of potential pollen health impacts in densely populated urban areas like Paris. It also clearly supports the need for long-term speciation within the total pollen burden. As different species/families had significantly different wind directions and speeds associated with their sampling.
As a first conclusion, regarding the pollen origins and point sources, Figure 13 clearly shows that the origins and point sources for both the Betulaceae (Betula pollen is the main genus) and for Oleaceae (where Fraxinus is the main genus) are dictated by the wind speed and direction and fast changes in the wind sectors. Given that, both occur at the same time of the year this may not be surprising however, his results does show the importance of measuring the wind direction and the wind speed at the same site which pollen monitoring is performed. This is especially significant for forecasting applications as the aforementioned meteorological parameters cannot be achieved by back trajectories.

4.5. Wind Occurrence and Pollen Patterns

To further analyse, the relationship between pollen seasonality and the controlling meteorological factors influencing total pollen grains concentrations, the respective occurrences of winds directions at Saclay have been studied, based on hourly wind data from 2004 to 2018. Westerly winds had a larger number of occurrences than Easterly winds from 0° to 180° as illustrated by Figure. For the West sector (180° to 359°), results are presented in Appendix A, Figure A4, a maximum during summer (July and August) was noted with values ranging from 5149 to 7144 counts. Results for the East sector, more interestingly, highlight a far different trend, with a clear seasonality noted and exhibited by bi modal pattern visible (Figure 14), with maxima reported in March (4054 counts) and in October (3671 counts). We also observed that there is a decrease in May (3292 counts) followed by a small increase in the frequency (3389 counts) in June, comparable to levels in levels to February (3443 counts). Easterly winds show a decrease starting in July, reaching a minimum in August (2300 counts). The monthly mean wind direction shows similar variations, although the smoothing effect on the monthly means (in Appendix A, Table A2). No standard deviation can be applied on occurrence calculations.
Interestingly the Easterly wind occurrence pattern matches the seasonal pattern of total pollen grains concentrations from early spring to the end of the summer-during winter, since no significant source of pollen is known in the local atmosphere of Saclay, no significant relationship can be observed. This covariation between typical synoptic conditions and the pollen levels has been recently documented for Swedish cities by [19] where exceptionally high concentrations of Birch pollen were found to coincide with East North East winds and significant concentrations of pollutants. Also, [22] published work on the identification of the meteorological factors that influence the occurrence of airborne pollen concentrations.

4.6. Pollen Point Sources, Long Range Transport and Allergen Transfers during Pollution Events

All runs confirmed that the various pollen seasons are associated with specific anticyclonic weather conditions (East and North East). Our results show that the main allergenic pollen grains reaching Saclay: (i) are transported by winds of 12 to over 20 km/h; and (ii) primarily originate from the East and North East sectors. These factors imply the following:
(i) Relatively high wind speeds associated with Betulaceae, Urticaceae and Poaceae lead to two hypotheses that should be addressed. First, some taxa in Saclay may have been transported over long distances, as has been shown in other regions for specific pollen with respect to their aerodynamic properties (e.g., density, mass, granulometry). This factor remains to be characterized for our site. In particular, significant inputs from a remote area may occur before the local or regional pollen cycles have started. The different results obtained by season illustrated in Appendix A, Figure A3 show that the pollen can be transported over long distances, particularly during warmer temperatures and low relative humidity periods. This main result regarding long-range transport pollen is consistent with the work of [70,71,72]. Our study suggests that long-range transported pollen can affect pollen levels monitored at a receptor site under favourable synoptic conditions. Secondly, as pollen release from trees and plants is known to be both wind speed and relative humidity dependant [59], it requires consideration not only of potential remote areas of emission but also regional and local ones that complement the information provided by wind analysis.
(ii) In such atmospheric conditions, particulate matter pollution events regularly occur between December and April within the Paris region by [73,74] and reference therein. Inputs of pollen from the North East and East sectors might have to be considered together with inputs of long range transport of reactive gases and aerosols, which follow the same path in the same annual period, as previously reported, for Saclay [40]. The combination of atmospheric pollutants and allergenic pollen content is of great interest in understanding allergy in general and even asthmatic events coincident with thunderstorms during the pollen season [19,60,61]. Over their common atmospheric transport modes, pollen, gas and aerosols can possibly interact. In 2006, [17] published a study on the release mechanisms when grass pollen are submitted to high concentrations of gaseous pollutants and the presence of water. Both, [75,76] have showed that allergenic activity of pollen grains could be found in PM10 and below. Moreover, [77] showed that when birch trees are flowering and exposed to moisture followed by drying winds they can produce particulate aerosols from the nanometre to micrometre range, which contain the allergens. This last point is of importance as negligible amounts of particles above 10 micrometre (aerodynamic size) can penetrate deep into the lung all the way to the bronchi. In future studies it will be necessary to evaluate the transfer of allergenic cytoplasm components in small particles during pollution events and their transport by highly hydrated aerosols. This mechanism could possibly explain thunderstorm induced asthma episodes or the asthmatic bronchitis encountered in megacities or highly populated areas downwind atmospheric mixtures of both biological and anthropogenic pollution.

5. Conclusions

The daily observations made at Saclay over four years demonstrate that airborne pollen grains concentration exhibits a biannual cycle of total airborne pollen grains mainly driven by some species of the Betulaceae family. The general increasing trend in the annual sum of concentrations needs to be further examined given the limited observations expressed here and consequently compared with more established pollen monitoring sites such as those that have been located in Paris and operational for over 25 years (M. Thibaudon personal communication). During our observation period, strong variations in the interannual concentrations were observed. This interannuality seems to be closely linked to the total amount of rain water during the 6 months preceding the start of the pollen season. We noticed that the pollen season starts in early February under anticyclonic conditions (North and East wind regime) and ends in early September when the wind sectors were mostly coming from the Ocean (West regime). The first phase of the pollen season is due to tree pollen dispersions and the second phase to herbaceous species. The mean concentration during the nine month of pollen season was seen to be on average 200 Pollen/m3 of air and mainly dominated by allergenic species which represents 65% of the total pollen grains. The daily concentrations measured fluctuated in intensity from day-to-day and are probably in relation to weather instability. The cycles of hot days followed by rainfall possibly produced, plant stresses, fast growing which can produce huge amount of submicronic biological allergens. This effect is more visible for regional species and particularly grass species. The burst of pollen concentrations can increase by up to 300% compared with the mean concentration of the whole pollen season. To validate our observations and in comparison with the studies available in the literature, the Sustainable Wind Incidence Method was used to couple atmospheric concentrations and wind data. The model shows that the wind prevalence was from the South-West whereas the pollen was associated with the North to East sector with strong winds. The use of ZeFir tool validates our observation regarding the type and the nature of the air masses implicated in the atmospheric pollen loading. We have determined that the origin of pollen grains impacting the region of Saclay were wind direction dependant: higher levels of pollen are observed when the winds are coming from the East and North East sectors, suggesting long range transport for Betulaceae and regional sources for Poaceae. As the local wind is very much affected by mesoscale weather phenomena, inverse dispersion modelling supported by a mesoscale Numerical Weather Prediction (NWP), and/or a footprint calculation for the observation site looks would be interesting for comparison studies. We also identified potential point sources that need to be confirmed by on-site inventories. Additionally, these pollen episodes are often associated with pollution events, which could increase the allergenic character of smaller particles. This last aspect must be further investigated by intensive campaigns to identify in which class of particle size the allergenic material is transferred. In summary, this study has shown that by combining our statistical analysis method with meteorological analysis as well as aerobiological data and pollution measurements we should be able to predict a realistic risk index on a daily basis to reduce the exposure of susceptible individuals during the pollen season for the region of Paris.

Author Contributions

R.S.E. has pioneered bioaerosol research at CEA/LSCE, he has conceived and designed the experiments and has lead the writing of this paper. D.B. has participated to the conception and design of the experiments, she has analysed the data and contributed to the writing of this article. B.G. contributed to the interpretation of the dataset in correlation with pollution and health impact and writing of the paper. J.-E.P. has developed the ZeFir tool and contributed to the interpretation of the outputs of wind analysis. J.P.B., M.T., V.G. have contributed to the interpretation of the data and writing of the paper. J.S. and D.O. contribute to supervise the science on pollen research and writing of the paper.

Funding

This research was funded by CEA-NRBC-E grant number D34 and the APC was funded by PREVIPOL ANR project.

Acknowledgments

The authors want to thank all the team from the Réseau National de Surveillance Aérobiologique (RNSA) and particularly Nadine Dupuy, Gilles Oliver, Charlotte Sindt and Jennifer Charbonnier. We are grateful to Francois Truong from LSCE for his help during the experiments.

Conflicts of Interest

The authors declare no conflict of interest

Appendix A

Figure A1. Annual abundance of allergenic families and genus at Saclay from January 2015 to September 2018.
Remotesensing 10 01932 g0a1
Figure A2. Origin of total atmospheric pollen grains (a,b) Betulaceae, Poaceae, Urticaceae excluded using SWIM model from for January 2015 to September 2018. The white circles represent the wind speed scale in kilometre per hour (km/h). The colour grid represents the estimated concentration (Nb#/m3) for any wind speed and wind direction.
Remotesensing 10 01932 g0a2
Figure A3. Origin of total atmospheric pollen grains concentration by season (a) Winter (b) Spring (c) Summer (d) Autumn using SWIM model for January 2015 to September 2018. The white circles represent the wind speed scale in kilometre per hour (km/h). The colour grid represents the estimated concentration (Nb#/m3) for any wind speed and wind direction.
Remotesensing 10 01932 g0a3
Figure A4. Monthly Occurrence of wind sector coming from South (185°) to North (355°) for the period January 2004 to August 2018 and for temperature ranging from −5.9 °C to 34.6 °C.
Remotesensing 10 01932 g0a4
Figure A5. Daily variability of Betulaceae, Wind Direction and Relative Humidity in April 2016.
Remotesensing 10 01932 g0a5
Figure A6. Daily variability of Rain (sum in mm) from January 2014 to October 2018.
Remotesensing 10 01932 g0a6
Figure A7. Daily variability of Grass pollen, Rain, Temperature and Relative Humidity from end of May to mid of August 2016.
Remotesensing 10 01932 g0a7
Figure A8. Abundance of different families and species of allergenic pollen by year: (a) 2015, (b) 2016, (c) 2017, (d) 2018.
Remotesensing 10 01932 g0a8
Table A1. Values of monthly averages of pollen concentrations for each year from January 2015 to September 2018.
2015201620172018
MonthNb#/m3stdMaxNb#/m3stdMaxNb#/m3stdMaxNb#/m3stdMax
Jan.3.13.357.022.134.1361.01.62.513.054.459.7978.0
Feb.21.134.0359.0103.3199.42396.0133.6149.41426.067.193.1771.0
Mar.301.7390.95854.0158.9145.41975.0162.2141.71586.0191.3184.11952.0
Apri.400.9373.35012.0554.3459.08255.0217.5119.03306.01638.61755.523317.0
May240.0197.52359.0309.8350.13898.0189.0163.41632.0199.2148.91964.0
June384.5321.44634.0241.6297.12517.0269.4236.95116.0443.3252.15367.0
July238.6284.15137.0615.5826.010551.0120.378.91418.0202.6146.93689.0
Aug.123.9113.44252.0159.1117.33942.0197.3109.25408.055.836.21374.0
Sept.32.827.5648.026.745.0477.028.130.2438.028.426.2485.0
Oct.5.45.152.010.618.7227.08.75.477.0
Nov.4.76.650.02.63.730.02.82.016.0
Dec.7.110.2121.01.11.49.04.612.576.0
Table A2. Values of monthly averages wind direction (Degrees) and wind speed (m/s) for each year from January 2015 to September 2018.
2015201620172018
MonthWDWD_stdWSWS_stdWDWD_stdWSWS_stdWDWD_stdWSWS_stdWDWD_stdWSWS_std
Jan.234.563.11.81.5217.957.71.91.3230.499.60.31.0240.664.22.01.5
Feb.277.090.40.41.2239.677.01.41.4220.184.51.01.444.791.70.61.0
Mar.297.986.60.71.4312.885.60.41.2233.388.40.81.2195.383.70.71.1
April7.793.90.31.1243.787.70.51.1348.064.20.80.8209.987.00.81.1
May255.475.21.01.1304.191.00.31.0216.5102.00.10.9353.473.40.70.8
June323.678.80.61.0266.267.01.00.8253.784.10.81.113.763.80.90.8
July262.375.21.01.0271.160.91.00.9253.372.91.01.0330.476.70.50.8
Aug.217.5101.50.31.0269.874.00.80.9249.682.20.71.0271.178.10.91.0
Sept.292.093.30.11.1228.589.70.40.9237.765.41.21.2309.381.50.60.9
Oct.78.695.20.20.857.487.60.50.9235.867.71.21.1
Nov.228.956.81.91.3217.696.40.51.3251.163.31.31.3
Dec.201.933.32.10.9157.484.80.50.7244.250.91.91.5
Table A3. Values of monthly averages Temperature (°C) and Relative Humidity (RH%) for each year from January 2015 to September 2018.
2015201620172018
MonthTT_stdRHRH_stdTT_stdRHRH_stdTT_stdRHRH_stdTT_stdRHRH_std
Jan.3.93.791.68.54.93.689.58.81.23.886.812.57.32.590.78.0
Feb.3.42.886.913.75.43.684.913.76.63.683.110.71.73.279.618.0
Mar.7.53.475.417.86.32.877.515.810.23.675.616.66.64.179.714.2
April12.04.763.923.09.14.076.017.410.34.264.018.313.64.869.218.6
May13.33.875.117.613.94.176.521.415.75.576.117.815.65.168.419.7
June17.34.665.618.016.33.785.916.020.05.368.017.320.04.262.218.0
July20.65.363.018.919.34.671.418.120.14.667.717.822.84.258.017.7
Aug.20.24.965.021.419.44.768.319.419.04.372.818.420.45.057.217.3
Sept.14.03.077.118.116.23.375.318.514.53.582.014.216.42.859.27.8
Oct.10.73.385.914.510.73.082.614.913.73.684.812.6
Nov.10.24.689.910.27.43.285.512.67.73.386.511.0
Dec.8.82.988.59.74.43.287.514.45.03.392.47.1
Table A4. Values of monthly Rain (mm) for each year from January 2014 to September 2018.
20142015201620172018
Jan.52.436.452.224.0110.7
Feb.47.132.149.736.433.1
Mar.11.431.382.268.971.9
April49.656.451.016.946.6
May80.277.5153.753.469.1
June74.76.254.236.4103.6
July80.816.321.358.211.7
Aug.81.589.427.764.436.5
Sept.14.368.032.8110.50.0
Oct.55.741.930.429.524.6
Nov.53.651.870.447.7
Dec.50.024.221.9102.4
Total651.3531.5647.5648.7507.8

References

  1. Núñez, A.; Amo de Paz, G.; Rastrojo, A.; García Ruiz, A.M.; Alcamí, A.; Gutiérrez-Bustillo, A.M.; Moreno Gómez, D.A. Monitoring of airborne biological particles in outdoor atmosphere. Part 2: Metagenomics applied to urban environments. Int. Microbiol. 2016, 19, 69–80. [Google Scholar] [PubMed]
  2. Clot, B. Trends in airborne pollen: An overview of 21 years of data in Neuchâtel (Switzerland). Aerobiologia 2003, 19, 227–234. [Google Scholar] [CrossRef]
  3. D’Amato, G.; Cecchi, L.; D’Amato, M.; Liccardi, G. Urban air pollution and climate change as environmental risk factors of respiratory allergy: An update. J. Investig. Allergol. Clin. Immunol. 2010, 20, 95–102. [Google Scholar] [PubMed]
  4. García-Mozo, H. Poaceae pollen as the leading aeroallergen worldwide: A review. Allergy 2017, 72, 1849–1858. [Google Scholar] [CrossRef] [PubMed] [Green Version]
  5. Cecchi, L.; D’Amato, G.; Ayres, J.G.; Galan, C.; Forastiere, F.; Forsberg, B.; Gerritsen, J.; Nunes, C.; Behrendt, H.; Akdi, C.; et al. Projections of the effects of climate change on allergic asthma: The contribution of aerobiology. Allergy 2010, 65, 1073–1081. [Google Scholar] [CrossRef] [PubMed]
  6. D’Amato, G.; Cecchi, L.; Bonini, S.; Nunes, C.; Annesi-Maesano, I.; Behrendt, H.; Van Cauwenberge, P. Allergenic pollen and pollen allergy in Europe. Allergy 2007, 62, 976–990. [Google Scholar] [CrossRef] [PubMed] [Green Version]
  7. García-Mozo, H.; Oteros, J.A.; Galán, C. Impact of land cover changes and climate on the main airborne pollen types in Southern Spain. Sci. Total Environ. 2016, 548, 221–228. [Google Scholar] [CrossRef] [PubMed]
  8. Tormo-Molina, R.; Rodríguez, A.M.; Palaciso, I.S.; López, F.G. Pollen production in anemophilous trees. Grana 1996, 35, 38–46. [Google Scholar] [CrossRef] [Green Version]
  9. Vázquez, L.M.; Galán, C.; Domínguez-Vilches, E. Influence of meteorological parameters on olea pollen concentrations in Córdoba (South-western Spain). Int. J. Biometeorol. 2003, 48, 83–90. [Google Scholar] [CrossRef]
  10. Puc, M.; Bosiacka, B. Effects of meteorological factors and air pollution on urban pollen concentrations. Pol. J. Environ. Stud. 2011, 20, 611–618. [Google Scholar]
  11. Latałowa, M.; Miętus, M.; Uruska, A. Seasonal variations in the atmospheric Betula pollen count in Gdańsk (southern Baltic coast) in relation to meteorological parameters. Aerobiologia 2002, 18, 33–43. [Google Scholar] [CrossRef]
  12. Drake, J.E.; Tjoelker, M.G.; Vårhammar, A.; Medlyn, B.E.; Reich, P.B.; Leigh, A.; Pfautsc, S.; Blackman, C.J.; López, R.; et al. Trees tolerate an extreme heatwave via sustained transpirational cooling and increased leaf thermal tolerance. Glob. Chang. Boil. 2018, 24, 2390–2402. [Google Scholar] [CrossRef] [PubMed] [Green Version]
  13. Berggren, B.; Nilsson, S.; Boëthius, G. Diurnal variation of airborne birch pollen at some sites in Sweden. Grana 1995, 34, 251–259. [Google Scholar] [CrossRef]
  14. García-Mozo, H.; Galán, C.; Jato, V.; Belmonte, J.; de la Guardia, C.D.; Fernández, D.; Gutiérrez, M.; Aira, M.J.D.M.; Roure, J.M.; Ruiz, L.; et al. Quercus pollen season dynamics in the Iberian Peninsula: Response to meteorological parameters and possible consequences of climate change. Ann. Agric. Environ. Med. 2006, 13, 209. [Google Scholar] [PubMed]
  15. García-Mozo, H.; Yaezel, L.; Oteros, J.; Galán, C. Statistical approach to the analysis of olive long-term pollen season trends in southern Spain. Sci. Total Environ. 2014, 473, 103–109. [Google Scholar] [CrossRef] [PubMed]
  16. Grote, M.; Vrtala, S.; Niederberger, V.; Wiermann, R.; Valenta, R.; Reichelt, R. Release of allergen-bearing cytoplasm from hydrated pollen: A mechanism common to a variety of grass (Poaceae) species revealed by electron microscopy. J. Allergy Clin. Immunol. 2001, 108, 109–115. [Google Scholar] [CrossRef] [PubMed]
  17. Motta, A.C.; Marliere, M.; Peltre, G.; Sterenberg, P.A.; Lacroix, G. Traffic-related air pollutants induce the release of allergen-containing cytoplasmic granules from grass pollen. Int. Arch. Allergy Immunol. 2006, 139, 294–298. [Google Scholar] [CrossRef] [PubMed]
  18. Damialis, A.; Halley, J.M.; Gioulekas, D.; Vokou, D. Long-term trends in atmospheric pollen levels in the city of Thessaloniki, Greece. Atmos. Environ. 2007, 41, 7011–7021. [Google Scholar] [CrossRef]
  19. Grundström, M.; Dahl, Å.; Ou, T.; Chen, D.; Pleijel, H. The relationship between birch pollen, air pollution and weather types and their effect on antihistamine purchase in two Swedish cities. Aerobiologia 2017, 33, 457–471. [Google Scholar] [CrossRef] [PubMed]
  20. Kruczek, A.; Puc, M.; Wolski, T. Airborne pollen from allergenic herbaceous plants in urban and rural areas of Western Pomerania, NW Poland. Grana 2017, 56, 71–80. [Google Scholar] [CrossRef]
  21. Borycka, K.; Kasprzyk, I. Hourly pattern of allergenic alder and birch pollen concentrations in the air: Spatial differentiation and the effect of meteorological conditions. Atmos. Environ. 2018, 182, 179–192. [Google Scholar] [CrossRef]
  22. Kubik-Komar, A.; Piotrowska-Weryszko, K.; Weryszko-Chmielewska, E.; Kaszewski, B.M. Analysis of Fraxinus pollen seasons and forecast models based on meteorological factors. Ann. Agric. Environ. Med. 2018, 25, 285–291. [Google Scholar] [CrossRef] [PubMed] [Green Version]
  23. Wozniak, M.C.; Solmon, F.; Steiner, A.L. Pollen rupture and its impact on precipitation in clean continental conditions. Geophys. Res. Lett. 2018, 45, 7156–7164. [Google Scholar] [CrossRef]
  24. Sofiev, M. On impact of transport conditions on variability of the seasonal pollen index. Aerobiologia 2017, 33, 167–179. [Google Scholar] [CrossRef] [PubMed]
  25. Rojo, J.; Rapp, A.; Lara, B.; Fernández-González, F.; Pérez-Badia, R. Effect of land uses and wind direction on the contribution of local sources to airborne pollen. Sci. Total Environ. 2015, 538, 672–682. [Google Scholar] [CrossRef] [PubMed]
  26. Tseng, Y.T.; Kawashima, S.; Kobayashi, S.; Takeuchi, S.; Nakamura, K. Algorithm for forecasting the total amount of airborne birch pollen from meteorological conditions of previous years. Agric. For. Meteorol. 2018, 249, 35–43. [Google Scholar] [CrossRef]
  27. Mesa, J.A.S.; Smith, M.; Emberlin, J.; Allitt, U.; Caulton, E.; Galan, C. Characteristics of grass pollen seasons in areas of southern Spain and the United Kingdom. Aerobiologia 2003, 19, 243–250. [Google Scholar] [CrossRef]
  28. Rodríguez-Rajo, F.J.; Fdez-Sevilla, D.; Stach, A.; Jato, V. Assessment between pollen seasons in areas with different urbanization level related to local vegetation sources and differences in allergen exposure. Aerobiologia 2010, 26, 1–14. [Google Scholar] [CrossRef]
  29. Aguilera, F.; Dhiab, A.B.; Msallem, M.; Orlandi, F.; Bonofiglio, T.; Ruiz-Valenzuela, L.; Galan, C.; Diaz-de la Guardia, C.; Gianelli, A.; et al. Airborne-pollen maps for olive-growing areas throughout the Mediterranean region: Spatio-temporal interpretation. Aerobiologia 2015, 31, 421–434. [Google Scholar] [CrossRef]
  30. Voukantsis, D.; Niska, H.; Karatzas, K.; Riga, M.; Damialis, A.; Vokou, D. Forecasting daily pollen concentrations using data-driven modeling methods in Thessaloniki, Greece. Atmos. Environ. 2010, 44, 5101–5111. [Google Scholar] [CrossRef]
  31. Fernández-Rodríguez, S.; Skjøth, C.A.; Tormo-Molina, R.; Brandao, R.; Caeiro, E.; Silva-Palacios, I. Identification of potential sources of airborne Olea pollen in the Southwest Iberian Peninsula. Int. J. Biometeorol. 2014, 58, 337–348. [Google Scholar] [CrossRef] [PubMed]
  32. Sofiev, M.; Siljamo, P.; Ranta, H.; Linkosalo, T.; Jaeger, S.; Rasmussen, A.; Rantio-Lehtimaki, A.; Severova, E.; Kukkonen, J. A numerical model of birch pollen emission and dispersion in the atmosphere. Description of the emission module. Int. J. Biometeorol. 2013, 57, 45–58. [Google Scholar] [CrossRef] [PubMed]
  33. Hernández-Ceballos, M.A.; Skjøth, C.A.; García-Mozo, H.; Bolívar, J.P.; Galán, C. Improvement in the accuracy of back trajectories using WRF to identify pollen sources in southern Iberian Peninsula. Int. J. Biometeorol. 2014, 58, 2031–2043. [Google Scholar] [CrossRef] [PubMed] [Green Version]
  34. Oteros, J.; García-Mozo, H.; Alcázar, P.; Belmonte, J.; Bermejo, D.; Boi, M. A new method for determining the sources of airborne particles. J. Environ. Manag. 2015, 155, 212–218. [Google Scholar] [CrossRef] [PubMed]
  35. Oteros, J.; Valencia, R.M.; Del Río, S.; Vega, A.M.; García-Mozo, H.; Galán, C.; Gutiérrez, P.; Mandrioli, P.; Fernandez-Gonzalez, D. Concentric Ring Method for generating pollen maps. Quercus as case study. Sci. Total Environ. 2017, 576, 637–645. [Google Scholar] [CrossRef] [PubMed] [Green Version]
  36. Rojo, J.; Orlandi, F.; Pérez-Badia, R.; Aguilera, F.; Dhiab, A.B.; Bouziane, H.; Diaz-de la Guardia, C.; Galan, C.; Gutiérrez-Bustillo, A.M.; Moreno-Grau, S.; et al. Modeling olive pollen intensity in the Mediterranean region through analysis of emission sources. Sci. Total Environ. 2016, 551, 73–82. [Google Scholar] [CrossRef]
  37. Haworth, J.; Cheng, T. Non-parametric regression for space–time forecasting under missing data. Comput. Environ. Urban Syst. 2012, 36, 538–550. [Google Scholar] [CrossRef]
  38. Donnelly, A.; Misstear, B.; Broderick, B. Real time air quality forecasting using integrated parametric and non-parametric regression techniques. Atmos. Environ. 2015, 103, 53–65. [Google Scholar] [CrossRef] [Green Version]
  39. Petit, J.E.; Favez, O.; Albinet, A.; Canonaco, F. A user-friendly tool for comprehensive evaluation of the geographical origins of atmospheric pollution: Wind and trajectory analyses. Environ. Model. Softw. 2017, 88, 183–187. [Google Scholar] [CrossRef]
  40. Petit, J.E.; Favez, O.; Sciare, J.; Crenn, V.; Sarda-Estève, R.; Bonnaire, N.; Mocnik, G.; Dupont, J.C.; Haeffelin, M.; Leoz-Garziandia, E. Two years of near real-time chemical composition of submicron aerosols in the region of Paris using an Aerosol Chemical Speciation Monitor (ACSM) and a multi-wavelength Aethalometer. Atmos. Chem. Phys. 2015, 15, 2985–3005. [Google Scholar] [CrossRef]
  41. Mason, R.H.; Si, M.; Chou, C.; Irish, V.E.; Dickie, R.; Elizondo, P.; Wong, R.; Brintnell, M.; Elsasser, M.; Lassar, M.; et al. Size-resolved measurements of ice-nucleating particles at six locations in North America and one in Europe. Atmos. Chem. Phys. 2016, 16, 1637–1651. [Google Scholar] [CrossRef]
  42. Hirst, J. An automatic volumetric spore trap. Ann. Appl. Boil. 1952, 39, 257–265. [Google Scholar] [CrossRef]
  43. Jager, S.; Mandroli, P.; Spieksma, F.; Emberlin, J.; Hjelmroos, M.; Rantio-Lehtimaki, A. News. Aerobiologia 1995, 11, 69–70. [Google Scholar]
  44. Volumetric Pollen and Particle Sampler, VPPS 2000, User’s Manual. 1980, pp. 1–19. Available online: https://www.lanzoni.it/campionatore-pollini (accessed on 30 November 2018).
  45. Galán, C.; Smith, M.; Thibaudon, M.; Frenguelli, G.; Oteros, J.; Gehrig, R.; Berger, U.; Clot, B.; Brandao, R. Pollen monitoring: Minimum requirements and reproducibility of analysis. Aerobiologia 2014, 30, 385–395. [Google Scholar]
  46. Caulton, E.; Lacey, M. Airborne Pollens and Spores: A Guide to Trapping and Counting; British Aerobiology Federation: Harpenden, UK, 1995; ISBN 0-9525617-0-0. [Google Scholar]
  47. Rogers, C.; Muilenberg, M. Comprehensive Guidelines for the Operation of Hirst-Type Suction Bioaerosol Samplers. Pan-American Aerobiology Association, Standardized Protocols. 2001. Available online: http://www.paaa.org/ (accessed on 30 November 2018).
  48. Henry, R.; Norris, G.A.; Vedantham, R.; Turner, J.R. Source region identification using kernel smoothing. Environ. Sci. Technol. 2009, 43, 4090–4097. [Google Scholar] [CrossRef] [PubMed]
  49. Olson, D.A.; Vedantham, R.; Norris, G.A.; Brown, S.G.; Roberts, P. Determining source impacts near roadways using wind regression and organic source markers. Atmos. Environ. 2012, 47, 261–268. [Google Scholar] [CrossRef]
  50. Yamartino, R.J. A comparison of several “single-pass” estimators of the standard deviation of wind direction. J. Clim. Appl. Meteorol. 1984, 23, 1362–1366. [Google Scholar] [CrossRef]
  51. Weryszko-Chmielewska, E.; Piotrowska, K. Airborne pollen calendar of Lublin, Poland. Ann. Agric. Environ. Med. 2004, 11, 91–97. [Google Scholar] [PubMed]
  52. Recio, M.; Picornell, A.; Trigo, M.M.; Gharbi, D.; García-Sánchez, J.; Cabezudo, B. Intensity and temporality of airborne Quercus pollen in the southwest Mediterranean area: Correlation with meteorological and phenoclimatic variables, trends and possible adaptation to climate change. Agric. For. Meteorol. 2018, 250, 308–318. [Google Scholar] [CrossRef]
  53. Spieksma, F.T.M.; Emberlin, J.C.; Hjelmroos, M.; Jäger, S.; Leuschner, R.M. Atmospheric birch (Betula) pollen in Europe: Trends and fluctuations in annual quantities and the starting dates of the seasons. Grana 1995, 34, 51–57. [Google Scholar] [CrossRef]
  54. García-Mozo, H.; Mestre, A.; Galán, C. Phenological trends in southern Spain: A response to climate change. Agric. For. Meteorol. 2010, 150, 575–580. [Google Scholar] [CrossRef]
  55. de la Cruz, D.R.; Sánchez-Reyes, E.; Sánchez-Sánchez, J. A contribution to the knowledge of Cupressaceae airborne pollen in the middle west of Spain. Aerobiologia 2015, 31, 435–444. [Google Scholar] [CrossRef]
  56. Hoebeke, L.; Bruffaerts, N.; Verstraeten, C.; Delcloo, A.; De Smedt, T.; Packeu, A.; Detandt, M.; Hendrickx, M. Thirty-four years of pollen monitoring: An evaluation of the temporal variation of pollen seasons in Belgium. Aerobiologia 2018, 34, 139–155. [Google Scholar] [CrossRef]
  57. Jato, V.; Rodríguez-Rajo, F.J.; Alcázar, P.; De Nuntiis, P.; Galán, C.; Mandrioli, P. May the definition of pollen season influence aerobiological results? Aerobiologia 2006, 22, 13. [Google Scholar] [CrossRef]
  58. Alexandre, F. Géographie et écologie végétale. Pour une nouvelle convergence. Ph.D. Thesis, Université Paris 7-Diderot, Paris, France, 2008. [Google Scholar]
  59. Jones, A.M.; Harrison, R.M. The effects of meteorological factors on atmospheric bioaerosol concentrations—A review. Sci. Total Environ. 2004, 326, 151–180. [Google Scholar] [CrossRef] [PubMed]
  60. D’Amato, G.; Annesi-Maesano, I.; Cecchi, L.; D’Amato, M. Latest News on relationship between thunderstorms and respiratory allergy, severe asthma, and deaths for asthma. Allergy 2018. [Google Scholar] [CrossRef] [PubMed]
  61. Davies, J.M.; Thien, F.; Hew, M. Thunderstorm asthma: Controlling (deadly) grass pollen allergy. BMJ 2018, 360, 432. [Google Scholar] [CrossRef]
  62. İnceoğlu, Ö.; Pinar, N.M.; Şakiyan, N.; Sorkun, K. Airborne pollen concentration in Ankara, Turkey 1990–1993. Grana 1994, 33, 158–161. [Google Scholar] [CrossRef] [Green Version]
  63. Emberlin, J.; Detandt, M.; Gehrig, R.; Jaeger, S.; Nolard, N.; Rantio-Lehtimäki, A. Responses in the start of Betula (birch) pollen seasons to recent changes in spring temperatures across Europe. Int. J. Biometeorol. 2002, 46, 159–170. [Google Scholar]
  64. Stach, A.; Emberlin, J.; Smith, M.; Adams-Groom, B.; Myszkowska, D. Factors that determine the severity of Betula spp. pollen seasons in Poland (Poznań and Krakow) and the United Kingdom (Worcester and London). Int. J. Biometeorol. 2008, 52, 311–321. [Google Scholar] [CrossRef]
  65. Galán, C.; Alcázar, P.; Oteros, J.; García-Mozo, H.; Aira, M.J.; Belmonte, J.; Diaz de la Guardia, C.; Fernández-González, D.; Gutierrez-Bustillo, M.; Moreno-Grau, S.; et al. Airborne pollen trends in the Iberian Peninsula. Sci. Total Environ. 2016, 550, 53–59. [Google Scholar] [CrossRef] [PubMed]
  66. Ritenberga, O.; Sofiev, M.; Siljamo, P.; Saarto, A.; Dahl, A.; Ekebom, A.; Sauliene, I.; Shalaboda, V.; Severova, E.; Hoebeke, L.; et al. A statistical model for predicting the inter-annual variability of birch pollen abundance in Northern and North-Eastern Europe. Sci. Total Environ. 2018, 615, 228–239. [Google Scholar] [CrossRef] [PubMed]
  67. Laaidi, K. Predicting days of high allergenic risk during Betula pollination using weather types. Int. J. Biometeorol. 2001, 45, 124–132. [Google Scholar] [CrossRef] [PubMed]
  68. D’Odorico, P.; Yoo, J.C.; Jaeger, S. Changing seasons: An effect of the North Atlantic Oscillation? J. Clim. 2002, 15, 435–445. [Google Scholar] [CrossRef]
  69. Dowding, P. Wind pollination mechanisms and aerobiology. Int. Rev. Cytol. 1987, 107, 421–437. [Google Scholar]
  70. Hjelmroos, M. Evidence of long-distance transport of Betula pollen. Grana 1991, 30, 215–228. [Google Scholar] [CrossRef]
  71. Cecchi, L.; Torrigiani Malaspina, T.T.; Albertini, R.; Zanca, M.; Ridolo, E.; Usberti, I.; Morabito, M.; Dall’ Aglio, P.; Orlandini, S. The contribution of long-distance transport to the presence of Ambrosia pollen in central northern Italy. Aerobiologia 2007, 23, 145–151. [Google Scholar] [CrossRef]
  72. Belmonte, J.; Alarcón, M.; Avila, A.; Scialabba, E.; Pino, D. Long-range transport of beech (Fagus sylvatica L.) pollen to Catalonia (north-eastern Spain). Int. J. Biometeorol. 2008, 52, 675–687. [Google Scholar] [CrossRef] [PubMed]
  73. Bessagnet, B.; Hodzic, A.; Blanchard, O.; Lattuati, M.; Le Bihan, O.; Marfaing, H.; Rouil, L. Origin of particulate matter pollution episodes in wintertime over the Paris Basin. Atmos. Environ. 2005, 39, 6159–6174. [Google Scholar] [CrossRef]
  74. Baudic, A.; Gros, V.; Sauvage, S.; Locoge, N.; Sanchez, O.; Sarda-Estève, R.; Kalogridis, C.; Petit, J.E.; Bonnaire, N.; Baisnée, D.; et al. Seasonal variability and source apportionment of volatile organic compounds (VOCs) in the Paris megacity (France). Atmos. Chem. Phys. 2016, 16, 11961–11989. [Google Scholar] [CrossRef]
  75. Agarwal, M.K.; Swanson, M.C.; Reed, C.E.; Yunginger, J.W. Airborne ragweed allergens: Association with various particle sizes and short ragweed plant parts. J. Allergy Clin. Immunol. 1984, 74, 687–693. [Google Scholar] [CrossRef]
  76. Spieksma, F.T.M.; Kramps, J.A.; Van der Linden, A.C.; Nikkels, B.H.; Plomp, A.; Koerten, H.K.; Dijkman, J.H. Evidence of grass-pollen allergenic activity in the smaller micronic atmospheric aerosol fraction. Clin. Exp. Allergy 1990, 20, 273–280. [Google Scholar] [CrossRef] [PubMed]
  77. Taylor, P.E.; Flagan, R.C.; Miguel, A.G.; Valenta, R.; Glovsky, M.M. Birch pollen rupture and the release of aerosols of respirable allergens. Clin. Exp. Allergy 2004, 34, 1591–1596. [Google Scholar] [CrossRef] [PubMed]
Figure 1. Localization of the monitoring station (ACTRIS EU observatory) at Saclay, France.
Remotesensing 10 01932 g001
Figure 2. Analytical procedure of pollen grains collection and counting.
Remotesensing 10 01932 g002
Figure 3. Annual Pollen Sum (APS or APIn) from January 2015 to September 2018.
Remotesensing 10 01932 g003
Figure 4. Monthly means of total pollen grains concentration from 1 January 2015 to 30 September 2018.
Remotesensing 10 01932 g004
Figure 5. Daily variability of total pollen concentrations from 1 January 2015 to 30 September 2018.
Remotesensing 10 01932 g005
Figure 6. Abundance of different families and species of allergenic pollen from 1 January 2015 to 30 September 2018.
Remotesensing 10 01932 g006
Figure 7. Variability of the daily concentration the 9 selected allergenic pollen in the period 1 January 2015–30 September 2018.
Remotesensing 10 01932 g007
Figure 8. (a) Rain amount for the IP period (curve) of the year preceding the APS (bars) from 2015 to 2018; (b) Linear regression between total rain amounts for the IP period of the preceding year and the APS for the years 2015, 2016, 2017 and 2018.
Remotesensing 10 01932 g008
Figure 9. Monthly averages of total pollen grains concentrations, temperature and relative humidity for each year from 2015 to 2018.
Remotesensing 10 01932 g009
Figure 10. Monthly averages of temperature (curve) and precipitation (bars) from 2015 to 2018.
Remotesensing 10 01932 g010
Figure 11. Joint probability polar plot, equivalent to a wind rose from January 2015 to September 2018. The white circles represent a wind speed scale in kilometre per hour (km/h). The colour grid represents the estimated concentration (Nb#/m3) for any wind speed and wind direction.
Remotesensing 10 01932 g011
Figure 12. Origin of total atmospheric pollen grains using SWIM model Origin. The white circles represent the wind speed scale in kilometre per hour (km/h). The colour grid represents the estimated concentration (Nb#/m3) for any wind speed and wind direction.
Remotesensing 10 01932 g012
Figure 13. Origin of pollen grains for (a) Betulaceae (Alnus, Betula, Corylus, Carpinus, Ostrya), (b) Poaceae and Urticaceae families, (c) Cupressaceae and Taxaceae families (d) Oleaceae family using SWIM model. The white circles represent the wind speed scale in kilometre per hour (km/h). The colour grid represents the estimated concentration (Nb#/m3) for any wind speed and wind direction.
Remotesensing 10 01932 g013
Figure 14. Monthly Occurrence of East winds for the period January 2004 to August 2018 (Temperature range: −5.9/34.6 °C, Sectors from 0° to 180°).
Remotesensing 10 01932 g014
Table 1. Tree and shrub species with the strongest allergenic potential.
SpeciesFamilies
AlnusBetulaceae
BetulaBetulaceae
CarpinusBetulaceae
CorylusBetulaceae
JuniperusCupressaceae
CupressusCupressaceae
FraxinusOleaceae
Table 2. Table of the two families of spontaneous herbs with the strongest allergenic potential.
SpeciesFamilies
AllPoaceae
ParietariaUrticaceae
Table 3. Relationship between total rainfall amounts and the Annual Pollen Sum.
Integrated Period (IP)Total Rain (mm)APS (2015 to 2018) (Nb#/m3)
August 2014 to January 2015291.554,931
August 2015 to January 2016327.568,958
August 2016 to January 2017207.240,861
August 2017 to January 2018465.286,989

