Prediction of Drought on Pentad Scale Using Remote Sensing Data and MJO Index through Random Forest over East Asia


1
School of Urban and Environmental Engineering, Ulsan National Institute of Science and Technology (UNIST), Ulsan 44919, Korea
2
Satellite Application Division, Korea Aerospace Institute (KARI), Daejeon 34133, Korea
*
Author to whom correspondence should be addressed.
Remote Sens. 2018, 10(11), 1811; https://doi.org/10.3390/rs10111811
Submission received: 31 August 2018
/
Revised: 4 November 2018
/
Accepted: 13 November 2018
/
Published: 15 November 2018
(This article belongs to the Special Issue Remote Sensing of Drought Monitoring)
Abstract
:Rapidly developing droughts, including flash droughts, have frequently occurred throughout East Asia in recent years, causing significant damage to agricultural ecosystems. Although many drought monitoring and warning systems have been developed in recent decades, the short-term prediction of droughts (within 10 days) is still challenging. This study has developed drought prediction models for a short-period of time (one pentad) using remote-sensing data and climate variability indices over East Asia (20°–50°N, 90°–150°E) through random forest machine learning. Satellite-based drought indices were calculated using the European Space Agency (ESA) Climate Change Initiative (CCI) soil moisture, Tropical Rainfall Measuring Mission (TRMM) precipitation, Moderate Resolution Imaging Spectroradiometer (MODIS) land surface temperature (LST), and normalized difference vegetation index (NDVI). The real-time multivariate (RMM) Madden–Julian oscillation (MJO) indices were used because the MJO is a short timescale climate variability and has important implications for droughts in East Asia. The validation results show that those drought prediction models with the MJO variables (r ~ 0.7 on average) outperformed the original models without the MJO variables (r ~ 0.4 on average). The predicted drought index maps showed similar spatial distribution to actual drought index maps. In particular, the MJO-based models captured sudden changes in drought conditions well, from normal/wet to dry or dry to normal/wet. Since the developed models can produce drought prediction maps at high resolution (5 km) for a very short timescale (one pentad), they are expected to provide decision makers with more accurate information on rapidly changing drought conditions.
1. Introduction
Drought is one of the most complex disasters because it is difficult to identify the start and end points of drought, unlike other disasters such as typhoons, landslides, or floods [1,2]. Drought associates a meteorological process with agricultural and hydrological processes [3]. Meteorological drought occurs due to a deficit of precipitation, which brings about a shortage of available soil water for plant growth [4,5,6]. Agricultural drought is caused by the shortage of soil water, which results in significant damage to agricultural ecosystems (e.g., crop yield) [7,8,9]. Hydrological drought refers to groundwater depletion and the lack of surface water, which affects water resources for allocation [10]. Numerous drought indices have been developed using ground station, numerical model, and remote-sensing data. The standardized precipitation index (SPI; [11]) is a meteorological drought index calculated using station rainfall data on a range of timescales (1 to 36 months). However, its agricultural use is limited because SPI only depends on rainfall data. Many satellite-based drought indices have been proposed. The vegetation condition index (VCI; [12]) was developed through modification of the normalized difference vegetation index (NDVI) by normalizing NDVI after considering the potential maximum and minimum of an ecosystem. Since a single index cannot fully explain the complexity of drought, many blended drought indices have been developed [13]. The vegetation health index (VHI; [14]) and soil wetness deficit index (SWDI; [15]) were developed using NDVI and land surface temperature (LST). The scaled drought condition index (SDCI; [16]) is obtained from LST, NDVI, and Tropical Rainfall Measuring Mission (TRMM) precipitation. SDCI detects meteorological and agricultural droughts well in both humid and arid regions when compared to U.S. Drought Monitor (USDM) data. The microwave integrated drought index (MIDI; [17]), which is a short-term drought index, combines LST, NDVI, and soil moisture. When compared to 1- and 3-month SPIs, MIDI monitors metrological drought well. Many drought-monitoring systems, including the U.S. Drought Monitor (USDM; [18]), European Drought Observatory (EDO; http://edo.jrc.ec.europa.eu/), and vegetation drought response index (VegDRI; [19,20]) have been widely operated to monitor drought. Although such drought monitoring systems provide more accurate information on various drought types, they are computationally demanding because they require many climate models, in situ observations, and remote-sensing data. While drought monitoring is relatively well advanced in many countries, short- to long-term predictions of drought are still difficult due to its inherent complexity. Timely prediction of drought provides valuable information to decision makers, which can help mitigate drought.
For these reasons, drought prediction is of increasing interest, and various studies on drought prediction have been conducted. Several stochastic models have been developed for the prediction of meteorological and agricultural droughts based on (1) empirical methodology such as multiple linear regression [21,22], (2) the autoregressive moving-average (ARMA)/autoregressive integrated moving average (ARIMA) models [23,24], (3) the ensemble streamflow prediction (ESP) method [25,26,27], and (4) machine learning [28,29,30]. These models can predict gradually intensifying drought well. However, it is hard for them to predict rapidly changing drought conditions, such as wet to dry and dry to wet, due to the delayed signal. This is because the variables tend to respond slowly to sudden changes in drought conditions [31,32]. Therefore, it is necessary to understand the regional meteorological or climate factors, as well as historical patterns, in order to improve the prediction models.
There are many climate factors that affect the occurrence of drought. The East Asian monsoon, which is closely related to drought in East Asia, is prominently affected by climate variations. The dynamical connection between East Asia and the El Niño-Southern Oscillation (ENSO) was identified by Wang et al. [33]. The East Asian monsoon is also affected by variations in the sea surface temperature (SST) in the Indian Ocean as well as the tropical Pacific Ocean [34]. In this regard, there have been many attempts to use climate variability to forecast regional precipitation and specifically, the East Asian monsoon. For example, Wu et al. [35] developed a statistical model for predicting the East Asian summer monsoon using ENSO and the North Atlantic Oscillation (NAO). From these potential relationships on an interannual timescale, climate indices, such as ENSO, Arctic Oscillation (AO), and NAO have been used for drought forecasting in previous studies [36,37,38].
Although many systems have been developed in recent decades to predict meteorological and agricultural droughts, the short-term prediction of drought (within 10 days) is still challenging. The historical pattern of short-term drought prediction is less valid than long-term drought prediction because the drought factors respond slowly to sudden changes in drought conditions and have a delayed signal [31,32]. The causative factors for the short-term prediction of drought are also more complex than those for the long-term prediction of drought, and it is difficult to understand the process. While drought predictions for long periods of time are mainly based on the lack of precipitation, drought predictions for short periods of time are based on other factors, including temperature and evapotranspiration, rather than precipitation. Some droughts, such as flash droughts caused by a rapid rate of intensification, have increased in recent years, and this has resulted in damage to agricultural systems [39] such as the economic losses reported in the billions of US$ from the 2010/11 flash drought in the U.S. [40]. Therefore, early warnings for the agricultural community through the short-term prediction of drought is necessary to mitigate the related losses [41].
The short-term prediction of drought can be affected by atmospheric variability on an intra-seasonal timescale. One of the major atmospheric variabilities is the Madden–Julian oscillation (MJO: [42]), which leads to changes in the teleconnection pattern that affects extratropical circulation over East Asia during the boreal winter season [43]. The anomalous teleconnection pattern associated with MJO also leads to anomalous precipitation which subsequently affects hydrological land surface conditions [44]. Additionally, Peng et al. [45] explored the relationship between MJO and land surface soil moisture across the world, especially over monsoon regions, where the change in the atmospheric teleconnection pattern was identified using satellite-based soil moisture and precipitation data. The soil moisture changes during the MJO phases could be useful information in predicting drought events in short periods of time, since the variable is persistent for a few days.
This study aims to develop a drought prediction model for short periods of time (one pentad) using random forest machine learning focusing on agricultural drought. The proposed drought prediction model considers the real-time multivariate (RMM) MJO indices. The MJO indices, showing short timescale climate variability, has important implications for drought in East Asia [44,46,47]. Random forest (RF) machine learning was adopted to develop drought prediction models because RF has been used for many remote-sensing applications and has shown better performance than other machine learning approaches in drought-related studies, such as decision trees or boosted regression trees [13,48,49]. Three satellite-based drought indices, the SDCI, MIDI, and very short-term drought index (VSDI) were used because satellite-based drought indices are able to detect sudden changes at relatively high spatial resolution and increase the identification of flash droughts [41,50,51,52,53]. In addition, satellite images have shown good performance in drought monitoring [4,7,13,16,19,21,50]. As discussed above, SDCI and MIDI monitored drought well when compared to reference data such as USDM and SPI. It is, thus, expected that satellite images and the derived indices will be useful in the short-term prediction of drought. The objectives of this study were to (1) suggest a modified drought index, VSDI, which combines surface soil moisture, LST, and NDVI; (2) develop drought prediction models based on drought indices using random forest; (3) validate the drought prediction models; and (4) compare the spatial distributions of drought evolution from reference and predicted drought indices.
2. Study Area and Data
2.1. Study Area
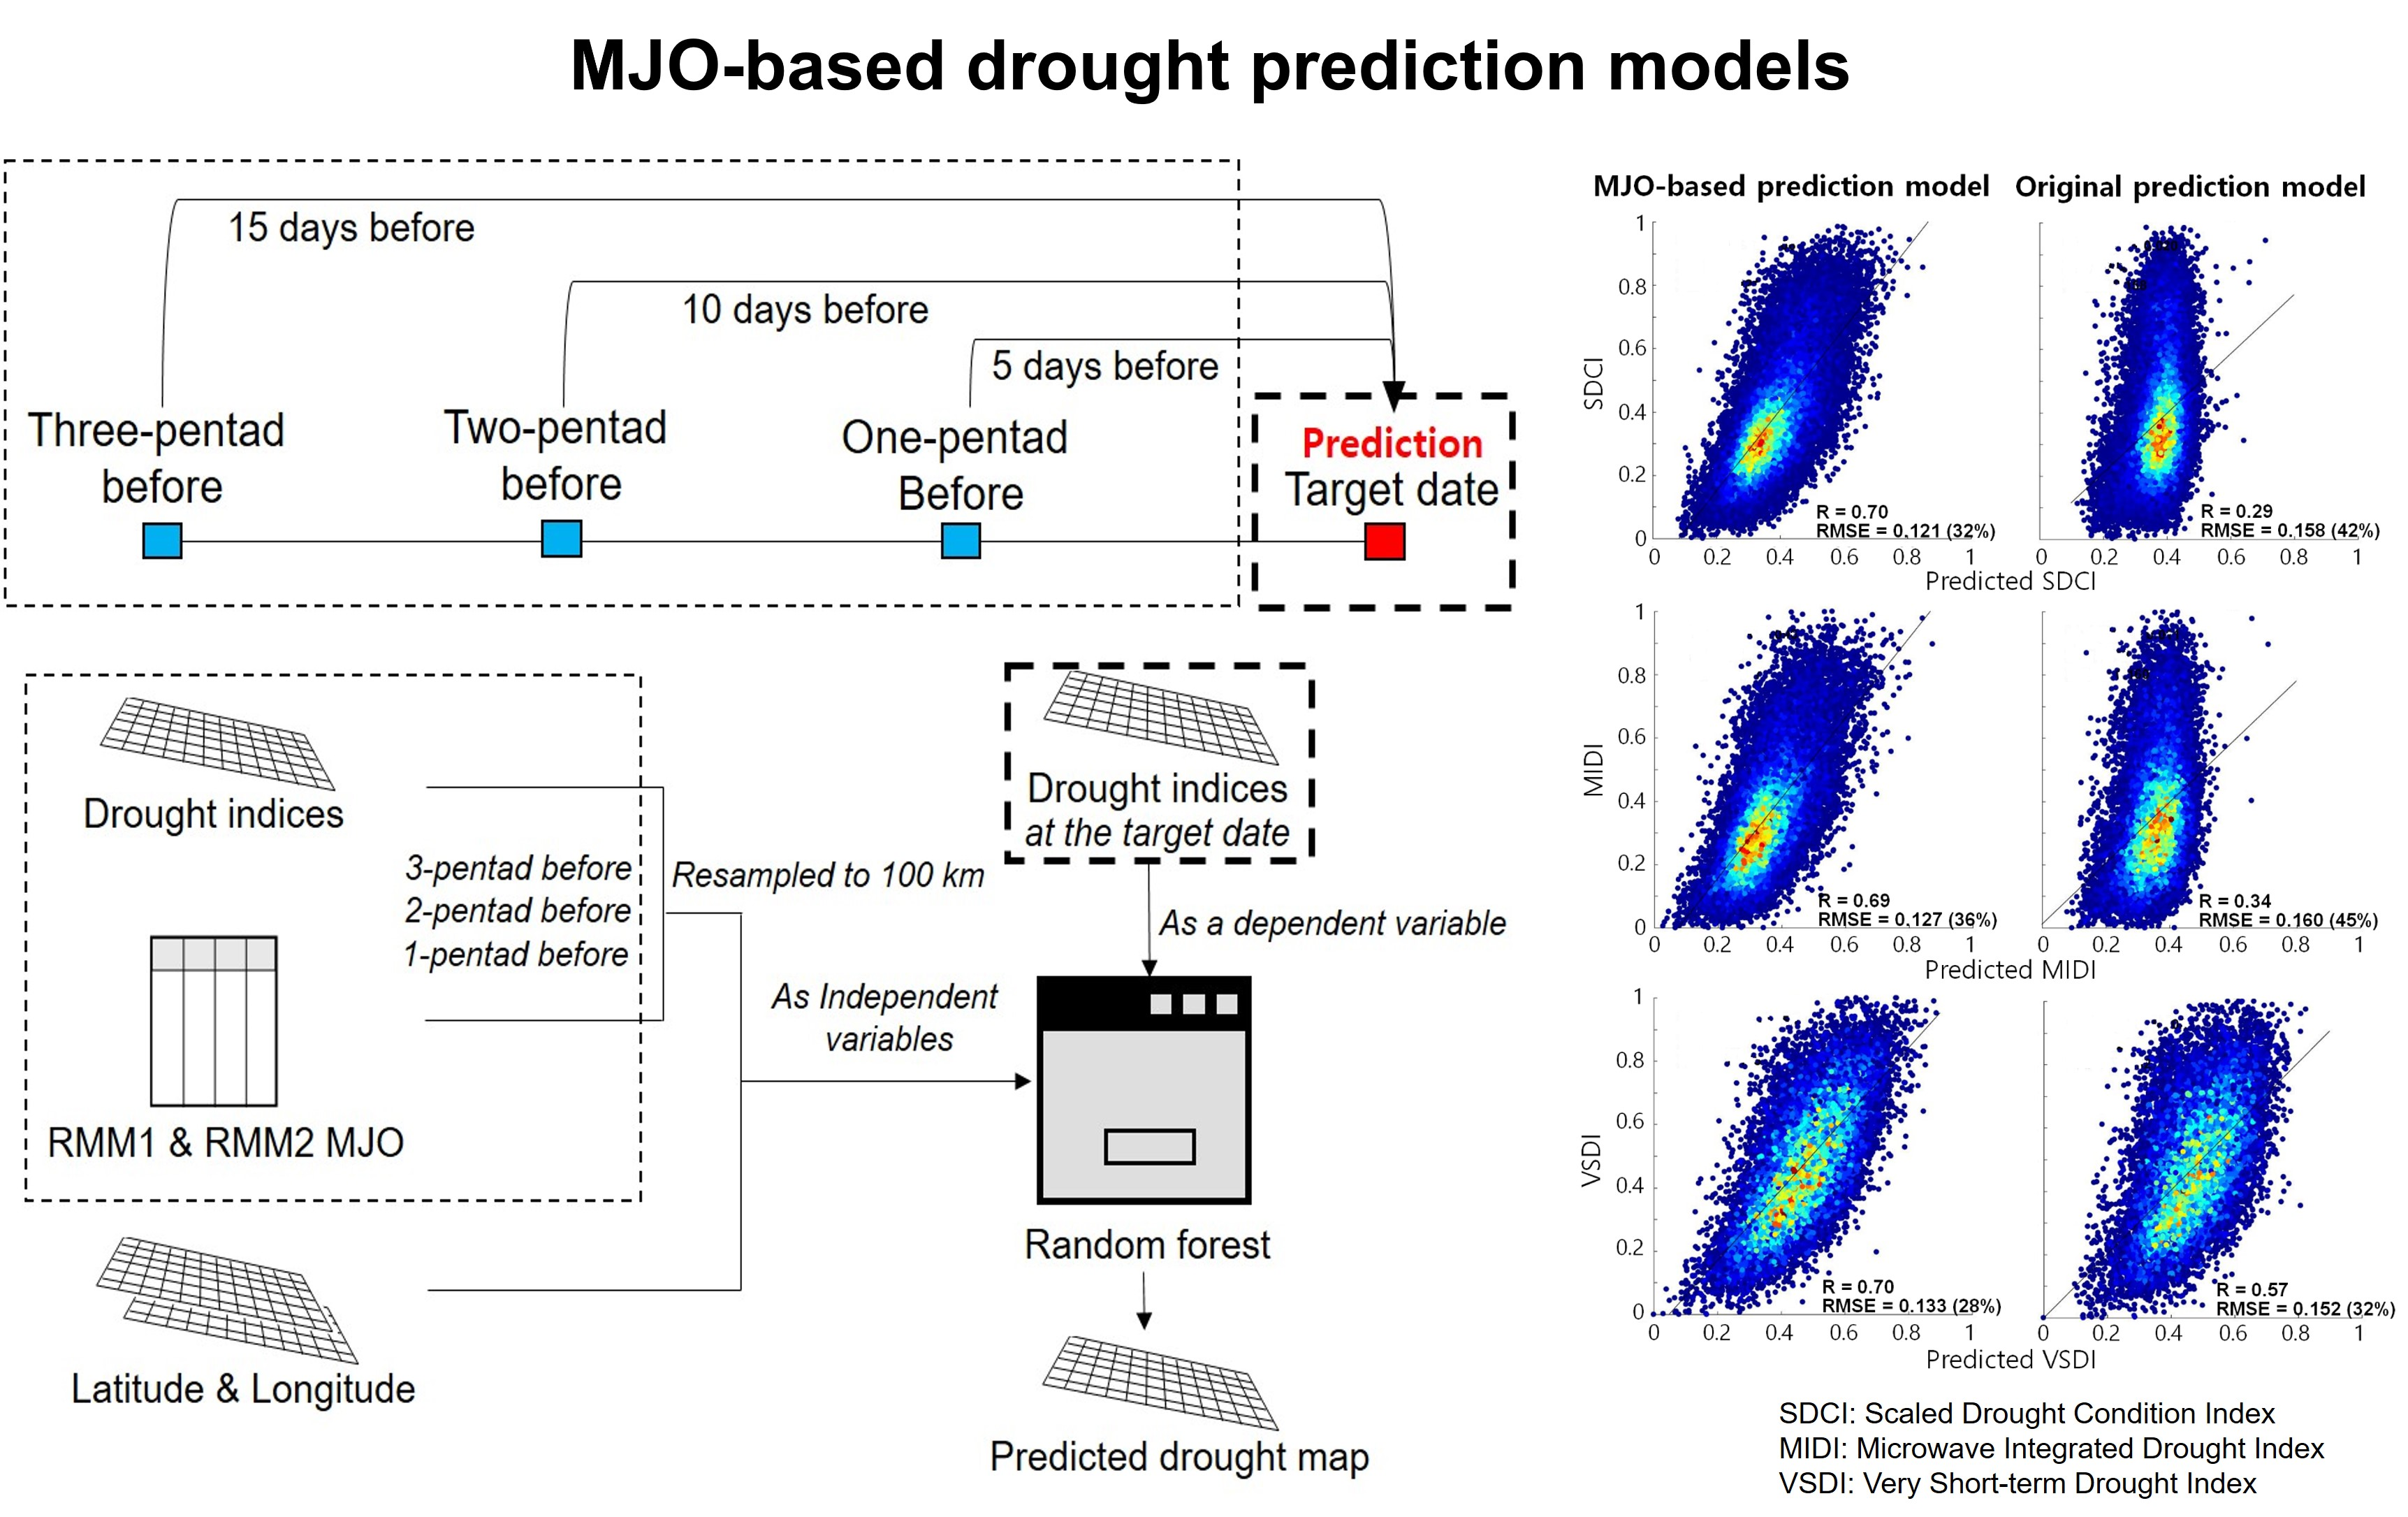
This study mainly focused on the East Asia region (10°–50°N and 90°–150°E) including east China, south-east Russia, Taiwan, Korea, and Japan. East Asia suffers from droughts especially during the spring (from March to May) due to the transient season of the East Asian monsoon onset. East Asia has diverse land cover types. Figure 1 shows Moderate Resolution Imaging Spectroradiometer (MODIS, MCD12Q1) land-cover distribution with 11 land cover classes. While Korea, Taiwan, and Japan mostly consist of forest and croplands, China is composed of forest, croplands, shrublands, grasslands, and barren lands. Most of south-east China, South Korea and Japan is covered with vegetation including forest and croplands where annual rainfall is concentrated, while north central China, including a desert, is mostly barren. In this regard, the land surface conditions of East Asia are strongly associated with atmospheric phenomena in diverse timescales.
2.2. Data
2.2.1. Satellite Data
Four variables; LST, NDVI, precipitation, and soil moisture, were used to produce three drought indices. LST and NDVI were obtained from MODIS daily LST (MOD11C1) and daily surface reflectance (MOD09CMG) with 5 km spatial resolution which were obtained from EARTH DATA (https://earthdata.nasa.gov/). In this study, pentad mean (5 days) data were used to capture short-term changes in drought conditions, and thus, daily products were converted into pentad information. To calculate NDVI, bands 1 (red) and 2 (near-infrared) were used, and the maximum value composite approach (MVC; [54]) was applied to produce pentad NDVI. This study used TRMM 3B42 daily precipitation data with 25 km spatial resolution obtained from Goddard Earth Sciences Data and Information Center) (GES DIC; https://mirador.gsfc.nasa.gov/). Daily precipitation data were converted into monthly data with a 5-day interval (pentad). The European Space Agency (ESA)–Climate Change Initiative (CCI) satellite-based soil moisture dataset, collaborating active and passive measurements, has provided daily volumetric soil moisture at surface level with 0.25° spatial resolution since 1979 [55,56,57]. The version 3.3 soil moisture data available from ESA-CCI (http://www.esa-soilmoisture-cci.org) were used in this study. TRMM precipitation and ESA CCI soil moisture were resampled to a 0.05° grid size using bilinear interpolation.
The SDCI proposed by Rhee et al. [16] was calculated using the precipitation condition index (PCI), temperature condition index (TCI), and vegetation condition index (VCI) (Equations (1)–(4)). MIDI proposed by Zhang and Jia [17] were calculated using PCI, the soil moisture condition index (SMCI), and TCI (Equations (5) and (6)). Those condition indices were calculated by normalizing from 0 to 1 through max-min scaling at each pixel, which considers the potential maximum and minimum of an ecosystem, as discussed in Kogan [14]. The values of 0 (1) represents the driest (wettest) conditions. Although the growing season over East Asia is from April to September, drought frequently occurs from April to May when people start farming [13,58]. Thus, the temporal scope of this study is from April to May between 2000 and 2016. The indices were computed using pentad means for 17 years (12 pentads per year). Each drought index has 12 pentads per year. This study proposed a new drought index, very short-term drought Index (VSDI), which modifies SDCI, because the precipitation factor in SDCI is inadequate for monitoring and predicting changes in drought conditions in short periods of time. It is difficult for the lack of precipitation within one pentad to be the standard of what is considered to be a drought, and other factors such as temperature and evapotranspiration are closely related to drought rather than precipitation in short periods of time. Since soil moisture reflects precipitation as discussed in Wang et al. [39], VSDI was developed by replacing PCI with SMCI (Equation (7)).
PCI = (Precip − Precipmin)/(Precipmax − Precipmin)
TCI = (LSTmax − LST)/(LSTmax − LSTmin)
VCI = (NDVI − NDVImin)/(NDVImax − NDVImin)
SDCI = 0.5 × PCI + 0.25 × TCI + 0.25 × VCI
SMCI = (SM − SMmin)/(SMmax − SMmin)
MIDI = 0.5 × PCI + 0.3 × SMCI + 0.2 × TCI
VSDI = 0.5 × SMCI + 0.25 × TCI + 0.25 × VCI
2.2.2. Numerical Land Surface Data
The global collection of land surface datasets on a long-term timescale with subsurface layers has been limited due to the lack of satellite and ground-based observations. An alternative way to create the land condition datasets is to use an offline land surface model (LSM) which is assimilated with atmospheric boundary-forcing conditions. In order to produce realistic land variables, the quality of the forcing datasets is essential because meteorological biases exert a confounding effect on both water and energy budgets.
In this study, an offline LSM simulation with the Joint UK Land Environment Simulator (JULES: [59]) was implemented. The model simulation produced land surface variables with a 0.5° spatial resolution and 4 layers (0.1, 0.25, 0.65, and 2 m) of vertical resolution in the land. Three-hourly near surface atmospheric forcing, provided by the Terrestrial Hydrology Research Group [60] was used to implement the LSM. The atmospheric variables from the National Centers for Environmental Prediction–National Center for Atmospheric Research reanalysis [61] including surface air temperature (SAT), humidity, 10-m wind, precipitation, surface radiation components (e.g., net short and longwave radiation fluxes at surface level), and surface pressure were used. Additionally, the mean biases of reanalysis were corrected by observational datasets (e.g., Global Precipitation Climatology Project (GPCP) and TRMM 3B42RT). Climatic Research Unit (CRU) time-series (TS) 2.0 monthly data [62] was used to correct SAT, and monthly NASA Langley surface radiation budget products [63] were adopted to correct surface radiative fluxes. The offline integration of land surface model was prescribed by corrected atmospheric boundary forcing with three-hourly time steps.
2.2.3. Madden–Julian Oscillation (MJO) Index
To define the MJO phases, we adopted the method proposed in Wheeler and Hendon [64], which is based on a pair of empirical orthogonal functions (EOFs) of the combined fields of 850-hPa, 200-hPa zonal wind anomalies and outgoing longwave radiation (OLR) averaged over the tropics (15°S–15°N). The two leading principal components (PC1 and PC2) of the EOFs are referred to as the real-time multivariate MJO series 1 (RMM1) and 2 (RMM2), respectively. Based on RMMs, MJO phases 1 to 8 are determined by the location of the convection center, and their amplitude is calculated by the root of the sum of the squared RMM1 and RMM2 (in Equation (8)). The real-time observational RMM indices were obtained from (http://www.bom.gov.au/climate/mjo/graphics/rmm.74toRealtime.txt). Seasonal MJO amplitude is relatively uniform from October through June while it is weakened during July–September, supporting the suitability of MJO for drought prediction in April–May [65].
3. Methodology
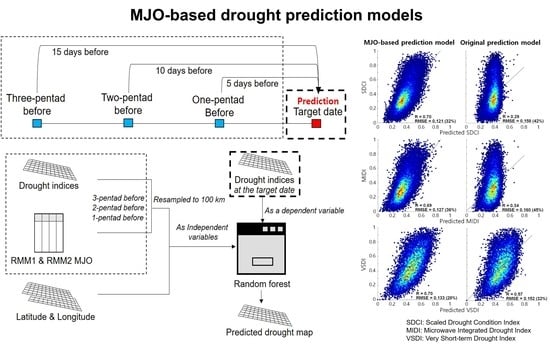
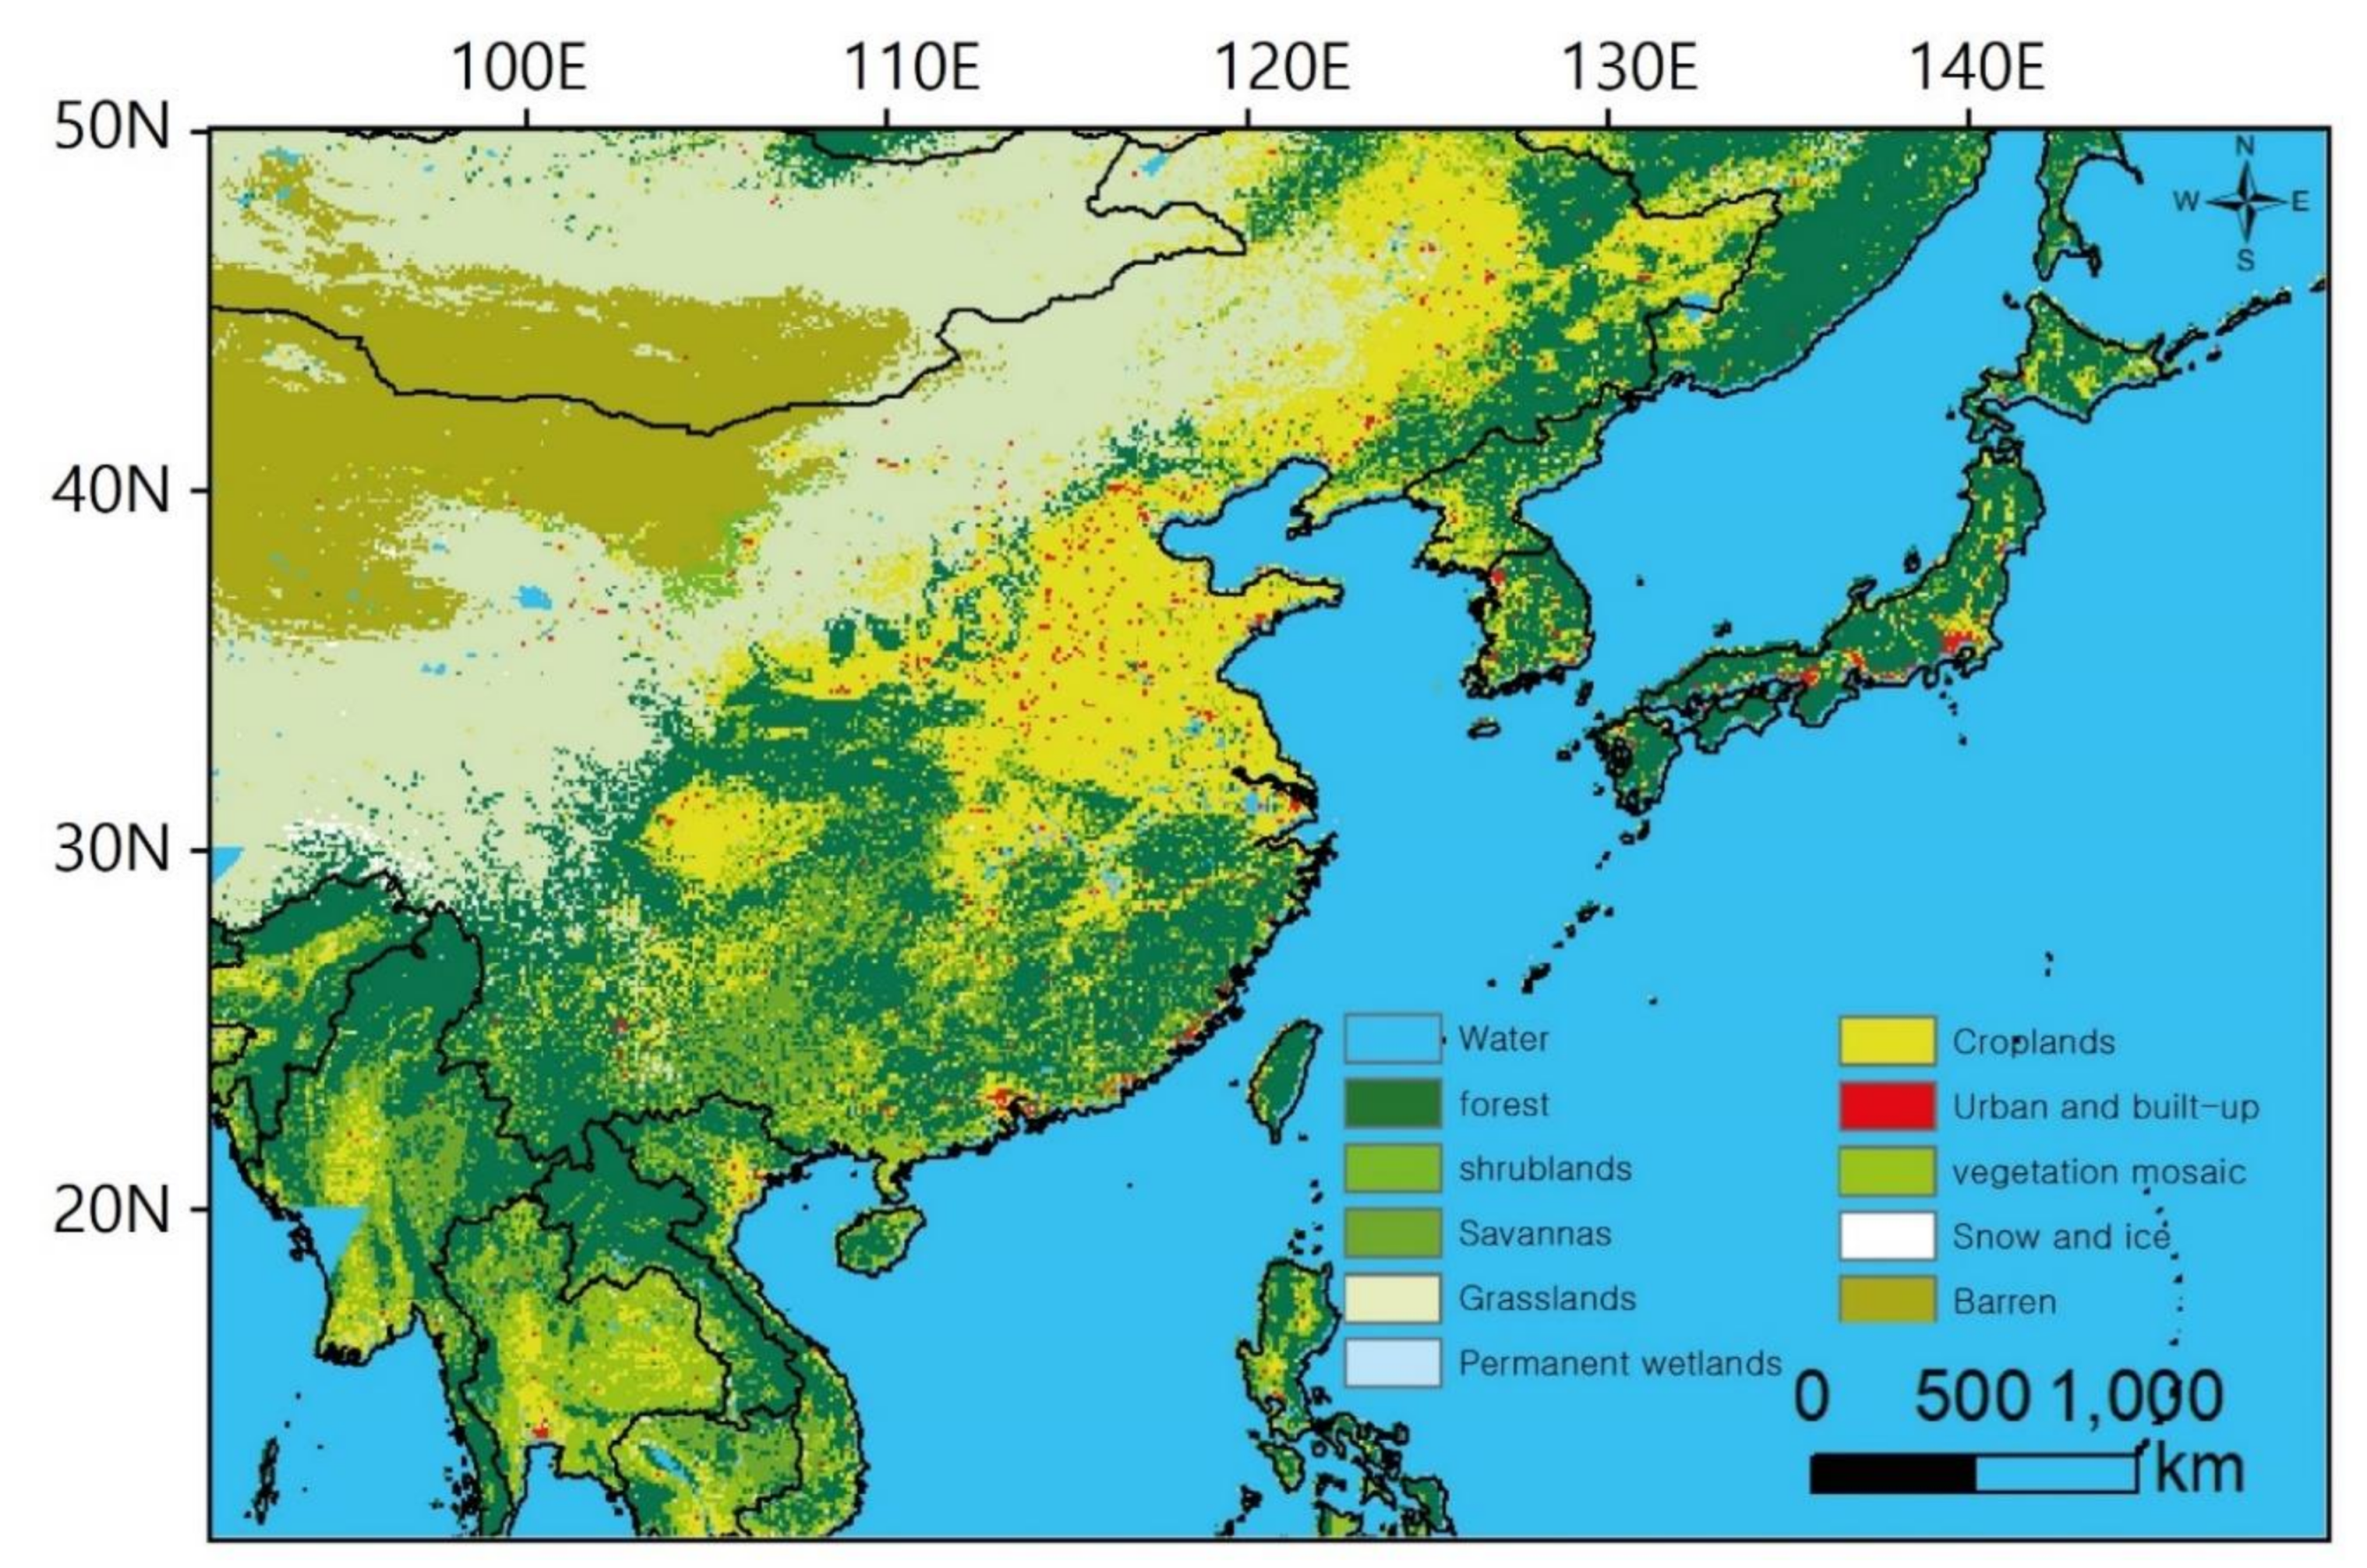
A total of 11 input variables were used to develop the drought prediction models: 1-, 2-, and 3- pentads before the target prediction dates, RMM1 MJO, RMM2 MJO, and drought indices, latitude, and longitude—from 2000 to 2016 (Table 1). The target variable is each drought index. For example, to predict SDCI on a target date, SDCIs computed 1-, 2-, and 3-pentads before the date was used with other variables, i.e., 1-, 2- and 3-pentad before RMM MJO indices, latitude, and the longitude of each pixel over the study area. Figure 2 shows the process flow diagram of the approach proposed in this study. All variables—drought indices, RMM MJO indices, latitude, and longitude—were resampled to 100 km, considering the characteristics of the variables over the entire study area by using all pixels. Then, the 11 independent variables were fed into a random forest to develop drought prediction models to predict each drought index for the target dates. A randomly selected 80% of the samples were used as training data, and the remaining 20% were used for validation. Validation was conducted to compare the performance of each drought index and the effect of MJO for the short-term prediction of drought, and to identify the importance of the input variables. Then, a ‘leave-one-year-out’ cross validation was used to further evaluate the selected drought prediction model.
Random forest (RF) consists of many (typically 500–1000) classification and regression trees. There are two major randomization processes in RF. A subset of training samples (2/3 by default; the remaining data is held as out-of-bag data) is randomly selected to develop each tree, and a random subset of variables (i.e., a third of the number of variables in this study) is used at each node of a tree to determine a splitting variable. Each tree is fully grown through repeated splits. The best split at a node is determined using the variable resulting in the lowest residual sum of squares. Finally, the prediction of an unknown pixel is determined by averaging the results of all trees. RF also provides relative variable importance (i.e., the increase of the mean squared error as percentage; %IncMSE) which implies the contribution of the variable towards predicting a target variable. It is calculated by permuting a variable. The prediction error (mean squared error; MSE) is computed for each tree, and the same error is also computed after permuting each predictor variable. The difference between the two MSEs from all trees is averaged and then standardized. A high difference means the variable is important. In our study, R software (https://www.r-project.org/) was used to implement RF through the random forest package (Version 4.6-14). Default settings were applied except for the number of trees (1000 trees).
In this study, the intra-seasonal variability of MJO over East Asia was analyzed. Two prediction models for each drought index were compared in order to understand the effect of RMM MJO indices in drought prediction. The original prediction model used five variables (drought indices one, two, and three pentads before, latitude and longitude) excluding RMM MJO indices to predict each drought index, while the other MJO-based prediction model used 11 variables including RMM MJO indices. The drought prediction models developed were also validated through ‘leave a year out’ cross validation (i.e., 17-fold cross validation from 2000 to 2016) to further evaluate the temporal robustness of the models. The performance of the drought prediction models was evaluated using the root mean square error (RMSE) and correlation coefficients (r), relative RMSE (rRMSE), and p-value. The change in the spatial distribution of drought from normal to dry and dry to normal conditions was also compared in this study.
4. Results
4.1. Meteorological Climatology Associated with MJO
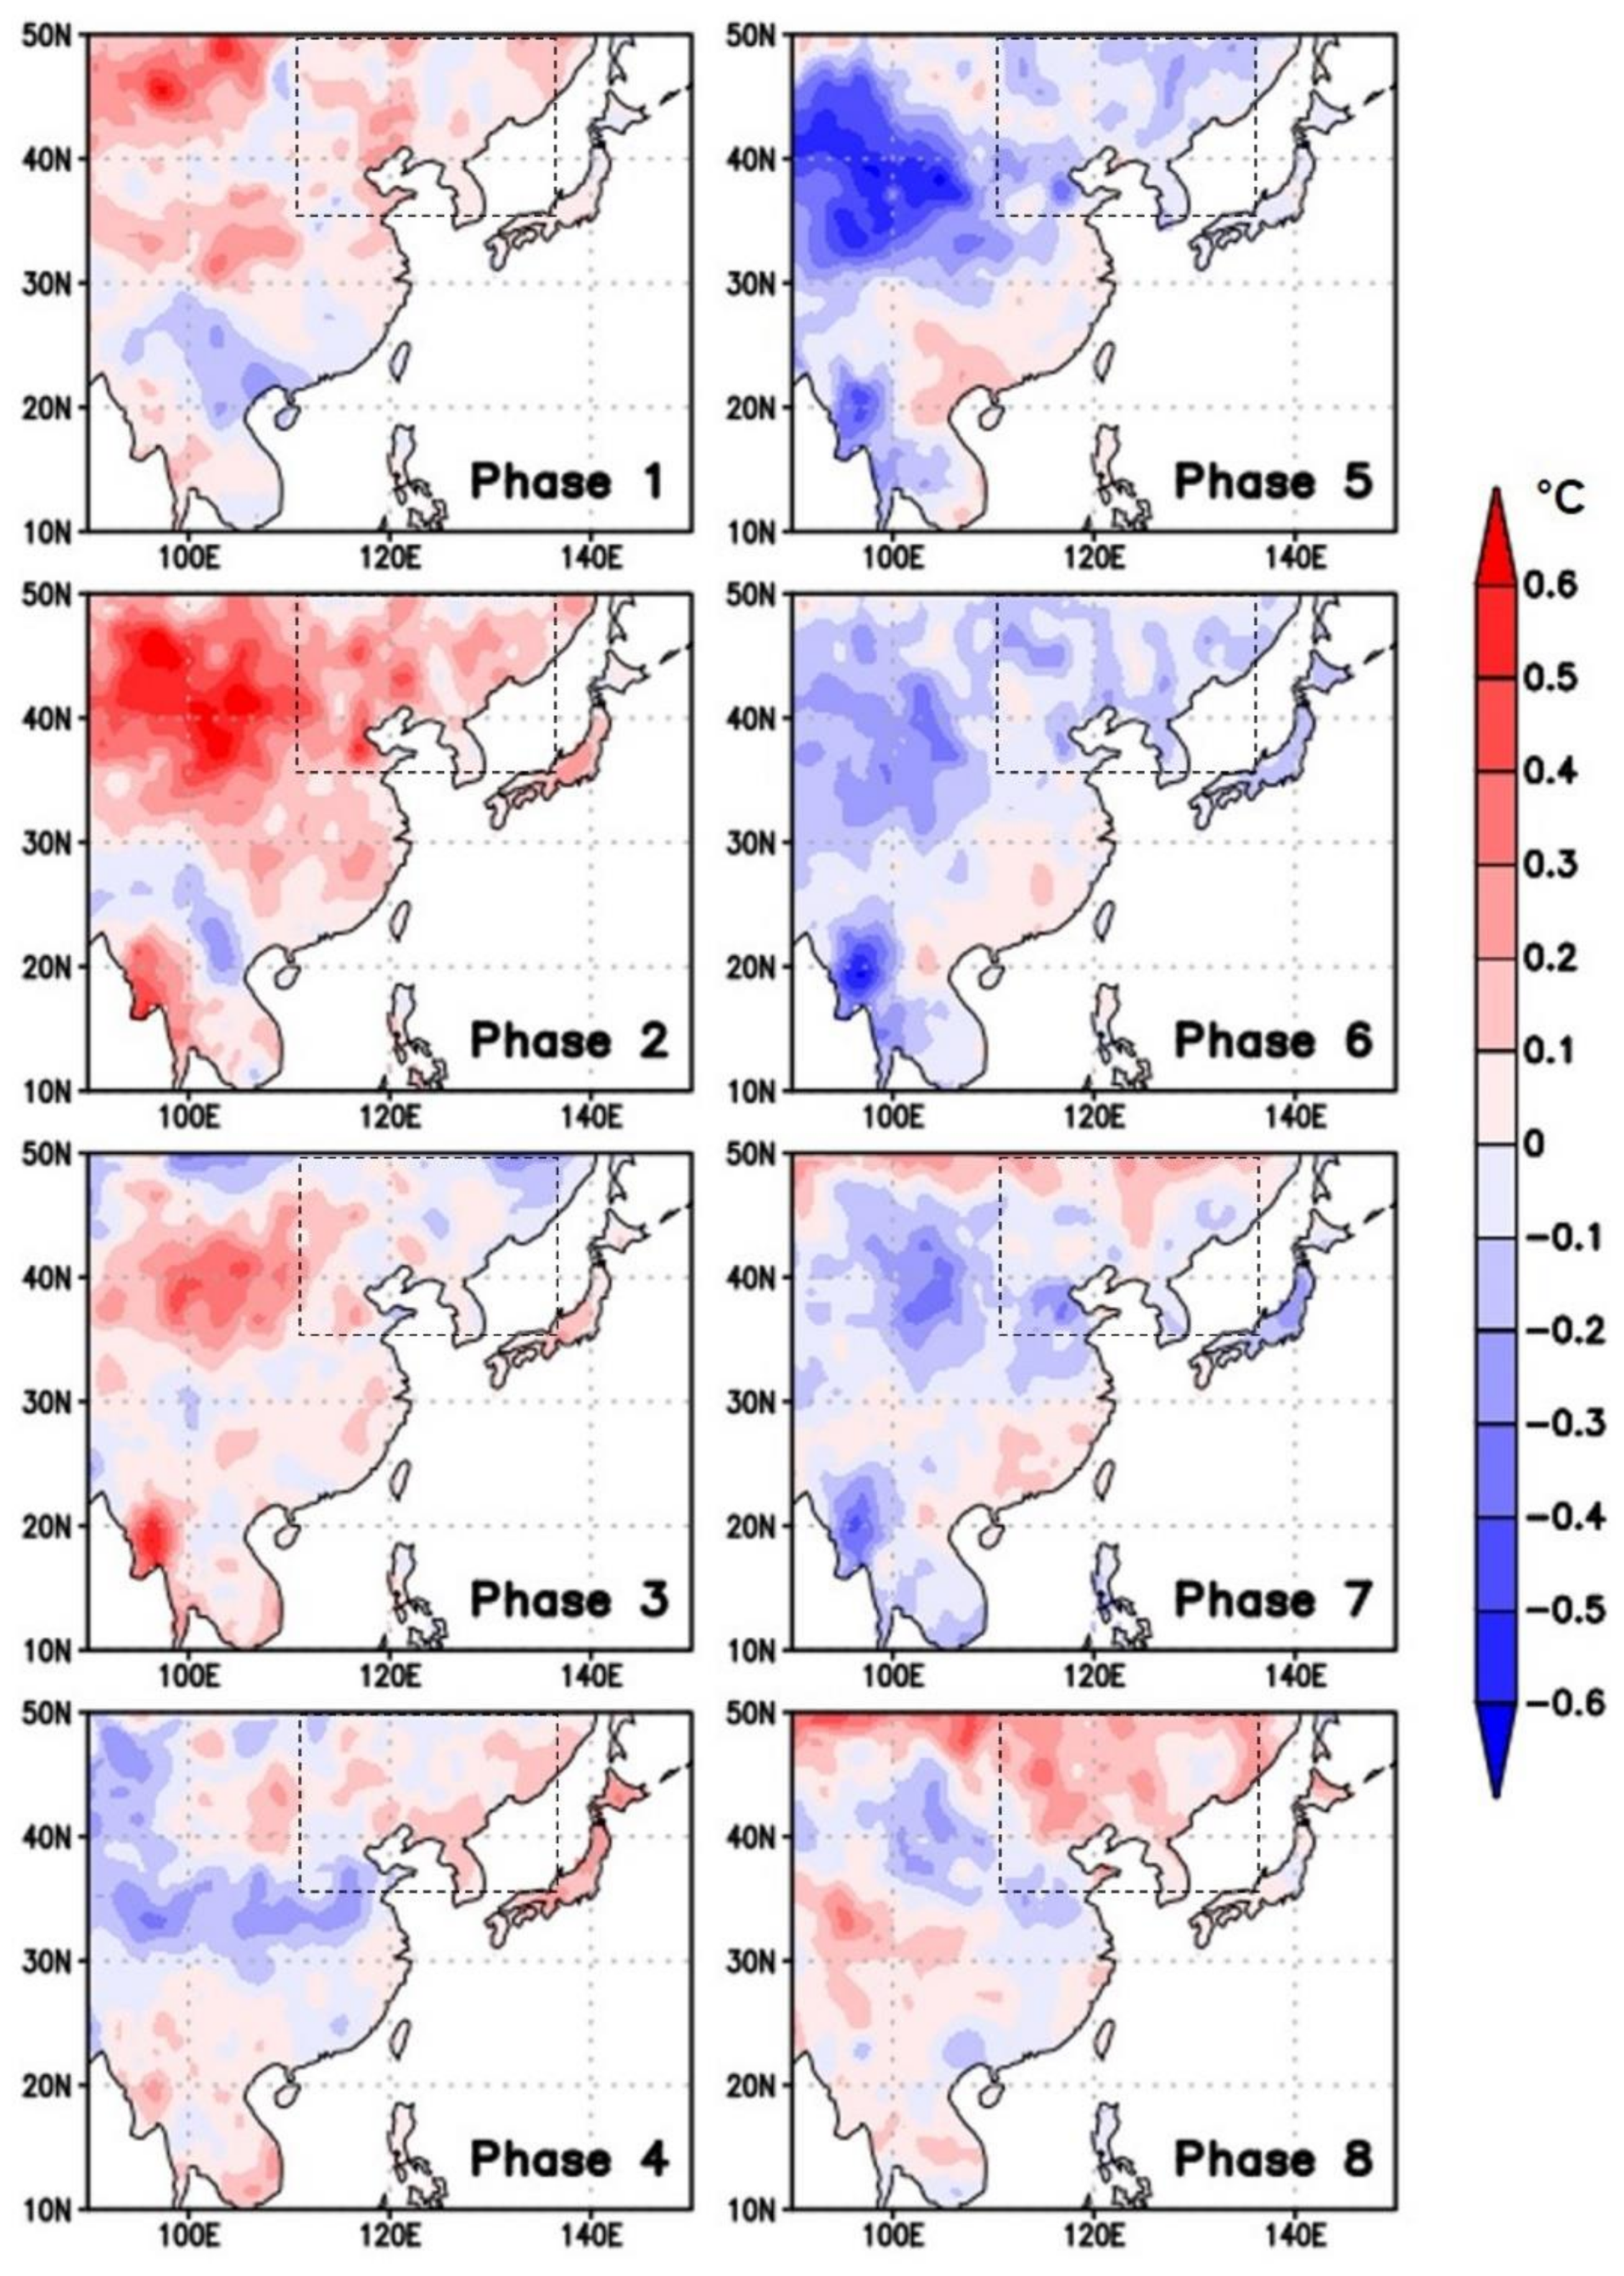
Prior to developing the short-term drought prediction model based on MJO, we investigated the role of meteorological variables, which consist of drought indices, on a sub-seasonal timescale of 30–90 days. It addresses the importance of MJO indices to predict short-term drought since the meteorological variables associated with the MJO timescale significantly explain their total variance. The analysis was performed with the numerical land surface data described in Section 2.2.2, and the variable was filtered using the 30–90 day bandpass to extract the sub-seasonal timescale variability. Figure 3 shows the composited SAT by MJO phases 1 to 8 during the spring season (April–May) for 22 years between 1991 and 2012. Looking at the results, the spatial anomaly of SAT according to the MJO phase clearly appears over East Asia. During MJO phases 1–3, there is a distinct warm anomaly pattern, while the opposite anomaly (i.e., cold pattern) is shown for phases 5–7 over East Asia and central China. However, the MJO-related temperature variation is not clear in southern China. The result is not consistent with the analysis in Jeong et al. [43] during the boreal winter season, when MJO amplitude is strong, and thus there is a significant cooling in phases 2–4 while there is a warming in phases 6–8 over the East Asia region.
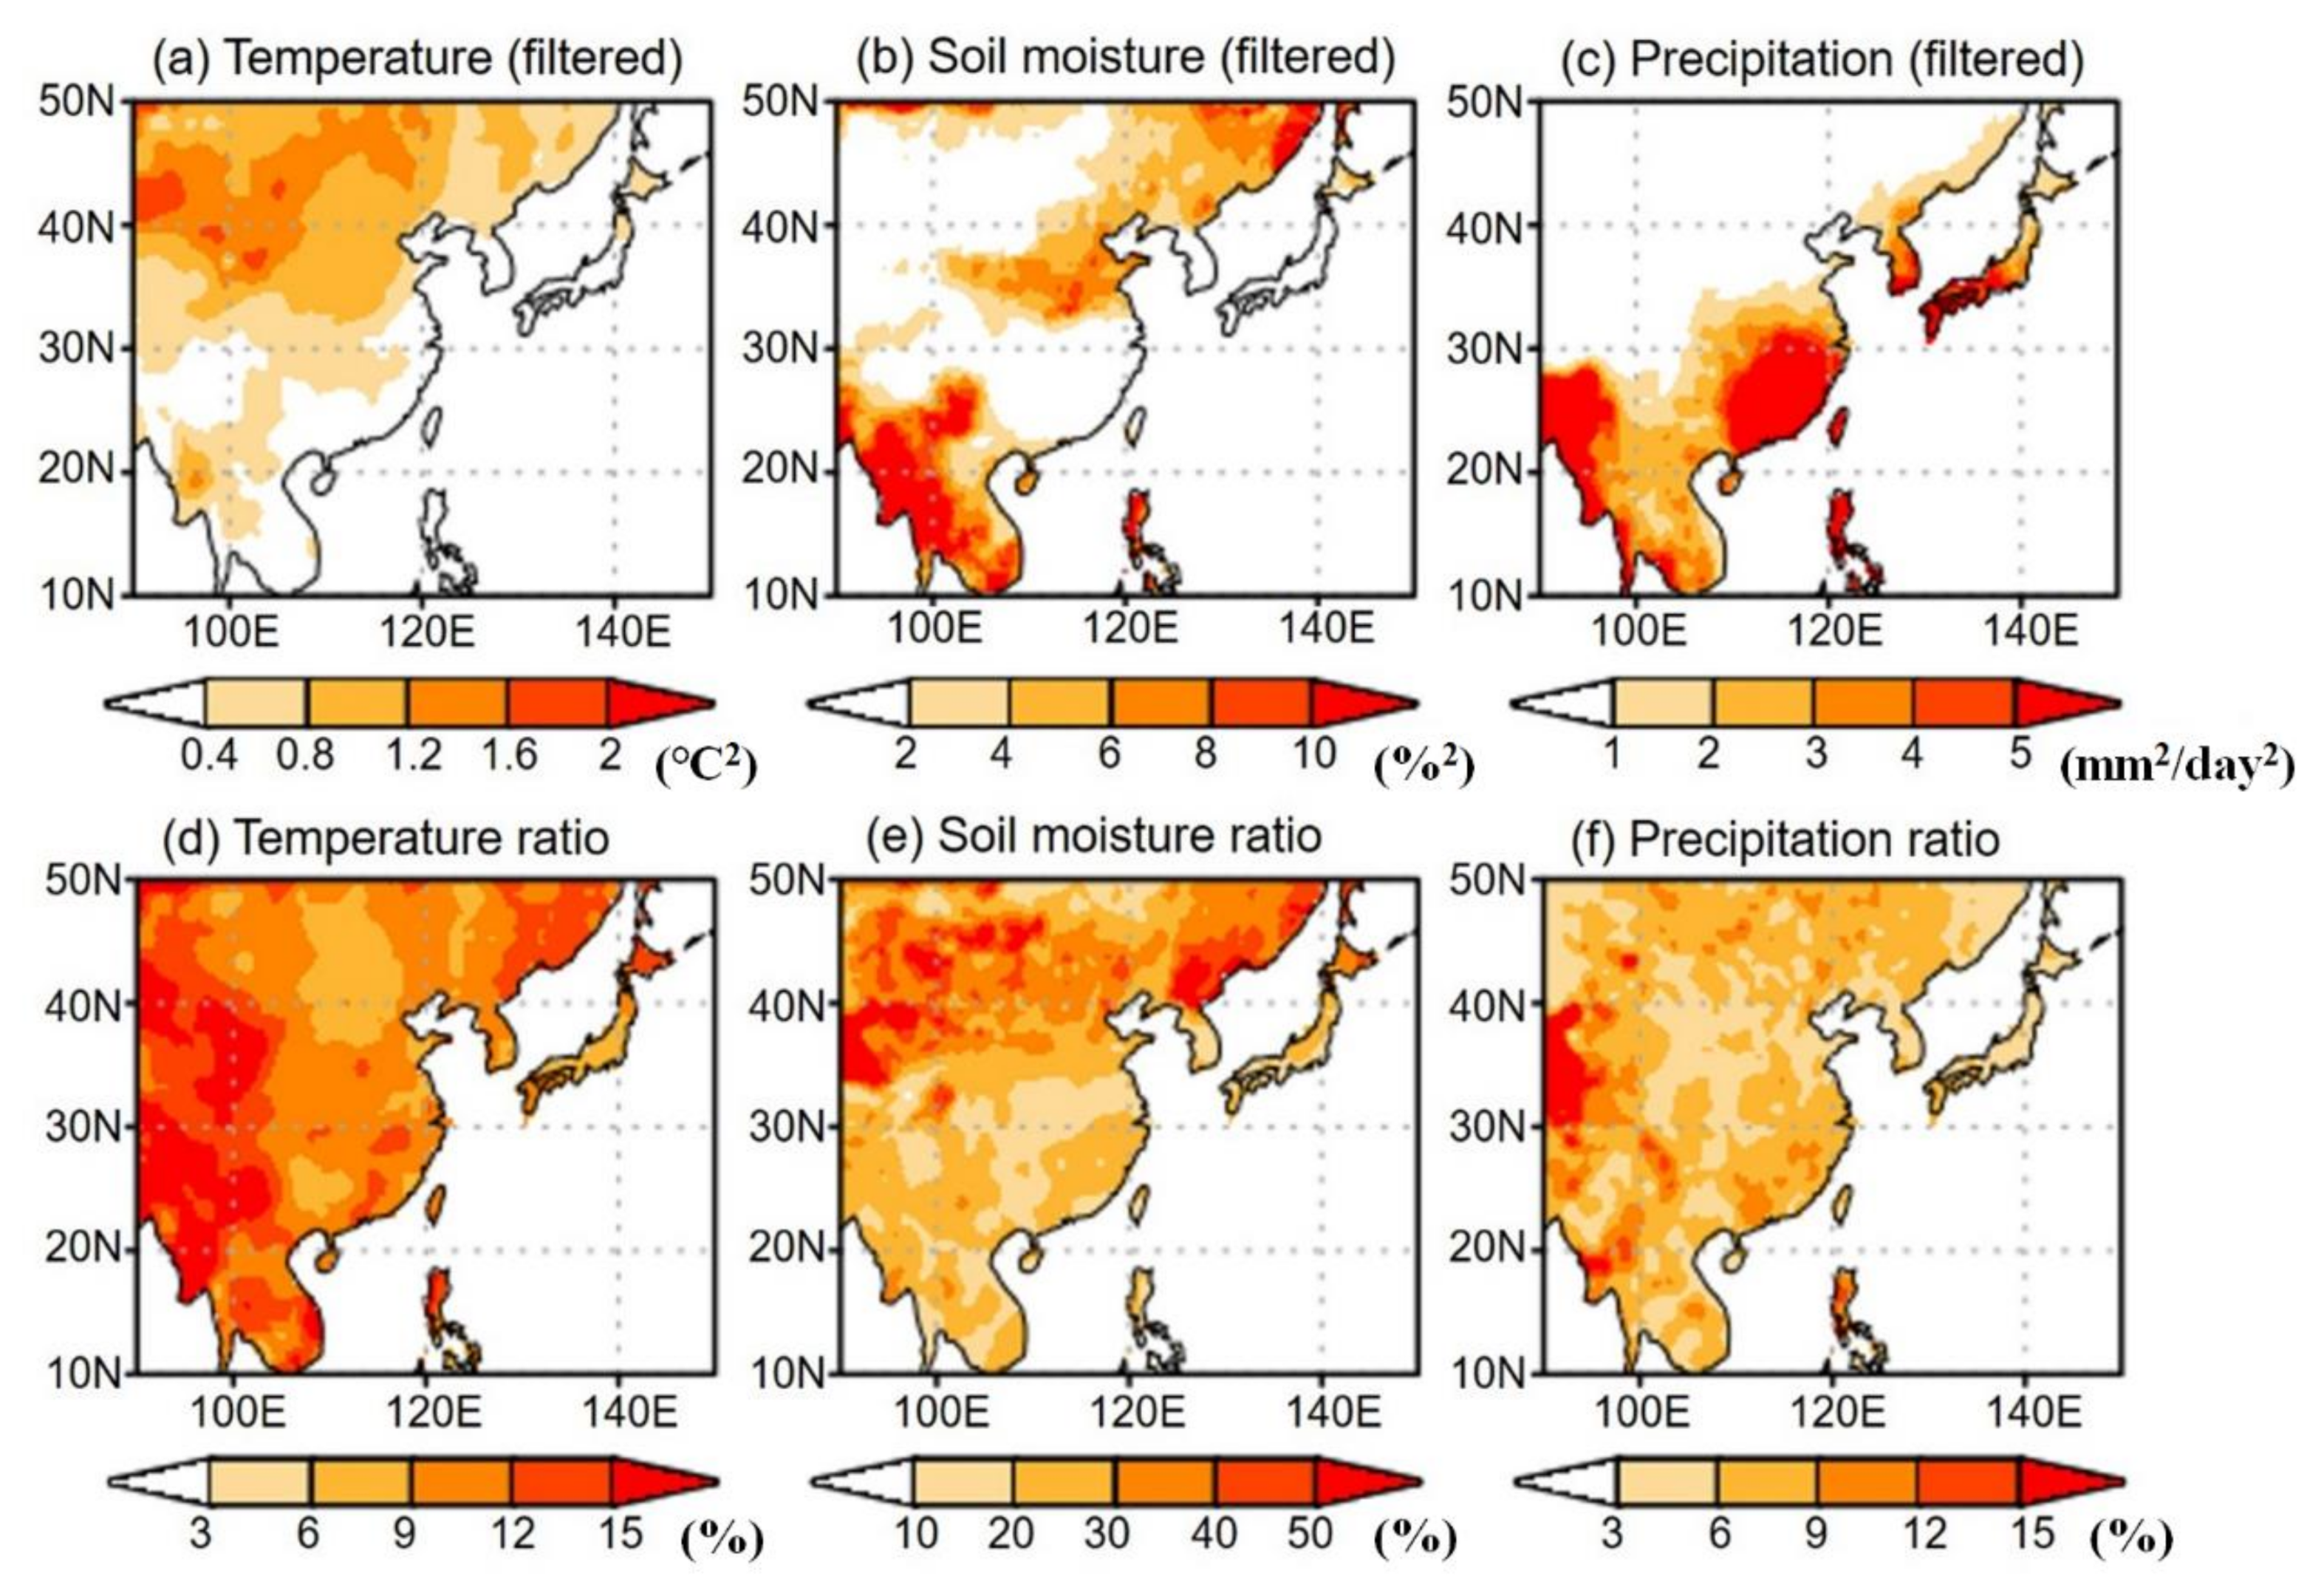
Figure 4 represents the daily variance of the SAT, near-surface (~10 cm) volumetric soil moisture, and precipitation on a sub-seasonal timescale of 30–90 days. The sub-seasonal variance of the SAT is about 1 °C2 over central China (90°E–120°E, 35°N–50°N) where the land surface conditions are relatively dry, and the range of soil moisture variance on that timescale is about 10%2 over south-east Asia (90°E–110°E, 10°N–25°N) and north-east Asia (110°E–140°E, 35°N–50°N). Precipitation variability on a sub-seasonal timescale is high in the main rainfall regions including south-east Asia, south China, Korea, and Japan. However, the distribution of the ratio explained by the intra-seasonal variation versus the total variance is quite different. The degree of explanation of the soil moisture variability on the range of 30–90 days compared to its total variance is practically high, about 40% over central and north-east China, where soil moisture memory is relatively large compared to the rest of East Asia [66]. The ratio of the filtered temperature variance to its total variance is about 10–15% over the research region, and the ratio of the precipitation is less than 10%. Based on the introduced variables, this study examines their role in forecasting drought in a short period of time over East Asia.
4.2. Comparison of Drought Prediction Model Performance
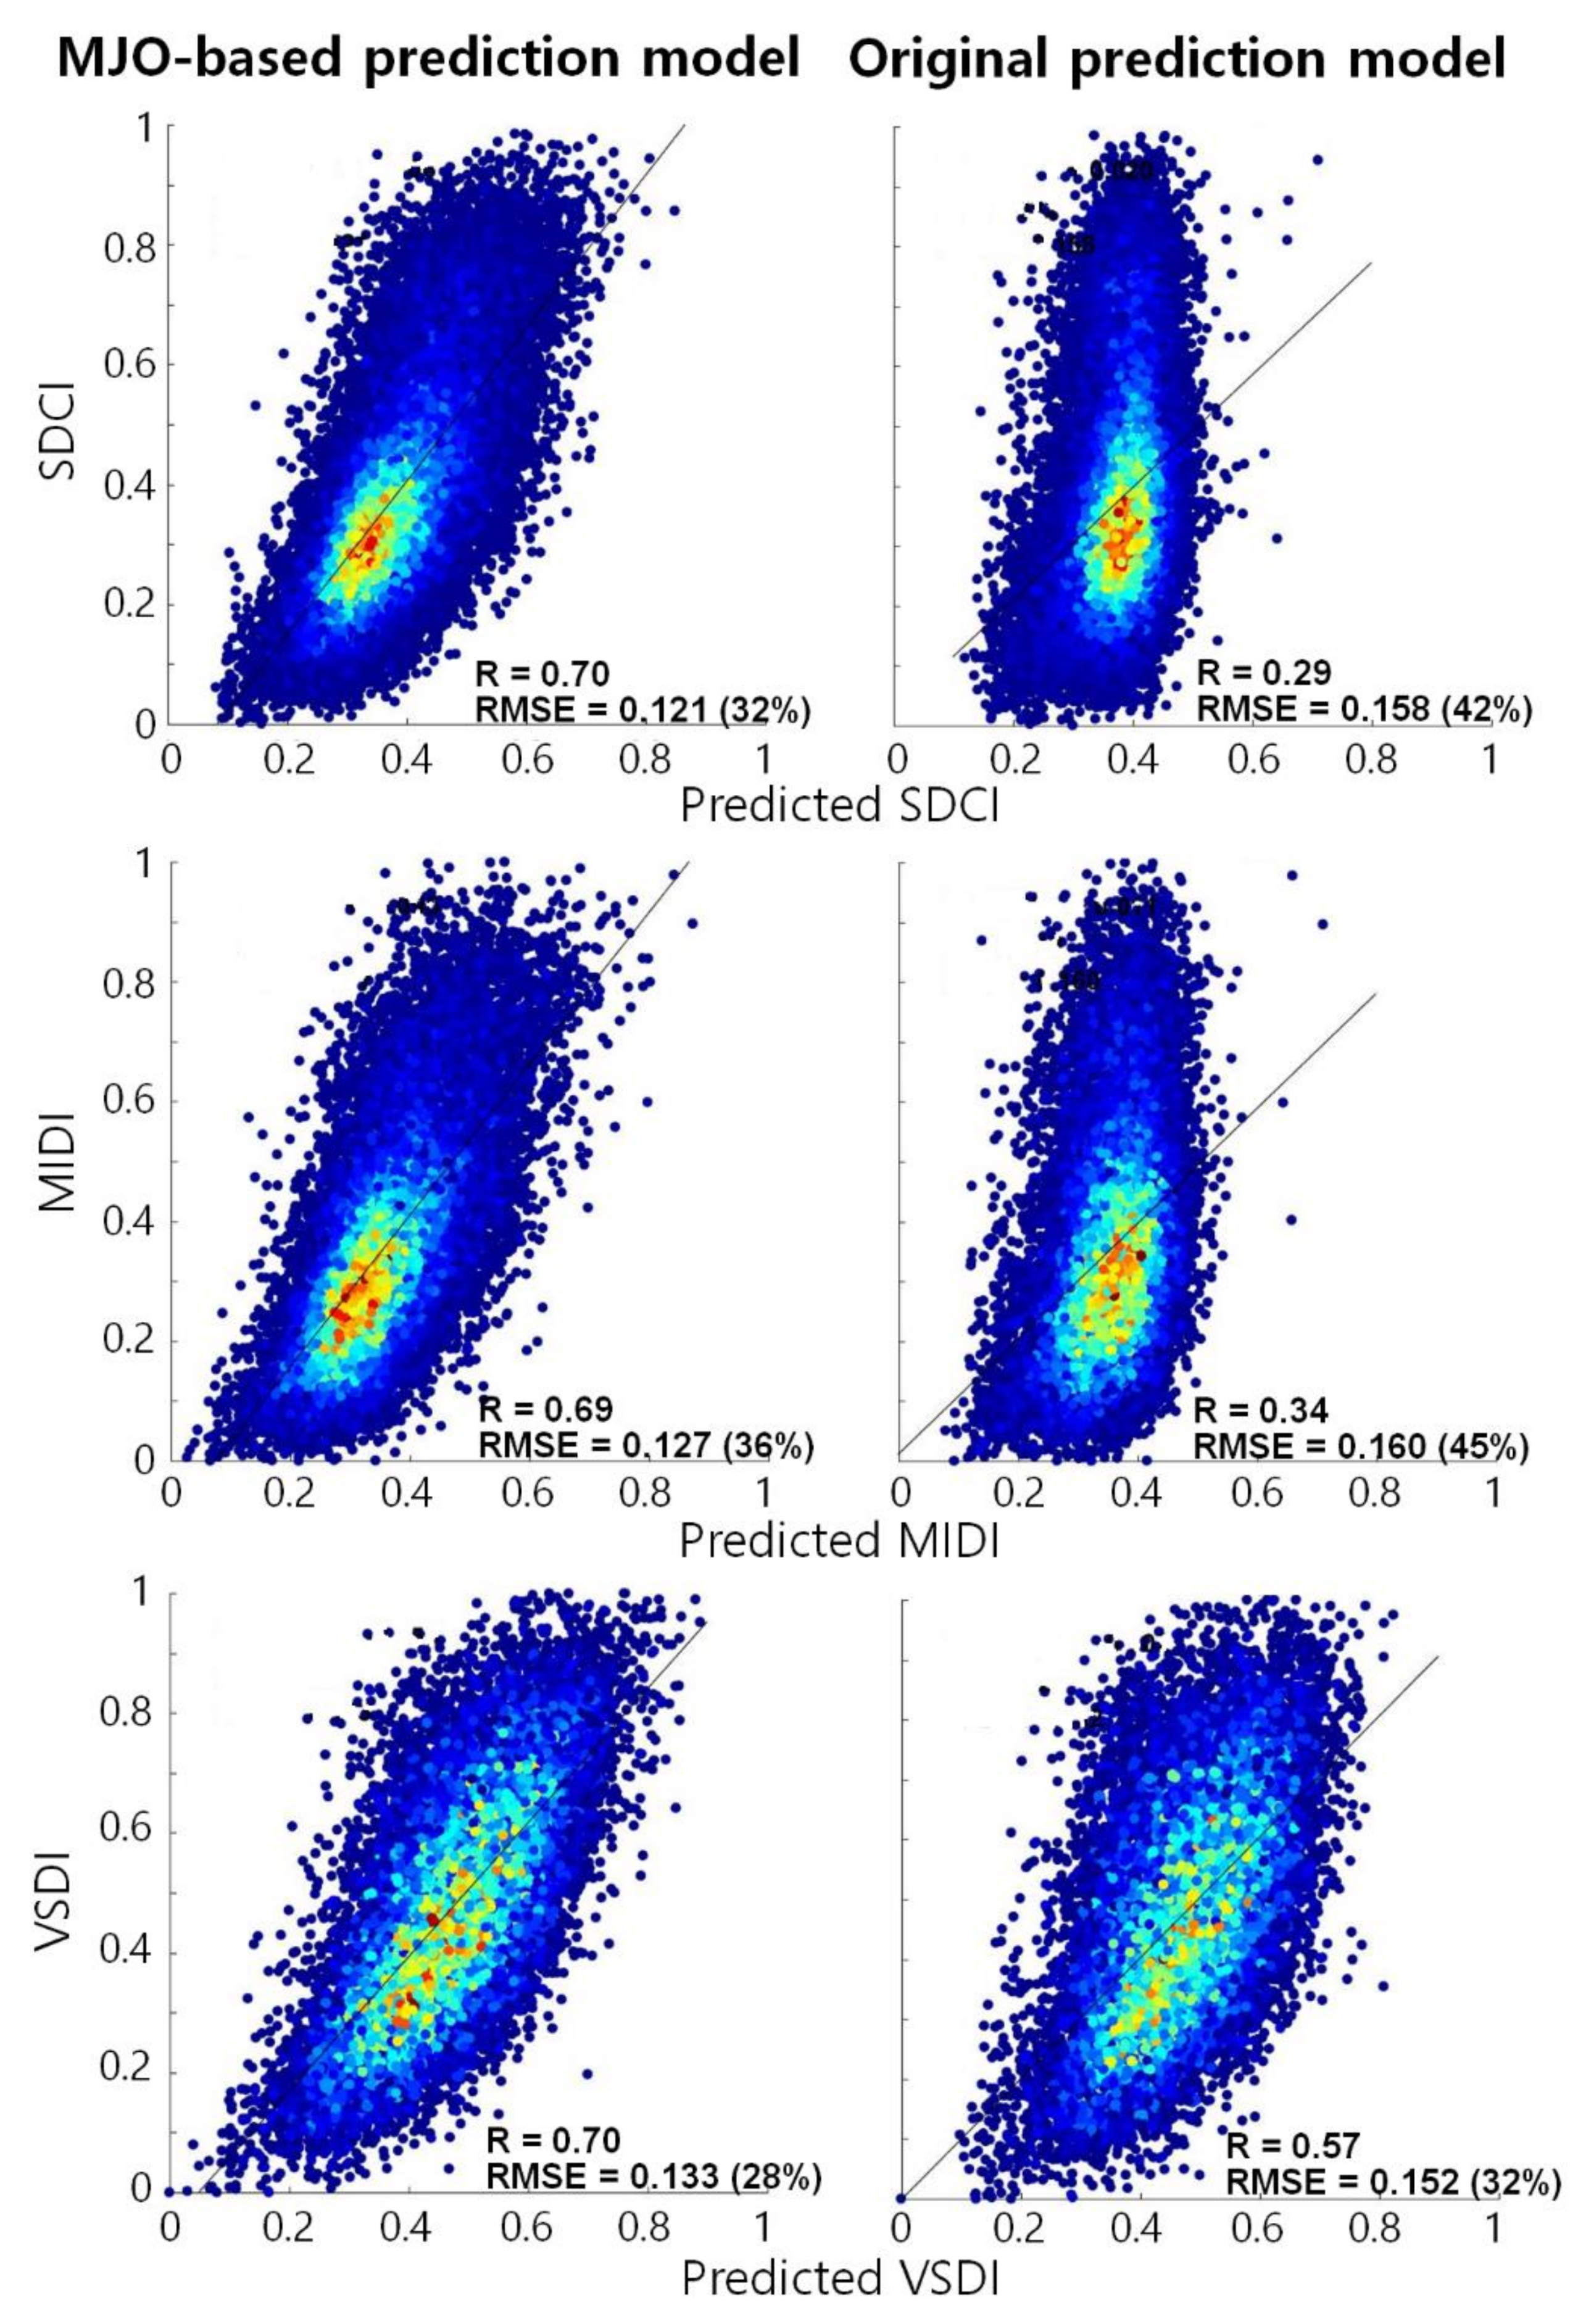
Figure 5 shows the 8:2 validation results. The MJO-based prediction models showed better performance than the original prediction models (i.e., without MJO variables) (Figure 5). The correlation coefficients (r) and RMSEs were greatly improved by around 0.3 and 10%, respectively, in all three drought indices. Figure 5 also shows that the predicted drought indices in the MJO-based prediction models are well matched with the actual drought indices. For SDCI and MIDI, the values of the predicted drought indices are concentrated on mean values (~0.35) in the original prediction models, which results in a smaller dynamic range (0.2–0.5). Such a tendency has previously been reported to be one of the limitations of empirical models in many studies [49,67]. However, predicted drought indices catch the range of the original drought indices well (0.1–0.7) in the MJO-based prediction models. In particular, the driest and wettest conditions in SDCI and MIDI were predicted well, which shows that RMM MJO indices provide useful information for drought prediction. Supplementary Figures S1–S3 show the time series of the predicted and target drought indices for six selected points (Point 1: 17°N and 80°E; Point 2: 34°N and 102°E; Point 3: 42°N and 123°E; Point 4: 47°N and 102°E; Point 5: 48°N and 83°E; and Point 6: 49°N and 112°E). The drought pattern fluctuates in the short term (i.e., one pentad). Although the predicted indices did not have the full dynamic ranges of the target indices, the predicted ones, particularly the predicted VSDI, showed a relatively similar pattern to the targets. The correlations between one- to three-pentad lagged drought indices and the target indices were mostly lower than those between the predicted drought indices and targets (Supplementary Table S1). Although the R2 values of the prediction models seem to be relatively low, the results show that the short-term drought prediction using the proposed VSDI method is necessary and useful when compared to the existing indices.
The relative variable importance from the two models for the three drought indices is presented in Table 2. As expected, the latest drought index (1-P before drought index) showed the highest variable importance in both the MJO-based and original models for the three drought indices, while there is no noticeable difference in variable importance between the 2-pentad before drought index and 3-pentad before drought index. In terms of the two MJO variables, the contribution of the RMM1 MJO was higher than that of the RMM2 MJO. The variable importance of latitude was higher than longitude in the original models, while longitude contributed more in the MJO-based models.
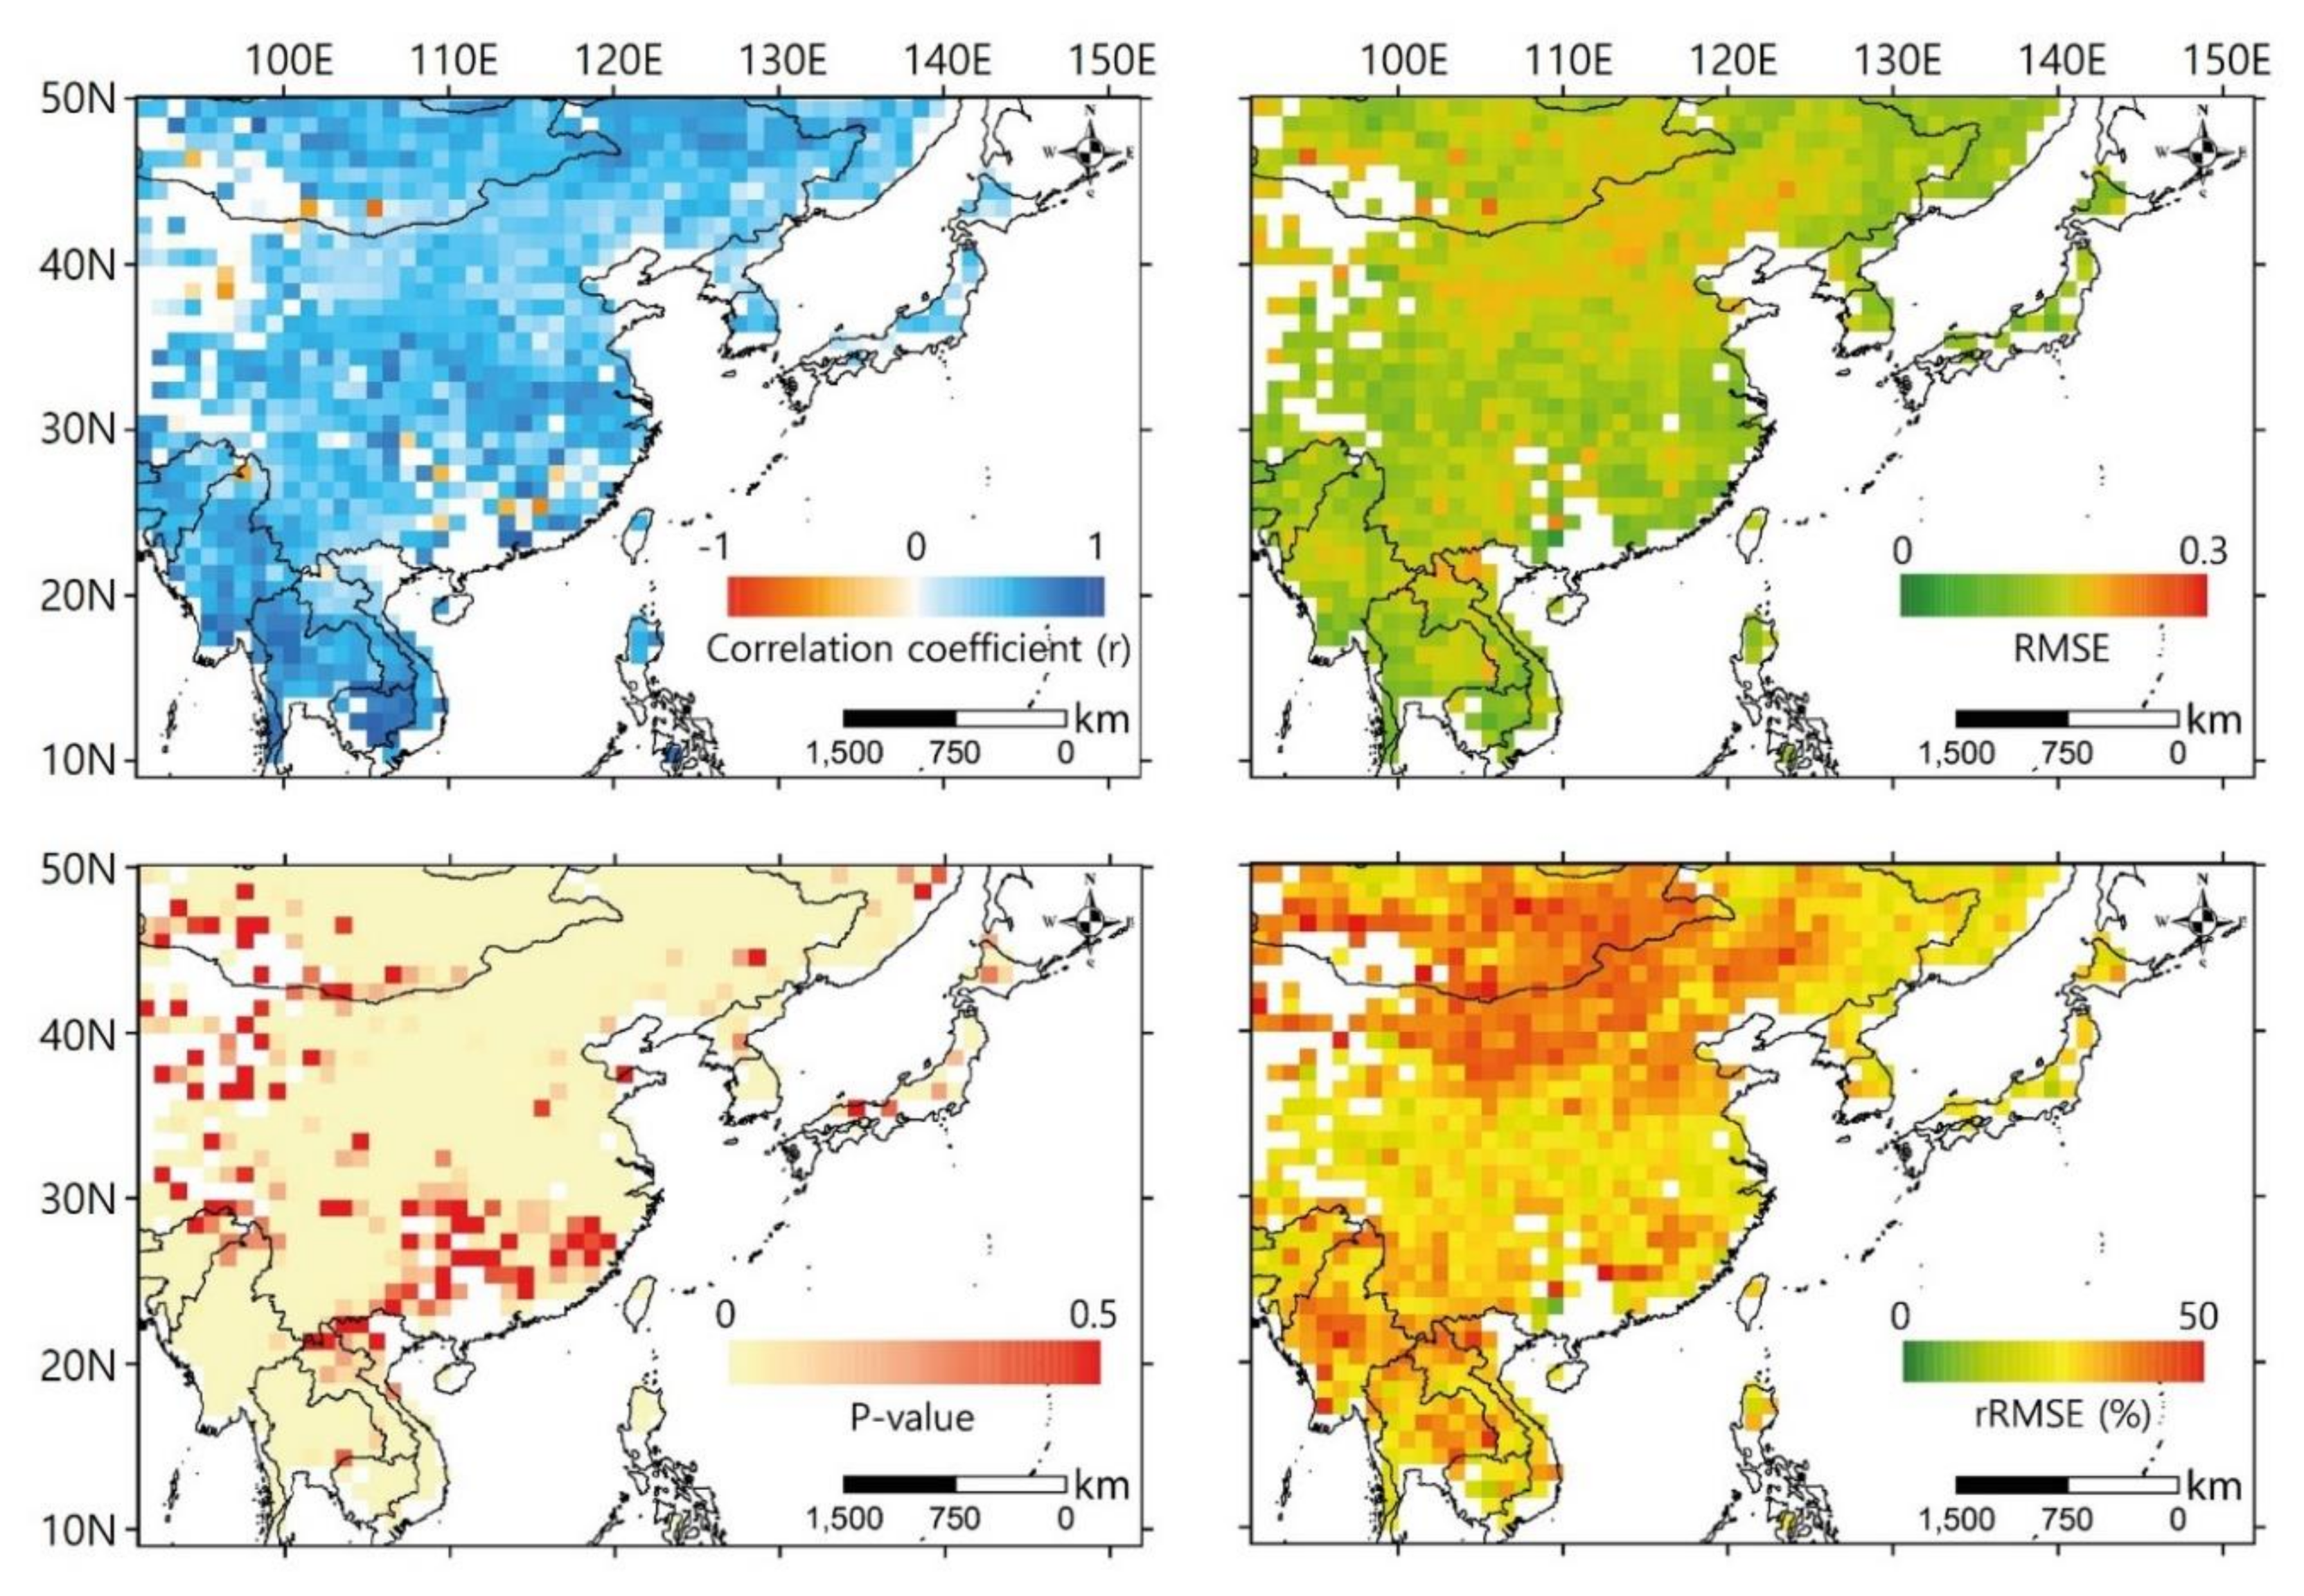
Figure 6 shows the spatial distribution of the 17-fold (leave-one-year-out) cross validation results of the MJO-based VSDI prediction model. The Original VSDI and predicted VSDI during the planting season (April to May) from 2000 to 2016 (153 pentads) were compared using r, the p-value, RMSE, and rRMSE (Figure 6). According to the results, positive correlation (~0.424) and low RMSE (<0.148) and rRMSE (<30%) can be seen in most areas. Some regions, such as southern and north-western China, showed lower r and a higher p-value than other regions, which implies that the drought prediction model did not predict VSDI well in these areas. This is because of the limited number of samples due to clouds (i.e., no data pixels in LST and NDVI) and limited satellite paths (CCI soil moisture). North-eastern China near the Gobi desert shows higher RMSE (~0.18) and rRMSE (~40%) with relatively low r (~0.23) compared to other areas, because this region is sparsely vegetated and is relatively dry (averaged VSDI ~0.411) regardless of the season, unlike the other areas (averaged VSDI ~ 0.523) [67]. The drought prediction model performed well over densely vegetated regions, which consist of forest, shrublands, savannas and croplands (refer to Figure 1) with relatively high r and low RMSE and rRMSE (Figure 6).
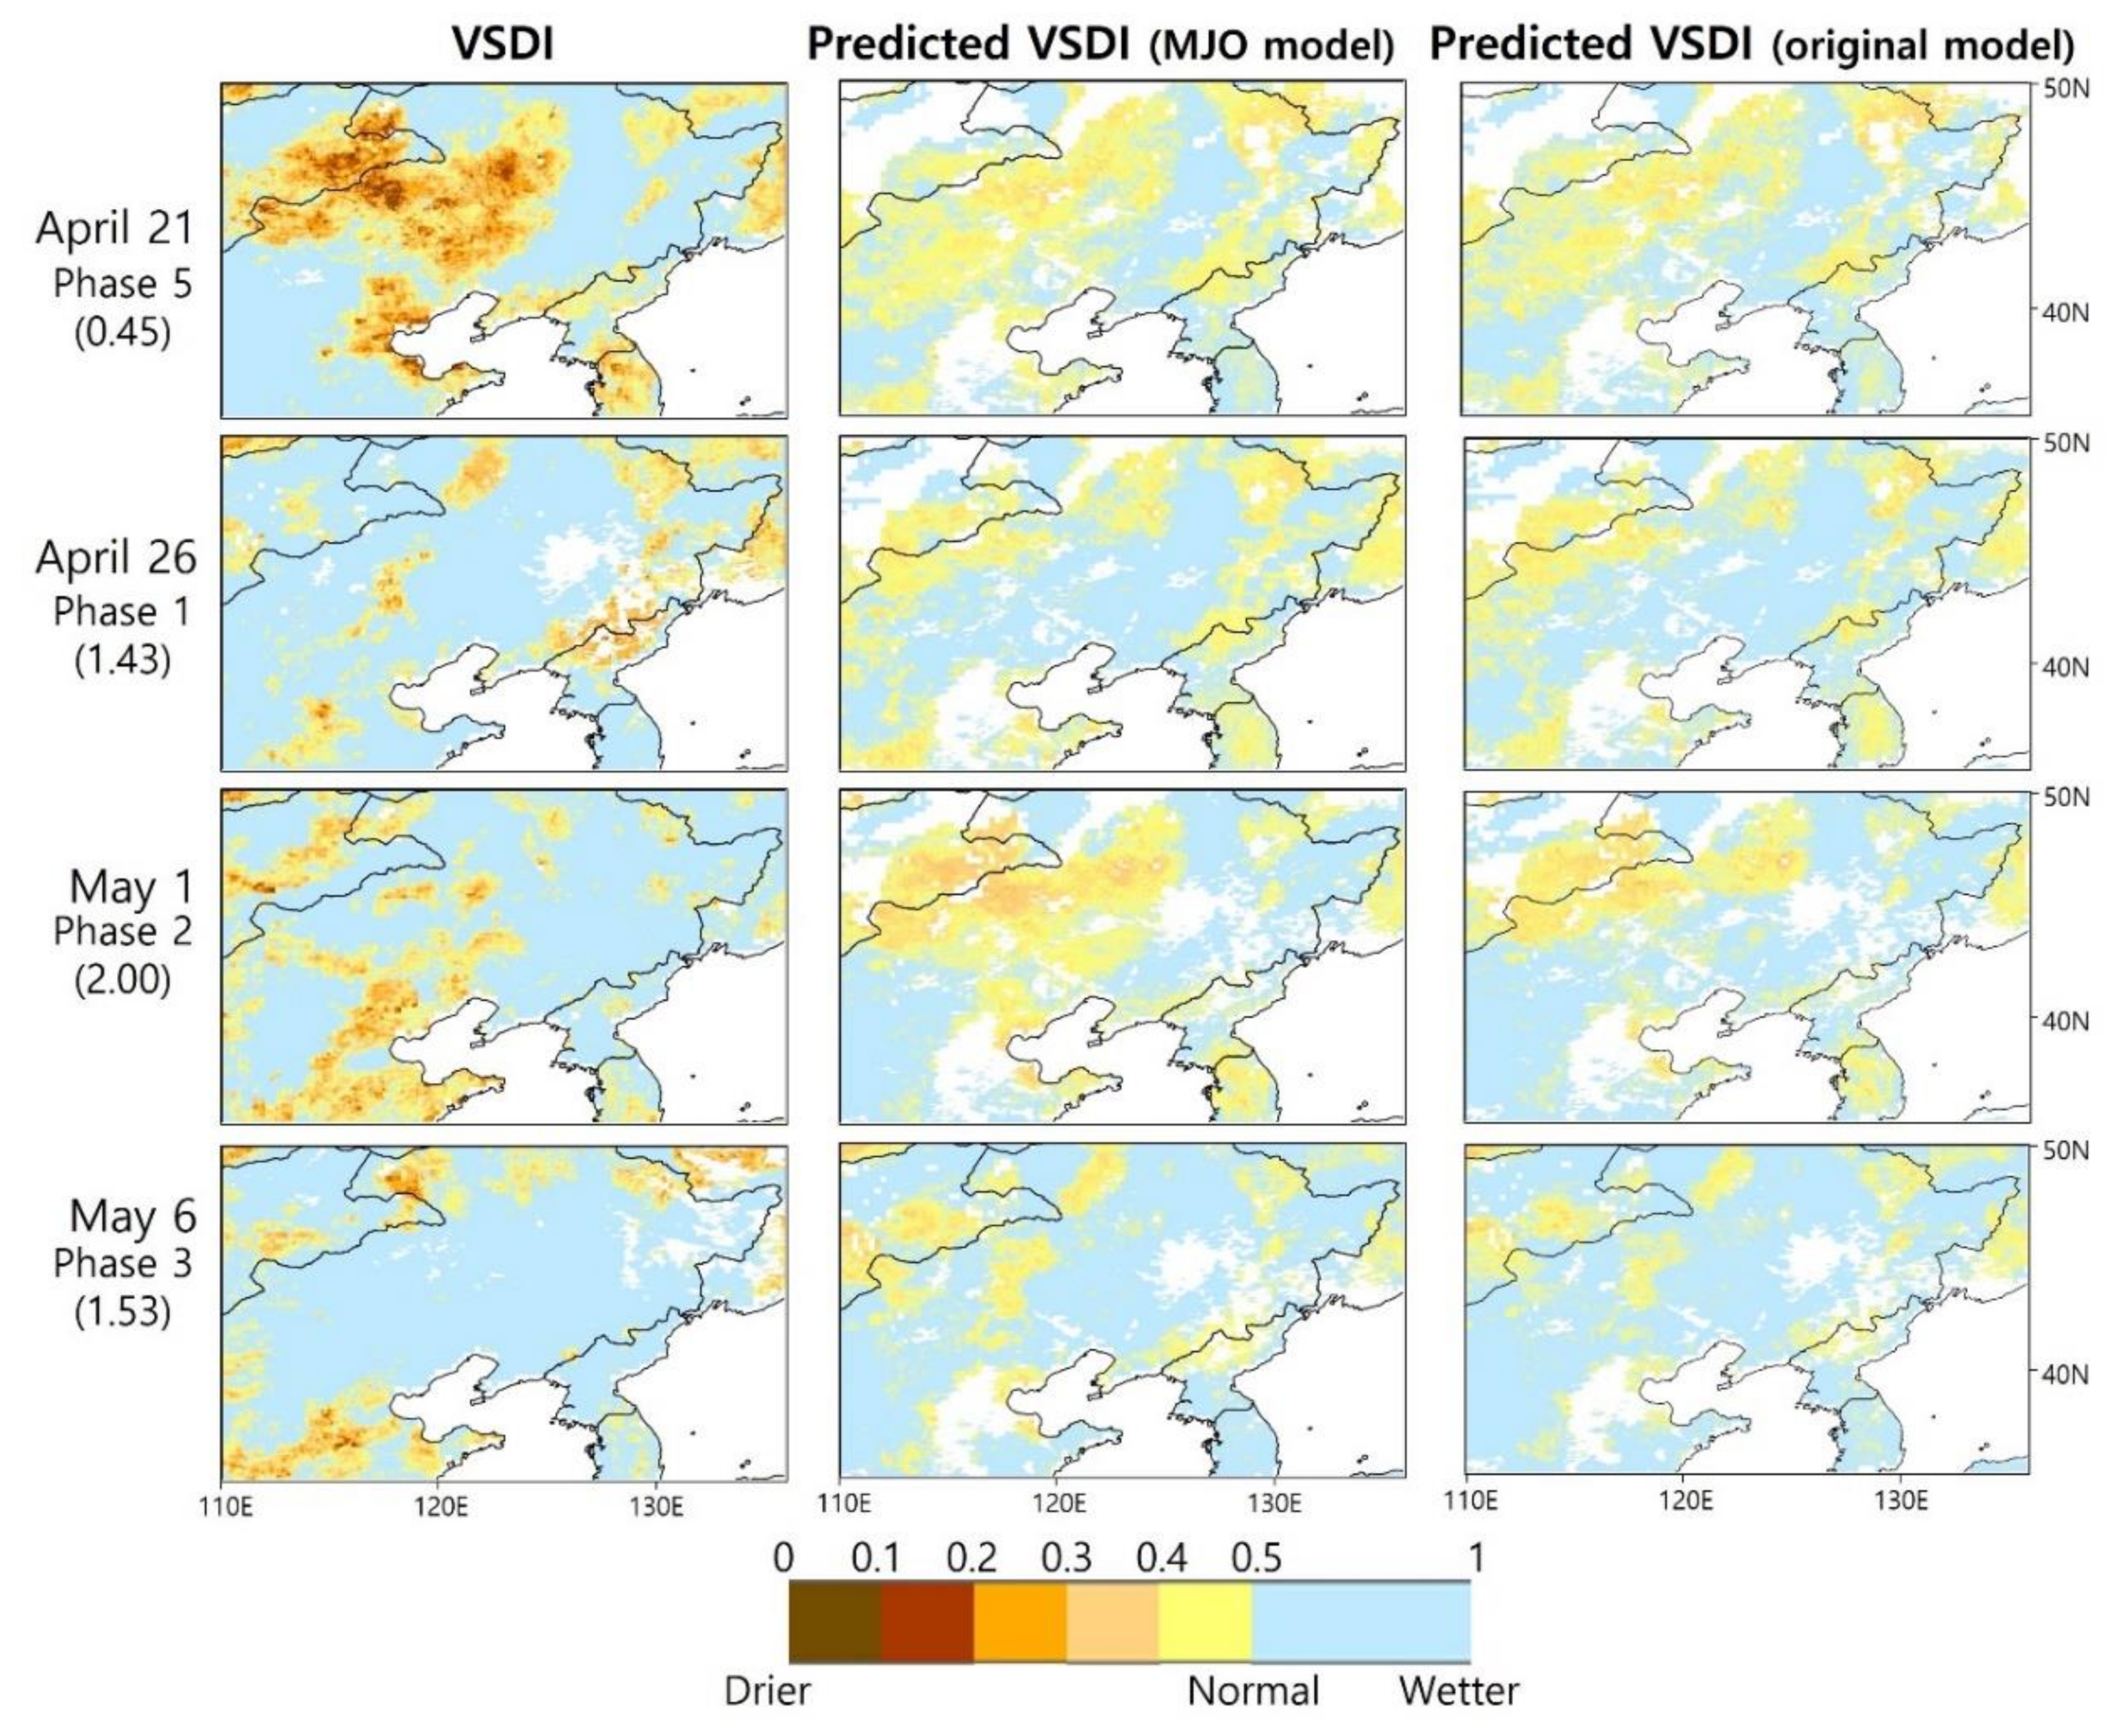
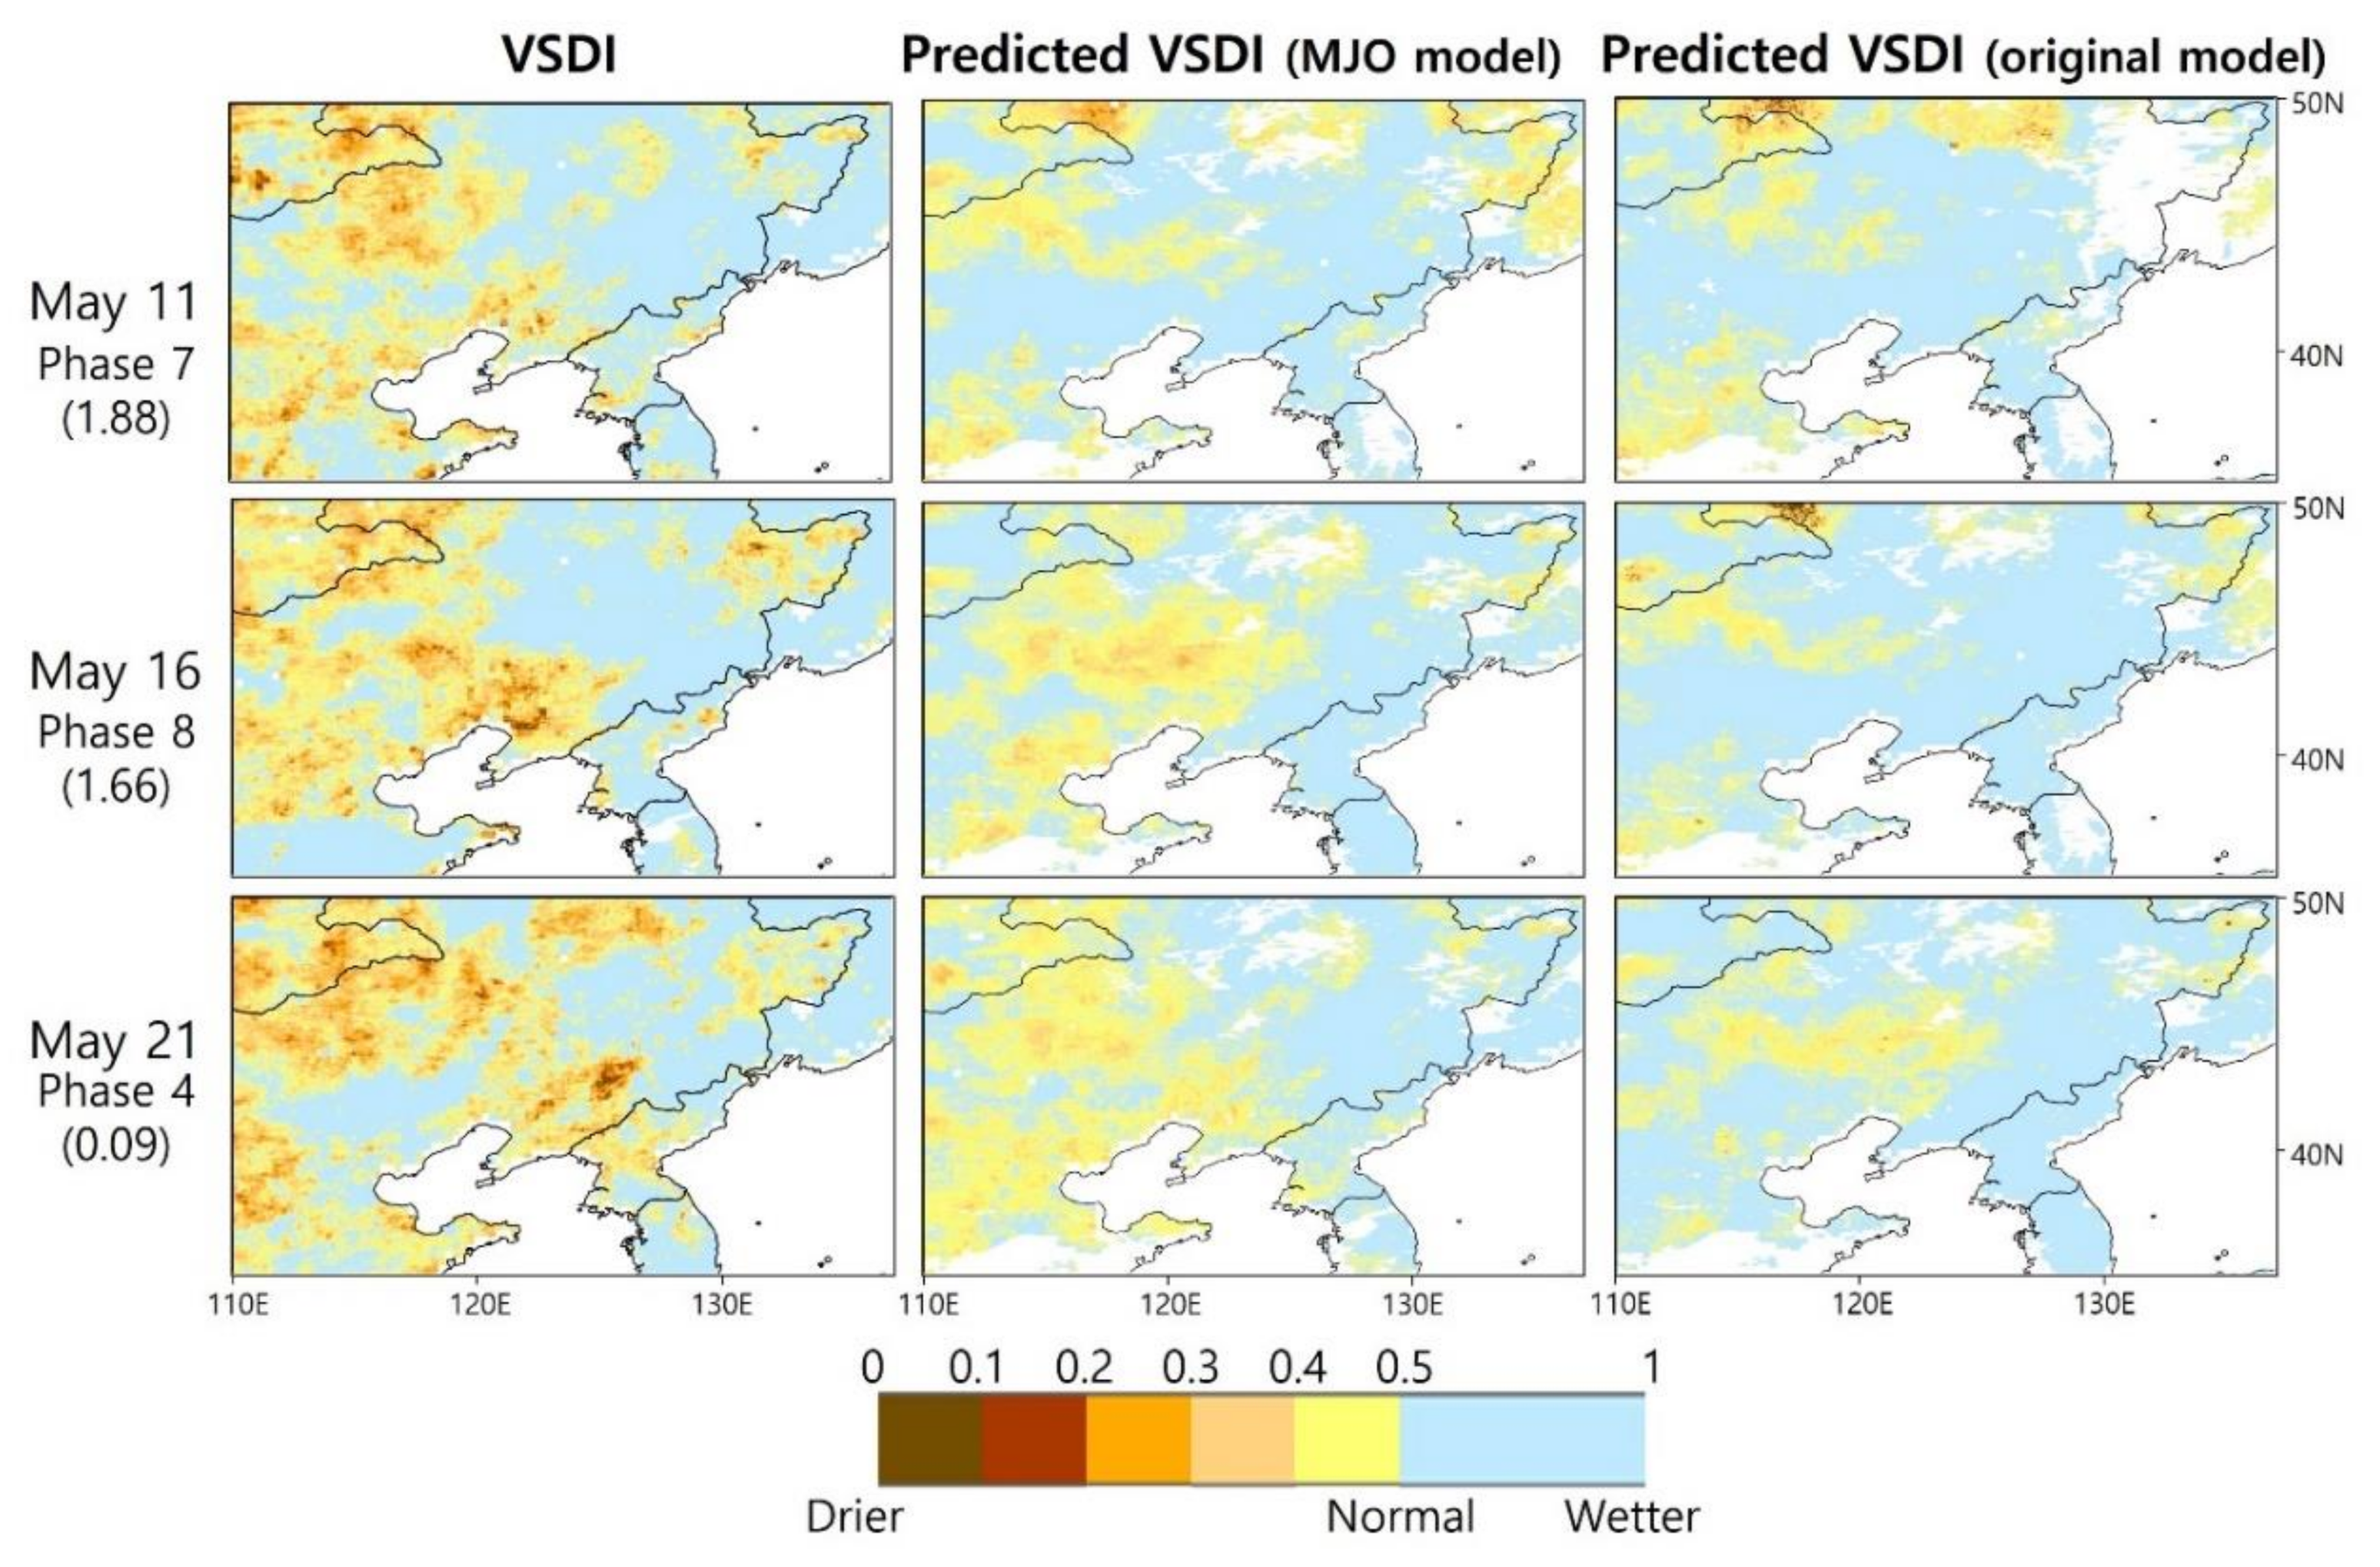
The spatial distribution of drought conditions in the northeast Asia (dashed rectangles in Figure 3) from the original VSDI and predicted VSDI from the two models (with MJO and without MJO) were compared with the pentad scale in 2010 and 2011 (Figure 7 and Figure 8). Drought prediction maps were produced using the ‘leave-one-year-out’ cross validation results. In 2010, drought eased from 21 April to 26 April, and drought intensified from 26 April to 1 May. Then, drought relieved again from 1 May to 6 May. The MJO-based prediction model predicted drought conditions well in both eased and intensified drought conditions during four pentads (Figure 7). It is noticeable that the predicted VSDIs from the MJO model caught the inverse patterns that were not learned from previous drought conditions. The predicted VSDIs from the original model (without MJO) did not catch the patterns, especially on 1 May. 26 April was at the MJO phase 1 and 1 May was at phase 2, and this region became dry from phase 1 to phase 2 (refer to Figure 3). The MJO-based prediction model was able to predict the drought near 40°N and 120°E, but the original prediction model did not predict the drought (Figure 7). In Figure 8, the drought evolved from 11 May to 21 May in 2011, and the predicted VSDIs from the MJO model also matched well with actual VSDI. Similarly, 11 May and 16 May were at the phases 7 and 8, respectively, and the change to drier conditions from phases 7 to 8 is shown in Figure 3. As expected, while the original prediction model did not predict the intensified drought, the MJO-based prediction model successfully predicted this drought (Figure 8).
5. Discussion
The improvement in the performance of the drought prediction model through the application of RMM MJO indices is most striking for SDCI, which does not contain a soil moisture component (Figure 5). The ratio of soil moisture variability on a 30–90 day timescale is much higher than those of the temperature and precipitation (refer to Figure 4). It means that predictions of MIDI and VSDI without using MJO indices as the inputs already have a MJO-related intra-seasonal variation component due to soil moisture. The modeling performance of SDCI in the MJO-based prediction models increased from 0.29 to 0.70 in r and from 42% to 32% in RMSE. The inclusion of MJO indices creates a substantial improvement in the prediction skill of SDCI, which consists of PCI, TCI, and VCI, because the MJO-related intra-seasonal variability is included less in PCI and TCI than in SMCI (Figure 4). VSDI, where soil moisture accounts for half of the index, shows a prediction skill of 0.57 without using MJO information for the drought prediction because the surface conditions themselves already contain the MJO-related intra-seasonal memory.
The performance of the MJO-based prediction model was also better than that of the original prediction model for VSDI, although the original prediction model still worked well, unlike the other drought indices. Since precipitation fluctuates more during short-term periods than the other variables such as soil moisture, LST, and NDVI, precipitation is considered inadequate for conducting short-term predictions of drought. In addition, most of the drought conditions in SDCI and MIDI during the study period were dry (less than 0.4) because most of the PCI values were less than normal (0.5) due to a large gap between the maximum and minimum values of precipitation during one pentad. Therefore, VSDI is regarded as adequate for monitoring and predicting drought in short periods of time. In addition, the performance of the three prediction models were saturated around r = ~0.7, which suggests that there is still a possibility that drought predictions can be improved through further understanding of the physical drought processes over East Asia using climate variabilities on other timescales.
As each of the RMM values is determined by each of the EOF leading modes, the RMM1 is more important in drought forecasting than the RMM2 (Table 2) due to the highest variance explanation of EOF1 [64]. The variable importance of latitude was higher than longitude in the original models, while longitude contributed more in the MJO-based models. MJO variability, that primarily tends to eastward propagation in the equatorial belt, influences the horizontal anomaly of the teleconnection pattern [68]. Thus, the geographical MJO propagation causes longitude to contribute more than latitude in the MJO-based models.
Although the spatial pattern of the predicted VSDI was well matched with actual VSDI, the severity of the drought in the predicted VSDI was relatively overestimated. The dynamic range of the predicted VSDI was slightly smaller than that of the actual VSDI because random forest tries to produce results with fewer errors, which leads to the values trending closer to the mean value when there are not many extreme samples [13,49]. Although it is difficult to predict a sudden change in drought conditions (wet to dry or dry to wet) considering only the previous patterns of droughts [25,69,70], the MJO-based prediction models can improve on that limitation. In particular, MJO-based prediction models are very useful in predicting drought with high resolution (5 km) in a short period of time.
6. Conclusions
The frequency of rapidly developing droughts in short periods of time (e.g., flash droughts) has increased, often leading to damage to agricultural systems. Short-term prediction of drought is important to provide accurate information to decision makers. In this study, short-term prediction models of drought considering climate variability were developed using random forest. Three satellite-based drought indices—SDCI, MIDI, and VSDI—were predicted with a very short time scale (one pentad), and RMM MJO indices were used to improve drought predictability because MJO has a short timescale variability and is closely related to drought factors including precipitation, temperature, and soil moisture. The effect of MJO was evaluated through the comparison between two models (i.e., one with RMM MJO indices and the other without RMM MJO indices). The performance of the drought prediction models, including the RMM MJO indices, improved for all three drought indices, implying the importance of sub-seasonal climate variability in drought prediction. However, there are differences in the performance improvement among the three drought indices. The performance increase was the greatest for SDCI and the least for VSDI. As stated before, since soil moisture includes the intra-seasonal variability of MJO, VSDI with a high portion (0.5) of soil moisture resulted in less improvement than MIDI (0.3) and SDCI (0). VSDI, which modified SDCI and MIDI, was found to be the most acceptable drought index to predict and monitor drought in a short-period of time because soil moisture is more adequate than precipitation for monitoring drought on a short timescale. Although RMM MJO indices contributed to the enhancement of drought prediction, there is still a limitation. The performances of drought prediction models were saturated to 0.7 in correlation in all three drought indices. Therefore, other factors including interannual climate variabilities, such as ENSO, AMO and local or regional characteristics including topography and land use, should be further investigated to improve drought prediction accuracy.
Supplementary Materials
The following are available online at https://www.mdpi.com/2072-4292/10/11/1811/s1, further information on model verification. Table S1. Coefficient of determination (R2) between the target drought indices and one- to three-pentad lagged drought indices, and between target drought indices and predicted drought indices for six selected points (Point 1: 17°N and 80°E; Point 2: 34°N and 102°E; Point 3: 42°N and 123°E; Point 4: 47°N and 102°E; Point 5: 48°N and 83°E; and Point 6: 49°N and 112°E). Most of the cases, the predicted drought indices showed higher R2 with the target drought indices than the time lagged drought indices did. The highest R2 values are shown in bold for each point; Figure S1. Time series graphs of the very short-term drought index (VSDI) and the predicted VSDI for the six selected points; Figure S2. Time series graphs of the microwave integrated drought index (MIDI) and the predicted MIDI for the six selected points; Figure S3. Time series graphs of the scaled drought condition index (SDCI) and the predicted SDCI for the six selected points.
Author Contributions
S.P. and E.S. led manuscript writing and contributed to the data analysis and research design. J.I. supervised this study, contributed to the research design and manuscript writing, and served as the corresponding author. D.K. contributed to data processing and analysis. M.-I.L. contributed to the discussion of the results and manuscript writing.
Funding
This research was supported by the Space Technology Development Program and the Basic Science Research Program through the National Research Foundation of Korea (NRF) funded by the Ministry of Science, ICT, and Future Planning and the Ministry of Education of Korea, respectively (NRF-2017M1A3A3A02015981; NRF-2017R1D1A1B03028129). D.K. was supported by the Fostering Core Leaders of the Future Basic Science Program of the National Research Foundation of Korea (NRF-2014H1A8A1022342).
Conflicts of Interest
The authors declare no conflict of interest.
References
- Cebrián, A.C.; Abaurrea, J. Drought analysis based on a marked cluster poisson model. J. Hydrometeorol. 2006, 7, 713–723. [Google Scholar] [CrossRef]
- Padhee, S.; Nikam, B.; Dutta, S.; Aggarwal, S. Using satellite-based soil moisture to detect and monitor spatiotemporal traces of agricultural drought over Bundelkhand region of India. GIScience Remote Sens. 2017, 54, 144–166. [Google Scholar] [CrossRef]
- Rao, M.; Silber-Coats, Z.; Powers, S.; Fox, L.; Ghulam, A. Mapping drought-impacted vegetation stress in California using remote sensing. GIScience Remote Sens. 2017, 54, 185–201. [Google Scholar] [CrossRef]
- Zhang, L.; Jiao, W.; Zhang, H.; Huang, C.; Tong, Q. Studying drought phenomena in the continental united states in 2011 and 2012 using various drought indices. Remote Sens. Environ. 2017, 190, 96–106. [Google Scholar] [CrossRef]
- Bhuiyan, C.; Saha, A.; Bandyopadhyay, N.; Kogan, F. Analyzing the impact of thermal stress on vegetation health and agricultural drought—A case study from Gujarat, India. GIScience Remote Sens. 2017, 54, 678–699. [Google Scholar] [CrossRef]
- Muriithi, F.; Yu, D.; Robila, S. Vegetation response to intensive commercial horticulture and environmental changes within watersheds in central highlands, Kenya, using AVHRR NDVI data. GIScience Remote Sens. 2016, 53, 1–21. [Google Scholar] [CrossRef]
- Martínez-Fernández, J.; González-Zamora, A.; Sánchez, N.; Gumuzzio, A.; Herrero-Jiménez, C. Satellite soil moisture for agricultural drought monitoring: Assessment of the SMOS derived soil water deficit index. Remote Sens. Environ. 2016, 177, 277–286. [Google Scholar] [CrossRef]
- Tran, H.T.; Campbell, J.B.; Tran, T.D.; Tran, H.T. Monitoring drought vulnerability using multispectral indices observed from sequential remote sensing (case study: Tuy Phong, Binh Thuan, Vietnam). GIScience Remote Sens. 2017, 54, 167–184. [Google Scholar] [CrossRef]
- Wallace, C.; Thenkabail, P.; Rodriguez, J.; Brown, M. Fallow-land Algorithm based on Neighborhood and Temporal Anomalies (FANTA) to map planted versus fallowed croplands using MODIS data to assist in drought studies leading to water and food security assessments. GIScience Remote Sens. 2017, 54, 258–282. [Google Scholar] [CrossRef] [Green Version]
- Van Loon, A.F.; Gleeson, T.; Clark, J.; Van Dijk, A.I.; Stahl, K.; Hannaford, J.; Di Baldassarre, G.; Teuling, A.J.; Tallaksen, L.M.; Uijlenhoet, R. Drought in the anthropocene. Nat. Geosci. 2016, 9, 89–91. [Google Scholar] [CrossRef]
- McKee, T.B. Drought monitoring with multiple time scales. In Proceedings of the 9th Conference on Applied Climatology, Boston, MA, USA, 15–20 January 1995. [Google Scholar]
- Kogan, F.N. Remote sensing of weather impacts on vegetation in non-homogeneous areas. Int. J. Remote Sens. 1990, 11, 1405–1419. [Google Scholar] [CrossRef]
- Park, S.; Im, J.; Jang, E.; Rhee, J. Drought assessment and monitoring through blending of multi-sensor indices using machine learning approaches for different climate regions. Agric. For. Meteorol. 2016, 216, 157–169. [Google Scholar] [CrossRef]
- Kogan, F. Application of vegetation index and brightness temperature for drought detection. Adv. Space Res. 1995, 15, 91–100. [Google Scholar] [CrossRef]
- Keshavarz, M.R.; Vazifedoust, M.; Alizadeh, A. Drought monitoring using a Soil Wetness Deficit Index (SWDI) derived from MODIS satellite data. Agric. Water Manag. 2014, 132, 37–45. [Google Scholar] [CrossRef]
- Rhee, J.; Im, J.; Carbone, G.J. Monitoring agricultural drought for arid and humid regions using multi-sensor remote sensing data. Remote Sens. Environ. 2010, 114, 2875–2887. [Google Scholar] [CrossRef]
- Zhang, A.; Jia, G. Monitoring meteorological drought in semiarid regions using multi-sensor microwave remote sensing data. Remote Sens. Environ. 2013, 134, 12–23. [Google Scholar] [CrossRef]
- Svoboda, M.; LeComte, D.; Hayes, M.; Heim, R.; Gleason, K.; Angel, J.; Rippey, B.; Tinker, R.; Palecki, M.; Stooksbury, D. The drought monitor. Bull. Am. Meteorol. Soc. 2002, 83, 1181–1190. [Google Scholar] [CrossRef]
- Brown, J.F.; Wardlow, B.D.; Tadesse, T.; Hayes, M.J.; Reed, B.C. The vegetation drought response index (VegDRI): A new integrated approach for monitoring drought stress in vegetation. GIScience Remote Sens. 2008, 45, 16–46. [Google Scholar] [CrossRef]
- Tadesse, T.; Champagne, C.; Wardlow, B.D.; Hadwen, T.A.; Brown, J.F.; Demisse, G.B.; Bayissa, Y.A.; Davidson, A.M. Building the vegetation drought response index for Canada (VegDRI-Canada) to monitor agricultural drought: First results. GIScience Remote Sens. 2017, 54, 230–257. [Google Scholar] [CrossRef]
- Lorenz, D.J.; Otkin, J.A.; Svoboda, M.; Hain, C.R.; Anderson, M.C.; Zhong, Y. Predicting US Drought Monitor states using precipitation, soil moisture, and evapotranspiration anomalies. Part I: Development of a nondiscrete USDM index. J. Hydrometeorol. 2017, 18, 1943–1962. [Google Scholar] [CrossRef]
- Otkin, J.A.; Anderson, M.C.; Hain, C.; Svoboda, M. Examining the relationship between drought development and rapid changes in the evaporative stress index. J. Hydrometeorol. 2014, 15, 938–956. [Google Scholar] [CrossRef]
- Mishra, A.K.; Singh, V.P. Drought modeling—A review. J. Hydrol. 2011, 403, 157–175. [Google Scholar] [CrossRef]
- Han, P.; Wang, P.X.; Zhang, S.Y.; Zhu, D.H. Drought forecasting based on the remote sensing data using Arima models. Math. Comput. Model. 2010, 51, 1398–1403. [Google Scholar] [CrossRef]
- AghaKouchak, A. A multivariate approach for persistence-based drought prediction: Application to the 2010–2011 east Africa drought. J. Hydrol. 2015, 526, 127–135. [Google Scholar] [CrossRef]
- Mo, K.C.; Shukla, S.; Lettenmaier, D.P.; Chen, L.C. Do climate forecast system (CFSV2) forecasts improve seasonal soil moisture prediction? Geophys. Res. Lett. 2012, 39. [Google Scholar] [CrossRef]
- Lyon, B.; Bell, M.A.; Tippett, M.K.; Kumar, A.; Hoerling, M.P.; Quan, X.-W.; Wang, H. Baseline probabilities for the seasonal prediction of meteorological drought. J. Appl. Meteorol. Clim. 2012, 51, 1222–1237. [Google Scholar] [CrossRef]
- Belayneh, A.; Adamowski, J.; Khalil, B.; Ozga-Zielinski, B. Long-term SPI drought forecasting in the Awash River Basin in Ethiopia using wavelet neural network and wavelet support vector regression models. J. Hydrol. 2014, 508, 418–429. [Google Scholar] [CrossRef]
- Belayneh, A.; Adamowski, J. Standard precipitation index drought forecasting using neural networks, wavelet neural networks, and support vector regression. Appl. Comput. Intell. Soft Comput. 2012, 2012. [Google Scholar] [CrossRef]
- Özger, M.; Mishra, A.K.; Singh, V.P. Long lead time drought forecasting using a wavelet and fuzzy logic combination model: A case study in Texas. J. Hydrometeorol. 2012, 13, 284–297. [Google Scholar] [CrossRef]
- Otkin, J.A.; Anderson, M.C.; Hain, C.; Svoboda, M. Using temporal changes in drought indices to generate probabilistic drought intensification forecasts. J. Hydrometeorol. 2015, 16, 88–105. [Google Scholar] [CrossRef]
- Otkin, J.A.; Anderson, M.C.; Hain, C.; Mladenova, I.E.; Basara, J.B.; Svoboda, M. Examining rapid onset drought development using the thermal infrared—Based evaporative stress index. J. Hydrometeorol. 2013, 14, 1057–1074. [Google Scholar] [CrossRef]
- Wang, B.; Wu, R.; Fu, X. Pacific–East Asian teleconnection: How does ENSO affect East Asian climate? J. Clim. 2000, 13, 1517–1536. [Google Scholar] [CrossRef]
- Yang, J.; Liu, Q.; Xie, S.P.; Liu, Z.; Wu, L. Impact of the Indian Ocean SST basin mode on the Asian summer monsoon. Geophys. Res. Lett. 2007, 34. [Google Scholar] [CrossRef] [Green Version]
- Wu, Z.; Wang, B.; Li, J.; Jin, F.F. An empirical seasonal prediction model of the East Asian summer monsoon using ENSO and NAO. J. Geophys. Res. Atmos. 2009, 114. [Google Scholar] [CrossRef]
- Deo, R.C.; Kisi, O.; Singh, V.P. Drought forecasting in eastern Australia using multivariate adaptive regression spline, least square support vector machine and M5Tree model. Atmos. Res. 2017, 184, 149–175. [Google Scholar] [CrossRef] [Green Version]
- Rhee, J.; Im, J. Meteorological drought forecasting for ungauged areas based on machine learning: Using long-range climate forecast and remote sensing data. Agric. For. Meteorol. 2017, 237, 105–122. [Google Scholar] [CrossRef]
- Morid, S.; Smakhtin, V.; Bagherzadeh, K. Drought forecasting using artificial neural networks and time series of drought indices. Int. J. Clim. 2007, 27, 2103–2111. [Google Scholar] [CrossRef] [Green Version]
- Wang, L.; Yuan, X.; Xie, Z.; Wu, P.; Li, Y. Increasing flash droughts over china during the recent global warming hiatus. Sci. Rep. 2016, 6, 30571. [Google Scholar] [CrossRef] [PubMed]
- Wallander, S.; Aillery, M.; Hellerstein, D.; Hand, M. The Role of Conservation Programs in Drought Risk Adaptation. Economic Research Service ERR 148. Available online: http://ssrn.com/abstract=2735043 (accessed on 19 April 2013).
- Mo, K.C.; Lettenmaier, D.P. Heat wave flash droughts in decline. Geophys. Res. Lett. 2015, 42, 2823–2829. [Google Scholar] [CrossRef] [Green Version]
- Madden, R.A.; Julian, P.R. Detection of a 40–50 day oscillation in the zonal wind in the tropical Pacific. J. Atmos. Sci. 1971, 28, 702–708. [Google Scholar] [CrossRef]
- Jeong, J.H.; Ho, C.H.; Kim, B.M.; Kwon, W.T. Influence of the Madden-Julian oscillation on wintertime surface air temperature and cold surges in East Asia. J. Geophys. Res. Atmos. 2005, 110. [Google Scholar] [CrossRef]
- Jeong, J.-H.; Kim, B.-M.; Ho, C.-H.; Noh, Y.-H. Systematic variation in wintertime precipitation in East Asia by MJO-induced extratropical vertical motion. J. Clim. 2008, 21, 788–801. [Google Scholar] [CrossRef]
- Peng, J.; Loew, A.; Crueger, T. The relationship between the Madden-Julian oscillation and the land surface soil moisture. Remote Sens. Environ. 2017, 203, 226–239. [Google Scholar] [CrossRef]
- Chen, X.; Li, C.; Ling, J.; Tan, Y. Impact of East Asian winter monsoon on MJO over the equatorial western Pacific. Theor. Appl. Clim. 2017, 127, 551–561. [Google Scholar] [CrossRef]
- Lü, J.; Ju, J.; Ren, J.; Gan, W. The influence of the Madden-Julian oscillation activity anomalies on Yunnan’s extreme drought of 2009–2010. Sci. China Earth Sci. 2012, 55, 98–112. [Google Scholar] [CrossRef]
- Ke, Y.; Im, J.; Park, S.; Gong, H. Spatiotemporal downscaling approaches for monitoring 8-day 30 m actual evapotranspiration. ISPRS J. Photogramm. Remote Sens. 2017, 126, 79–93. [Google Scholar] [CrossRef]
- Im, J.; Park, S.; Rhee, J.; Baik, J.; Choi, M. Downscaling of AMSR-E soil moisture with MODIS products using machine learning approaches. Environ. Earth Sci. 2016, 75, 1120. [Google Scholar] [CrossRef]
- Park, S.; Im, J.; Park, S.; Rhee, J. Drought monitoring using high resolution soil moisture through multi-sensor satellite data fusion over the Korean peninsula. Agric. For. Meteorol. 2017, 237, 257–269. [Google Scholar] [CrossRef]
- Abelen, S.; Seitz, F.; Abarca-del-Rio, R.; Güntner, A. Droughts and floods in the La Plata basin in soil moisture data and GRACE. Remote Sens. 2015, 7, 7324–7349. [Google Scholar] [CrossRef]
- Pablos, M.; Martínez-Fernández, J.; Sánchez, N.; González-Zamora, Á. Temporal and Spatial Comparison of Agricultural Drought Indices from Moderate Resolution Satellite Soil Moisture Data over Northwest Spain. Remote Sens. 2017, 9, 1168. [Google Scholar] [CrossRef]
- Mishra, A.; Vu, T.; Veettil, A.V.; Entekhabi, D. Drought monitoring with soil moisture active passive (SMAP) measurements. J. Hydrol. 2017, 552, 620–632. [Google Scholar] [CrossRef]
- Holben, B.N. Characteristics of maximum-value composite images from temporal AVHRR data. Int. J. Remote Sens. 1986, 7, 1417–1434. [Google Scholar] [CrossRef] [Green Version]
- Liu, Y.Y.; Dorigo, W.A.; Parinussa, R.; de Jeu, R.A.; Wagner, W.; McCabe, M.F.; Evans, J.; Van Dijk, A. Trend-preserving blending of passive and active microwave soil moisture retrievals. Remote Sens. Environ. 2012, 123, 280–297. [Google Scholar] [CrossRef]
- Dorigo, W.; Wagner, W.; Albergel, C.; Albrecht, F.; Balsamo, G.; Brocca, L.; Chung, D.; Ertl, M.; Forkel, M.; Gruber, A. ESA CCI soil moisture for improved earth system understanding: State-of-the art and future directions. Remote Sens. Environ. 2017, 203, 185–215. [Google Scholar] [CrossRef]
- Gruber, A.; Dorigo, W.A.; Crow, W.; Wagner, W. Triple collocation-based merging of satellite soil moisture retrievals. IEEE Trans. Geosci. Remote Sens. 2017, 55, 6780–6792. [Google Scholar] [CrossRef]
- Conroy, J.L.; Overpeck, J.T. Regionalization of present-day precipitation in the greater monsoon region of Asia. J. Clim. 2011, 24, 4073–4095. [Google Scholar] [CrossRef]
- Best, M.; Pryor, M.; Clark, D.; Rooney, G.; Essery, R.; Ménard, C.; Edwards, J.; Hendry, M.; Porson, A.; Gedney, N. The Joint UK Land Environment Simulator (JULES), model description—Part 1: Energy and water fluxes. Geosci. Model Dev. 2011, 4, 677–699. [Google Scholar] [CrossRef]
- Sheffield, J.; Goteti, G.; Wood, E.F. Development of a 50-year high-resolution global dataset of meteorological forcings for land surface modeling. J. Clim. 2006, 19, 3088–3111. [Google Scholar] [CrossRef]
- Kalnay, E.; Kanamitsu, M.; Kistler, R.; Collins, W.; Deaven, D.; Gandin, L.; Iredell, M.; Saha, S.; White, G.; Woollen, J. The NCEP/NCAR 40-year reanalysis project. Bull. Am. Meteorol. Soc. 1996, 77, 437–471. [Google Scholar] [CrossRef]
- Mitchell, K.E.; Lohmann, D.; Houser, P.R.; Wood, E.F.; Schaake, J.C.; Robock, A.; Cosgrove, B.A.; Sheffield, J.; Duan, Q.; Luo, L. The multi-institution north American Land Data Assimilation System (NLDAS): Utilizing multiple GCIP products and partners in a continental distributed hydrological modeling system. J. Geophys. Res. Atmos. 2004, 109. [Google Scholar] [CrossRef]
- Stackhouse, P.; Gupta, S.; Cox, S.; Mikovitz, J.; Zhang, T.; Chiacchio, M. 12-year surface radiation budget data set. Gewex News 2004, 14, 10–12. [Google Scholar]
- Wheeler, M.C.; Hendon, H.H. An all-season real-time multivariate MJO index: Development of an index for monitoring and prediction. Mon. Weather Rev. 2004, 132, 1917–1932. [Google Scholar] [CrossRef]
- Hendon, H.H.; Wheeler, M.C.; Zhang, C. Seasonal dependence of the MJO–ENSO relationship. J. Clim. 2007, 20, 531–543. [Google Scholar] [CrossRef]
- Seneviratne, S.I.; Koster, R.D.; Guo, Z.; Dirmeyer, P.A.; Kowalczyk, E.; Lawrence, D.; Liu, P.; Mocko, D.; Lu, C.-H.; Oleson, K.W. Soil moisture memory in AGCM simulations: Analysis of global land–atmosphere coupling experiment (GLACE) data. J. Hydrometeorol. 2006, 7, 1090–1112. [Google Scholar] [CrossRef]
- Park, S.; Park, S.; Im, J.; Rhee, J.; Shin, J.; Park, J.D. Downscaling GLDAS soil moisture data in East Asia through fusion of multi-sensors by optimizing modified regression trees. Water 2017, 9, 332. [Google Scholar] [CrossRef]
- Stan, C.; Straus, D.M.; Frederiksen, J.S.; Lin, H.; Maloney, E.D.; Schumacher, C. Review of tropical-extratropical teleconnections on intraseasonal time scales. Rev. Geophys. 2017, 55, 902–937. [Google Scholar] [CrossRef]
- Hao, Z.; Hao, F.; Singh, V.P.; Sun, A.Y.; Xia, Y. Probabilistic prediction of hydrologic drought using a conditional probability approach based on the meta-gaussian model. J. Hydrol. 2016, 542, 772–780. [Google Scholar] [CrossRef]
- Belayneh, A.; Adamowski, J.; Khalil, B.; Quilty, J. Coupling machine learning methods with wavelet transforms and the bootstrap and boosting ensemble approaches for drought prediction. Atmos. Res. 2016, 172, 37–47. [Google Scholar] [CrossRef]
Figure 1.
Study area with Moderate Resolution Imaging Spectroradiometer (MODIS) land-cover 2010 data. The representative 11 land-cover classes were aggregated from MODIS land-cover data that consists of 16 classes.
Figure 1.
Study area with Moderate Resolution Imaging Spectroradiometer (MODIS) land-cover 2010 data. The representative 11 land-cover classes were aggregated from MODIS land-cover data that consists of 16 classes.

Figure 2.
Flowchart of this study. 1-, 2- and 3-pentad before the date of the real-time multivariate Madden–Julian Oscillation (RMM MJO) indices and drought indices, latitude and longitude were used to predict drought.
Figure 2.
Flowchart of this study. 1-, 2- and 3-pentad before the date of the real-time multivariate Madden–Julian Oscillation (RMM MJO) indices and drought indices, latitude and longitude were used to predict drought.

Figure 3.
Composites of 30–90 days filtered surface air temperature (SAT) based on each of eight MJO phases during 22 spring seasons (April–May) of 1991–2012. Dashed rectangles indicate the domain of northeast Asia.
Figure 3.
Composites of 30–90 days filtered surface air temperature (SAT) based on each of eight MJO phases during 22 spring seasons (April–May) of 1991–2012. Dashed rectangles indicate the domain of northeast Asia.

Figure 4.
Variance of (a) SAT, (b) near-surface volumetric soil moisture, and (c) precipitation bandpass filtered for 30–90 days during 22 springs between 1991–2012, and (d–f) their ratios to total variance, respectively.
Figure 4.
Variance of (a) SAT, (b) near-surface volumetric soil moisture, and (c) precipitation bandpass filtered for 30–90 days during 22 springs between 1991–2012, and (d–f) their ratios to total variance, respectively.

Figure 5.
Modeling performances of the two drought prediction models (with MJO and without MJO) for three drought indices. Scatter plots with r, root mean square error (RMSE), and relative RMSE (rRMSE) (the percentage values mentioned in parentheses) were produced though validation.
Figure 5.
Modeling performances of the two drought prediction models (with MJO and without MJO) for three drought indices. Scatter plots with r, root mean square error (RMSE), and relative RMSE (rRMSE) (the percentage values mentioned in parentheses) were produced though validation.

Figure 6.
‘Leave-one-year-out’ validation of VSDI prediction model. Each pixel includes 9 pentads × 17 years’ data. Each pixel was processed as no data when the number of data was less than 50.
Figure 6.
‘Leave-one-year-out’ validation of VSDI prediction model. Each pixel includes 9 pentads × 17 years’ data. Each pixel was processed as no data when the number of data was less than 50.

Figure 7.
Comparison of temporal change of drought conditions between actual VSDI and predicted VSDIs from two models (with MJO and without MJO) in 2010. MJO phase and amplitude (parenthesis) at each day are indicated on the left. The region corresponds to the dashed rectangles in Figure 3.
Figure 7.
Comparison of temporal change of drought conditions between actual VSDI and predicted VSDIs from two models (with MJO and without MJO) in 2010. MJO phase and amplitude (parenthesis) at each day are indicated on the left. The region corresponds to the dashed rectangles in Figure 3.

Figure 8.
Comparison of temporal change of drought conditions between actual VSDI and predicted VSDIs from two models (with MJO and without MJO) in 2011. MJO phase and amplitude (parenthesis) at each day are indicated on the left. The region corresponds to the dashed rectangles in Figure 3.
Figure 8.
Comparison of temporal change of drought conditions between actual VSDI and predicted VSDIs from two models (with MJO and without MJO) in 2011. MJO phase and amplitude (parenthesis) at each day are indicated on the left. The region corresponds to the dashed rectangles in Figure 3.


Table 1.
Description of Input variables used in the proposed models with Madden–Julian Oscillation (MJO) for three drought indices: Scaled Drought Condition Index (SDCI), Microwave Integrated Drought Index (MIDI), and Very Short-term Drought Index (VSDI).
Table 1.
Description of Input variables used in the proposed models with Madden–Julian Oscillation (MJO) for three drought indices: Scaled Drought Condition Index (SDCI), Microwave Integrated Drought Index (MIDI), and Very Short-term Drought Index (VSDI).
| Variable | Description | Source |
|---|---|---|
| 1-P before drought index | 5 days before SDCI/MIDI/VSDI | MODIS, TRMM, ESA CCI |
| 2-P before drought index | 10 days before SDCI/MIDI/VSDI | MODIS, TRMM, ESA CCI |
| 3-P before drought index | 15 days before SDCI/MIDI/VSDI | MODIS, TRMM, ESA CCI |
| Latitude | Latitude (decimal) | - |
| Longitude | Longitude (decimal) | - |
| 1-P before RMM1 | 5 days before MJO RMM1 | Bureau of Meteorology (BOM) |
| 1-P before RMM2 | 5 days before MJO RMM2 | Bureau of Meteorology (BOM) |
| 2-P before RMM1 | 10 days before MJO RMM1 | Bureau of Meteorology (BOM) |
| 2-P before RMM2 | 10 days before MJO RMM2 | Bureau of Meteorology (BOM) |
| 3-P before RMM1 | 15 days before MJO RMM1 | Bureau of Meteorology (BOM) |
| 3-P before RMM2 | 15 days before MJO RMM2 | Bureau of Meteorology (BOM) |
Table 2.
Variable importance of two drought prediction models (with MJO and without MJO) for three drought indices.
Table 2.
Variable importance of two drought prediction models (with MJO and without MJO) for three drought indices.
| SDCI | MIDI | VSDI | ||||
|---|---|---|---|---|---|---|
| Variables | MJO-Based Model | Original Model | MJO-Based Model | Original Model | MJO-Based Model | Original Model |
| 1-P before drought index | 189.21 | 126.74 | 208.45 | 151.64 | 267.95 | 227.17 |
| 2-P before drought index | 144.38 | 66.42 | 146.00 | 81.43 | 128.91 | 107.89 |
| 3-P before drought index | 146.22 | 64.62 | 141.75 | 73.25 | 127.34 | 111.08 |
| Latitude | 205.26 | 117.25 | 150.36 | 85.28 | 92.67 | 79.32 |
| Longitude | 215.02 | 76.10 | 177.90 | 67.37 | 106.38 | 74.55 |
| 1-P before RMM1 | 144.23 | 133.19 | 130.05 | |||
| 1-P before RMM2 | 139.66 | 117.60 | 88.32 | |||
| 2-P before RMM1 | 110.21 | 110.71 | 127.19 | |||
| 2-P before RMM2 | 106.79 | 107.22 | 81.07 | |||
| 3-P before RMM1 | 113.44 | 114.50 | 103.56 | |||
| 3-P before RMM2 | 97.37 | 97.84 | 82.79 | |||
© 2018 by the authors. Licensee MDPI, Basel, Switzerland. This article is an open access article distributed under the terms and conditions of the Creative Commons Attribution (CC BY) license (http://creativecommons.org/licenses/by/4.0/).
Share and Cite
MDPI and ACS Style
Park, S.; Seo, E.; Kang, D.; Im, J.; Lee, M.-I. Prediction of Drought on Pentad Scale Using Remote Sensing Data and MJO Index through Random Forest over East Asia. Remote Sens. 2018, 10, 1811. https://doi.org/10.3390/rs10111811
AMA Style
Park S, Seo E, Kang D, Im J, Lee M-I. Prediction of Drought on Pentad Scale Using Remote Sensing Data and MJO Index through Random Forest over East Asia. Remote Sensing. 2018; 10(11):1811. https://doi.org/10.3390/rs10111811
Chicago/Turabian StylePark, Seonyoung, Eunkyo Seo, Daehyun Kang, Jungho Im, and Myong-In Lee. 2018. "Prediction of Drought on Pentad Scale Using Remote Sensing Data and MJO Index through Random Forest over East Asia" Remote Sensing 10, no. 11: 1811. https://doi.org/10.3390/rs10111811
Note that from the first issue of 2016, this journal uses article numbers instead of page numbers. See further details here.