Figure 1.
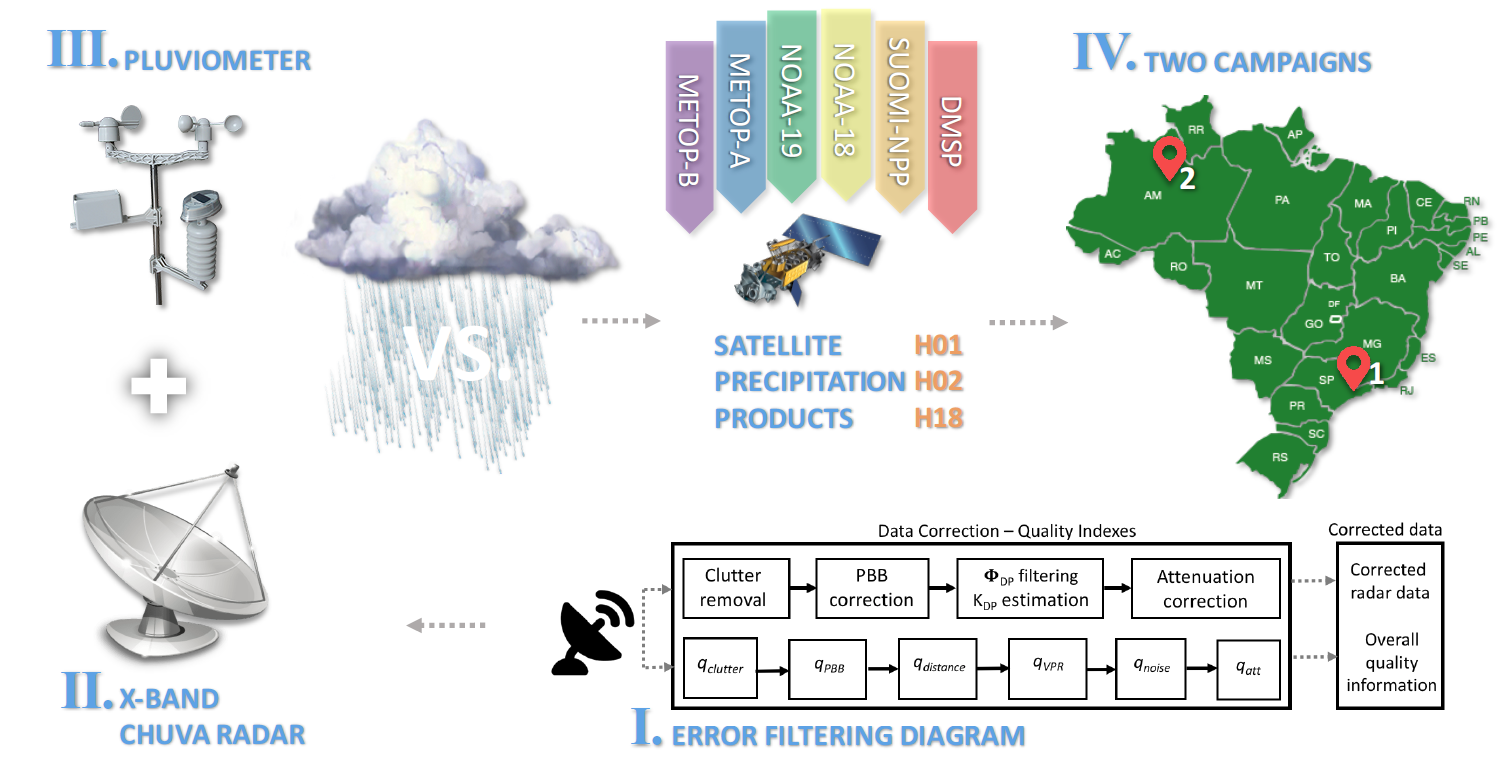
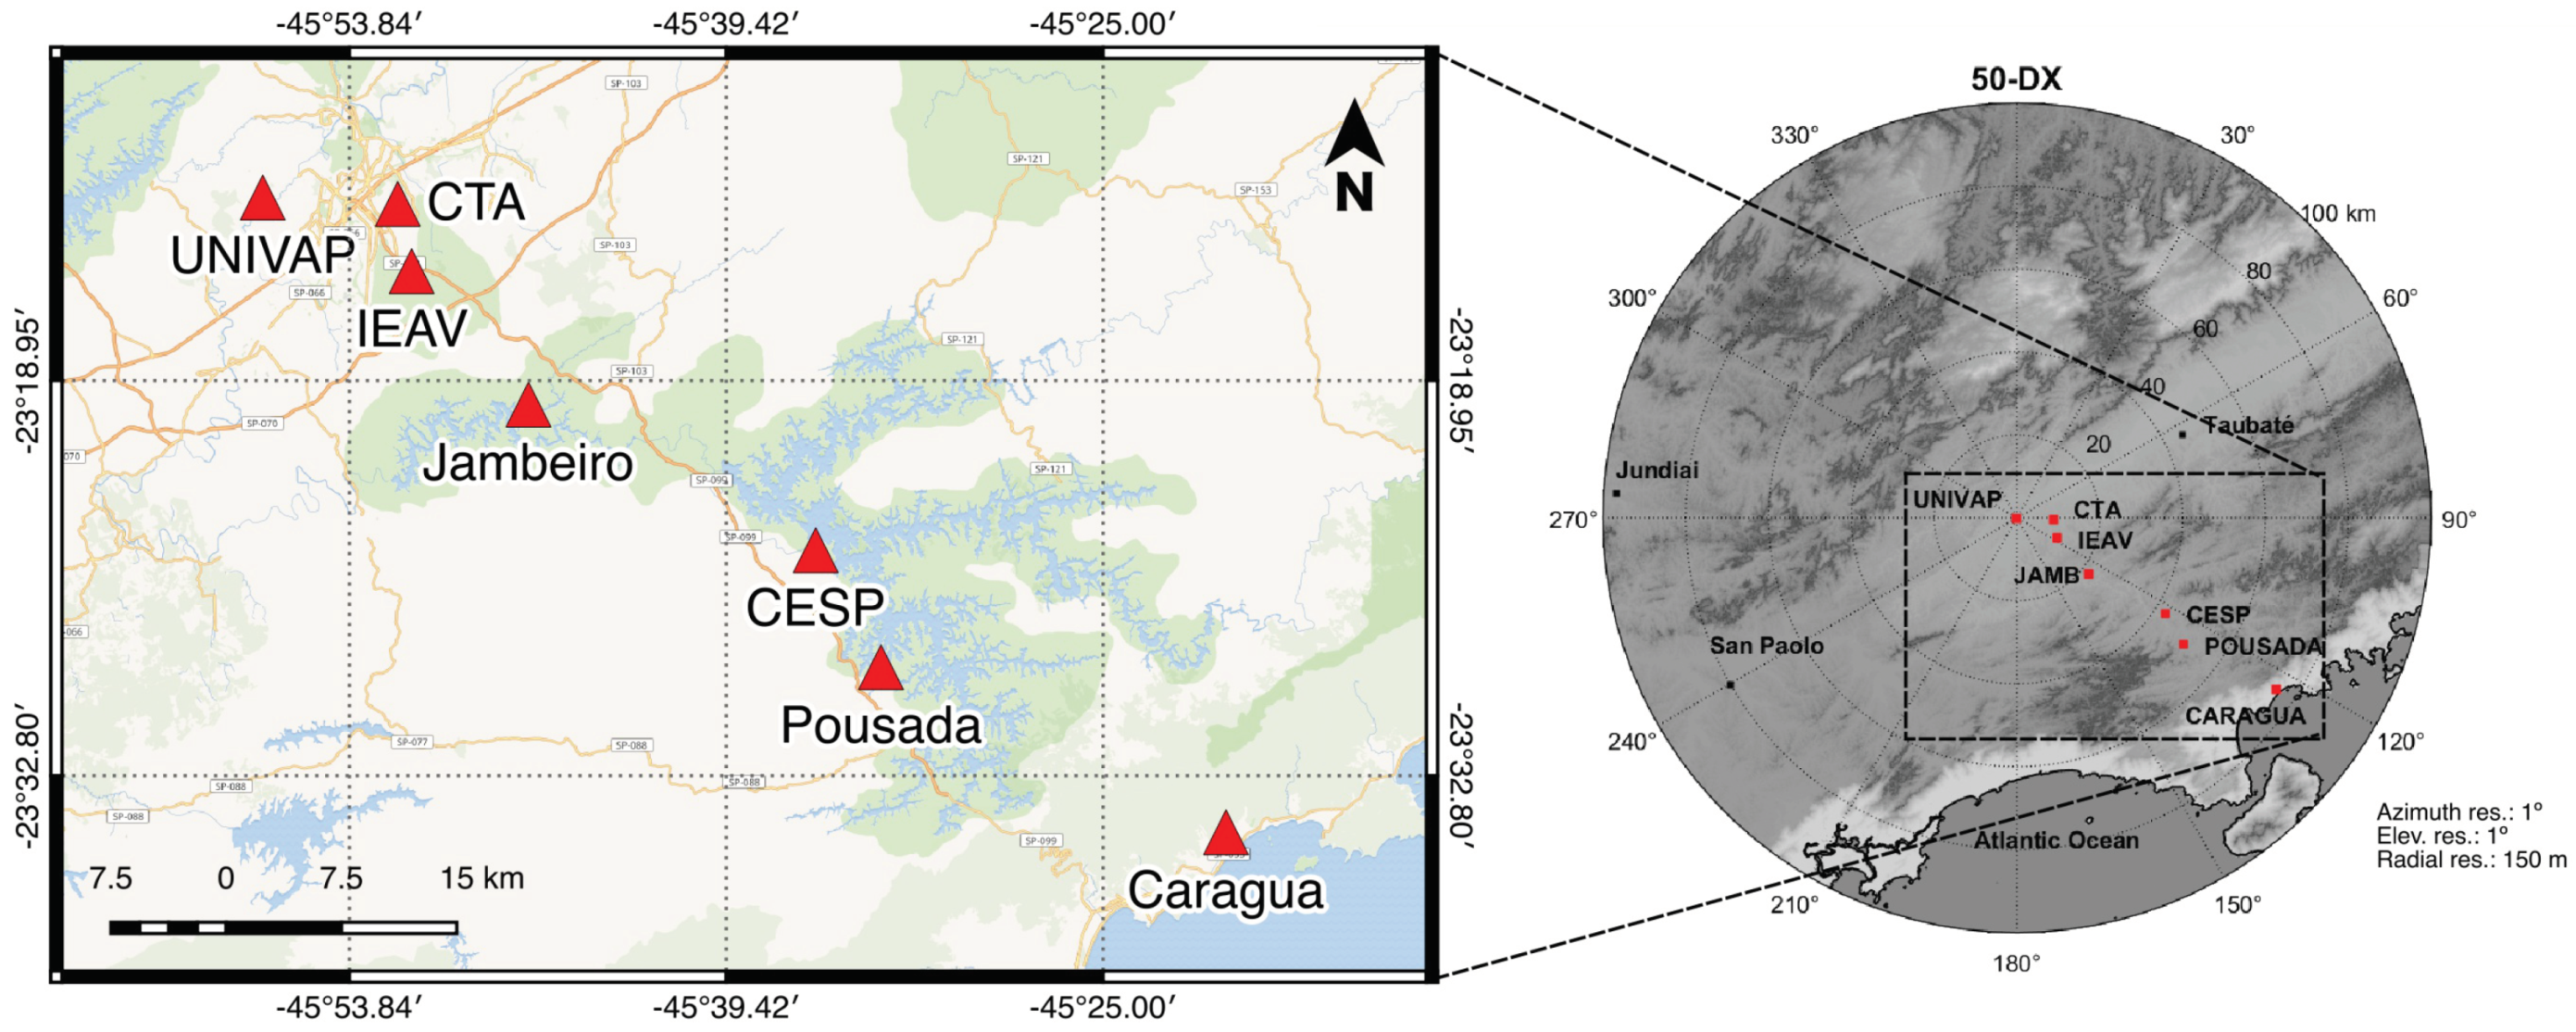
Position of the X-band radar and of the rain gauges indicated with a thumbtack in each site, during the Vale do Paraíba campaign.
Figure 1.
Position of the X-band radar and of the rain gauges indicated with a thumbtack in each site, during the Vale do Paraíba campaign.
Figure 2.
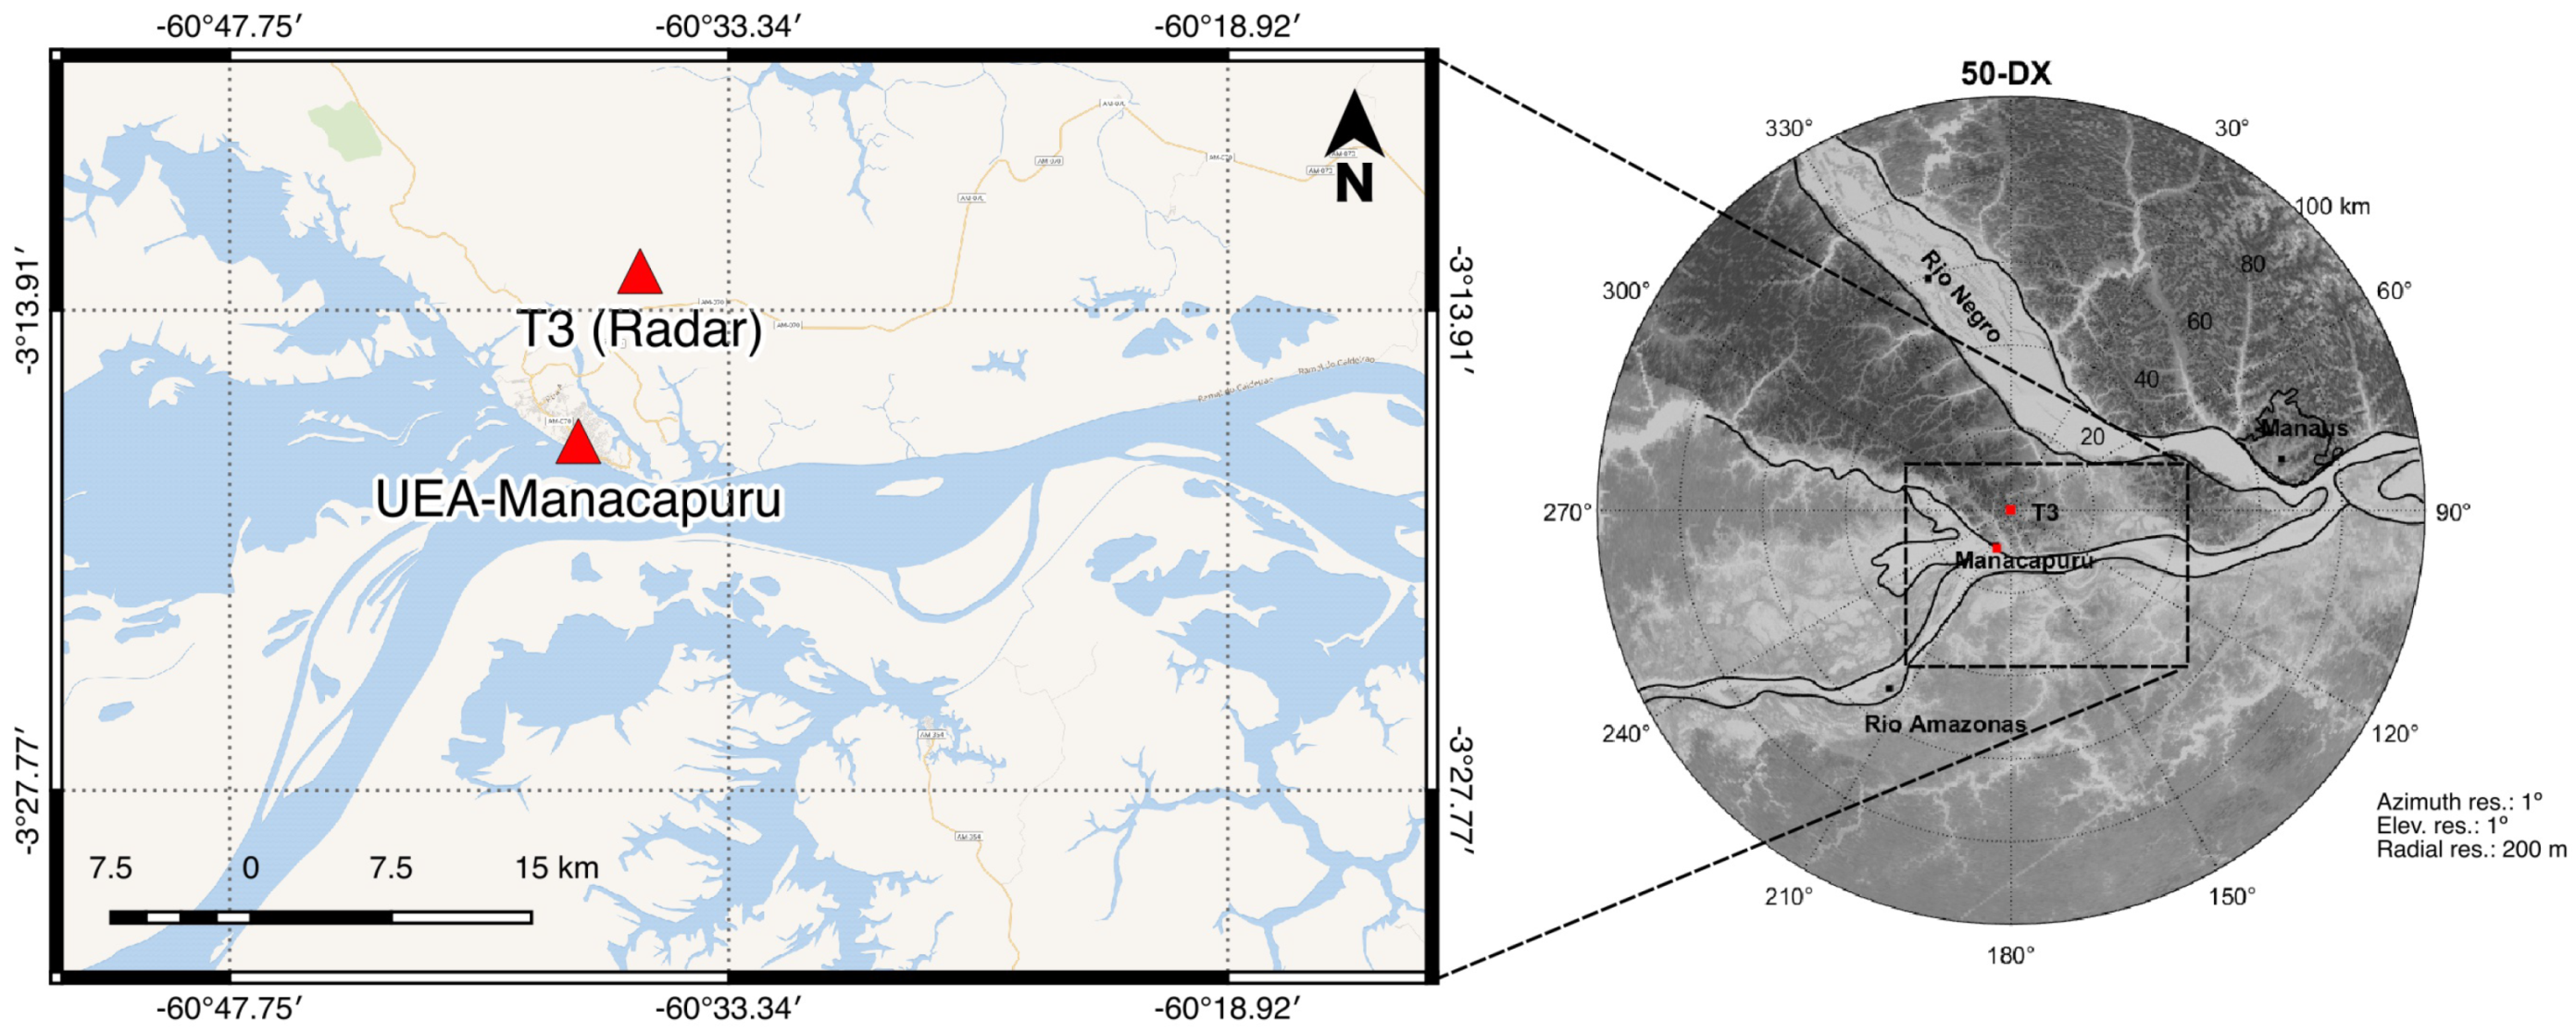
Position of the X-band radar and of the rain gauges indicated with a thumbtack in each site, during Manaus campaign.
Figure 2.
Position of the X-band radar and of the rain gauges indicated with a thumbtack in each site, during Manaus campaign.
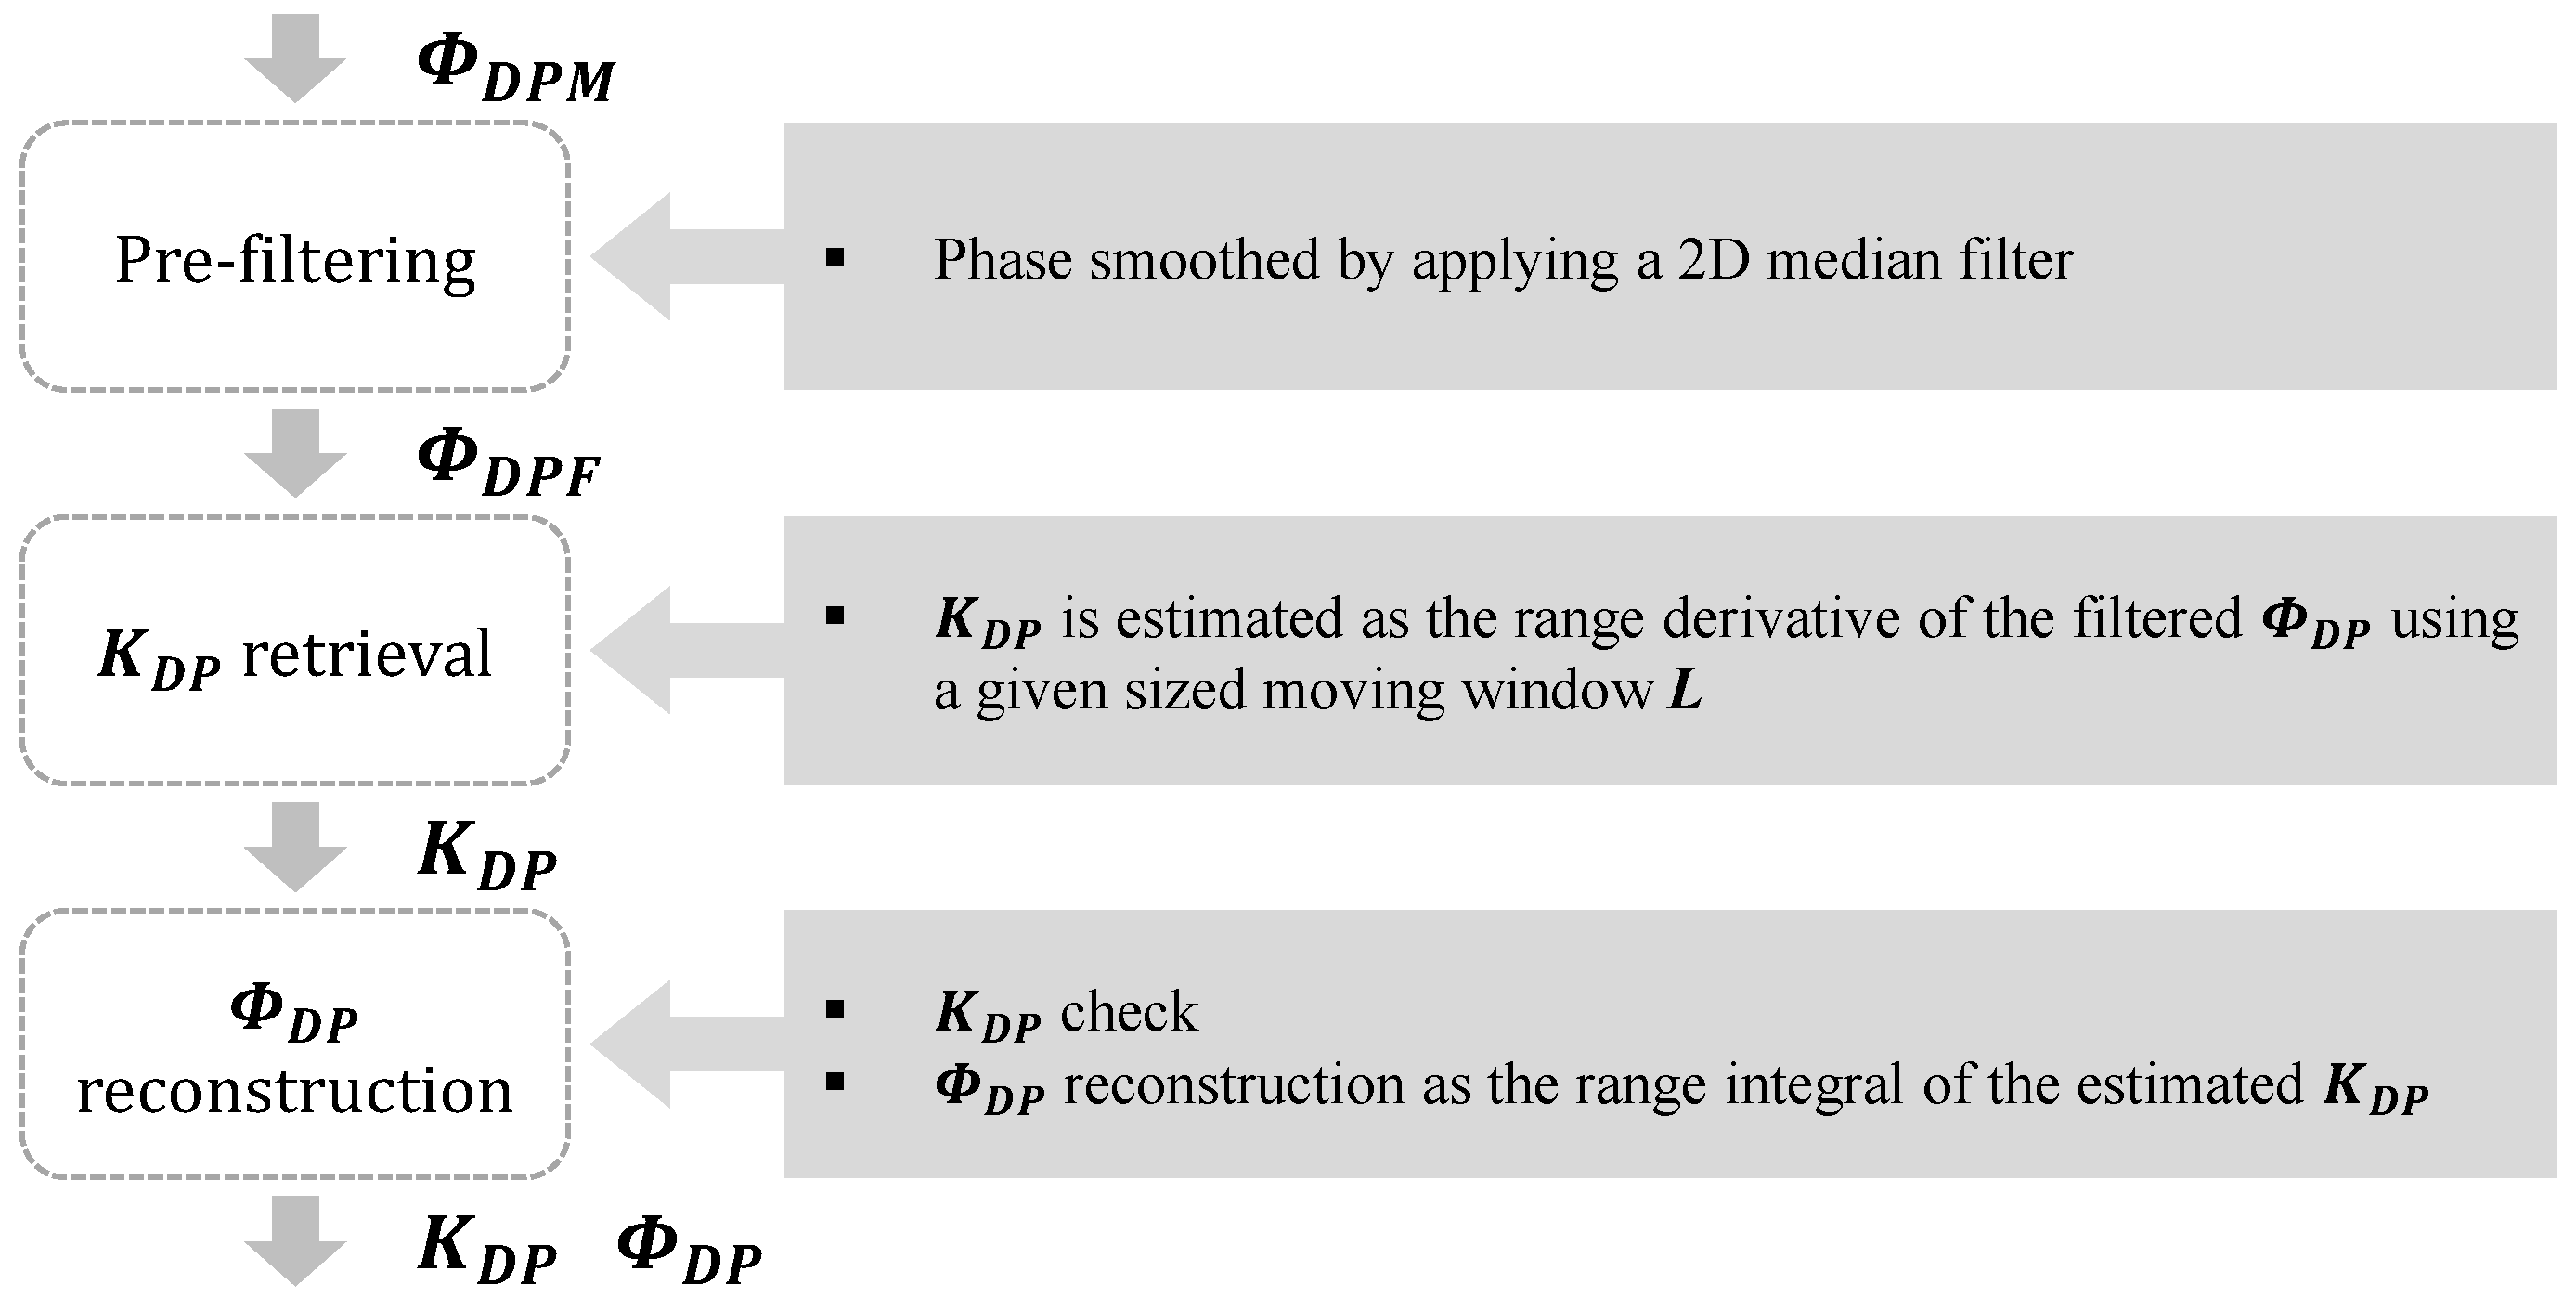
Figure 3.
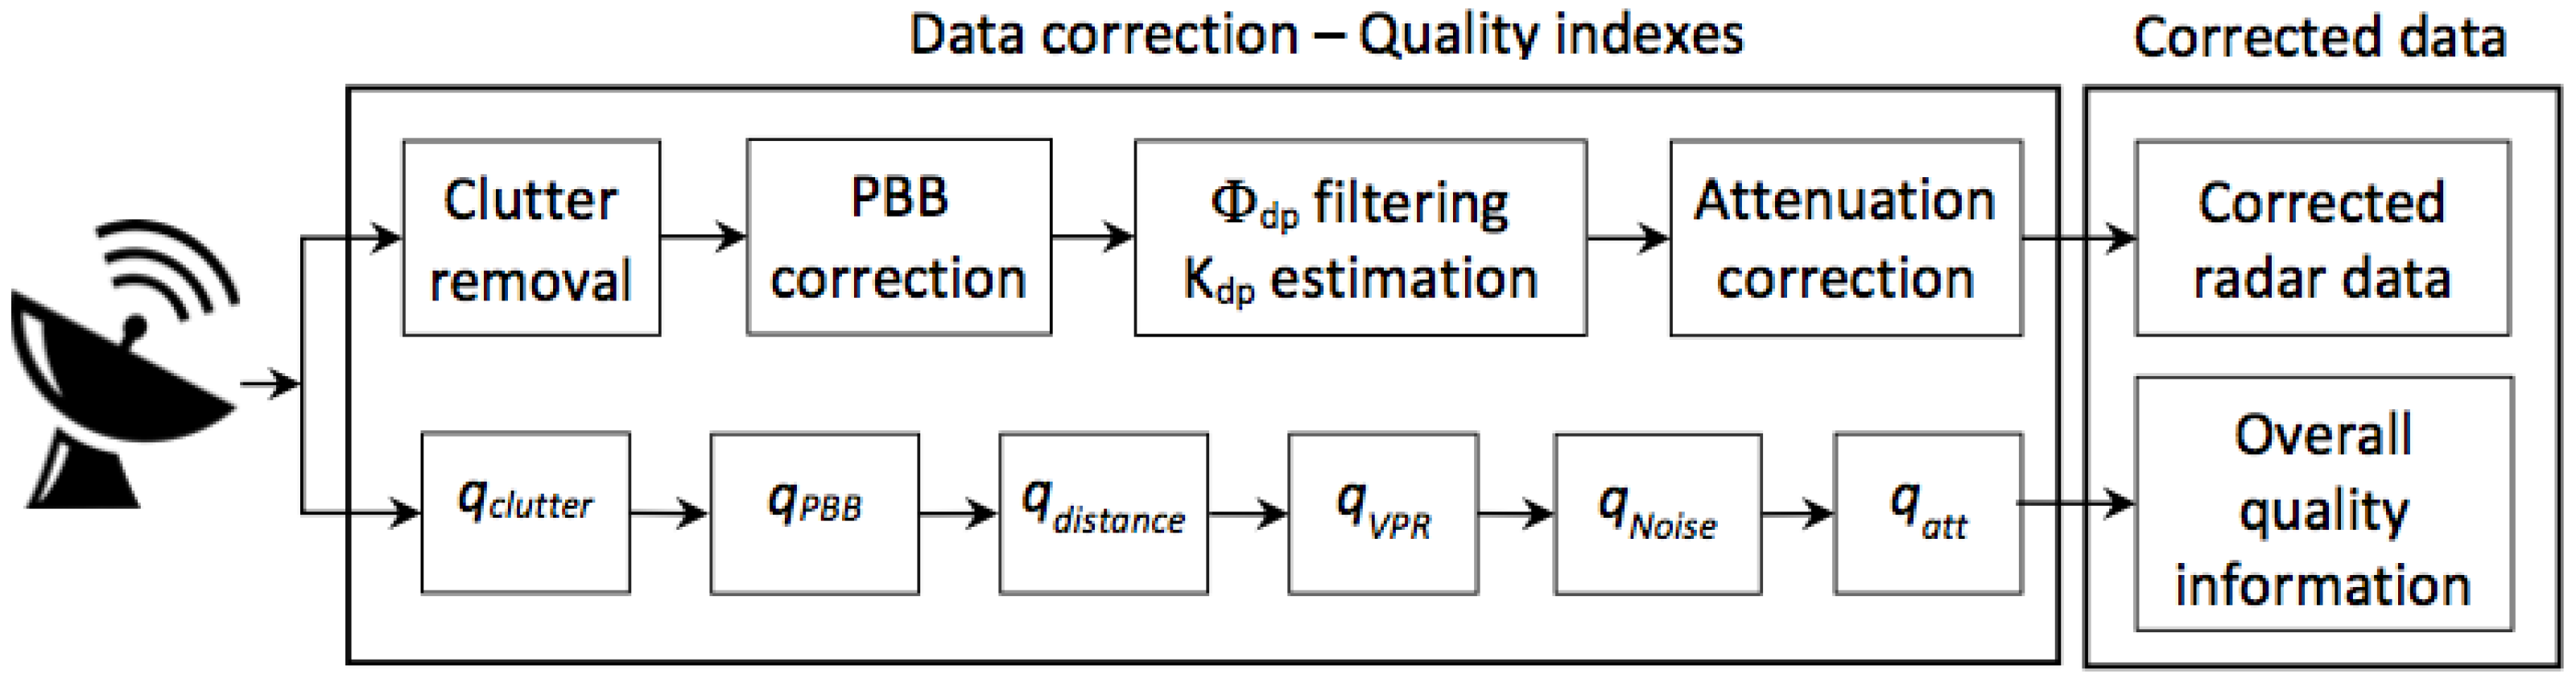
Weather radar data processing chain.
Figure 3.
Weather radar data processing chain.
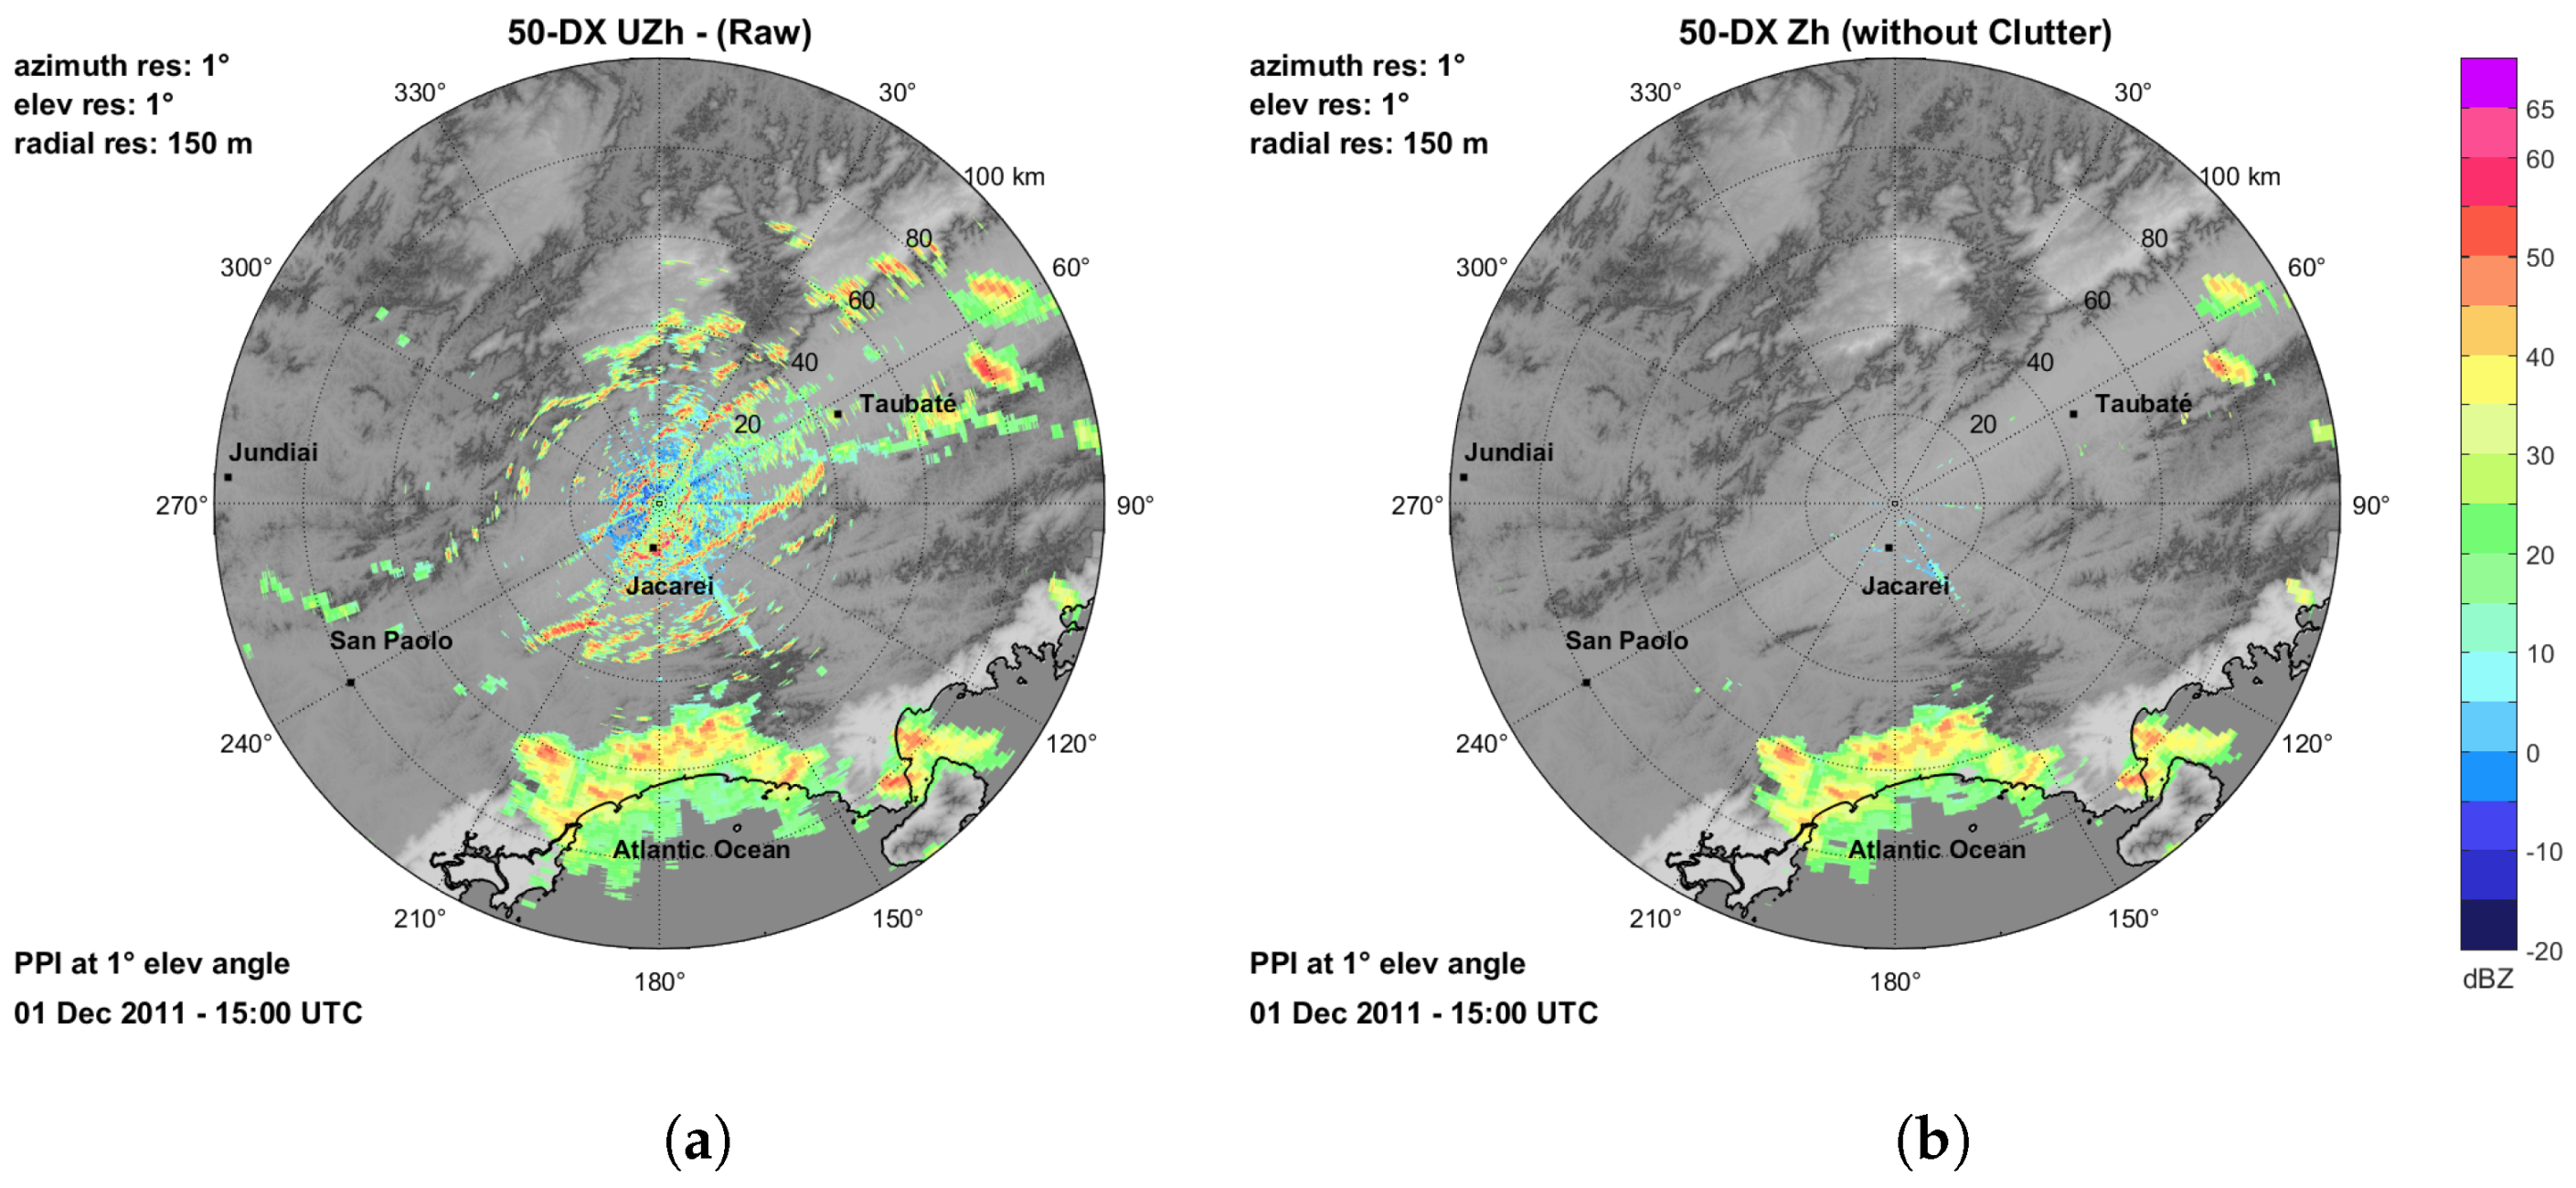
Figure 4.
PPI, at lowest elevation angle of (a) raw reflectivity and (b) reflectivity filtered to remove the clutter contamination on 1 December 2011 in the Vale do Paraíba campaign.
Figure 4.
PPI, at lowest elevation angle of (a) raw reflectivity and (b) reflectivity filtered to remove the clutter contamination on 1 December 2011 in the Vale do Paraíba campaign.
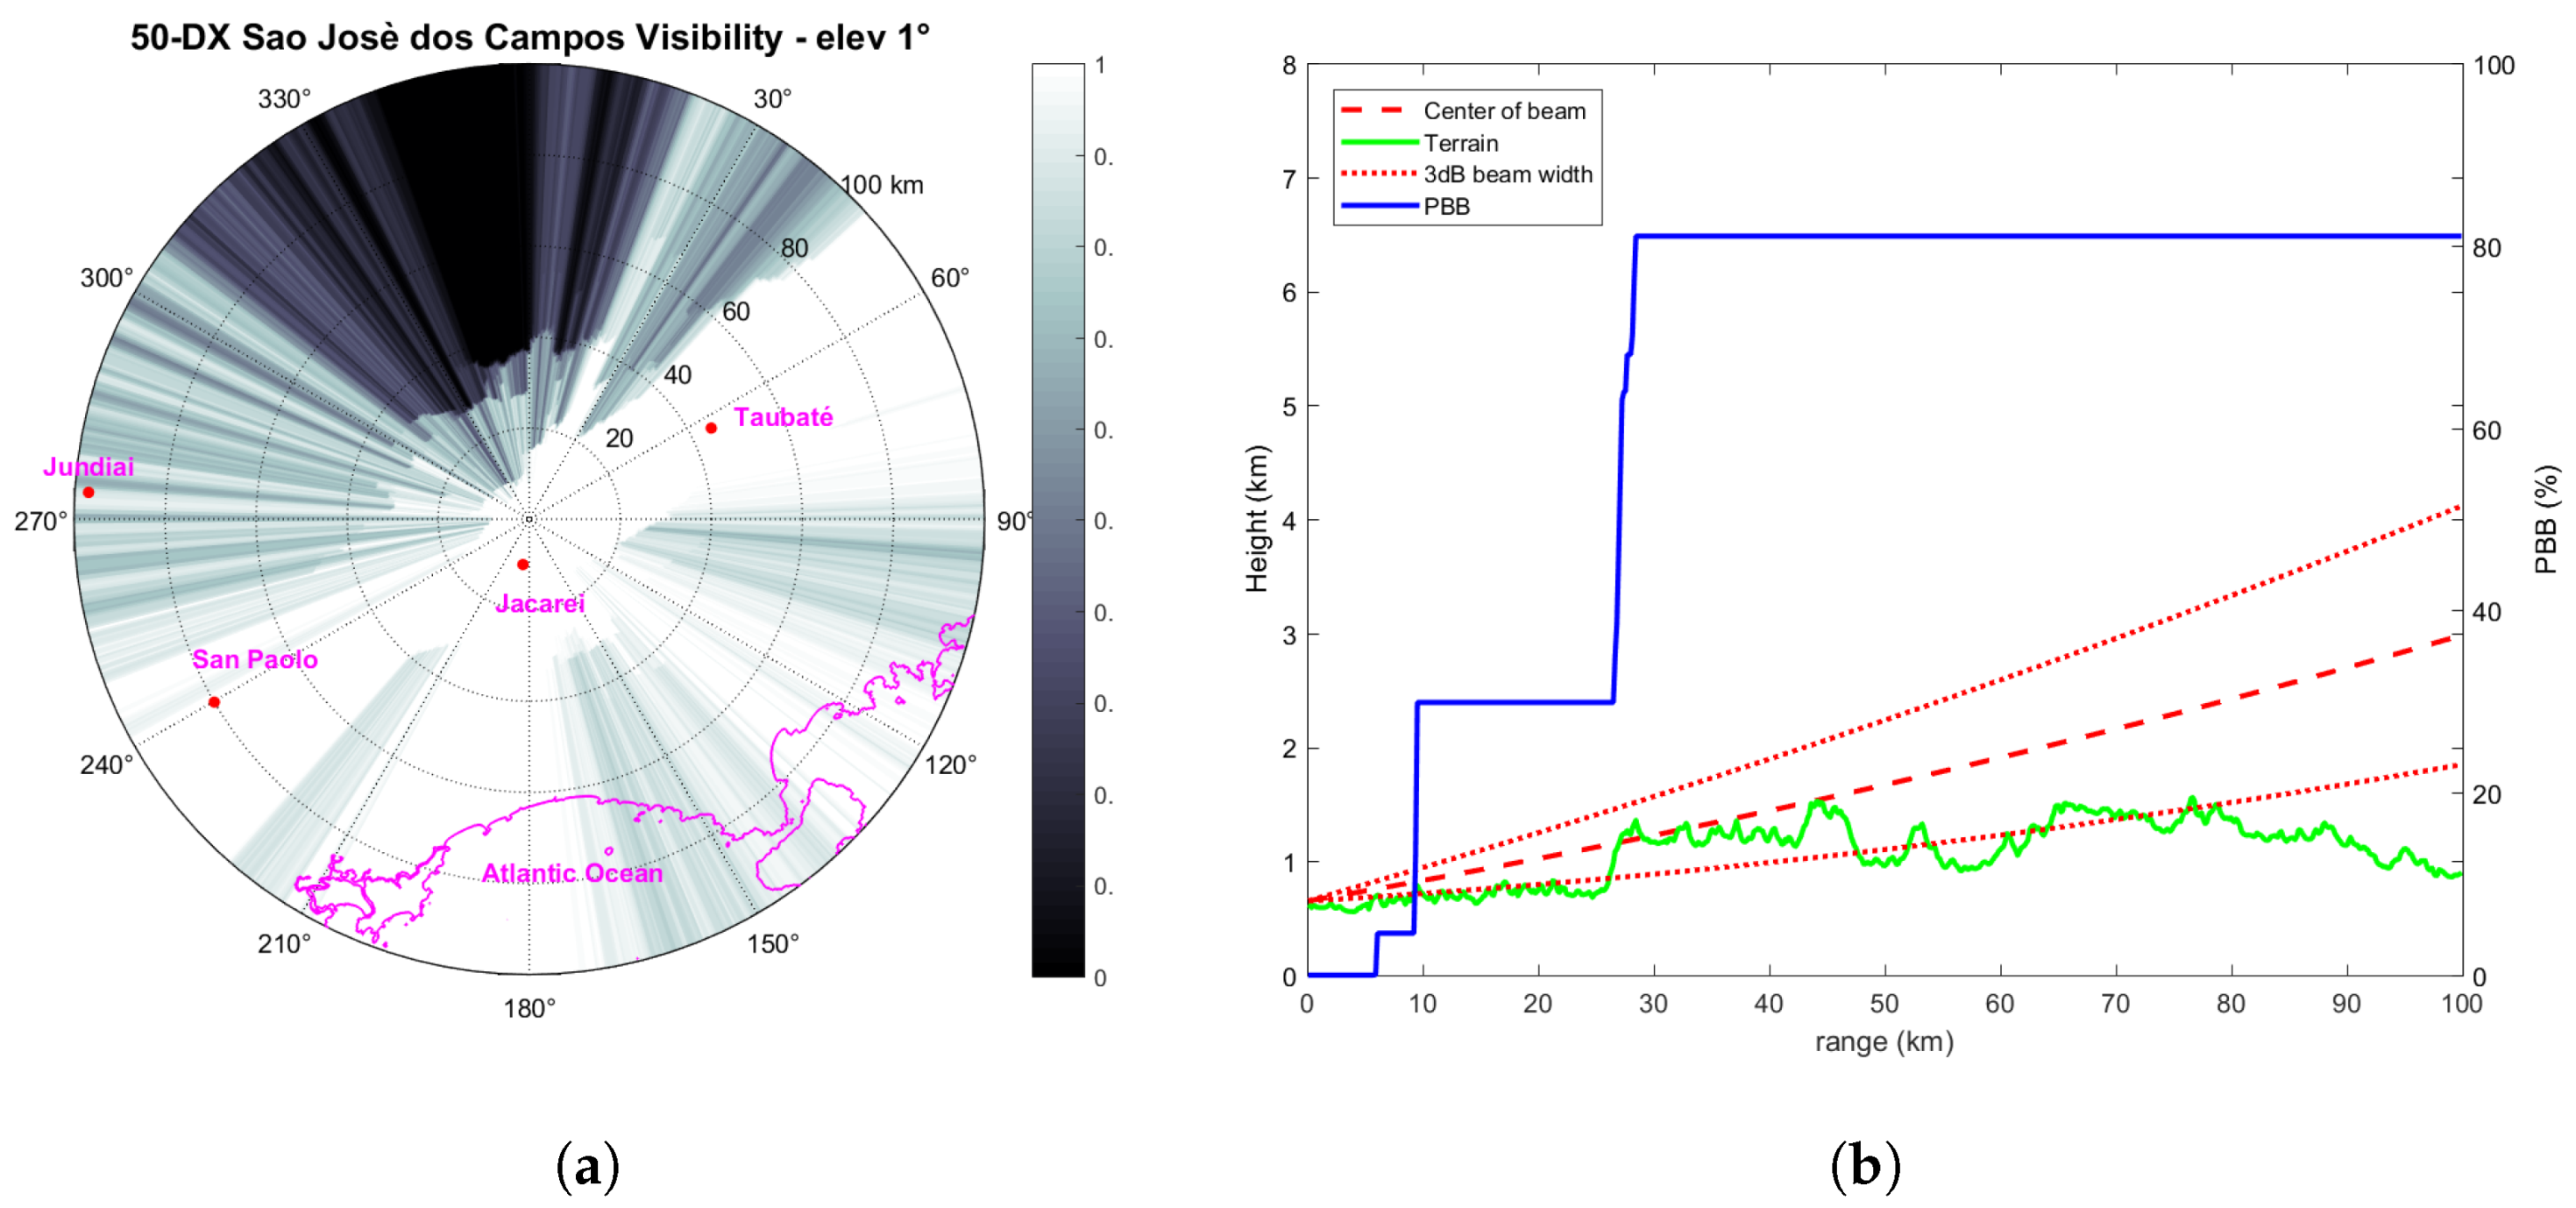
Figure 5.
(a) Map of radar visibility in Vale do Paraíba (black, no visibility and white, full visibility) for the 1 elevation and (b) profile of the beam, PBB and DEM along a given azimuth (330 degrees). Maximum range is 100 km.
Figure 5.
(a) Map of radar visibility in Vale do Paraíba (black, no visibility and white, full visibility) for the 1 elevation and (b) profile of the beam, PBB and DEM along a given azimuth (330 degrees). Maximum range is 100 km.
Figure 6.
Weather radar data processing chain.
Figure 6.
Weather radar data processing chain.
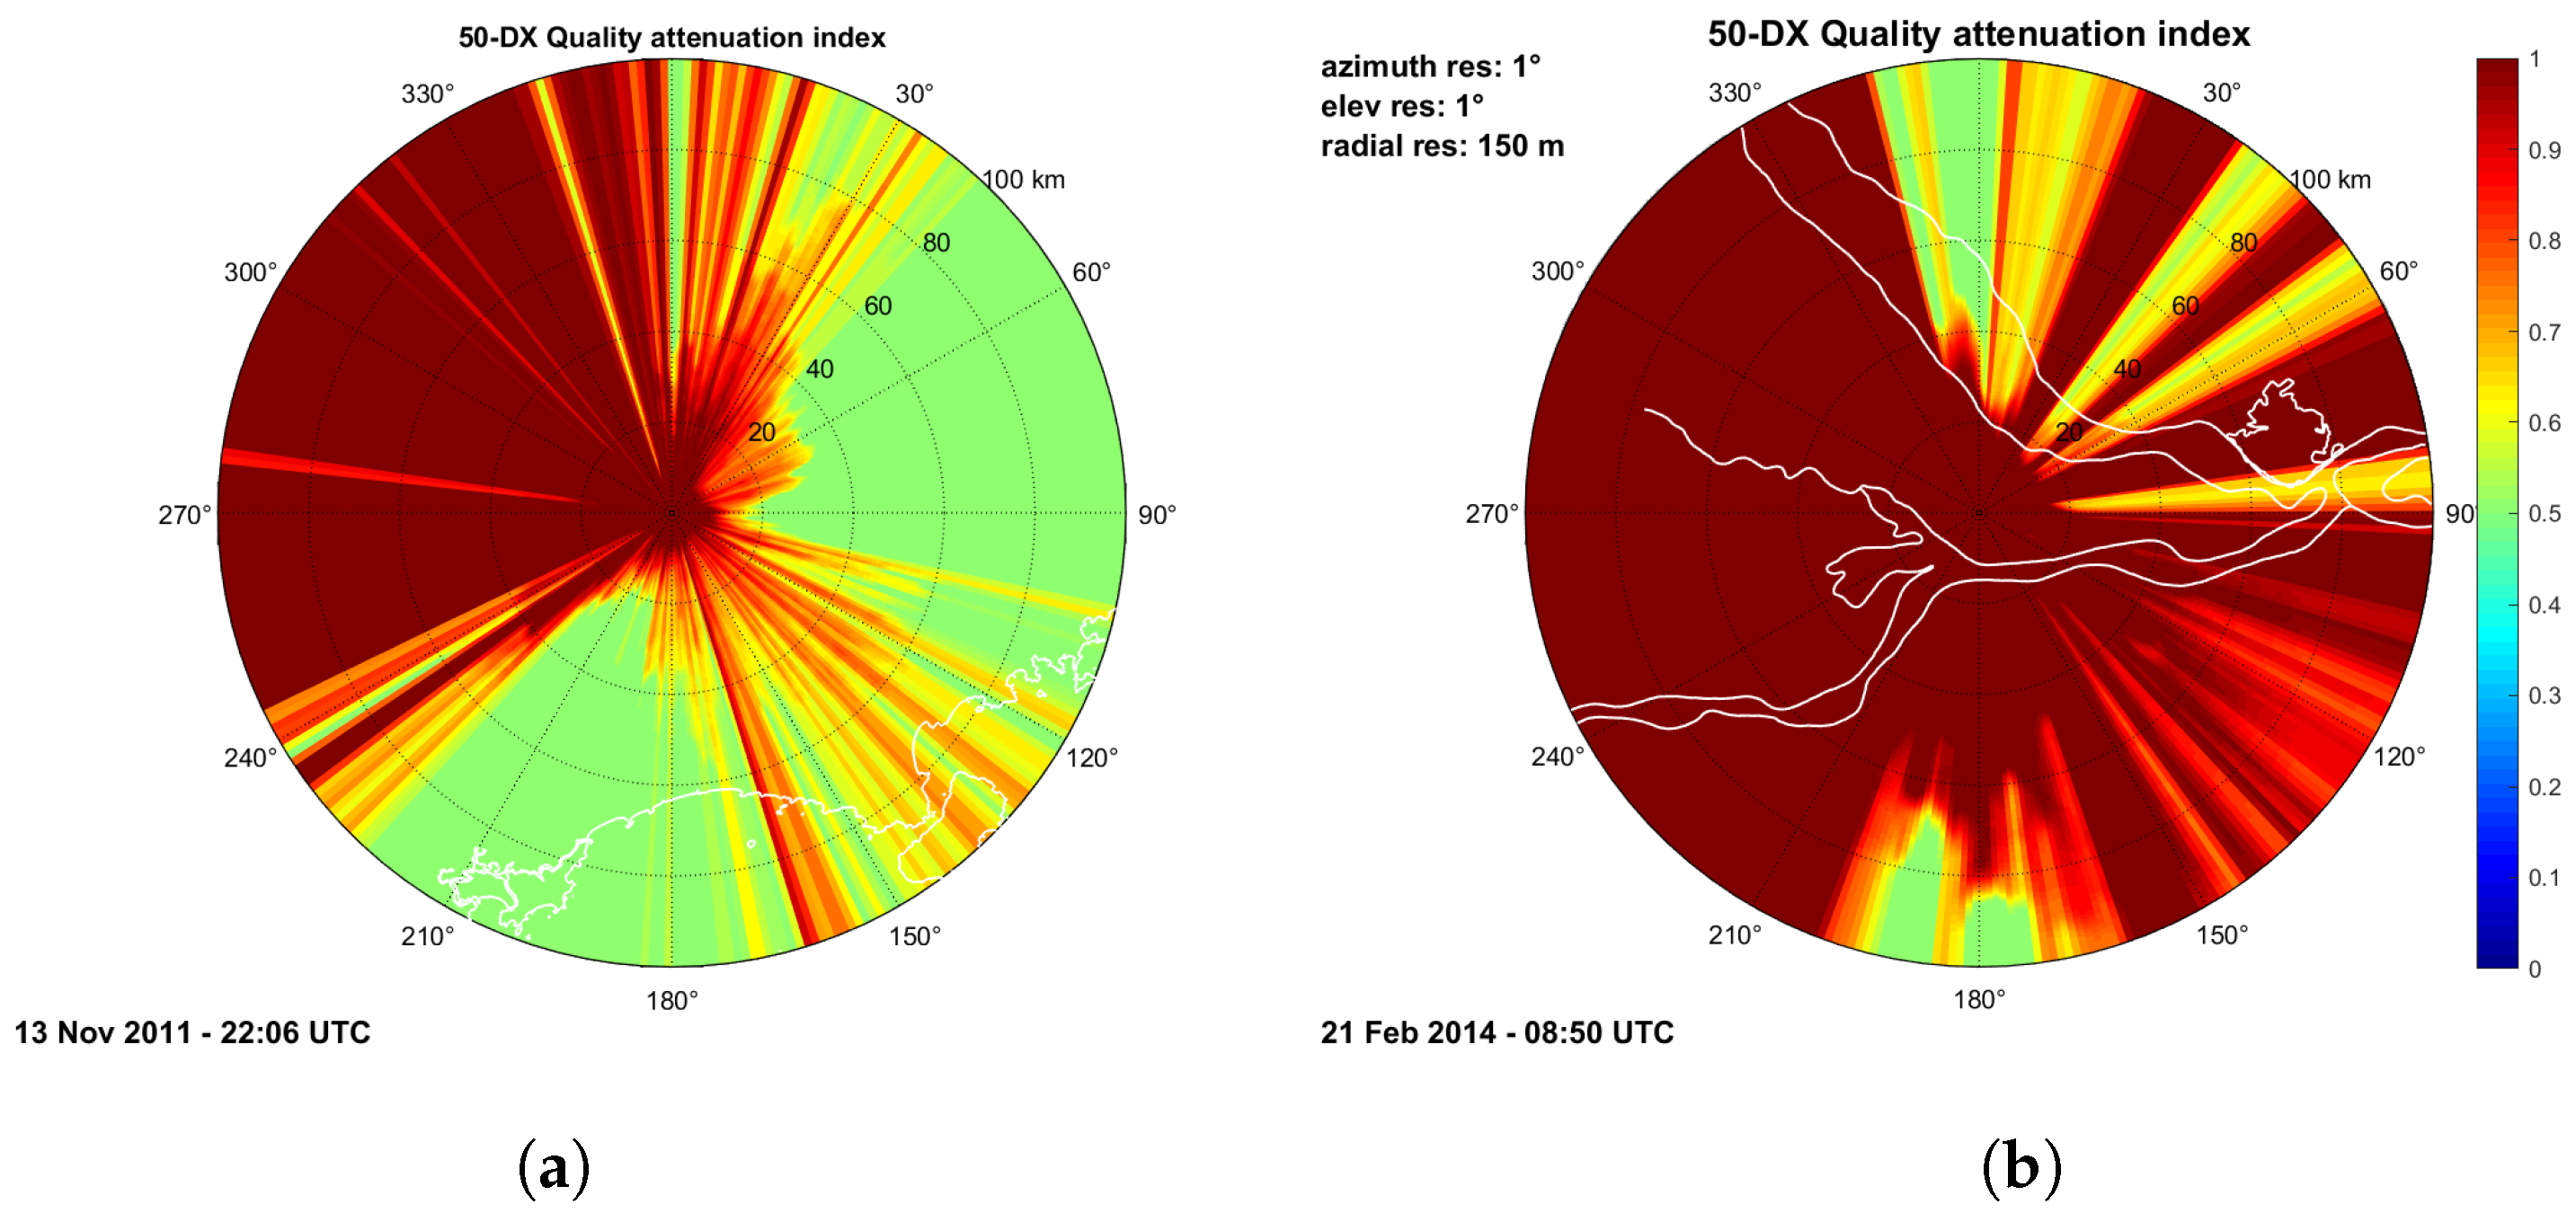
Figure 7.
(a) Attenuation correction map at lowest elevation angle associated with radar in (a) Vale do Paraíba on 13 November 2011 at 22:06 UTC (center) and (b) Manaus on 21 February 2014 at 8:50 UTC (right).
Figure 7.
(a) Attenuation correction map at lowest elevation angle associated with radar in (a) Vale do Paraíba on 13 November 2011 at 22:06 UTC (center) and (b) Manaus on 21 February 2014 at 8:50 UTC (right).
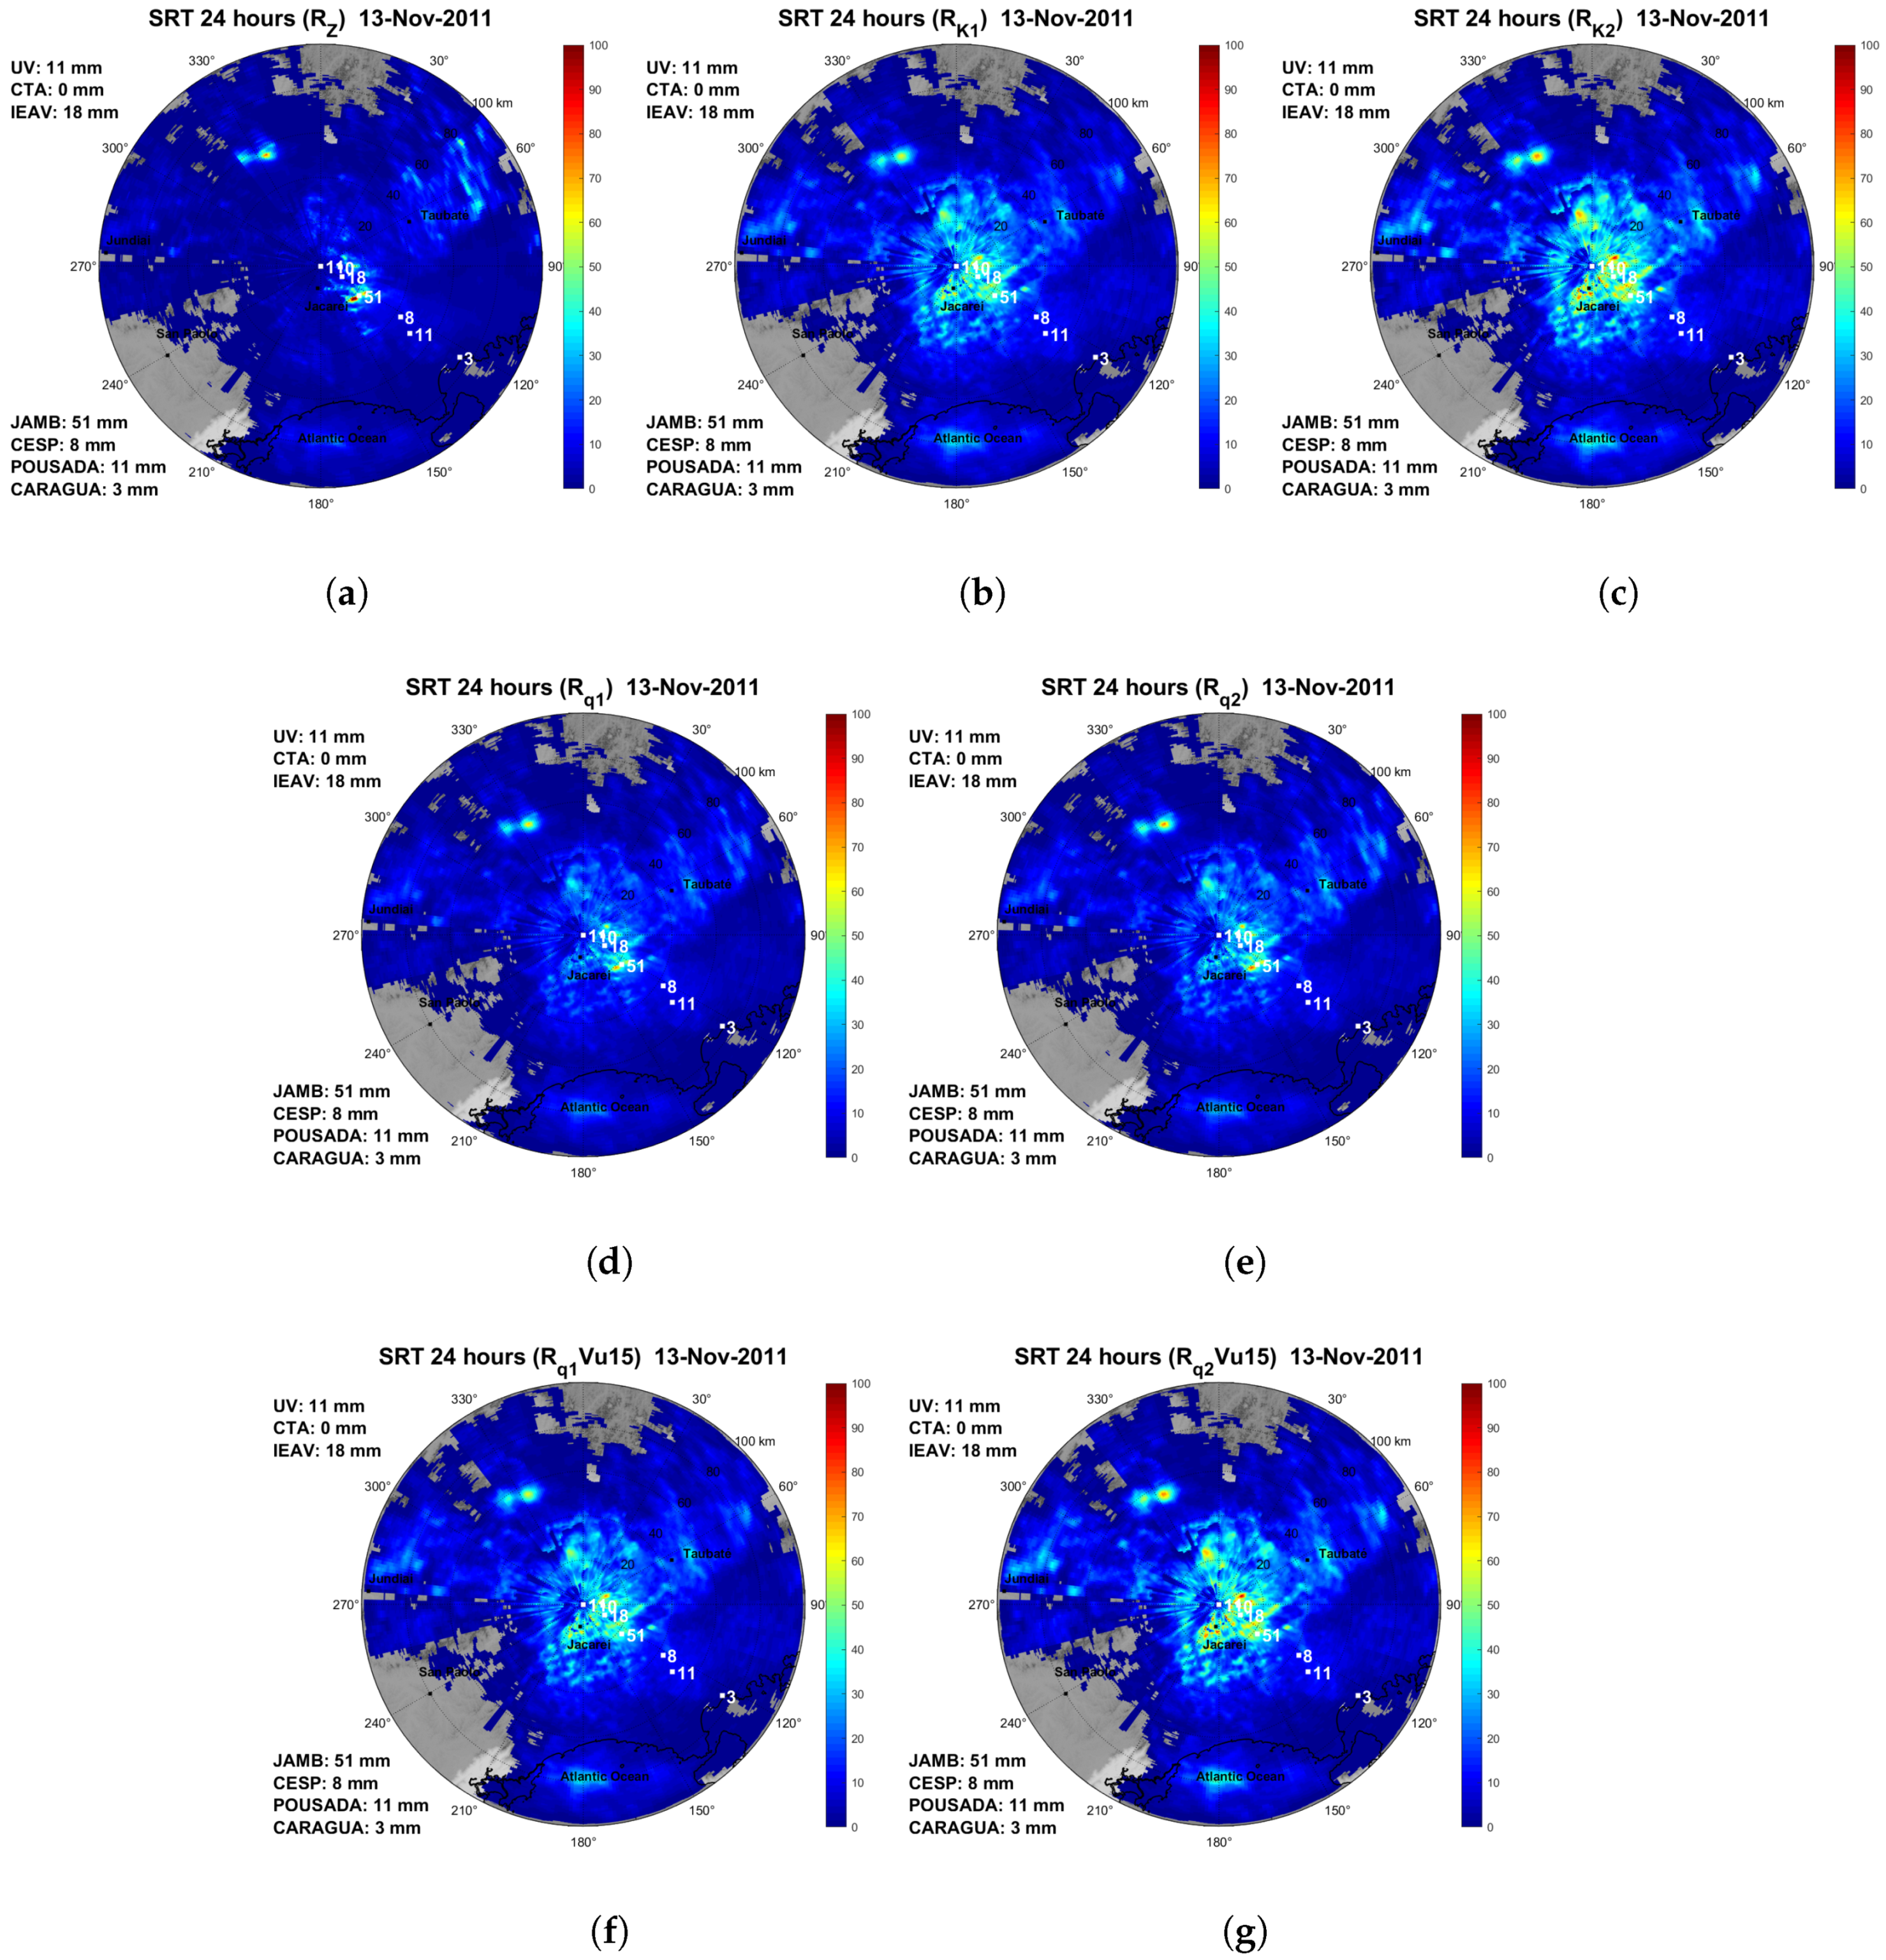
Figure 8.
Surface Rainfall Total (SRT) 24 hourly accumulated using (a) model, (b) model, (c) model, (d) model, (e) model, (f) model and (g) model for the event which occurred on 13 November 2011. The corresponding values accumulated by the rain gauges are shown in the map.
Figure 8.
Surface Rainfall Total (SRT) 24 hourly accumulated using (a) model, (b) model, (c) model, (d) model, (e) model, (f) model and (g) model for the event which occurred on 13 November 2011. The corresponding values accumulated by the rain gauges are shown in the map.
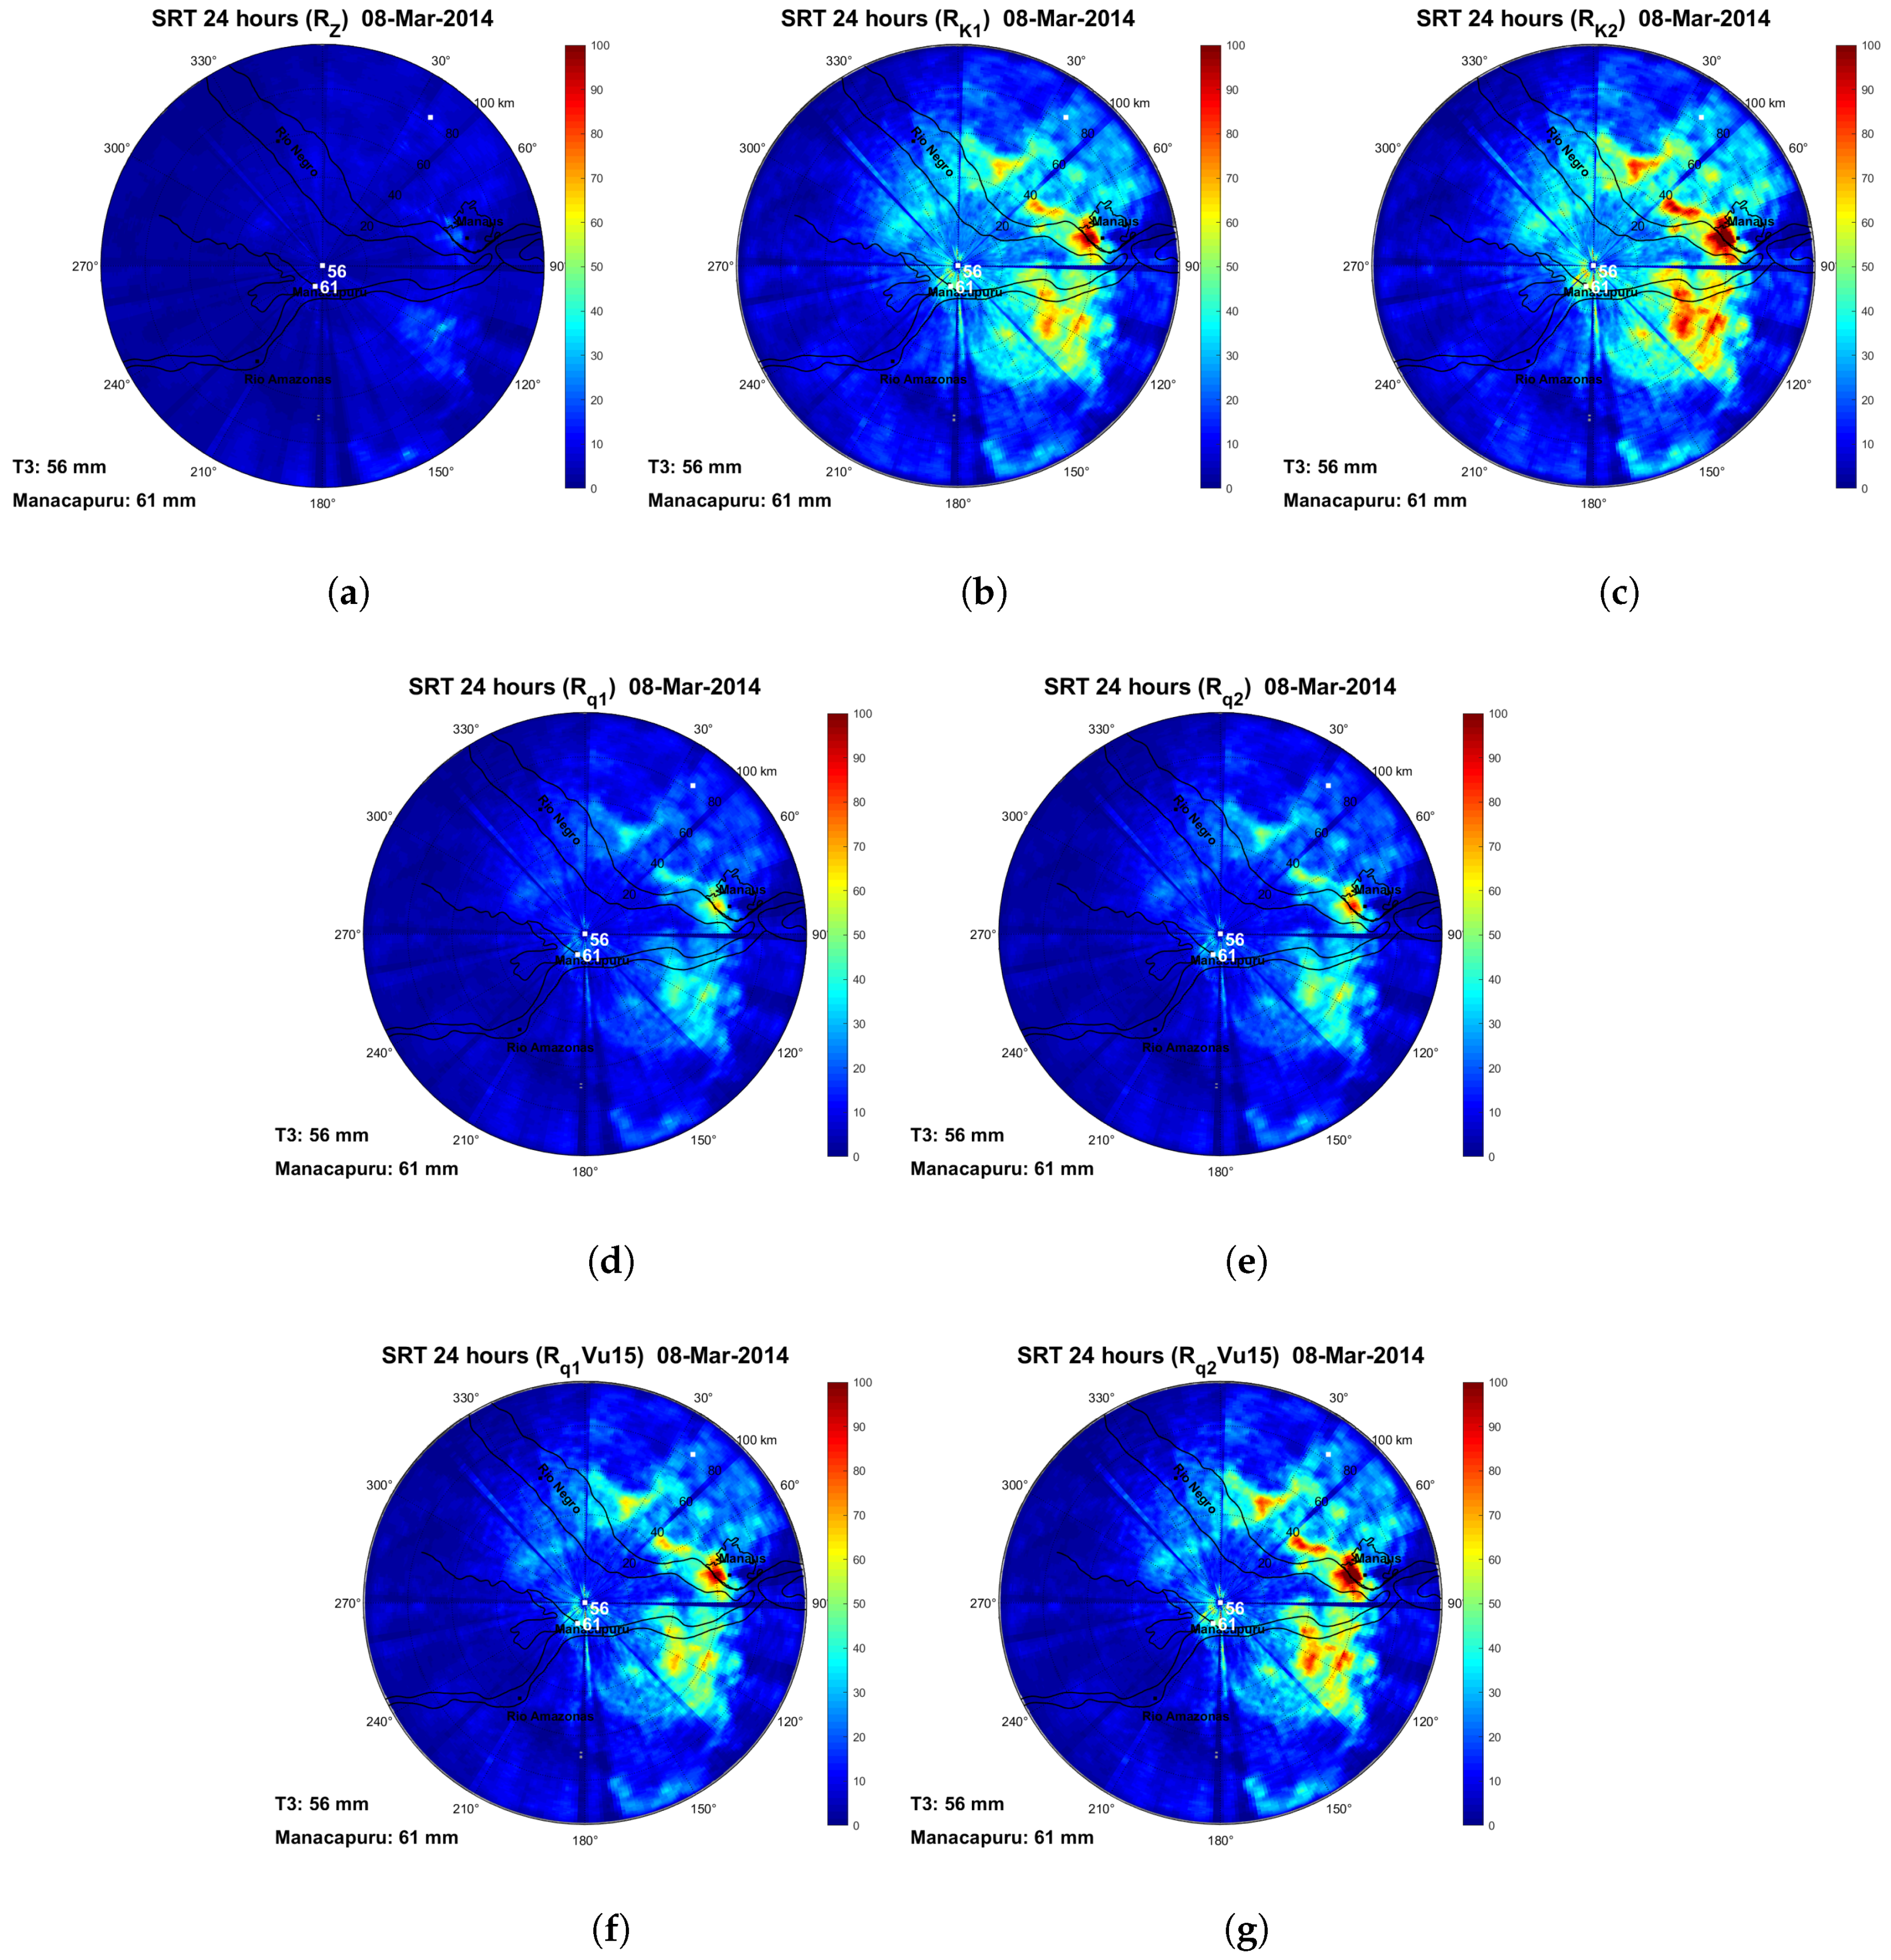
Figure 9.
Surface Rainfall Total (SRT) 24 hourly accumulated using (a) model, (b) model, (c) model, (d) model, (e) model, (f) model and (g) model for the event which occurred on 8 March 2014. The corresponding values accumulated by the rain gauges are shown in the map.
Figure 9.
Surface Rainfall Total (SRT) 24 hourly accumulated using (a) model, (b) model, (c) model, (d) model, (e) model, (f) model and (g) model for the event which occurred on 8 March 2014. The corresponding values accumulated by the rain gauges are shown in the map.
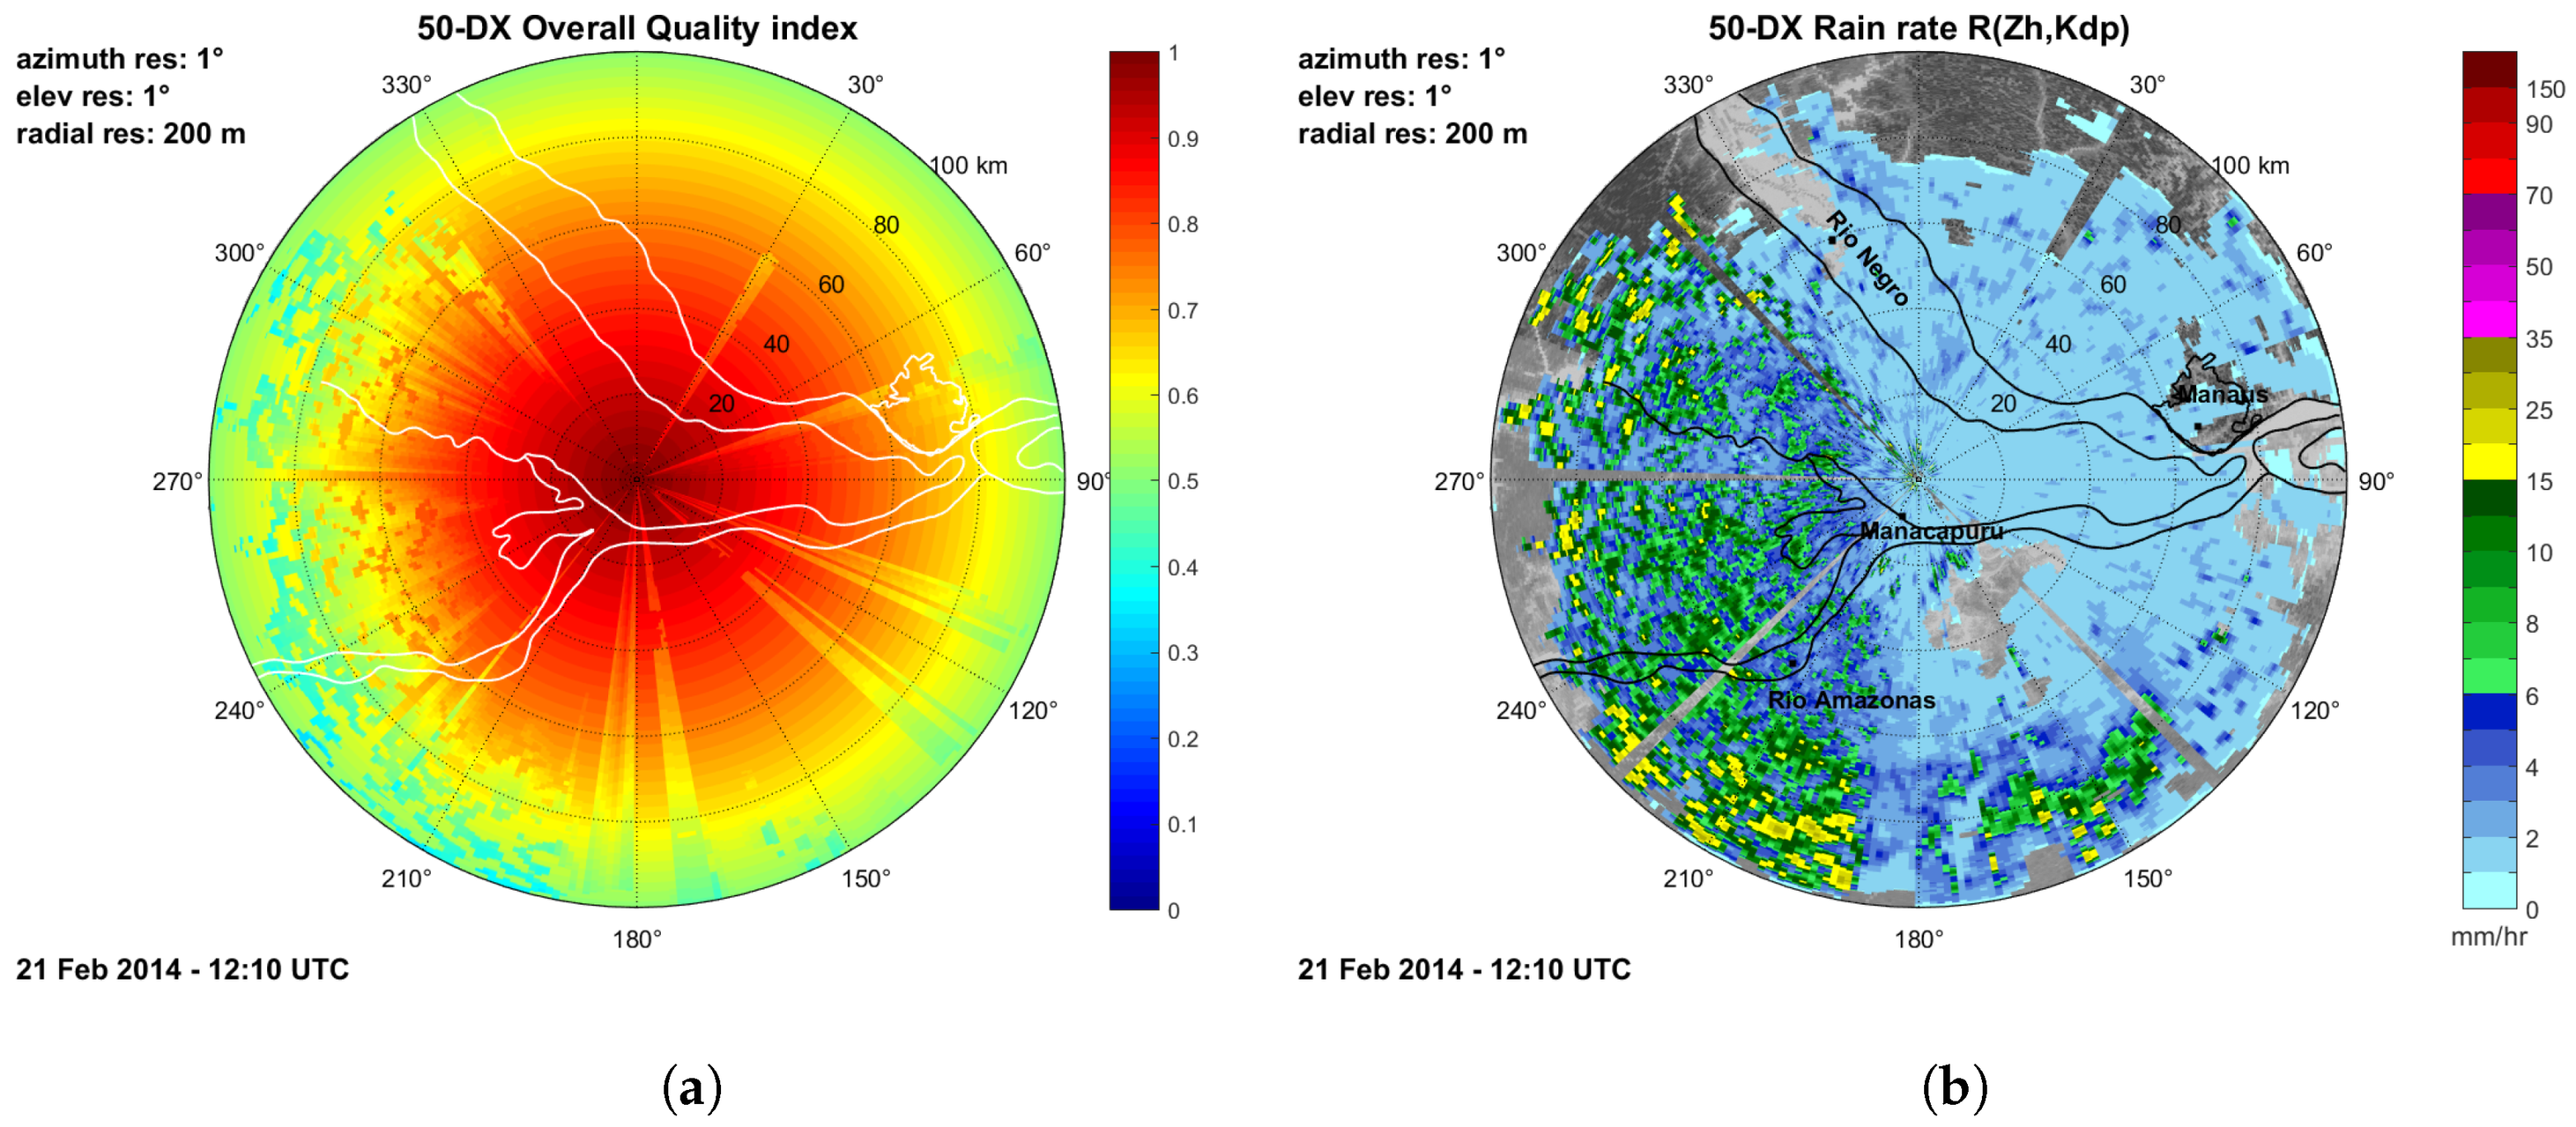
Figure 10.
(a) Overall radar quality index and (b) Rain rate from radar on 21 February 2014 at 12:10 UTC.
Figure 10.
(a) Overall radar quality index and (b) Rain rate from radar on 21 February 2014 at 12:10 UTC.
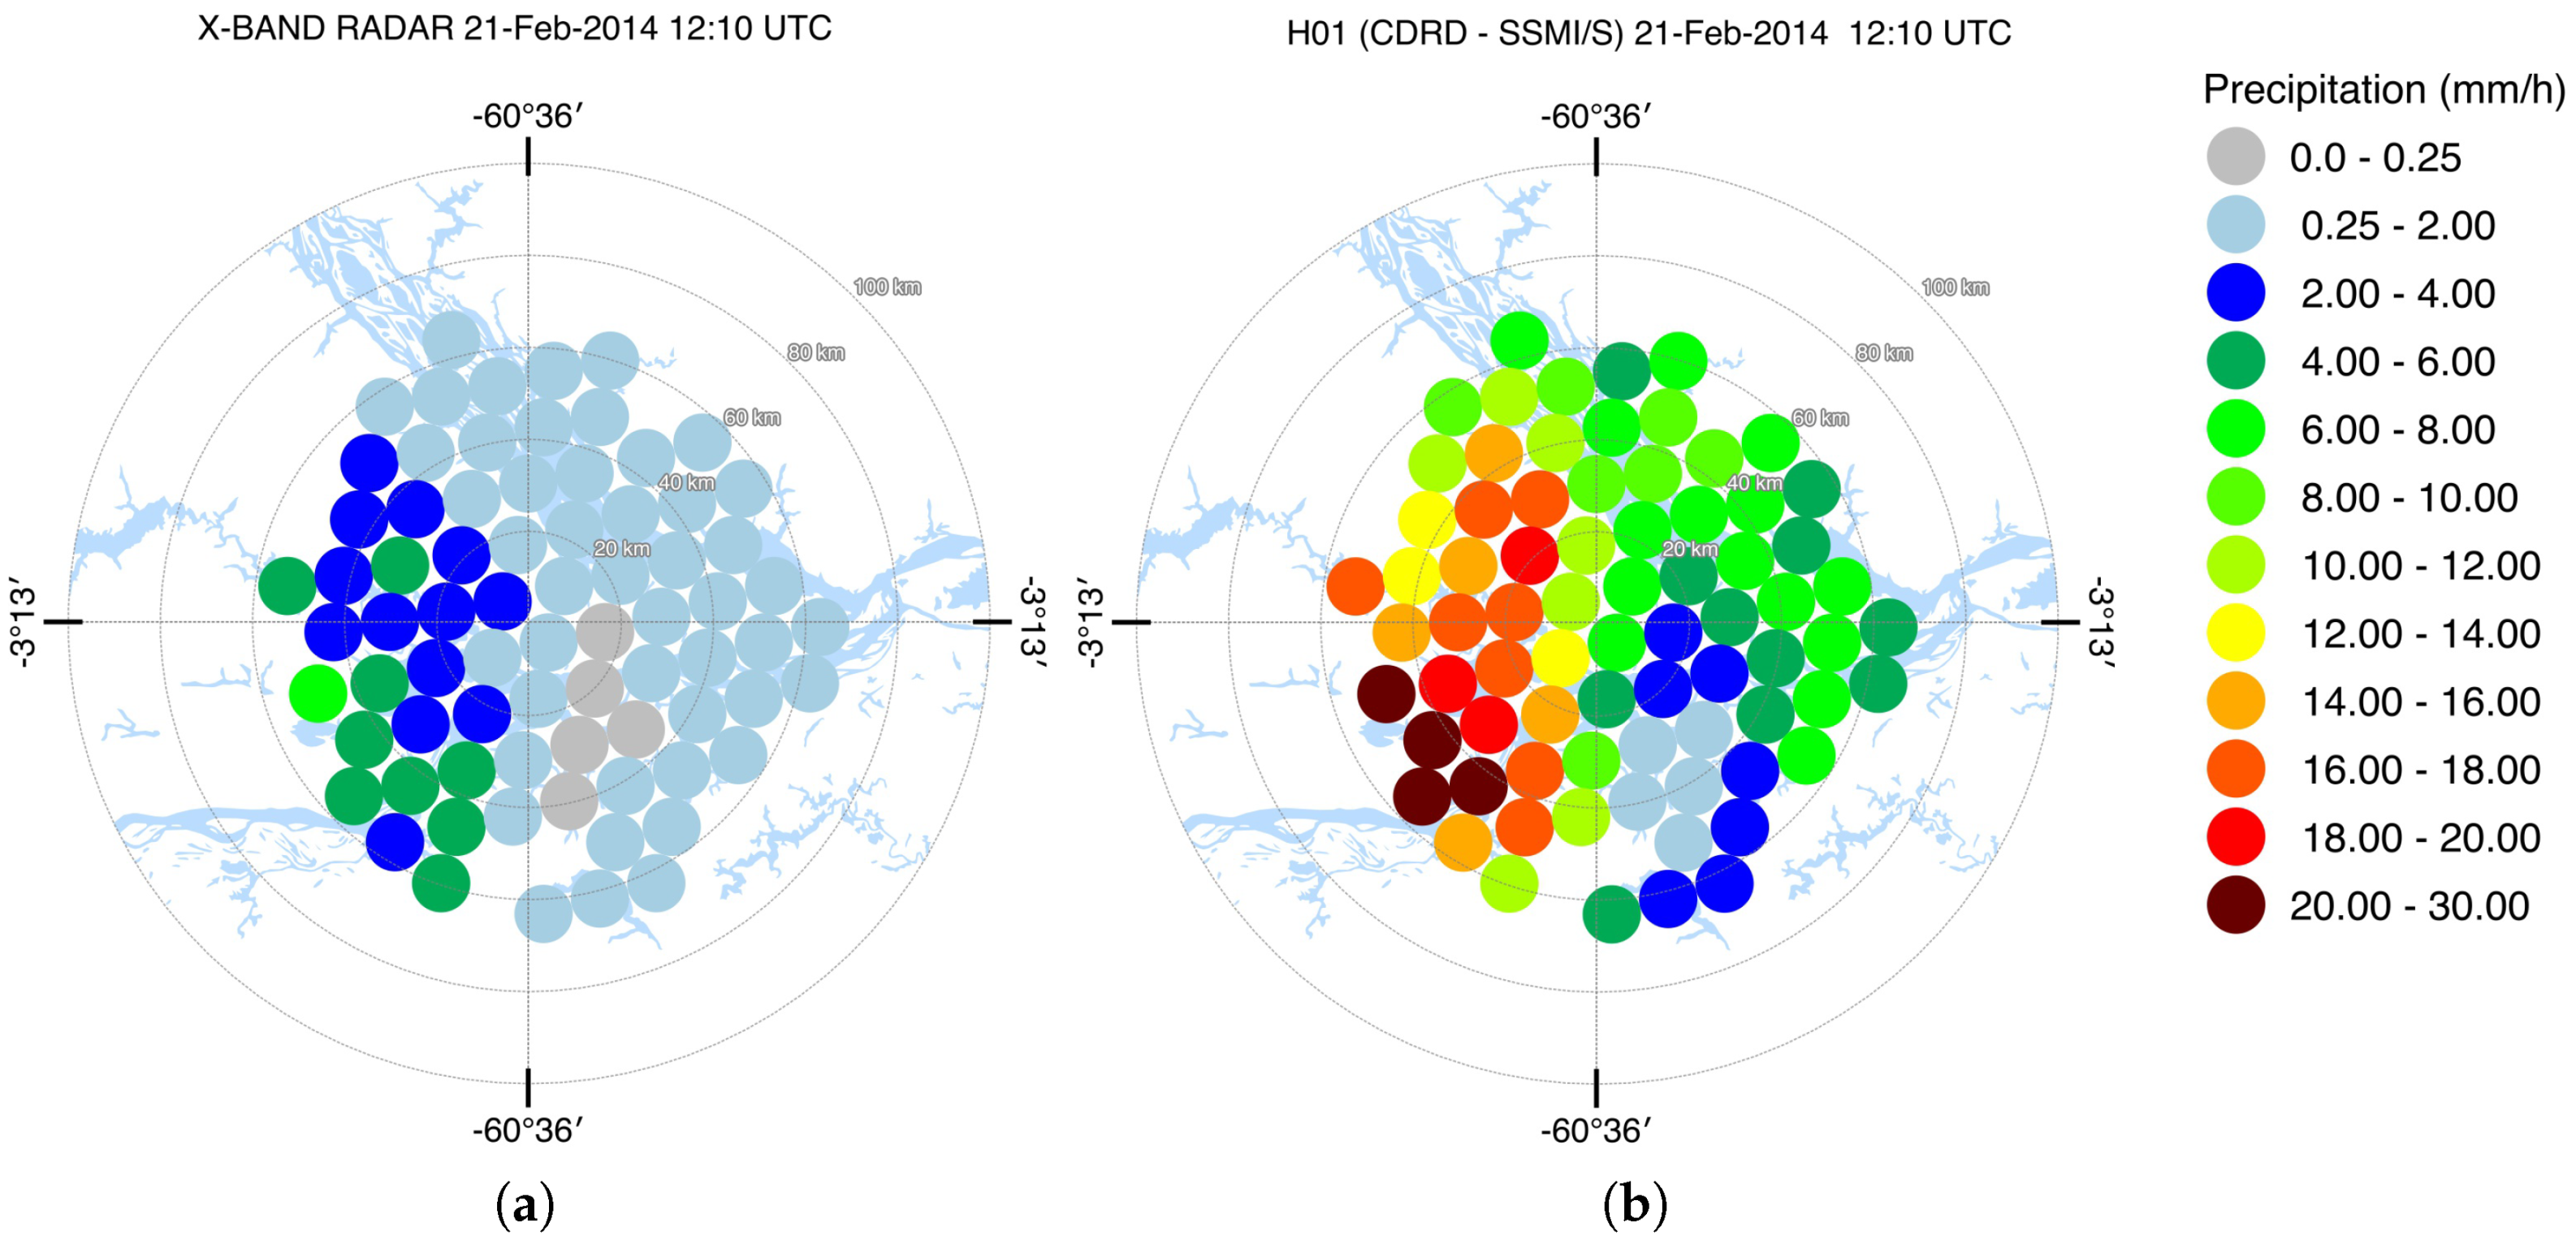
Figure 11.
(a) Rain rate from radar upscaled to the satellite grid and (b) H01 rain rate retrieval in Manaus on 21 February 2014 at 12:10 UTC.
Figure 11.
(a) Rain rate from radar upscaled to the satellite grid and (b) H01 rain rate retrieval in Manaus on 21 February 2014 at 12:10 UTC.
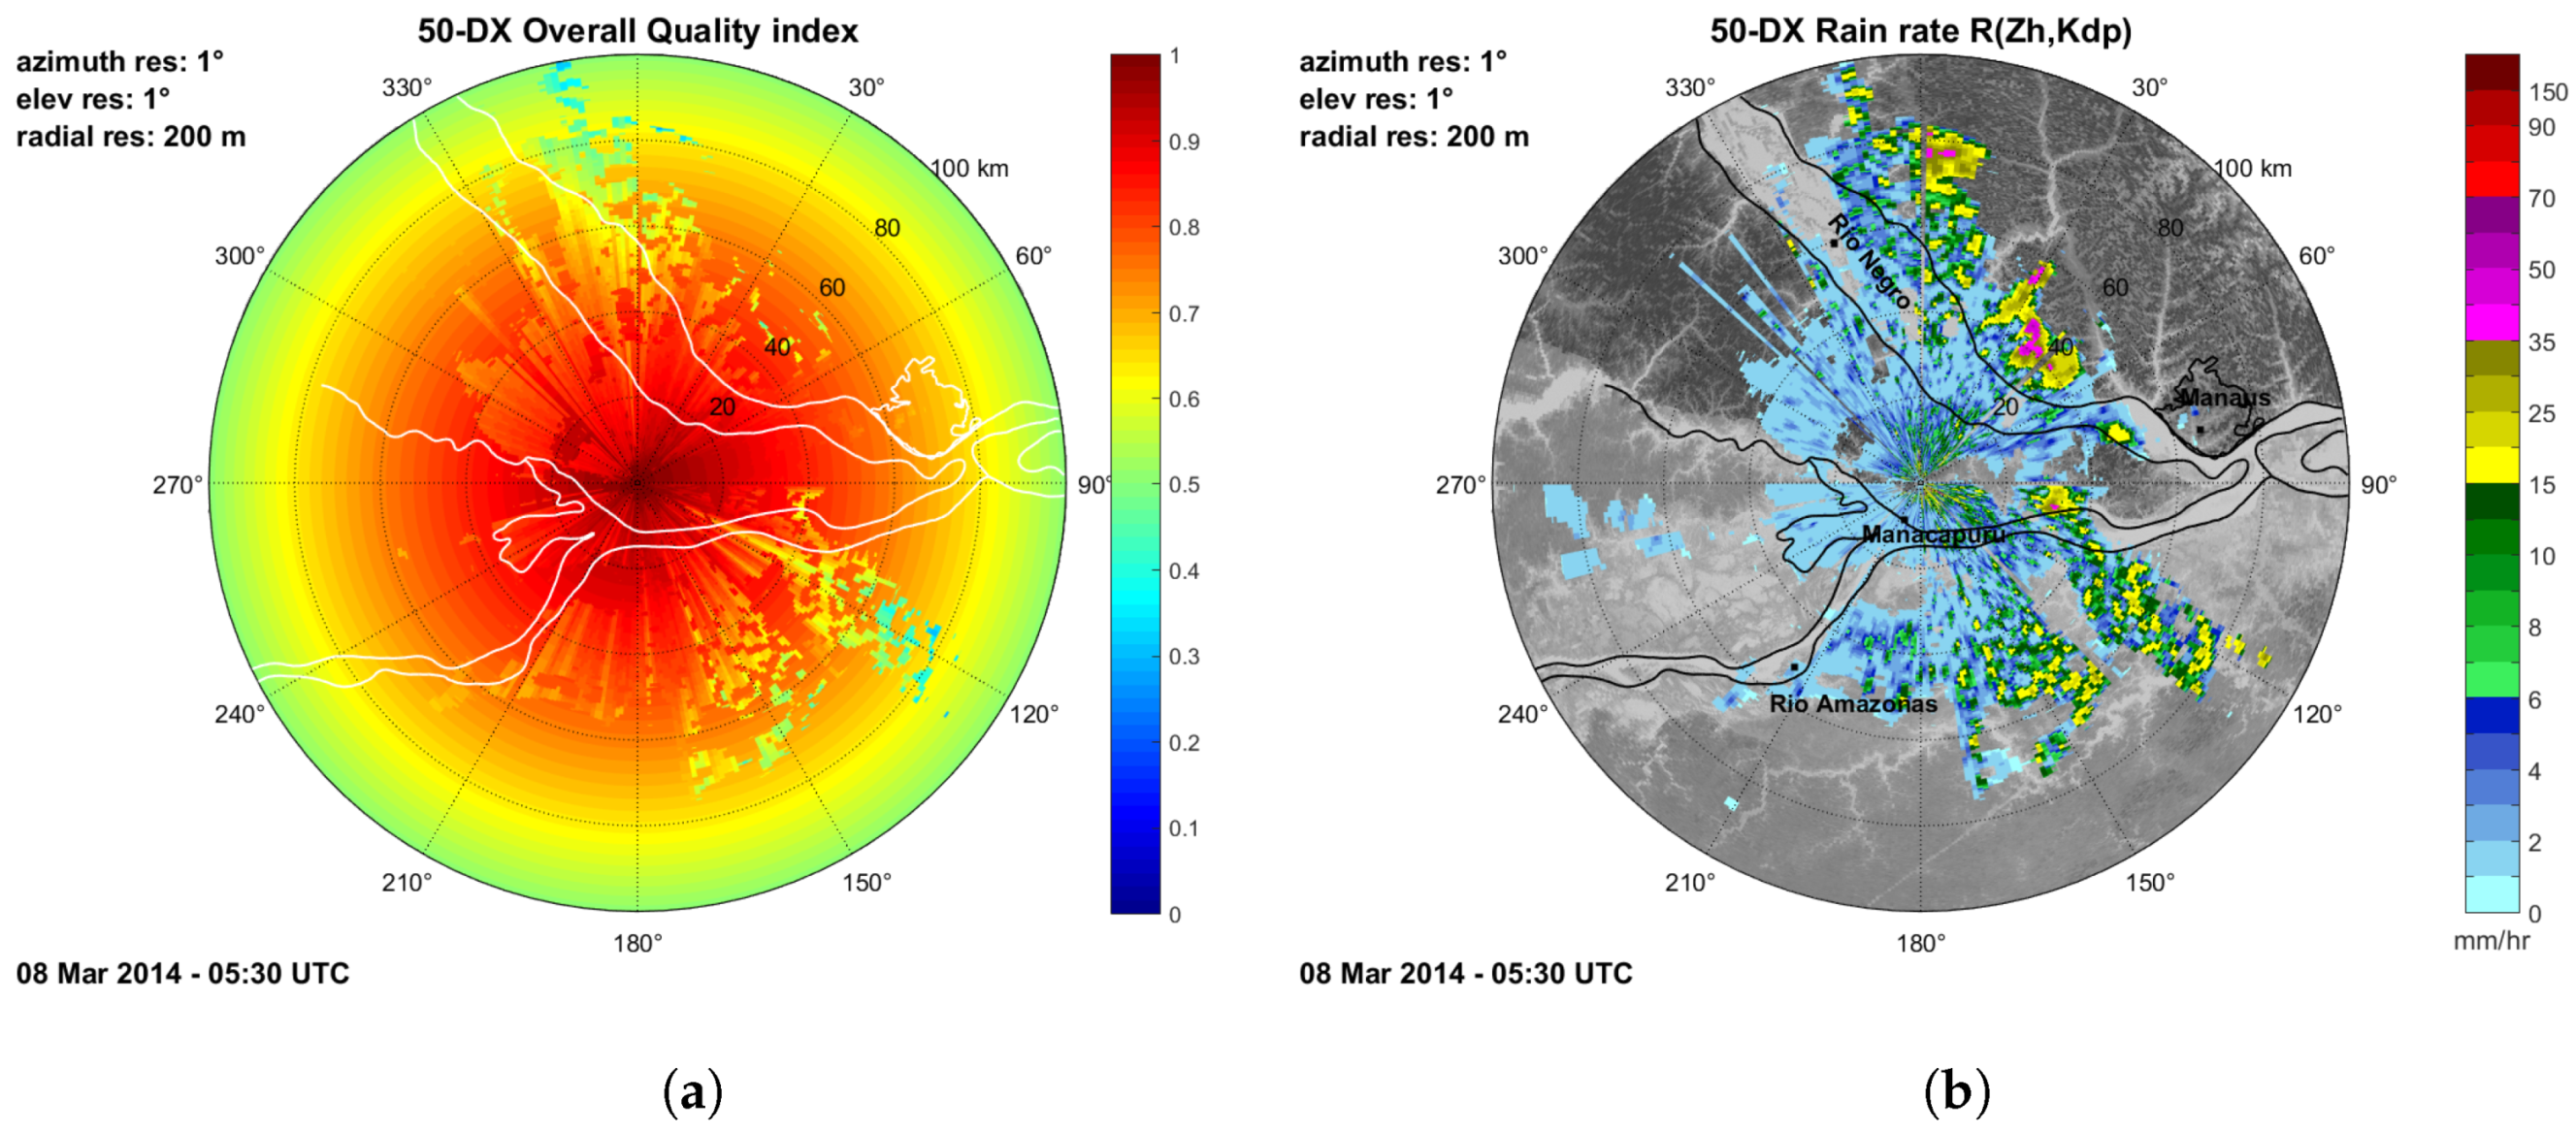
Figure 12.
(a) Overall radar quality index and (b) Rain rate from radar on 8 March 2014 at 05:30 UTC.
Figure 12.
(a) Overall radar quality index and (b) Rain rate from radar on 8 March 2014 at 05:30 UTC.
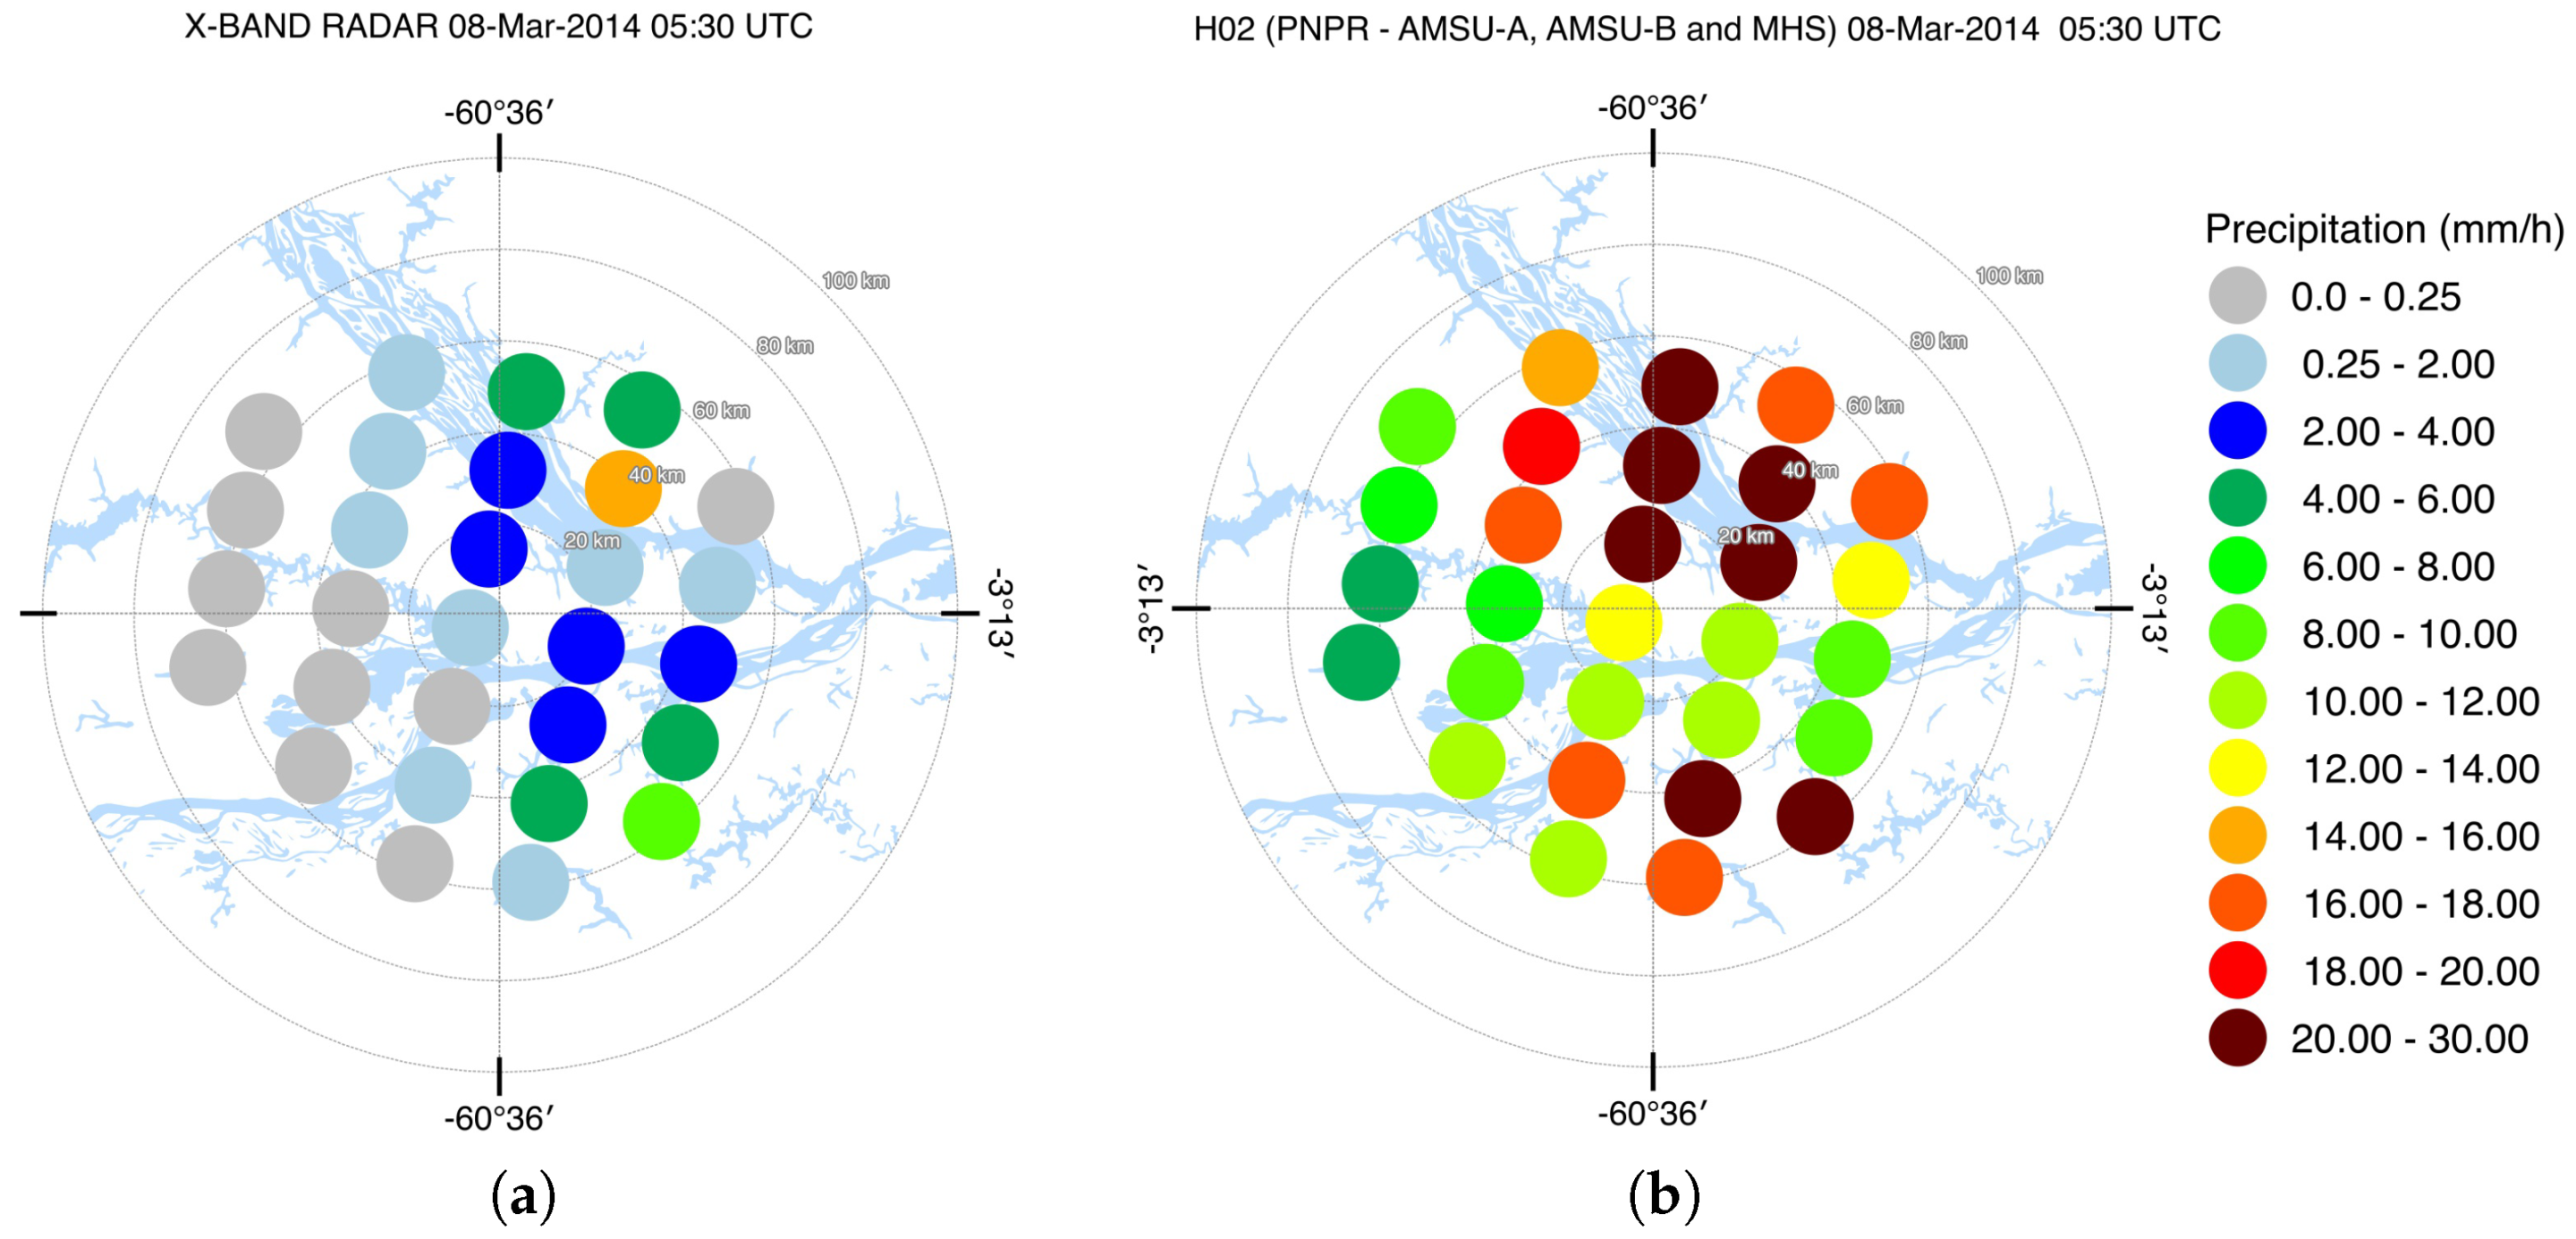
Figure 13.
(a) Rain rate from radar upscaled to the satellite grid and (b) H02 rain rate map in Manaus on 8 March 2014 at 05:30 UTC.
Figure 13.
(a) Rain rate from radar upscaled to the satellite grid and (b) H02 rain rate map in Manaus on 8 March 2014 at 05:30 UTC.
Figure 14.
(a) Overall radar quality index and (b) Rain rate from radar on 8 March 2014 at 05:10 UTC.
Figure 14.
(a) Overall radar quality index and (b) Rain rate from radar on 8 March 2014 at 05:10 UTC.
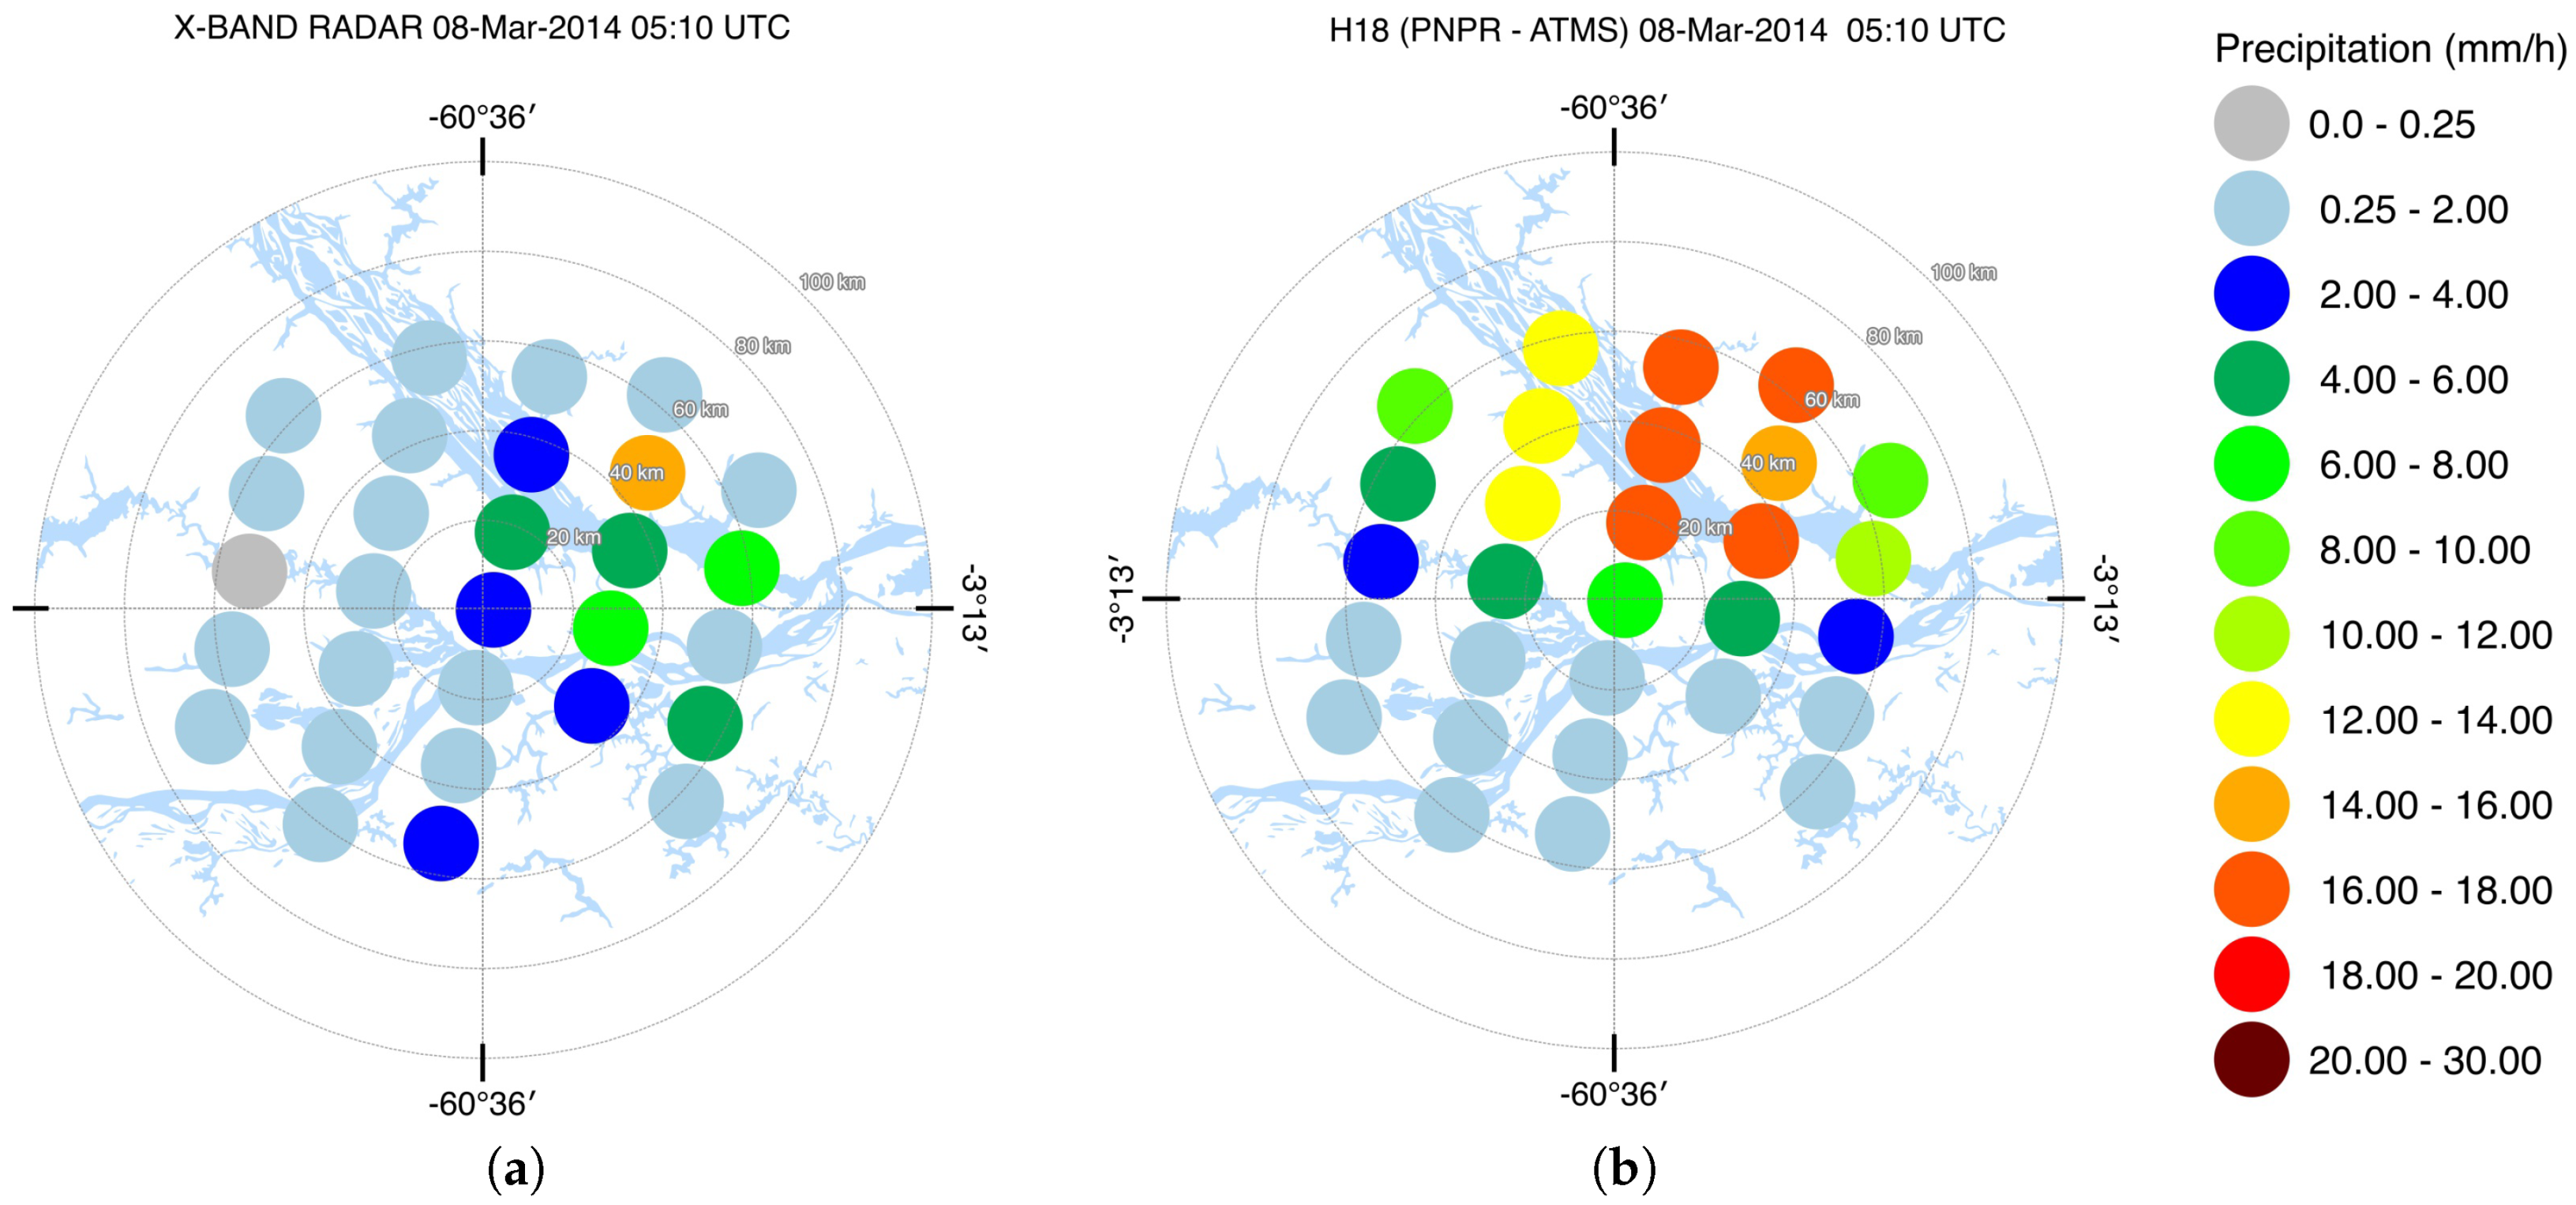
Figure 15.
(a) Rain rate from radar upscaled to the satellite grid and (b) H18 rain rate map in Manaus on 8 March 2014 at 05:10 UTC.
Figure 15.
(a) Rain rate from radar upscaled to the satellite grid and (b) H18 rain rate map in Manaus on 8 March 2014 at 05:10 UTC.
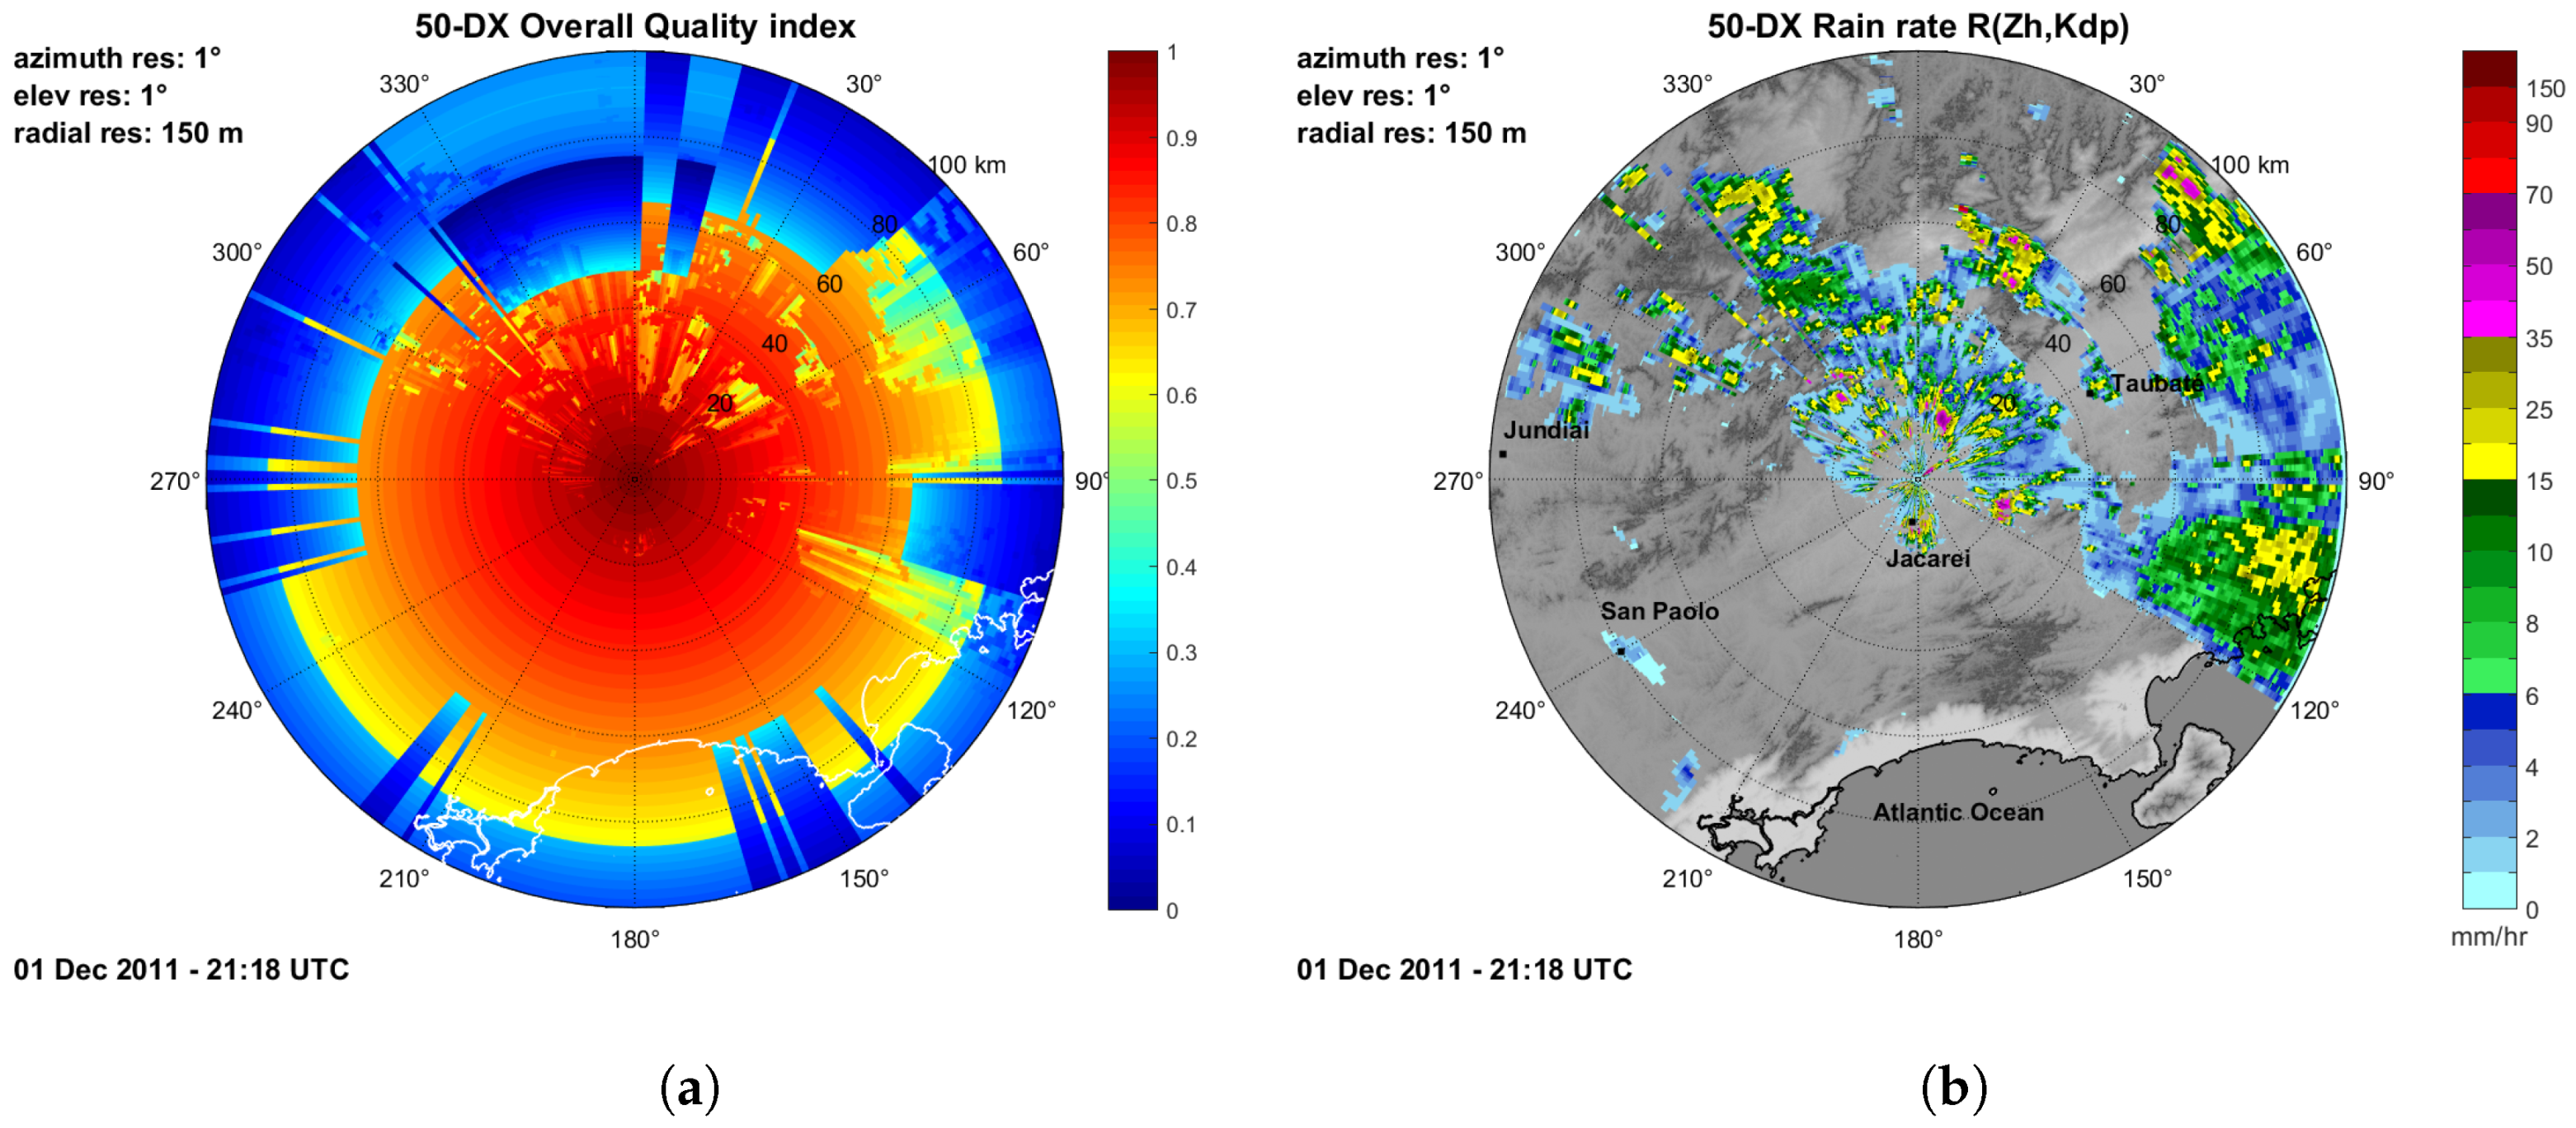
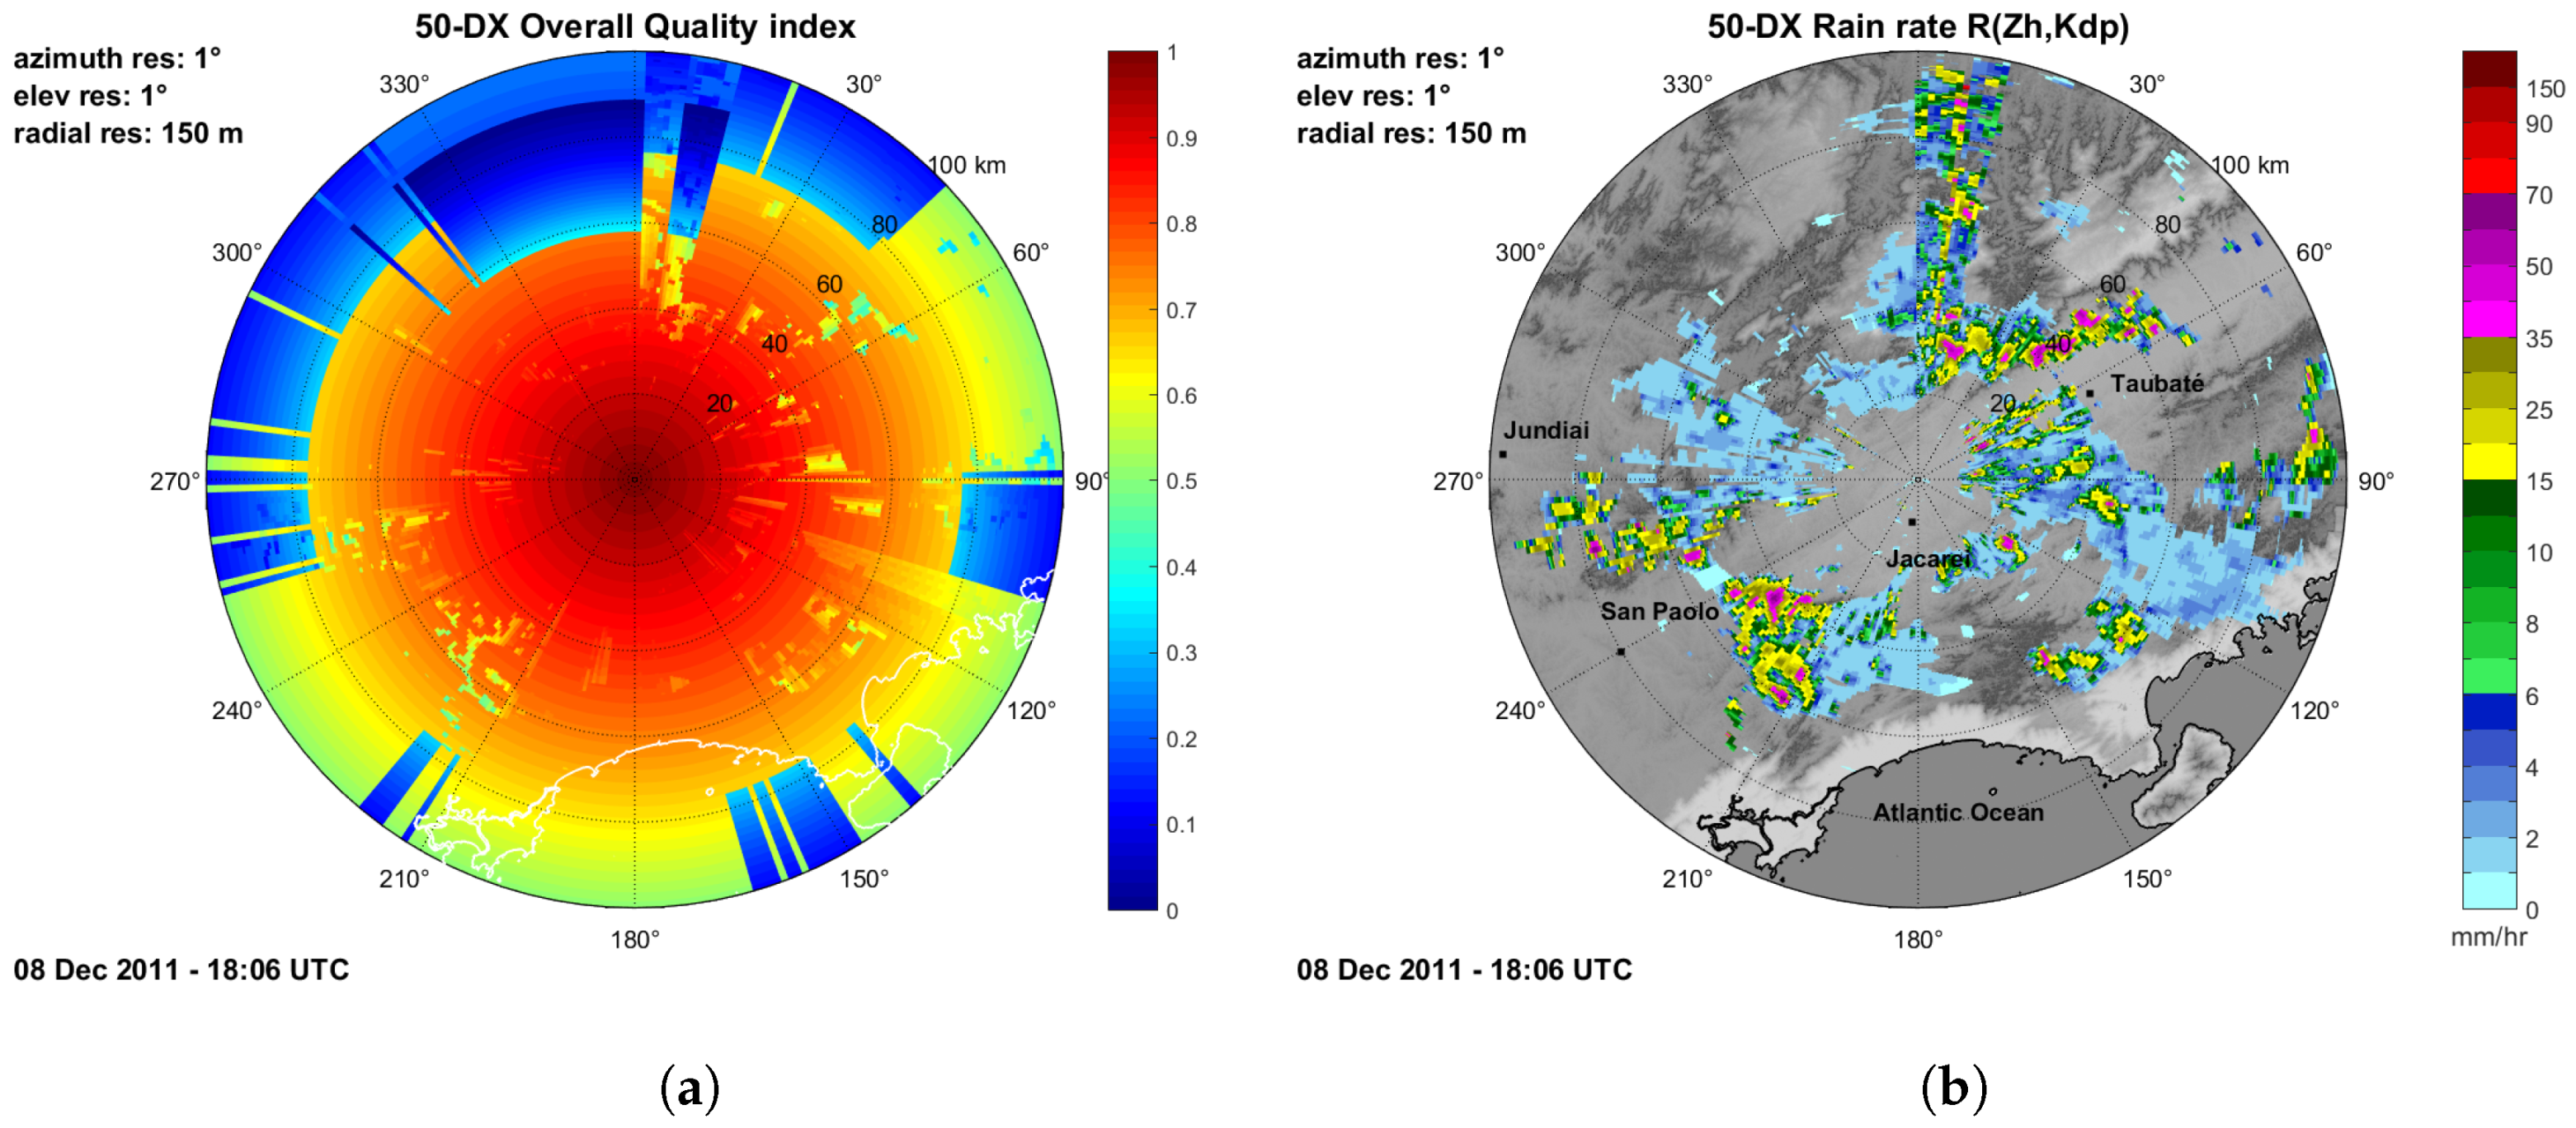
Figure 16.
(a) Overall radar quality index and (b) Rain rate from radar on 1 December 2011 at 21:18 UTC.
Figure 16.
(a) Overall radar quality index and (b) Rain rate from radar on 1 December 2011 at 21:18 UTC.
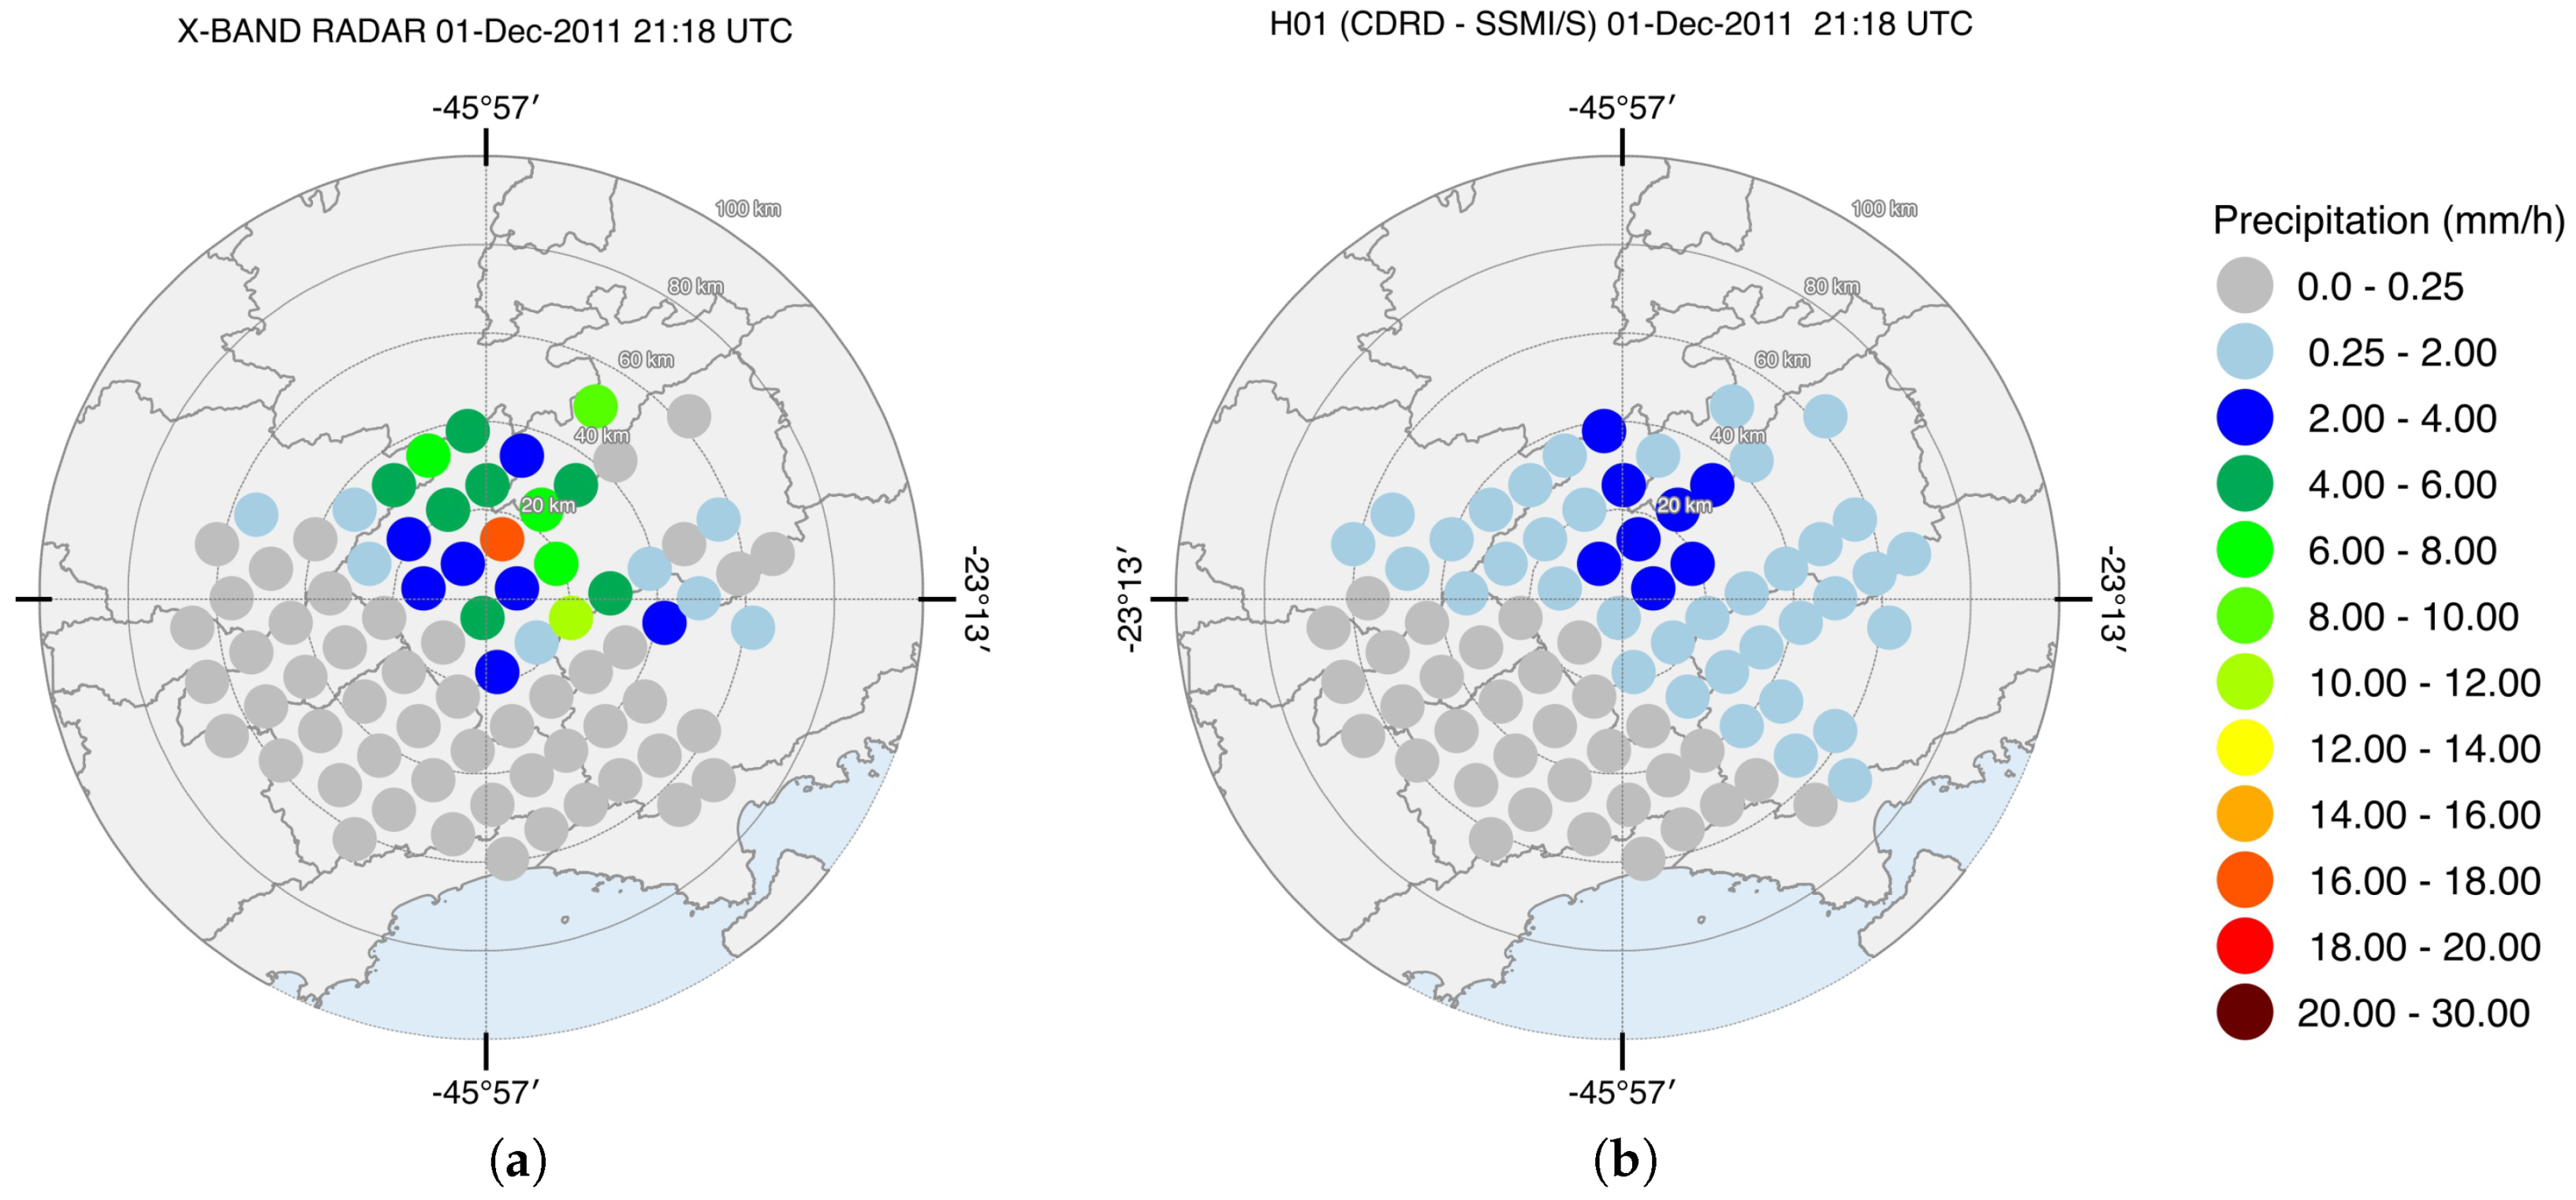
Figure 17.
(a) Rain rate from radar upscaled to the satellite grid and (b) H01 rain rate map in Vale do Paraíba on 1 December 2011 at 21:18 UTC.
Figure 17.
(a) Rain rate from radar upscaled to the satellite grid and (b) H01 rain rate map in Vale do Paraíba on 1 December 2011 at 21:18 UTC.
Figure 18.
(a) Overall radar quality index and (b) Rain rate from radar on 8 December 2011 at 18:06 UTC.
Figure 18.
(a) Overall radar quality index and (b) Rain rate from radar on 8 December 2011 at 18:06 UTC.
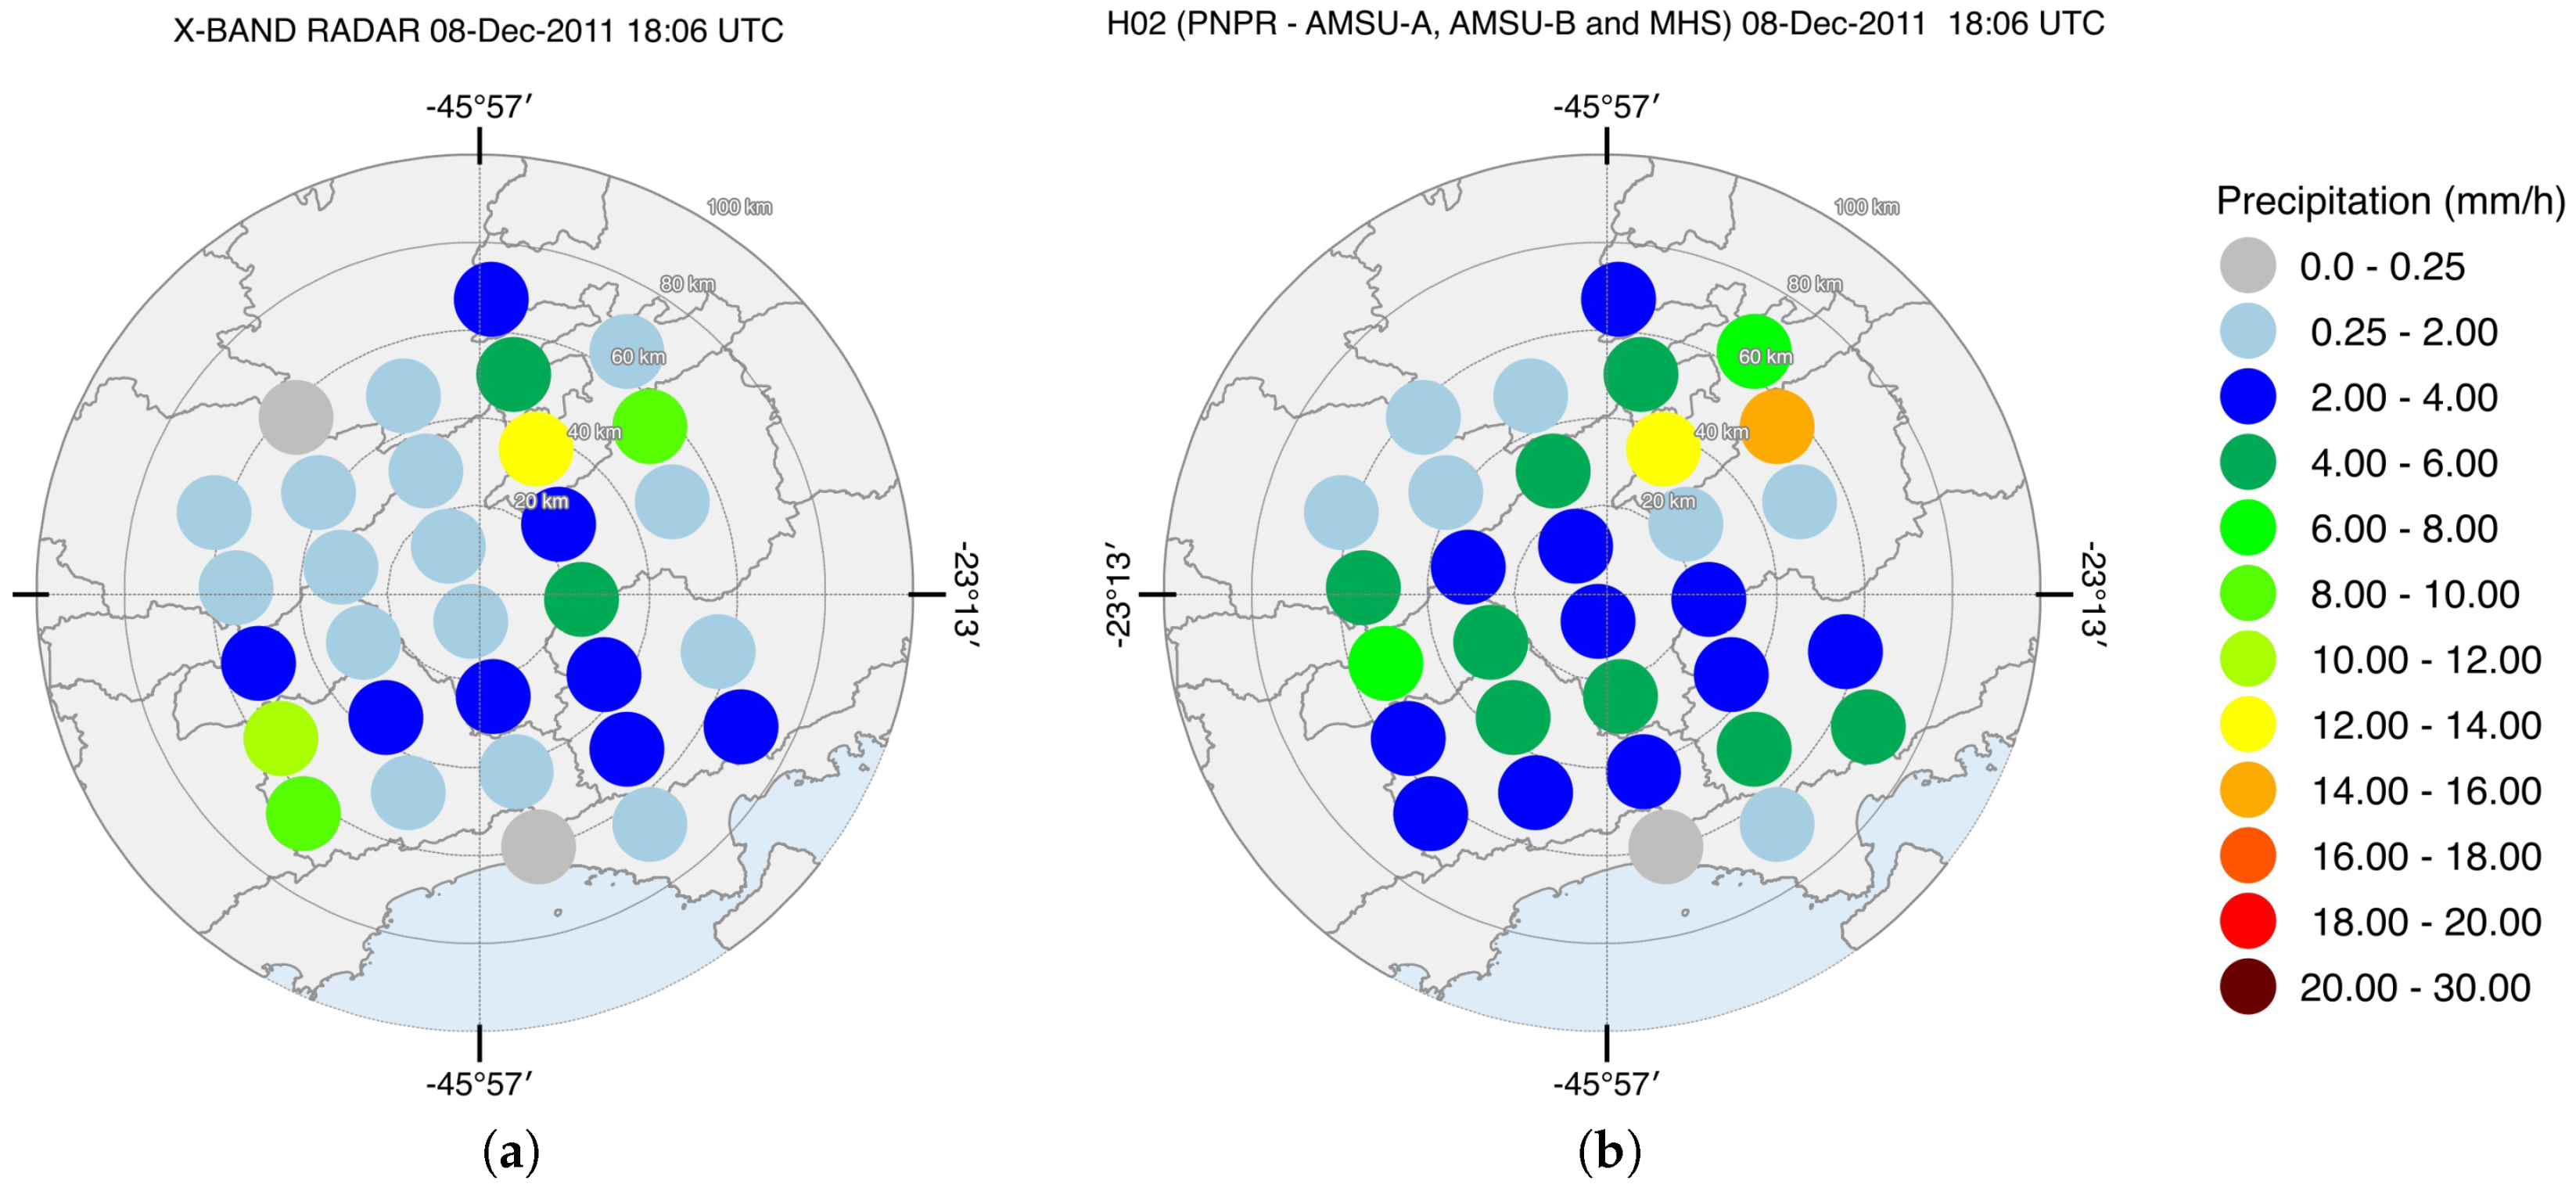
Figure 19.
(a) Rain rate from radar upscaled to the satellite grid and (b) H02 rain rate map in Vale do Paraíba on 8 December 2011 at 18:06 UTC.
Figure 19.
(a) Rain rate from radar upscaled to the satellite grid and (b) H02 rain rate map in Vale do Paraíba on 8 December 2011 at 18:06 UTC.
Figure 20.
(a) GHz, (b) GHz, (c) GHz, (d) Screening of precipitation (0—no rain, 1—rain) and (e) Surface Precipitation (mm/h) on 21 February 2014 at 12:10 UTC in the Manaus region.
Figure 20.
(a) GHz, (b) GHz, (c) GHz, (d) Screening of precipitation (0—no rain, 1—rain) and (e) Surface Precipitation (mm/h) on 21 February 2014 at 12:10 UTC in the Manaus region.
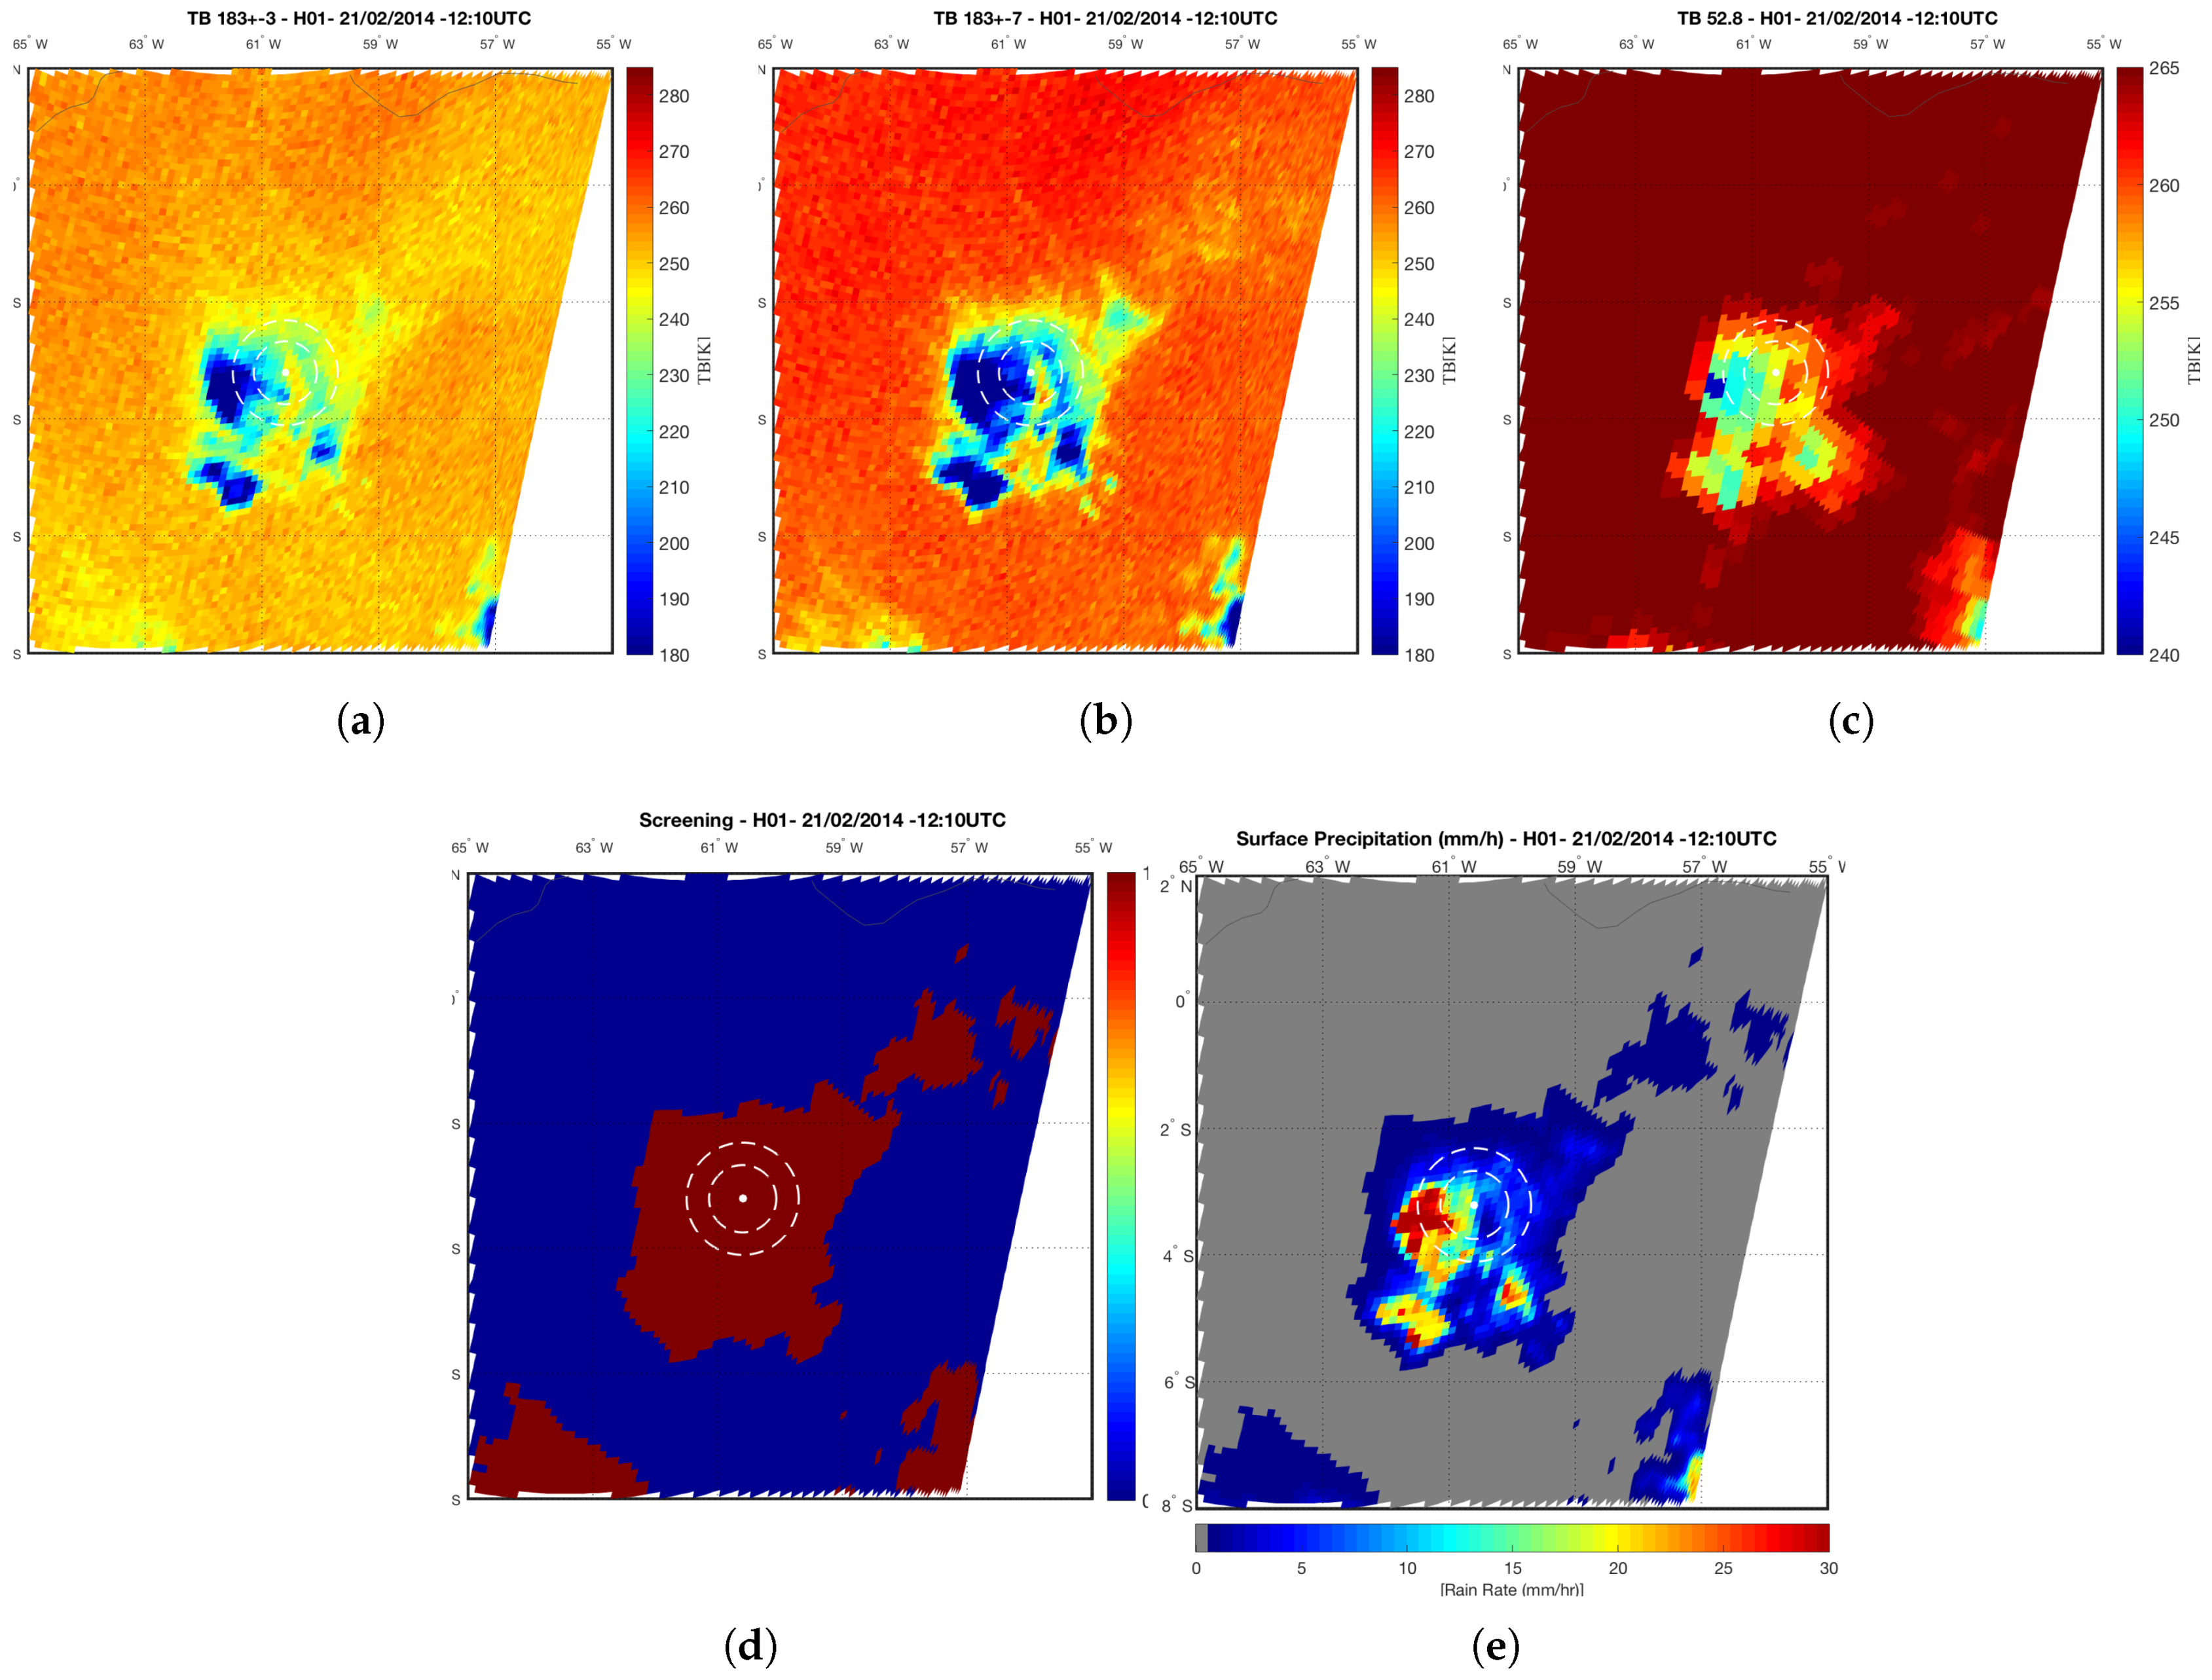
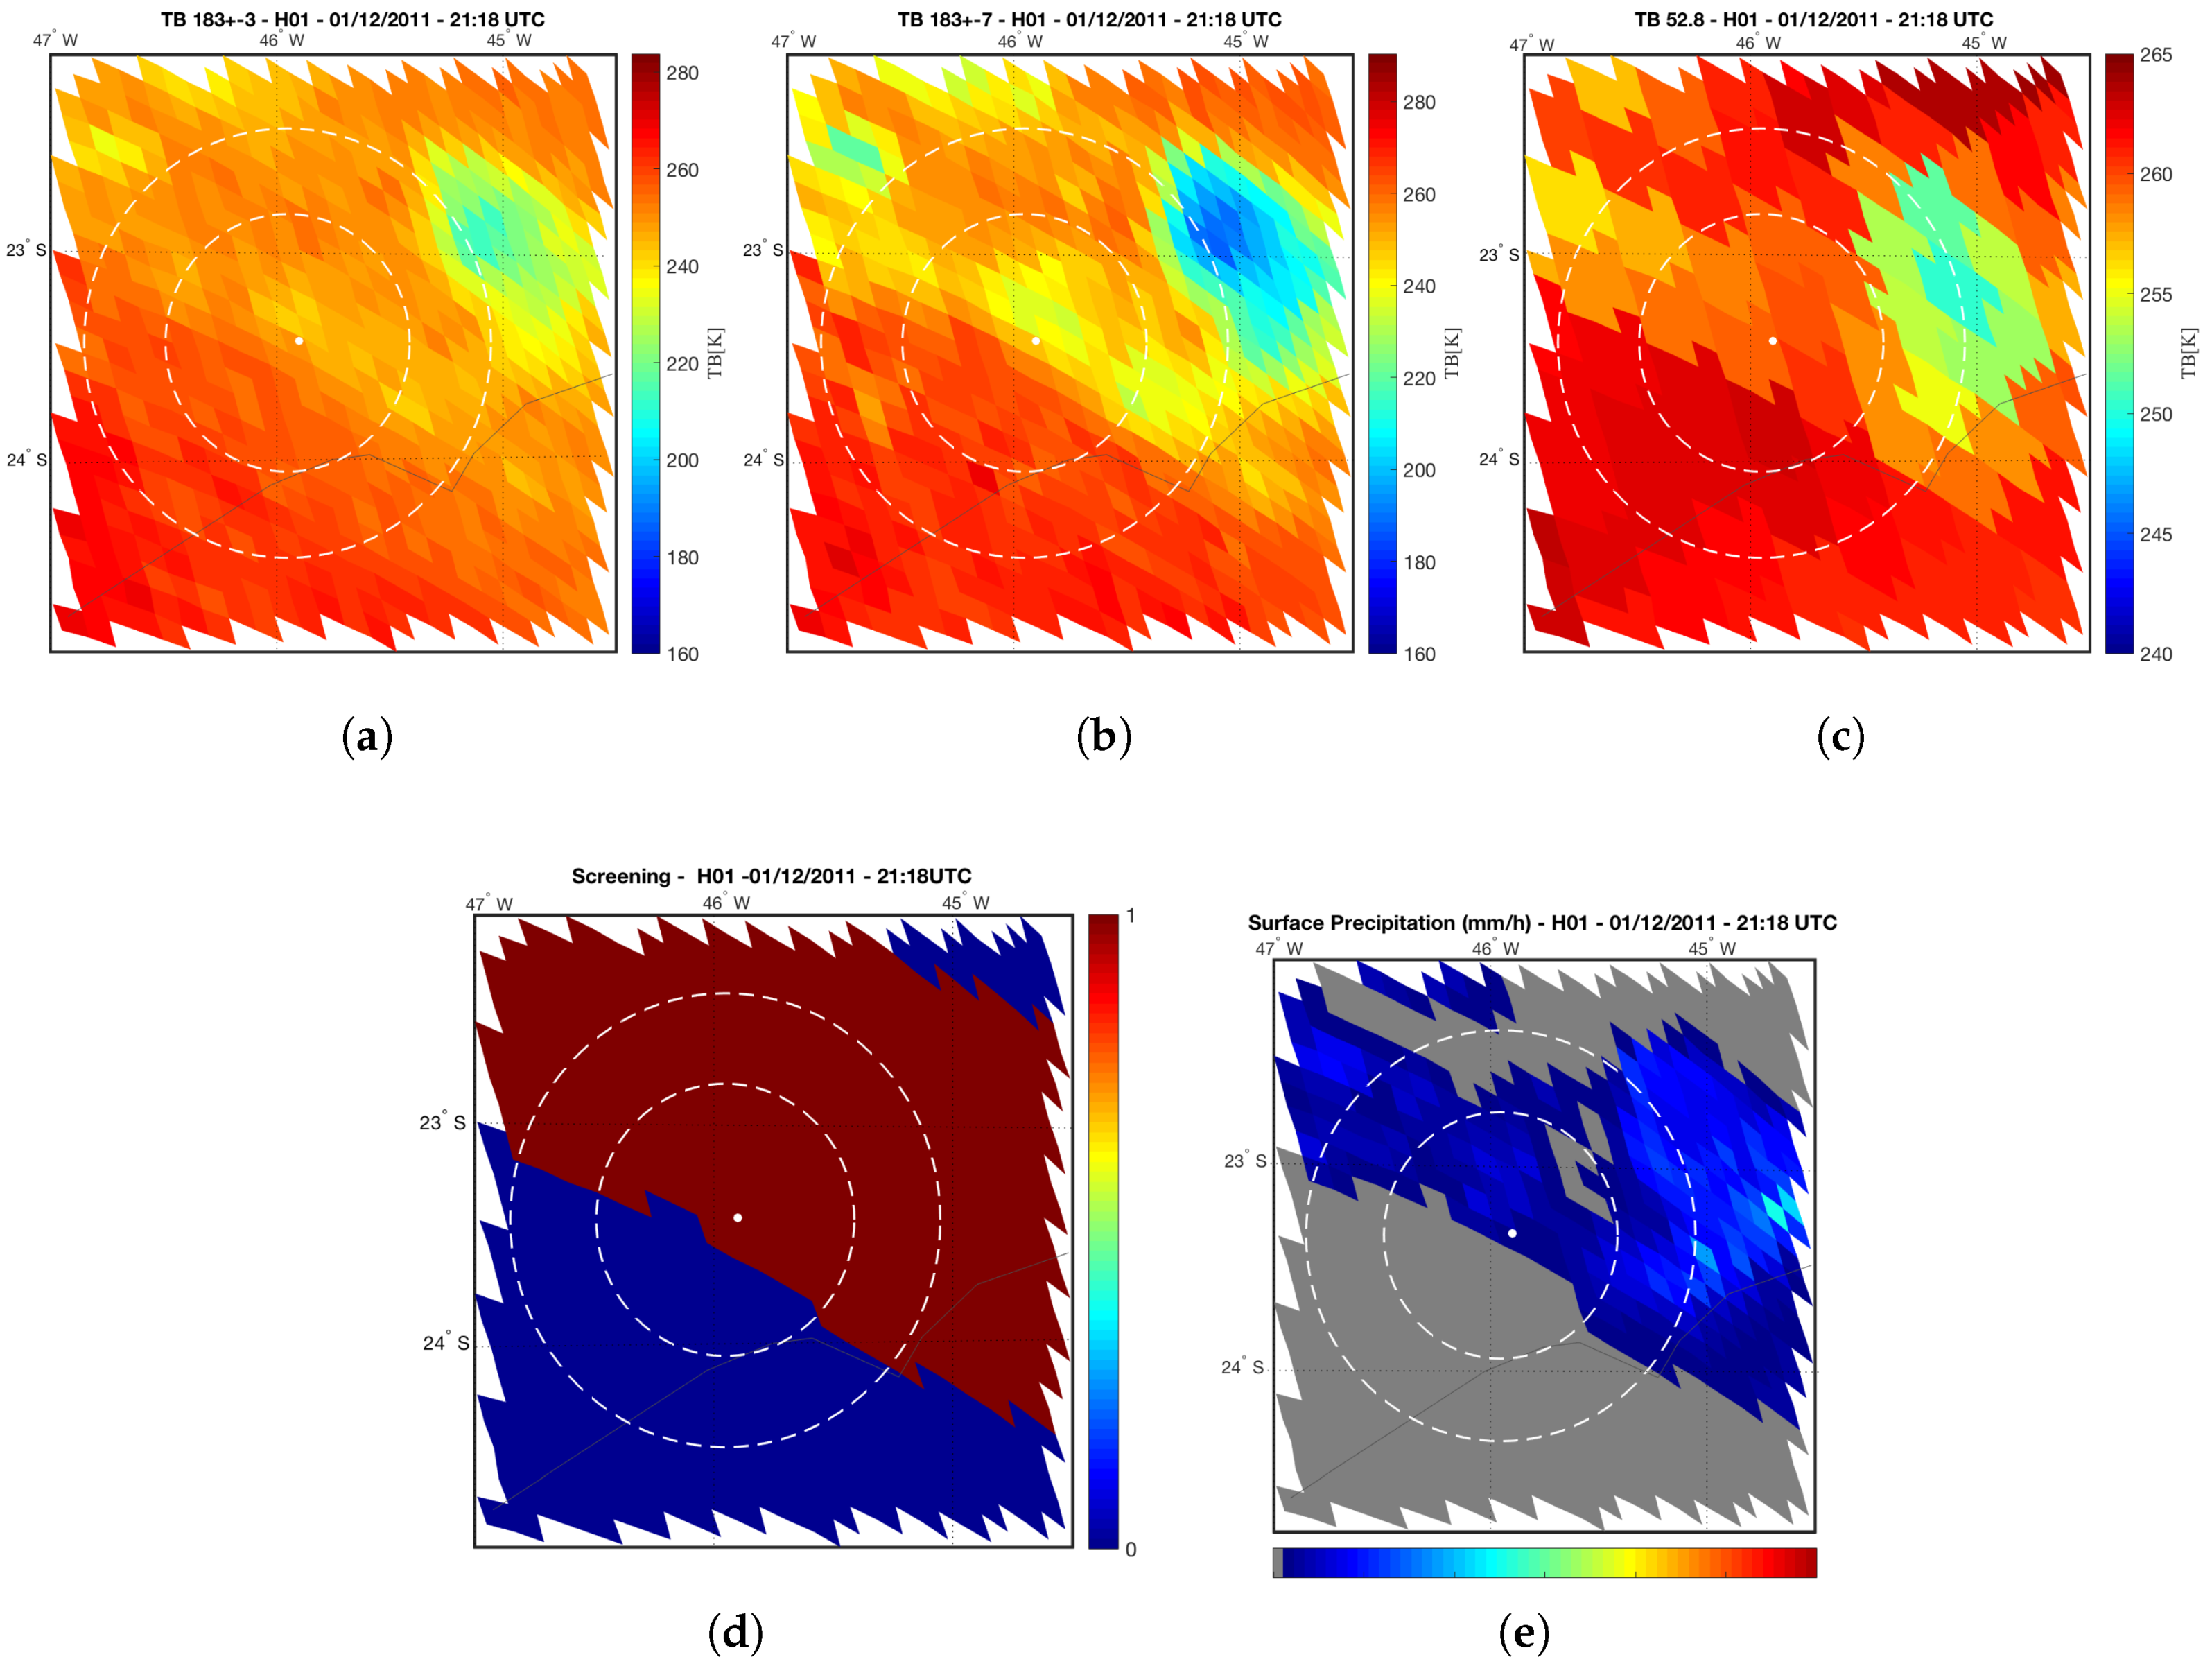
Figure 21.
(a) GHz, (b) GHz, (c) GHz, (d) Screening of precipitation (0—no rain, 1—rain) and (e) Surface Precipitation (mm/h) on 1 December 2011 at 21:18 UTC in the Vale do Paraíba region.
Figure 21.
(a) GHz, (b) GHz, (c) GHz, (d) Screening of precipitation (0—no rain, 1—rain) and (e) Surface Precipitation (mm/h) on 1 December 2011 at 21:18 UTC in the Vale do Paraíba region.
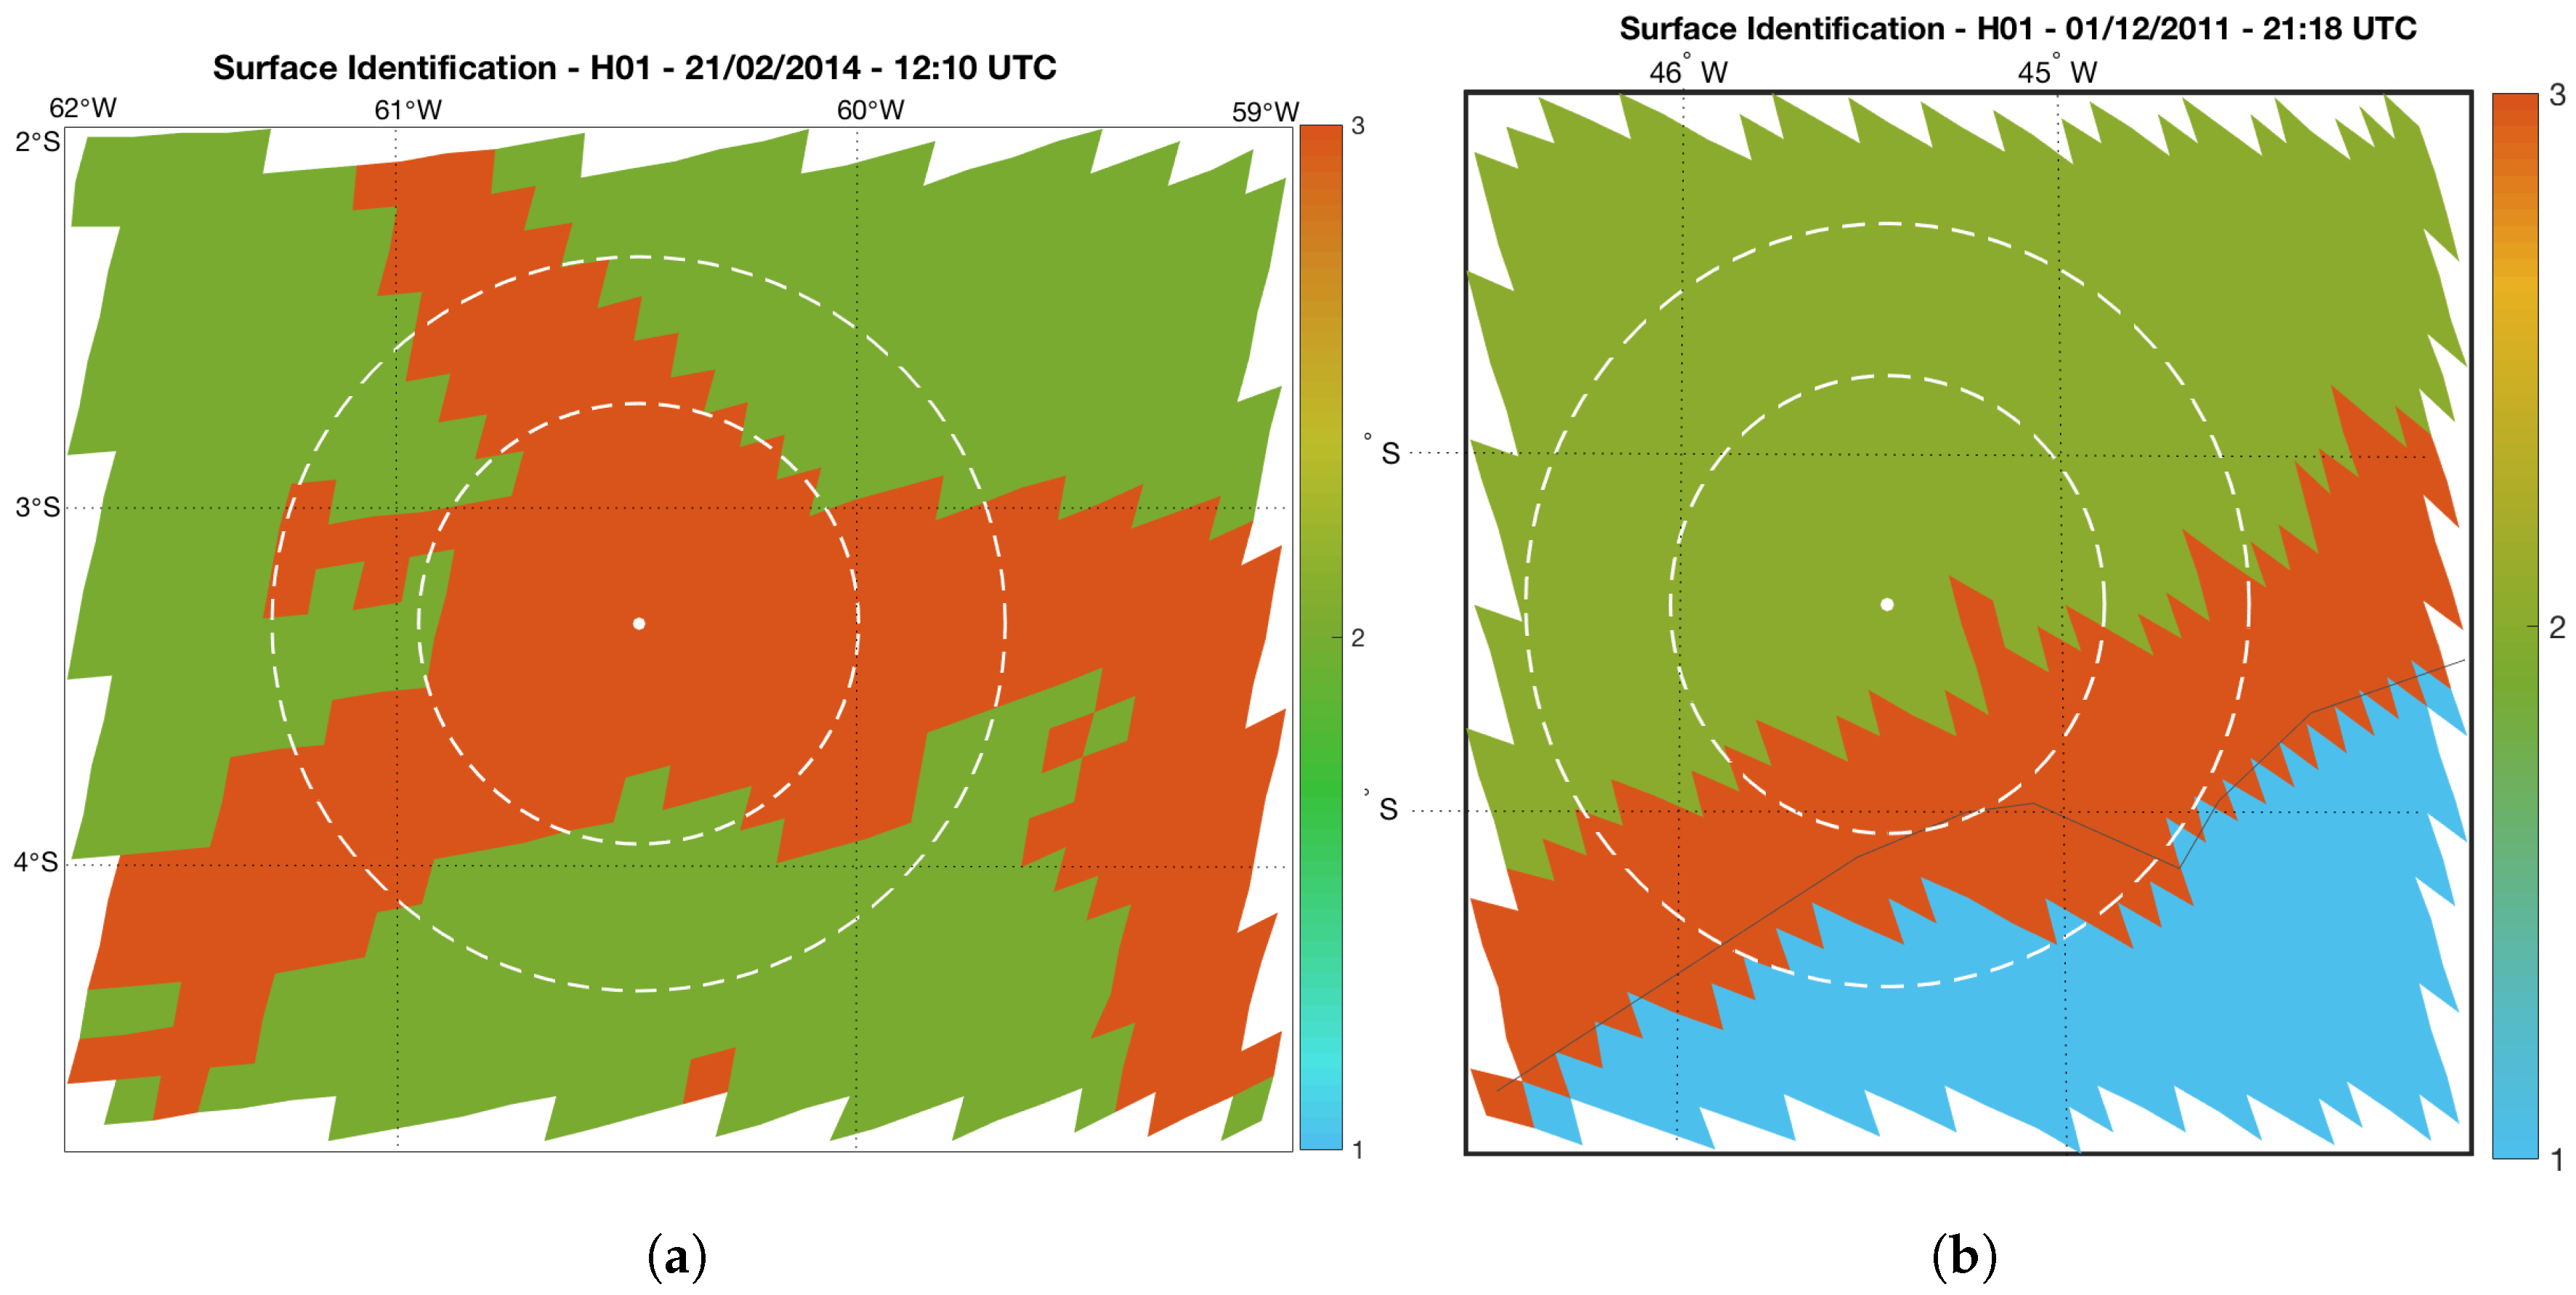
Figure 22.
Surface Identification (1—Ocean, 2—Land, 3—Coast) for (a) Manaus and (b) Vale do Paraíba.
Figure 22.
Surface Identification (1—Ocean, 2—Land, 3—Coast) for (a) Manaus and (b) Vale do Paraíba.
Table 1.
Parameters of R() and R() power law relations for the CHUVA X-band Radar.
Table 1.
Parameters of R() and R() power law relations for the CHUVA X-band Radar.
| | R() | | R() |
|---|
| | a | b | | c | d |
|---|
| MP48 | 0.0208 | 0.680 | SC12 | 15.813 | 0.774 |
| BC01 | 19.193 | 0.850 |
Table 2.
Continuous statistical scores.
Table 2.
Continuous statistical scores.
| Score | Perfect Score | Calculation |
|---|
| Mean error or bias (ME) | 0 | |
| Standard deviation (SD) | 0 | |
| Root mean square error (RMSE) | 0 | |
| Fractional standard error (FSE) | 0 | |
| Correlation coefficient (CC) | 1 | |
Table 3.
Multicategory scores.
Table 3.
Multicategory scores.
| Score | Perfect Score | Calculation |
|---|
| Probability of Detection (POD) | 1 | |
| False alarm rate (FAR) | 0 | |
| Critical success index (CSI) | 1 | |
Table 4.
Statistical continuous scores for Manaus for H01, H02 and H18. The number inside parenthesis represents the number of matched pixel pairs for each algorithm.
Table 4.
Statistical continuous scores for Manaus for H01, H02 and H18. The number inside parenthesis represents the number of matched pixel pairs for each algorithm.
| Algorithm | Sat. Mean | Rad. Mean | ME | RMSE | SD | FSE | CORR |
|---|
| H01 (406) | 4.60 | 0.93 | 3.67 | 5.20 | 3.69 | 5.59 | 0.40 |
| H02 (631) | 3.78 | 1.18 | 2.59 | 5.11 | 4.40 | 4.32 | 0.32 |
| H18 (140) | 4.53 | 1.46 | 3.07 | 5.10 | 4.07 | 3.48 | 0.34 |
Table 5.
Multicategory scores for Manaus for H01, H02 and H18. The number inside parenthesis concerns the number of matched pixel pairs for each algorithm.
Table 5.
Multicategory scores for Manaus for H01, H02 and H18. The number inside parenthesis concerns the number of matched pixel pairs for each algorithm.
| Algorithm | POD | FAR | CSI |
|---|
| H01 (3149) | 0.75 | 0.54 | 0.39 |
| H02 (1889) | 0.96 | 0.47 | 0.51 |
| H18 (916) | 0.81 | 0.39 | 0.53 |
Table 6.
Continuous scores for Vale do Paraíba for H01 and H02. The number inside parenthesis concerns the number of matched pixel pairs for each algorithm.
Table 6.
Continuous scores for Vale do Paraíba for H01 and H02. The number inside parenthesis concerns the number of matched pixel pairs for each algorithm.
| Algorithm | Sat. Mean | Rad. Mean | ME | RMSE | SD | FSE | CORR |
|---|
| H01 (181) | 2.53 | 2.89 | −0.35 | 4.00 | 3.98 | 1.38 | 0.44 |
| H02 (124) | 2.45 | 2.76 | −0.30 | 3.56 | 3.55 | 1.29 | 0.37 |
Table 7.
Multi-category scores for Vale do Paraíba for H01 and H02. The number inside parenthesis concerns the number of matched pixel pairs for each algorithm.
Table 7.
Multi-category scores for Vale do Paraíba for H01 and H02. The number inside parenthesis concerns the number of matched pixel pairs for each algorithm.
| Algorithm | POD | FAR | CSI |
|---|
| H01 (2420) | 0.49 | 0.49 | 0.33 |
| H02 (991) | 0.43 | 0.21 | 0.39 |

 ,
, 


