Multi-Resolution Feature Fusion for Image Classification of Building Damages with Convolutional Neural Networks


Abstract
:1. Introduction
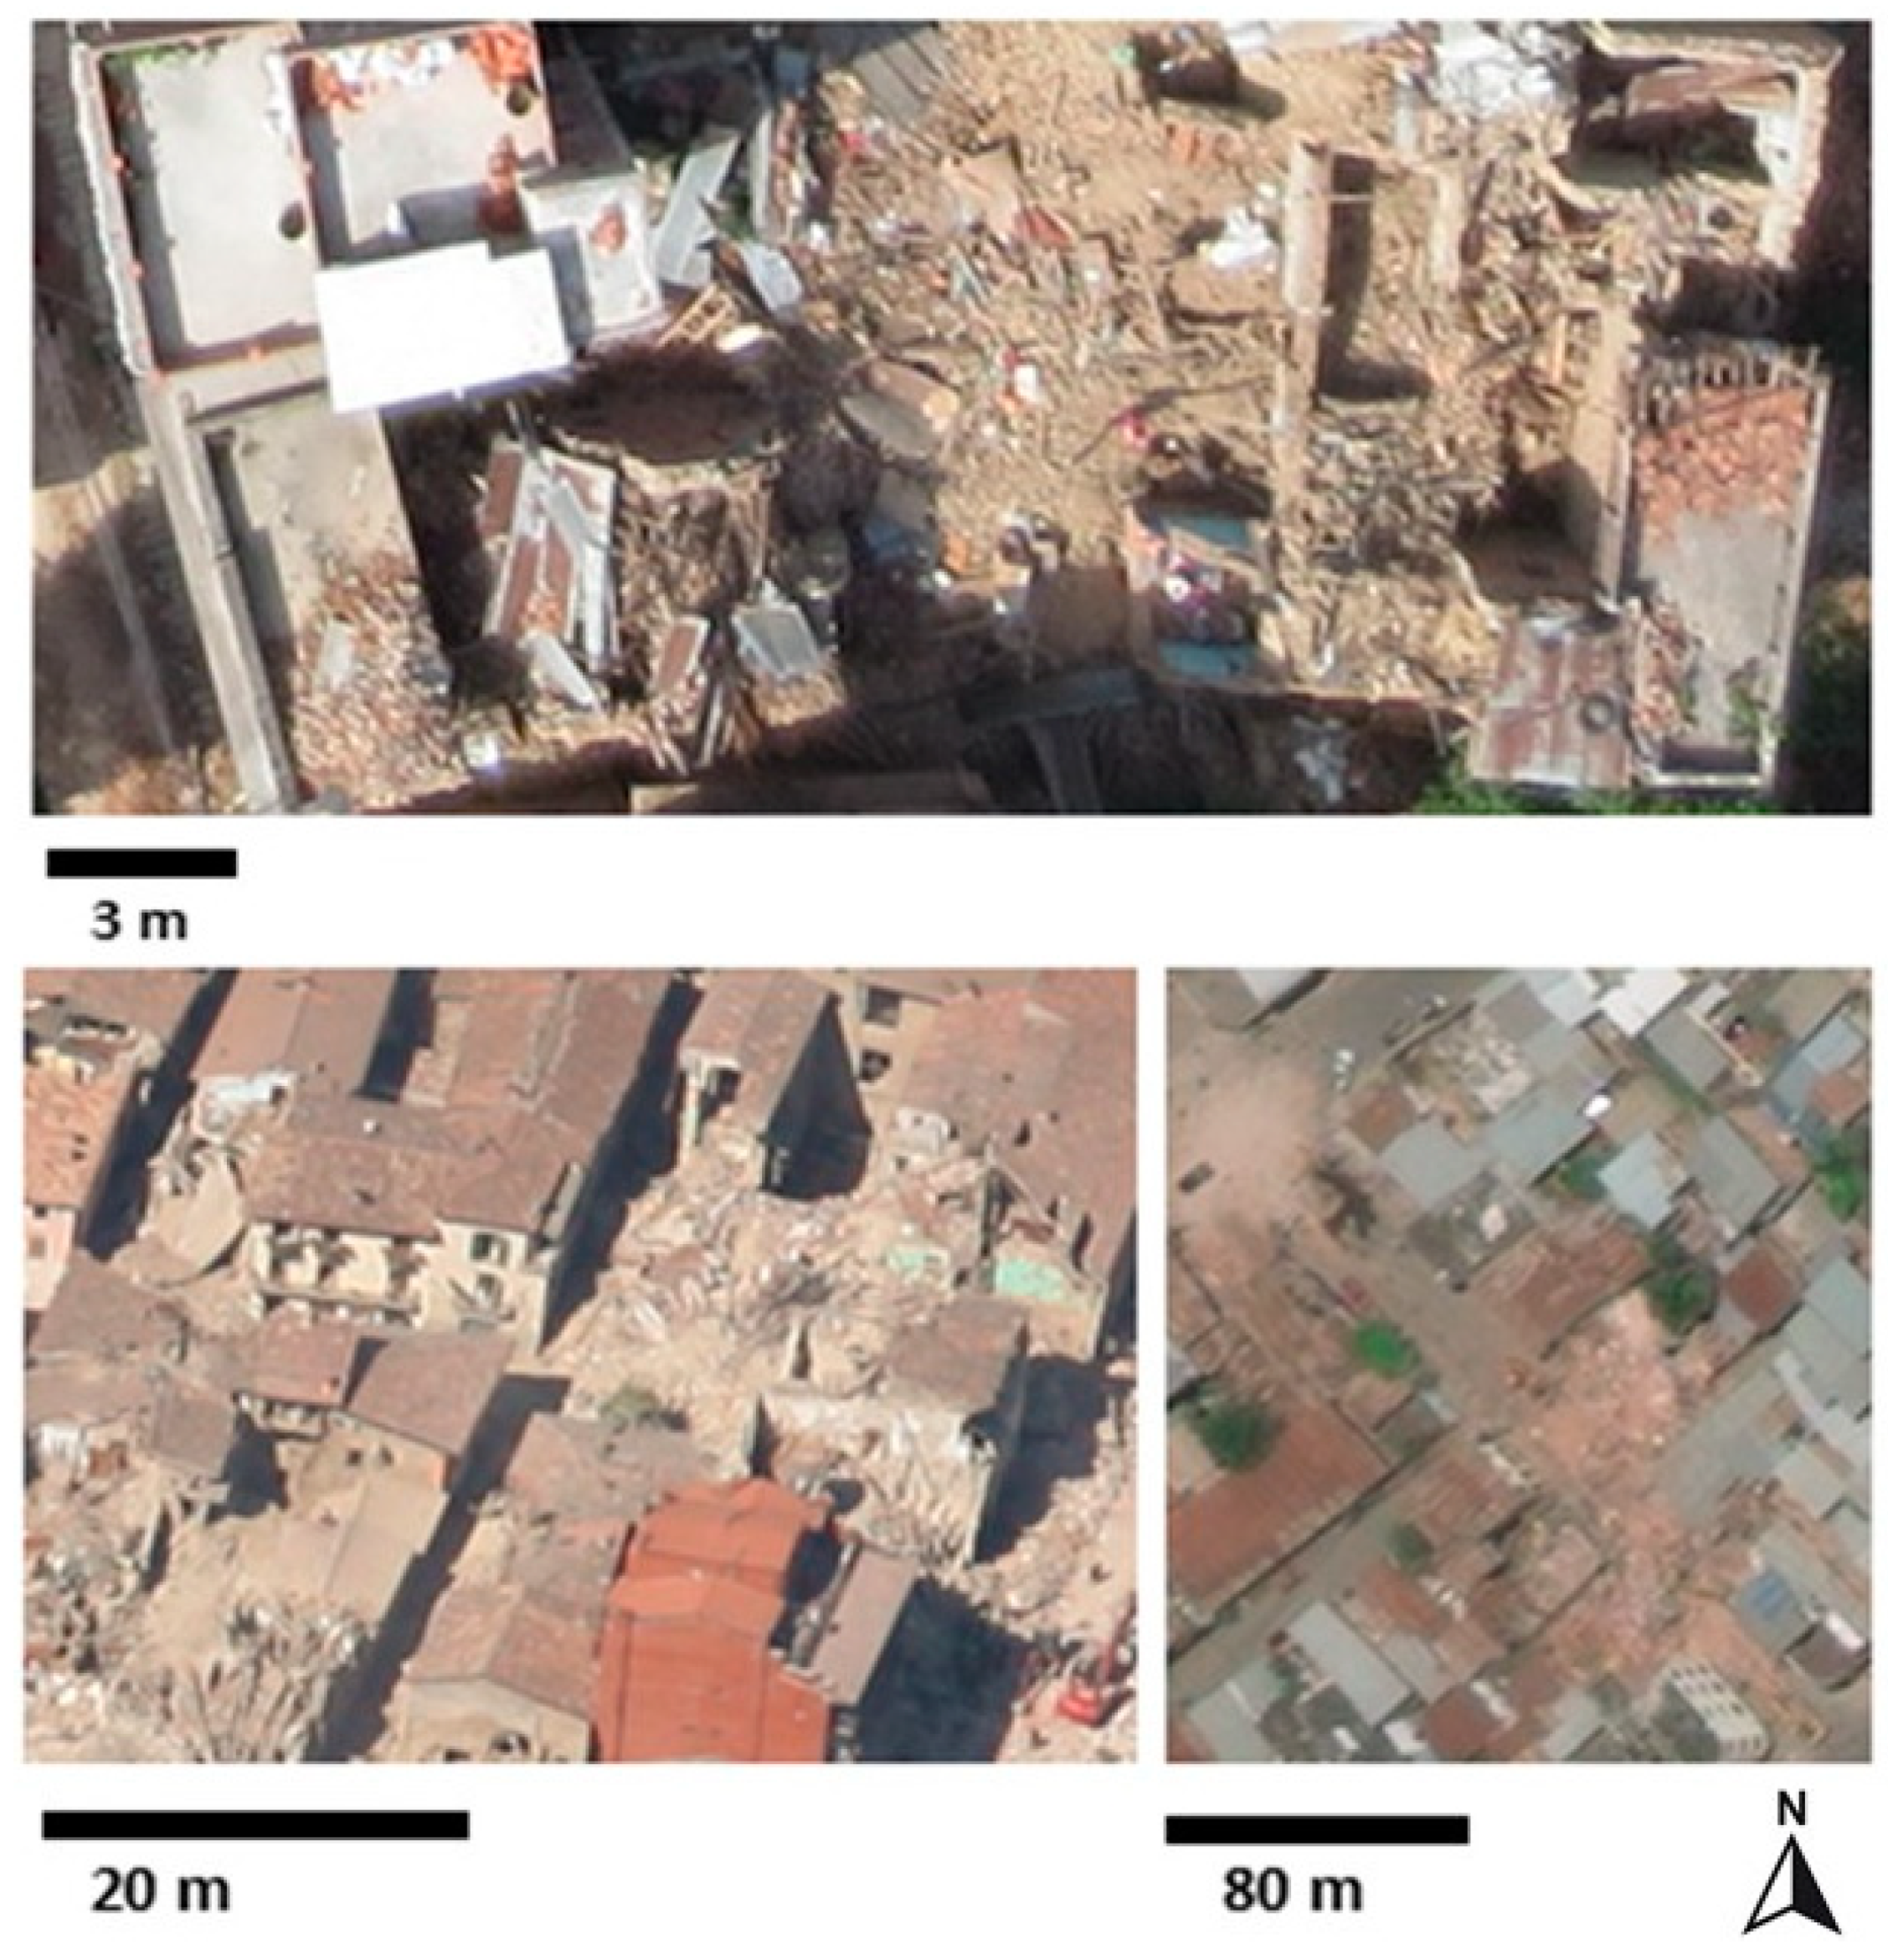
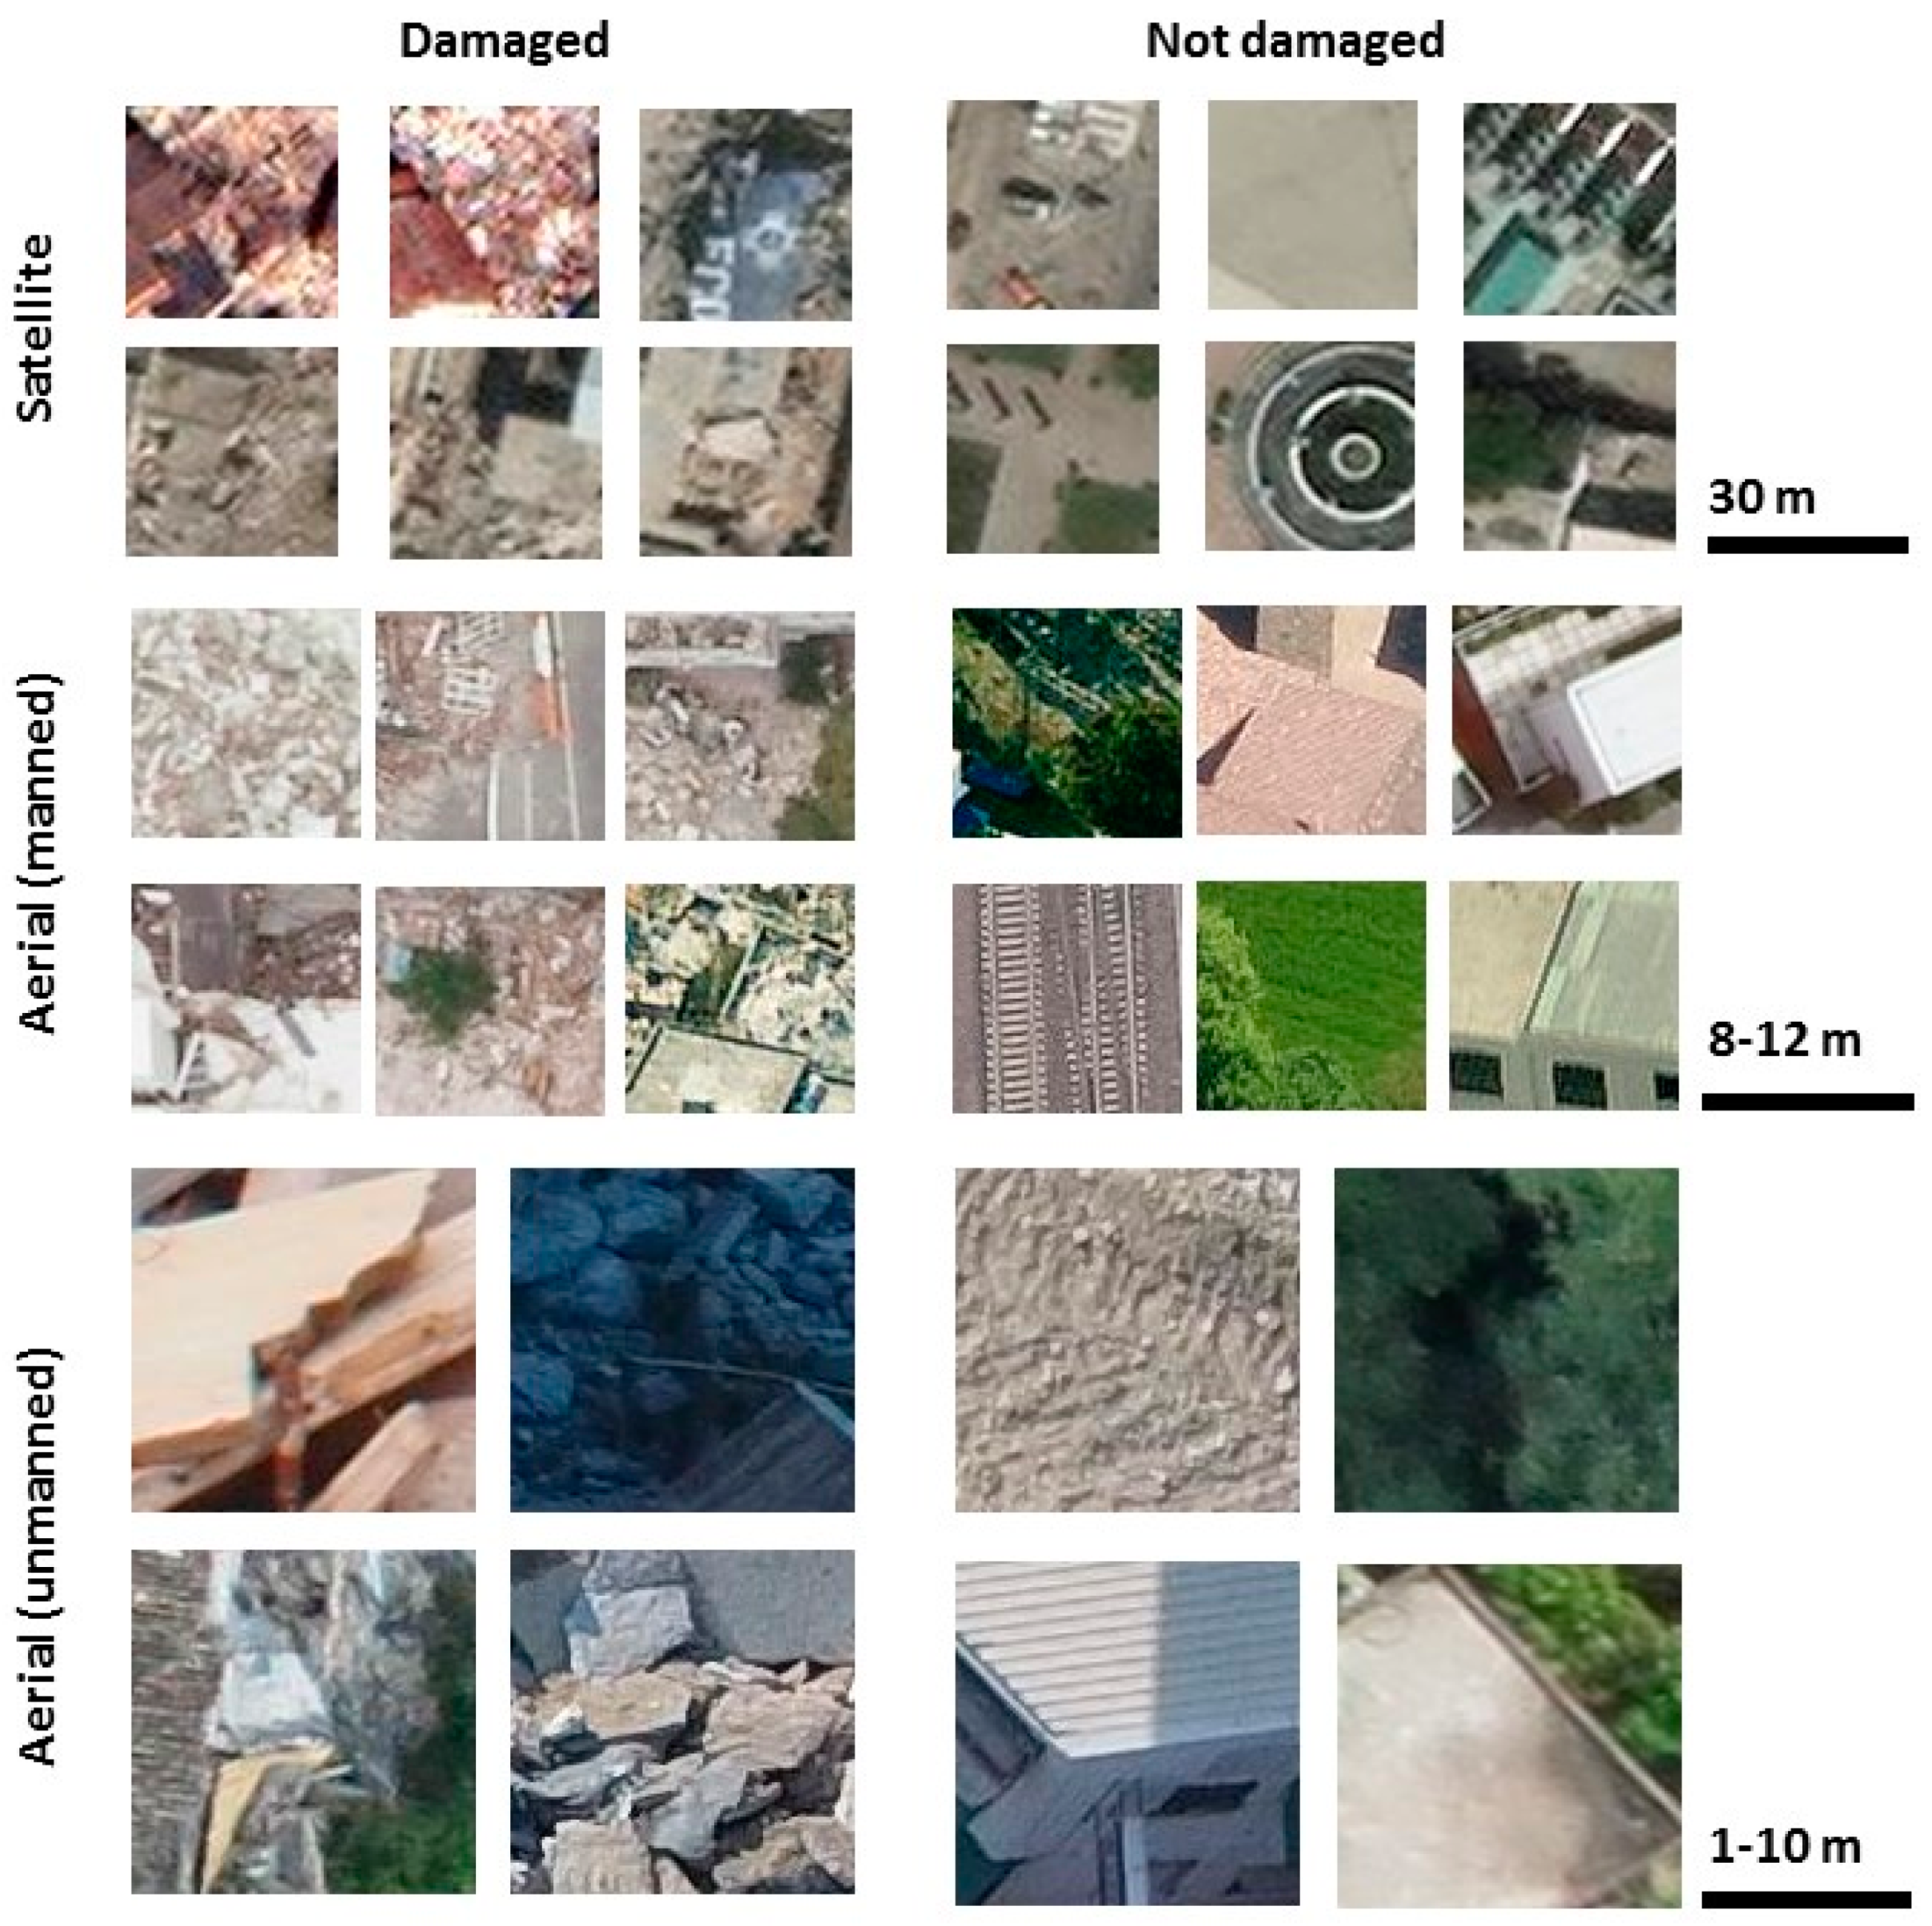
- Assess the behavior of several feature fusion approaches by considering satellite and airborne (manned and unmanned) (Figure 1) feature information, and compare them against two baseline experiments for the image classification of building damages;
- Assess the impact of multi-resolution fusion approaches in the model transferability for each of the considered resolution levels, where an image dataset from a different geographical region is only considered in the validation step.
2. Related Work
2.1. Image-Based Damage Mapping
2.2. CNN Feature Fusion Approaches in Remote Sensing
3. Methodology
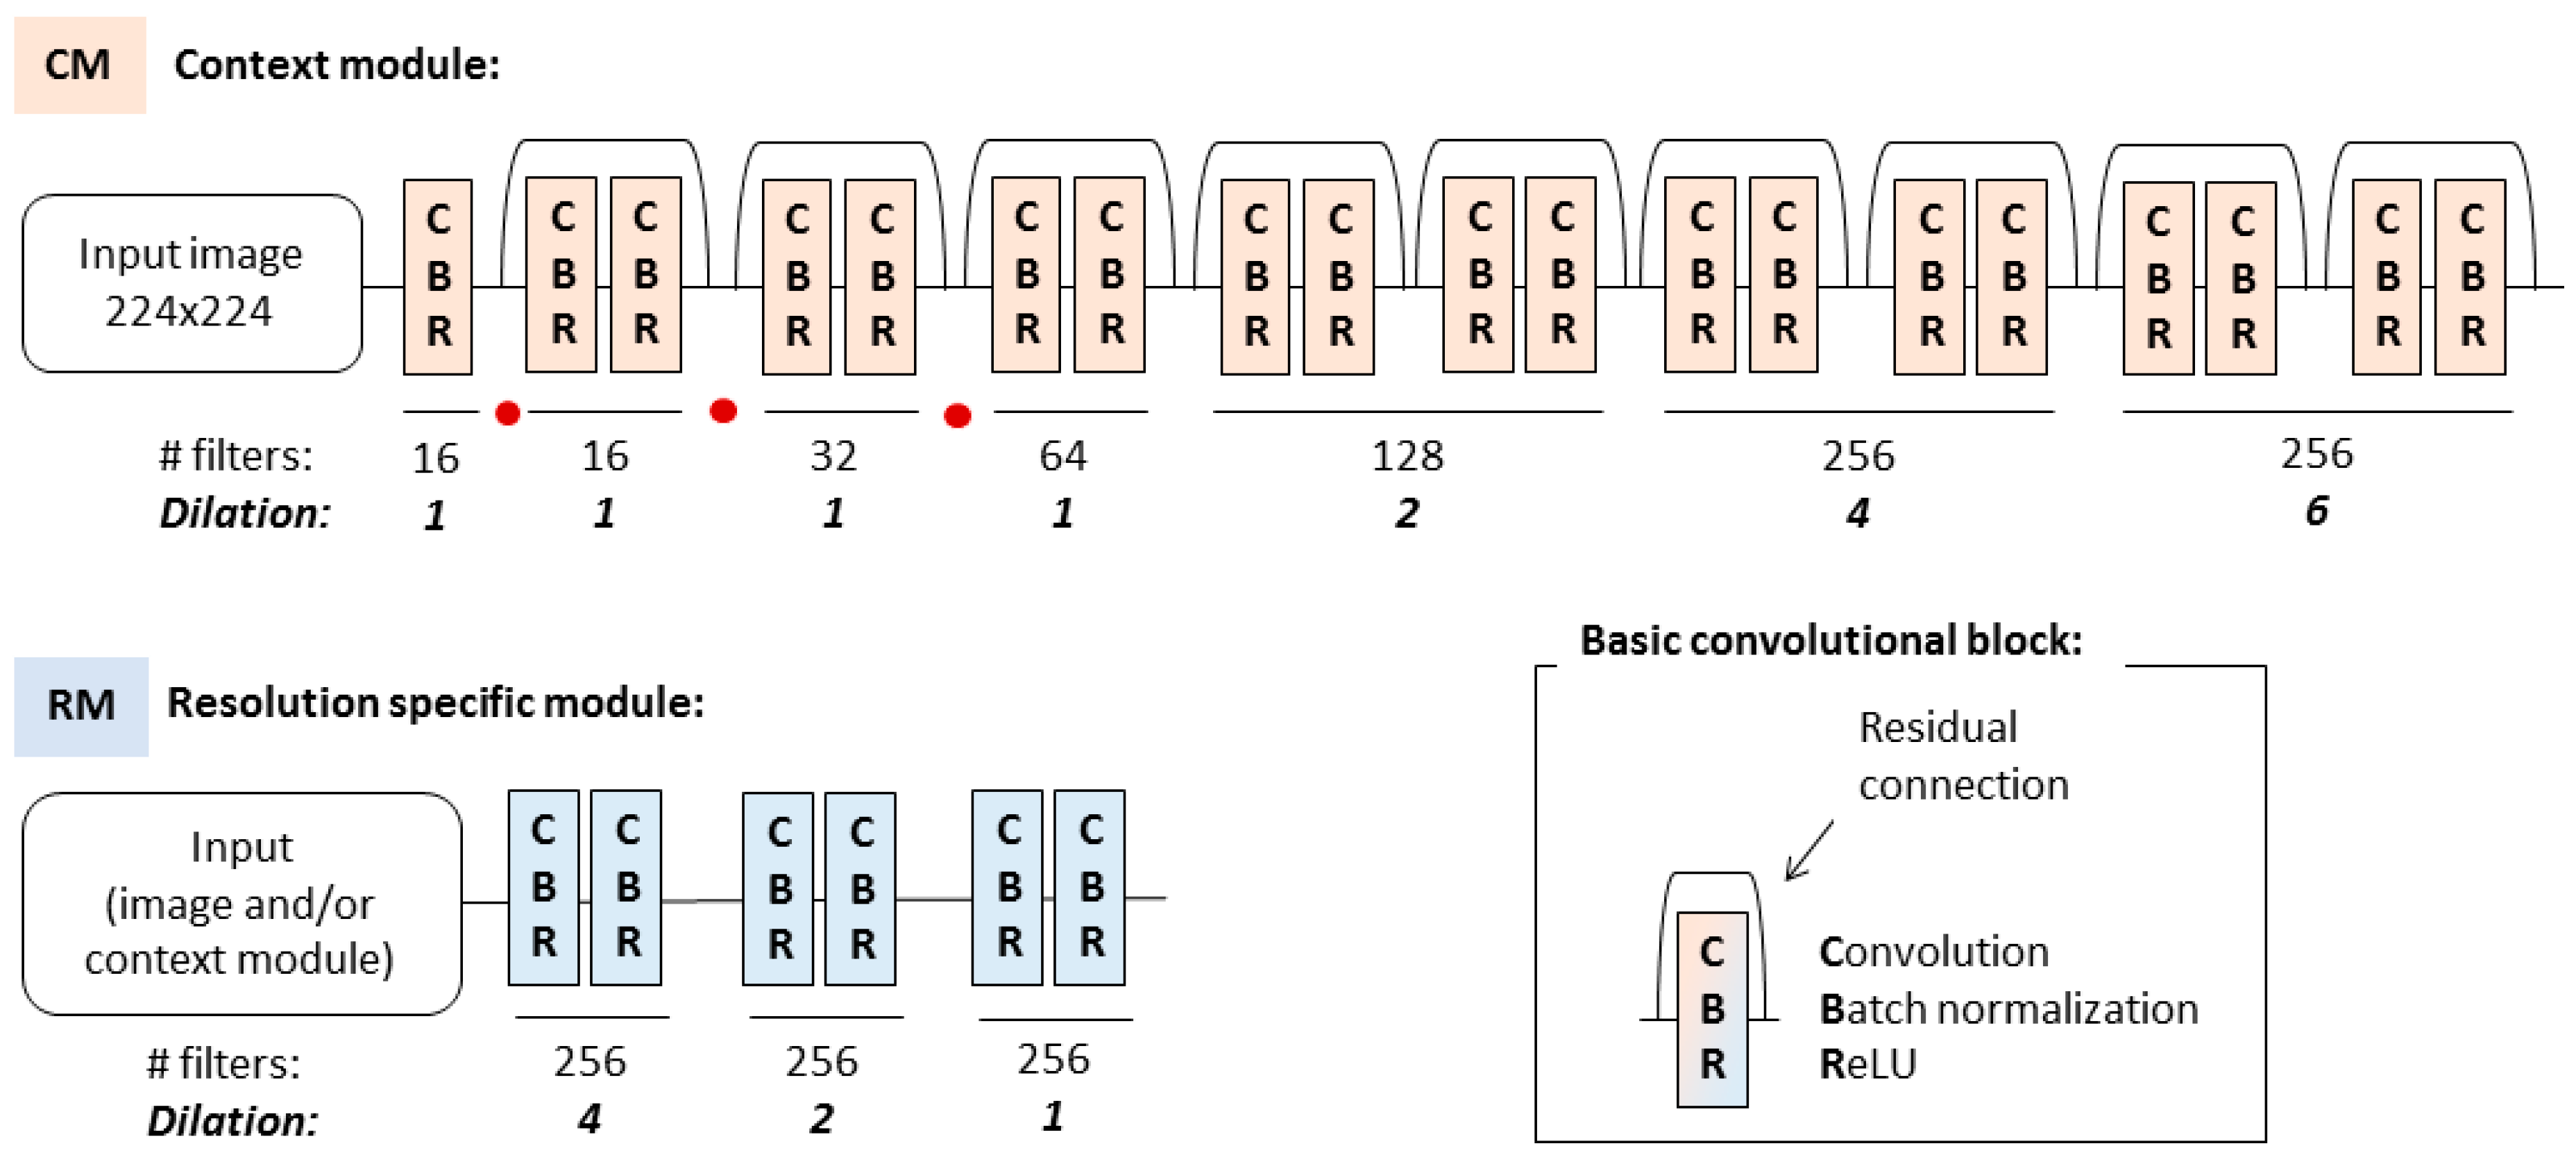
3.1. Basic Convolutional Set and Modules Definition
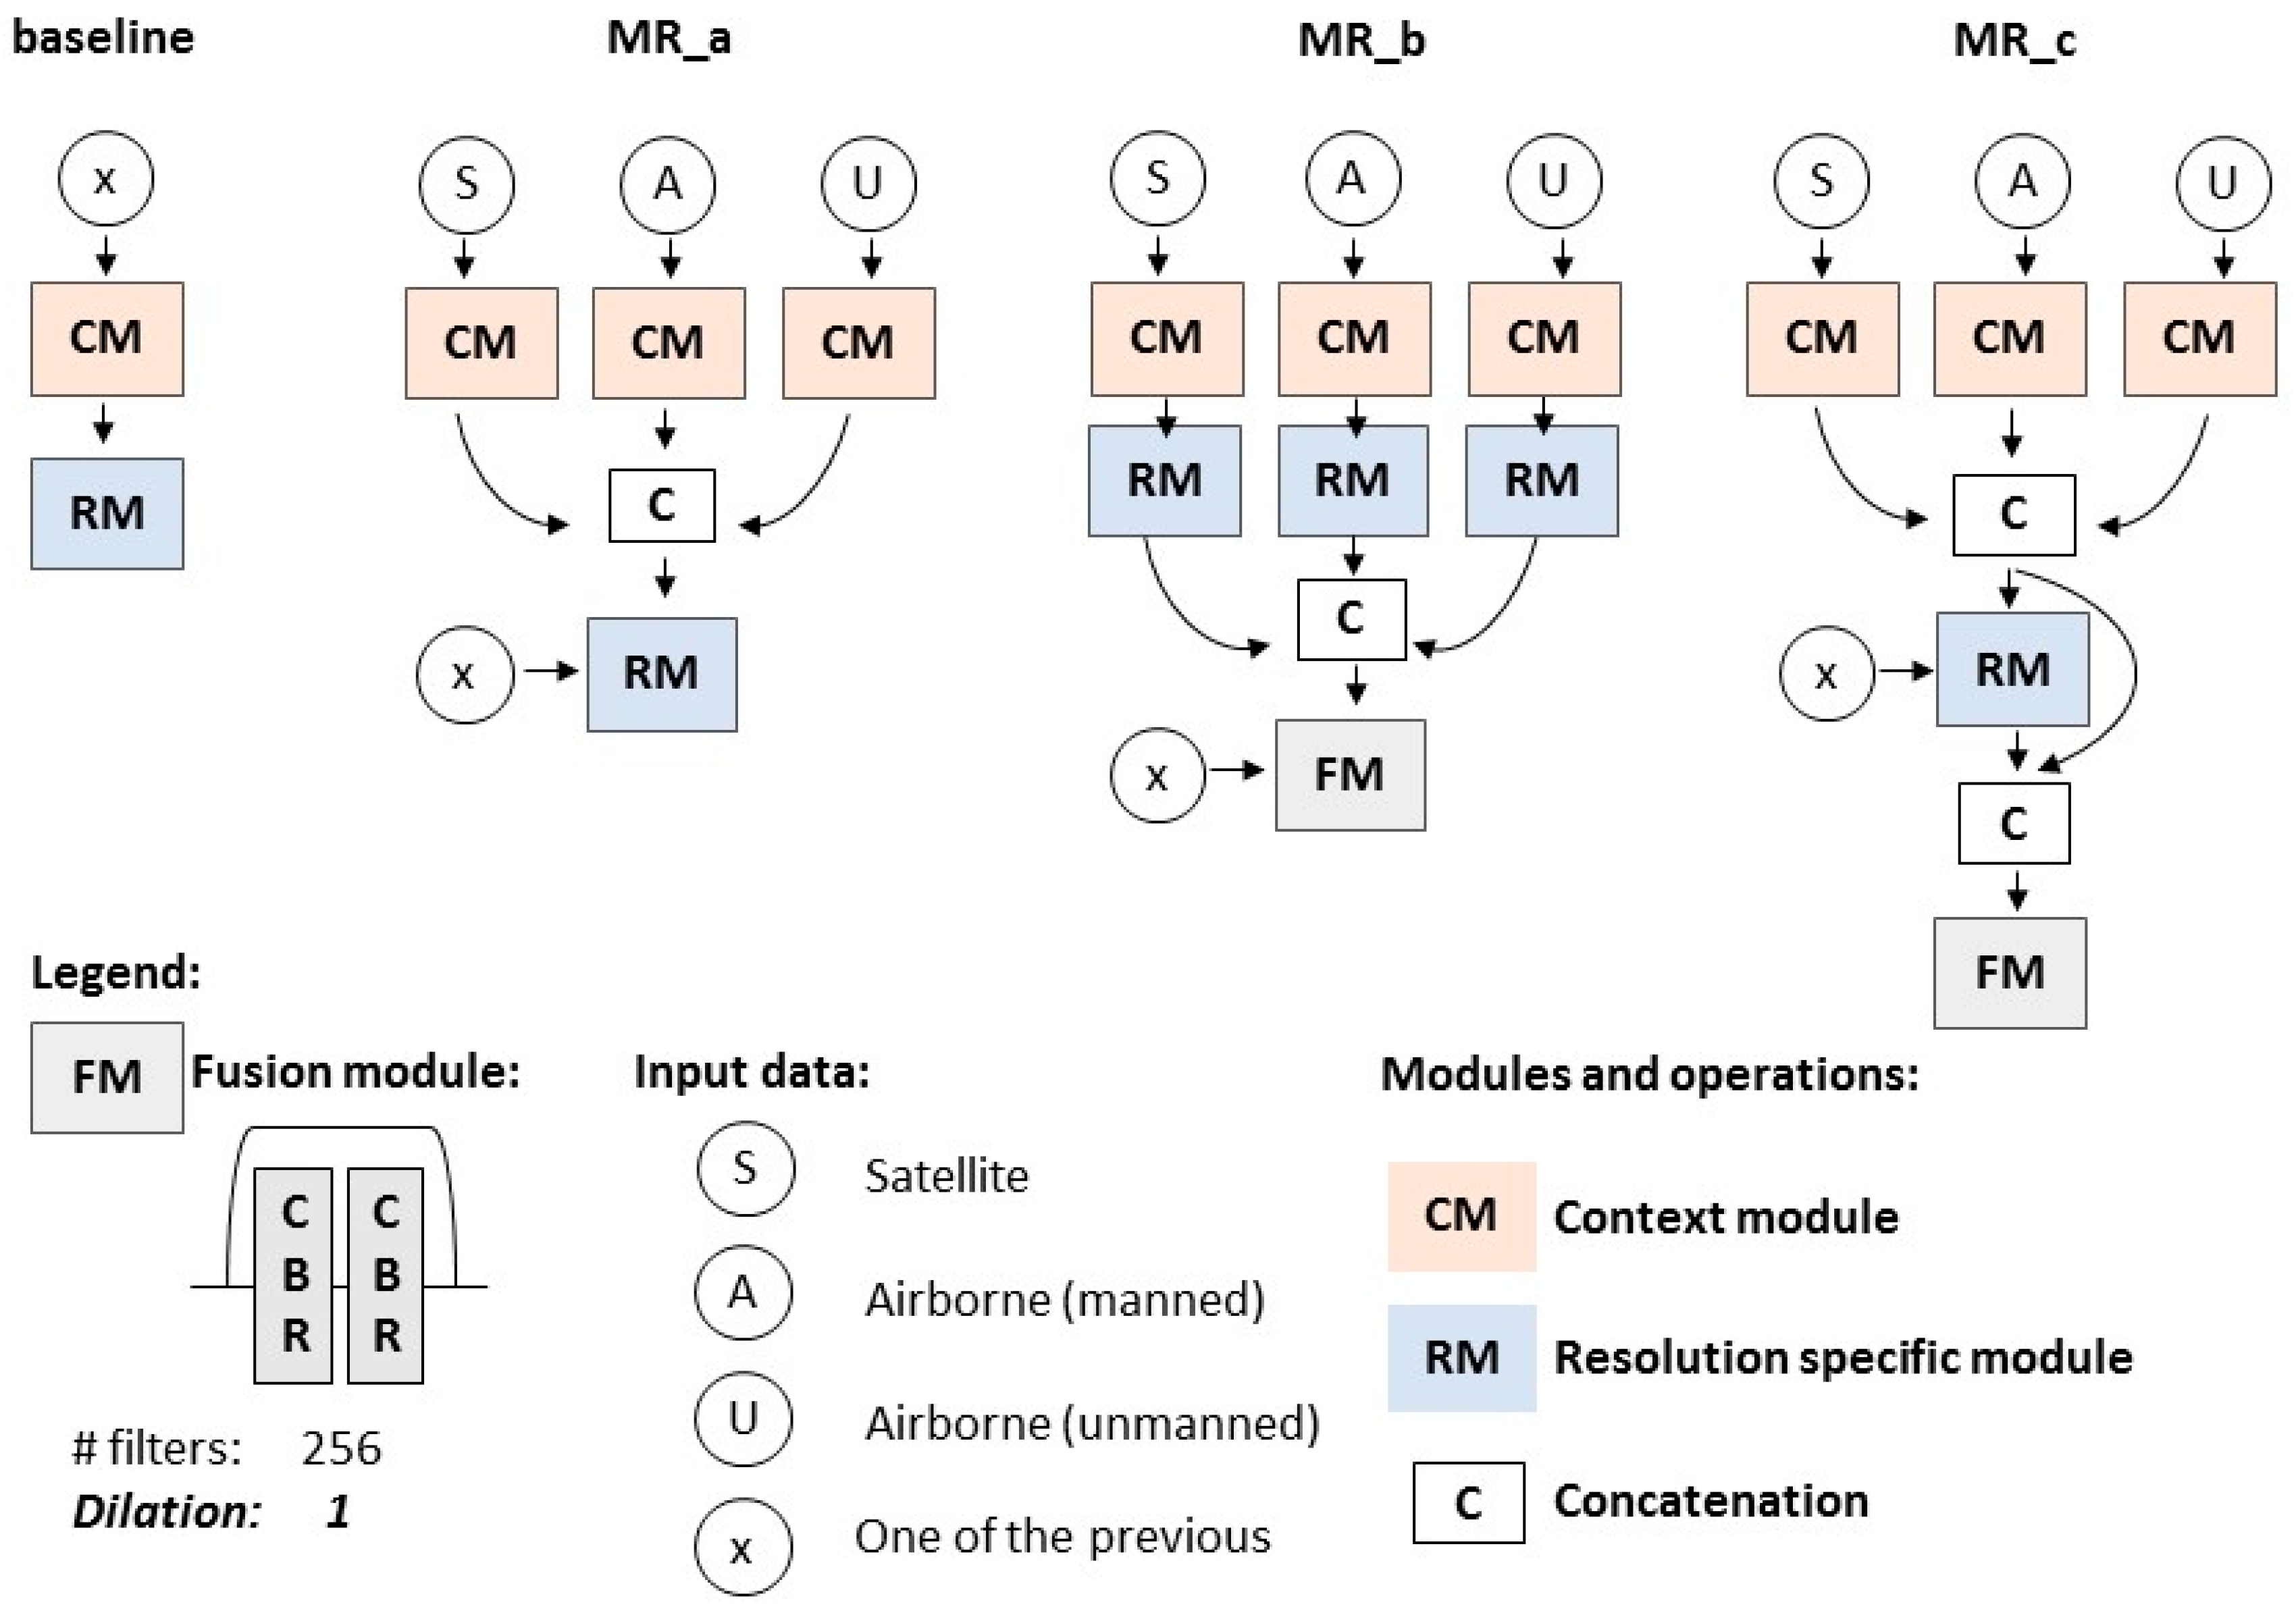
3.2. Baseline Method
3.3. Feature Fusion Methods
- MR_a: in this fusion approach, the features of the context modules of each of the baseline experiments were concatenated. The resolution-specific module was then fine-tuned using the image data of a given resolution level (X, in Figure 5). This approach followed a general fusion approach already used in computer vision to merge the artificial multi-scale branches of a network [28,59] or to fuse remote sensing image data [60]. Furthermore, this simple fusion approach has already been tested in another multi-resolution study [30].
- MR_b: in this fusion approach, the features of the context followed by the resolution-specific modules of the baseline experiments were concatenated. The fusion module considered as input the previous concatenation and it was fine-tuned using the image data of a given resolution level (X, in Figure 5). While only the context module of each resolution level was considered for the fusion in MR_a, MR_b considered the feature information of the resolution-specific module. In this case, the fusion model aimed at blending all these heterogeneous feature maps and building the final classifier for each of the resolution levels separately (Figure 5). This fusion approach allows the use of traditional (i.e., mono resolution) pre-trained networks as only the last set of convolutions need to be run (i.e., fusion module).
- MR_c: this approach builds on MR_a. However, in this case, the feature information from the concatenation of several context modules is maintained in a later stage of the fusion approach. This was performed by further concatenating this feature information with the output of the resolution-specific module that was fine-tuned with a given resolution image data (X in Figure 5). Like MR_b, the feature information coming from the context modules and resolution-specific module were blended using the fusion module.
4. Experiments and Results
4.1. Datasets and Training Samples
4.1.1. Damage Domain Image Samples for the Three Resolution Levels Considered
4.1.2. Generic Image Samples for the Three Levels of Resolution
4.2. Results
4.2.1. Multi-Resolution Fusion Approaches
4.2.2. Multi-Resolution Fusion Approaches’ Impact on the Model Transferability
5. Discussion
6. Conclusions and Future Work
Author Contributions
Funding
Acknowledgments
Conflicts of Interest
References
- Dell’Acqua, F.; Gamba, P. Remote sensing and earthquake damage assessment: Experiences, limits, and perspectives. Proc. IEEE 2012, 100, 2876–2890. [Google Scholar] [CrossRef]
- Eguchi, R.T.; Huyck, C.K.; Ghosh, S.; Adams, B.J.; McMillan, A. Utilizing new technologies in managing hazards and disasters. In Geospatial Techniques in Urban Hazard and Disaster Analysis; Showalter, P.S., Lu, Y., Eds.; Springer: Dordrecht, The Netherlands, 2009; pp. 295–323. ISBN 978-90-481-2237-0. [Google Scholar]
- United Nations. INSARAG Guidelines, Volume II: Preparedness and Response, Manual B: Operations. 2015. Available online: https://www.insarag.org/methodology/guidelines (accessed on 6 June 2018).
- Curtis, A.; Fagan, W.F. Capturing damage assessment with a spatial video: An example of a building and street-scale analysis of tornado-related mortality in Joplin, Missouri, 2011. Ann. Assoc. Am. Geogr. 2013, 103, 1522–1538. [Google Scholar] [CrossRef]
- Ishii, M.; Goto, T.; Sugiyama, T.; Saji, H.; Abe, K. Detection of earthquake damaged areas from aerial photographs by using color and edge information. In Proceedings of the ACCV2002: The 5th Asian Conference on Computer Vision, Melbourne, Australia, 23–25 January 2002. [Google Scholar]
- Vu, T.T.; Matsuoka, M.; Yamazaki, F. Detection and Animation of Damage Using Very High-Resolution Satellite Data Following the 2003 Bam, Iran, Earthquake. Earthq. Spectra 2005, 21, 319–327. [Google Scholar] [CrossRef]
- Balz, T.; Liao, M. Building-damage detection using post-seismic high-resolution SAR satellite data. Int. J. Remote Sens. 2010, 31, 3369–3391. [Google Scholar] [CrossRef]
- Brunner, D.; Schulz, K.; Brehm, T. Building damage assessment in decimeter resolution SAR imagery: A future perspective. In Proceedings of the 2011 Joint Urban Remote Sensing Event, Munich, Germany, 11–13 April 2011; pp. 217–220. [Google Scholar]
- Armesto-González, J.; Riveiro-Rodríguez, B.; González-Aguilera, D.; Rivas-Brea, M.T. Terrestrial laser scanning intensity data applied to damage detection for historical buildings. J. Archaeol. Sci. 2010, 37, 3037–3047. [Google Scholar] [CrossRef]
- Khoshelham, K.; Oude Elberink, S.; Xu, S. Segment-based classification of damaged building roofs in aerial laser scanning data. IEEE Geosci. Remote Sens. Lett. 2013, 10, 1258–1262. [Google Scholar] [CrossRef]
- Kerle, N.; Hoffman, R.R. Collaborative damage mapping for emergency response: The role of Cognitive Systems Engineering. Nat. Hazards Earth Syst. Sci. 2013, 13, 97–113. [Google Scholar] [CrossRef]
- Saito, K.; Spence, R.; Booth, E.; Madabhushi, G.; Eguchi, R.; Gill, S. Damage assessment of Port-au-Prince using Pictometry. In Proceedings of the 8th International Conference on Remote Sensing for Disaster Response, Tokyo, Japan, 30 September–1 October 2010. [Google Scholar]
- Kerle, N. Satellite-based damage mapping following the 2006 Indonesia earthquake—How accurate was it? Int. J. Appl. Earth Obs. Geoinf. 2010, 12, 466–476. [Google Scholar] [CrossRef]
- Gerke, M.; Kerle, N. Automatic structural seismic damage assessment with airborne oblique Pictometry© imagery. Photogramm. Eng. Remote Sens. 2011, 77, 885–898. [Google Scholar] [CrossRef]
- Murtiyoso, A.; Remondino, F.; Rupnik, E.; Nex, F.; Grussenmeyer, P. Oblique aerial photography tool for building inspection and damage assessment. In Proceedings of the ISPRS—International Archives of the Photogrammetry, Remote Sensing and Spatial Information Sciences, Denver, CO, USA, 17–20 November 2014; Volume XL–1, pp. 309–313. [Google Scholar]
- Nex, F.; Rupnik, E.; Toschi, I.; Remondino, F. Automated processing of high resolution airborne images for earthquake damage assessment. In Proceedings of the ISPRS—International Archives of the Photogrammetry, Remote Sensing and Spatial Information Sciences, Denver, CO, USA, 17–20 November 2014; Volume XL–1, pp. 315–321. [Google Scholar]
- Vetrivel, A.; Gerke, M.; Kerle, N.; Nex, F.; Vosselman, G. Disaster damage detection through synergistic use of deep learning and 3D point cloud features derived from very high resolution oblique aerial images, and multiple-kernel-learning. ISPRS J. Photogramm. Remote Sens. 2018, 140, 45–59. [Google Scholar] [CrossRef]
- CGR Supplies Aerial Survey to JRC for Emergency. Available online: http://www.cgrspa.com/news/cgr-fornira-il-jrc-con-immagini-aeree-per-le-emergenze/ (accessed on 9 November 2015).
- Fernandez Galarreta, J.; Kerle, N.; Gerke, M. UAV-based urban structural damage assessment using object-based image analysis and semantic reasoning. Nat. Hazards Earth Syst. Sci. 2015, 15, 1087–1101. [Google Scholar] [CrossRef] [Green Version]
- Duarte, D.; Nex, F.; Kerle, N.; Vosselman, G. Towards a more efficient detection of earthquake induced facade damages using oblique UAV imagery. In Proceedings of the ISPRS—International Archives of the Photogrammetry, Remote Sensing and Spatial Information Sciences, Bonn, Germany, 4–7 September 2017; Volume XLII-2/W6, pp. 93–100. [Google Scholar]
- He, K.; Zhang, X.; Ren, S.; Sun, J. Deep residual learning for image recognition. In Proceedings of the IEEE Conference on Computer Vision and Pattern Recognition (CVPR), Las Vegas, NV, USA, 27–30 June 2016. [Google Scholar]
- Krizhevsky, A.; Sutskever, I.; Hinton, G.E. ImageNet classification with deep convolutional neural networks. In Proceedings of the Advances in Neural Information Processing Systems, Lake Tahoe, NV, USA, 3–6 December 2012; pp. 1097–1105. [Google Scholar]
- Simonyan, K.; Zisserman, A. Very deep convolutional networks for large-scale image recognition. In Proceedings of the ICLR 2015, San Diego, CA, USA, 7–9 May 2015; pp. 1–13. [Google Scholar]
- Fu, G.; Liu, C.; Zhou, R.; Sun, T.; Zhang, Q. Classification for high resolution remote sensing imagery using a fully convolutional network. Remote Sens. 2017, 9, 498. [Google Scholar] [CrossRef]
- Maggiori, E.; Tarabalka, Y.; Charpiat, G.; Alliez, P. Convolutional neural networks for large-scale remote-sensing image classification. IEEE Trans. Geosci. Remote Sens. 2017, 55, 645–657. [Google Scholar] [CrossRef]
- Wei, Y.; Wang, Z.; Xu, M. Road structure refined CNN for road extraction in aerial images. IEEE Geosci. Remote Sens. Lett. 2017, 14, 709–713. [Google Scholar] [CrossRef]
- Vetrivel, A.; Kerle, N.; Gerke, M.; Nex, F.; Vosselman, G. Towards automated satellite image segmentation and classification for assessing disaster damage using data-specific features with incremental learning. In Proceedings of the GEOBIA 2016, Enschede, The Netherlands, 14–16 September 2016. [Google Scholar]
- Eigen, D.; Fergus, R. Predicting depth, surface normals and semantic labels with a common multi-scale convolutional architecture. In Proceedings of the IEEE International Conference on Computer Vision (ICCV), Washington, DC, USA, 7–13 December 2015; pp. 2650–2658. [Google Scholar]
- Hu, F.; Xia, G.-S.; Hu, J.; Zhang, L. Transferring deep convolutional neural networks for the scene classification of high-resolution remote sensing imagery. Remote Sens. 2015, 7, 14680–14707. [Google Scholar] [CrossRef]
- Duarte, D.; Nex, F.; Kerle, N.; Vosselman, G. Satellite image classification of building damages using airborne and satellite image samples in a deep learning approach. In Proceedings of the ISPRS Annals of Photogrammetry, Remote Sensing and Spatial Information Sciences, Riva del Garda, Italy, 4–7 June 2018; Volume IV–2, pp. 89–96. [Google Scholar]
- Vu, T.T.; Ban, Y. Context-based mapping of damaged buildings from high-resolution optical satellite images. Int. J. Remote Sens. 2010, 31, 3411–3425. [Google Scholar] [CrossRef]
- Yamazaki, F.; Vu, T.T.; Matsuoka, M. Context-based detection of post-disaster damaged buildings in urban areas from satellite images. In Proceedings of the 2007 Urban Remote Sensing Joint Event, Paris, France, 11–13 April 2007; pp. 1–5. [Google Scholar]
- Miura, H.; Yamazaki, F.; Matsuoka, M. Identification of damaged areas due to the 2006 Central Java, Indonesia earthquake using satellite optical images. In Proceedings of the 2007 Urban Remote Sensing Joint Event, Paris, France, 11–13 April 2007; pp. 1–5. [Google Scholar]
- Dong, L.; Shan, J. A comprehensive review of earthquake-induced building damage detection with remote sensing techniques. ISPRS J. Photogramm. Remote Sens. 2013, 84, 85–99. [Google Scholar] [CrossRef]
- Li, X.; Yang, W.; Ao, T.; Li, H.; Chen, W. An improved approach of information extraction for earthquake-damaged buildings using high-resolution imagery. J. Earthq. Tsunami 2011, 5, 389–399. [Google Scholar] [CrossRef]
- Ma, J.; Qin, S. Automatic depicting algorithm of earthquake collapsed buildings with airborne high resolution image. In Proceedings of the International Geoscience and Remote Sensing Symposium, Munich, Germany, 22–27 July 2012; pp. 939–942. [Google Scholar]
- Vetrivel, A.; Gerke, M.; Kerle, N.; Vosselman, G. Identification of damage in buildings based on gaps in 3D point clouds from very high resolution oblique airborne images. ISPRS J. Photogramm. Remote Sens. 2015, 105, 61–78. [Google Scholar] [CrossRef]
- Blaschke, T. Object based image analysis for remote sensing. ISPRS J. Photogramm. Remote Sens. 2010, 65, 2–16. [Google Scholar] [CrossRef]
- Cusicanqui, J.; Kerle, N.; Nex, F. Usability of aerial video footage for 3D-scene reconstruction and structural damage assessment. Nat. Hazards Earth Syst. Sci. 2018, 18, 1583–1598. [Google Scholar] [CrossRef]
- Hasegawa, H.; Aoki, H.; Yamazaki, F.; Matsuoka, M.; Sekimoto, I. Automated detection of damaged buildings using aerial HDTV images. In Proceedings of the IGARSS 2000, Honolulu, HI, USA, 24–28 July 2000; Volume 1, pp. 310–312. [Google Scholar]
- Mitomi, H.; Matsuoka, M.; Yamazaki, F. Application of automated damage detection of buildings due to earthquakes by panchromatic television images. In Proceedings of the 7th US National Conference on Earthquake Engineering, Boston, MA, USA, 21–25 July 2002. [Google Scholar]
- Vetrivel, A.; Gerke, M.; Kerle, N.; Vosselman, G. Identification of structurally damaged areas in airborne oblique images using a Visual-Bag-of-Words approach. Remote Sens. 2016, 8, 231. [Google Scholar] [CrossRef]
- Gomez-Chova, L.; Tuia, D.; Moser, G.; Camps-Valls, G. Multimodal classification of remote sensing images: A review and future directions. Proc. IEEE 2015, 103, 1560–1584. [Google Scholar] [CrossRef]
- Paisitkriangkrai, S.; Sherrah, J.; Janney, P.; Van-Den Hengel, A. Effective semantic pixel labelling with convolutional networks and Conditional Random Fields. In Proceedings of the 2015 IEEE Conference on Computer Vision and Pattern Recognition (CVPR), Boston, MA, USA, 7–12 June 2015; pp. 36–43. [Google Scholar]
- Hermosilla, T.; Ruiz, L.A.; Recio, J.A.; Estornell, J. Evaluation of Automatic Building Detection Approaches Combining High Resolution Images and LiDAR Data. Remote Sens. 2011, 3, 1188–1210. [Google Scholar] [CrossRef] [Green Version]
- Sohn, G.; Dowman, I. Data fusion of high-resolution satellite imagery and LiDAR data for automatic building extraction. ISPRS J. Photogramm. Remote Sens. 2007, 62, 43–63. [Google Scholar] [CrossRef]
- Prince, D.; Sidike, P.; Essa, A.; Asari, V. Multifeature fusion for automatic building change detection in wide-area imagery. J. Appl. Remote Sens. 2017, 11, 026040. [Google Scholar] [CrossRef]
- Audebert, N.; Le Saux, B.; Lefèvre, S. Beyond RGB: Very high resolution urban remote sensing with multimodal deep networks. ISPRS J. Photogramm. Remote Sens. 2018, 140, 20–32. [Google Scholar] [CrossRef] [Green Version]
- Audebert, N.; Le Saux, B.; Lefèvre, S. Semantic segmentation of earth observation data using multimodal and multi-scale deep networks. In Computer Vision—ACCV 2016; Lai, S.-H., Lepetit, V., Nishino, K., Sato, Y., Eds.; Springer International Publishing: Cham, Switzerland, 2017; Volume 10111, pp. 180–196. ISBN 978-3-319-54180-8. [Google Scholar]
- Liu, Y.; Piramanayagam, S.; Monteiro, S.T.; Saber, E. Dense semantic labeling of very-high-resolution aerial imagery and LiDAR with fully-convolutional neural networks and higher-order CRFs. In Proceedings of the 2017 IEEE Conference on Computer Vision and Pattern Recognition (CVPR), Honolulu, HI, USA, 21–26 July 2017; pp. 1561–1570. [Google Scholar]
- Yu, F.; Koltun, V. Multi-scale context aggregation by dilated convolutions. In Proceedings of the ICLR 2016, Caribe Hilton, San Juan, Puerto Rico, 2–4 May 2016. [Google Scholar]
- Yu, F.; Koltun, V.; Funkhouser, T. Dilated residual networks. In Proceedings of the 2017 IEEE Conference on Computer Vision and Pattern Recognition (CVPR), Honolulu, HI, USA, 21–26 July 2017. [Google Scholar]
- Hamaguchi, R.; Fujita, A.; Nemoto, K.; Imaizumi, T.; Hikosaka, S. Effective use of dilated convolutions for segmenting small object instances in remote sensing images. arXiv, 2017; arXiv:1709.00179. [Google Scholar]
- Ioffe, S.; Szegedy, C. Batch normalization: Accelerating deep network training by reducing internal covariate shift. In Proceedings of the 32nd International Conference on Machine Learning, Lille, France, 7–9 July 2015. [Google Scholar]
- Springenberg, J.; Dosovitskiy, A.; Brox, T.; Riedmiller, M. Striving for simplicity: The all convolutional net. In Proceedings of the ICLR 2015, San Diego, CA, USA, 7–9 May 2015. [Google Scholar]
- Long, J.; Shelhamer, E.; Darrell, T. Fully convolutional networks for semantic segmentation. In Proceedings of the 2015 IEEE Conference on Computer Vision and Pattern Recognition (CVPR), Boston, MA, USA, 7–12 June 2015; pp. 3431–3440. [Google Scholar]
- Tajbakhsh, N.; Shin, J.Y.; Gurudu, S.R.; Hurst, R.T.; Kendall, C.B.; Gotway, M.B.; Liang, J. Convolutional neural networks for medical image analysis: Full training or fine tuning? IEEE Trans. Med. Imaging 2016, 35, 1299–1312. [Google Scholar] [CrossRef] [PubMed]
- Ngiam, J.; Khosla, A.; Kim, M.; Nam, J.; Lee, H.; Ng, A. Multimodal deep learning. In Proceedings of the 28th International Conference on Machine Learning, Bellevue, WA, USA, 28 June–2 July 2011. [Google Scholar]
- Li, H.; Lin, Z.; Shen, X.; Brandt, J.; Hua, G. A convolutional neural network cascade for face detection. In Proceedings of the 2015 IEEE Conference on Computer Vision and Pattern Recognition (CVPR), Boston, MA, USA, 7–12 June 2015; pp. 5325–5334. [Google Scholar]
- Boulch, A.; Saux, B.L.; Audebert, N. Unstructured point cloud semantic labeling using deep segmentation networks. In Proceedings of the Eurographics Workshop on 3D Object Retrieval, Lyon, France, 23–24 April 2017; The Eurographics Association: Lyon, France, 2017. [Google Scholar]


| Location | No. of Samples | Month/Year of Event | Sensor/System | |
|---|---|---|---|---|
| Damaged | Not Damaged | |||
| Satellite | ||||
| L’Aquila (Italy) | 115 | 108 | April 2009 | GeoEye-1 |
| Port-au-Prince (Haiti) | 701 | 681 | January 2010 | GeoEye-1 |
| Portoviejo (Ecuador) | 125 | 110 | April 2016 | WorldView-3 |
| Amatrice (Italy) | 135 | 159 | August 2016 | WorldView-3 |
| Pesc. Tronto (Italy) | 91 | 94 | August 2016 | WorldView-3 |
| Total | 1169 | 1152 | ||
| Airborne (manned) | ||||
| L’Aquila (Italy) | 242 | 235 | April 2009 | PentaView |
| St Felice (Italy) | 337 | 366 | May 2012 | PentaView |
| Amatrice (Italy) | 387 | 262 | September 2016 | PentaView |
| Tempera (Italy) | 151 | 260 | April 2009 | PentaView |
| Port-au-Prince (slums) (Haiti) | 409 | 329 | January 2010 | PentaView |
| Port-au-Prince (Haiti) | 302 | 335 | January 2010 | PentaView |
| Onna (Italy) | 293 | 265 | April 2009 | PentaView |
| Christchurch (New Zealand) | 603 | 649 | February 2011 | Vexcel UCXp |
| Total | 2754 | 2701 | ||
| Airborne (unmanned) | ||||
| L’Aquila (Italy) | 103 | 99 | April 2009 | Sony ILCE-6000 |
| Wesel (Germany) | 175 | 175 | June 2016++ | Canon EOS 600D |
| Portoviejo (Ecuador) | 306 | 200 | April 2016 | DJI FC300S |
| Pesc. Tronto (Italy) | 197 | 262 | August 2016 | Canon Powershot S110 |
| Katmandu (Nepal) | 388 | 288 | April 2015 | Canon IXUS 127 HS |
| Taiwan (China) | 257 | 479 | February 2016 | DJI FC300S |
| Gronau (Germany) | 437 | 501 | October 2013++ | Canon EOS 600D |
| Mirabello (Italy) | 412 | 246 | May 2012 | Olympus E-P2 |
| Lyon (France) | 230 | 242 | May 2017++ | DJI FC330 |
| Total | 2505 | 2692 | ||
| Built | Non-Built |
|---|---|
| Airport | Beach |
| Commercial area | Circular farmland |
| Dense residential | Desert |
| Freeway | Forest |
| Industrial area | Mountain |
| Medium residential | Rectangular farm |
| Sparse residential | Terrace |
| Location | Generic Airborne (Unmanned) Image Samples | Generic Airborne (Manned) Image Samples | ||||
|---|---|---|---|---|---|---|
| Built | Non-Built | Sensor/System | Built | Non-Built | Sensor/System | |
| Netherlands * | 971 | 581 | Olympus E-P3 | 1758 | 878 | PentaView and Vexcel Ultra-CamXP |
| France | 697 | 690 | Canon IXUS220 HS | |||
| Germany | 681 | 618 | DJI FC330 | 1110 | 1953 | Vexcel Ultra-Cam D |
| Italy | 578 | 405 | Pentax OPTIO A40 | |||
| Switzerland | 107 | 688 | Canon IXUS220 HS | |||
| Total | 3034 | 2982 | 2868 | 2831 | ||
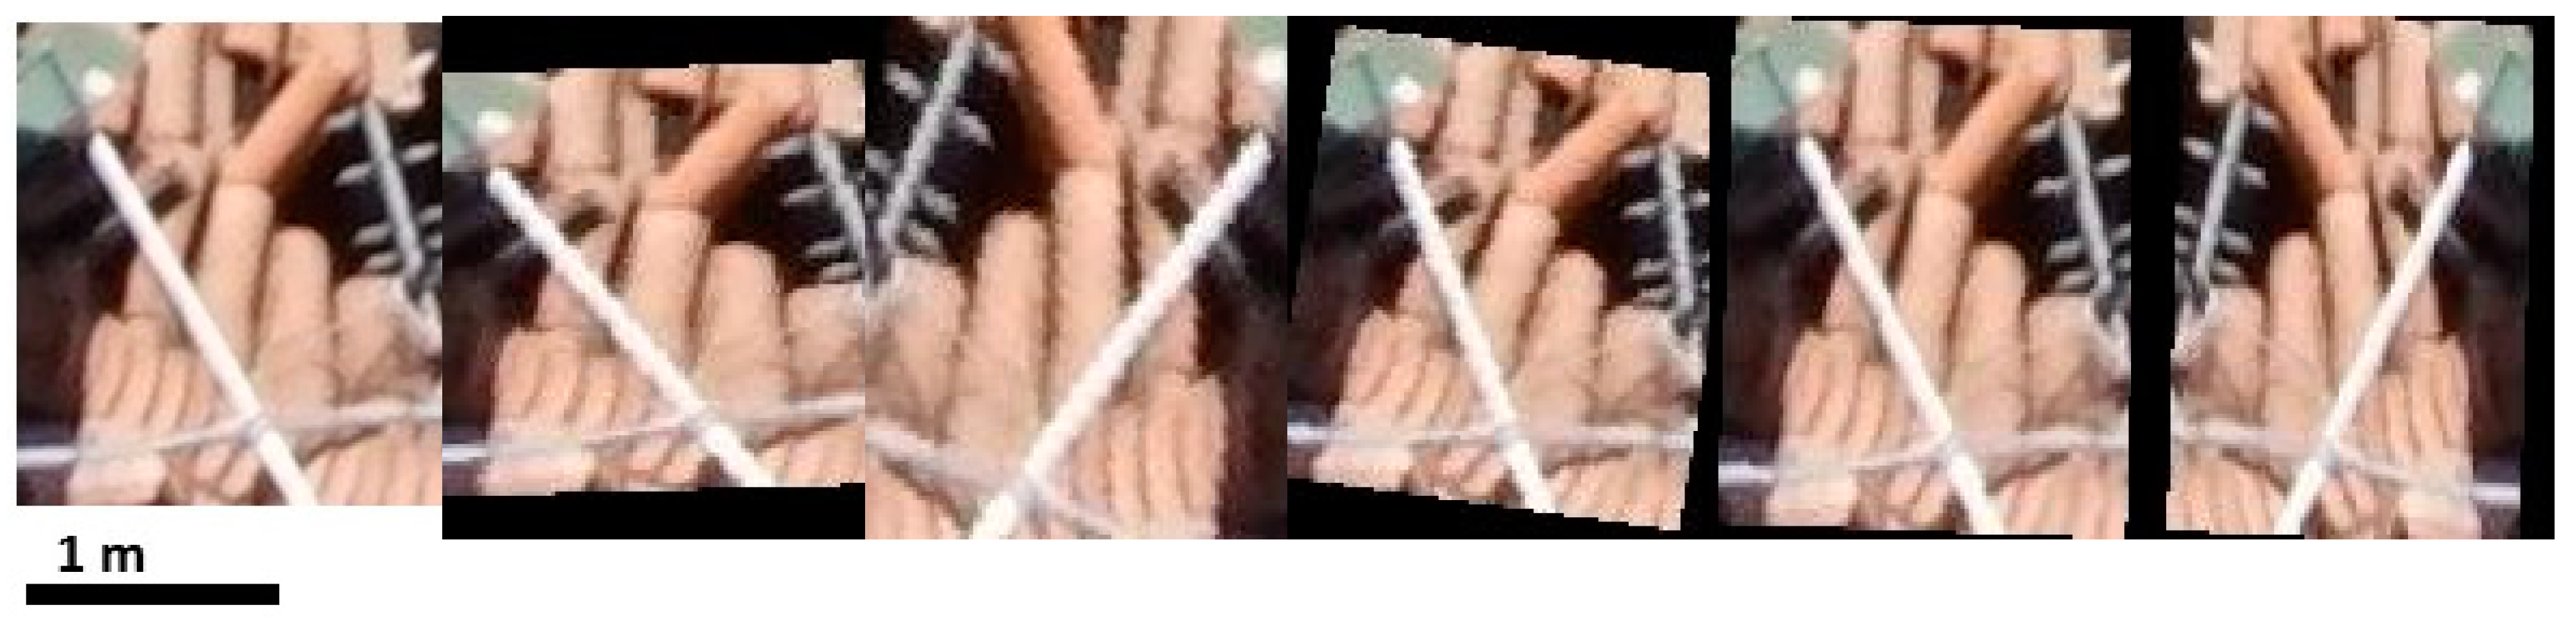
| Data Augmentation | Value |
|---|---|
| Image normalization | 1/255 |
| Scale factor | [0.8,1.2] |
| Rotation | [−12,12] deg |
| Horizontal flip | true |
| Network | Satellite | |||
| Accuracy | Recall | Precision | Training Samples | |
| baseline | 87.7 ± 0.7 | 88.4 ± 0.9 | 87.4 ± 1.0 | 1602 |
| baseline_ft | 84.3 ± 0.8 | 84.1 ± 1.2 | 87.5 ± 1.8 | 11,402 |
| MR_a | 89.2 ± 1.0 | 87.0 ± 1.2 | 91.0 ± 1.3 | 8968 |
| MR_b | 89.3 ± 0.9 | 91.0 ± 0.9 | 86.5 ± 0.6 | 8968 |
| MR_c | 89.7 ± 0.9 | 93.1 ± 1.1 | 82.3 ± 1.6 | 8968 |
| Network | Airborne (Manned) | |||
| Accuracy | Recall | Precision | Training Samples | |
| baseline | 91.1 ± 0.1 | 92.4 ± 1.5 | 91.1 ± 0.4 | 3736 |
| baseline_ft | 90.0 ± 0.4 | 89.8 ± 2.4 | 90.5 ± 0.3 | 9752 |
| MR_a | 91.4 ± 0.2 | 94.0 ± 0.6 | 88.0 ± 0.7 | 8968 |
| MR_b | 90.7 ± 0.4 | 91.9 ± 2.2 | 90.0 ± 1.2 | 8968 |
| MR_c | 91.4 ± 0.2 | 92.4 ± 0.7 | 89.4 ± 1.3 | 8968 |
| Network | Airborne (Unmanned) | |||
| Accuracy | Recall | Precision | Training Samples | |
| baseline | 94.2 ± 1.0 | 93.1 ± 2.6 | 95.0 ± 0.7 | 3630 |
| baseline_ft | 91.3 ± 1.0 | 91.8 ± 2.0 | 89.9 ± 2.0 | 9329 |
| MR_a | 94.3 ± 0.7 | 94.1 ± 1.9 | 95.7 ± 1.9 | 8968 |
| MR_b | 95.3 ± 1.2 | 95.2 ± 0.7 | 95.3 ± 1.5 | 8968 |
| MR_c | 95.4 ± 0.6 | 95.5 ± 1.7 | 95.1 ± 1.2 | 8968 |
| Network | Satellite (Portoviejo) | |||
| Accuracy (%) | Recall (%) | Precision (%) | Training Samples | |
| baseline | 81.5 | 84 | 78 | 2160 |
| baseline_ft | 79.4 | 76 | 85 | 11,960 |
| MR_a | 81.5 ± 0.9 | 83.5 ± 0.1 | 83.5 ± 1.7 | 9526 |
| MR_b | 82.1 ± 0.6 | 77.7 ± 0.8 | 90.5 ± 1.5 | 9526 |
| MR_c | 83.4 ± 0.4 | 86.5 ± 0.9 | 82.9 ± 0.6 | 9526 |
| Network | Aerial (Manned, Port-au-Prince) | |||
| Accuracy (%) | Recall (%) | Precision (%) | Training Samples | |
| baseline | 84.3 | 80.2 | 83.4 | 4406 |
| baseline_ft | 84.7 | 83.2 | 85.1 | 10,442 |
| MR_a | 81.9 ± 0.4 | 85.0 ± 0.3 | 78.6 ± 2.0 | 9638 |
| MR_b | 83.9 ± 0.4 | 80.3 ± 0.9 | 84.1 ± 2.1 | 9638 |
| MR_c | 84.2 ± 0.2 | 85.0 ± 0.5 | 80.0 ± 1.4 | 9638 |
| Network | Aerial (Unmanned, Lyon) | |||
| Accuracy (%) | Recall (%) | Precision (%) | Training Samples | |
| baseline | 87.2 | 79.5 | 95.1 | 4711 |
| baseline_ft | 83.0 | 70.0 | 94.6 | 10,442 |
| MR_a | 85.7 ± 3.2 | 85.2 ± 3.6 | 90.0 ± 3.4 | 9943 |
| MR_b | 83.6 ± 2.1 | 86.2 ± 1.4 | 83.2 ± 3.3 | 9943 |
| MR_c | 88.7 ± 1.7 | 89.6 ± 2.0 | 82.4 ± 3.3 | 9943 |
© 2018 by the authors. Licensee MDPI, Basel, Switzerland. This article is an open access article distributed under the terms and conditions of the Creative Commons Attribution (CC BY) license (http://creativecommons.org/licenses/by/4.0/).
Share and Cite
Duarte, D.; Nex, F.; Kerle, N.; Vosselman, G. Multi-Resolution Feature Fusion for Image Classification of Building Damages with Convolutional Neural Networks. Remote Sens. 2018, 10, 1636. https://doi.org/10.3390/rs10101636
Duarte D, Nex F, Kerle N, Vosselman G. Multi-Resolution Feature Fusion for Image Classification of Building Damages with Convolutional Neural Networks. Remote Sensing. 2018; 10(10):1636. https://doi.org/10.3390/rs10101636
Chicago/Turabian StyleDuarte, Diogo, Francesco Nex, Norman Kerle, and George Vosselman. 2018. "Multi-Resolution Feature Fusion for Image Classification of Building Damages with Convolutional Neural Networks" Remote Sensing 10, no. 10: 1636. https://doi.org/10.3390/rs10101636
APA StyleDuarte, D., Nex, F., Kerle, N., & Vosselman, G. (2018). Multi-Resolution Feature Fusion for Image Classification of Building Damages with Convolutional Neural Networks. Remote Sensing, 10(10), 1636. https://doi.org/10.3390/rs10101636