Article

The Implementation of a Mineral Dust Wet Deposition Scheme in the GOCART-AFWA Module of the WRF Model

by
Konstantinos Tsarpalis
1,
Anastasios Papadopoulos
2,
Nikolaos Mihalopoulos
3,
Christos Spyrou
1,
Silas Michaelides
4 and
Petros Katsafados
1,*
1
Department of Geography, Harokopio University of Athens, El. Venizelou 70 Str., 17671 Kallithea, Greece
2
Institute of Marine Biological Resources and Inland Waters, Hellenic Center of Marine Research, 46.7 km Athens-Sounion Ave., 19013 Anavissos Attikis, Greece
3
Institute for Environmental Research and Sustainable Development, National Observatory of Athens (NOA), Metaxa & Vas. Pavlou, 15236 Palea Penteli, Greece
4
The Cyprus Institute, 20, Konstantinou Kavafi Str., 2121 Aglantzia, Nicosia, Cyprus
*
Author to whom correspondence should be addressed.
Remote Sens. 2018, 10(10), 1595; https://doi.org/10.3390/rs10101595
Submission received: 30 July 2018 / Revised: 1 October 2018 / Accepted: 2 October 2018 / Published: 6 October 2018
(This article belongs to the Special Issue Remote Sensing of Precipitation)

Abstract

:
The principal objective of this study is to present and evaluate an advanced dust wet deposition scheme in the Weather and Research Forecasting model coupled with Chemistry (WRF-Chem). As far as the chemistry component is concerned, the Georgia Tech Goddard Global Ozone Chemistry Aerosol Radiation and Transport of the Air Force Weather Agency (GOCART-AFWA) module is applied, as it supports a binary scheme for dust emissions and transport. However, the GOCART-AFWA aerosol module does not incorporate a wet scavenging scheme, nor does it interact with cloud processes. The integration of a dust wet deposition scheme following Seinfeld and Pandis into the WRF-Chem model is assessed through a case study of large-scale Saharan dust transport over the Eastern Mediterranean that is characterized by severe wet deposition over Greece. An acceptable agreement was found between the calculated and measured near surface PM10 concentrations, as well as when model estimated atmospheric optical depth (AOD) was validated against the AERONET measurements, indicating the validity of our dust wet deposition scheme.

Graphical Abstract

1. Introduction

Dust particles in the atmosphere are deposited on the Earth’s surface via wet (precipitation) or dry deposition (gravitational forcing). Hence, dust wet deposition is one of the most important sink processes of dust aerosol particles. The climatic and meteorological importance of mineral dust particles is significant, as it contributes to the absorption and scattering of solar radiation (shortwave and longwave), both of which modify the albedo of Earth-Atmosphere system [1]. Furthermore, mineral dust contributes to the modification of the optical properties of clouds and ice/snow surfaces [2,3], and even alters the water content of the atmospheric column [4]. Marconi et al. [5] identified two main source areas for intense dust episodes influencing the Mediterranean Basin: one in Algeria-Tunisia, and one in Libya. These extreme outbreaks mainly occur in autumn and spring [6,7,8,9,10,11,12]. In order to evaluate the effects of these episodes on global and regional scales, spatial distributions and temporal variations of deposition fluxes must be ascertained [13]. In addition to in-situ measurements, observations using ground-based and space borne lidars provide vertical and spatial distributions of mineral dust particles in the atmosphere [14,15,16,17,18]. However, data related to temporal variations and spatial distributions of mineral dust flux at the ground are still very limited [19,20].
A number of dust modeling studies have been carried out that focus either on dust emissions and advection [3,21,22] or dust budget, including dry/wet deposition [23]. The efficiency of the wet deposition depends on many factors, such as particle size distribution [24], raindrop size distribution [25], the chemical characteristics of the particles [26], scavenging efficiencies [27], and electrical forces [28]. Wet deposition processes are generally represented using a computationally-efficient bulk method with separate treatment of the in cloud (rainout) and below cloud (washout) scavenging [29,30].
Below cloud scavenging by precipitation is the process of aerosol removal from the atmosphere between a precipitating cloud base and the ground. The scavenging of dust particles by falling hydrometeors takes place by Brownian and turbulent shear diffusion, inertial impaction, diffiusiophoresis, thermophoresis, and electrical effects [31]. Guelle et al. [32] estimate an aerosol scavenging coefficient based on a parameterization according to the particle diameter [33] which is integrated over the aerosol size distribution [34]. Some corrections are also applied concerning the mean diameters of dust size distributions, thus providing more accurate scavenging efficiencies of the dust particles. Sensitivity tests have shown that during large-scale precipitation events, below cloud scavenging has been found to be negligible for submicronic aerosols, while the results according to observations show an acceptable reproduction of the annual wet deposition fluxes. Former studies reach the same conclusion [35,36,37], which shows that there is a minimum in the collection efficiency of aerosol particles with radii of 0.5 to 1 μm called the “Greenfield Gap” [31].
As far as the in-cloud scavenging is concerned, the precipitation formation is related to the cloud droplet number concentration and the liquid water content [38]. In a fundamental study, Giorgy and Chameides [39] estimate the in-cloud scavenging coefficient in terms of the local water vapor condensation (and precipitation) rate. Furthermore, Tsyro [40] and Guelle et al. [32], estimate the in-cloud scavenging as a function of the liquid water content and the particle hygroscopicity. In contrast to below-cloud scavenging, the in-cloud scavenging is important for submicron particles [41].
The available wet deposition parameterizations used for dust modeling can be classified into four types, based on their formulations [41]. The first type calculates the scavenging coefficient as a function of the raindrop-particle collection efficiency and raindrop size distribution [42,43,44]. In the second type, the wet scavenging coefficient is calculated as a function of a single value, for example relative humidity [45] or precipitation [23,46]. In the third type, the scavenging coefficient is estimated as an empirical relationship based on aerosol size spectrum and precipitation parameters [28]. As far as the fourth type is concerned, the scavenging coefficient is defined as the ratio of the dust concentration in the precipitation divided by the dust concentration in the air [47]. In their study, Jung and Shao [41], through an intercomparison of below cloud dust wet deposition schemes that rely on these four types, show that, apart from the third scheme which is based on field measurements, the other schemes showed similar wet deposition patterns, although the scavenging efficiencies were quite different. The scavenging efficiencies of the first scheme were negligible for submicron particles, which is acceptable, as submicron particle removal is an in-cloud scavenging matter, as mentioned above. The simulated dust concentrations with the third and the fourth schemes are underestimated in comparison to the observations. On the other hand, the dust concentrations concerning the first and the second types are in good agreement with the measured data [41].
In this study, a dust wet deposition scheme is implemented in the Georgia Tech/Goddard Global Ozone Chemistry Aerosol Radiation and Transport (GOCART) module of the fully coupled Weather Research and Forecasting coupled to Chemistry model (WRF/Chem) [48,49]. The original GOCART scheme [50] does not support any dust wet deposition scheme. Thus, a dust wet deposition scheme following Seinfeld and Pandis [44] is fully embedded in the revised GOCART-AFWA (Air Force Weather Agency) module. This scheme belongs to the first type of the abovementioned dust wet deposition schemes in a form adopted by the Comprehensive Air Quality Model with Extensions (CAMx) [22,51,52] for aerosols inside and below clouds. Although the scheme is computationally expensive [53], it does not contribute to systematic underestimation of the simulated dust concentration, as it has negligible scavenging effects on submicron particles for the area below the clouds. It also incorporates an in-cloud scavenging process for submicron particle removal. Moreover, it is a scheme that takes into account parameters that characterize the behavior of particles suspended in a fluid flow, such as the Reynolds, Schmidt, and Stokes numbers, as it represents wet removal using microphysical processes including detailed interactions between hydrometeors and aerosols.
The new scheme has been evaluated in a case study of a severe wet deposition event which affected Central and Eastern Mediterranean. This episode was characterized by large-scale dust transport from the Saharan desert area towards the Eastern Mediterranean, followed by torrential rain over Greece during the early days of June 2014. Due to the fact that ground measurements of the dust wet deposition are scarce, an evaluation using observed data of Aerosol Optical Depth and PM10 concentrations has been performed. Furthermore, the impact of the new GOCART wet deposition scheme on the dust vertical profile is also assessed through two sensitivity simulations which are evaluated against ground-based measurements provided by the AERONET network.

2. Materials and Methods

2.1. Model Configuration and Parameterization Schemes

The simulations in this study have been performed using the WRF/Chem (version 3.8) model, which is a fully coupled meteorology-chemistry model that contains a variety of schemes for the simulation of atmospheric chemistry [48]. The meteorological component is fully consistent with the chemical component. Hence, both meteorological and air-quality components use the same physics schemes for the sub-grid scale transport, the same grid on the horizontal and vertical coordinates, and the same transport scheme, which preserves air and scalar mass. WRF/Chem is set up in a domain that covers the area of North Africa, the Mediterranean, the Europe, the Middle East, and the Arabian Peninsula. This domain encompasses the entire subtropical belt of deserts, which act as mineral dust sources emitting particulate matter towards the Mediterranean (see Figure 1). It consists of 400 × 212 grid points, on a horizontal resolution of 25 × 25 km, and with 38 vertical levels from the Earth’s surface to 50 hPa. The ECMWF (European Centre for Medium-Range Weather Forecasts) analyses are used as initial and boundary conditions at a resolution of 0.5° × 0.5° and with a 6h time increment.
The basic parameterization schemes for the simulations in this study are summarized in Table 1 (see [54,55,56,57,58]). The Rapid Radiative Transfer Model (RRTMG) for both short-wave and long-wave radiation calculations is used [58]. RRTMG has the ability to use prognostic dust fields to calculate the aerosol direct radiative effect; however, this is not used in the present study, and dust is considered as a passive tracer. The Morrison 2-moment microphysics scheme (6-class microphysics scheme with graupel) is used as described in Refs. [55,56]. As a new and advanced 2-moment microphysics scheme, Morrison in its WRF release predicts the mass mixing ratio for five hydrometeor categories: cloud, rain, snow, ice, and graupel. It also predicts the total number concentrations for cloud water, rain, snow, ice, and graupel [59].

2.2. The Air Quality (Chemistry) Component

The WRF/Chem model includes three alternative packages for mineral dust emission: two (namely, “DUST-GOCART”, “DUST-GOCART/AFWA”) from the GOCART module, and the third (namely, “DUST-UOC”) from the University of Cologne [60]. In “DUST-GOCART”, the dust emissions are scaled with the soil erodibility fields, as described by Ref. [61], with the dust emissions activating when the 10-m wind speed exceeds a threshold value proposed by Ref. [62]. In the “DUST-GOCART/AFWA scheme, dust emissions are also scaled with the erodibility fields based on Ref. [61], with the erodibility function being dependent to the particle bin mass fraction. This scheme also parameterizes the initialization of dust production by saltation bombardment. For dry soils, there is the same threshold as that used in “DUST-GOCART”, but AFWA uses a different soil moisture correction. On the other hand, the “DUST-UOC” uses the erodible fields of Ref. [61] for the definition of the areas concerning the areas of potential dust emission, but in contrast to the other two previous schemes, the calculated dust emissions are not scaled with the erodibility function [63]. However, “DUST-GOCART/AFWA” produces an important over-prediction of dust concentration [64]. This may be explained in part by the fact that the AFWA scheme only considers vertical dust flux which is related to clay content [60], and it does not support a dust wet deposition scheme, in contrast to the “DUST-UOC”, which considers a more realistic soil texture type. Furthermore, the “DUST-UOC” supports a dust wet deposition scheme based on the study of Jung [65], only for below cloud scavenging of aerosols. Thus, it is expected that the implementation of a dust wet deposition scheme in the “DUST-GOCART/AFWA” module that contains both in-cloud and below cloud scavenging processes will contribute to the reduction of the systematic overestimation of dust concentration.

2.3. The GOCART-AFWA Module

The GOCART-AFWA module contains a sectional, non-experimental dust scheme with advanced dust emissions parameterizations [54,66]. In the GOCART-AFWA module, the dust emissions scheme is based on the parameterizations of Ref. [62], incorporating five dust bins of 0.73, 1.4, 2.4, 4.5, and 8.0 μm effective radii. In this scheme, the saltation of large particles is triggered by wind shear, leading to fine particle emissions by disaggregation and bombardment. The dust emissions due to saltation bombardment are parameterized, with the vertical dust emission flux being proportional to the horizontal saltation dust flux, calculated when the friction velocity exceeds a certain threshold. Saltation processes for a given size bin initiate or cease as the friction velocity exceeds or falls below the values of the threshold friction velocity [67]. The proportionality of dust emission and dust flux is empirically related to clay, sand, and erodibility fields that are shown in Figure 1. As stated above, the empirical relationship of the vertical dust flux to the clay content is a reason for the systematic overprediction of the simulated dust concentration [60]. However, as far as soil moisture is concerned, the correction of Ref. [68] is applied. The calculation of the horizontal saltation flux is based on a modification of the expression of Ref. [69]. The distribution of the dust particles follows the brittle fragmentation theory [70]. The dust particles are emitted into the lowest atmospheric model level according to their respective size bins. GOCART-AFWA is able to resolve direct effects concerning aerosol interactions with radiation. However, in this study, no interactions with radiation are taken into account. Moreover, no wet scavenging mechanism is currently supported.

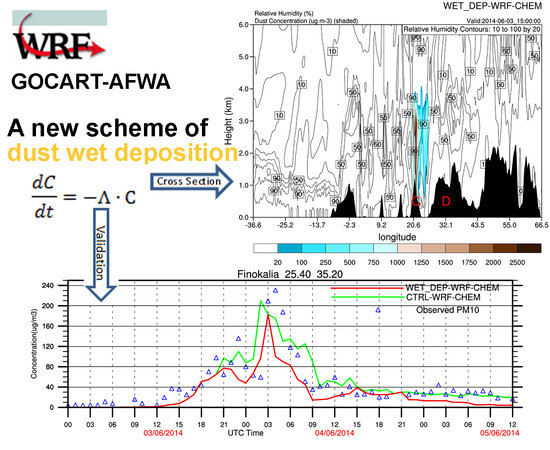
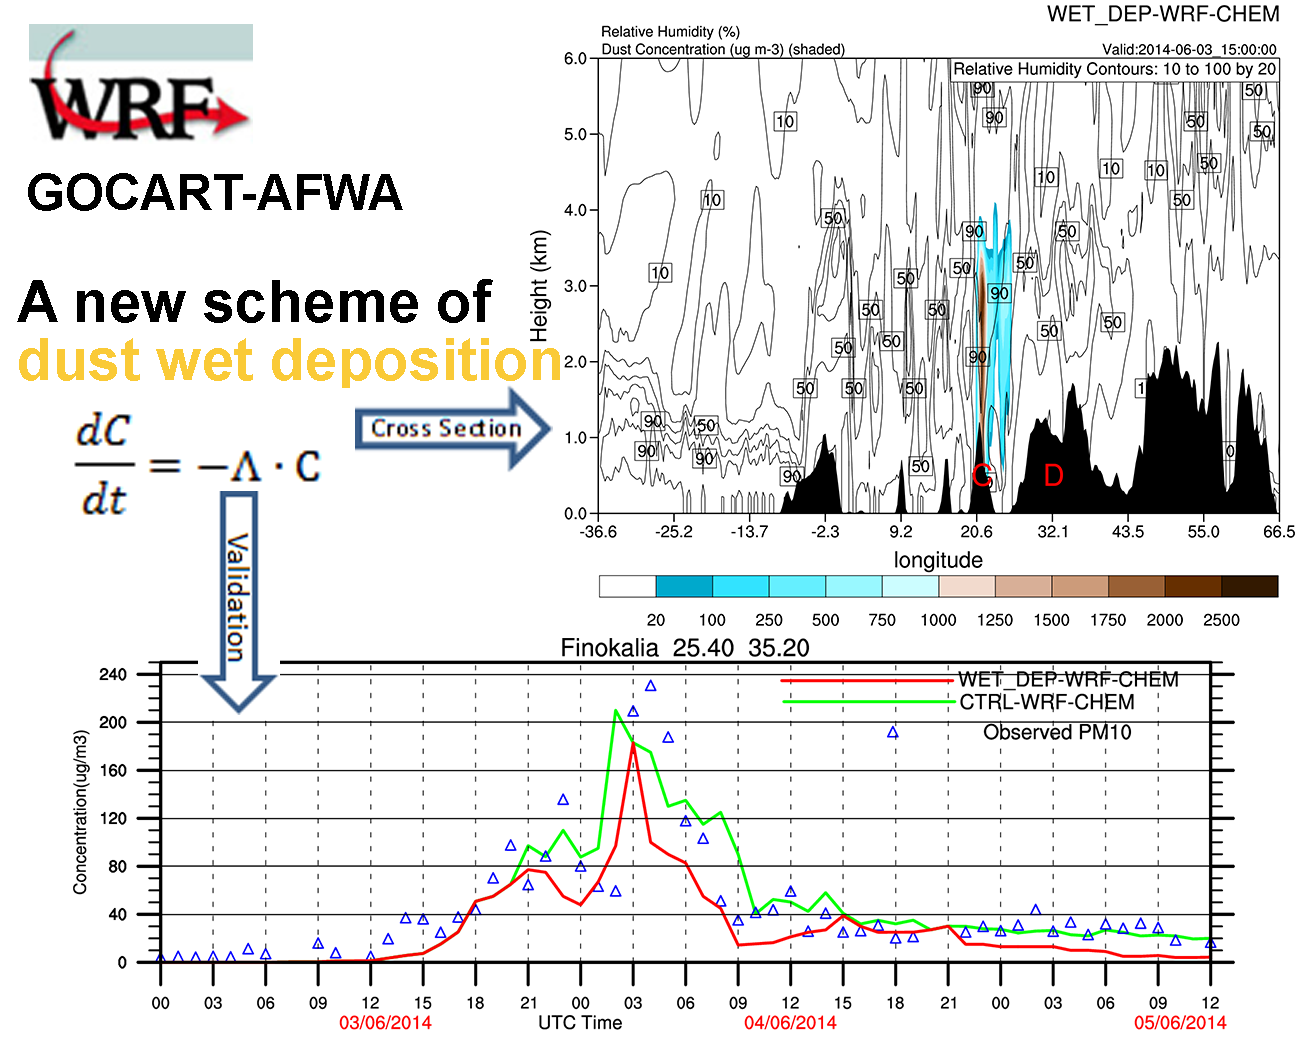
2.4. The Embedded Dust Wet Deposition Scheme

The dust wet removal from the atmosphere can be expressed in two stages: one inside the cloud (in-cloud wet scavenging), and the other below the cloud base (below cloud scavenging). The Seinfeld and Pandis [44] dust wet deposition scheme (hereafter denoted as SP) is embedded in the GOCART-AFWA module in order to estimate the rate of dust scavenging by precipitation for both in and below cloud areas, concerning grid-scale and convective precipitation [55,56,57]. The wet removal is considered only by rain, and no evaporation mechanism is taken into account. Scavenging is direct and irreversible, and the mass which is collected by rain is effectively removed from the atmosphere. Particles that are captured by the droplets are deposited to the ground. The advantage of this scheme is that it takes into account parameters that characterize the behavior of particles suspended in a fluid flow, such as the Reynolds, Schmidt, and Stokes numbers. Thus, the rate of dust concentration ( C ) removed by the precipitation is represented by
C t = Λ C
where, Λ is the scavenging coefficient. For aerosols inside the clouds, the scavenging coefficient is given by:
Λ = 4.2 × 10 7 E P d c
where E is the collection efficiency (E = 0.9), P is the total precipitation (mm h−1), which is the sum of the grid-scale and convective precipitation in each model layer, and d c is the cloud mean droplet diameter, with values from 2 μm to 50 μm [55]. In order to identify the cloud existence in a grid cell and in a specific model layer, the Cloud Water mixing ratio is utilized. Values greater than zero indicate the presence of clouds, and aerosols are assumed to act as in cloud water. As far as the wet removal below the cloud base is concerned, the same scavenging coefficient is used as before, but d d instead of d c is used in Equation (2). Furthermore, the collection efficiency is now dependent on the particle size d p (effective diameters of 1.46 µm, 2.8 µm, 4.8 µm, 9.0 µm, 16 μm), as shown below [37,44]:
E ( d p ) = 4 R e S c ( 1 + 0.4 R e 1 / 2 S c 1 / 3 + 0.16 R e 1 / 2 S c 1 / 2 ) + 4 φ [ μ μ w + φ ( 1 + 2 R e 1 / 2 ) ] + ( S t S S t S + 2 / 3 )
where, R e is the Reynolds number of the raindrop, S c is the Schmidt number for the collected particle, S t is the Stokes number for the collected particle, μ and μ w are the kinematic viscosity of the air and water respectively, and φ = d p / d d is the ratio from particle size to raindrop size respectively, with d p being the particle diameter and d d the raindrop mean diameter with values of 20 μm to 500 μm [55], for below cloud scavenging instances. Parameter S is given by Equation (4), and the R e , S t and S c are given by Equations (5)–(7), respectively:
S = 1.2 + ln ( 1 + R e ) / 12 1 + ln ( 1 + R e )
R e = d d V t ( d d ) ρ α 2 μ
S c = μ ρ α D
S t = 2 τ ( V t ( d d ) v t ( d p ) ) d d
In these relationships, the various variables are defined as follows:
D = k b T C c 3 π μ d p
C c = 1 + 0.167 d p
τ = v t g
v t = C c g 3 π μ d p
V t = a d b
where ρ α is the air density (kg m−3), V t and v t are the terminal velocities of the rain drops and the particles respectively (in m s−1) as they are diagnostically estimated by the model, g is the gravitational acceleration (in m s−2), d is equal to d c or d d , C c is the Cunningham correction factor, k b = 1.38066 × 10⁻²³ J K−1, and T is the model predicted temperature (in K). For cloud particles, α = 3 × 10⁷ m1−bs−1 and b = 2, and for rain particles a = 841.997 m1−bs−1 and b = 0.8 [55,71,72]. The expressions of D (particle diffusivity) and τ (relaxation time of the collected particle) are dependent on dp and are given by Refs. [44,73]. The first term in Equation (3) is the contribution to the Brownian diffusion, the second term concerns the collection by interception, and the third term concerns the inertial impaction and it is efficient for large particles ( d p > 2 μm) [74] with a restriction when S t > S [75].

3. Results

For its consistency and performance, the WRF/Chem model using the GOCART-AFWA module with the SP scheme has been tested in a case study. To accomplish this, two numerical experiments have been conducted for a case of a large-scale desert dust transportation event which involved severe wet deposition that affected central and eastern Mediterranean from 3 to 5 June, 2014. The two numerical experiments have been designed as follows:
  • The control simulation (CTRL): It adopts the default GOCART-AFWA configuration described in Section 2.1 and Section 2.2.
  • The wet deposition simulation (Wet_Dep): As in CTRL but enabling the dust wet deposition scheme described in Section 2.3.
Both simulations initialized on 2 June in “dust hot started” mode. To this end, a 72hr “dust cold started” simulation initialized on the 30 May, 2014 in order to build the adequate desert dust background for driving CTRL and Wet_Dep. Since the date of interest is the 3rd of June, the spin-up time was 12 h for both simulations.
The inter-comparison between the two simulations demonstrates the impact of the SP scheme on the dust load and the dust concentration vertical profile caused by the vertical dust concentration losses triggered by the rainout and washout processes. Predicted dust is considered as a passive tracer for both simulations as far as interactions with radiation and clouds are concerned. Due to the lack of dust wet deposition measured data, the two simulations are evaluated against observed PM10 concentrations and AOD data provided by the Finokalia station of Crete and the AERONET network respectively.

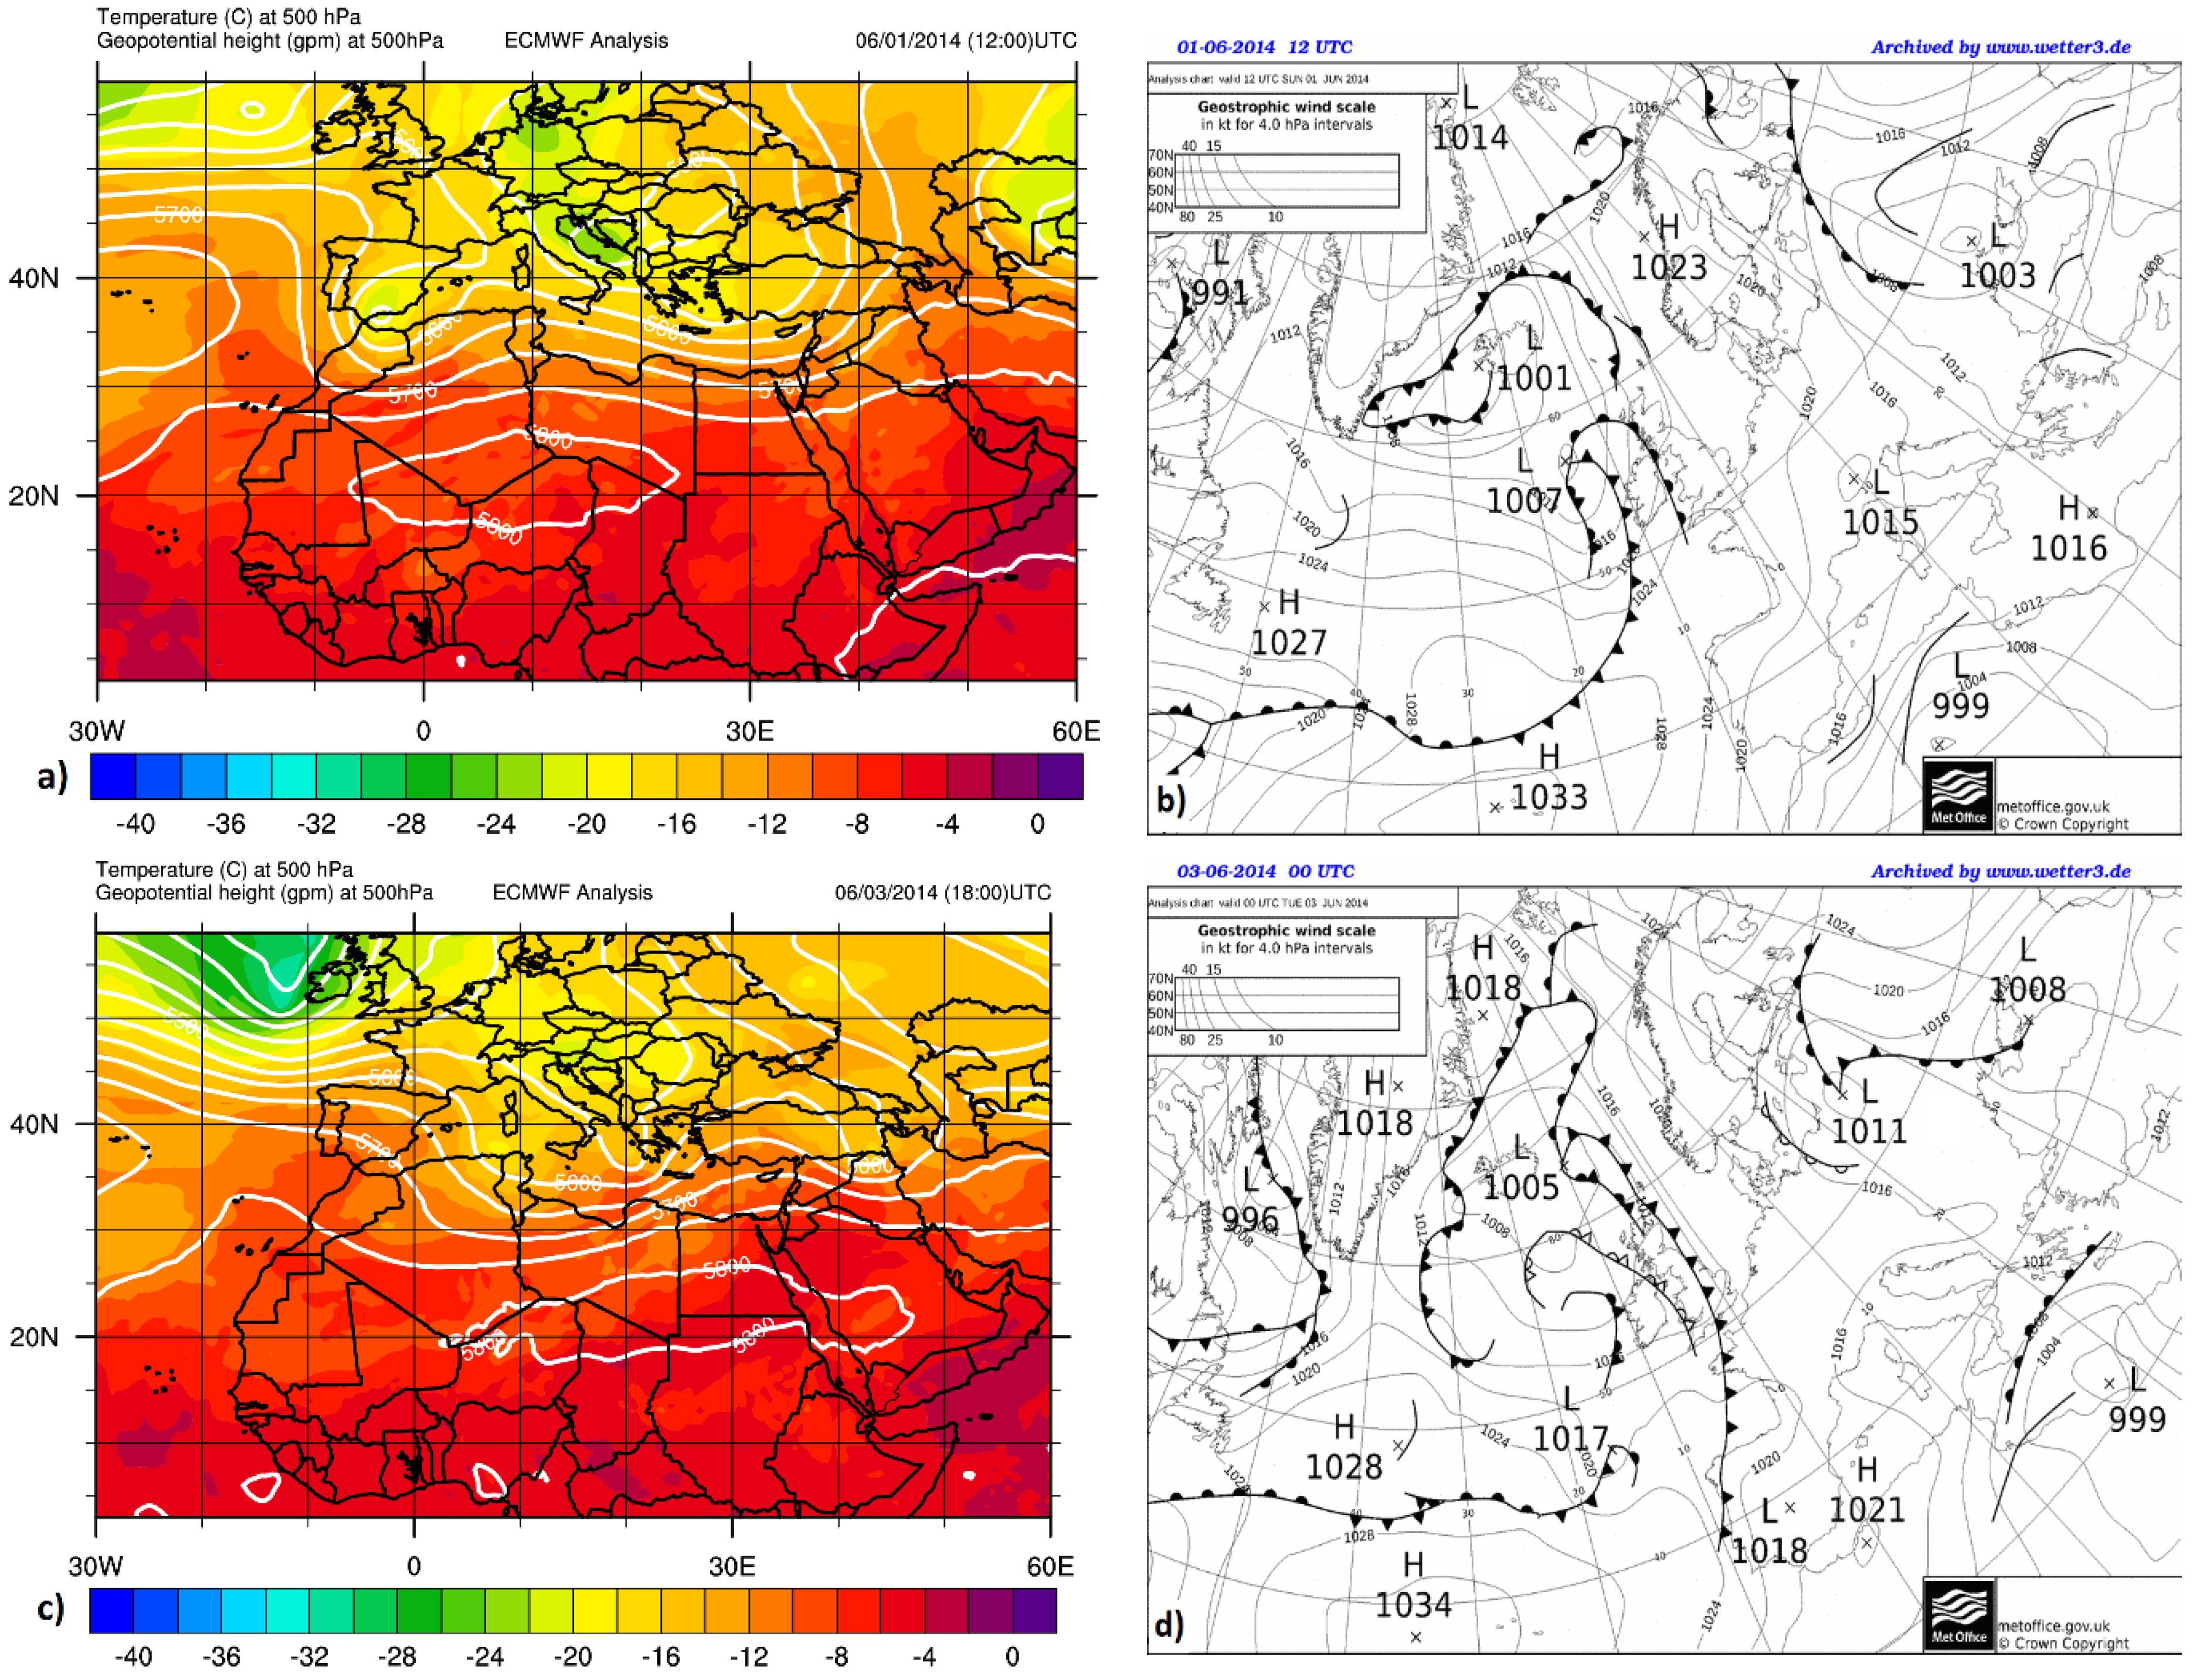
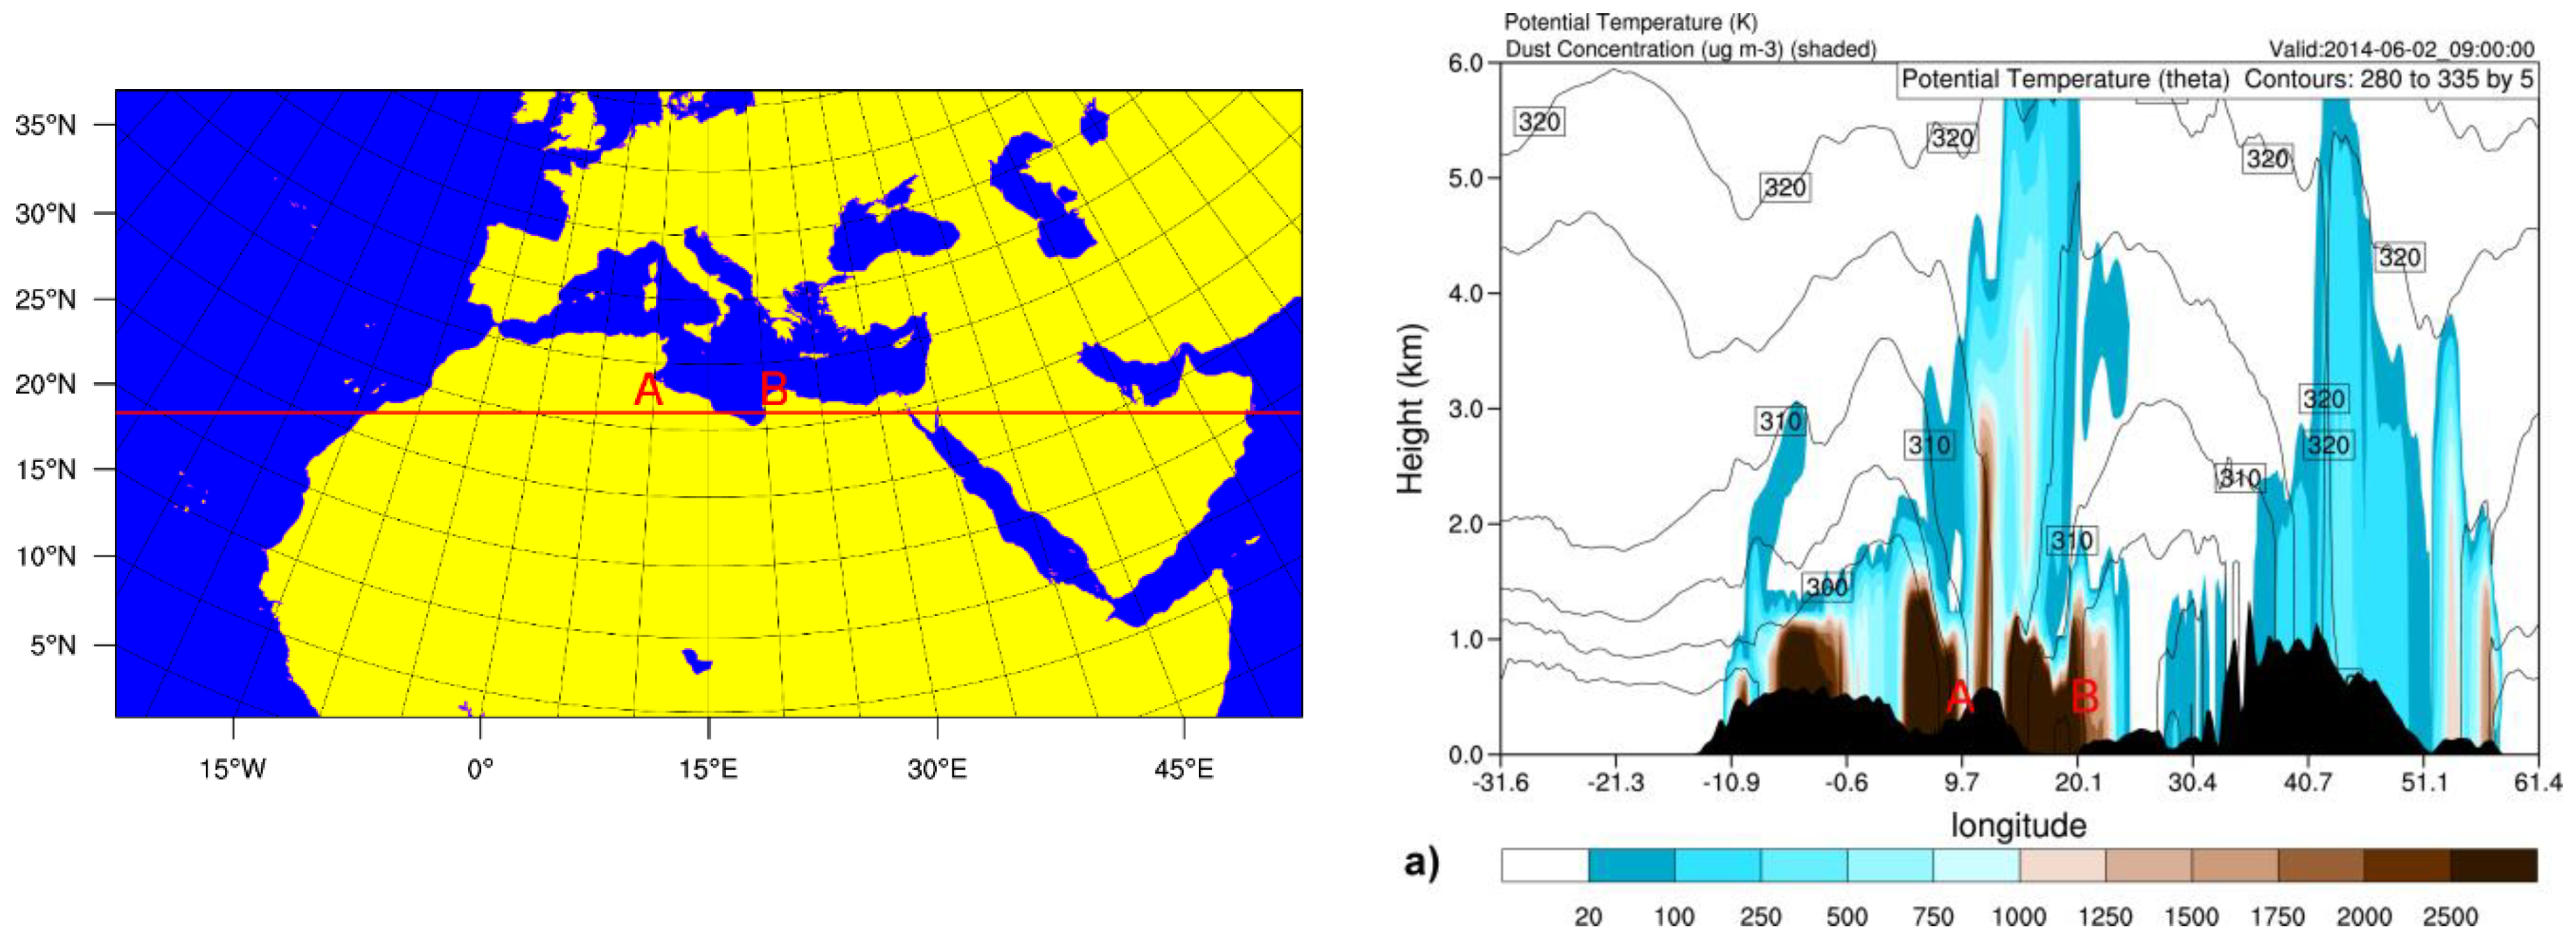
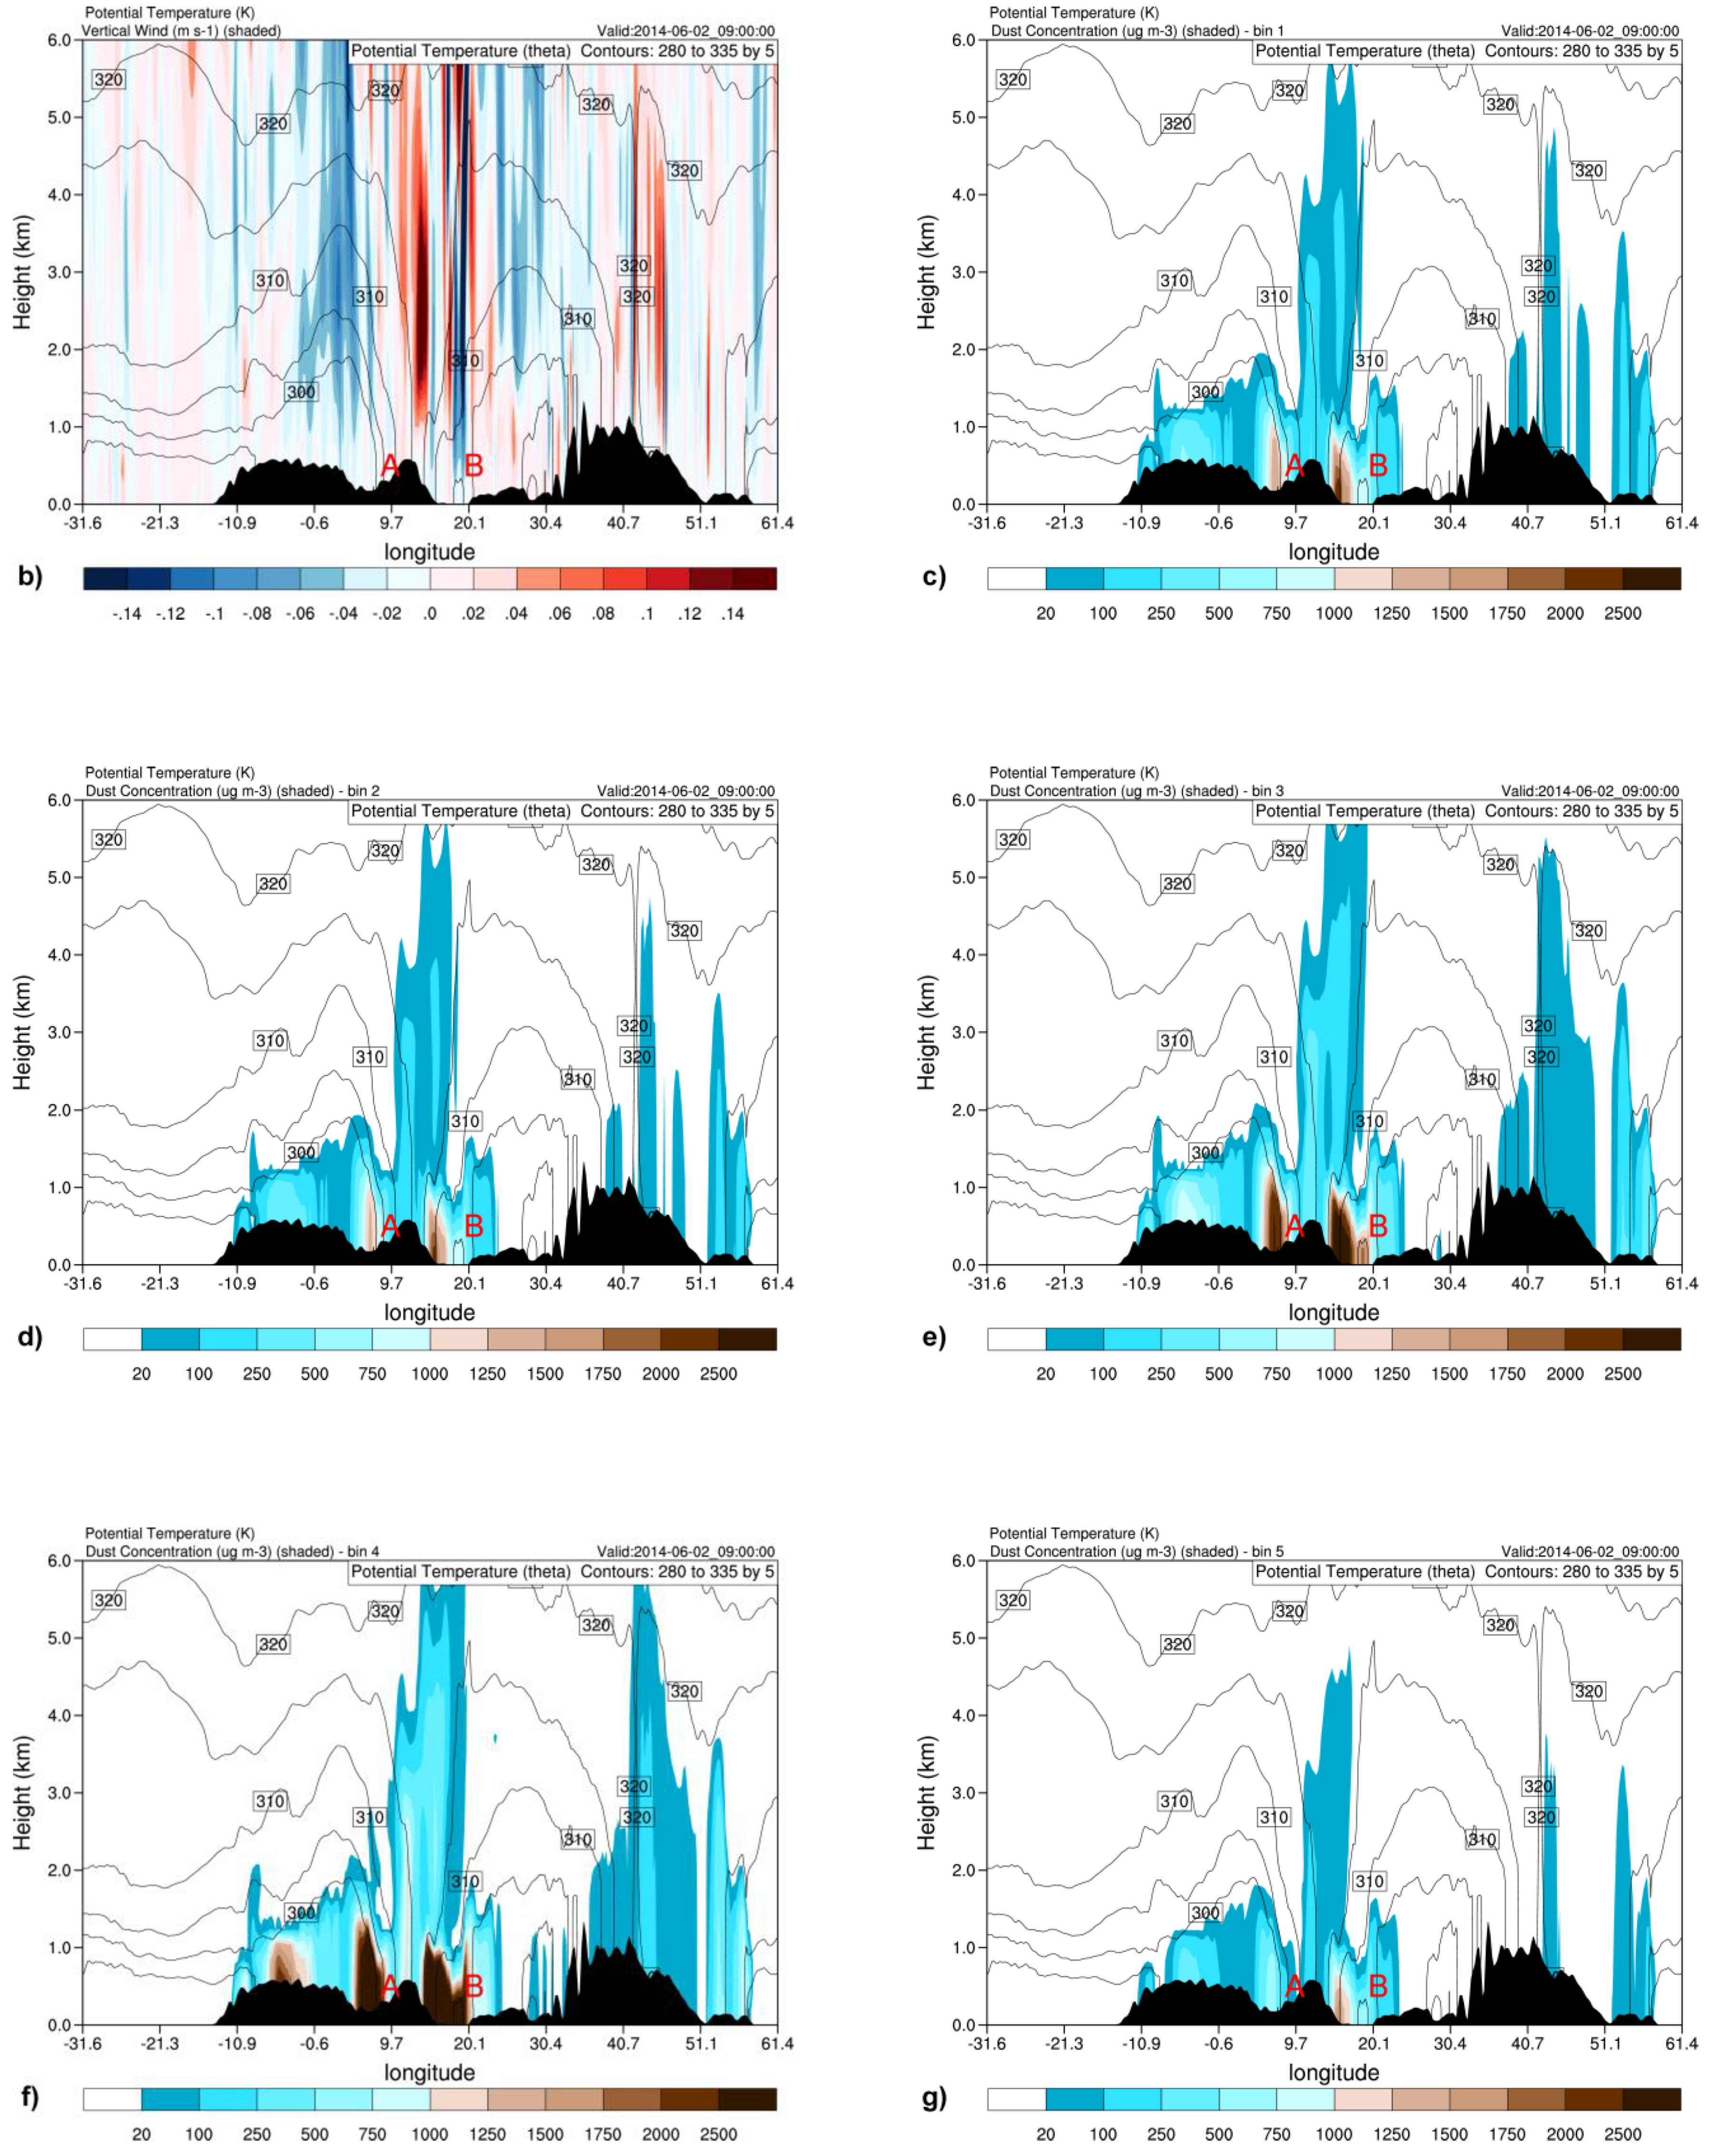
3.1. Description of Synoptic Conditions
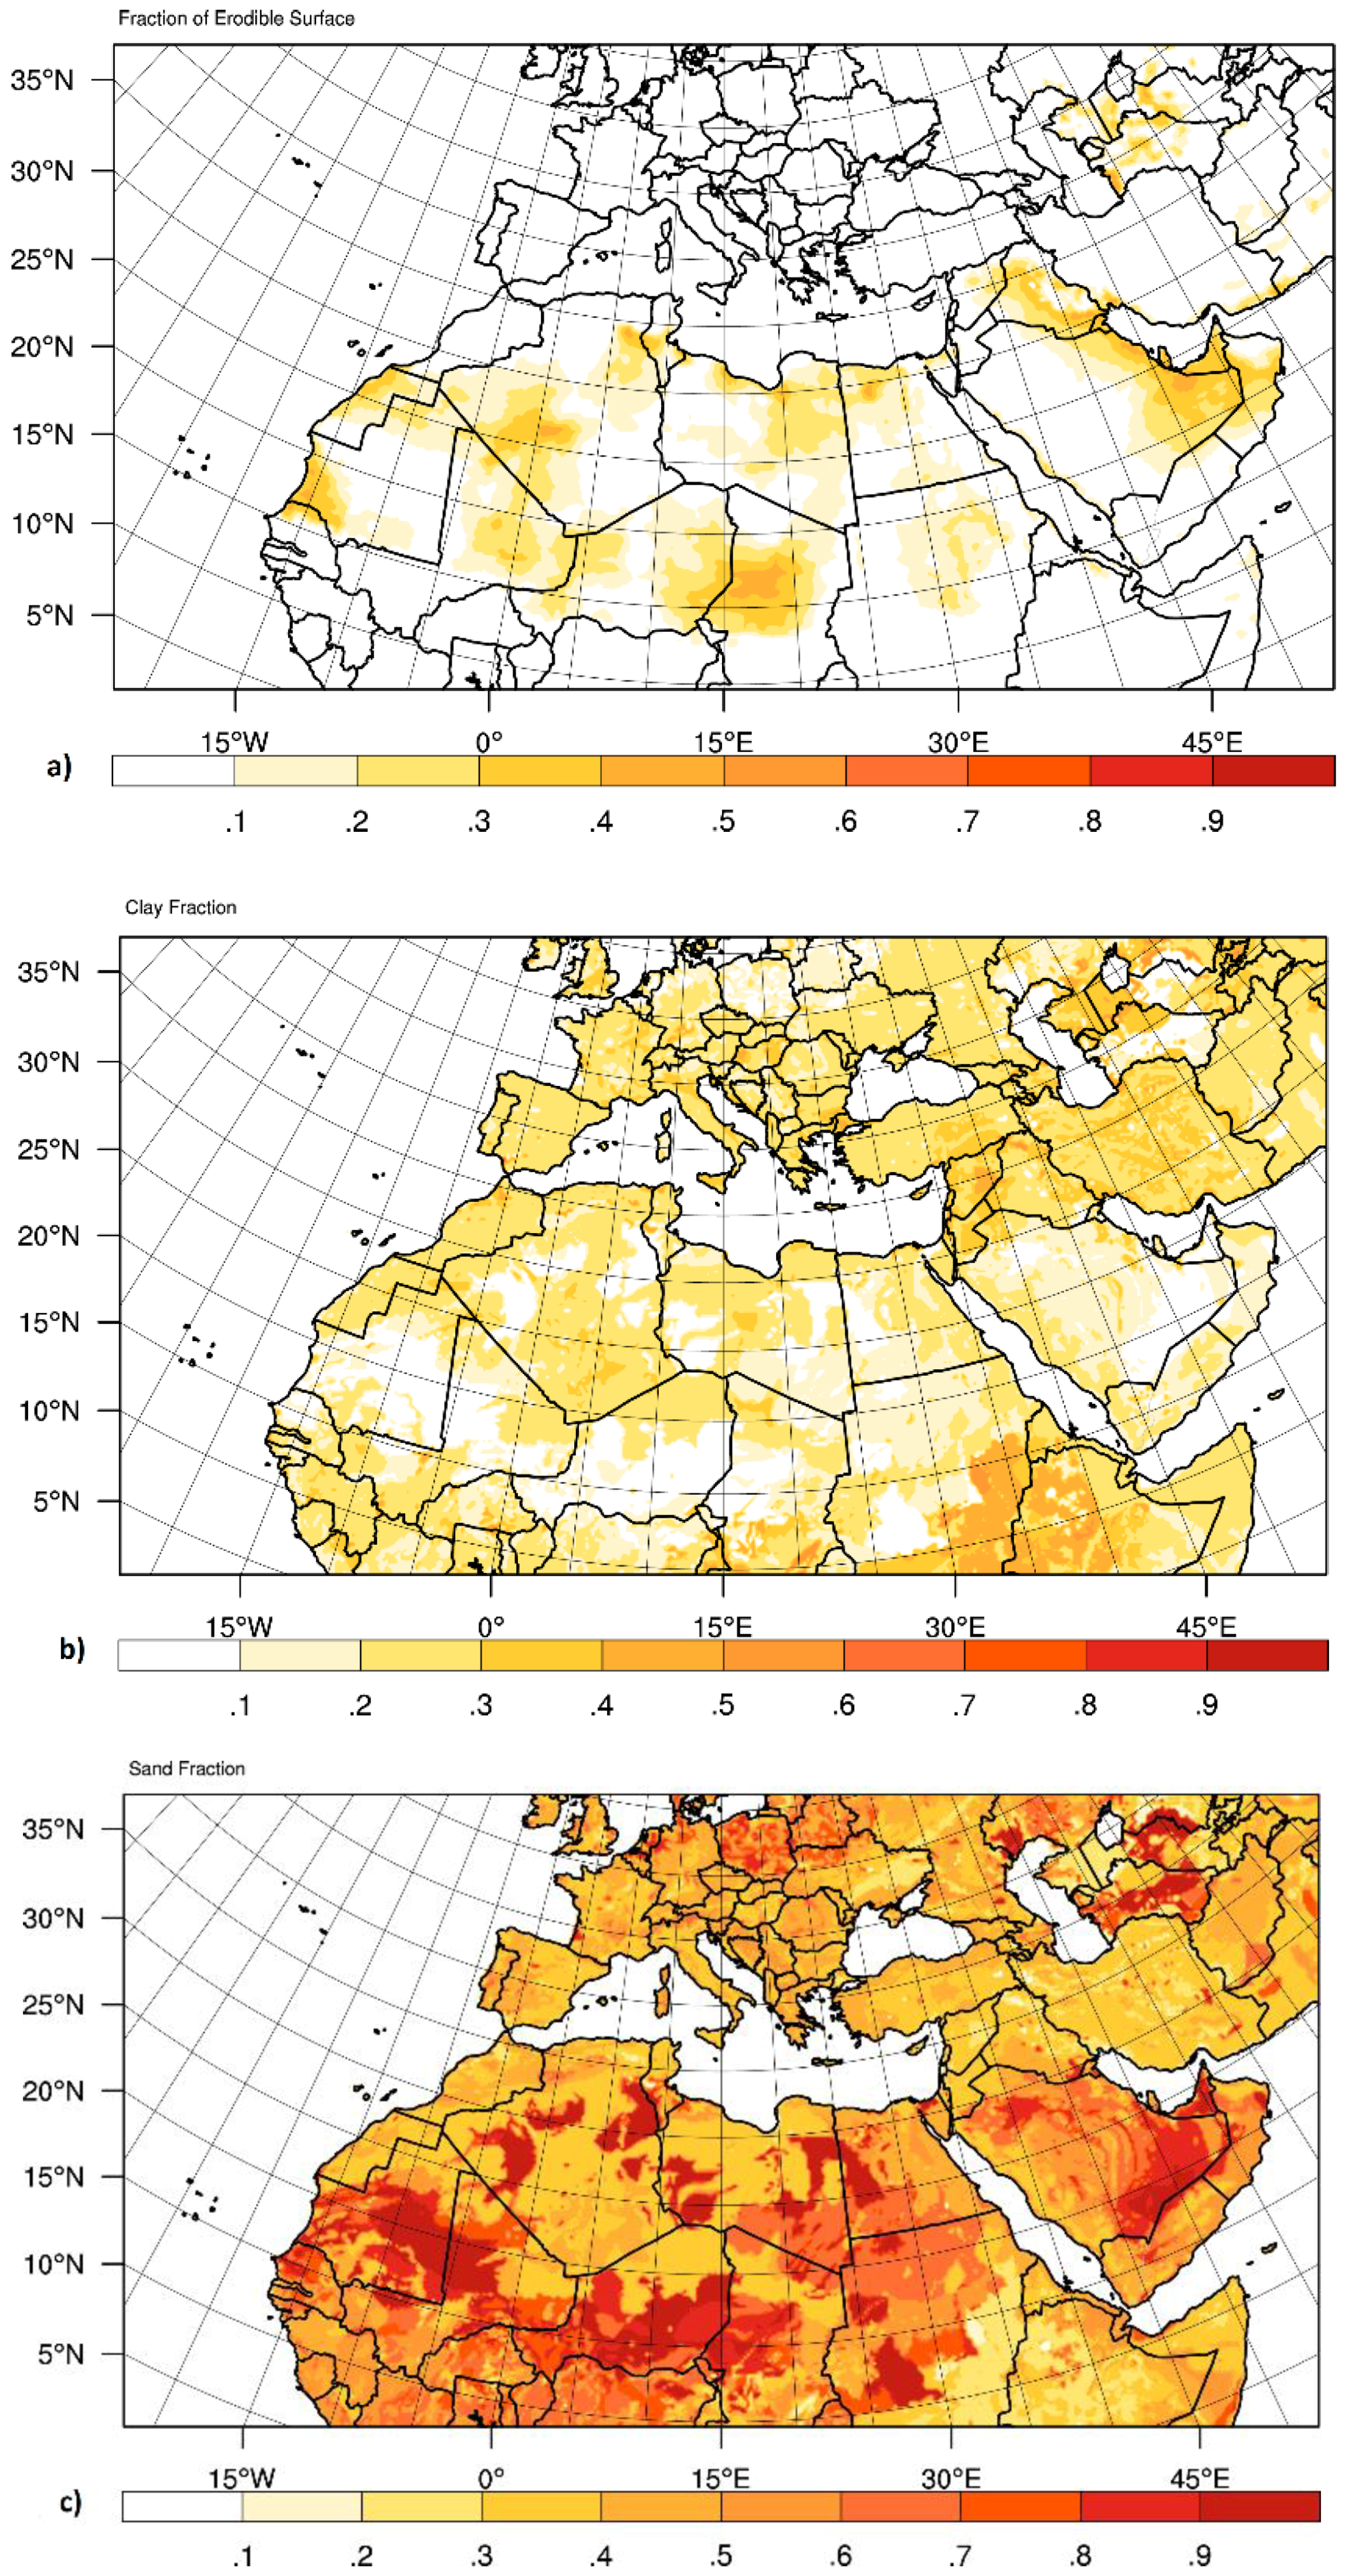
On 1 June 2014, an upper-air trough, transferring cold air masses towards central Europe and the Mediterranean, was associated with the development of a barometric low over Northern Algeria (Figure 2a,b). As the trough propagated eastward on 2 June, the surface low triggered updraft motions due to the formation of a well-organized warm front over Tunis and Libya (not shown). The prevailing upper air southwesterly synoptic flow favored the advection of the suspended particles towards Italy and Greece. On 3 June, the torrential rains that occurred over Italy and Greece originated mainly from the warm front passage over Sicily and Greece, transferring warm and moist air masses over the Mediterranean Sea (Figure 2c,d). On 2 June, the enhanced instability led to cloud formation and triggered dust uptake mechanisms over Northern Africa (Figure 3a). On 3 June, the barometric low is located over the Gulf of Sirte, while the northward advected dust is washed out over western and central Greece (Figure 3b). On 4 June, the upper air conditions supported the eastward propagation of the barometric low over western Turkey, followed by a steady rise in surface pressure and moderate precipitation.

3.2. Dust Uptake

Dust uptake processes and vertical profiles have been investigated in an area between points A and B, which denote the major dust sources of this case study (see Figure 4 top left). In Figure 4a, the dust dispersion is shown as a combination of mechanisms that transfer the dust plume downstream from its source region (area between A and B points). The sharp downward slope of the isotheta contours in the area 10°–20°E confirms the presence of a warm front, which favours dust uptake. The synergy of the synoptic and mesoscale motions suspends dust particles with effective radii in the range of 0.5–4.5 μm (bins 1–4) up to the height of 6 km, while coarser particles reach up to the height of 5 km (bin 5) (Figure 4c–g). The enhanced buoyancy can also be confirmed by the positive values of the vertical wind velocity component which dominates the dust plume area and exceeds 0.14 m s−1 at 3 km, as shown in the cross-section of Figure 4b. The suspended particles in the lower troposphere are then transported horizontally downwind following the strong prevailed westerly flow.
The spatial distribution of the dust load (mg m−2) and wind speed at 3 km (m s−1) over the model’s area for 18:00 UTC 3 June 2014 are shown in Figure 5; from this figure, it can be seen that the simulated dust load over the Greek Peninsula reached 6000 mg m−2 at 18:00 UTC on 3 June 2014.

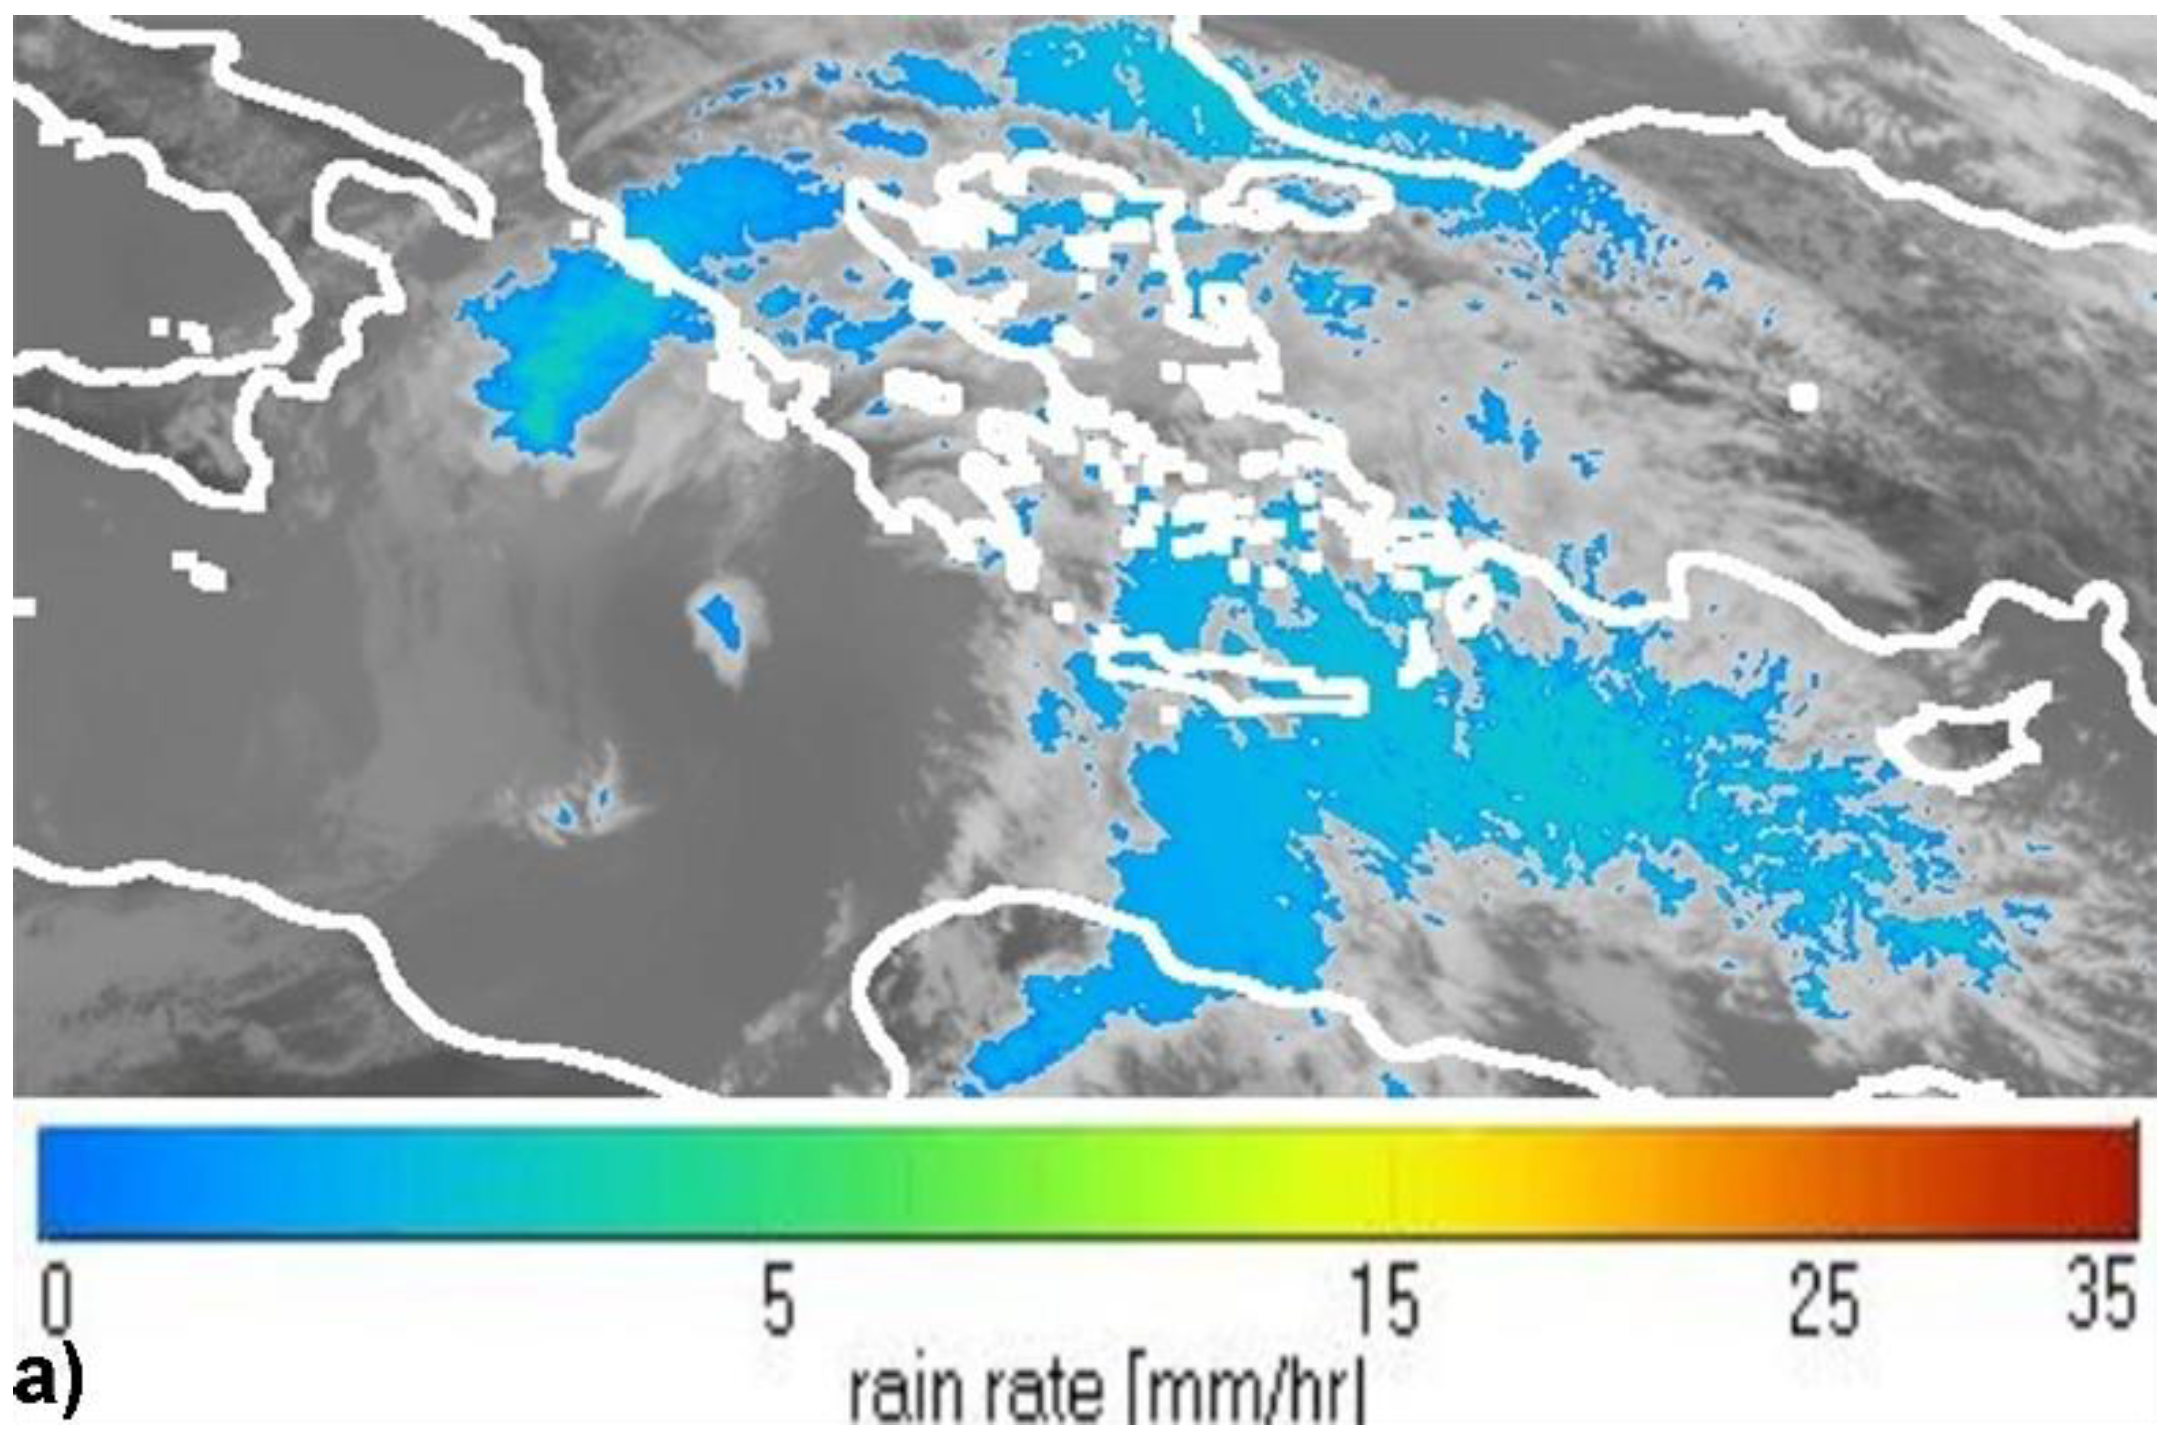
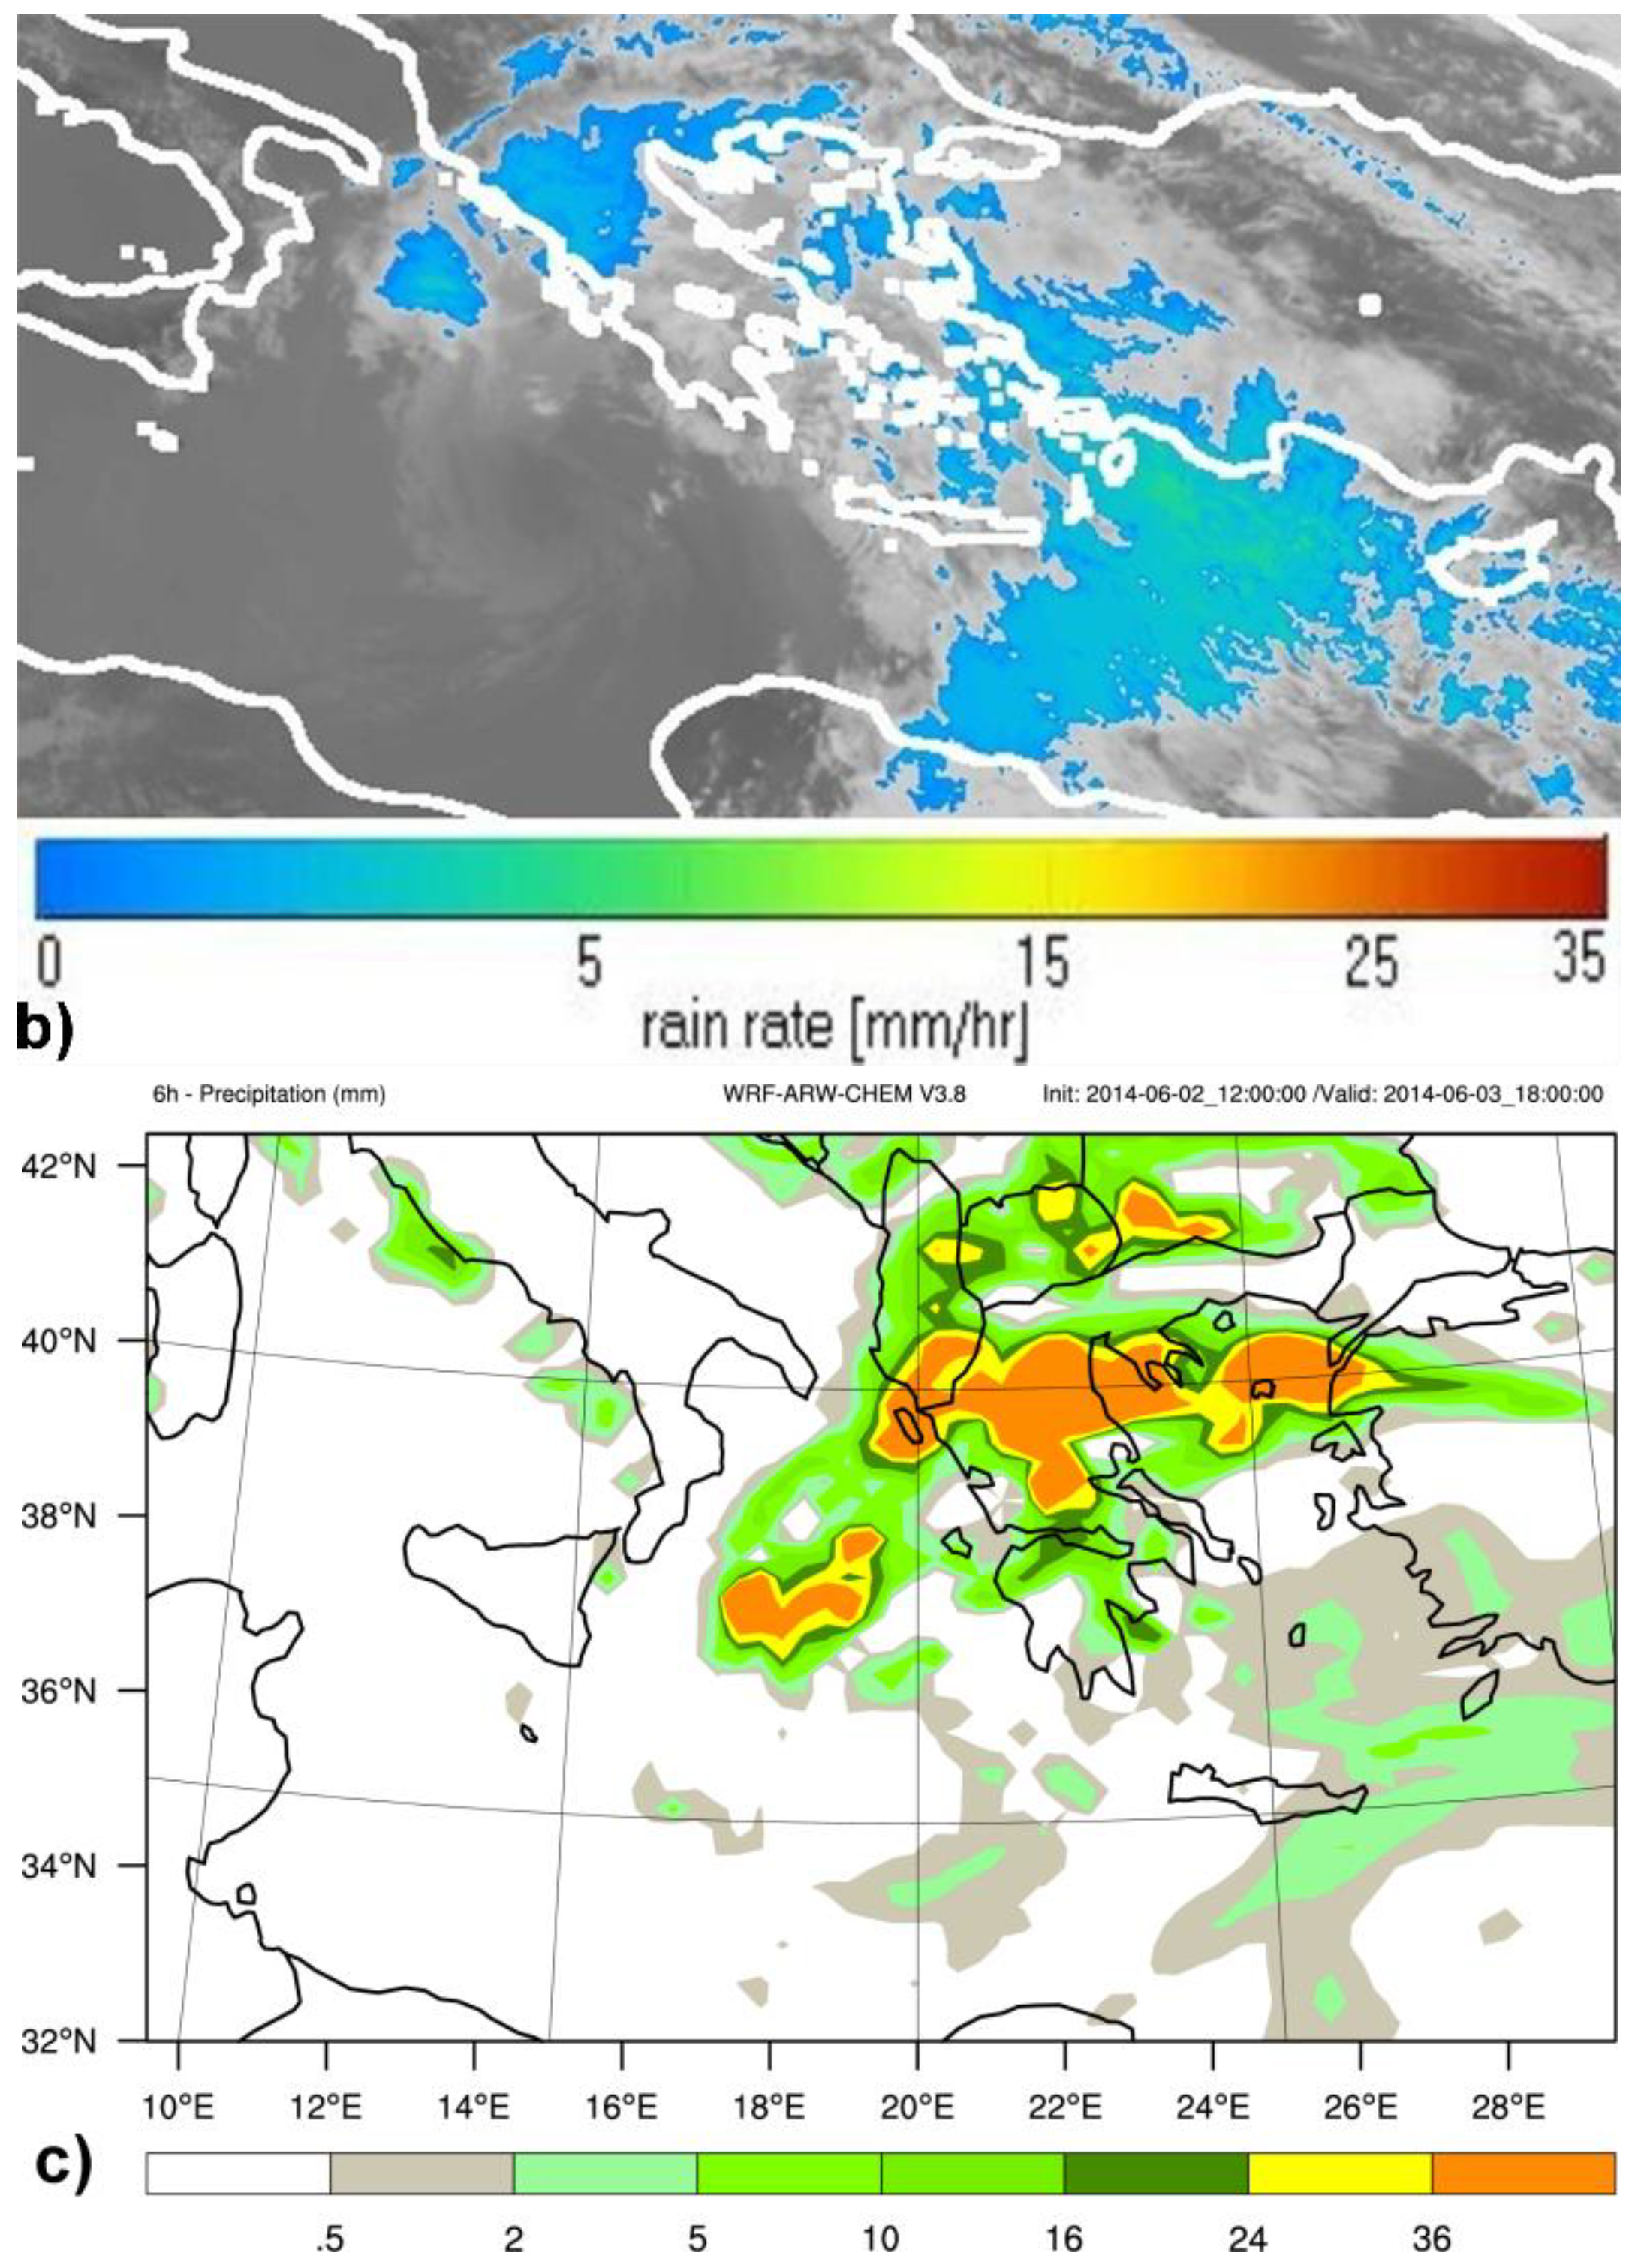
3.3. Modeled and Remotely Sensed Precipitation Distribution

In order to assess the model’s precipitation performance, a qualitative comparison is made between the model’s simulation results and remotely sensed precipitation rate from the EUMETSAT historical imagery archive (with 15 minutes frequency). Figure 6a,b show the precipitation rate on 3 June 2014 at 12:00 and 15:00 UTC, respectively, over the Greek Peninsula, with values reaching approximately 4–5 mm/hr. Figure 6c shows the simulated 6h precipitation on 3 June 2014 for 12:00–18:00 UTC. The 6h accumulated precipitation over Greece exceeded 36 mm in the northern areas of the country. The comparison shows satisfactory spatial agreement of the rainfall that occurred over the Greek Peninsula and the southeast Aegean Sea. Central and Eastern Mediterranean are dominated by a large-scale desert dust transport due to the prevailing synoptic conditions during the period from 3–5 June 2014.

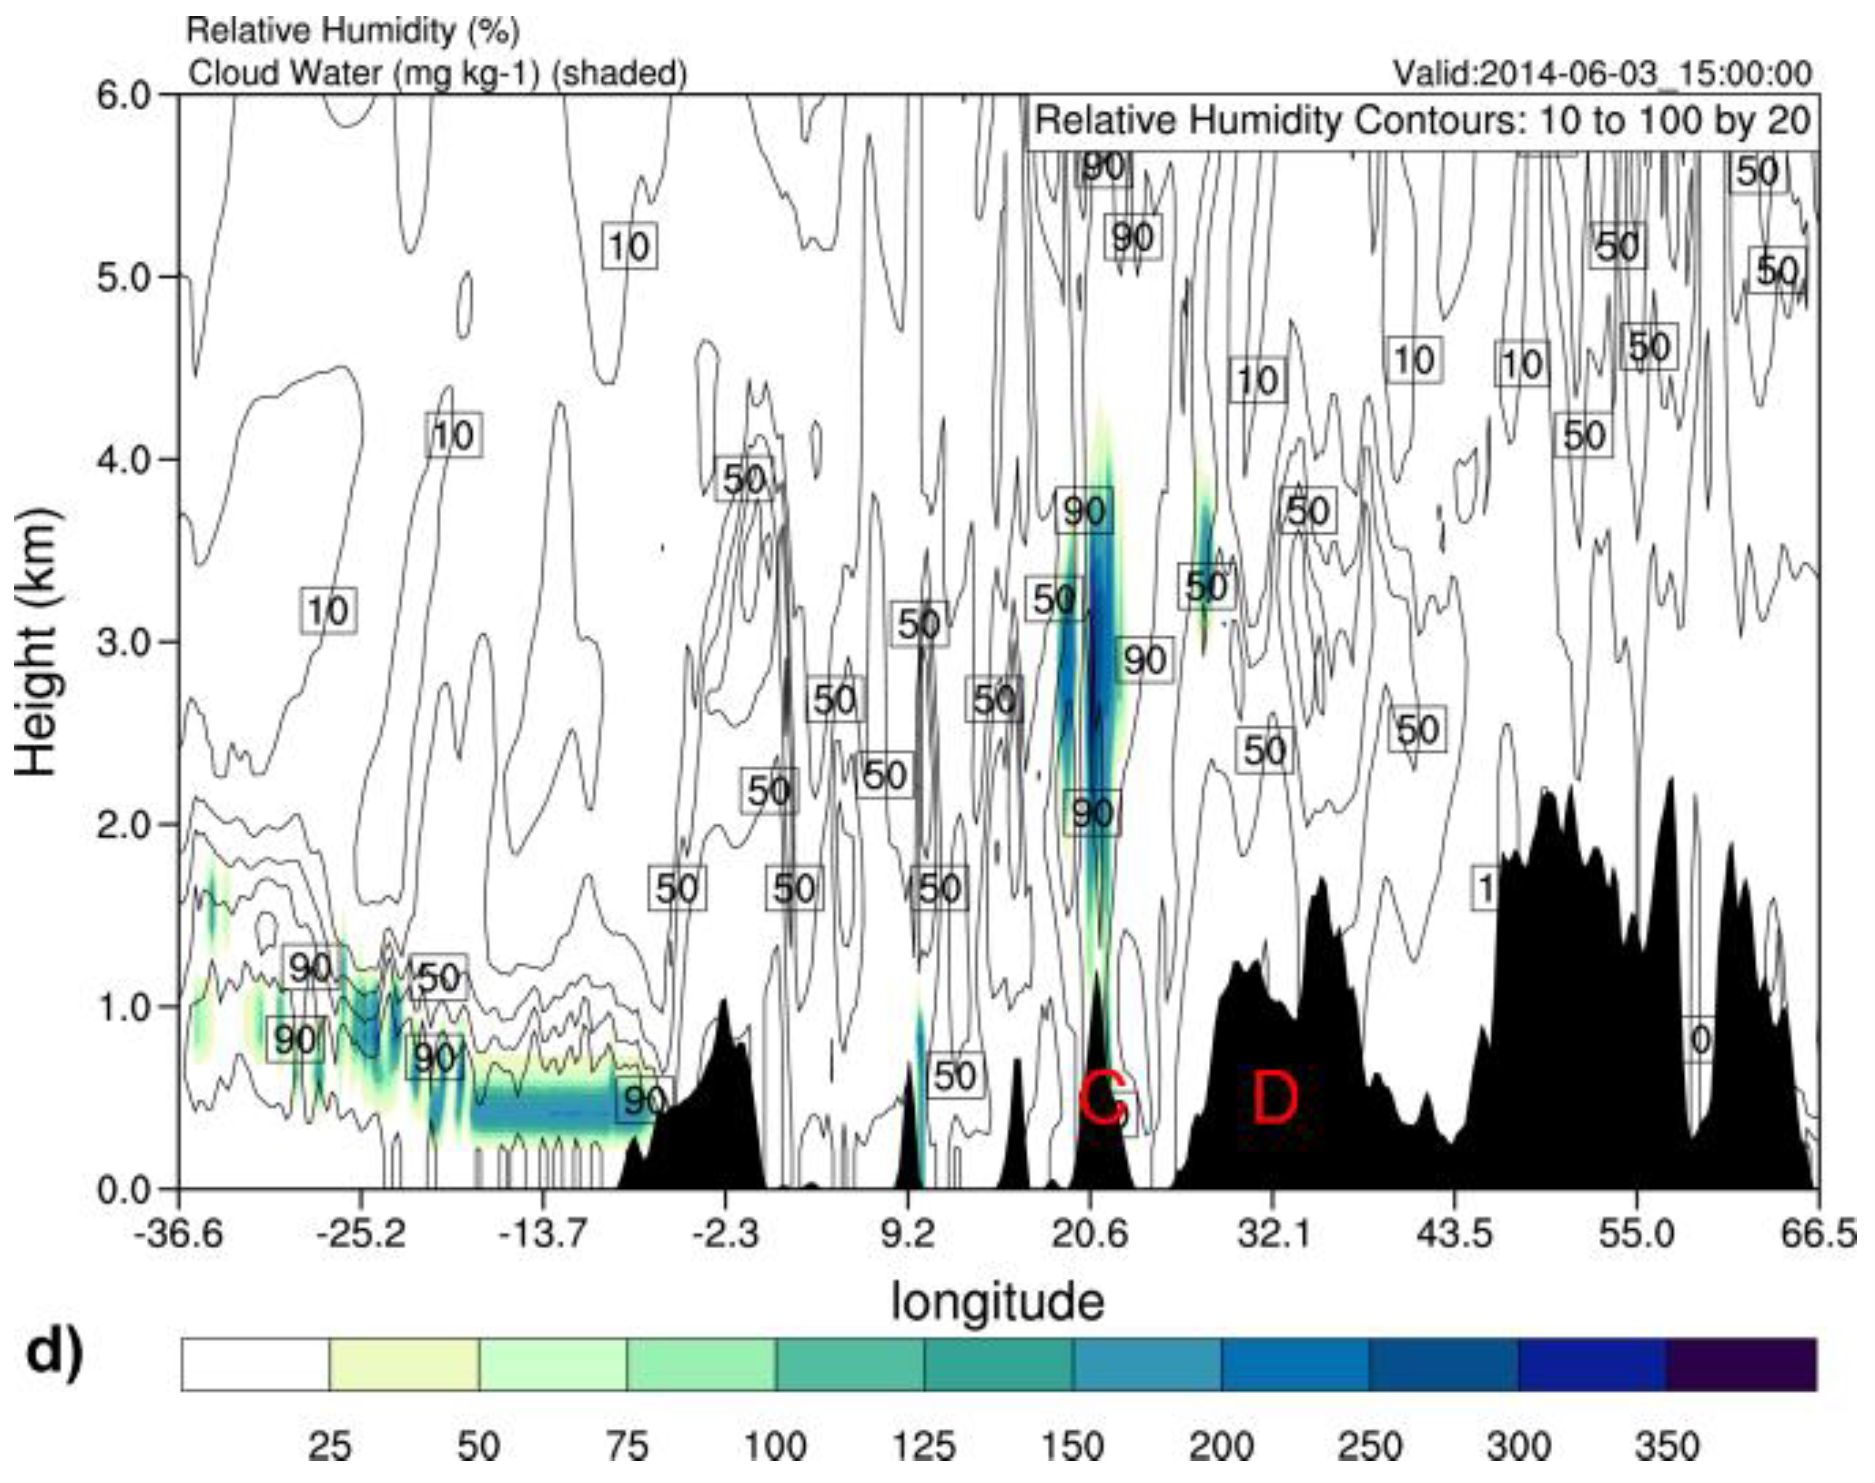
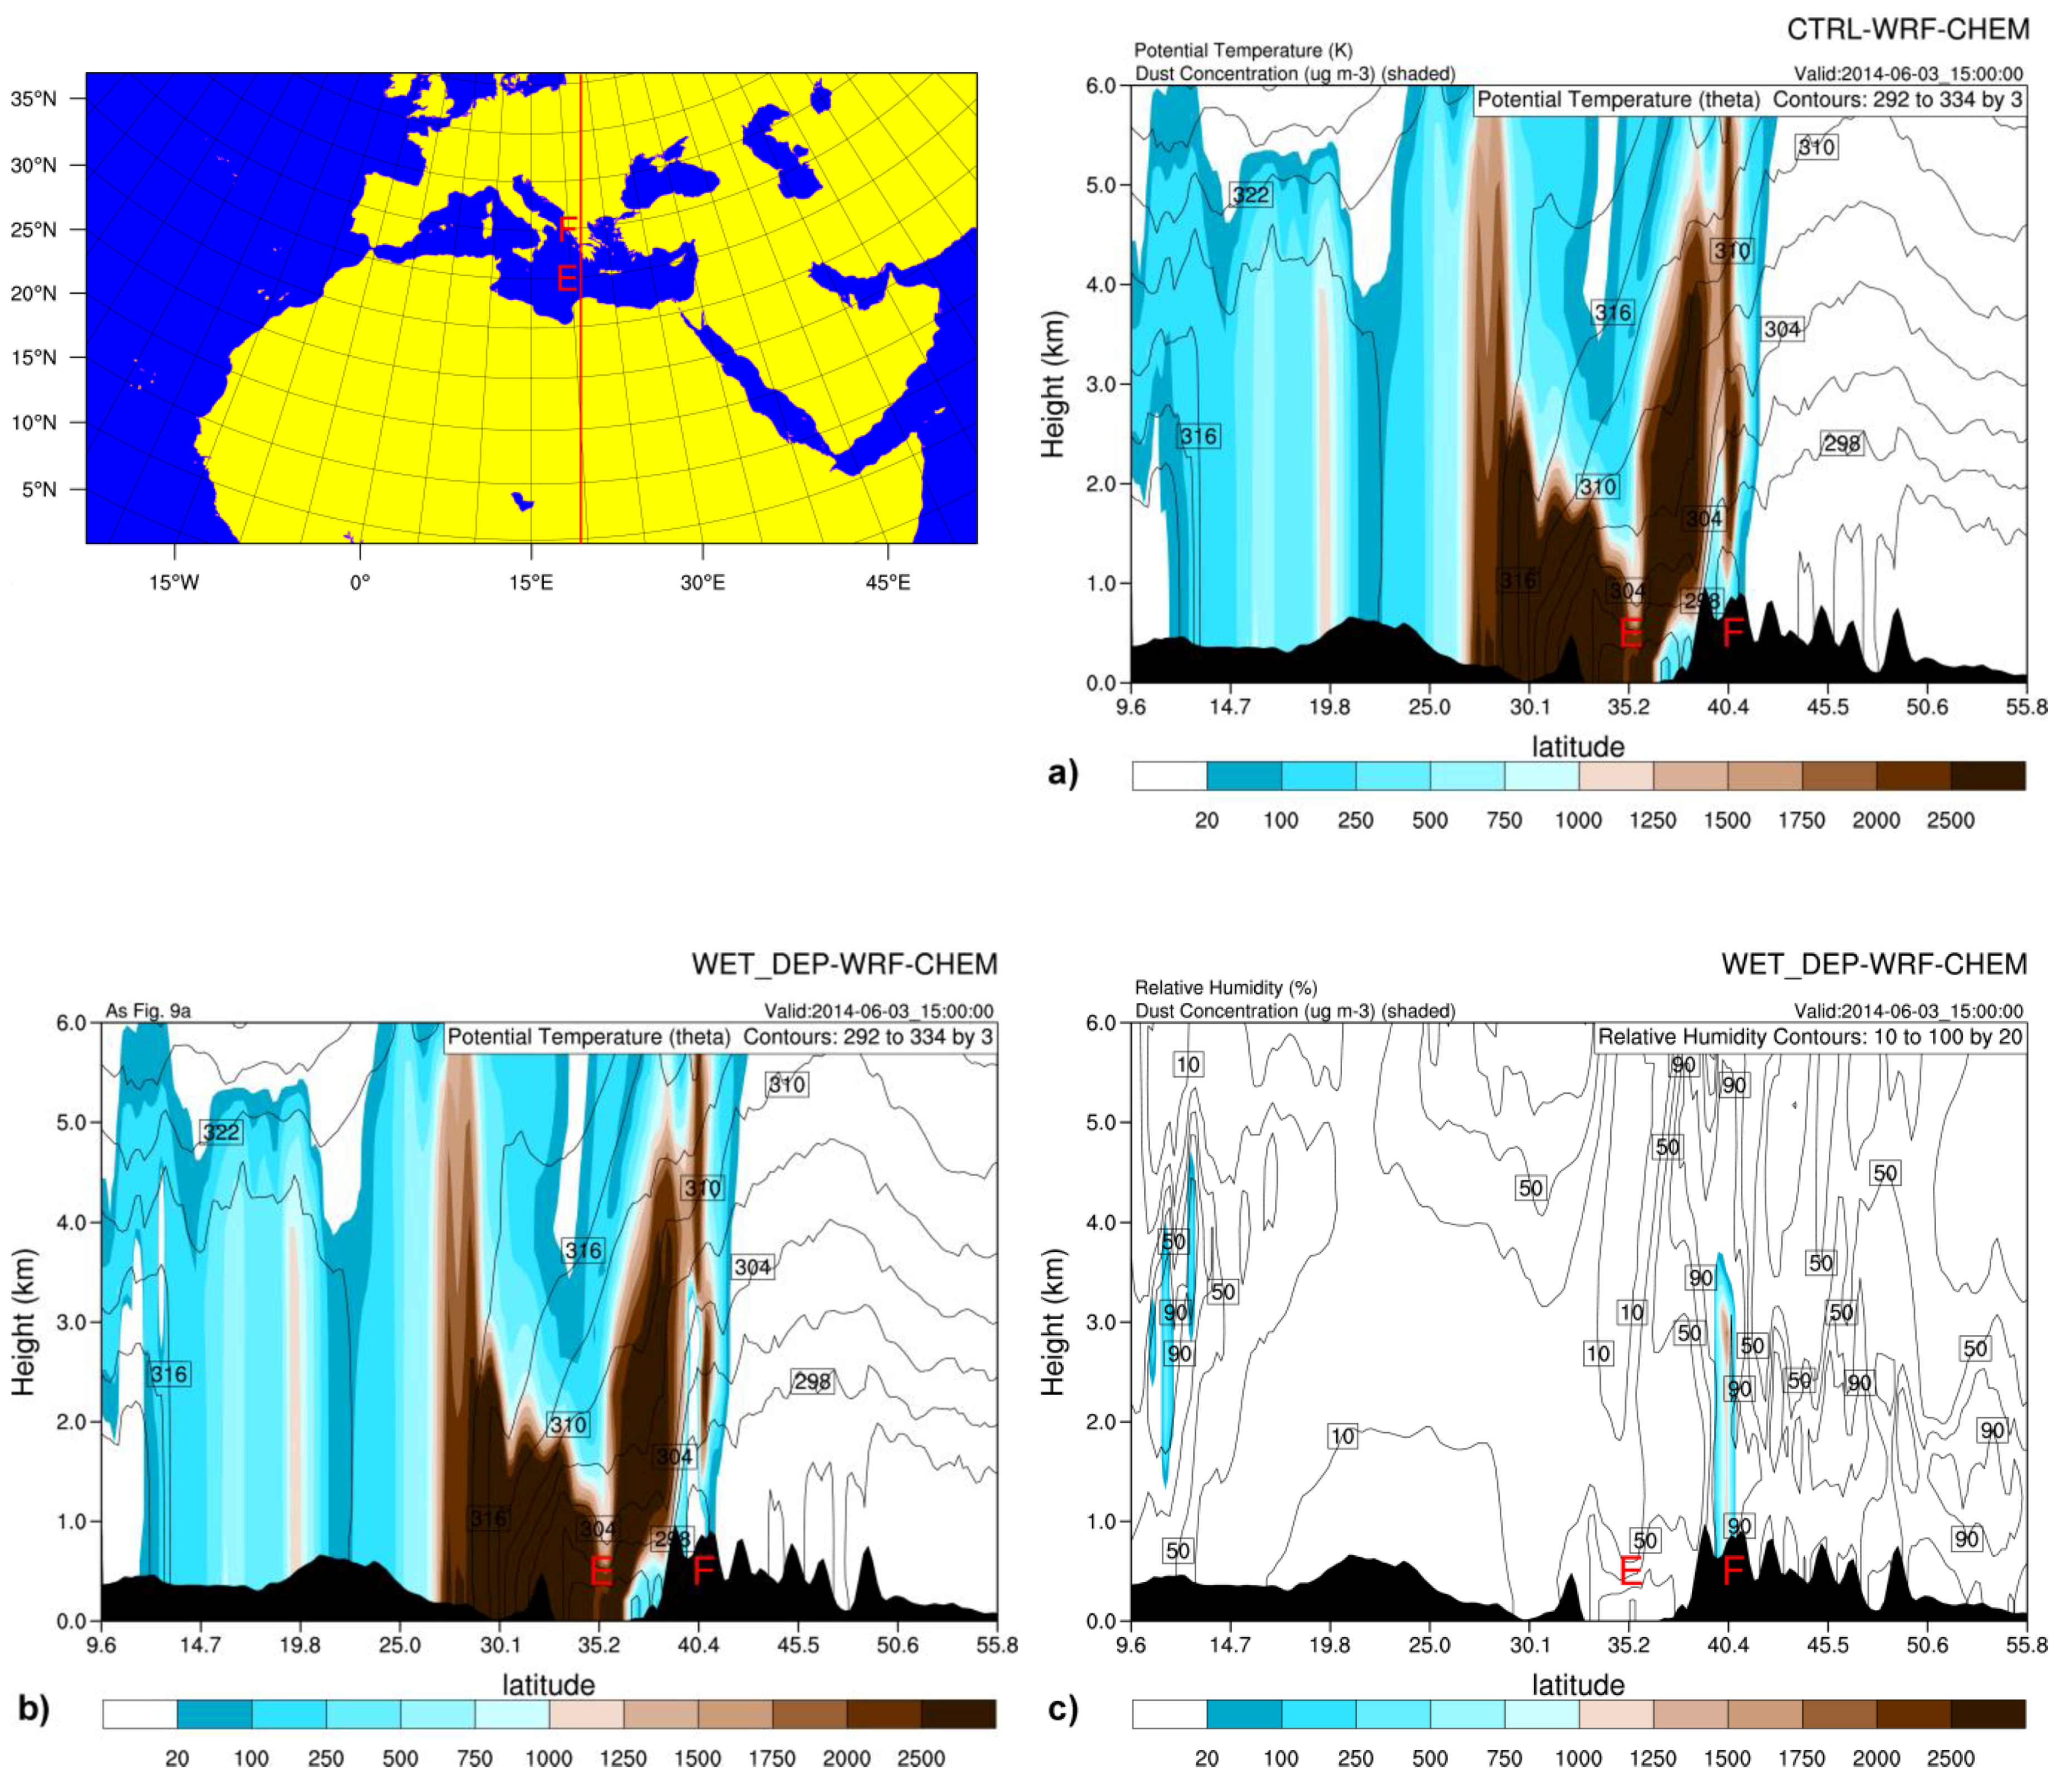
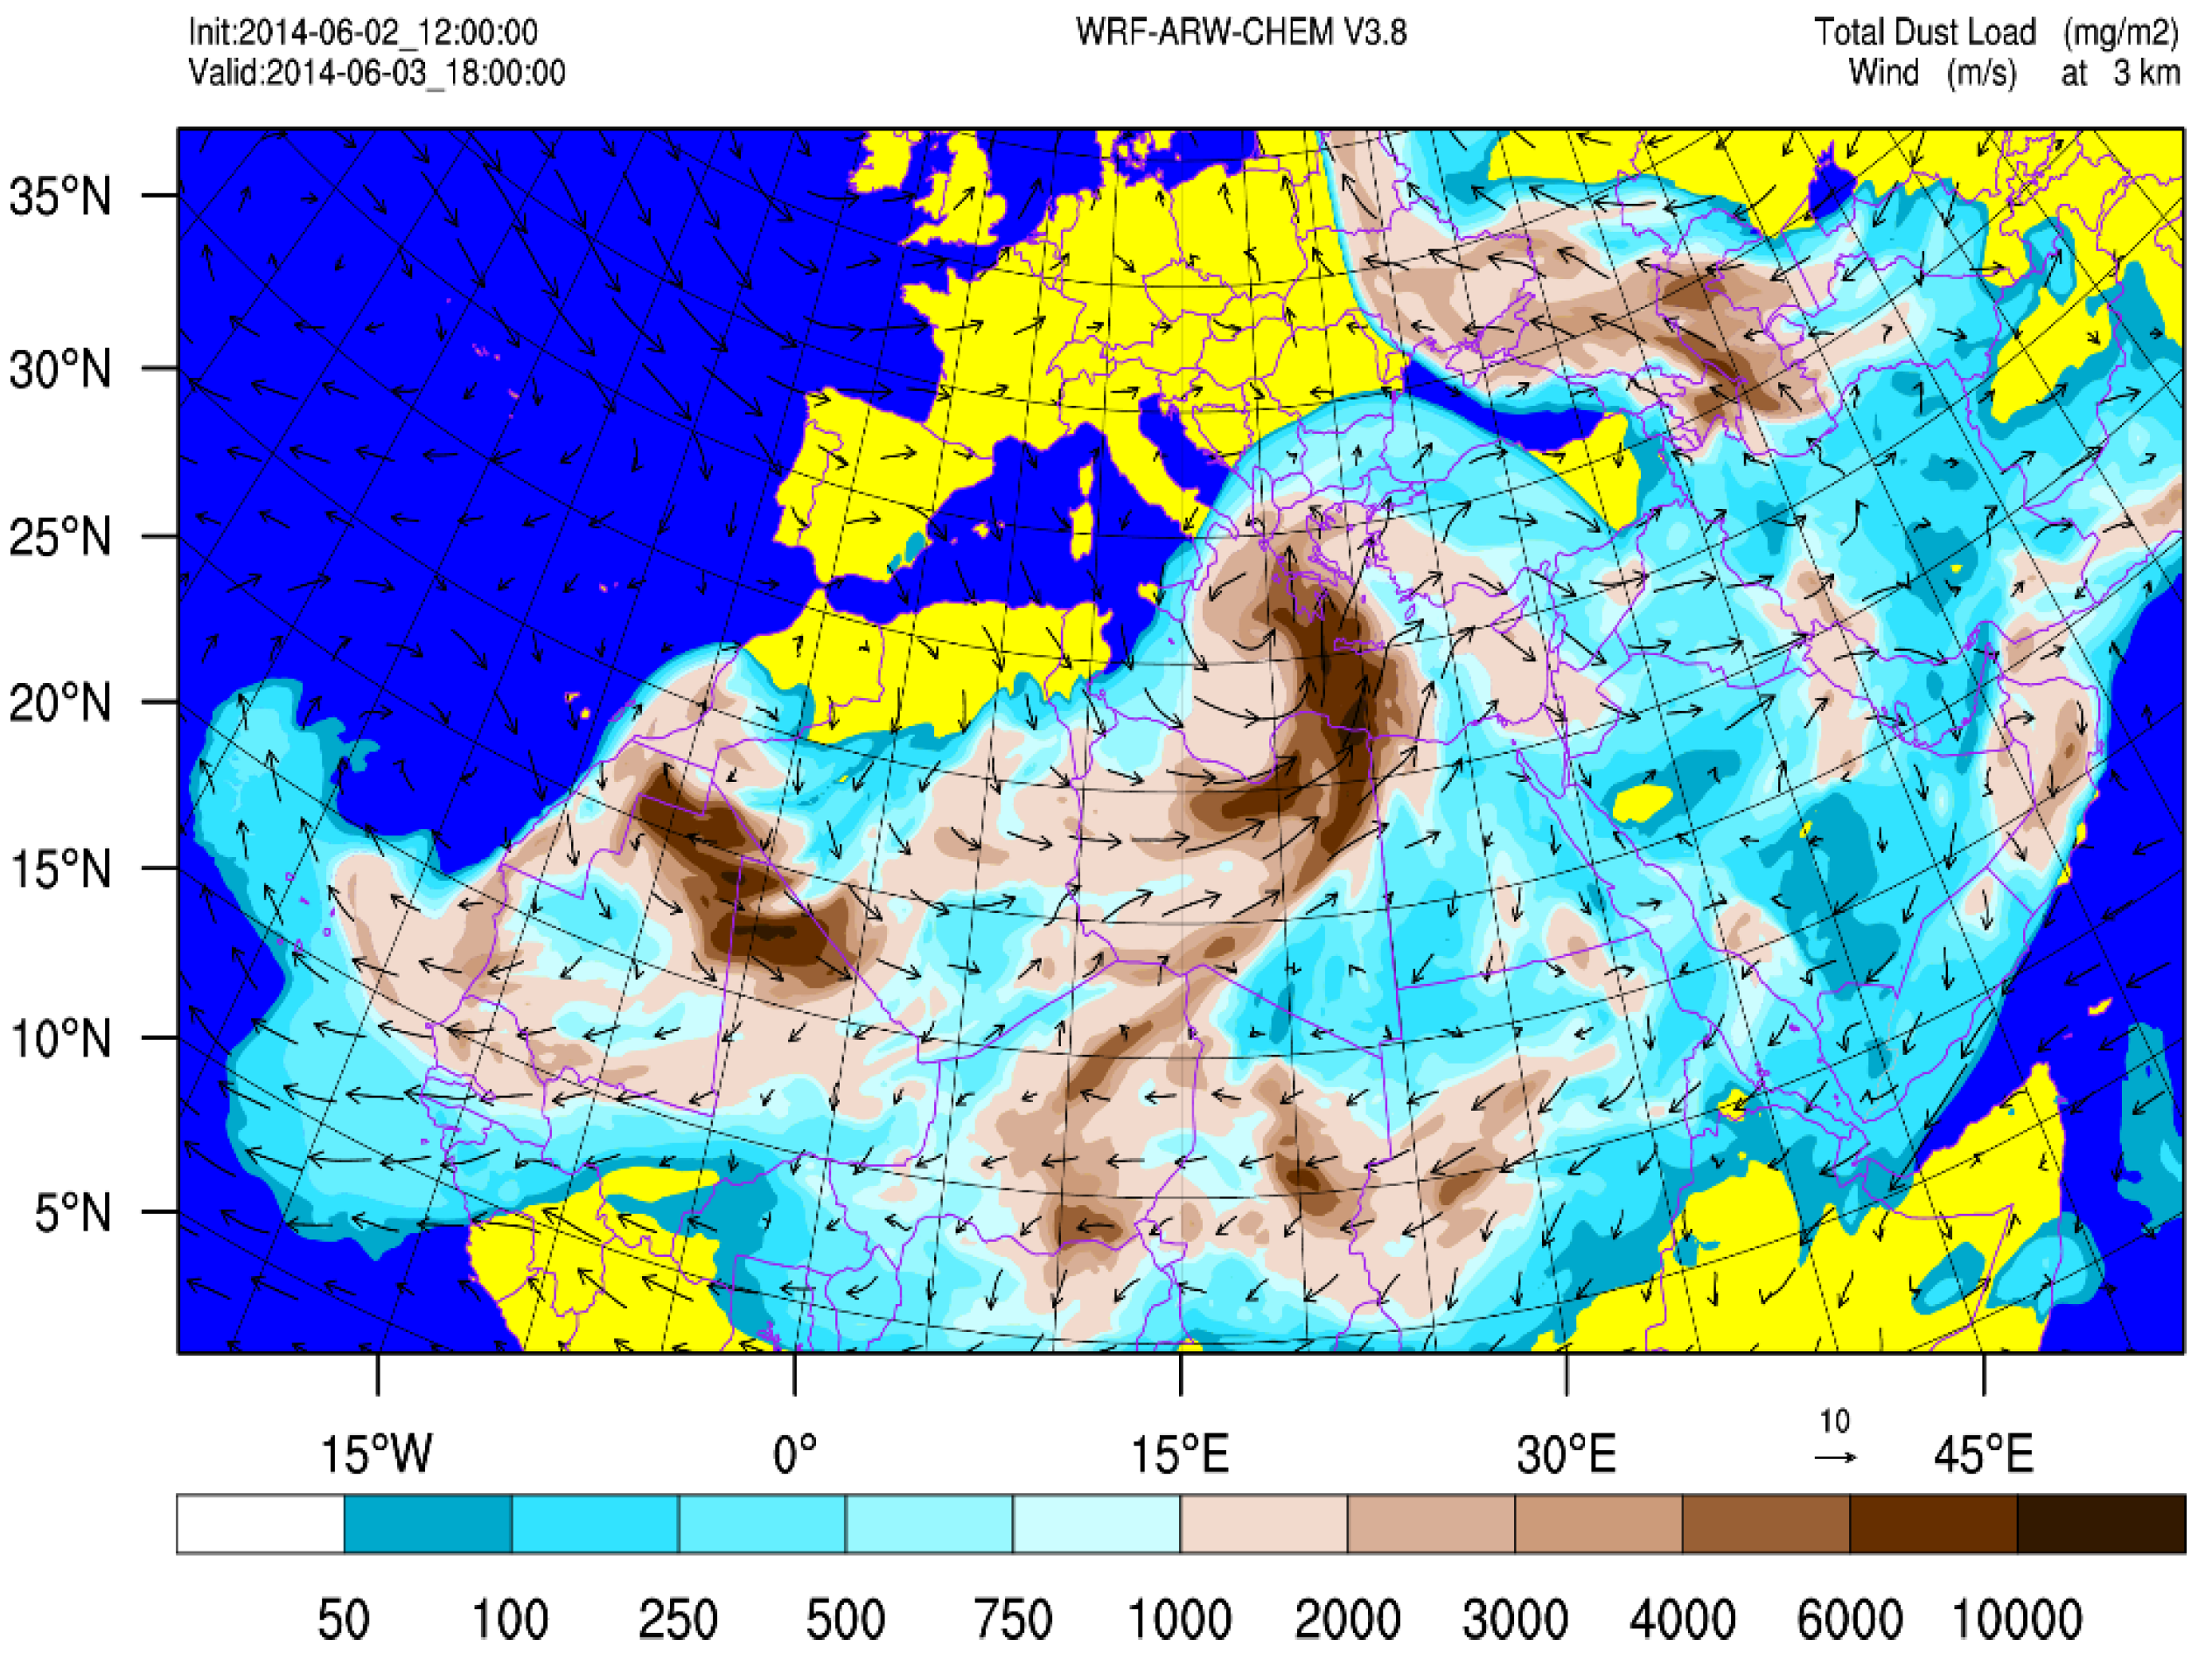
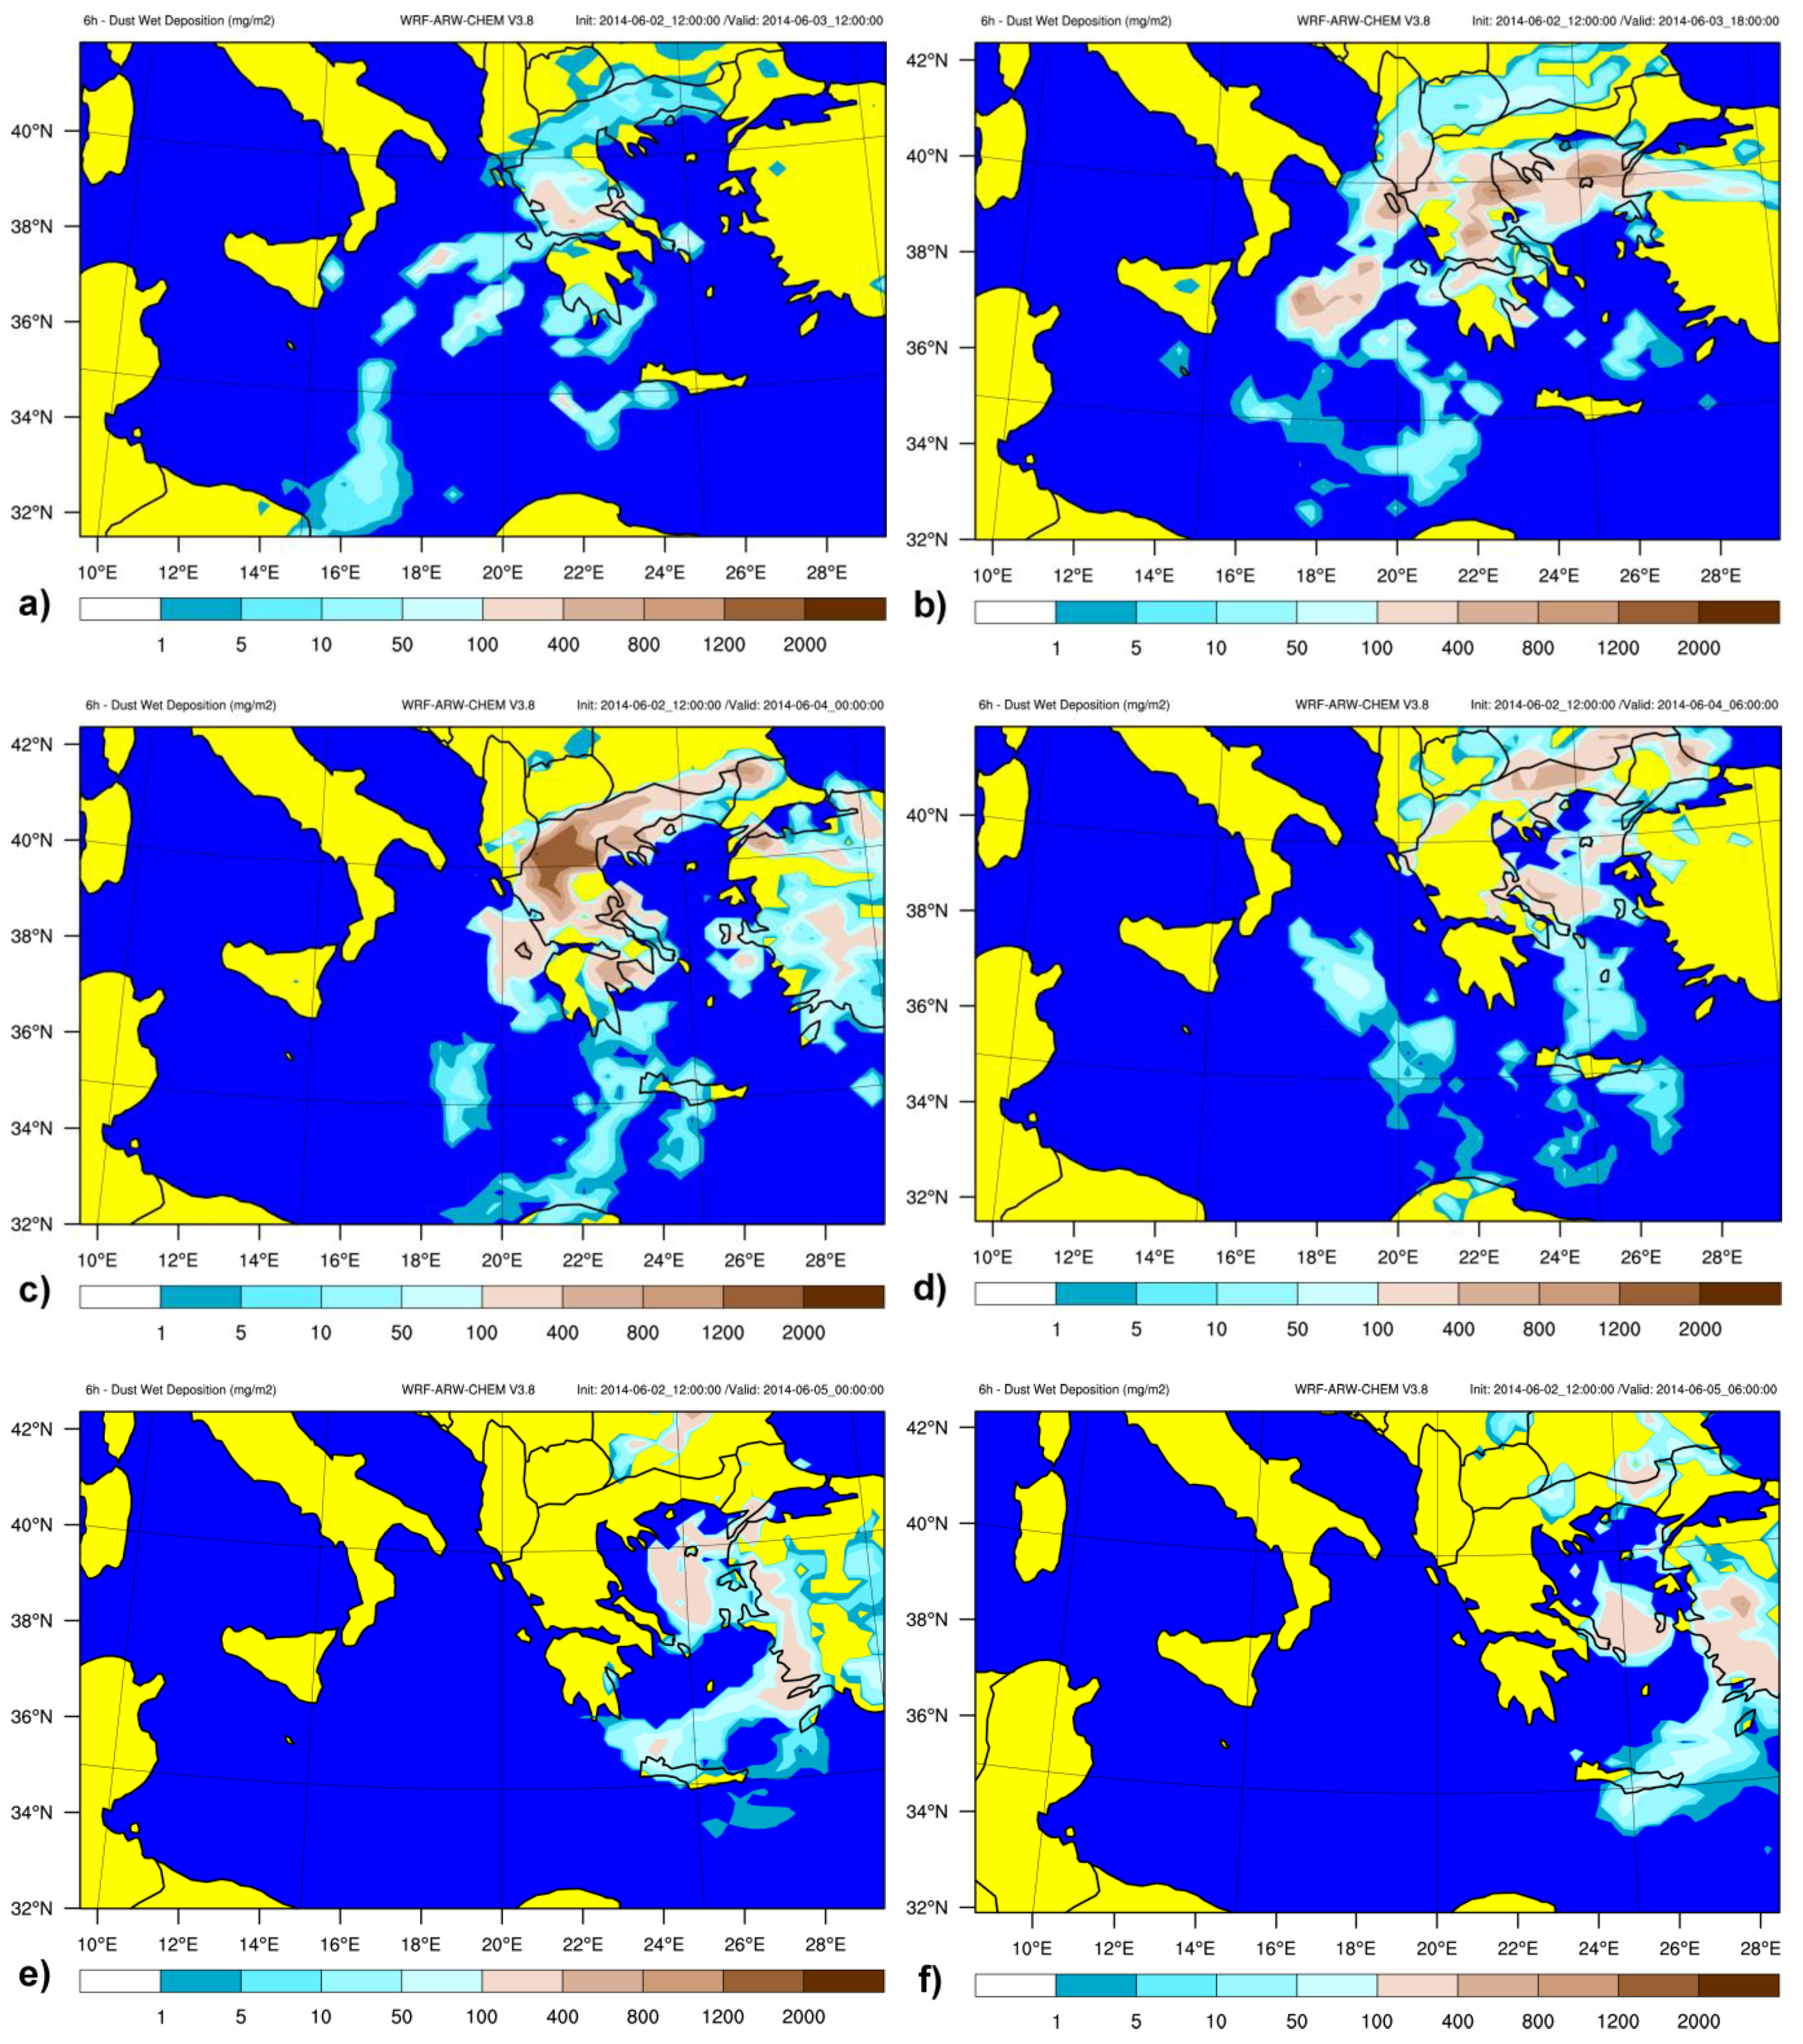
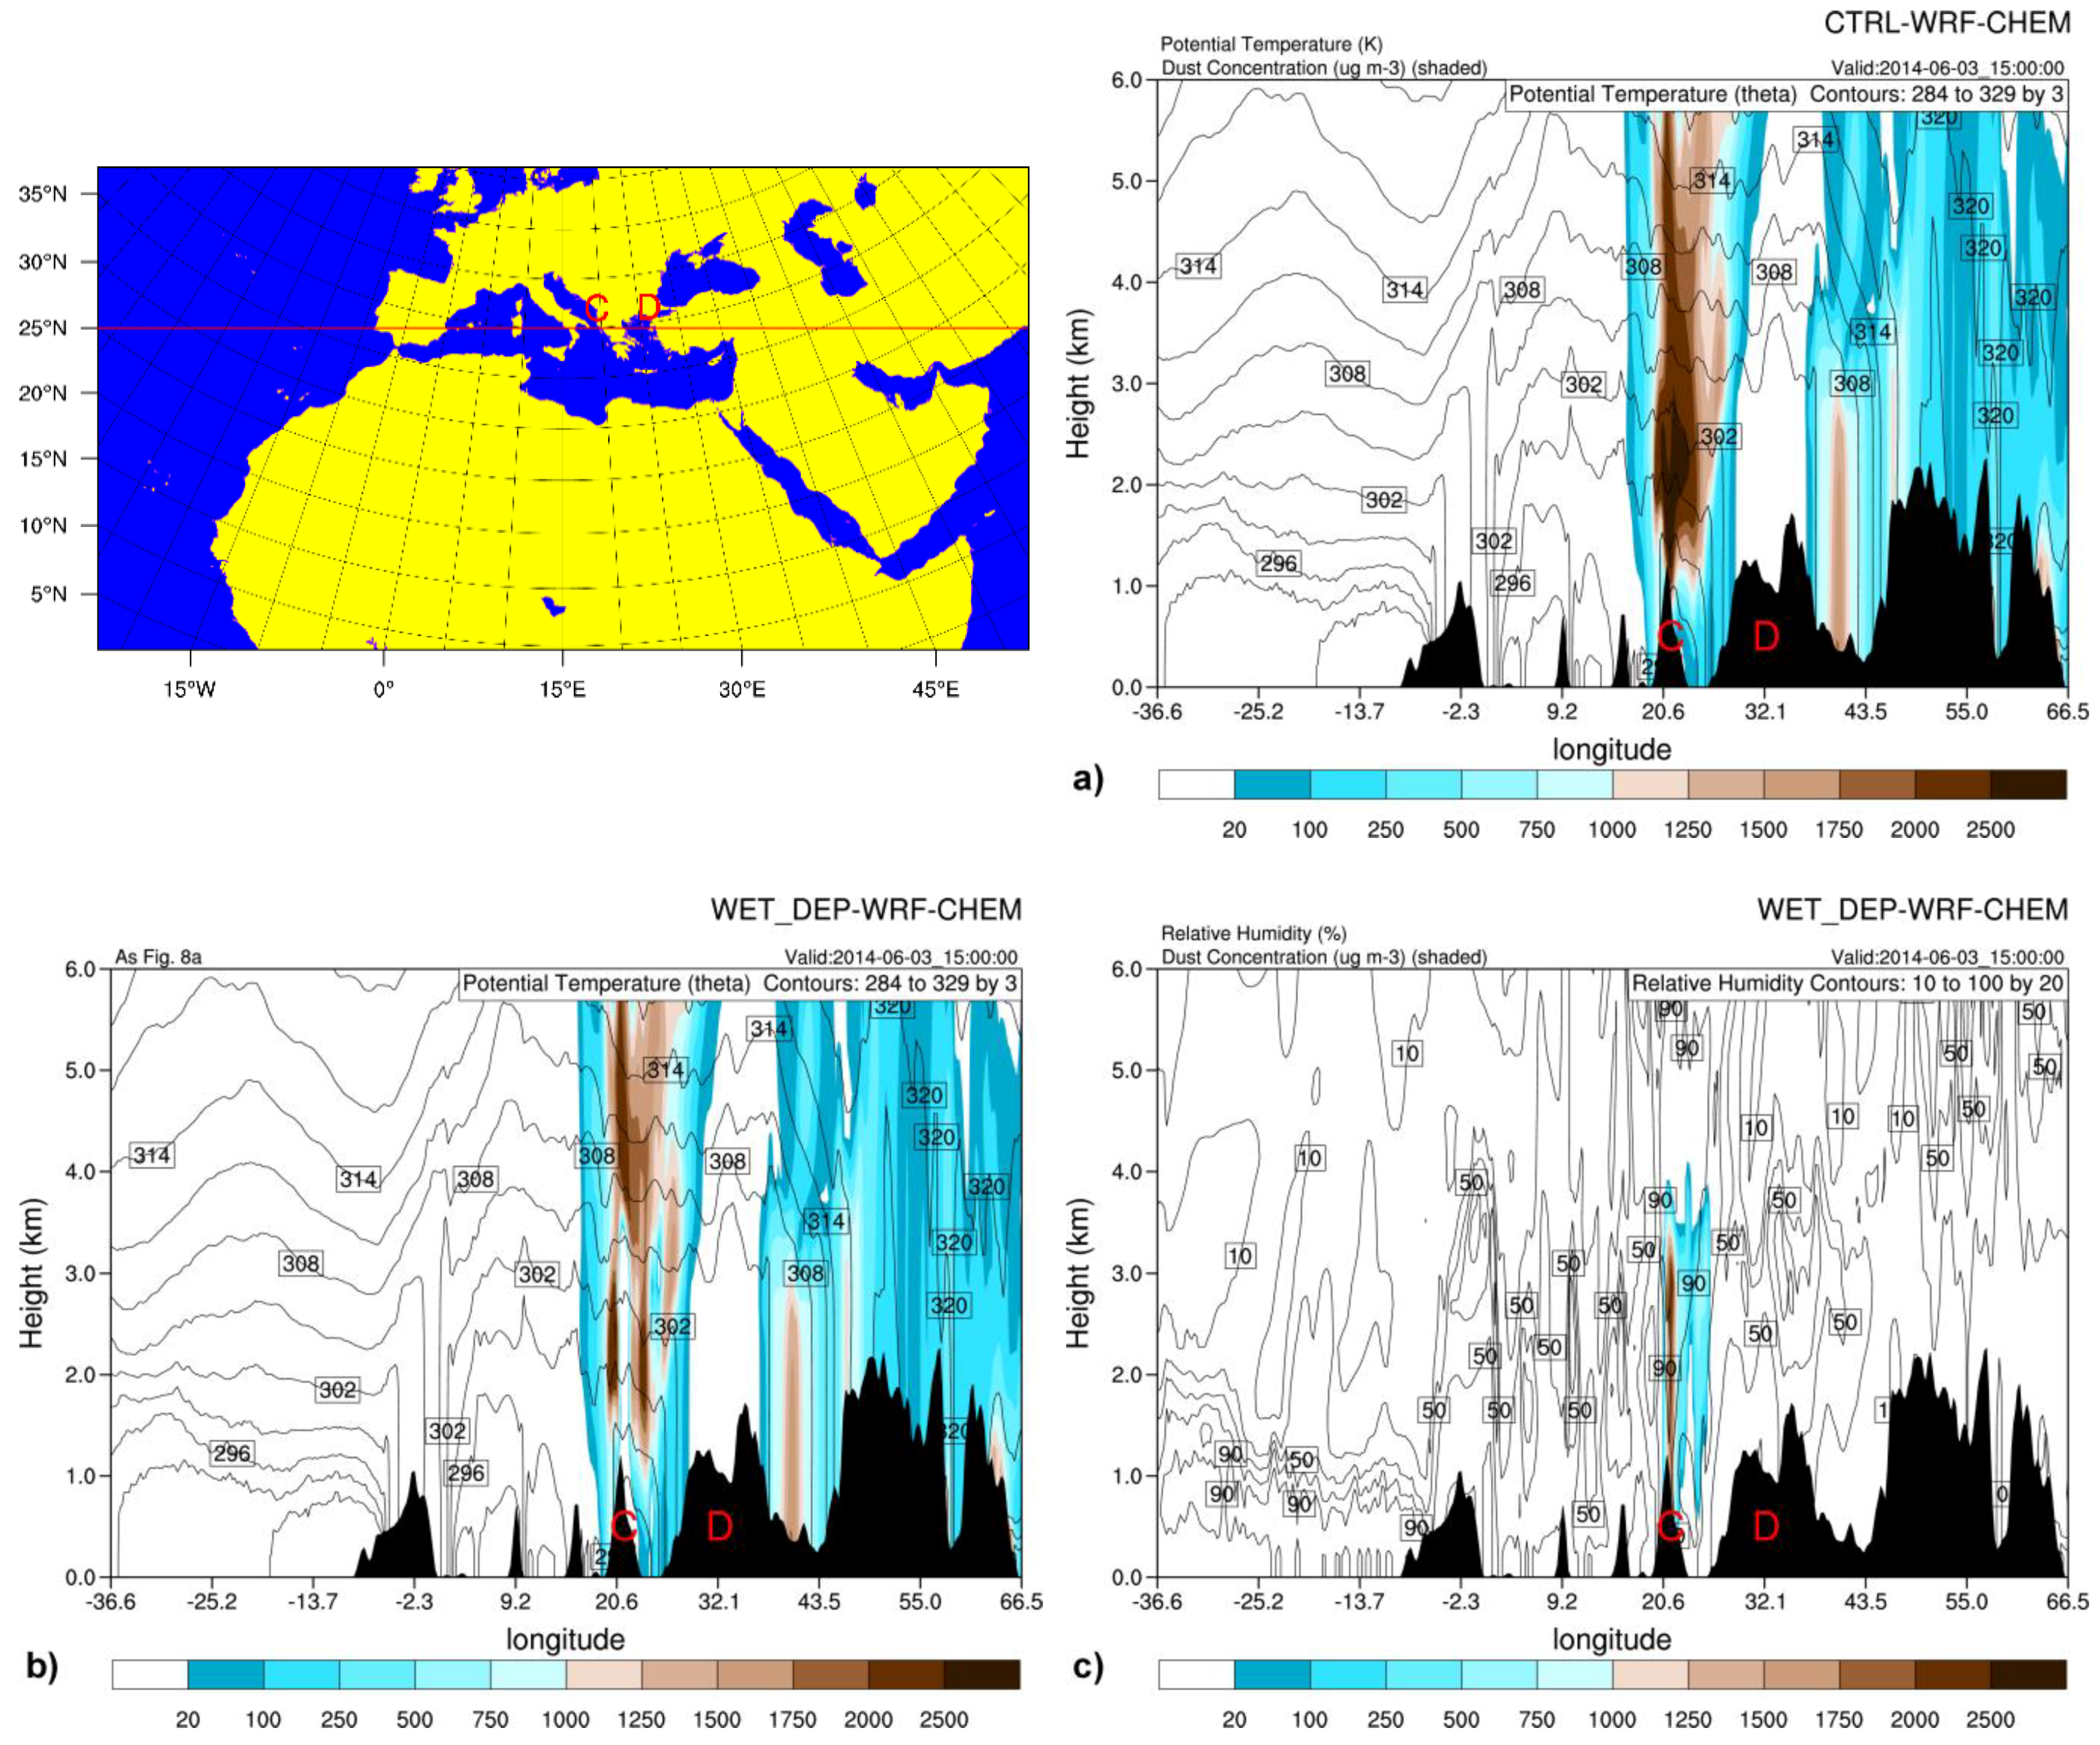
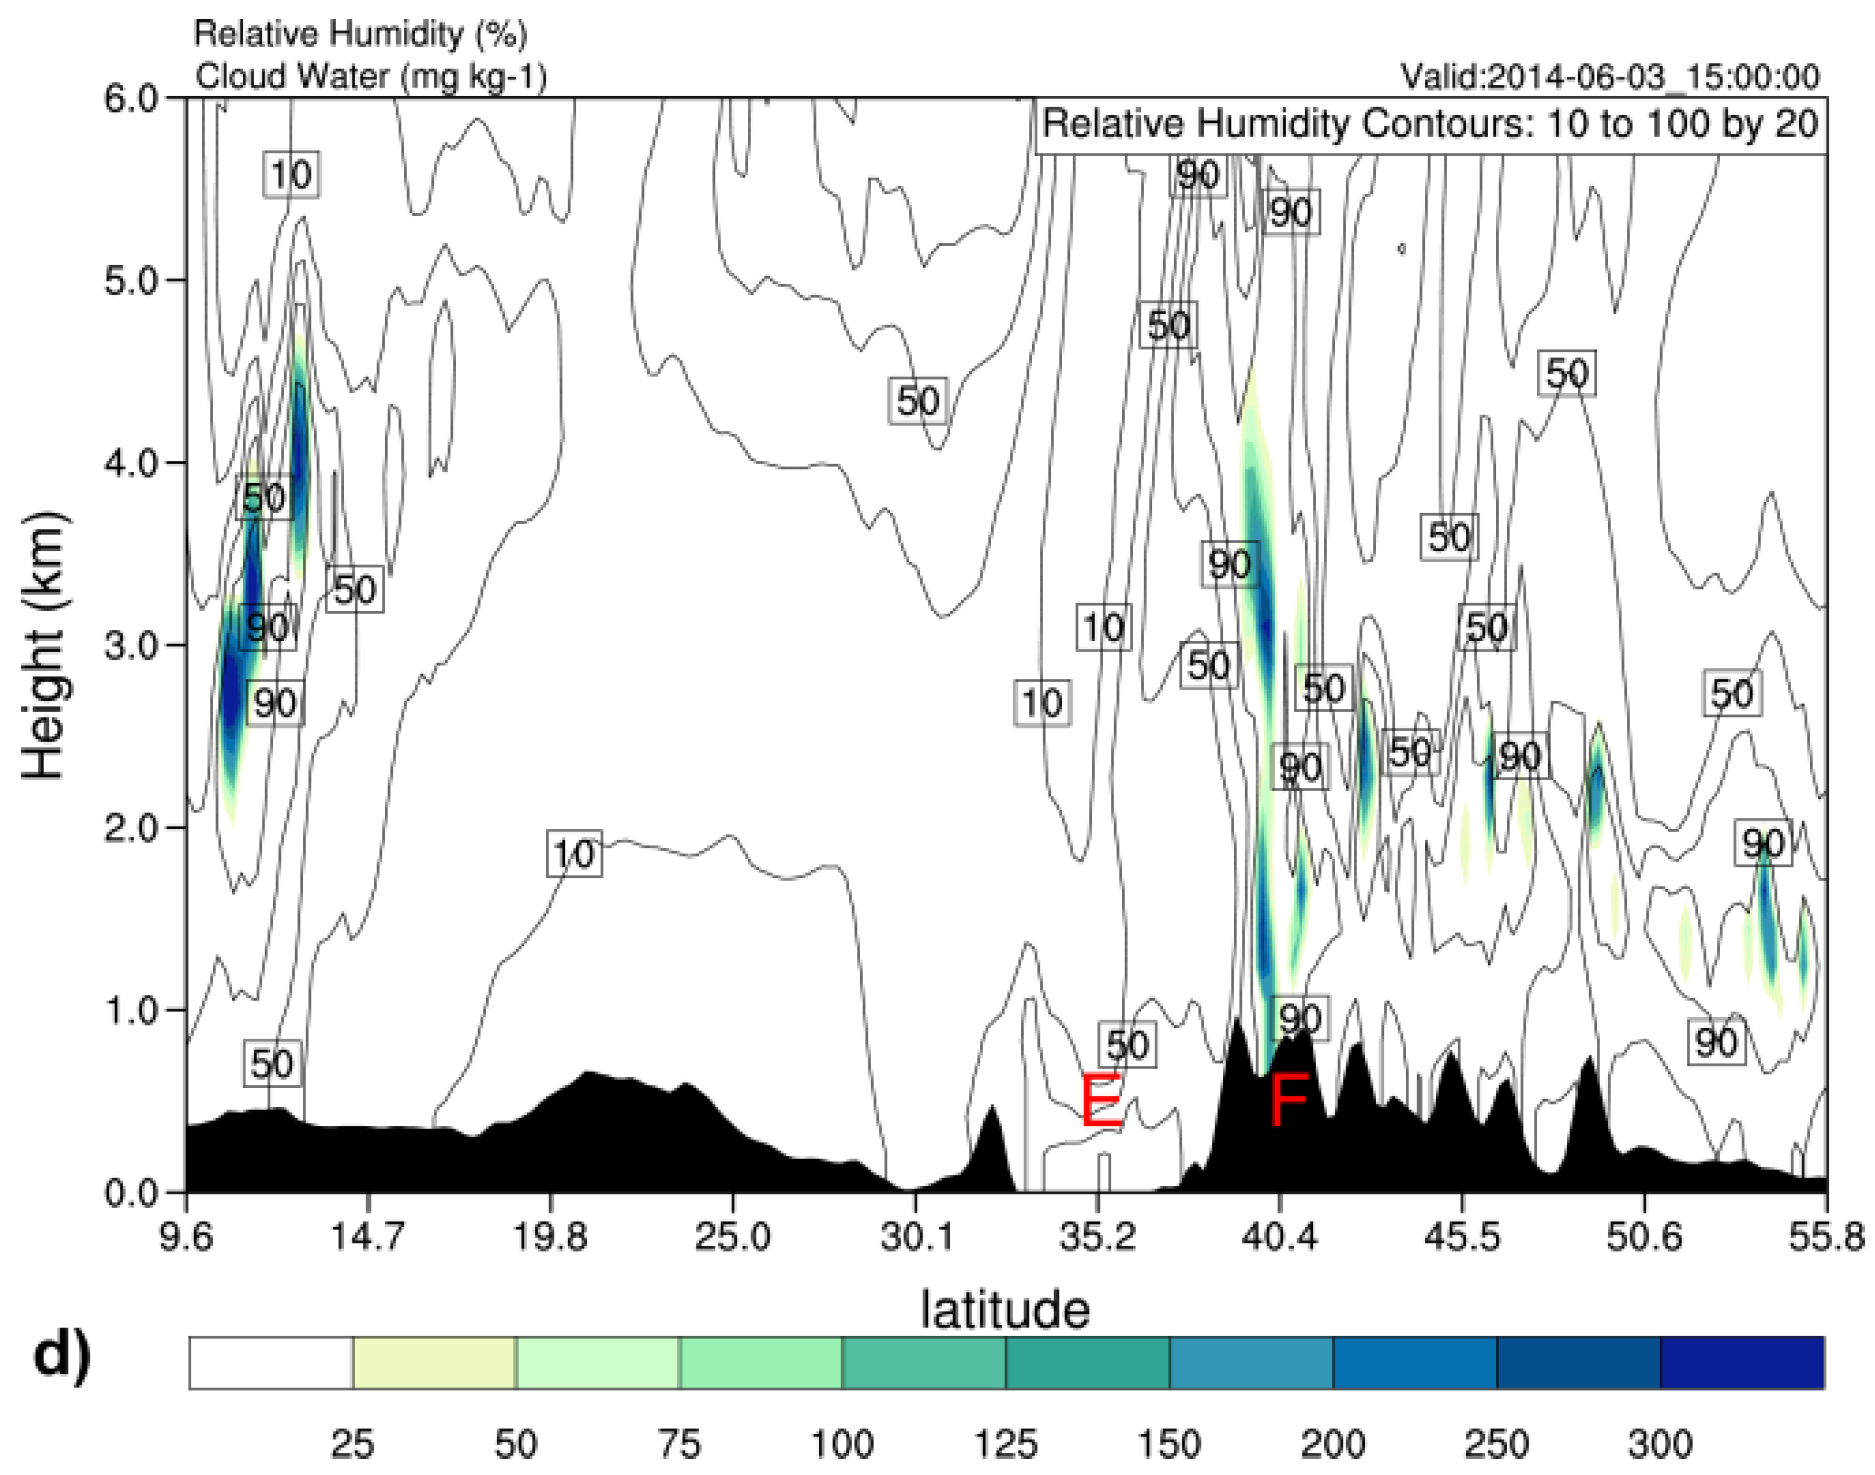
3.4. Dust Transport and Wet Deposition

The simulated dust wet deposition over central Greece was 400 mg m−2 in the period 06:00–12:00 UTC on 3 June (see Figure 7a). The values of dust wet deposition further increased in the period 12:00–18:00 UTC 3 June and 18:00 UTC 3 June–00:00 UTC June 2014, exceeding 800 mg m−2 and 1200 mg m−2, respectively (see Figure 7b,c). During those periods, dust is mainly deposited over the areas with precipitation maxima. In the period from 00:00-06:00 UTC 4 June, the simulated dust wet deposition is restricted over the northern Aegean Sea, reaching values of 400 mg m−2 due to the eastward propagation of the barometric low, which is followed by moderate precipitation over Aegean Sea (Figure 7d). In the periods 18:00 UTC 4 June–00:00 UTC 5 June 2014 and 00:00–06:00 UTC (Figure 7e,f, respectively), the precipitation is confined over the island of Crete, with the 6hr accumulated dust deposition reaching 100 mg m−2.
The impact of the ingested SP scheme on the loss of the dust mass in the atmospheric column is also assessed through vertical cross-sections of the dust concentration with latitudinal orientation C-D (20°E–30°E) [see Figure 8 top left] and meridional orientation E–F (35°N–41°N) (see Figure 9 top left]. Cross sections are valid at the dust concentration peak (15:00 UTC 3 June 2014), as is shown in Figure 8a and Figure 9a, respectively covering the area of Central and Northern Greece, where significant dust wet deposition occurred. In Figure 8b, CTRL simulation estimates a maximum of concentration that exceeds the 2000 μg m−3 around the height of 2 km over the area of central and northern Greece (C–D points). The downward slope of the isotheta contours confirms the existence of the warm front, as has been shown in Figure 4a, which is the major synoptic feature responsible for the advection of warm air and the enhanced ascent motions in the area. During this time, the torrential rain over the Central and Northern Greek Peninsula coincided with the main core of the dust plume extending (C–D area) up to 6 km height. The simulation with the SP scheme enabled (Wet_Dep) represents significant losses of the suspended dust mass (Figure 8c,d). Local maxima of the dust loss reach approximately 1400 μg m−3 at heights greater than 3.5 km. More specifically, the maximum reduction in dust concentration occurs in the layer between 3.0 and 3.5 km, coinciding with the local maxima of relative humidity. This indicates that an important percentage of the dust wet removal occurred in-cloud, where the finer particles play a leading role in the wet scavenging processes. In Figure 9, the meridional structure of the dust plume extends in the area of 27°–40°N. CTRL simulation in Figure 9a exhibits a maximum concentration of 2000 μg m−3, with the suspended particles extending up to 6 km (Figure 9a). In Figure 9b,c, which concern the Wet_Dep simulation, an almost 100% dust loss of approximately 1250 μg m−3 over the mountainous areas of Northern Greece (40°N above point F) at the height of about 3.5 km was observed. At this level, the high values of relative humidity (i.e., 90%) indicate that the greatest part of the wet scavenging process occurred in-cloud (Figure 9d). In Figure 8e and Figure 9e, the cross sections of cloud water and the relative humidity confirm the existence of clouds in most areas of high relative humidity, which are also characterized by significant wet scavenging.

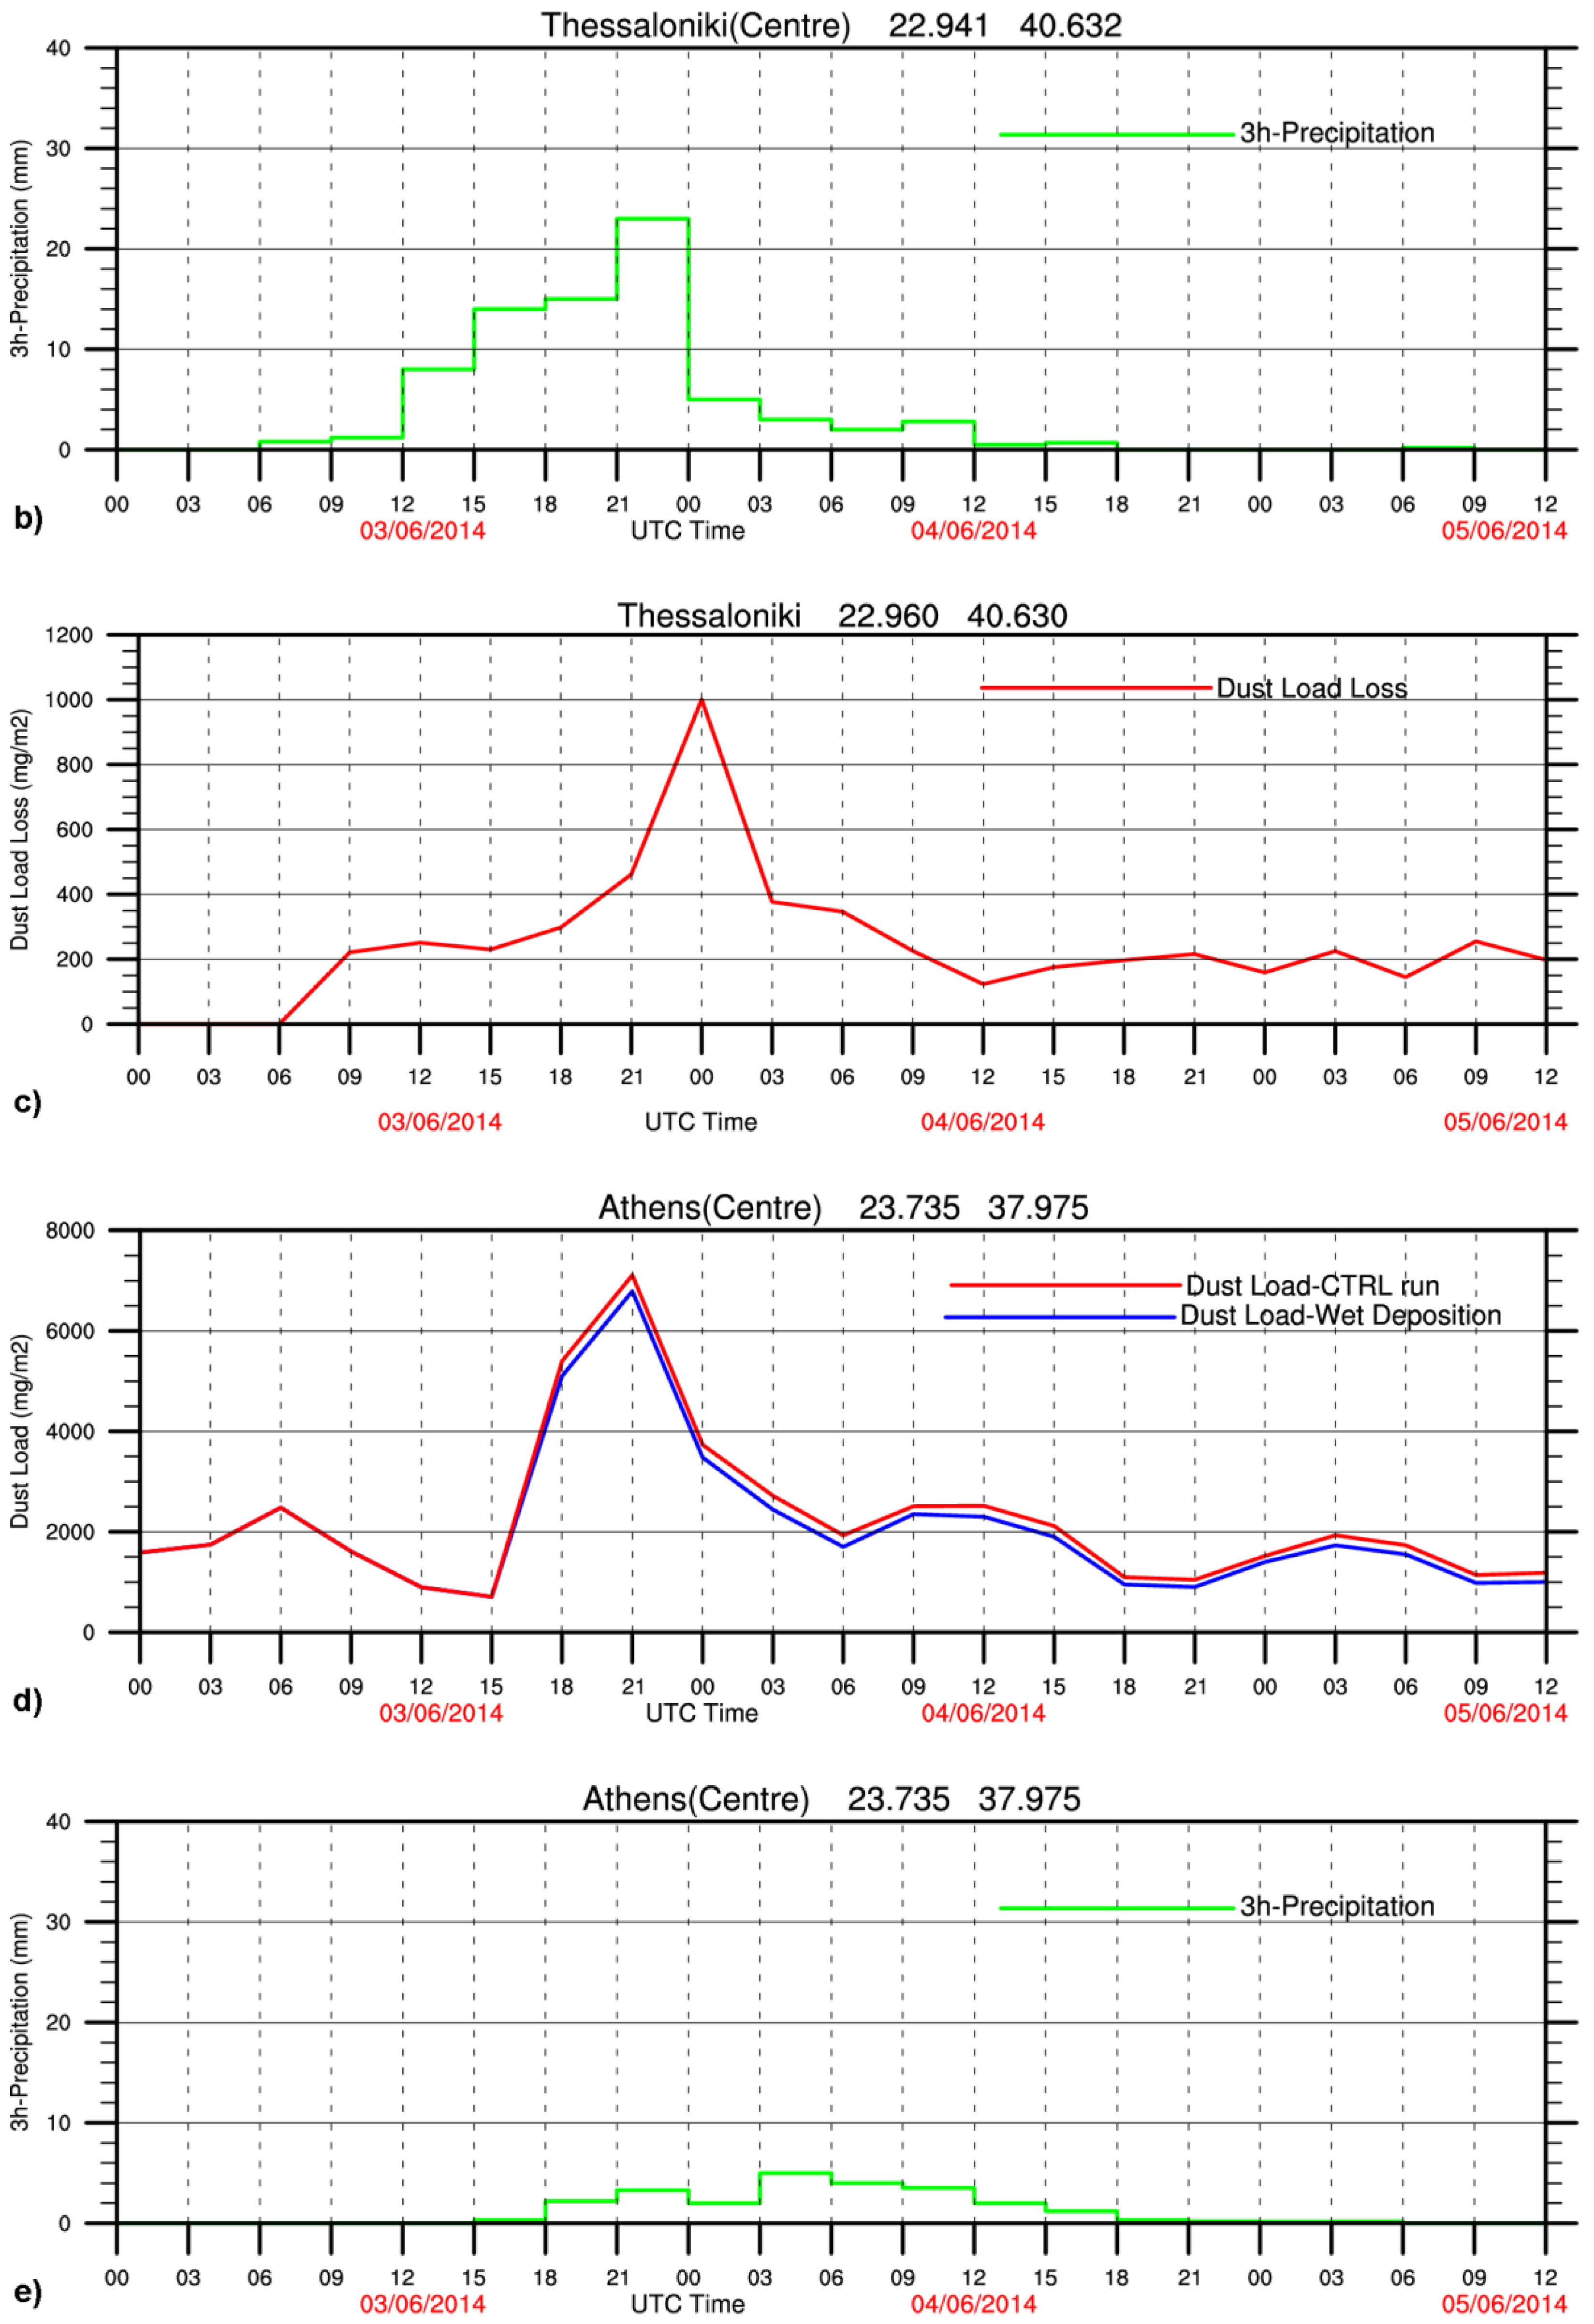
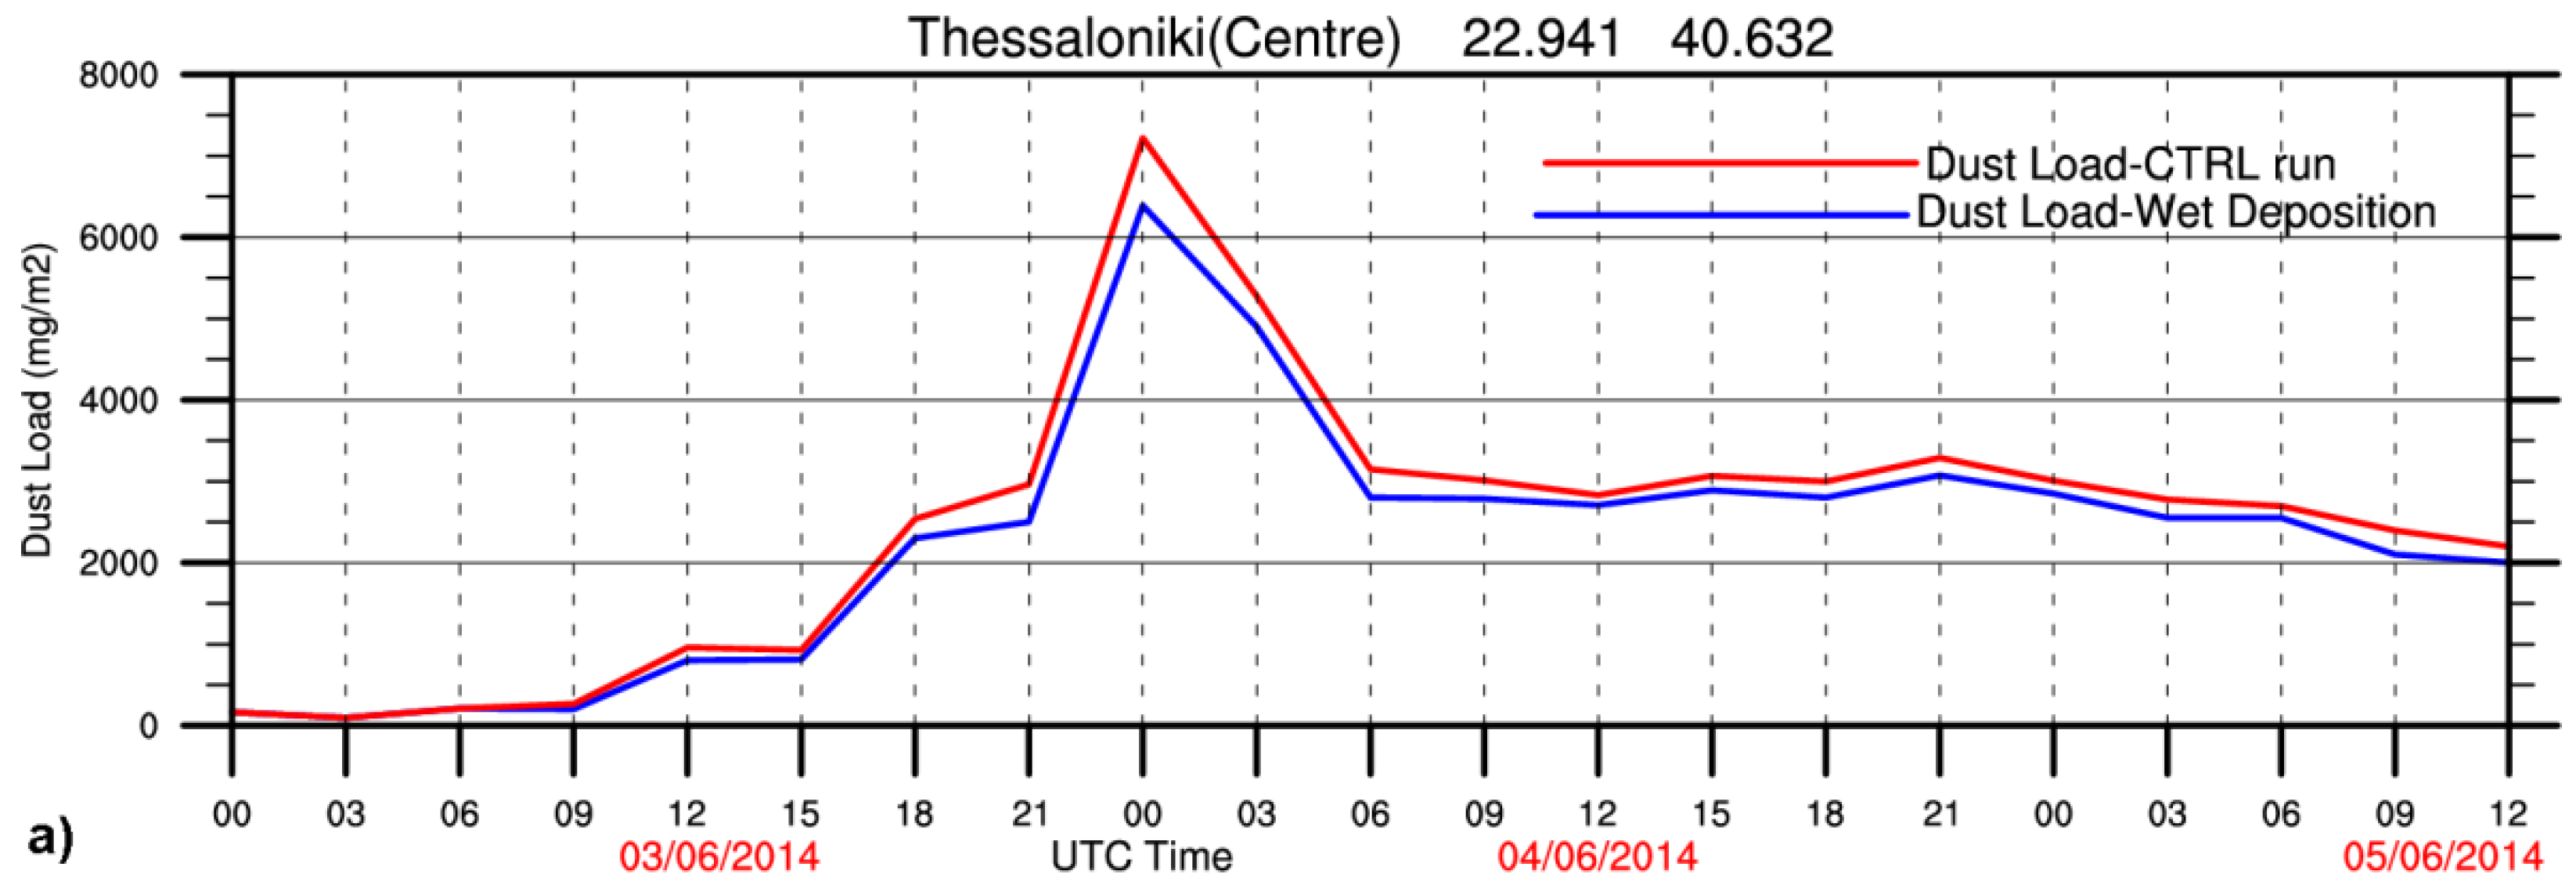
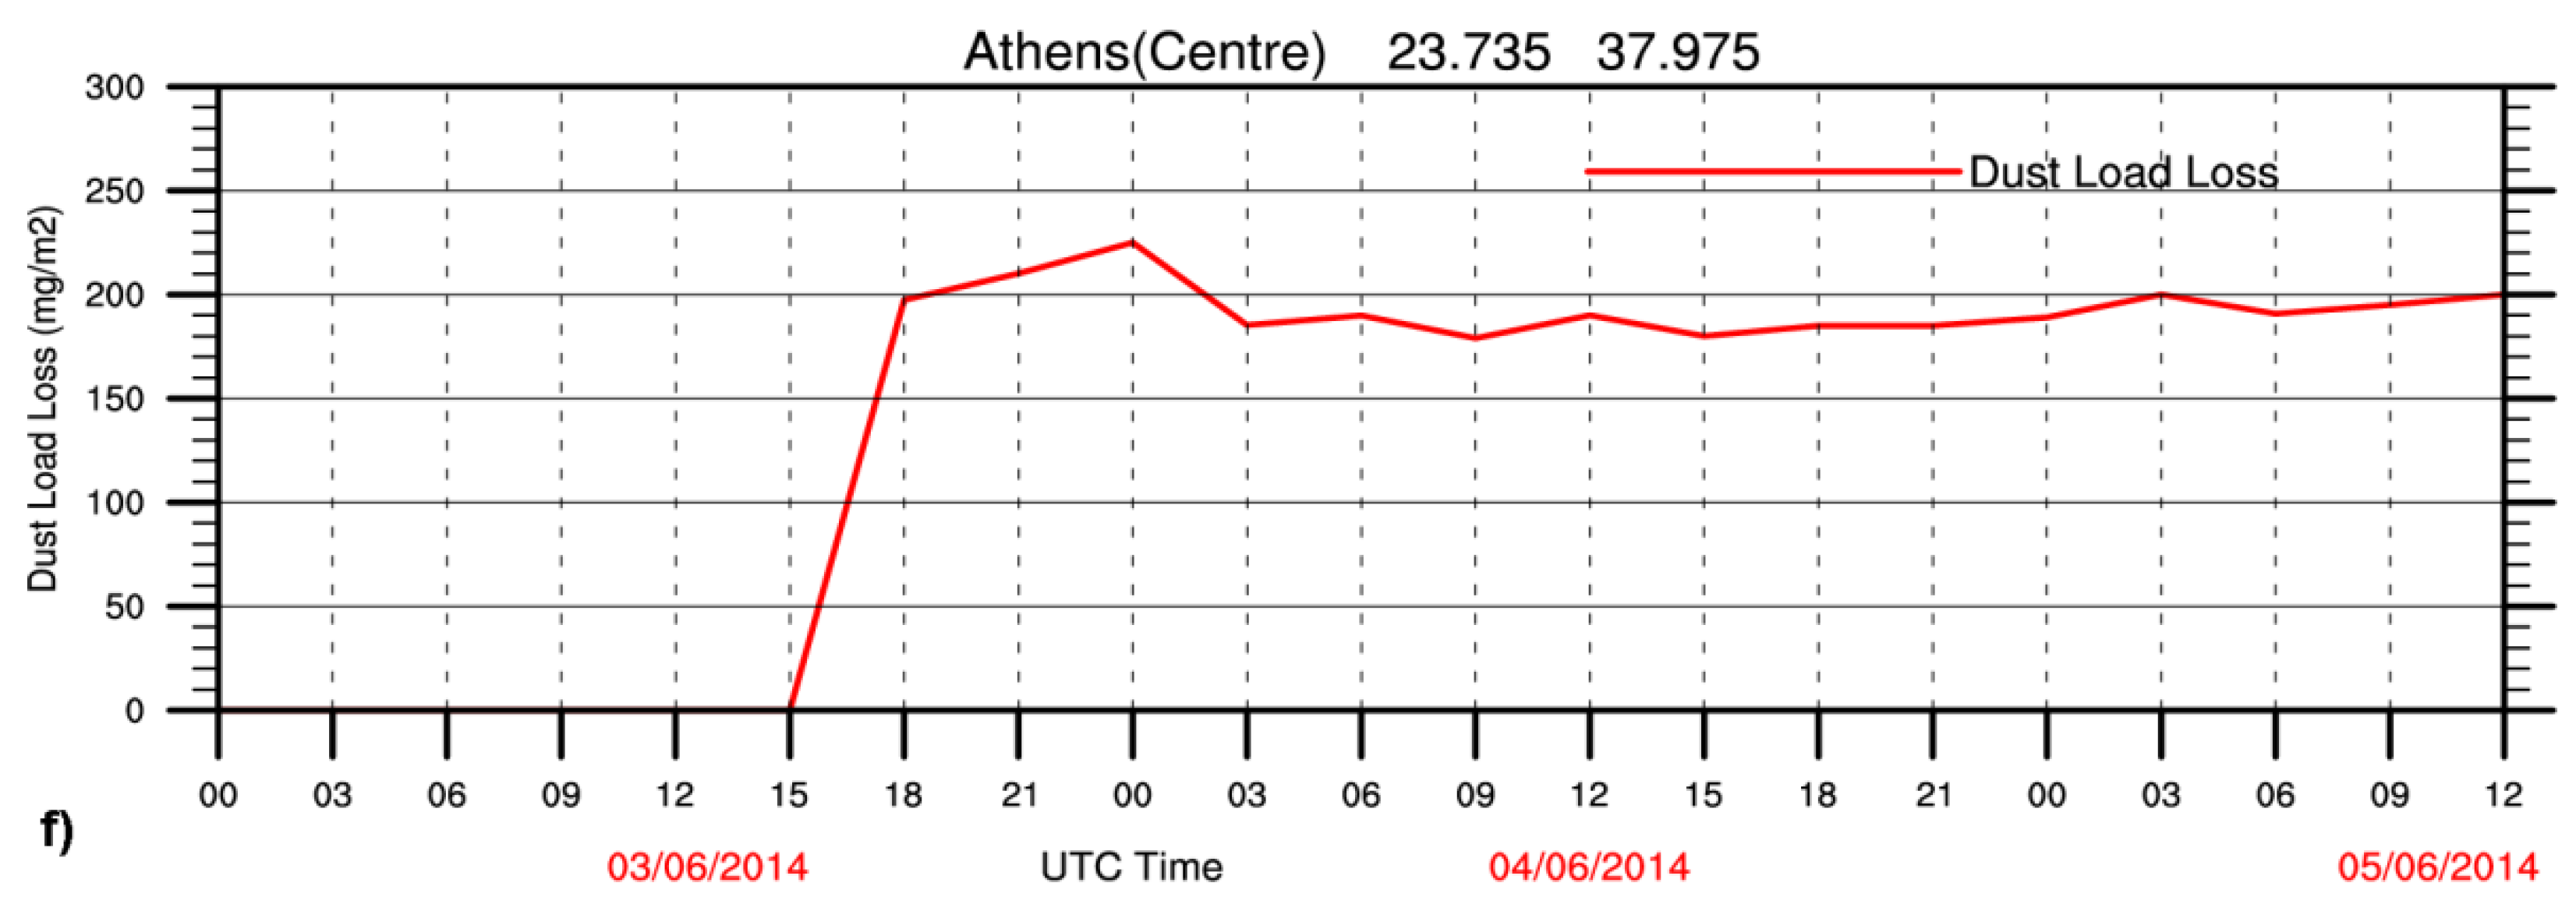
3.5. Dust Load Timeseries

The consistency of the SP scheme is evaluated through the dust load timeseries of CTRL and WET_DEP simulations, which are modeled over the cities Thessaloniki (22.960°E–40.630°N) and Athens (23.735°E–37.975°N), and shown in Figure 10a,d, respectively. In particular, the estimated dust load at Thessaloniki is identical for both simulations up to 09:00 UTC 3 June. At this time, the initiation of the precipitation coincides with the beginning of the dust particles wet removal (Figure 10a,c). The removal rate remained almost constant with 250 mg m−2 per 3 h in average until 18:00 UTC 3 June. At 00:00 UTC 4 June, as the precipitation strengthens up to its peak with approximately 25 mm, the dust loss also increases with a maximum value of 1000 mg m−2, showing also the contribution of the wet deposition to this specific dust mass loss. The dust removal mechanism shows an almost direct response to the enhanced precipitation during this period.
In contrast to Thessaloniki, Athens is characterized by negligible 6hr dust wet deposition values of 5–10 mg m−2 for 12:00-18:00 UTC 3 June, 50–100 mg m−2 for 18:00 UTC 3 June–00:00 UTC 4 June, and 10–50 mg m−2 for 00:00–06:00 UTC 4 June, which is mainly attributed to the moderate precipitation, as shown in Figure 6. However, a dust load loss of approximately 200 mg m−2 is observed at 18:00 UTC 3 June 2014, coinciding with the initialization of precipitation (Figure 10f).
Additionally, the difference in dust loads remains almost constant after the event; this is true for both time series, confirming that dust wet removal processes modify the spatiotemporal distribution of the total dust mass.

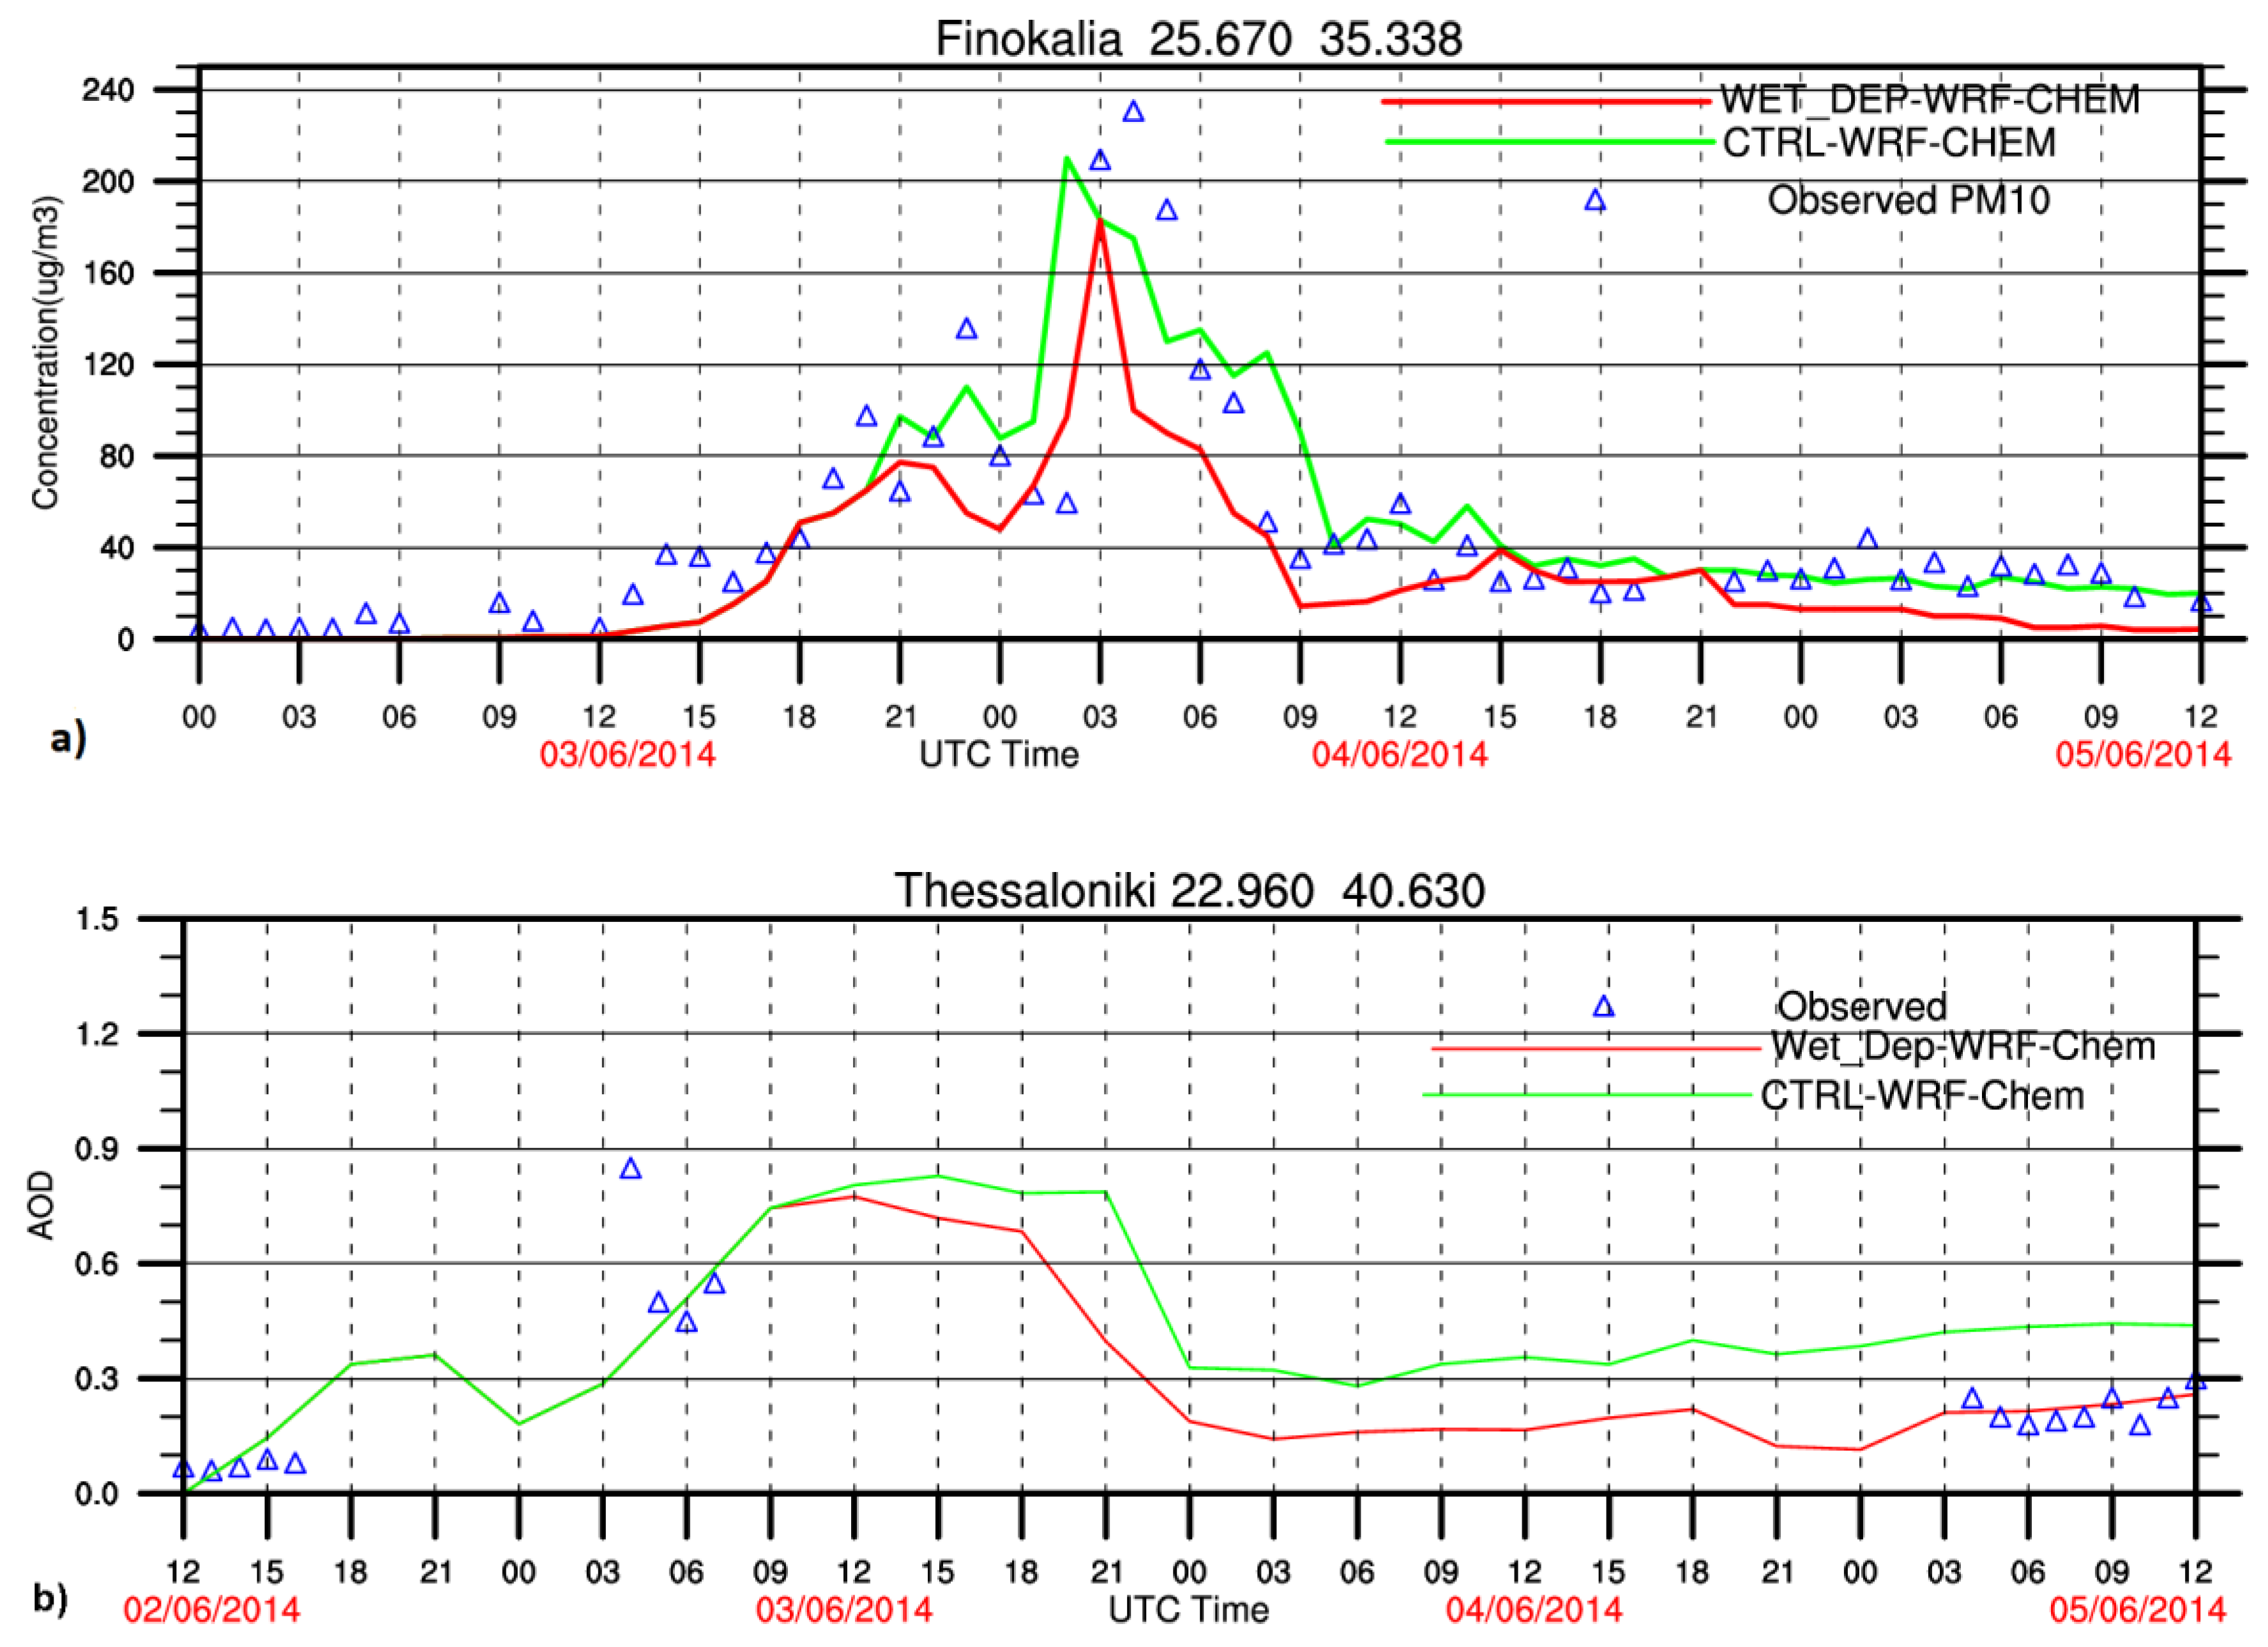
3.6. Validation With in situ Measurements

In order to evaluate the consistency of the SP scheme and its impact on the performance of WRF-Chem, a comparison is made between hourly values of PM10 concentrations measured at Finokalia surface station and the dust concentration values (μg m−3) simulated by the CTRL and Wet_Dep simulations. The Finokalia environmental research station is located in Southern Crete; additional information can be found in Ref. [3]. As far as PM10 concentration is concerned, both simulations reproduce a pattern similar to the measurements for the entire period under consideration (Figure 11a). Obviously, Wet_Dep estimates lower concentrations than the CTRL ones, which are more prominent around the peaks at 03:00–06:00 UTC 4 June. However, Wet_Dep reproduces better the general dust concentration pattern throughout the period of evaluation, which is reflected in the statistical scores (Table 2).
Indeed, Wet Dep underestimates the dust concentration by −1.50 μg m−3, having an overall lower RMSE of 28.50 μg m−3. In contrast, the bias score of the CTRL dust concentration reveals a systematical overestimation of PM10 measurements, despite the fact that the latter one also includes non-dust origin species such as sea salt, anthropogenic particles, etc.
A comparison is also made between the estimated values of aerosol optical depth (AOD) from AERONET’s database (500 nm, Level 1.5) for Thessaloniki station (Figure 11b) and the simulated ones. As the dust loss begins after 09:00 UTC 3 June 2014, a significant reduction in AOD is also shown in Figure 11b, with an approximately difference of 0.1–0.2 between the two time series. Despite the lack of AOD measurements for 4 June 2014, it seems that Wet Dep is in better accordance with the observed one for 5 June 2014 compared to the CTRL simulation, which clearly overestimates AOD by a value of 0.1–0.2 (Figure 11b). The statistical scores in Table 2 also confirm this statement. Indeed, the systematic overestimation of CTRL by 0.15 turns to a slight underestimation of Wet Dep by −0.05. Additionally, Wet Dep substantially improves the AOD forecasting skill with a RMSE of 0.17 instead of 0.23 of the CTRL run. It has to be mentioned that these results cannot be considered as significant, due to the limited sample of AOD measurements. However, in a case study that concerns a long-range dust transport event over the Italian Peninsula during 18–26 May 2014, Rizza et al. [60] reached similar statistical scores.

4. Discussion and Conclusions

In this study, the Seinfeld and Pandis [44] dust wet deposition scheme is embedded in the fully coupled atmospheric-chemistry model WRF/Chem with the GOCART/AFWA module, which uses an advanced dust emissions parameterization scheme in comparison to the original GOCART. As the GOCART/AFWA scheme does not support a dust wet deposition scheme, the implementation of the Seinfeld and Pandis (SP) scheme is assumed to be an important upgrade, with an advanced wet scavenging scheme.
The performance of the GOCART/AFWA including the SP scheme has been assessed in a long-range dust transport case study which occurred on 3–5 June 2014. To this end, two sensitivity simulations with the default GOCART/AFWA configuration (CTRL) and the GOCART/AFWA including the SP scheme (Wet_Dep) have been performed. The sensitivity simulations revealed that the dust wet deposition mainly occurs at heights greater than 3.5 km, with the in-cloud area playing an important role in the scavenging of significant amounts of the finer suspended particles. Furthermore, the dust loss due to the wet scavenging mechanisms reduces its total load in the atmosphere up to 6 km, and ultimately affects the entire spatiotemporal distribution of the suspended dust.
The incorporation of the advanced SP scheme also improves the model’s performance by limiting the overestimated values of the simulated dust concentration and dust load. Indeed, statistical evaluation reveals that the Wet_Dep simulation turns the CTRL systematic overestimation of dust to underestimation, while at the same time, reduces the forecast error. Wet_Dep, in comparison to observed PM10 values, underestimates surface concentration on a scale that could be generally acceptable, as the measured concentration of PM10 does not include mineral dust particles exclusively, but it also detects additional species such as sea salt, anthropogenic particles, etc. Similar conclusions can also be drawn through the comparison of the observed AOD values with those estimated by both simulations. Thus, Wet_Dep improves the AOD bias score by slightly underestimating it; additionally, it reduces RMSE. Such improvements substantially correct the spatiotemporal distribution of the suspended dust throughout the simulation period and are contributing factors to the reduction of its well-known dust concentration overestimation problem [60,64,76,77,78].

Author Contributions

K.T. contributed to the methodology and formal analysis, investigation, visualization and writing; A.P.; N.M. and S.M. contributed to the investigation writing, review and editing; C.S. contributed to the formal analysis, investigation, writing, review and editing; P.K. contributed to the conceptualization, methodology, supervision, investigation, writing, review and editing.

Funding

This research received no external funding.

Acknowledgments

We acknowledge the use of imagery from the NASA Worldview application (https://worldview.earthdata.nasa.gov/) operated by the NASA/Goddard Space Flight Center Earth Science Data and Information System (EOSDIS) project. We gratefully thank the EUMETSAT Historical Browse Imagery Archive, Darmstadt, Germany. British MetOffice is also acknowledged for the provision of the surface analysis charts. We thank the PI investigators and their staff for establishing and maintaining the AERONET sites used in this study.

Conflicts of Interest

The authors declare no conflict of interest.

References

  1. She, L.; Xue, Y.; Yang, X.; Guang, J.; Li, Y.; Che, Y.; Fan, C.; Xie, Y. Dust detection and intensity estimation using Himawari-8/AHI observation. Remote Sens. 2018, 10, 490. [Google Scholar] [CrossRef]
  2. Tegen, I. Modeling the mineral dust aerosol cycle in the climate system. Quat. Sci. Rev. 2003, 22, 1821–1834. [Google Scholar] [CrossRef] [Green Version]
  3. Solomos, S.; Kalivitis, N.; Mihalopoulos, N.; Amiridis, V.; Kouvarakis, G.; Gkikas, A.; Binietoglou, I.; Tsekeri, A.; Kazadzis, S.; Kottas, M.; et al. From Tropospheric Folding to Khamsin and Foehn Winds: How Atmospheric Dynamics Advanced a Record-Breaking Dust Episode in Crete. Atmosphere 2018, 9, 240. [Google Scholar] [CrossRef]
  4. Spyrou, C. Direct radiative impacts of desert dust on atmospheric water content. Aerosol Sci. Technol. 2018, 52, 693–701. [Google Scholar] [CrossRef]
  5. Marconi, M.; Sferlazzo, D.M.; Becagli, S.; Bommarito, C.; Calzolai, G.; Chiari, M.; Di Sara, A.; Ghendini, J.; Gomez-Amo, L.; Lucarelli, F.; et al. Saharan dust aerosol over the central Mediterranean Sea: PM10 chemical composition and concentration versus optical columnar measurements. Atmos. Chem. Phys. 2014, 14, 2039–2054. [Google Scholar] [CrossRef] [Green Version]
  6. Ginoux, P.; Clarisse, L.; Clerbaux, C.; Coheur, P.-F.; Dubovik, O.; Hsu, N.C.; Van Damme, M. Mixing of dust and NH3 observed globally over anthropogenic dust sources. Atmos. Chem. Phys. 2012, 12, 7351–7363. [Google Scholar] [CrossRef] [Green Version]
  7. Israelevich, P.; Ganor, E.; Alpert, P.; Kishcha, P.; Stupp, A. Predominant transport paths of Saharan dust over the Mediterranean Sea to Europe. J. Geophys. Res. 2012, 117, D02205. [Google Scholar] [CrossRef] [Green Version]
  8. Gkikas, A.; Hatzianastassiou, N.; Mihalopoulos, N.; Katsoulis, V.; Kazadzis, S.; Pey, J.; Querol, X.; Torres, O. The regime of intense desert dust episodes in the Mediterranean based on contemporary satellite observations and ground measurements. Atmos. Chem. Phys. 2013, 13, 12135–12154. [Google Scholar] [CrossRef]
  9. Gkikas, A.; Basart, S.; Hatzianastassiou, N.; Marinou, E.; Amiridis, V.; Kazadzis, S.; Pey, J.; Querol, X.; Jorba, O.; Gassó, S.; et al. Mediterranean intense desert dust outbreaks and their vertical structure based on remote sensing data. Atmos. Chem. Phys. 2016, 16, 8609–8642. [Google Scholar] [CrossRef] [Green Version]
  10. Georgoulias, A.K.; Alexandri, G.; Kourtidis, K.A.; Lelieveld, J.; Zanis, P.; Amiridis, V. Differences between the MODIS Collection 6 and 5.1 aerosol datasets over the greater Mediterranean region. Atmos. Environ. 2016, 147, 310–319. [Google Scholar] [CrossRef]
  11. Marinou, E.; Amiridis, V.; Binietoglou, I.; Tsikerdekis, A.; Solomos, S.; Proestakis, E.; Konsta, D.; Papagiannopoulos, N.; Tsekeri, A.; Vlastou, G.; et al. Three-dimensional evolution of Saharan dust transport towards Europe based on a 9-year EARLINET-optimized CALIPSO dataset. Atmos. Chem. Phys. 2017, 17, 5893–5919. [Google Scholar] [CrossRef] [Green Version]
  12. Tsikerdekis, A.; Zanis, P.; Steiner, A.L.; Solmon, F.; Amiridis, V.; Marinou, E.; Katragkou, E.; Karacostas, T.; Foret, G. Impact of dust size parameterizations on aerosol burden and radiative forcing in RegCM4. Atmos. Chem. Phys. 2017, 17, 769–791. [Google Scholar] [CrossRef]
  13. Osada, K.; Ura, S.; Kagawa, M.; Mikami, M.; Tanaka, T.Y.; Matoba, S.; Aoki, K.; Shinoda, M.; Kurosaki, U.; Hayashi, M.; et al. Wet and dry deposition of mineral dust particles in Japan: factors related to temporal variation and spatial distribution. Atmos. Chem. Phys. 2014, 14, 1107–1121. [Google Scholar] [CrossRef] [Green Version]
  14. Shimizu, A.; Sugimoto, N.; Matsui, I.; Arao, K.; Uno, I.; Murayama, T.; Kagawa, N.; Aoki, K.; Uchiyama, A.; Yamazaki, A. Continuous observations of Asian dust and other aerosols by polarization lidars in China and Japan during ACE-Asia. J. Geophys. Res. Atmos. 2004, 109(D19). [Google Scholar] [CrossRef]
  15. Su, L.; Toon, O.B. Saharan and Asian dust: similarities and differences determined by CALIPSO, AERONET, and a coupled climate-aerosol microphysical model. Atmos. Chem. Phys. 2011, 11, 3263. [Google Scholar] [CrossRef]
  16. Mona, L.; Liu, Z.; Müller, D.; Omar, A.; Papayannis, A.; Pappalardo, G.; Sugimoto, N.; Vaughan, M. Lidar measurements for desert dust characterization: an overview. Adv. Meteorol. 2012, 2012, 1–36. [Google Scholar] [CrossRef]
  17. Xie, Y.; Zhang, W.; Qu, J.J. Detection of Asian Dust Storm Using MODIS Measurements. Remote Sens. 2017, 9, 869. [Google Scholar] [CrossRef]
  18. Di, A.; Xue, Y.; Yang, X.; Leys, J.; Guang, J.; Mei, L.; Wang, J.; She, L.; Hu, Y.; He, X.; et al. Dust aerosol optical depth retrieval and dust storm detection for Xinjiang region using Indian National Satellite Observations. Remote Sens. 2016, 8, 702. [Google Scholar] [CrossRef]
  19. Washington, R.; Wiggs, G.S.F. Desert dust. In Arid Zone Geomorphology: Process, Form and Change in Drylands, 3rd ed.; Thomas, D.S.G., Ed.; John Wiley & Sons: Hoboken, NJ, USA, 2011; Chapter 20; pp. 517–537. ISBN 9780470519080. [Google Scholar]
  20. Schulz, M.; Prospero, J.M.; Baker, A.R.; Dentener, F.; Ickes, L.; Liss, P.S.; Mahowald, N.M.; Nickovic, S.C.; Garcia-Pando, P.; Rodriguez, S.; et al. Atmospheric transport and deposition of mineral dust to the ocean: implications for research needs. Environ. Sci. Technol. 2012, 46, 10390–10404. [Google Scholar] [CrossRef] [PubMed]
  21. In, H.-J.; Park, S.-U. A simulation of long-range transport of Yellow Sand observed in April 1998 in Korea. Atmos. Environ. 2002, 36, 4173–4187. [Google Scholar] [CrossRef]
  22. Spyrou, C.; Mitsakou, C.; Kallos, G.; Louka, P.; Vlastou, G. An improved limited area model for describing the dust cycle in the atmosphere. J. Geophys. Res. Atmos. 2010, 115(D17). [Google Scholar] [CrossRef]
  23. Nickovic, S.; Kallos, G.; Papadopoulos, A.; Kakaliagou, O. A model for prediction of desert dust cycle in the atmosphere. J. Geophys. Res. Atmos. 2001, 106, 18113–18129. [Google Scholar] [CrossRef] [Green Version]
  24. Jaffrezo, J.L.; Colin, J.L. Rain-aerosol coupling in urban area: scavenging ratio measurement and identification of some transfer processes. Atmos. Environ. (1967) 1988, 22, 929–935. [Google Scholar] [CrossRef]
  25. Zender, C.S.; Bian, H.; Newman, D. Mineral Dust Entrainment and Deposition (DEAD) model: Description and 1990s dust climatology. J. Geophys. Res. Atmos. 2003, 108(D14). [Google Scholar] [CrossRef]
  26. Harrison, R.M.; Pio, C.A. Size-differentiated composition of inorganic atmospheric aerosols of both marine and polluted continental origin. Atmos. Environ. (1967) 1983, 17, 1733–1738. [Google Scholar] [CrossRef]
  27. Loosmore, G.A.; Cederwall, R.T. Precipitation scavenging of atmospheric aerosols for emergency response applications: testing an updated model with new real-time data. Atmos. Environ. 2004, 38, 993–1003. [Google Scholar] [CrossRef]
  28. Laakso, L.; Rannik, Ü.; Grönholm, T.; Kosmale, M.; Fiedler, V.; Vehkamäki, H.; Kulmala, M. Ultrafine particle scavenging coefficients calculated from 6 years field measurements. Atmos. Environ. 2003, 37, 3605–3613. [Google Scholar] [CrossRef] [Green Version]
  29. Draxler, R.R.; Hess, G.D. An overview of the HYSPLIT_4 modelling system for trajectories. Aust. Meteorol. Mag. 1998, 47, 295–308. [Google Scholar]
  30. Webster, H.N.; Thomson, D.J. The NAME Wet Deposition Scheme. Met Office, Met Office Forecasting Research Technical Report, No: 584; 43p, 2014. Available online: https://www.metoffice.gov.uk/binaries/content/assets/mohippo/pdf/c/a/frtr584.pdf (accessed on 20 June 2018).
  31. Gong, S.L.; Barrie, L.A.; Blanchet, J.P.; Von Salzen, K.; Lohmann, U.; Lesins, G.; Spacel, L.; Zhang, L.M.; Girard, E.; Lin, H.; et al. Canadian Aerosol Module: A size-segregated simulation of atmospheric aerosol processes for climate and air quality models 1. Module development. J. Geophys. Res. Atmos. 2003, 108(D1). [Google Scholar] [CrossRef]
  32. Guelle, W.; Balkanski, Y.J.; Schulz, M.; Dulac, F.; Monfray, P. Wet deposition in a global size-dependent aerosol transport model: 1. Comparison of a 1 year 210Pb simulation with ground measurements. J. Geophys. Res. Atmos. 1998, 103(D10), 11429–11445. [Google Scholar] [CrossRef]
  33. Dana, M.T.; Hales, J.M. Statistical aspects of the washout of polydisperse aerosols. Atmos. Environ. 1976, 10, 45–50. [Google Scholar] [CrossRef]
  34. Butcher, S.S.; Charlson, R.J. An Introduction to Air Chemistry; Academic: San Diego, CA, USA, 1972; 241p, ISBN 978-0-12-148250-3. [Google Scholar]
  35. Greenfield, S.M. Rain scavenging of radioactive particulate matter from the atmosphere. J. Meteorol. 1957, 14, 115–125. [Google Scholar] [CrossRef]
  36. Beheng, K.D.; Herbert, F. Mathematical studies on the aerosol concentration in drops changing due to particle scavenging and redistribution by coagulation. Meteorol. Atmos. Phys. 1986, 35, 212–219. [Google Scholar] [CrossRef]
  37. Slinn, W.G.N. Precipitation scavenging. In Atmospheric Sciences and Power Production—1979; Division of Biomedical Environmental Research, US Department of Energy: Washington, DC, USA, 1983; Chapter 11; pp. 57–90. [Google Scholar]
  38. Beheng, K.D. A parameterization of warm cloud microphysical conversion processes. Atmos. Res. 1994, 33, 193–206. [Google Scholar] [CrossRef]
  39. Giorgi, F.; Chameides, W.L. Rainout lifetimes of highly soluble aerosols and gases as inferred from simulations with a general circulation model. J. Geophys. Res. Atmos. 1986, 91(D13), 14367–14376. [Google Scholar] [CrossRef]
  40. Tsyro, S. First Estimates of the Effect of Aerosol Dynamics in the Calculation of PM10 and PM2.5; EMEP/MSC-W: Oslo, Norway, 2002; Note 4; 40p, ISSN 0332-9879. [Google Scholar]
  41. Jung, E.; Shao, Y. An intercomparison of four wet deposition schemes used in dust transport modeling. Global Planet. Chang. 2006, 52, 248–260. [Google Scholar] [CrossRef]
  42. Wang, P.K.; Pruppacher, H.R. An experimental determination of the efficiency with which aerosol particles are collected by water drops in subsaturated air. J. Atmos. Sci. 1977, 34, 1664–1669. [Google Scholar] [CrossRef]
  43. Grover, S.N.; Pruppacher, H.R. The effect of vertical turbulent fluctuations in the atmosphere on the collection of aerosol particles by cloud drops. J. Atmos. Sci. 1985, 42, 2305–2318. [Google Scholar] [CrossRef]
  44. Seinfeld, J.H.; Pandis, S.N. Atmospheric Chemistry and Physics: From Air Pollution to Climate Change; John Willey and Sons, Inc.: Hoboken, NJ, USA, 1998. [Google Scholar]
  45. Pudykiewicz, J. Simulation of the Chernobyl dispersion with a 3-D hemispheric tracer model. Tellus B 1989, 41, 391–412. [Google Scholar] [CrossRef]
  46. Brandt, J.; Christensen, J.H.; Frohn, L.M. Modelling transport and deposition of caesium and iodine from the Chernobyl accident using the DREAM model. Atmos. Chem. Phys. 2002, 2, 397–417. [Google Scholar] [CrossRef] [Green Version]
  47. Tegen, I.; Fung, I. Modeling of mineral dust in the atmosphere: Sources, transport, and optical thickness. J. Geophys. Res. Atmos. 1994, 99(D11), 22897–22914. [Google Scholar] [CrossRef]
  48. Grell, G.A.; Peckham, S.E.; Schmitz, R.; McKeen, S.A.; Frost, G.; Skamarock, W.C.; Eder, B. Fully coupled “online” chemistry in the WRF model. Atmos. Environ. 2005, 39, 6957–6976. [Google Scholar] [CrossRef]
  49. Skamarock, W.C.; Klemp, J.B.; Dudhia, J.; Gill, D.O.; Barker, D.M.; Duda, M.G.; Huang, X.-Y.; Wang, W.; Powers, J.G. A Description of the Advanced Research WRF Version 3; NCAR Tech. Note NCAR/TN-475+STR; 2008; 113p. [Google Scholar] [CrossRef]
  50. Chin, M.; Rood, R.B.; Lin, S.J.; Müller, J.F.; Thompson, A.M. Atmospheric sulfur cycle simulated in the global model GOCART: Model description and global properties. J. Geophys. Res. Atmos. 2000, 105(D20), 24671–24687. [Google Scholar] [CrossRef]
  51. Solomos, S.; Kallos, G.; Kushta, J.; Astitha, M.; Tremback, C.; Nenes, A.; Levin, Z. An integrated modeling study on the effects of mineral dust and sea salt particles on clouds and precipitation. Atmos. Chem. Phys. 2011, 11, 873–892. [Google Scholar] [CrossRef] [Green Version]
  52. Environ. User’s Guide to the Comprehensive Air Quality Model with Extensions (CAMx), Version 4; ENVIRON International Corporation: Novato, CA, USA, 2006. [Google Scholar]
  53. Dare, R.A.; Potts, R.J.; Wain, A.G. Modelling wet deposition in simulations of volcanic ash dispersion from hypothetical eruptions of Merapi, Indonesia. Atmos. Environ. 2016, 143, 190–201. [Google Scholar] [CrossRef]
  54. Jones, S.L.; Creighton, G.A.; Kuchera, E.L.; Rentschler, S.A. Adapting WRF-CHEM GOCART for Fine-Scale Dust Forecasting. In AGU Fall 2011 Meeting Abstracts, Abstract id: U14A-06. 2011. Available online: http://adsabs.harvard.edu/abs/2011AGUFM.U14A..06J (accessed on 20 June 2018).
  55. Morrison, H.; Gettelman, A. A new two-moment bulk stratiform cloud microphysics scheme in the Community Atmosphere Model, version 3 (CAM3). Part I: Description and numerical tests. J. Clim. 2008, 21, 3642–3659. [Google Scholar] [CrossRef]
  56. Morrison, H.; Thompson, G.; Tatarskii, V. Impact of cloud microphysics on the development of trailing stratiform precipitation in a simulated squall line: Comparison of one-and two-moment schemes. Mon. Weather Rev. 2009, 137, 991–1007. [Google Scholar] [CrossRef]
  57. Kain, J.S. The Kain–Fritsch convective parameterization: an update. J. Appl. Meteorol. 2004, 43, 170–181. [Google Scholar] [CrossRef]
  58. Mlawer, E.J.; Taubman, S.J.; Brown, P.D.; Iacono, M.J.; Clough, S.A. Radiative transfer for inhomogeneous atmospheres: RRTM, a validated correlated-k model for the longwave. J. Geophys. Res. Atmos. 1997, 102(D14), 16663–16682. [Google Scholar] [CrossRef]
  59. Morrison, H.; Milbrandt, J. Comparison of two-moment bulk microphysics schemes in idealized supercell thunderstorm simulations. Mon. Weather Rev. 2010, 4, 1103–1130. [Google Scholar] [CrossRef]
  60. Rizza, U.; Barnaba, F.; Miglietta, M.M.; Mangia, C.; Di Liberto, L.; Dionisi, D.; Costabile, F.; Grasso, F. Gobbi, G.P. WRF-Chem model simulations of a dust outbreak over the central Mediterranean and comparison with multi-sensor desert dust observations. Atmos. Chem. Phys. 2017, 17, 93. [Google Scholar] [CrossRef]
  61. Ginoux, P.; Chin, M.; Tegen, I.; Prospero, J.M.; Holben, B.; Dubovik, O.; Lin, S.-J. Sources and distributions of dust aerosols simulated with the GOCART model. J. Geophys. Res. Atmos. 2001, 106(D17), 20255–20273. [Google Scholar] [CrossRef]
  62. Marticorena, B.; Bergametti, G. Modeling the atmospheric dust cycle: 1. Design of a soil-derived dust emission scheme. J. Geophys. Res. Atmos. 1995, 100(D8), 16415–16430. [Google Scholar] [CrossRef]
  63. Flaounas, E.; Kotroni, V.; Lagouvardos, K.; Klose, M.; Flamant, C.; Giannaros, T.M. Sensitivity of the WRF-Chem (V3.6.1) model to different dust emission parametrisation: assessment in the broader Mediterranean region. Geosci. Model Dev. 2017, 10, 2925–2945. [Google Scholar] [CrossRef] [Green Version]
  64. Fountoukis, C.; Ackermann, L.; Ayoub, M.A.; Gladich, I.; Hoehn, R.D.; Skillern, A. Impact of atmospheric dust emission schemes on dust production and concentration over the Arabian Peninsula. Model. Earth Syst. Environ. 2016, 2, 1–6. [Google Scholar] [CrossRef]
  65. Jung, E. Numerical Simulation of Asian Dust Events: The Impacts of Convective Transport and Wet Deposition. Ph.D. Thesis, The University of New South Wales, Sydney, Australia, 2005. [Google Scholar]
  66. Jones, S.L.; Adams-Selin, R.; Hunt, E.D.; Creighton, G.A.; Cetola, J.D. Update on Modifications to WRF-CHEM GOCART for Fine-Scale Dust Forecasting at AFWA. In AGU Fall 2012 Meeting Abstracts, Abstract id: A33D-0188. 2012. Available online: http://adsabs.harvard.edu/abs/2012AGUFM.A33D0188J (accessed on 20 June 2018).
  67. LeGrand, S.L.; Polashenski, C.; Letcher, T.W.; Creighton, G.A.; Peckham, S.E.; Cetola, J.D. The AFWA emissions Scheme for the GOCART Aerosol Model in WRF-Chem. Geosci. Model Dev. Discuss. 2018, 1–57. [Google Scholar] [CrossRef]
  68. Fécan, F.; Marticorena, B.; Bergametti, G. Parametrization of the increase of the aeolian erosion threshold wind friction velocity due to soil moisture for arid and semi-arid areas. Ann. Geophys. 1998, 17, 149–157. [Google Scholar] [CrossRef]
  69. White, B.R. Soil transport by winds on Mars. J. Geophys. Res. Sol. Ea. 1979, 84(B9), 4643–4651. [Google Scholar] [CrossRef]
  70. Kok, J.F. Does the size distribution of mineral dust aerosols depend on the wind speed emission? Atmos. Chem. Phys. 2011, 11, 10149–10156. [Google Scholar] [CrossRef]
  71. Liu, J.Y.; Orville, H.D. Numerical modeling of precipitation and cloud shadow effects on mountain-induced cumuli. J. Atmos. Sci. 1969, 26, 1283–1298. [Google Scholar] [CrossRef]
  72. Ikawa, M.; Saito, K. Description of the Non Hydrostatic Model Developed at the Forecast Research Department of the MRI; Technical Report 28; Meteorological Research Institute (MRI), Japan Meteorological Agency: Tsukuba, Japan, 1990; 238p. [Google Scholar]
  73. Sportisse, B. A review of parameterizations for modelling dry deposition and scavenging of radionuclides. Atmos. Environ. 2007, 41, 2683–2698. [Google Scholar] [CrossRef]
  74. Berthet, S.; Leriche, M.; Pinty, J.P.; Cuesta, J.; Pigeon, G. Scavenging of aerosol particles by rain in a cloud resolving model. Atmos. Res. 2010, 96, 325–336. [Google Scholar] [CrossRef] [Green Version]
  75. Feng, J. A size-resolved model for below-cloud scavenging of aerosols by snowfall. J. Geophys. Res. Atmos. 2009, 114(D8). [Google Scholar] [CrossRef]
  76. Mona, L.; Papagiannopoulos, N.; Basart, S.; Baldasano, J.; Binietoglou, I.; Cornacchia, C.; Pappalardo, G. EARLINET dust observations vs. BSCDREAM8b modeled profiles: 12-year-long systematic comparison at Potenza, Italy. Atmos. Chem. Phys. 2014, 14, 8781–8793. [Google Scholar] [CrossRef] [Green Version]
  77. Binietoglou, I.; Basart, S.; Alados-Arboledas, L.; Amiridis, V.; Argyrouli, A.; Baars, H.; Baldasano, J.M.; Balis, D.; Belegante, L.; Bravo-Aranda, J.; et al. A methodology for investigating dust model performance using synergistic EARLINET/AERONET dust concentration retrievals. Atmos. Meas. Tech. 2015, 8, 3577–3600. [Google Scholar] [CrossRef] [Green Version]
  78. Georgoulias, A.K.; Tsikerdekis, A.; Amiridis, V.; Marinou, E.; Benedetti, A.; Zanis, P.; Alexandri, G.; Mona, L.; Kourtidis, K.A.; Lelieveld, J. A 3-D evaluation of the MACC reanalysis dust product over Europe, northern Africa and Middle East using CALIOP/CALIPSO dust satellite observations. Atmos. Chem. Phys. 2018, 18, 8601–8620. [Google Scholar] [CrossRef]
Figure 1. WRF/Chem integration domain with horizontal distribution of: (a) Fraction of erodible surface; (b) Clay fraction; (c) Sand fraction over the domain of integration.
Remotesensing 10 01595 g001
Figure 2. (a) ECMWF analysis for geopotential height (contours in gpm) and temperature at 500 hPa (color shaded in °C) for 12:00 UTC 1 June 2014; (b) UK MetOffice surface pressure analysis map (hPa) for 12:00 UTC 1 June 2014; (c) Same as for (a) but for 18:00 UTC 3 June 2014; (d) Same as for (b) but for 00:00 UTC 3 June 2014.
Remotesensing 10 01595 g002
Figure 3. Dust mobilization over Libya and transport to Greek Peninsula for (a) 2 June 2014 and (b) 3 June 2014 (NASA satellite snapshots, EOSDIS-WORLDVIEW, 5 km resolution per pixel).
Remotesensing 10 01595 g003
Figure 4. Cross-section of major dust emission areas between points of A and B (10°E–20°E) [top left] at 09:00 UTC 2 June 2014: (a) Simulated dust concentration (μg m−3) (shaded), potential temperature (K) (contours); (b) Potential temperature (K) (contours), and vertical winds (m s−1) (shaded). Cross-section of the simulated dust concentration (μg m−3) (shaded), potential temperature (K) (contours); (c) for bin 1; (d) for bin 2; (e) for bin 3; (f) for bin 4; (g) for bin 5.
Remotesensing 10 01595 g004aRemotesensing 10 01595 g004b
Figure 5. Spatial distribution of the total dust load (mg m−2) and wind speed at 3 km (m s−1) over the model’s area for 18:00 UTC 3 June 2014.
Remotesensing 10 01595 g005
Figure 6. Remotely sensed METEOSAT precipitation rate (mm/hr) for (a) 12:00 UTC 3 June and for (b) 1500 UTC 3 June; (c) WRF/Chem accumulated precipitation (mm) for 12:00–18:00 UTC 3 June 2014.
Remotesensing 10 01595 g006aRemotesensing 10 01595 g006b
Figure 7. 6 h dust wet deposition (mg m−2) simulated by the WRF-Chem model (a) for 06:00–12:00 UTC 3 June 2014 (b) for 12:00–18:00 UTC 3 June 2014, (c) for 18:00 UTC 3 June–00:00 UTC 4 June 2014, (d) for 00:00–06:00 UTC 4 June 2014, (e) for 18:00 UTC 4 June–00:00 UTC 5 June 2014, (f) for 00:00–06:00 UTC 5 June 2014.
Remotesensing 10 01595 g007
Figure 8. Latitudinal cross-section between points of C and D (20°E–30°E) [top left]. (a) Cross-section of dust concentration (μg m−3) (shaded), potential temperature (K) (contours), in CTRL simulation; (b) as a in WET_DEP simulation; (c) Cross-section of dust concentration loss (μg m−3) (shaded) and relative humidity (%) (contours), in WET_DEP simulation for 15:00 UTC 3 June 2014; (d) Cross-section of cloud water (mg kg−1) (shaded) and relative humidity (%) (contours), in WET_DEP simulation for 15:00 UTC 3 June 2014.
Remotesensing 10 01595 g008aRemotesensing 10 01595 g008b
Figure 9. Meridional cross-section between points of E and F (35°E–40°E) [top left]. (a) Cross-section of dust concentration (μg m−3) (shaded), potential temperature (K) (contours); (b) as a in WET_DEP simulation; (c) Cross-section of dust concentration loss (μg m−3) (shaded) and relative humidity (%) (contours), in WET_DEP simulation for 15:00 UTC 3 June 2014; (d) Cross-section of cloud water (mg kg−1) (shaded) and relative humidity (%) (contours), in WET_DEP simulation for 15:00 UTC 3 June 2014.
Remotesensing 10 01595 g009aRemotesensing 10 01595 g009b
Figure 10. (ac) timeseries of the simulated dust load (mg m−2), 3h accumulated precipitation (mm) and dust load loss (mg m−2) over Thessaloniki (22.960°E–40.630°N) and (df) over Athens (23.735°E–37.975°N). Red and blue lines in dust load diagrams (a, d) correspond to CTRL and Wet_Dep simulations.
Remotesensing 10 01595 g010aRemotesensing 10 01595 g010bRemotesensing 10 01595 g010c
Figure 11. Time series (a) of the dust concentration (μg m−3) over Finokalia–Crete station (25.670°E–35.338°N) and (b) of AOD over Thessaloniki station (22.960°E–40.630°N) for CTRL (green) and Wet_Dep (red) simulations which are compared against the observed PM10 concentrations by Finokalia and the AOD values by Thessaloniki stations, respectively.
Remotesensing 10 01595 g011
Table 1. Primary model configuration settings.
Configuration
ModelWRF/Chem-3.8
Time step150 s
Horizontal resolution25 km × 25 km
Vertical resolution38 sigma-pressure levels up to 50 hPa
Grid points400 × 212
Initial and boundary conditionsECMWF (0.5° × 0.5°)
Emissions schemeGOCART/AFWA [54]
Microphysics schemeMorrison [55,56]
Cumulus schemeKain-Fritsch [57]
Longwave/Shortwave radiationRRTMG [58]
Table 2. BIAS and RMSE between dust concentration (CTRL and Wet_DEP) produced by WRF/Chem model and observed PM10 concentration by Finokalia station and between AOD (CTRL and Wet_DEP) and observed AOD concentration by Thessaloniki station.
CTRL-OBSERVEDWET_DEP-OBSERVED
Dust-PM10BIAS1.90−1.50
RMSE30.2028.50
Dust-AODBIAS0.15−0.05
RMSE0.230.17

