Thermokarst Development Detected from High-Definition Topographic Data in Central Yakutia
by
 , and
, and
Hitoshi Saito
1,2,*, 
Yoshihiro Iijima
3,
Nikolay I. Basharin
4,
Alexander N. Fedorov
4,5 and
Viktor V. Kunitsky
4 1
College of Economics, Kanto Gakuin University, 1-50-1, Mutsuura-higashi, Kanazawa-ku, Yokohama, Kanagawa 236-8501, Japan
2
Center for Spatial Information Science, The University of Tokyo, 5-1-5, Kashiwanoha, Kashiwa, Chiba 277-8568, Japan
3
Graduate School of Bioresources, Mie University, 1577 Kurimamachiya-cho Tsu city, Mie 514-8507, Japan
4
Melnikov Permafrost Institute, 36 Merzlotnaya Str., 677010 Yakutsk, Russia
5
BEST International Centre, North-Eastern Federal University, 58 Belinsky str., 677027 Yakutsk, Russia
*
Author to whom correspondence should be addressed.
Remote Sens. 2018, 10(10), 1579; https://doi.org/10.3390/rs10101579
Submission received: 10 August 2018
/
Revised: 15 September 2018
/
Accepted: 24 September 2018
/
Published: 1 October 2018
(This article belongs to the Special Issue Remote Sensing of Dynamic Permafrost Regions)
Abstract
:Eastern Siberia is characterized by widespread permafrost thawing and subsequent thermokarst development. Estimation of the impacts of the predicted rise in precipitation and air temperatures under climate change requires quantitative knowledge about the spatial distribution of thermokarst development. In the last few years, unmanned aerial systems (UAS) and structure-from-motion multi-view stereo (SfM-MVS) photogrammetry attracted a tremendous amount of interest for acquiring high-definition topographic data. This study detected characteristics of thermokarst landforms using UAS and SfM-MVS photogrammetry at a disused airfield (3.0 ha) and for arable land that was previously used for farming (6.3 ha) in the Churapcha area, located on the right bank of the Lena River in central Yakutia. Orthorectified photographs and digital terrain models with spatial resolutions of 4.0 cm and 8.0 cm, respectively, were obtained for this study. At the disused airfield site and the abandoned arable land, 174 and 867 high-centered polygons that developed after the 1990s were detected, respectively. The data showed that the average diameter and average area of the polygons at the disused airfield site were 11.6 m and 111.2 m2, respectively, while those of the polygons in the abandoned arable land were 7.4 m and 46.8 m2, respectively. The abandoned arable land was characterized by smaller polygons and a higher polygon density. The differences in polygon size for the abandoned arable land and the disused airfield site indicate a difference in the ice wedge distributions and thermokarst developments. The subsidence rate was estimated as 2.1 cm/year for the disused airfield site and 3.9 cm/year for the abandoned arable land.
1. Introduction
The term “thermokarst” refers to a process that produces characteristic landforms as a result of the thawing of ice-rich permafrost or the melting of massive ice [1,2]. Thermokarst research is important because it can be used to estimate permafrost degradation. Thermokarst formation is associated with landscape disturbances and climate change [3]. At present, thermokarst is most active in open natural and anthropogenic landscapes. Under recent warming trends, the destruction of the transient layer, which strongly protects frozen permafrost from thawing [4], resulted in increased thermokarst landform development [5]. Several field studies reported the activation of topographical subsidence along with thermokarst development in continuous permafrost zones. The vulnerability of permafrost to degradation induced by thermokarst subsidence depends on the degree of surface disturbance (e.g., from wild fires [6], clear-cutting [7], and anthropogenic land use [8,9]) and the subsequent deepening of the active layer thickness.
Thermokarst includes the thawing process of frozen ice-rich grounds and underground ice, accompanied by the formation of subsidence [10]. Climatic warming resulted in deeper thawing in these regions. This could lead to massive degradation of the permafrost, particularly in regions with underlying ice-rich permafrost. Pleistocene ice-rich permafrost with syngenetic ice wedges, called yedoma deposits [11], are widespread in eastern Siberia, extending to the subarctic boreal region in the central Lena River basin. The dynamics of thermokarst landforms on an ice complex, or yedoma, were first studied by Efimov and Grave [12] using the Sakha terminology, which was then refined by Solov’ev [13]. In this classification [13], the complete evolution of thermokarst landforms can be traced from primary subsidence to alas—a round subsidence depression with grass and lakes [14].
Eastern Siberia is characterized by widespread thawing of permafrost and the subsequent development of thermokarst. Estimation of the impact of the predicted increase in precipitation and air temperatures under climate change requires quantitative knowledge about the spatial distribution of thermokarst development [15,16]. Recent warming in eastern Siberia resulted in the development of cryogenic processes in permafrost landscapes [17,18]. The most vulnerable permafrost is located under open landscapes (mostly grassland) of the ice complex or yedoma, where the active layer thickness reaches the top of the ice wedges almost every summer, resulting in the melting and degradation of the permafrost. The thermokarst landforms are high-centered polygons (hereafter “polygons”), which now characterize almost all treeless areas of the ice complex in eastern Siberia. The most vulnerable areas are anthropogenic landscapes, such as arable land, areas experiencing deforestation and forest fires, as well as areas where the forest is affected by insect attacks.
In eastern Siberia, especially in central Yakutia, increases of 0.57 °C/decade and 0.70 °C/decade in the average annual air temperatures were observed in Churapcha and Yakutia [19], respectively. The increases in winter temperatures (0.69 °C/decade and 0.89 °C/decade, respectively) contributed significantly to this trend. The change in annual precipitation is insignificant, except for sharp increases during 2005–2008 [20]. The warming climate had a negative impact on the natural environment and economy of central Yakutia [9]. A reduction in usable lands, and damage to buildings and communities caused significant harm to the local population. Degradation of the permafrost leads to the release of organic carbon, which can contribute to further climate change. Therefore, detailed studies of thermokarst at high spatio-temporal resolutions have great practical and theoretical significance.
Temporal variation in satellite and aerial photographs combined with detailed field measurements is the basic method used to detect thermokarst development, as conducted in central Yakutia [17,21], the coastal area of eastern Siberia [22], and multiple sites over the Pan-Arctic region [23]. In contrast, interferometric synthetic aperture radar (InSAR) and light detection and ranging (LiDAR) techniques recently showed thermokarst development over the coastal tundra [24] and extensive areas affected by wild fires [6] in Alaska. A limitation of the detection of the spatial extent of thermokarst development is that smaller topographical features are not fully detected in traditional remote sensing images, such as satellite and aerial images, because of their relatively coarse spatial resolution. The primary thermokarst landforms are typically characterized by polygons with depths of less than a few meters and with widths of less than a few tens of meters. The detection and measurement of polygons and their topographical characteristics using conventional satellite images and aerial photographs are difficult in the visible bands due to these low spatial resolutions. To analyze surface subsidence accompanied by the very rapid formation of thermokarst over a few years, a spatial resolution of <1.0 m is needed. However, the acquisition of high-definition datasets with ground-based measurements remains challenging in remote environments.
In recent years, the use of unmanned aerial systems (UAS) and structure-from-motion multi-view stereo (SfM-MVS) photogrammetry became popular in bridging the spatial gap between ground-based measurements and conventional satellite analyses. The UAS and SfM-MVS photogrammetry technique was widely applied in various geomorphological studies (e.g., References [25,26]). The data processing of SfM-MVS photogrammetry is straightforward and allows for instantaneous acquisition of high-definition and accurate topographic datasets in remote environments from various platforms, including UAS. Unlike satellite images and traditional aerial photographs with conventional manual photogrammetry, the combination of UAS and SfM-MVS photogrammetry provides high-definition orthorectified images and digital terrain models (DTM) for detailed geomorphological terrain analysis with a spatial resolution of <1.0 m [25,26]. The technique is also suitable for the detection of thermokarst landforms. The purpose of this study is to determine features of the initial stage of thermokarst development under recent warming by studying the morphological features of thermokarst using high-definition topographic data from UAS and SfM-MVS photogrammetry.
2. Study Area
The study area is located in the Churapcha area on the right bank of the Lena River in central Yakutia (Figure 1). The Churapcha area is characterized by widespread permafrost and a typical landscape feature of the central Yakutia, called “charan”, which is a unique meadow–forest–steppe landscape formed in the late Pleistocene with current park birch, larch forests, and intermittent dry grassland [14] (Figure 1). Karavaev [27] determined that such meadow–forest–steppe landscapes originated from the Upper Pleistocene. The soils on the meadow–steppe areas are solonetsous [28] or solonetzes [29], which are characterized by a deeper humus horizon of up to 0.2–0.3 m, whereas the larch taiga contains pale solodized soils with a shallower humus horizon. These soils lie on the ice complex, composed of loess loams with ice wedges.
Recently, a significant increase in thermokarst activity was observed, especially in dry grasslands which have been anthropogenically disturbed since the 20th century. To assess the thermokarst developments in the disturbed areas, the Melnikov Permafrost Institute monitored the typical thermokarst landforms at a presently disused airfield site and a plot of abandoned arable land in the dry grasslands (Figure 1) since the 1980s. Based on the research, this study also analyzed the disused airfield site (3.0 ha) and the abandoned arable land (6.3 ha) (Figure 1 and Figure 2).
The Churapcha area is also characterized by an almost flat surface at about 180–200 m above sea level (a.s.l.) with thermokarst depressions (alas, with a relative depth of about 7–8 m). The sediments of the ice complex contain syngenetic polygonal ice wedges up to a depth of 12–14 m, which lie at a depth of 2.2–2.3 m below the surface. Field measurements by the Melnikov Permafrost Institute showed that the width of the upper parts of ice wedges varies from 1.5 m to 3.0 m. The transverse dimensions of the soil blocks between the ice wedges are usually about 8 m and 11 m at the abandoned arable land and disused airfield site, respectively. The disused airfield site is located at the top of the interfluve of Tatta and Kokhara rivers, while the abandoned arable land is located on a gentle slope at the confluence of their basins. The volumetric ice content (ice wedge) in the upper part of the permafrost is approximately 17% at the disused airfield site and 25% at the abandoned arable land, as estimated by the method of Gasanov [30] and field measurements by the Melnikov Permafrost Institute.
The regional climate is extra-continental. Observations from a meteorological station at the disused airfield site show that the mean annual air temperature is −11.5 °C, while monthly mean temperatures for January and July are −44.0 °C and 18.1 °C, respectively. The average annual duration of the frost-free period is 109 days. The amount of precipitation is 254.0 mm/year with 140.0 mm occurring during the warm period [31]. However, during 2007–2016, the mean annual air temperature increased to −8.9 °C and the total precipitation reached 269.0 mm/year.
The permafrost thickness is estimated at about 540 m in Churapcha [32]. The mean annual ground temperature at the meteorological station at a depth of 3.2 m was −2.1 ± 0.7 °C for 1967–2014. At our monitoring sites in the forest areas, the soil temperature ranged from −2 to −3 °C at a depth of 3.2 m, and from −1.5 to −2 °C in the meadows with an active layer thickness of 1.3 m and 2.0 m in 2015, for the forests and meadows, respectively. Increasing air temperatures have been observed in central Yakutia since the early 1990s [33]. The increase in the active layer thickness in open areas has caused rapid thermokarst subsidence since the 1990s [34].
The disused airfield site was characterized by grassland vegetation and was used as an airport from the mid-1960s until the end of the 1980s (Figure 2c,e, and personal communication with local people). The Melnikov Permafrost Institute carried out field measurements on geocryological conditions, such as active layer thickness and distribution of ice wedges at the runway of the presently disused airport site in 1988. These results also show the presence of a flat and straight topography, and grassland vegetation at the end of the 1980s (Figure 2c). However, there has been a significant increase in thermokarst activity in this area since the 1990s. Melting of the tops of ice wedges caused subsidence of the ground surface, deepening of the troughs, and growth of the polygons (Figure 2). Considering the location of measurements by the Melnikov Permafrost Institute, an area of 3.0 ha at the disused airfield site (Figure 2) was selected for this study. Recently, local residents constructed houses in these areas. Areas with such topographic modifications were also excluded from the study site.
The second study area is an area of abandoned arable land about 2.5 km east of the disused airfield site. The area was used for farming and had an almost straight topography, allowing it to be suitable for farming until the 1980s. Farming began in the Churapcha area in the 1930s and expanded rapidly in the 1960s (Figure 2e). After the abandon of farming, the thermokarst activity has enhanced since the early 1990s. The abandoned arable land is surrounded by artificial mounds, and the area within the mounds (6.3 ha) was selected for analysis. In September 2017, three thermokarst lakes existed between the polygons (Figure 2b).
3. Methods
Field survey and topographic measurements were conducted in September 2017. Aerial images of the study areas were obtained by using a UAS (DJI Phantom 4) with a digital camera (12.4 mega pixels) (Table 1), which enabled autonomous flight and image acquisition. Images were captured at an altitude of about 100–120 m above ground level with image overlap of more than 10 images. In total, 167 and 130 images of the disused airfield site and the abandoned arable land, respectively, were acquired. We also measured ground control points (GCPs) with a global navigation satellite system receiver (Emlid Reach RTK) using the kinematic method (Table 1). These data were processed using RTKLIB (ver. 2.4.3). The standard deviations of the GCP analysis were less than 0.01 m in total across three dimensions for the disused airfield site and the abandoned arable land.
The aerial images were processed with five GCPs each for the disused airfield site and the abandoned arable land using SfM-MVS photogrammetry software (Agisoft PhotoScan, Professional Edition). Following standard SfM-MVS photogrammetry workflows (e.g., Reference [26]), we obtained orthorectified images and DTMs. The residual errors (root-mean-squared error) at the GCPs were 16.5 cm and 30.1 cm in total across three dimensions for the disused airfield site and the abandoned arable land, respectively. Anthropogenic features (such as houses and power poles), trees, and grasses in the study areas were filtered from the DTMs for the topographic analysis.
Polygons were manually delineated from the orthorectified images; the DTMs derive relief maps and slope maps with emphasizing the polygon edges. The polygons in this study were detected as the interior of the polygons [35]. The spatial distribution of the polygons was examined together with the differences in the polygon diameter (m), area (m2), and density (number/ha) in the study areas.
Thereafter, the volume and rate of thermokarst subsidence was estimated. Since no aerial photographs and topographic data were available for the 1980s and the 1990s, it was assumed that the original topography was straight before the thermokarst development. Measurements by the Melnikov Permafrost Institute show that the disused airfield and the arable land had straight topography during the late 1980s (Figure 2c). The early stage of thermokarst is characterized by depressed troughs and relative stability in the central areas of the polygons. In the present study, it was assumed that the top terrain of the polygons remained the same as the original topography, and the summit-level map was regarded as the original topographic map. The summit level reflects the main first-order characteristics of the topography [36,37]. Summit-level maps are generally interpreted for general dynamic level of erosion or subsidence. In this study, the summit-level topography was calculated using the DTMs in 2017 through the window analysis in ArcMap (ver. 10.3) using a window size of 16.0 m × 16.0 m, considering the polygon size.
The two topographic datasets with identical spatial resolutions were used to obtain the difference in height based on cell-by-cell subtraction. This analysis is particularly relevant to geomorphic studies because the difference between the DTMs provides spatially distributed surface models of the topographic and volumetric changes (e.g., Reference [38]). The total subsidence volume (m3) and height (m) were estimated from the differences in the heights between the summit-level topographies and DTMs in 2017. Namely, the subsidence height represents the relative height of troughs. The subsidence rate (m/year) was also estimated from 27 years of data (1990–2017). Additionally, ground-based leveling was performed along the 100-m line transect at the disused airfield site in September 2017 at intervals of 2.0 m. The topography obtained from the UAS and SfM-MVS photogrammetry was examined based on results of the ground-based leveling.
4. Results
4.1. The Disused Airfield Site
Orthorectified images and DTMs with spatial resolutions of 4.0 cm and 8.0 cm, respectively, were obtained (Figure 3a,b). A total of 174 polygons, with a density of 57.6/ha, were detected. The mean and median polygon diameters were 11.6 m and 12.2 m, respectively. The area of the polygons ranged from 14.6 m2 to 248.5 m2, with a mean area of 111.2 m2 and a median of 116.0 m2 (Figure 3c, Table 2). Comparison of the DTMs and the ground-based leveling shows that the data obtained from the UAS and SfM-MVS photogrammetry are a good representation the topography (Figure 3e), although the DTMs have an uncertainty of a few tens of centimeters in the SfM-MVS photogrammetry. Figure 3e also indicates some overestimation of the trough depth because of a relatively dense grassland vegetation, which was not fully filtered.
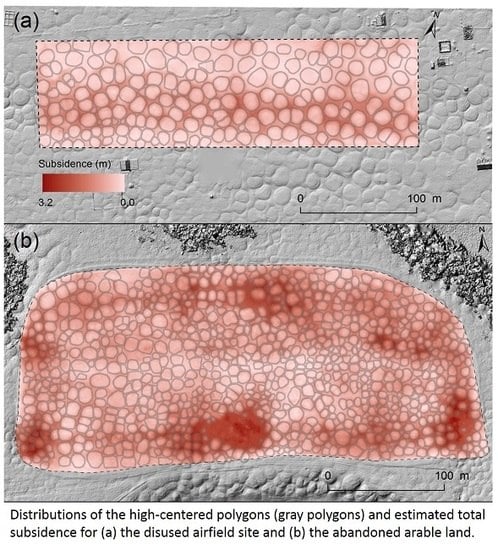
Figure 3d shows total subsidence estimated from the difference in height between the summit-level topography and the DTMs. The largest subsidence was found in the southern part of the study area. The maximum and spatial average of the total subsidence were 204.8 cm and 55.6 cm, respectively (Table 2). The total volume of subsidence was 1.7 × 10⁴ m3. The maximum and spatial average of the subsidence rates were 7.6 cm/year and 2.1 cm/year, respectively, at the disused airfield site during the 27 years.
4.2. The Abandoned Arable Land
Orthorectified images and DTMs with spatial resolutions of 4.0 cm and 8.0 cm, respectively, were obtained (Figure 4a,b). A total of 867 polygons were detected with a density of 137.8/ha. The mean and median polygon diameters were 7.4 m and 7.2 m, respectively. The area of the polygons ranged from 5.9 m2 to 174.1 m2 with a mean of 46.8 m2 and a median of 40.4 m2 (Figure 4c, Table 2).
Figure 4d shows the total subsidence estimated from the difference in height between the summit-level topography and the DTMs. Some of the larger subsidence areas were found around the initiating thermokarst lakes and the western part of the study area. The maximum and the spatial average of the total subsidence were 321.9 cm and 106.0 cm, respectively (Table 2). The total volume of subsidence was 6.7 × 10⁴ m3. The maximum and the spatial average of the subsidence rates were 11.9 cm/year and 3.9 cm/year, respectively, at the abandoned arable land site during the 27 years of the study period.
5. Discussion
5.1. Size of Polygons and Subsidence
Polygon systems formed by thermokarst and their geomorphometry were previously examined in the Arctic region (e.g., [35]). These studies showed that the polygon size is controlled by the initiation age and various environmental factors such as geological material, ice content, and ice-wedge distribution. The disused airfield site and the abandoned arable land site are located only 2.5 km apart; thus, there is little difference in the climatic conditions for the two sites. Thermokarst development began in the early 1990s at both sites. However, the polygon size at the disused airfield site was approximately two times larger than that at the abandoned arable land site (Table 2, Figure 5). These smaller polygons at the abandoned arable land site were densely distributed.
The average polygon diameter at the disused airfield site was 11.6 m, while that at the abandoned arable land site was 7.4 m. The spatial distribution of the ice wedges is the main factor that controls the polygon size in the early stages of thermokarst landform development. Field measurements by the Melnikov Permafrost Institute demonstrate that the transverse dimensions of the soil blocks between the ice wedges were about 11 m at the disused airfield site and 8 m at the abandoned arable land site. The spatial distributions of the ice wedges correspond well with the polygon diameters.
The spatial average of the subsidence rate at the abandoned arable land site was 3.9 cm/year, which was approximately twice the rate of 2.1 cm/year at the disused airfield site. This difference might be explained by the fact that the abandoned arable land is characterized by a high polygon density and high volumetric ice content. The volumetric ice content in the abandoned arable land was approximately 1.5 times higher than that in the disused airfield site. This depends on the structure of ice wedges, which corresponds well with the average size of the polygons. The small size of the polygons at the abandoned arable land is explained by the landscape conditions of the formation of two generations of ice wedges [39]. The first generation of ice wedges in the presently abandoned arable land might be the same as those at the disused airport. However, the abandoned arable land was more likely to form the second generation of ice wedges because the area was located in wetter surface conditions with the gentle slope of the confluence of the Kokhara and Tatta rivers. Therefore, a significant difference in volumetric ice content due to ice wedges could result in an almost twofold difference in subsidence. These observations indicate that the ice-wedge distribution and ice content have strongly affected the thermokarst development since the 1990s in the Churapcha area.
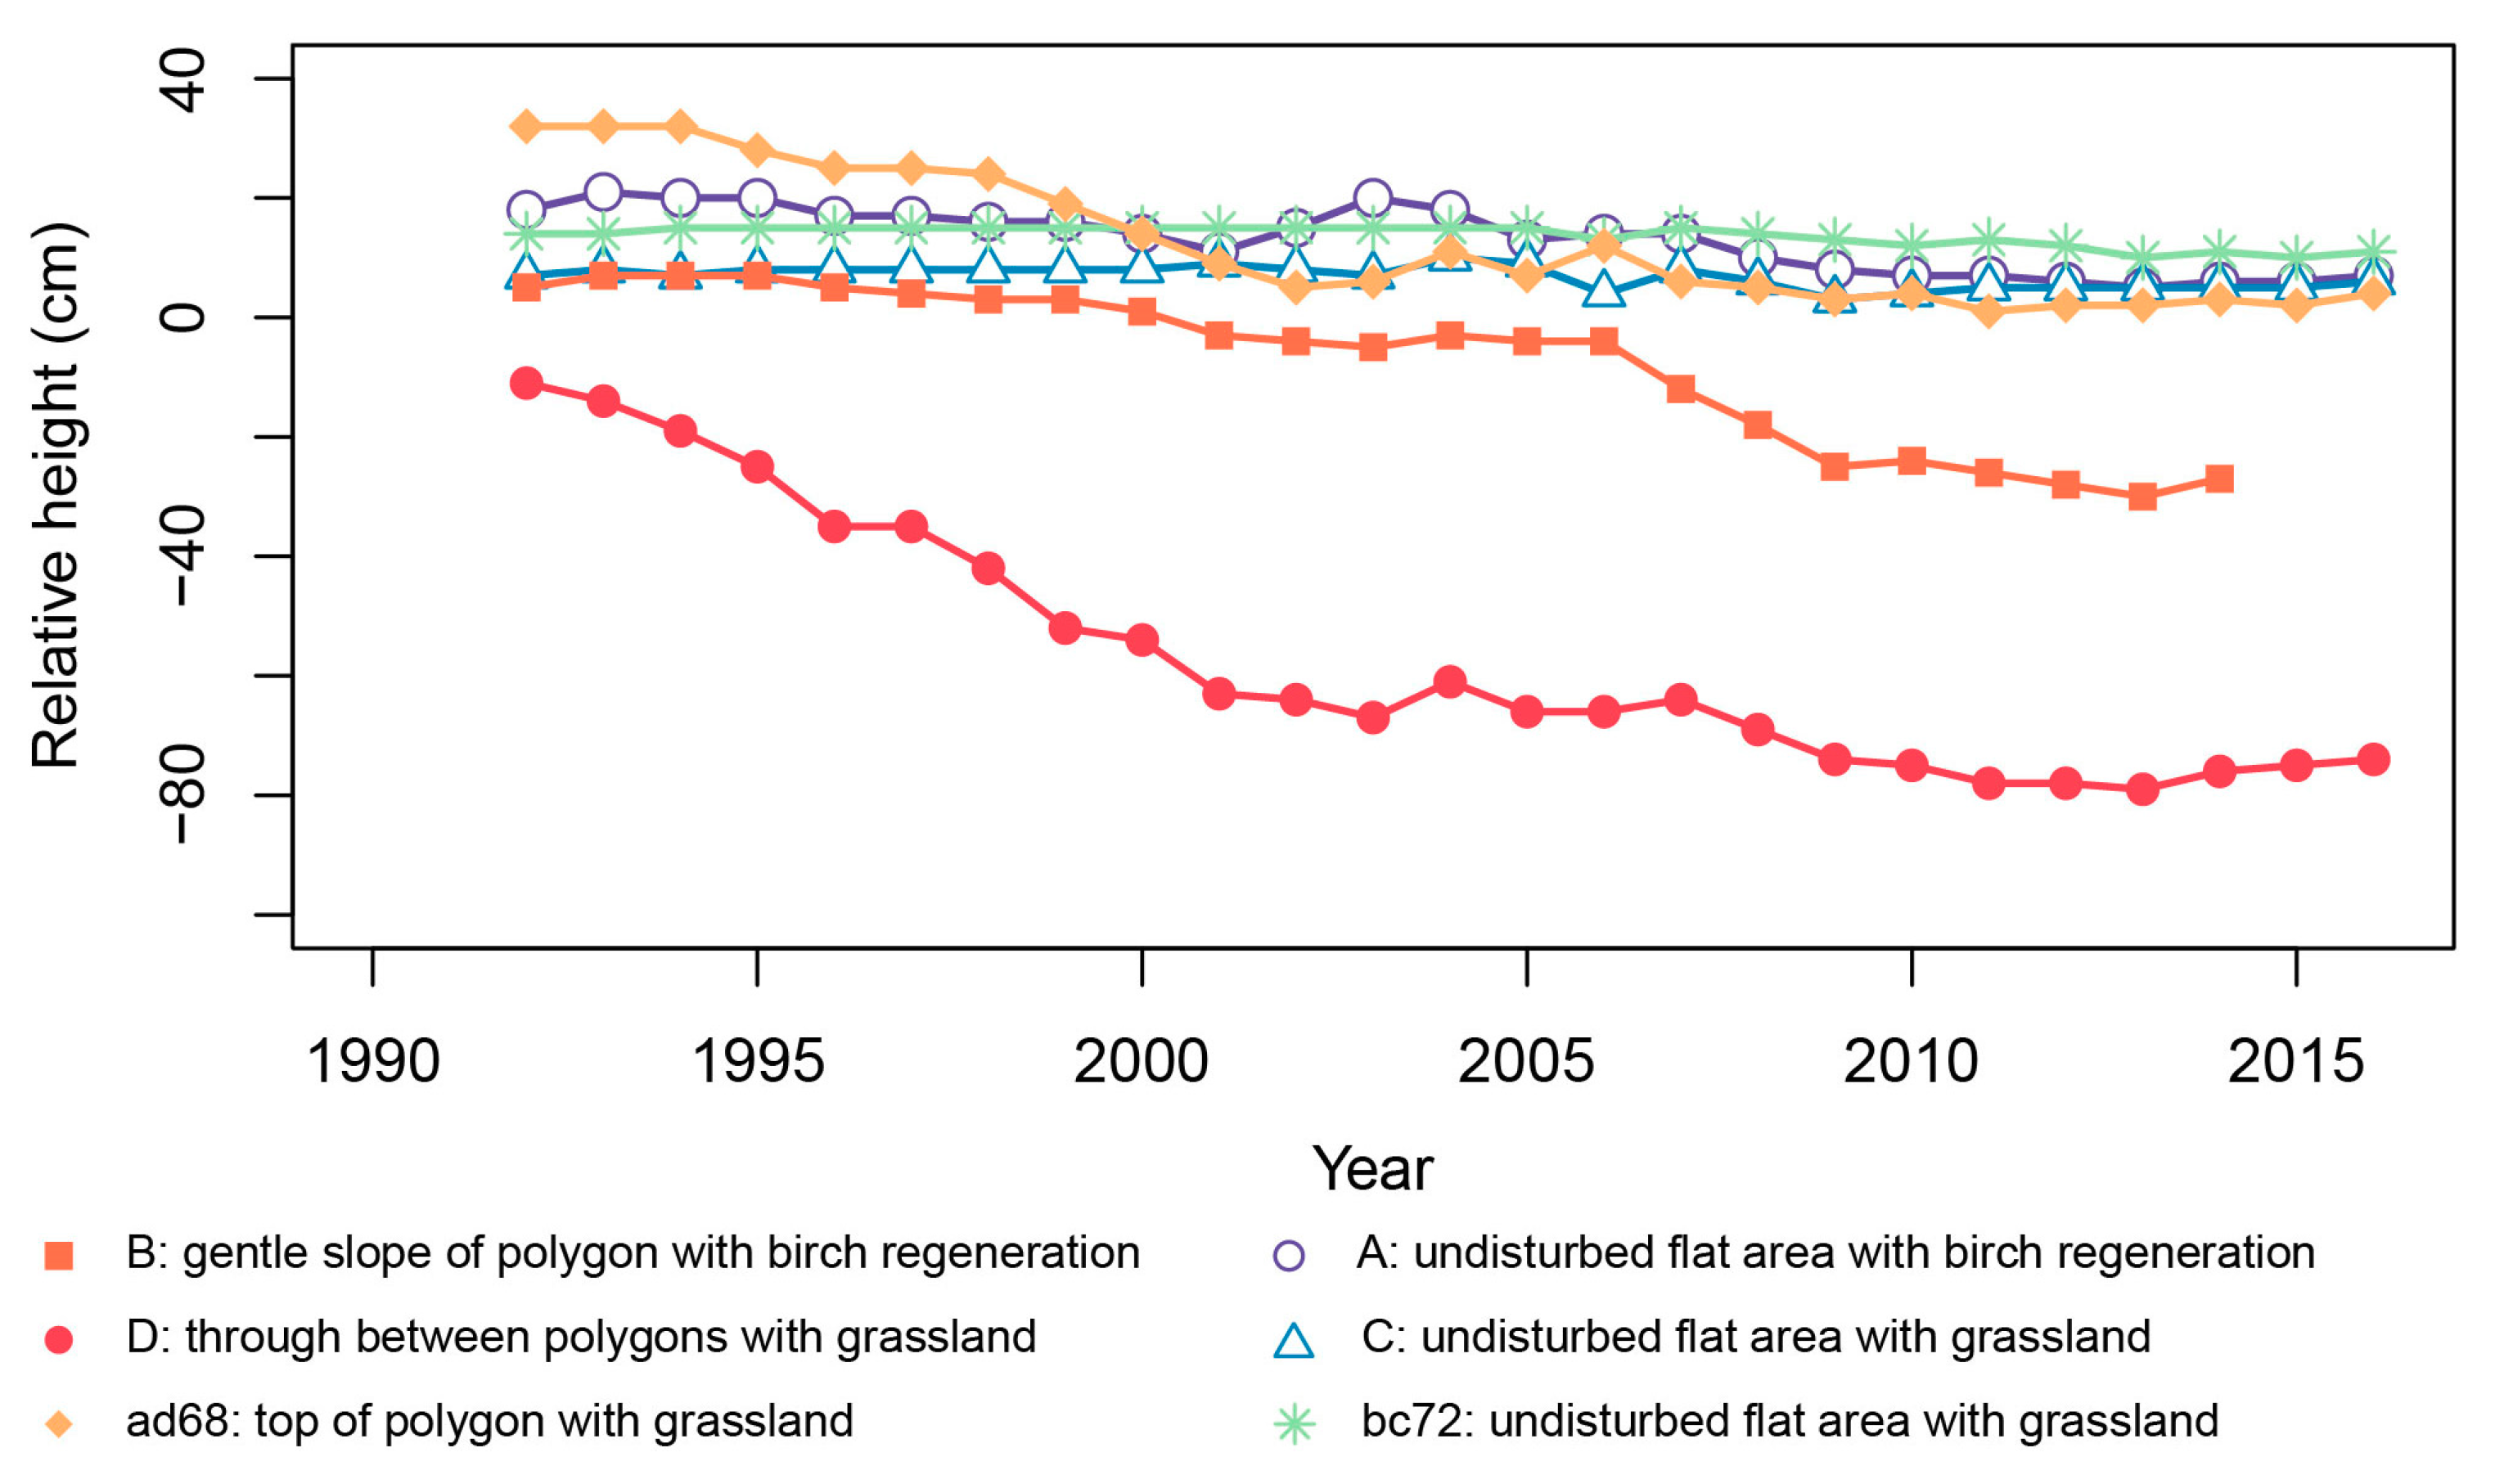
To discuss the processes of subsidence, the long-term ground measurement data by the Melnikov Permafrost Institute [17] at Yukechi in central Yakutia were obtained, which has a similar anthropogenic disturbed landscape with ice wedges (i.e., arable land that was abandoned in the 1960s) [40] and permafrost conditions similar to the Churapcha area. These data showed a subsidence rate of 1.5–7.0 cm/year during 1992–2016 (Figure 6). The undisturbed relatively stable areas, which were not directly impacted by the thermokarst depression, subsided at a mean rate of 0.2–0.6 cm/year. Regarding the trough between polygons, the subsidence rates reached a maximum of 15.0–16.0 cm/year in the initial period of about eight years from 1992, which then decreased to 5.0–7.0 cm/year. This nonlinear subsidence was explained by thermophysical processes resulting in an increasing talik under thermokarst lakes, as well as a reduction in the volumetric ice content [17].
The present study showed that the maximum subsidence rates measured in the troughs reached 7.6 cm/year and 11.9 cm/year at the disused airfield site and the abandoned arable land, respectively (Table 2). These estimated subsidence rates correspond to the field measurements at the Yukechi site. This study calculated the spatial average and the maximum subsidence rates, assuming linear subsidence, during 1990–2017 (Table 2). However, the nonlinear subsidence processes also indicate that higher rates of subsidence occurred in the study sites.
5.2. Advantages and Limitations of This Study
By using the advantages of the UAS and SfM-MVS photogrammetry technique for obtaining high-definition datasets, this study is the first to detect the distribution of polygons and related subsidence in the Churapcha region in central Yakutia. In this study, a spatial resolution of <1.0 m was needed to measure the initial stage of thermokarst landscape. Ground surveys by total station and terrestrial laser scanning, and airborne LiDAR are generally employed to obtain high-definition topographic datasets. However, these techniques are associated with time consumption, as well as high capital and logistical cost, especially in remote areas. On the other hand, the UAS and SfM-MVS photogrammetry technique is a revolutionary, low-cost, user-friendly photogrammetry technique [25], and has logistical advantages (Table 1). The technique allowed for instantaneous acquisition of high-definition datasets in the study area.
The results of this study emphasize the importance of initial topographic characteristics of thermokarst, such as polygon size, distribution, and subsidence affected by structures of ice wedges and ice contents. This study highlighted the rapid spatio-temporal subsidence rates at the typical landscape, which affected landscape changes and increased carbon emission, in central Yakutia. This study also showed the availability of the UAS and SfM-MVS photogrammetry technique to measure thermokarst landforms. The dry grassland with sparse vegetation and complex topography of the polygons in the study area were ideally suited for applying the technique. Similar thermokarst landforms are widely distributed in Siberia and the Pan-Arctic region (e.g., [23]). The UAS and SfM-MVS photogrammetry technique is, therefore, suitable for measuring thermokarst landforms in the areas.
The accuracy of orthorectified images and DTMs from SfM-MVS photogrammetry were affected by conditions of image acquisition and GCP measurements. The residual errors (root-mean-squared error) in SfM-MVS photogrammetry were 16.5 cm and 30.1 cm for the disused airfield site and the abandoned arable land, respectively. Considering the inherent uncertainty in the orthorectified images and the DTMs, the study refrained from discussing the topographic characteristics of polygons and troughs lower than the spatial scale of 30 cm. However, the average diameters of the polygons at the disused airfield site and at the abandoned arable land were 11.6 m and 7.4 m, respectively (Figure 5). The maximum and spatial average of the total subsidence at the disused airfield were 204.8 cm and 55.6 cm, while those at the abandoned arable land were 321.9 cm and 106.0 cm, respectively. Even if the uncertainty was considered, the differences between the polygon size and the total subsidence in the two study sites were significant.
This study assumed that the height of the polygons and the summit levels were reflected the original topography. The trough depth might be underestimated because a relatively dense grassland vegetation in the troughs was not fully filtered. These uncertainties resulted in the underestimation of the subsidence. Acceleration of thermokarst also caused the subsidence of polygons [17]. However, addressing the effect of polygon subsidence was difficult from the single UAS dataset available for the period considered in this study. Additionally, water-filled troughs at the abandoned arable land cannot be measured from the optical UAS images in this study. These factors imply that the actual subsidence rates were larger than our estimations.
This study demonstrated the difficulty of addressing the mechanism determining polygon size and distribution. The topography is affected by complex spatio-temporal interactions between factors such as variations in the air and ground temperatures and subsurface conditions. In addition, recent climate change and anthropogenic activity led to enhanced cryogenic degradation in central Yakutia [17,20]. Field surveys of analog morphologies in terrestrial permafrost environments are necessary to complement our findings and provide ground truth for robust UAS monitoring of thermokarst developments.
6. Conclusions
The properties of thermokarst distributions and their topographic characteristics in central Yakutia were detected using the advantages of high-definition datasets provided by the UAS and SfM-MVS photogrammetry technique. The subsidence rates were examined at a disused airfield site (3.0 ha) and an abandoned arable land (6.3 ha).
The orthorectified photographs and digital surface models with spatial resolutions of 4.0 cm and 8.0 cm for the airport and arable land, respectively, were obtained. We detected 174 and 867 high-centered polygons that developed from the 1990s at the disused airfield site and the abandoned arable land, respectively. The data showed that the polygons at the disused airfield site have an average diameter of 11.6 m and an average area of 111.2 m2, while the average diameter and average area in the abandoned arable lands were 7.4 m and 46.8 m2, respectively. The abandoned arable land is characterized by smaller polygons and a higher polygon density. This indicates that there are differences in the ice-wedge distributions for the two sites. The maximum and spatial average of the total subsidence at the disused airfield were 204.8 cm and 55.6 cm, while those at the abandoned arable land were 321.9 cm and 106.0 cm, respectively. The spatial average of subsidence corresponded to the subsidence rates of 2.1 cm/year for the disused airfield site and 3.9 cm/year for the abandoned arable land. This study demonstrated the difficulty in understanding thermokarst development in detail from a single UAS dataset. Recently, a warming climate accelerated the thermokarst development. Future studies should monitor thermokarst developments using frequent measurements with the UAS.
Author Contributions
H.S., Y.I., and A.N.F. proposed the topic, and conceived and designed the study. N.I.B. and A.N.F. carried out the field measurements and the estimation of the ice-wedge conditions and the ice contents. V.V.K. provided field survey data at Churapcha in 1988. All authors collaborated with the corresponding author in the preparation of the manuscript.
Funding
This research was funded by KAKENHI grant numbers JP 26242026 and JP 17H02031, the Arctic Challenge for Sustainability (ArCS) project, the Japan Science Technology Agency (JST) as part of the Belmont Forum CRA (COPERA project), and the Siberian branch of the RAS project IX.127.2.3.
Acknowledgments
We thank editors of the Remote Sensing journal, and anonymous reviewers for their helpful comments that improved the manuscript.
Conflicts of Interest
The authors declare no conflicts of interest.
References
- Washburn, A.L. Permafrost features as evidence of climatic change. Earth Sci. Rev. 1980, 15, 327–402. [Google Scholar] [CrossRef]
- Van Everdingen, R.O. Multi-Language Glossary of Permafrost and Related Ground-Ice Terms. International Permafrost Association, 2005. Available online: http://globalcryospherewatch.org/reference/glossary_docs/Glossary_of_Permafrost_and_Ground-Ice_IPA_2005.pdf (accessed on 8 September 2018).
- French, H.M. The Periglacial Environment, 3rd ed.; John Wiley & Sons: West Sussex, UK, 2007. [Google Scholar]
- Shur, Y.; Hinkel, K.M.; Nelson, F.E. The transient layer: Implication for geocryology and climate-change science. Permafr. Periglac. Process. 2005, 16, 5–17. [Google Scholar] [CrossRef]
- Grosse, G.; Romanovsky, V.; Jorgenson, T.; Anthony, K.W.; Brown, J.; Overduin, P.P. Vulnerability and feedbacks of permafrost to climate change. EOS Trans. AGU 2011, 92, 73–74. [Google Scholar] [CrossRef]
- Iwahana, G.; Uchida, M.; Liu, L.; Gong, W.; Meyer, F.; Guritz, R.; Yamanokuchi, T.; Hinzman, L. InSAR detection and field evidence for thermokarst after a tundra wildfire, Using ALOS-PALSAR. Remote Sens. 2016, 8, 218. [Google Scholar] [CrossRef]
- Iwahana, G.; Machimura, T.; Kobayashi, Y.; Fedorov, A.N.; Konstantinov, P.Y.; Fukuda, M. Influence of forest clear-cutting on the thermal and hydrological regime of the active layer near Yakutsk, Eastern Siberia. J. Geophys. Res. 2005, 110, G02004. [Google Scholar] [CrossRef]
- Iijima, Y.; Park, H.; Konstantinov, P.Y.; Pudov, G.G.; Fedorov, A.N. Active-Layer Thickness Measurements Using a Handheld Penetrometer at Boreal and Tundra Sites in Eastern Siberia. Permafr. Periglac. Process. 2017, 28, 306–313. [Google Scholar] [CrossRef]
- Crate, S.; Ulrich, M.; Habeck, J.O.; Desyatkin, A.R.; Desyatkin, R.V.; Fedorov, A.N.; Hiyama, T.; Iijima, Y.; Ksenofontov, S.; Mészáros, C.; et al. Permafrost livelihoods: A transdisciplinary review and analysis of thermokarst-based systems of indigenous land use. Anthropocene 2017, 18, 89–104. [Google Scholar] [CrossRef]
- Dubikov, G.I.; Aksenov, V.I.; Koreisha, M.M.; Murzaeva, V.E.; Poznanin, V.L.; Rivkin, F.M. Geocryological Glossary; GEOS: Moscow, Russia, 2003. (In Russian) [Google Scholar]
- Strauss, J.; Schirrmeistera, L.; Grosse, G.; Fortier, D.; Hugelius, G.; Knoblauch, C.; Romanovsky, V.; Schädelg, C.; von Deimling, T.S.; Schuur, E.A.G.; et al. Deep Yedoma permafrost: A synthesis of depositional characteristics and carbon vulnerability. Earth-Sci. Rev. 2017, 172, 75–86. [Google Scholar] [CrossRef]
- Efimov, A.I.; Grave, N.A. Buried ice of Abalakh lake area, Socialist construction. Yakutsk 1940, 10–11, 65–78. (In Russian) [Google Scholar]
- Soloviev, P.A. Permafrost of Northern Part of the Lena-Amga Interfluve; USSR Academy of Sciences: Moscow, Russia, 1959. (In Russian) [Google Scholar]
- Mil’kov, F.N. Dictionary-Reference on Physical Geography; Moscow: Mysl, Russia, 1970; 344p. (In Russian) [Google Scholar]
- Smith, L.C.; Sheng, Y.; MacDonald, G.M.; Hinzman, L.D. Disappearing arctic lakes. Science 2005, 308, 1429. [Google Scholar] [CrossRef] [PubMed]
- Schuur, E.A.G.; McGuire, A.D.; Schädel, C.; Grosse, G.; Harden, J.W.; Hayes, D.J.; Hugelius, G.; Koven, C.D.; Kuhry, P.; Lawrence, D.M.; et al. Climate change and the permafrost carbon feedback. Nature 2015, 520, 171–179. [Google Scholar] [CrossRef] [PubMed]
- Fedorov, A.N.; Gavriliev, P.P.; Konstantinov, P.Y.; Hiyama, T.; Iijima, Y.; Iwahana, G. Estimating the water balance of a thermokarst lake in the middle of the Lena River basin, eastern Siberia. Ecohydrology 2014, 7, 188–196. [Google Scholar] [CrossRef]
- Lopez Caceres, M.L.; Takakai, F.; Iwahana, G.; Fedorov, A.N.; Iijima, Y.; Hatano, R.; Fukuda, M. Snowmelt and the hydrological interaction of forest–grassland ecosystems in Central Yakutia, eastern Siberia. Hydrol. Process. 2015, 29, 3074–3083. [Google Scholar] [CrossRef]
- Skachkov, Y.B. Climate change trends in Central Yakutia at the turn of the 20th to 21st century. In Regional Environmental Response to Global Change: North-Earstern and Central Asia, Proceedings of the International Scientific Conference, Irkutsk, Russia, 17–21 September 2012; V.B. Sochava Institute of Geography SB RAS Publisher: Irkutsk, Russia, 2012; Volume 1, pp. 236–238. (In Russian) [Google Scholar]
- Iijima, Y.; Fedorov, A.N.; Park, H.; Suzuki, K.; Yabuki, H.; Maximov, T.C.; Ohata, T. Abrupt increases in soil temperature following increased precipitation in a permafrost region, central Lena River basin, Russia. Permafr. Periglac. Process. 2010, 21, 30–41. [Google Scholar] [CrossRef]
- Fedorov, A.; Konstantinov, P. Observations of surface dynamics with thermokarst initiation, Yukechi site, Central Yakutia. In Proceedings of the 8th International Conference on Permafrost, Zurich, Switzerland, 21–25 July 2003; AA Balkema: Lisse, The Netherlands, 2003; pp. 239–243. [Google Scholar]
- Günther, F.; Overduin, P.P.; Yakshina, I.A.; Opel, T.; Baranskaya, A.V.; Grigoriev, M.N. Observing Muostakh disappear: Permafrost thaw subsidence and erosion of a ground-ice-rich island in response to arctic summer warming and sea ice reduction. Cryosphere 2015, 9, 151–178. [Google Scholar] [CrossRef] [Green Version]
- Liljedahl, A.K.; Boike, J.; Daanen, R.P.; Fedorov, A.N.; Frost, G.V.; Grosse, G.; Hinzman, L.D.; Iijima, Y.; Jorgenson, J.C.; Matveyeva, N.; et al. Pan-Arctic ice-wedge degradation in warming permafrost and its influence on tundra hydrology. Nat. Geosci. 2016, 9, 312. [Google Scholar] [CrossRef]
- Liu, L.; Schaefer, K.M.; Chen, A.C.; Gusmeroli, A.; Zebker, H.A.; Zhang, T. Remote sensing measurements of thermokarst subsidence using InSAR. J. Geophys. Res. Earth Surf. 2015, 120, 1935–1948. [Google Scholar] [CrossRef]
- Westoby, M.J.; Brasington, J.; Glasser, N.F.; Hambrey, M.J.; Reynolds, J.M. ‘Structure-from-Motion’ photogrammetry: A low-cost, effective tool for geoscience applications. Geomorphology 2012, 179, 300–314. [Google Scholar] [CrossRef] [Green Version]
- Saito, H.; Uchiyama, S.; Obanawa, H.; Hayakawa, Y.S. Landslides triggered by an earthquake and heavy rainfalls at Aso volcano, Japan, detected by UAS and SfM-MVS photogrammetry. Prog. Earth Planet. Sci. 2018, 5, 15. [Google Scholar] [CrossRef]
- Karavaev, M.N. Paleogeographic reconstruction of landscapes of the Central Yakutian plain in the Cenozoic. Rep. Acad. Sci. USSR 1955, 102, 797–800. (In Russian) [Google Scholar]
- Krasyuk, A.A. The Soils of the Lena-Aldan Watershed. Materials of the Commission to Explore YASSR; Publishing House of the Academy of Sciences of the USSR: Moscow, Russia, 1927; 176p. (In Russian) [Google Scholar]
- Elovskaya, L.G. Classification and Diagnosis of Yakutia Permafrost Soils; Yakutian Section of the Siberian Branch of the Academy of Science USSR: Yakutsk, Russia, 1987; 172p. (In Russian) [Google Scholar]
- Gasanov, S.S. Estimating of the volumetric macro ice bodies content of permafrost in the development of placer deposit. Kolyma 1969, 6, 41–42. (In Russian) [Google Scholar]
- Scientific and Applied Reference Book on the Climate of the USSR; Issue 24, Yakut ASSR, Book 1; Gidrometeoizdat: Leningrad, Russia, 1989; 608p. (In Russian)
- Ivanov, M.S. The Cryogenic Structure of Quarternary Deposits of the Leno-Aldan Depression; Nauka: Novosibirsk, Russia, 1984; 125p. (In Russian) [Google Scholar]
- Fedorov, A.N.; Konstantinov, P.Y. Recent changes in ground temperature and the effect on permafrost landscapes in Central Yakutia. In Proceedings of the Ninth International Conference on Permafrost, University of Alaska Fairbanks, 29 June–3 July 2008; Kane, D.L., Hinkel, K.M., Eds.; Institute of Northern Engineering, University of Alaska Fairbanks: Fairbanks, AK, USA, 2008; pp. 433–438. [Google Scholar]
- Gavriliev, P.P.; Ugarov, I.S. Reaction of Central Yakutian ice complex on climate warming. Earth Cryosphere 2009, XIII, 24–30. (In Russian) [Google Scholar]
- Ulrich, M.; Hauber, E.; Herzschuh, U.; Härtel, S.; Schirrmeister, L. Polygon pattern geomorphometry on Svalbard (Norway) and western Utopia Planitia (Mars) using high-resolution stereo remote-sensing data. Geomorphology 2011, 134, 197–216. [Google Scholar] [CrossRef] [Green Version]
- Kühni, A.; Pfiffner, O. The relief of the Swiss Alps and adjacent areas and its relation to lithology and structure: Topographic analysis from a 250-m DEM. Geomorphology 2001, 41, 285–307. [Google Scholar] [CrossRef]
- Saito, H.; Nakayama, D.; Matsuyama, H. Comparison of landslide susceptibility based on a decision-tree model and actual landslide occurrence: The Akaishi Mountains, Japan. Geomorphology 2009, 109, 108–121. [Google Scholar] [CrossRef]
- James, L.A.; Hodgson, M.E.; Ghoshal, S.; Latiolais, M.M. Geomorphic change detection using historic maps and DEM differencing: The temporal dimension of geospatial analysis. Geomorphology 2012, 137, 181–198. [Google Scholar] [CrossRef]
- Romanovsky, N.N. Formation of Polygonal-Wedge Structures; Nauka Press: Novosibirsk, Russia, 1977. (In Russian) [Google Scholar]
- Ulrich, M.; Matthes, H.; Schirrmeister, L.; Schütze, J.; Park, H.; Iijima, Y.; Fedorov, A.N. Differences in behavior and distribution of permafrost-related lakes in Central Yakutia and their response to climatic drivers. Water Resour. Res. 2017, 53, 1167–1188. [Google Scholar] [CrossRef] [Green Version]
Figure 1.
Location and land use classification of the study area. A disused airfield site and an abandoned arable land in the Churapcha region were analyzed.
Figure 1.
Location and land use classification of the study area. A disused airfield site and an abandoned arable land in the Churapcha region were analyzed.

Figure 2.
Photographs of the study areas. Aerial photographs of (a) the disused airfield site and (b) the abandoned arable land. The ground level photographs at the disused airfield site taken in (c) 1988 and (d) 2016; (e) shows the study area in August 1969 taken by the Corona satellite system provided by the United States Geological Survey.

Figure 3.
Results for the disused airfield site. (a) Orthorectified images with a spatial resolution of 4.0 cm; (b) digital surface models (DTMs) with a spatial resolution of 8.0 cm; (c) the distribution of the polygons (blue polygons); and (d) the total subsidence, estimated from the differences between the summit-level topography and the DTMs. (e) Comparison of the DTMs and ground leveling along the 100-m transect line (A–B in (b)). The dashed black rectangle shows the study area. Black rectangles in (a) show the location of the ground control points (GCPs).
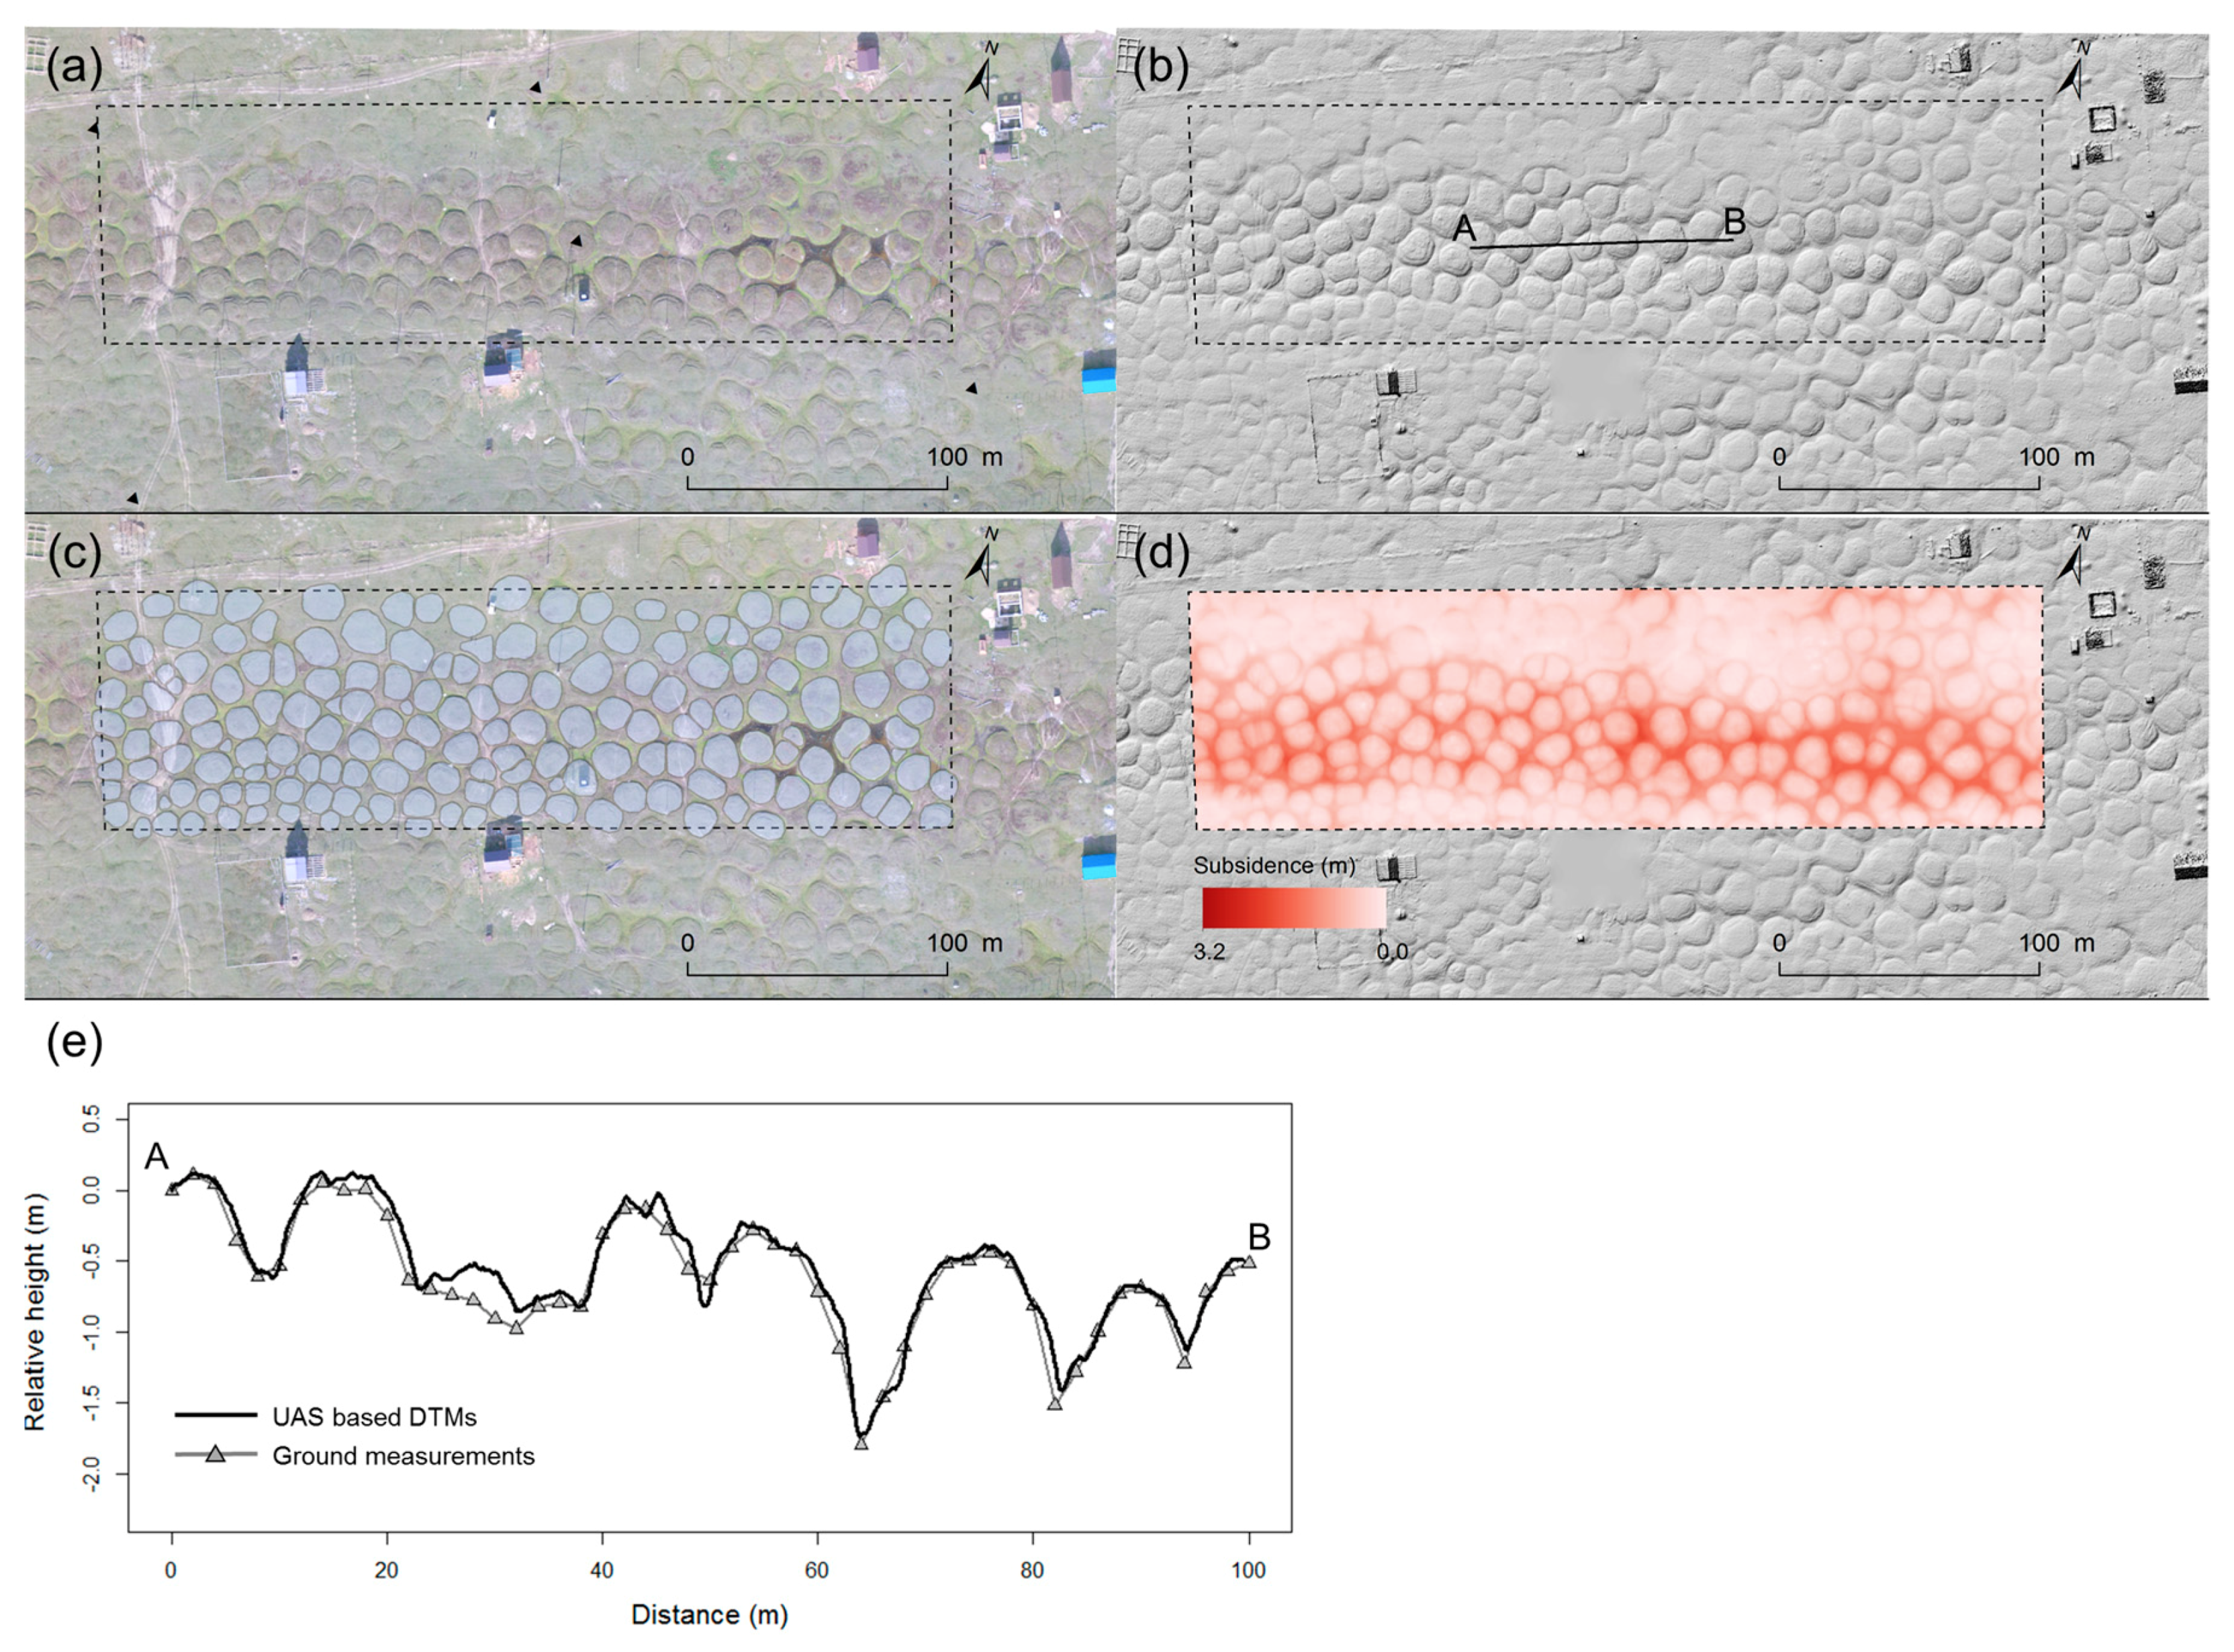
Figure 4.
Results for the abandoned arable land. (a) Orthorectified images with a spatial resolution of 4.0 cm; (b) DTMs with a spatial resolution of 8.0 cm; (c) the distribution of the high-centered polygons (blue polygons); and (d) the total subsidence, estimated from the differences between the summit-level topography and the DTMs. The dashed black rectangle shows the study area. Black rectangles in (a) show the location of the GCPs.
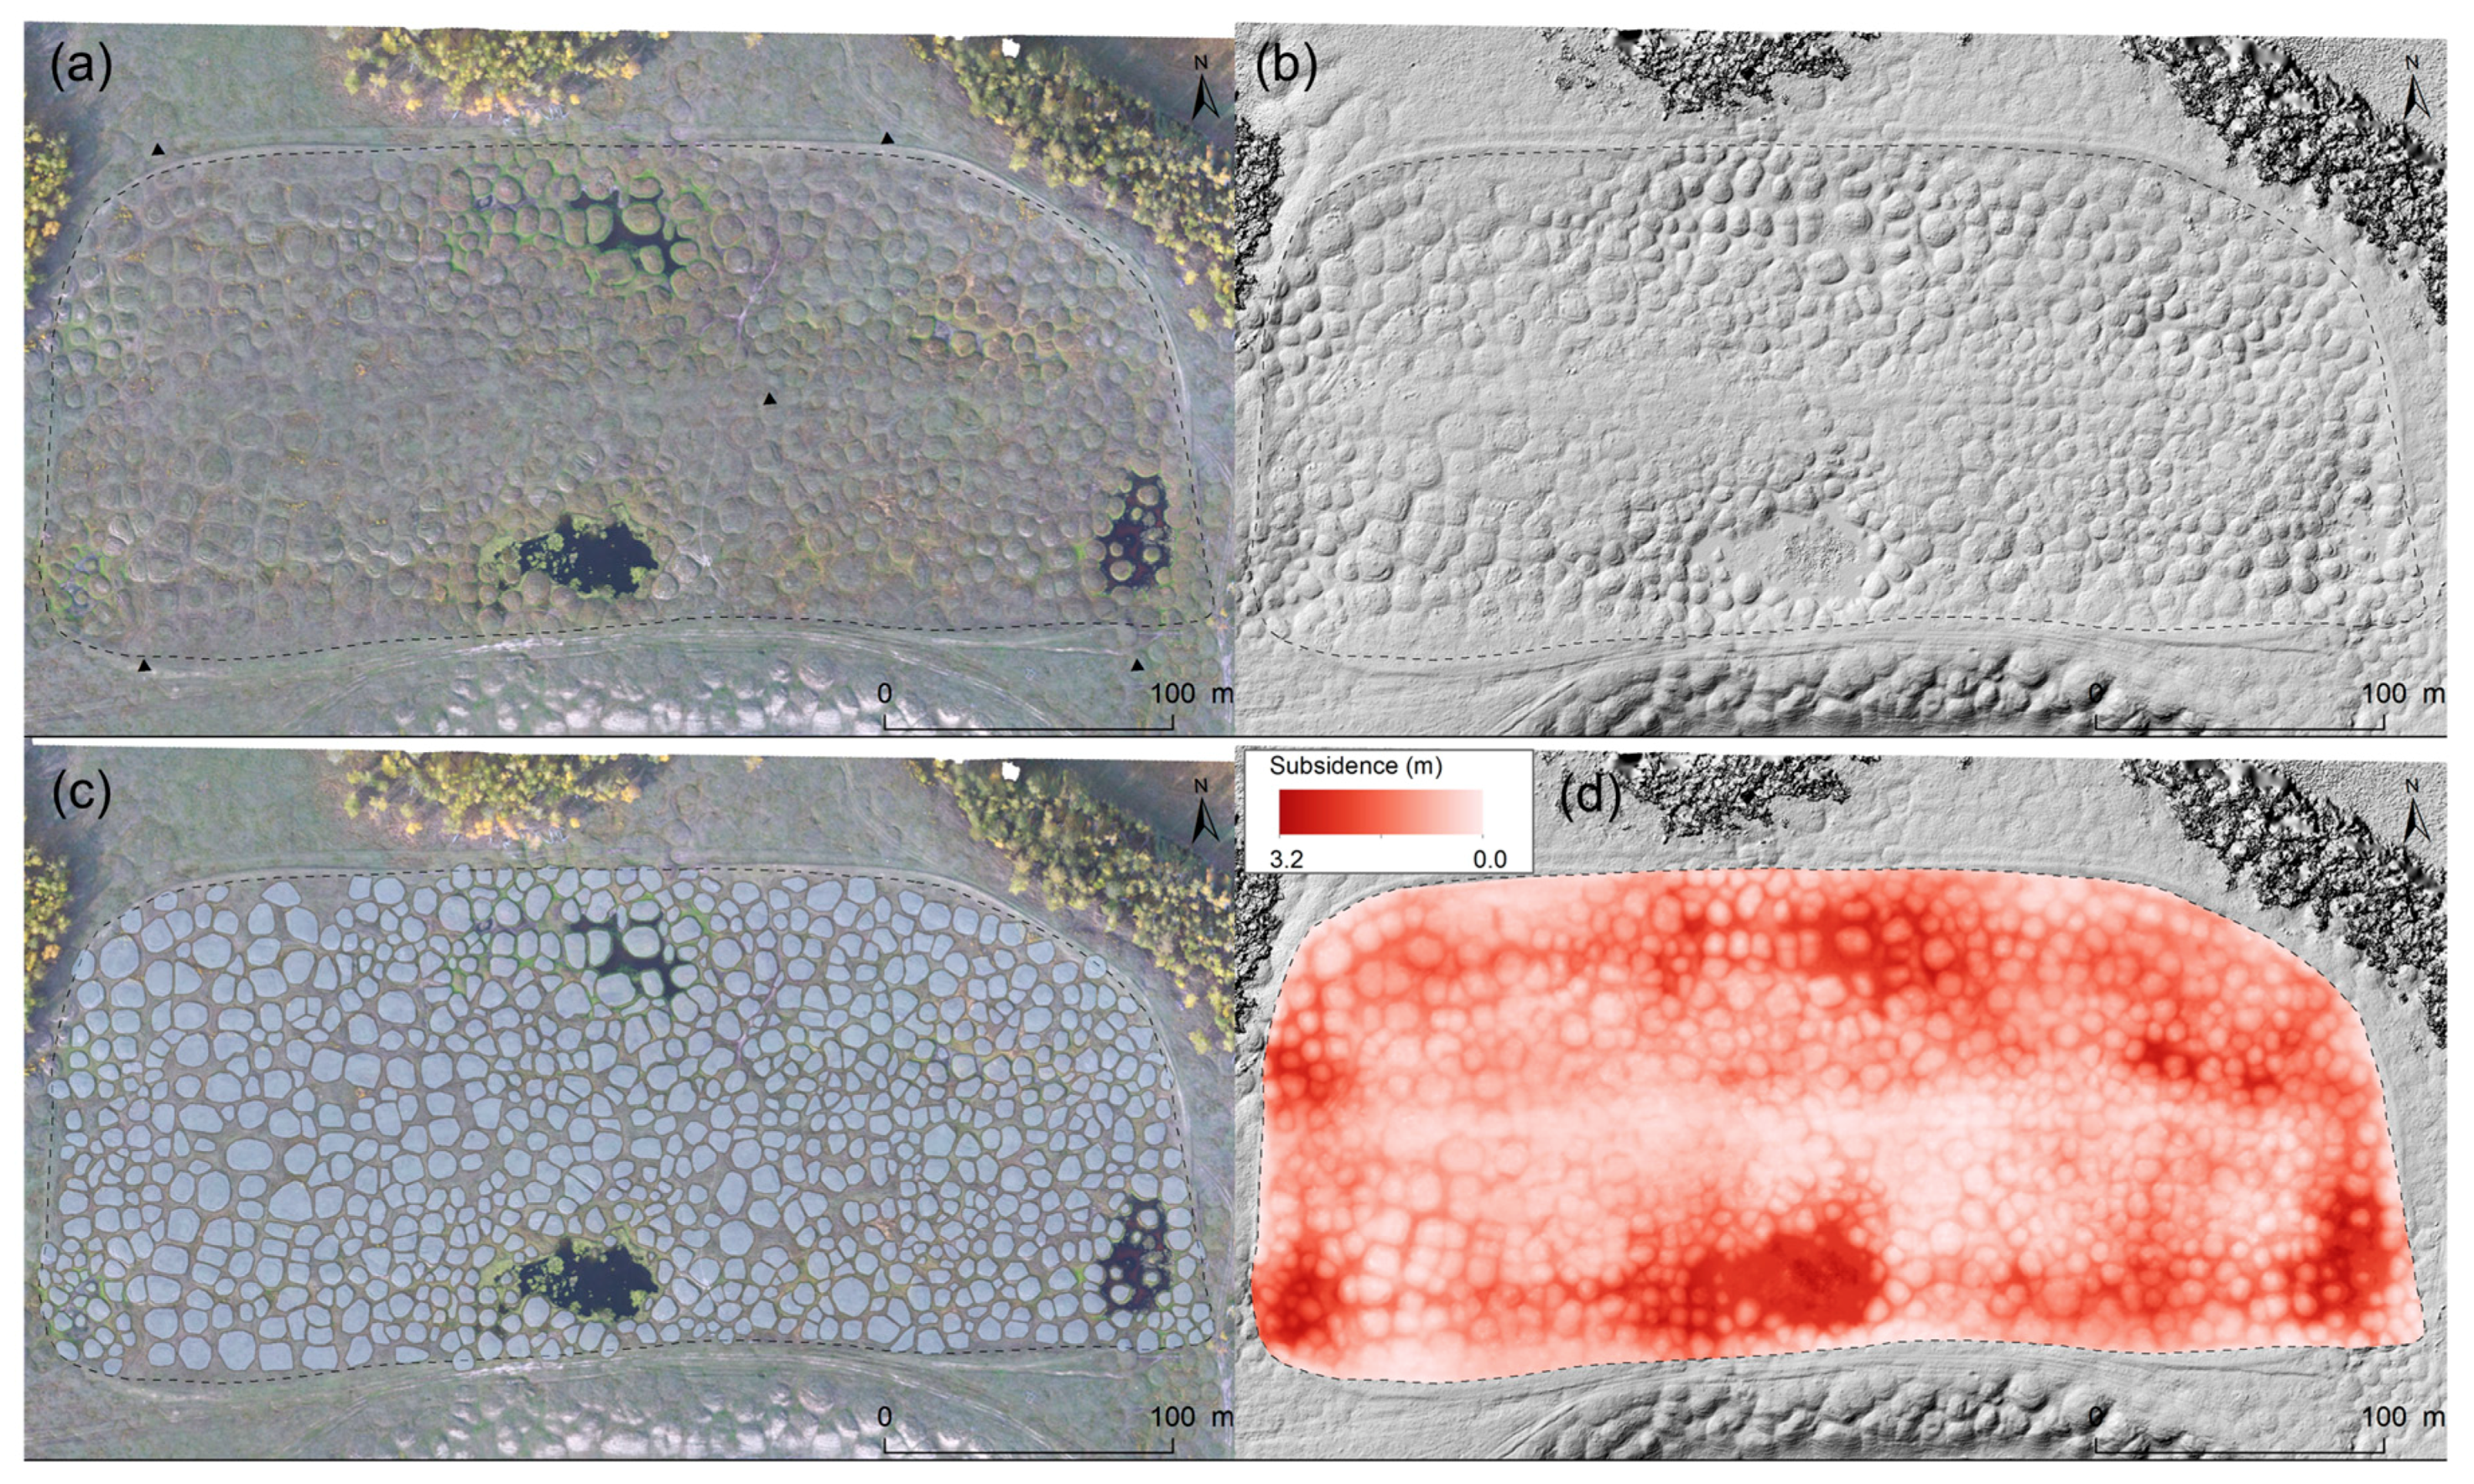
Figure 5.
Frequency density distribution of the polygon diameters at the disused airfield site (black line) and at the abandoned arable land site (dashed gray line).
Figure 5.
Frequency density distribution of the polygon diameters at the disused airfield site (black line) and at the abandoned arable land site (dashed gray line).

Figure 6.
Surface subsidence rates at Yukechi in central Yakutia during 1992–2016, measured by the Melnikov Permafrost Institute in landscapes with ice wedges [17]. Markers B, D, and ad68 were observed in areas with subsidence starting during 1990–2016, while markers A, C, and bc72 were observed in undisturbed relatively stable areas.

Table 1.
General information related to the unmanned aerial system (UAS), camera, and the global navigation satellite system (GNSS).
Table 1.
General information related to the unmanned aerial system (UAS), camera, and the global navigation satellite system (GNSS).
| UAS model | DJI Phantom4 |
| Airplane type | Rotorcraft |
| Weight | 1380 g |
| Max. duration of flight | Approx. 28 min. |
| Camera sensor | 1/2.3″ CMOS |
| Number of pixels | 12.4 M |
| GNSS receiver | EMLID Reach RTK |
| Frequency band | GPS L1, QZSS L1 |
Table 2.
Statistics of the topographic characteristics and subsidence at the disused airfield site and the abandoned arable land.
Table 2.
Statistics of the topographic characteristics and subsidence at the disused airfield site and the abandoned arable land.
| Study Area | Disused Airfield Site | Abandoned Arable Land | |
|---|---|---|---|
| Analyzed area (ha) | 3.0 | 6.3 | |
| Polygons | n = | 174 | 867 |
| density (/ha) | 57.6 | 137.8 | |
| Polygon area (m2) | minimum | 14.6 | 5.9 |
| average | 111.2 | 46.8 | |
| median | 116.0 | 40.4 | |
| maximum | 248.5 | 174.1 | |
| SD | 43.7 | 26.0 | |
| Diameter (m) | minimum | 4.3 | 2.7 |
| average | 11.6 | 7.4 | |
| median | 12.2 | 7.2 | |
| maximum | 17.8 | 14.9 | |
| SD | 2.5 | 2.0 | |
| Total subsidence (cm) | spatial average | 55.6 | 106.0 |
| maximum | 204.8 | 321.9 | |
| Total volume of subsidence (m3) | 1.7 × 10⁴ | 6.7 × 10⁴ | |
| Subsidence rate | spatial average | 2.1 | 3.9 |
| (1990–2017, cm/year) | maximum | 7.6 | 11.9 |
© 2018 by the authors. Licensee MDPI, Basel, Switzerland. This article is an open access article distributed under the terms and conditions of the Creative Commons Attribution (CC BY) license (http://creativecommons.org/licenses/by/4.0/).
Share and Cite
MDPI and ACS Style
Saito, H.; Iijima, Y.; Basharin, N.I.; Fedorov, A.N.; Kunitsky, V.V. Thermokarst Development Detected from High-Definition Topographic Data in Central Yakutia. Remote Sens. 2018, 10, 1579. https://doi.org/10.3390/rs10101579
AMA Style
Saito H, Iijima Y, Basharin NI, Fedorov AN, Kunitsky VV. Thermokarst Development Detected from High-Definition Topographic Data in Central Yakutia. Remote Sensing. 2018; 10(10):1579. https://doi.org/10.3390/rs10101579
Chicago/Turabian StyleSaito, Hitoshi, Yoshihiro Iijima, Nikolay I. Basharin, Alexander N. Fedorov, and Viktor V. Kunitsky. 2018. "Thermokarst Development Detected from High-Definition Topographic Data in Central Yakutia" Remote Sensing 10, no. 10: 1579. https://doi.org/10.3390/rs10101579
Note that from the first issue of 2016, this journal uses article numbers instead of page numbers. See further details here.