Machine Learning-Based Slum Mapping in Support of Slum Upgrading Programs: The Case of Bandung City, Indonesia


Abstract
:
1. Introduction
1.1. Background
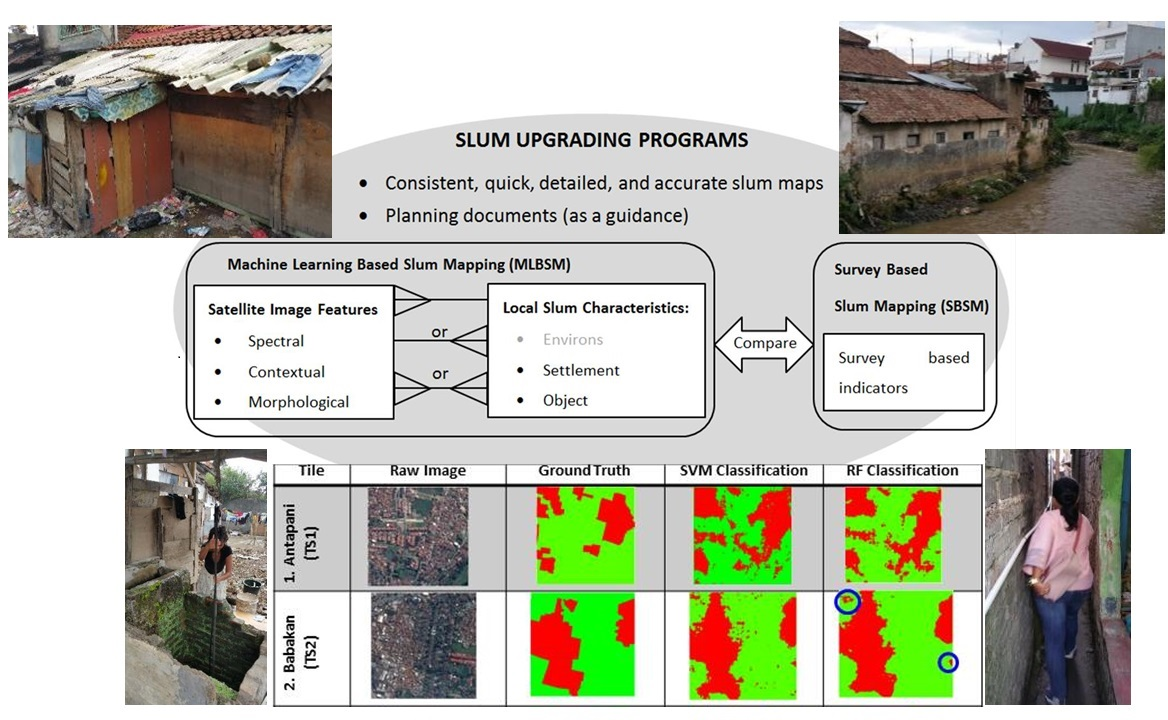
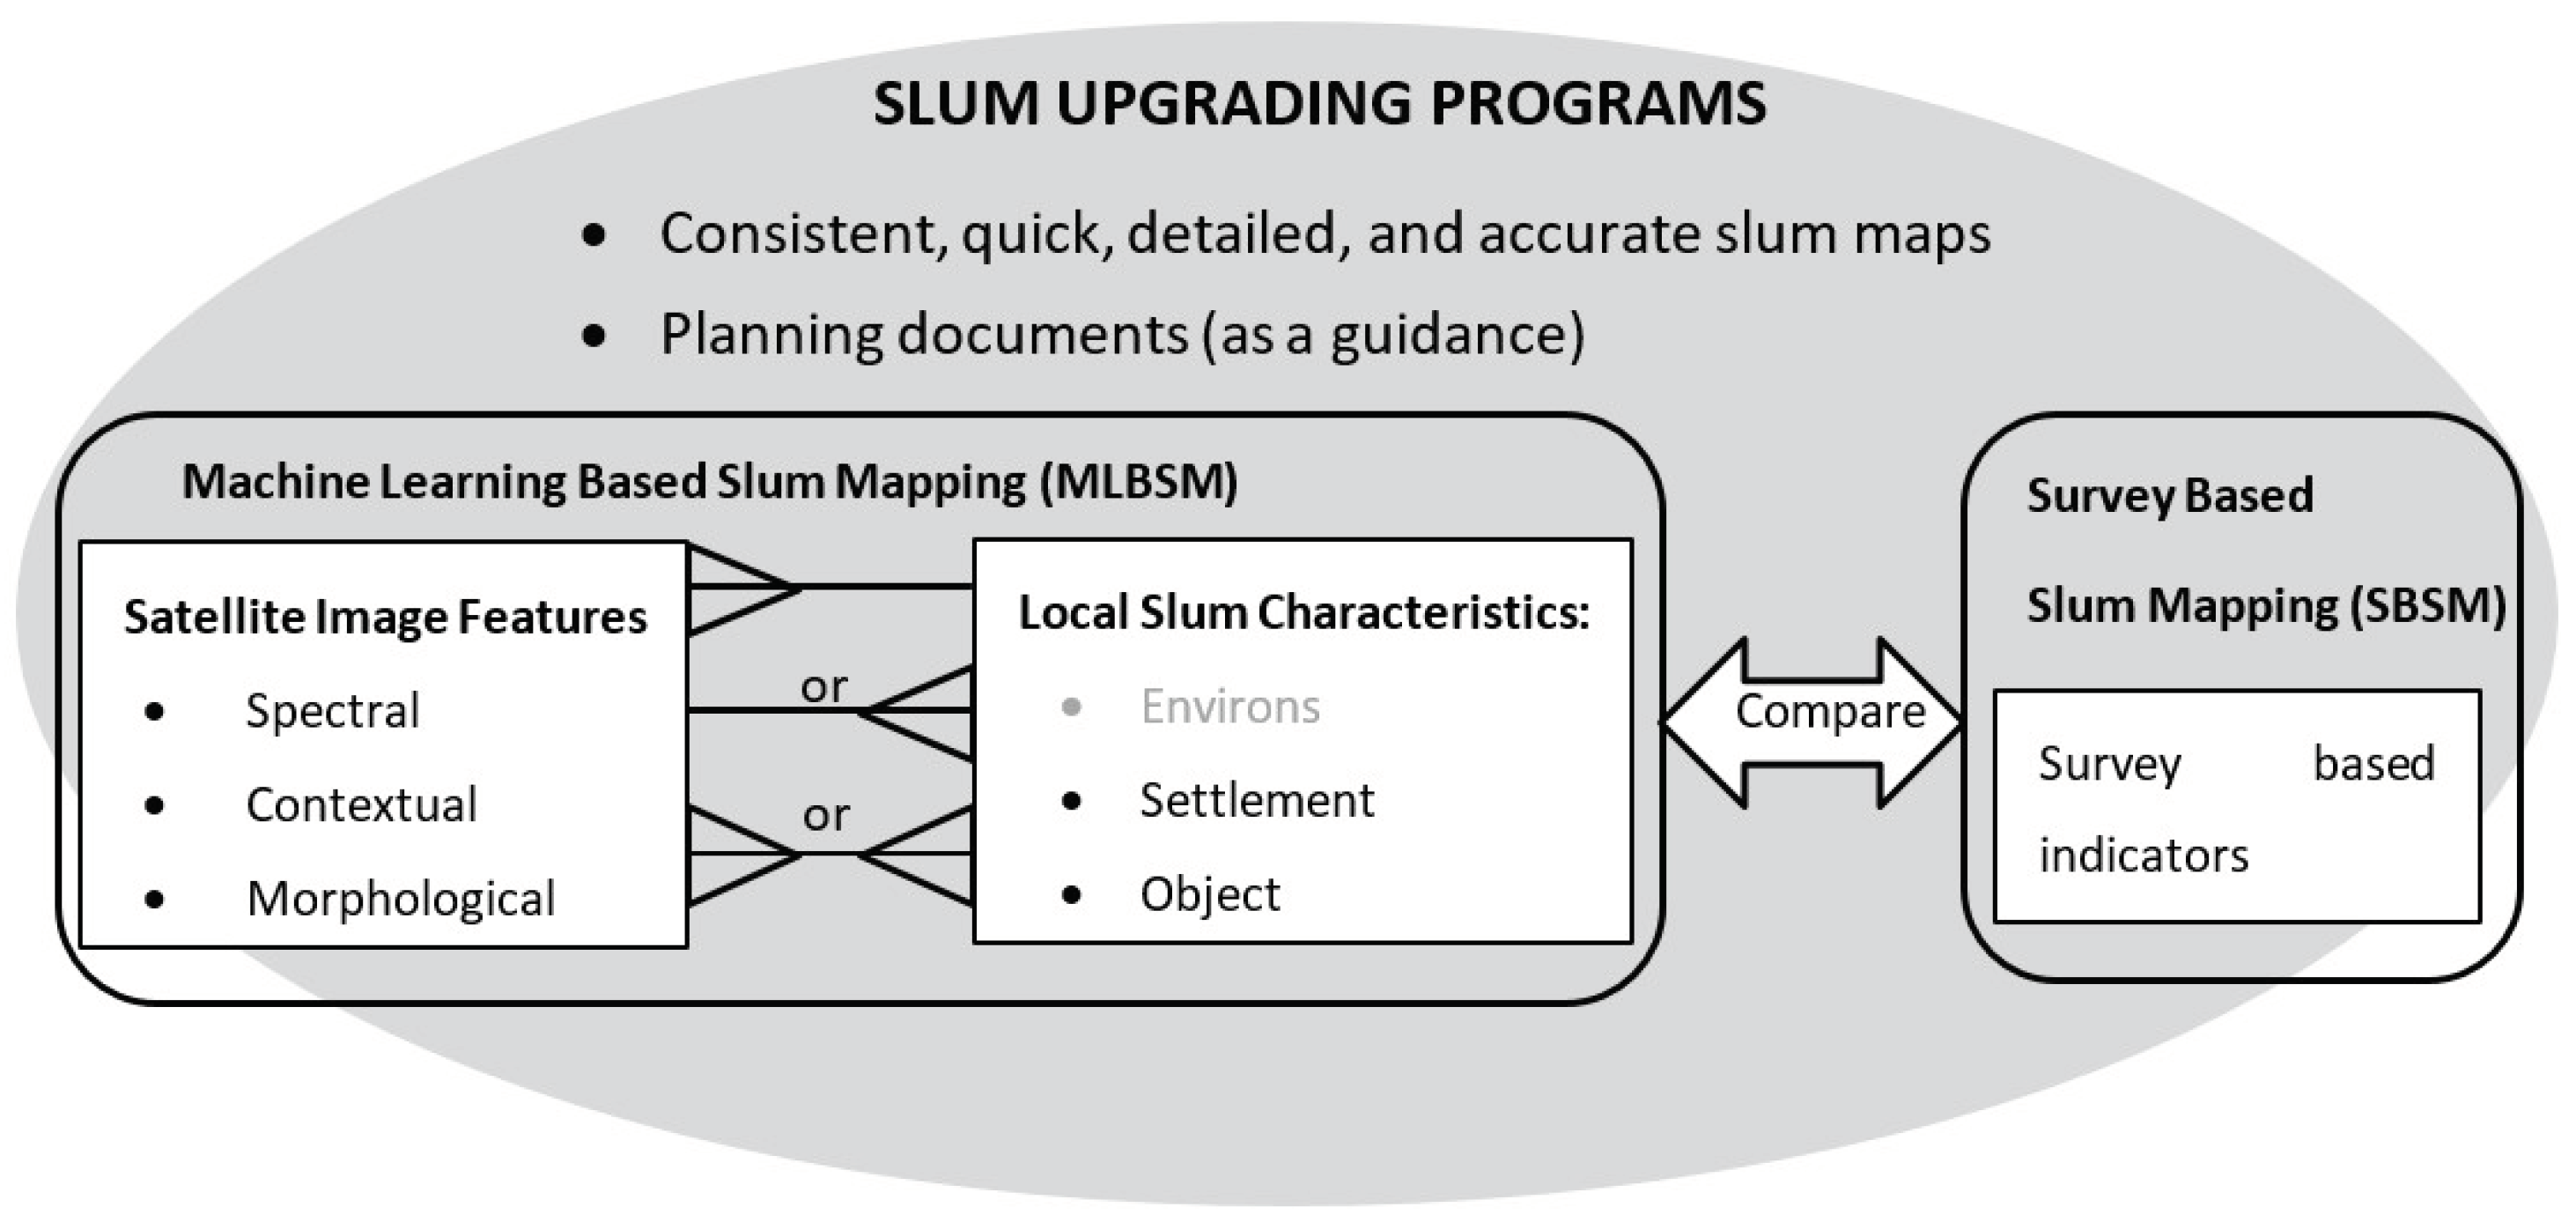
1.2. Conceptual Framework
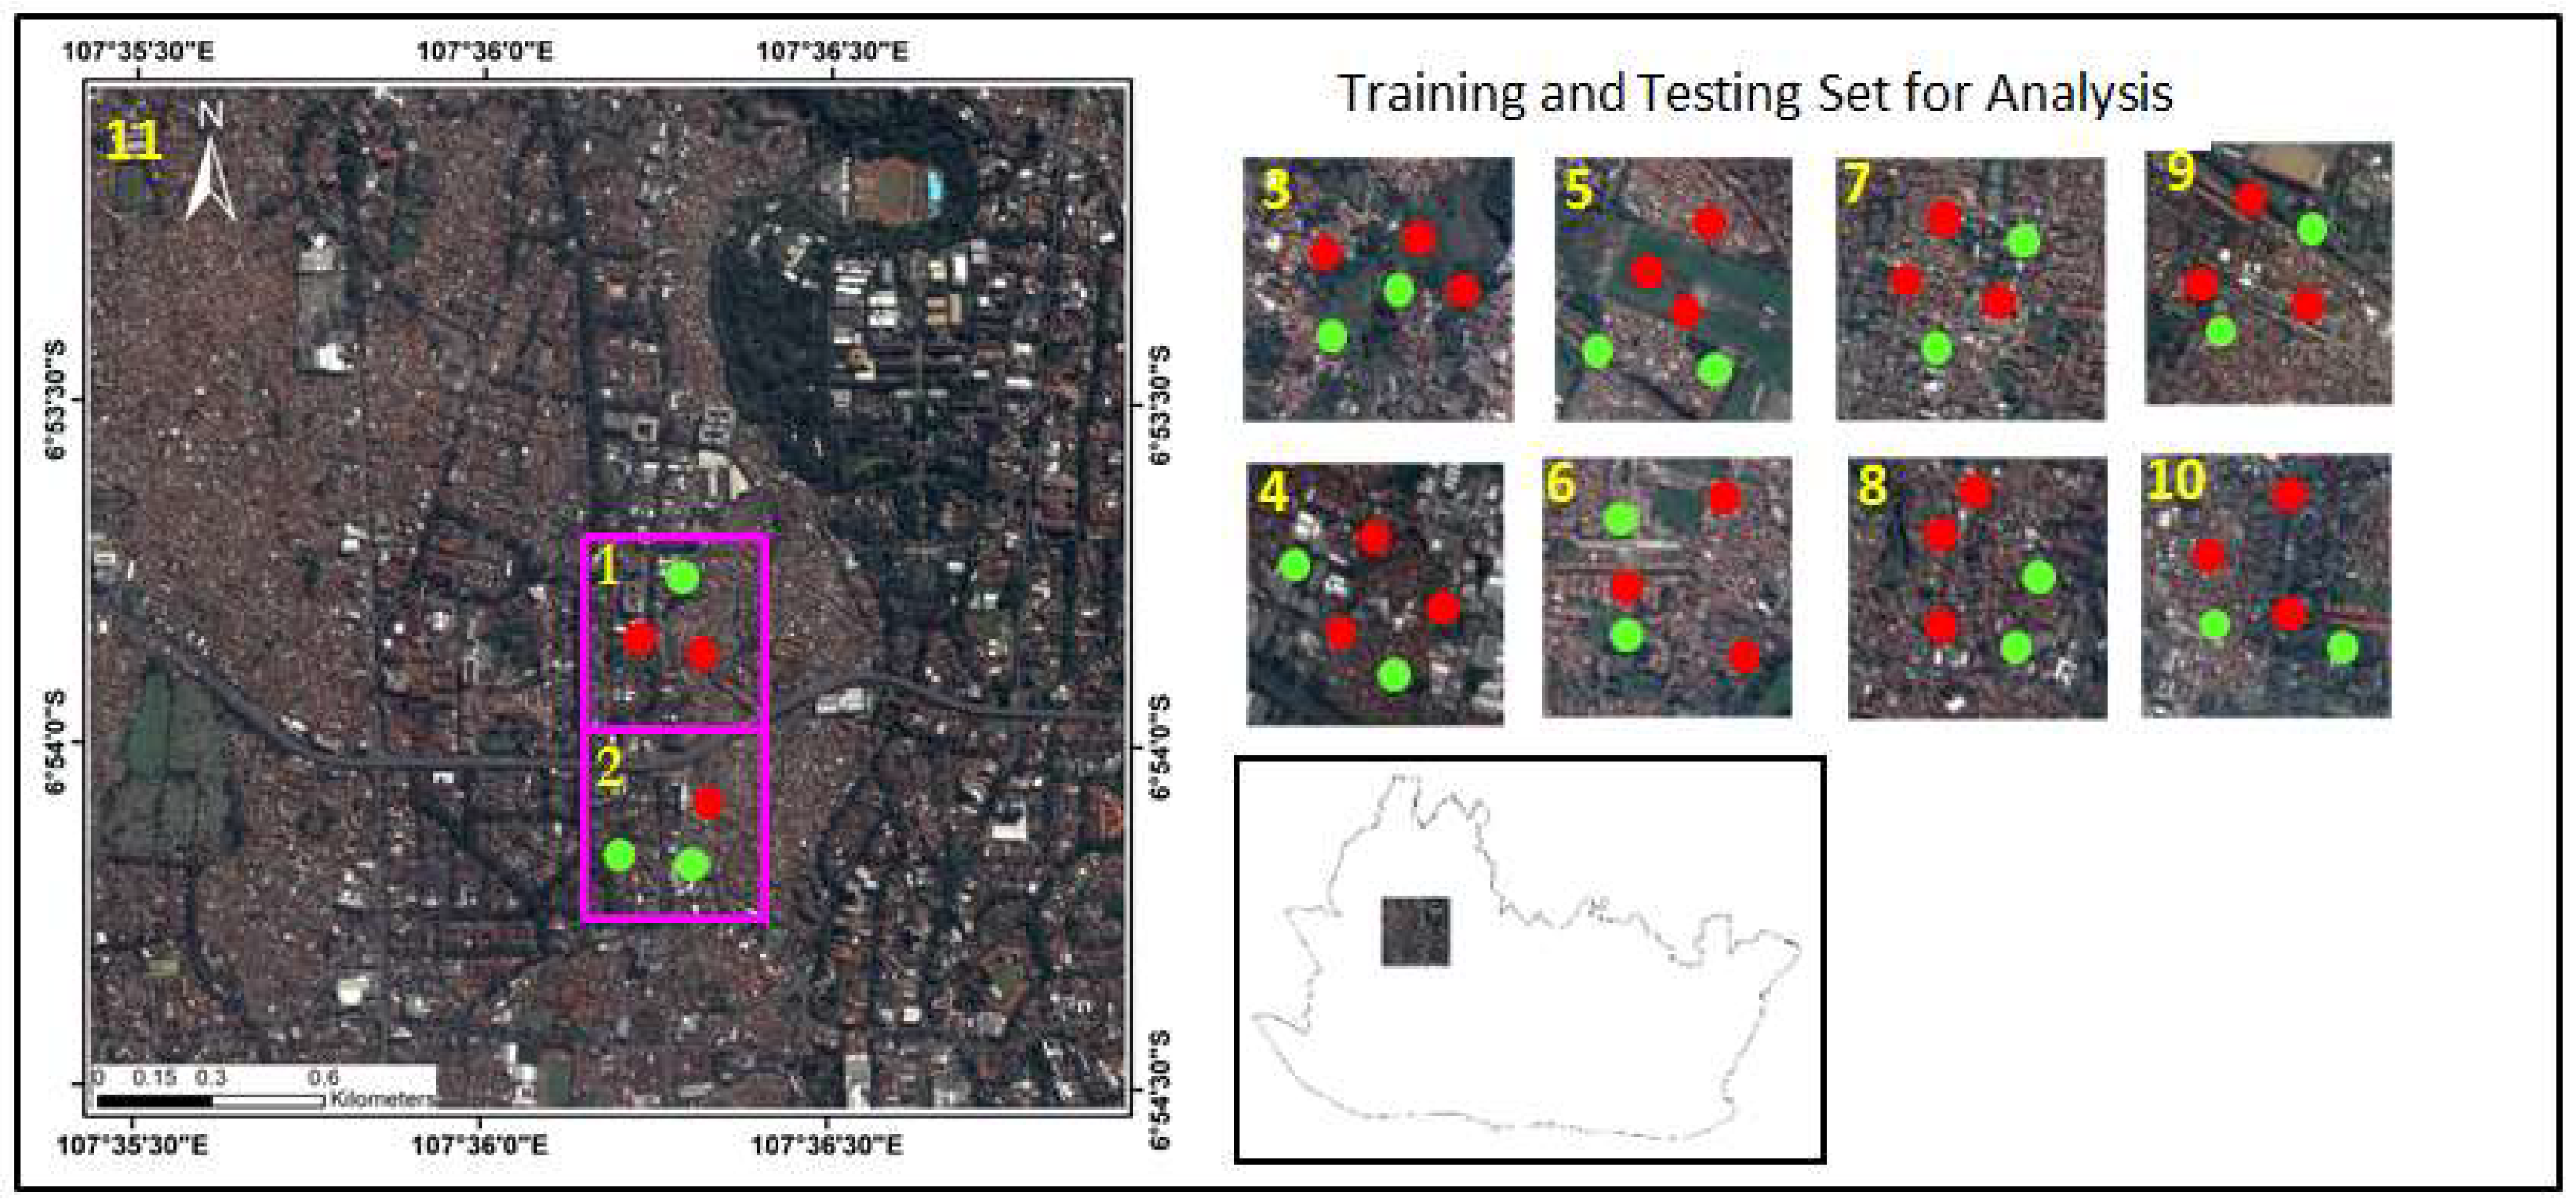
1.3. Study Area
2. Methodology
2.1. Material
2.2. Bandung Slum Characteristics and Image Features
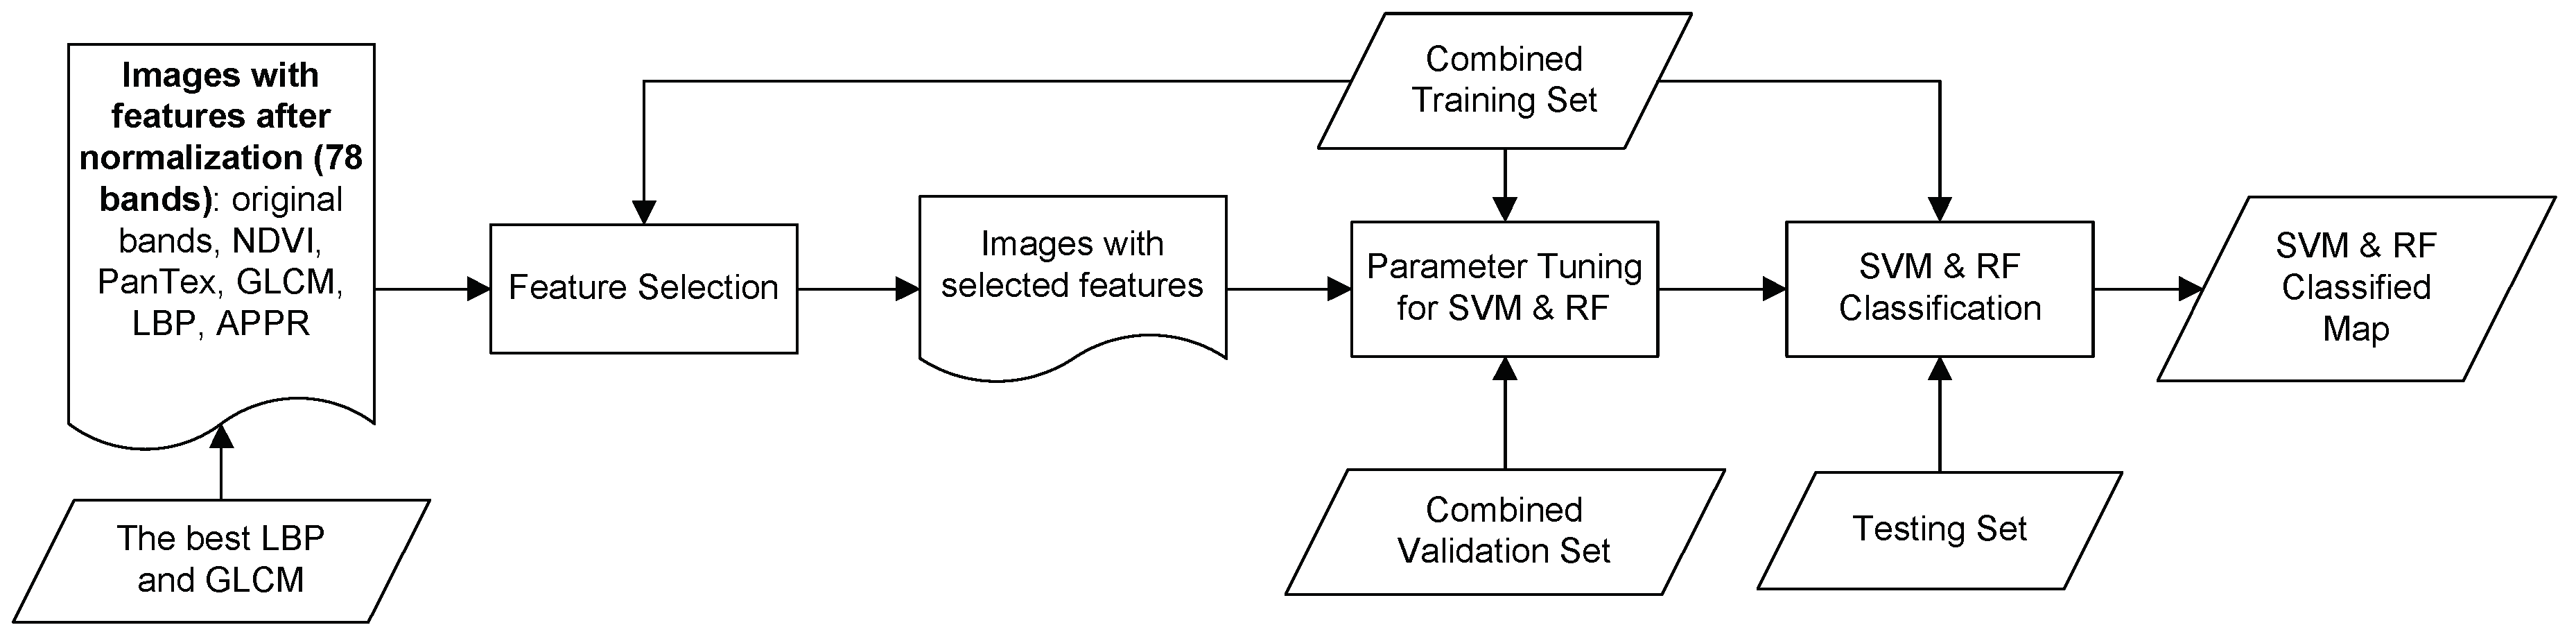
2.3. Feature Selection
2.4. Classification
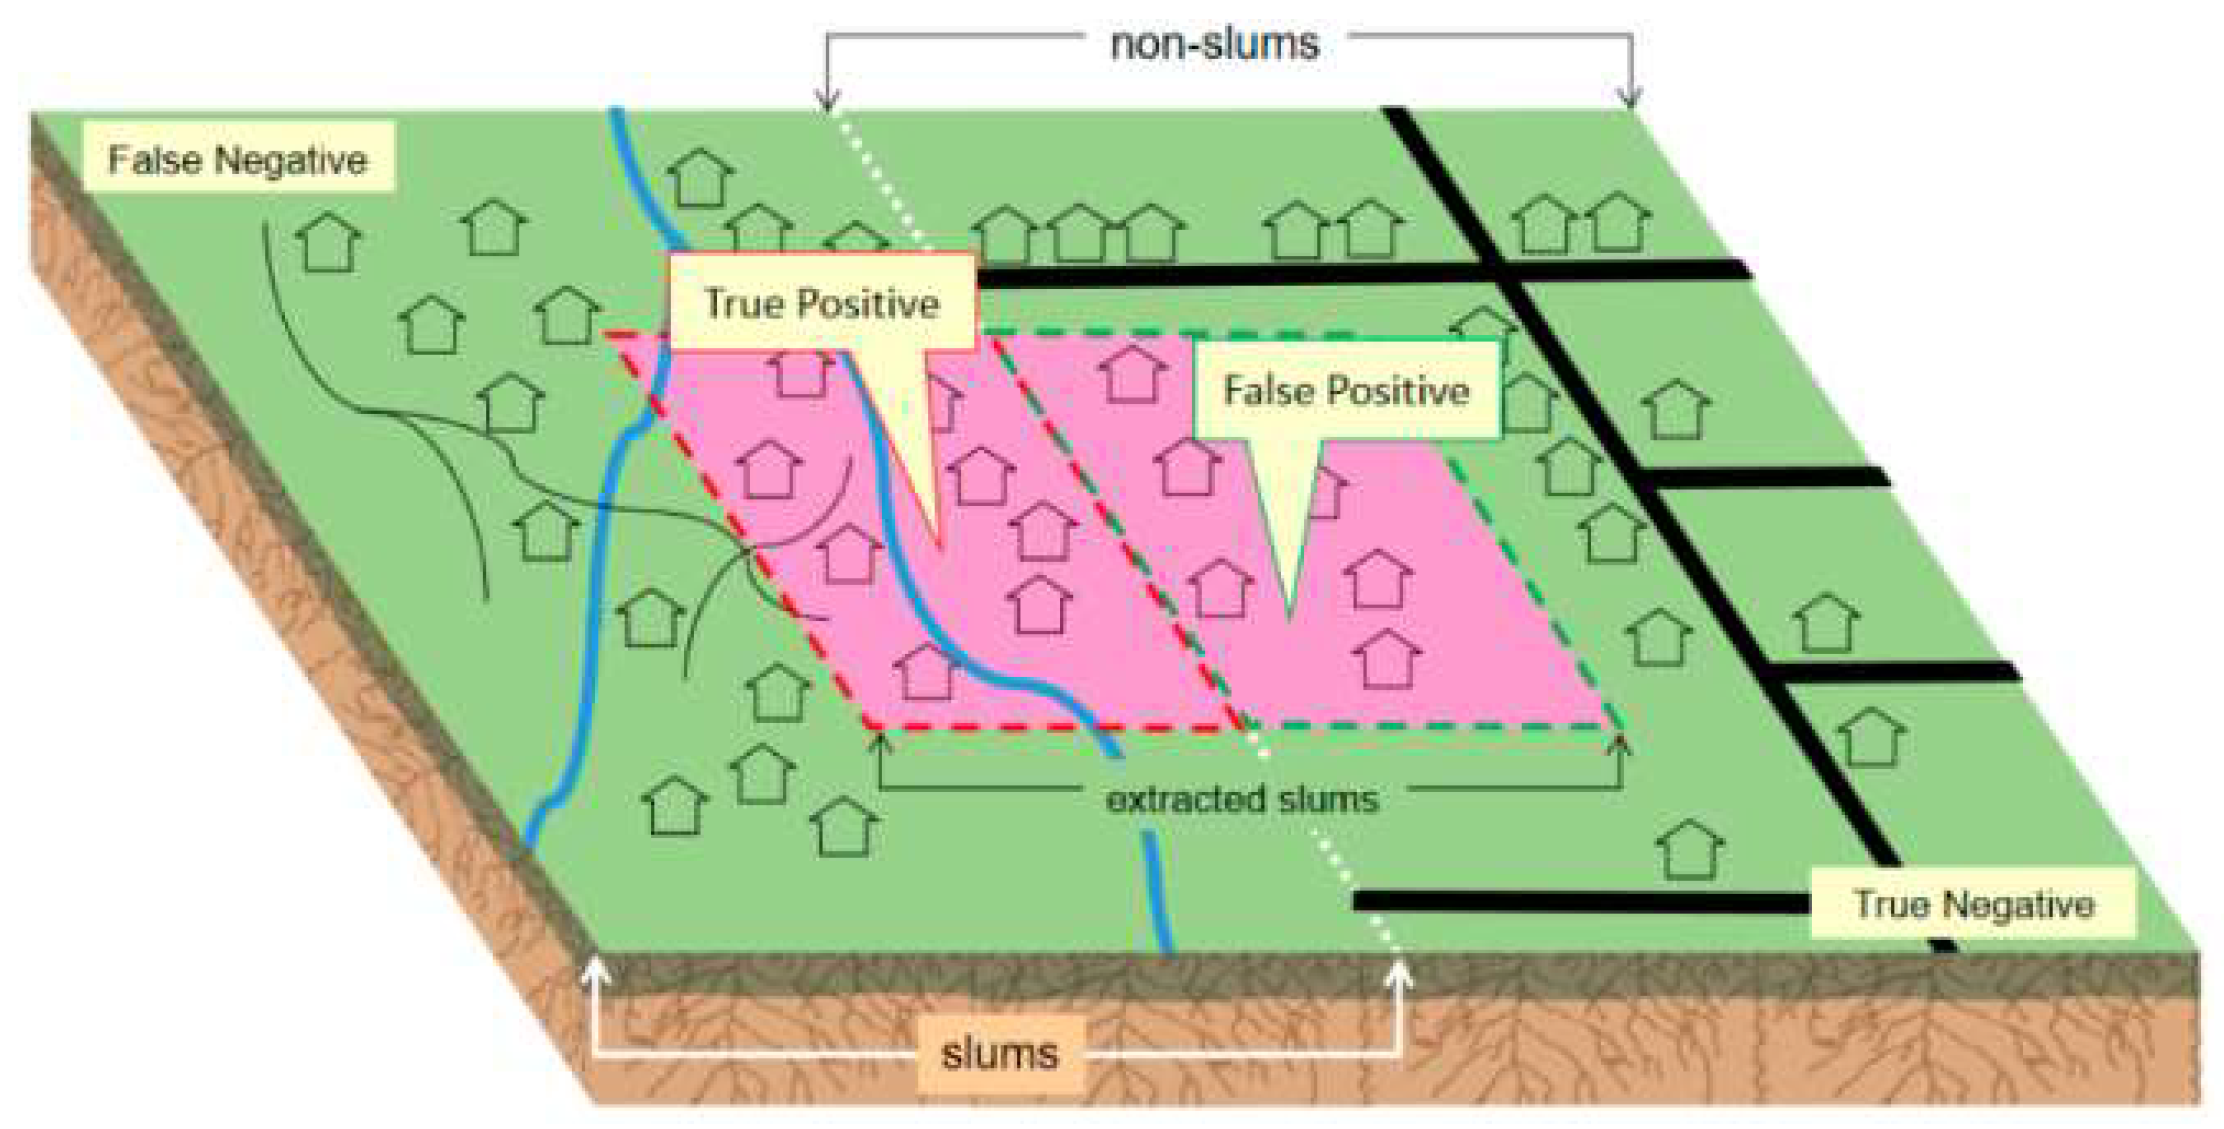
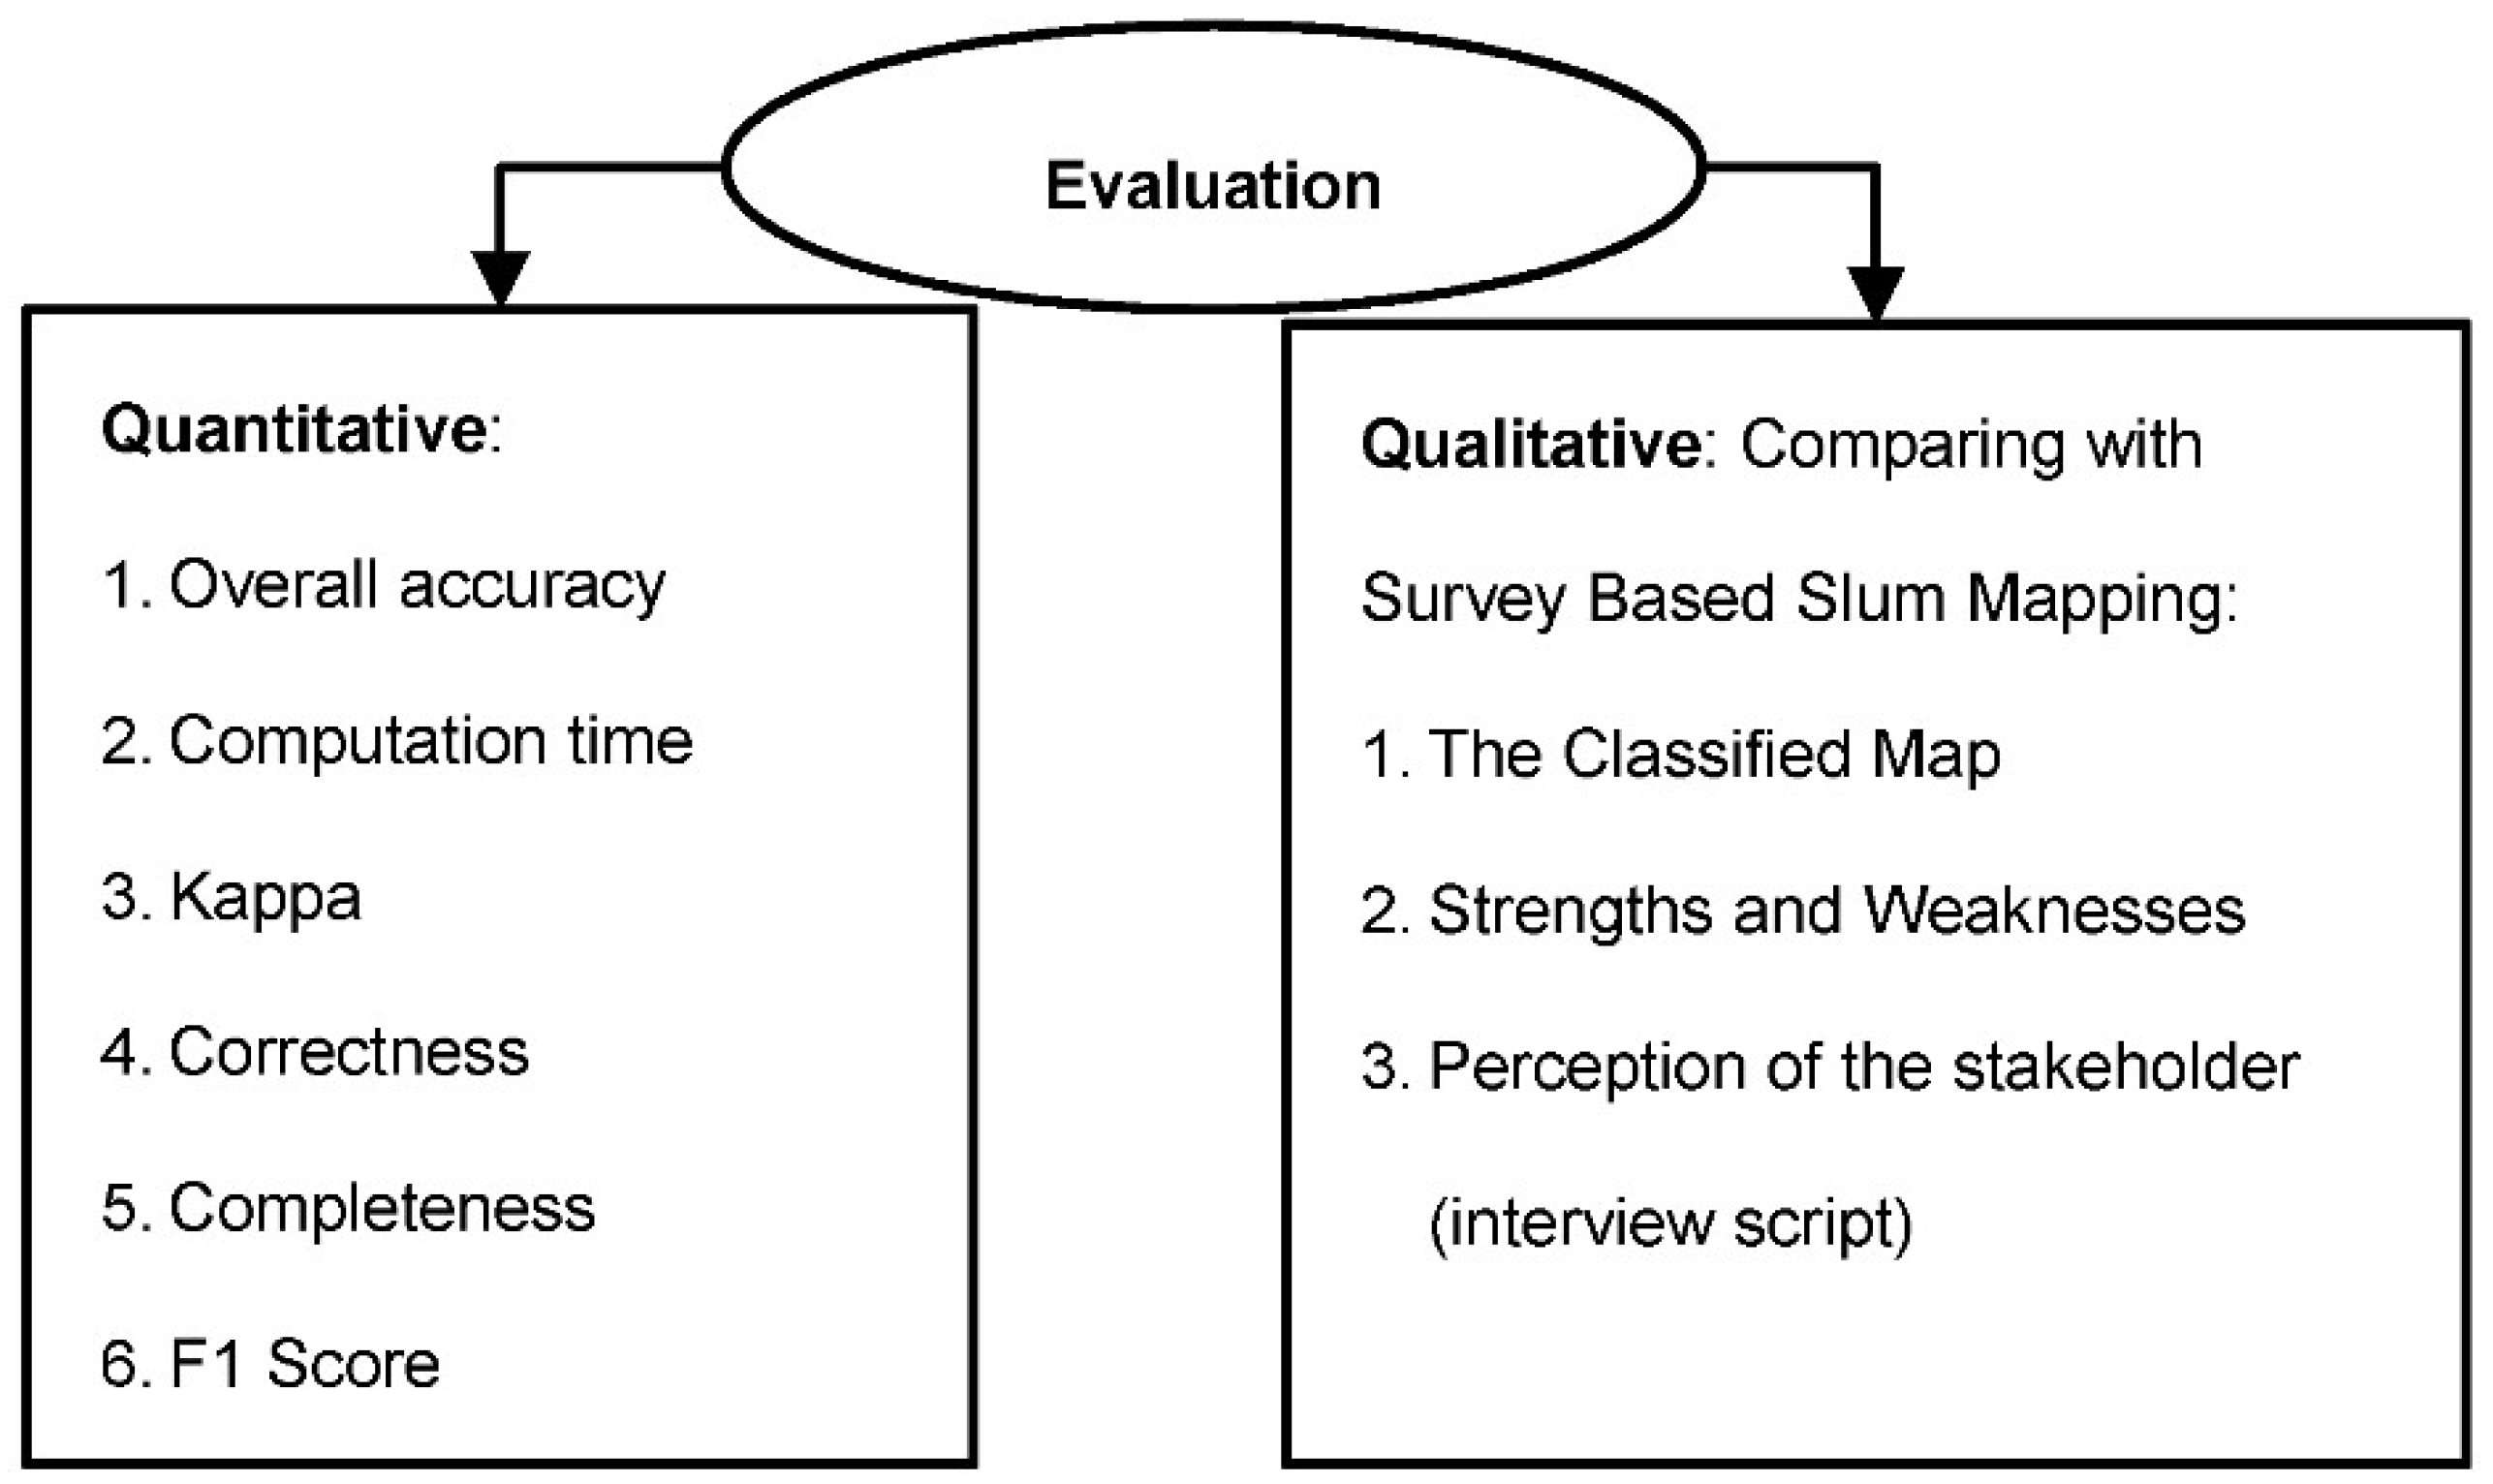
2.5. Evaluation of Machine Learning Slum Mapping
2.6. Experimental Setup
3. Results
3.1. GLCM and LBP Assessment
3.2. Sequential Feature Selection
3.3. Support Vector Machine and Random Forest
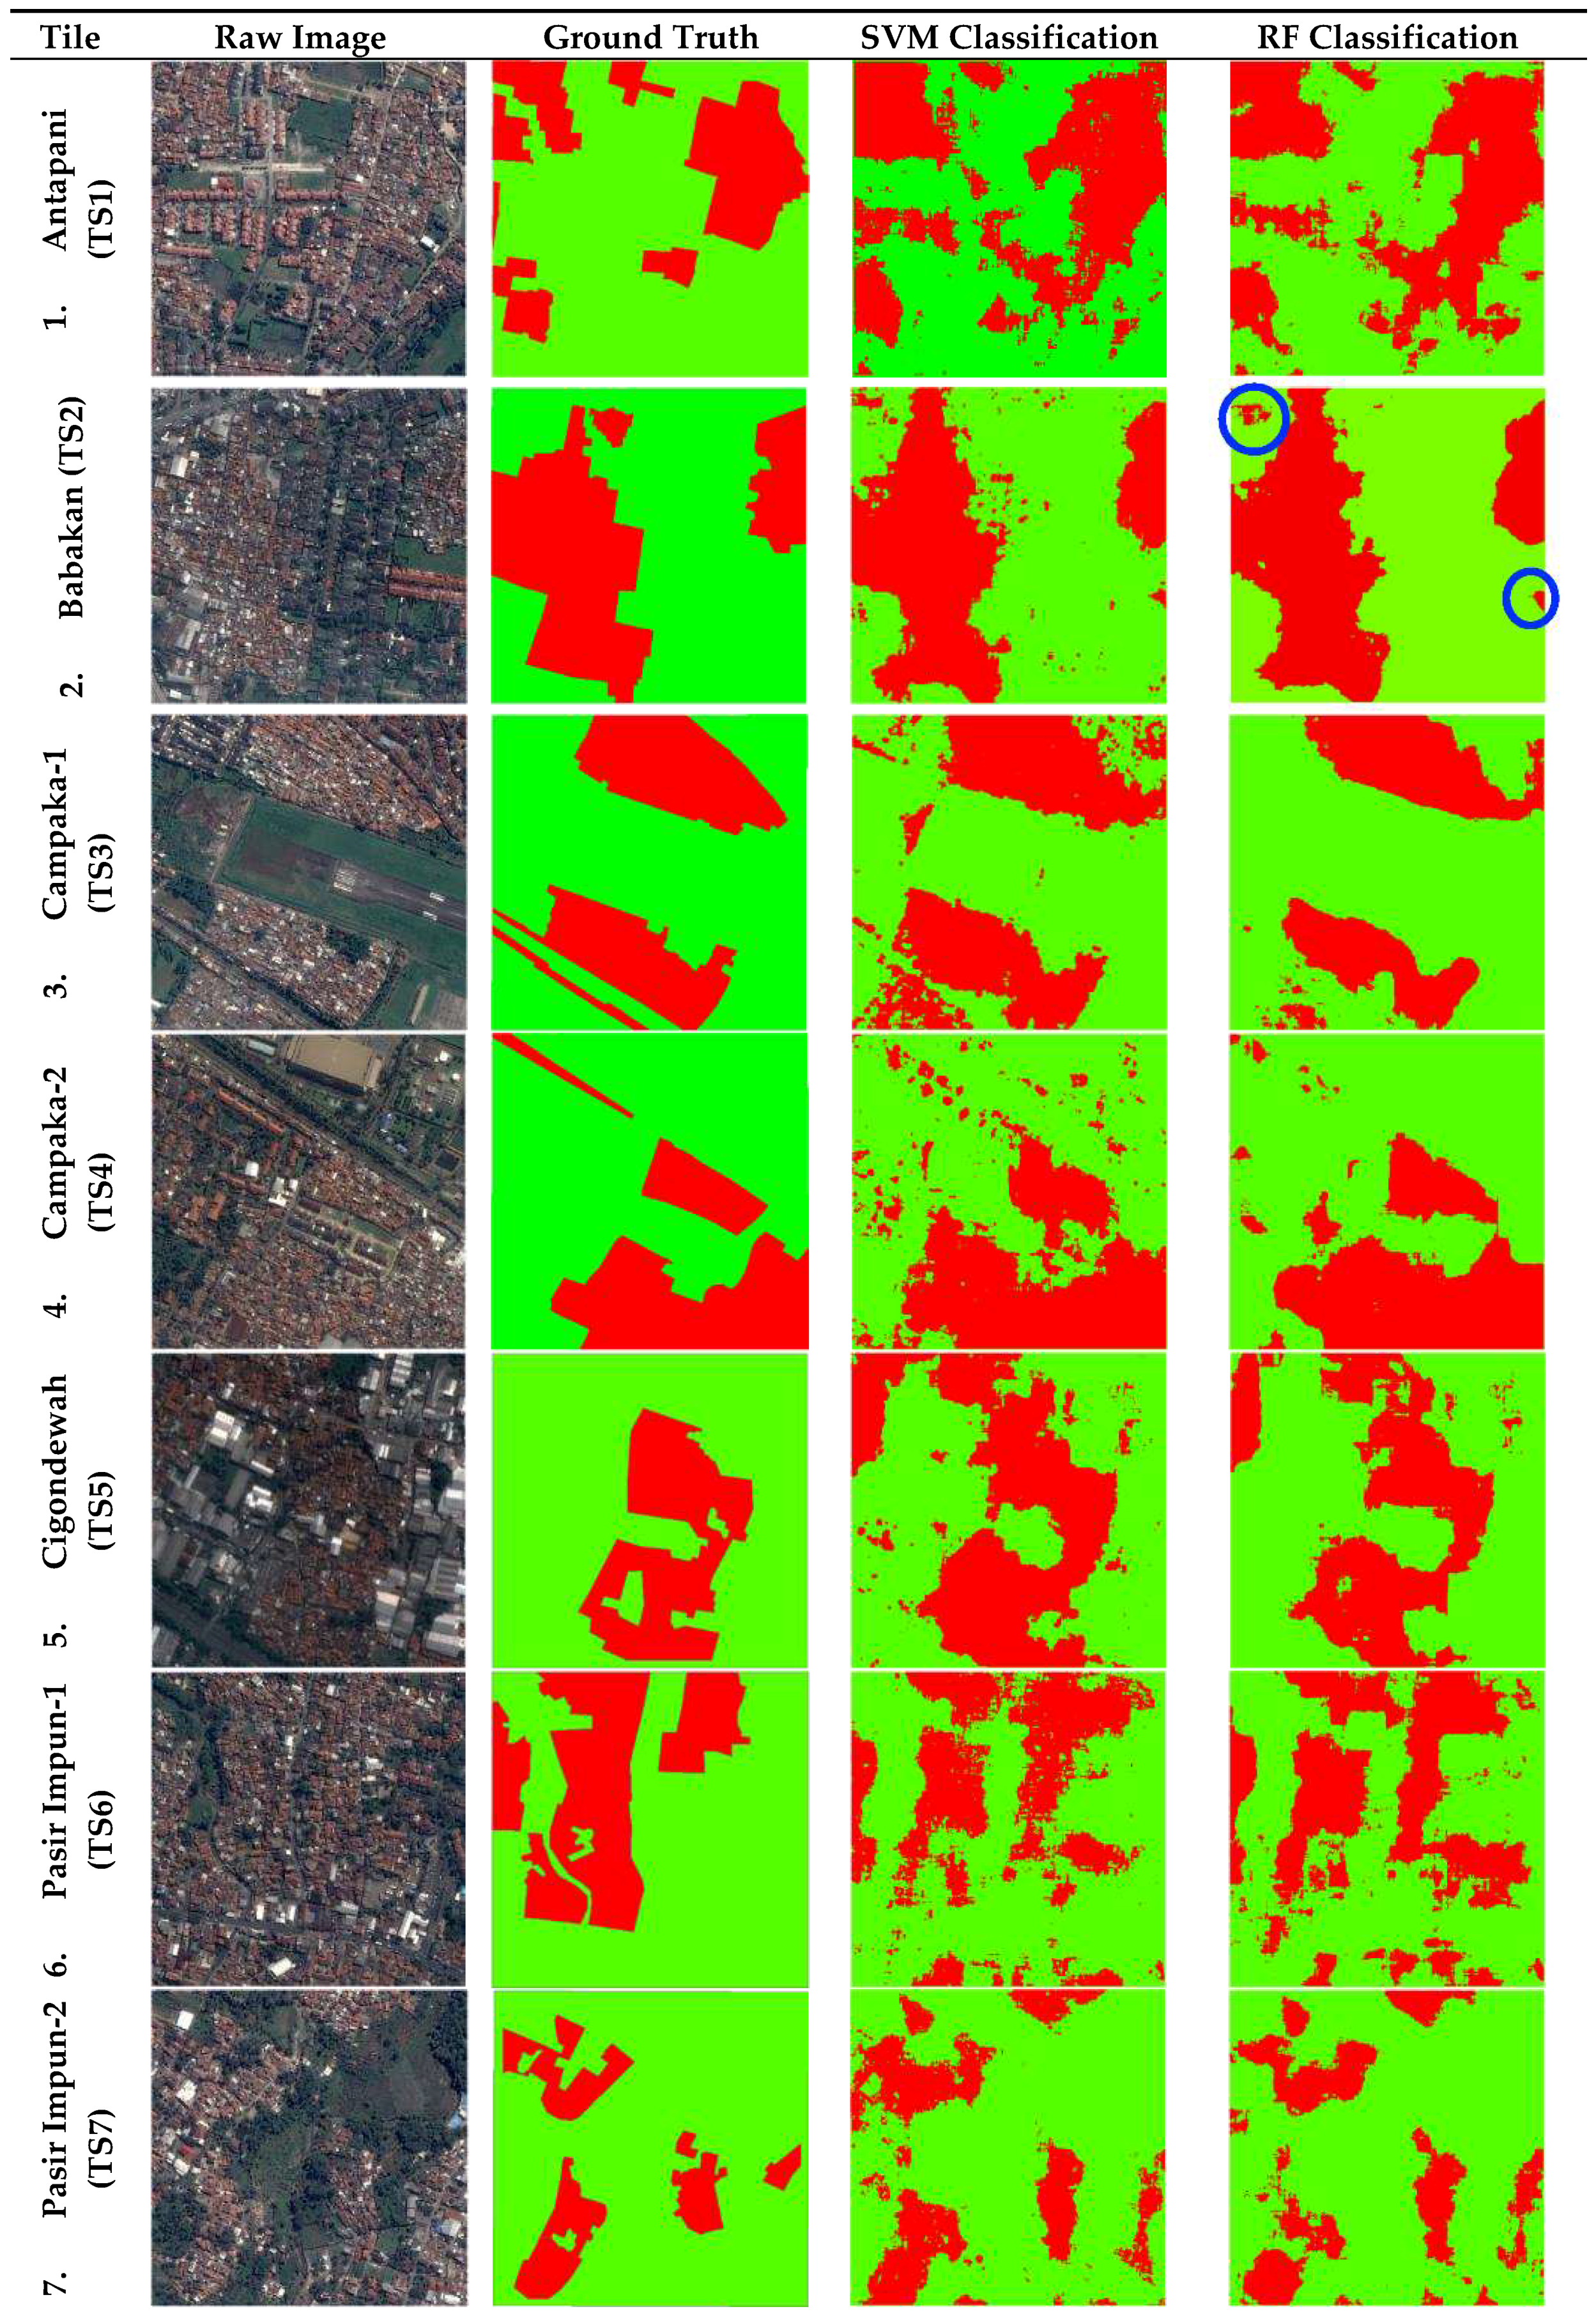
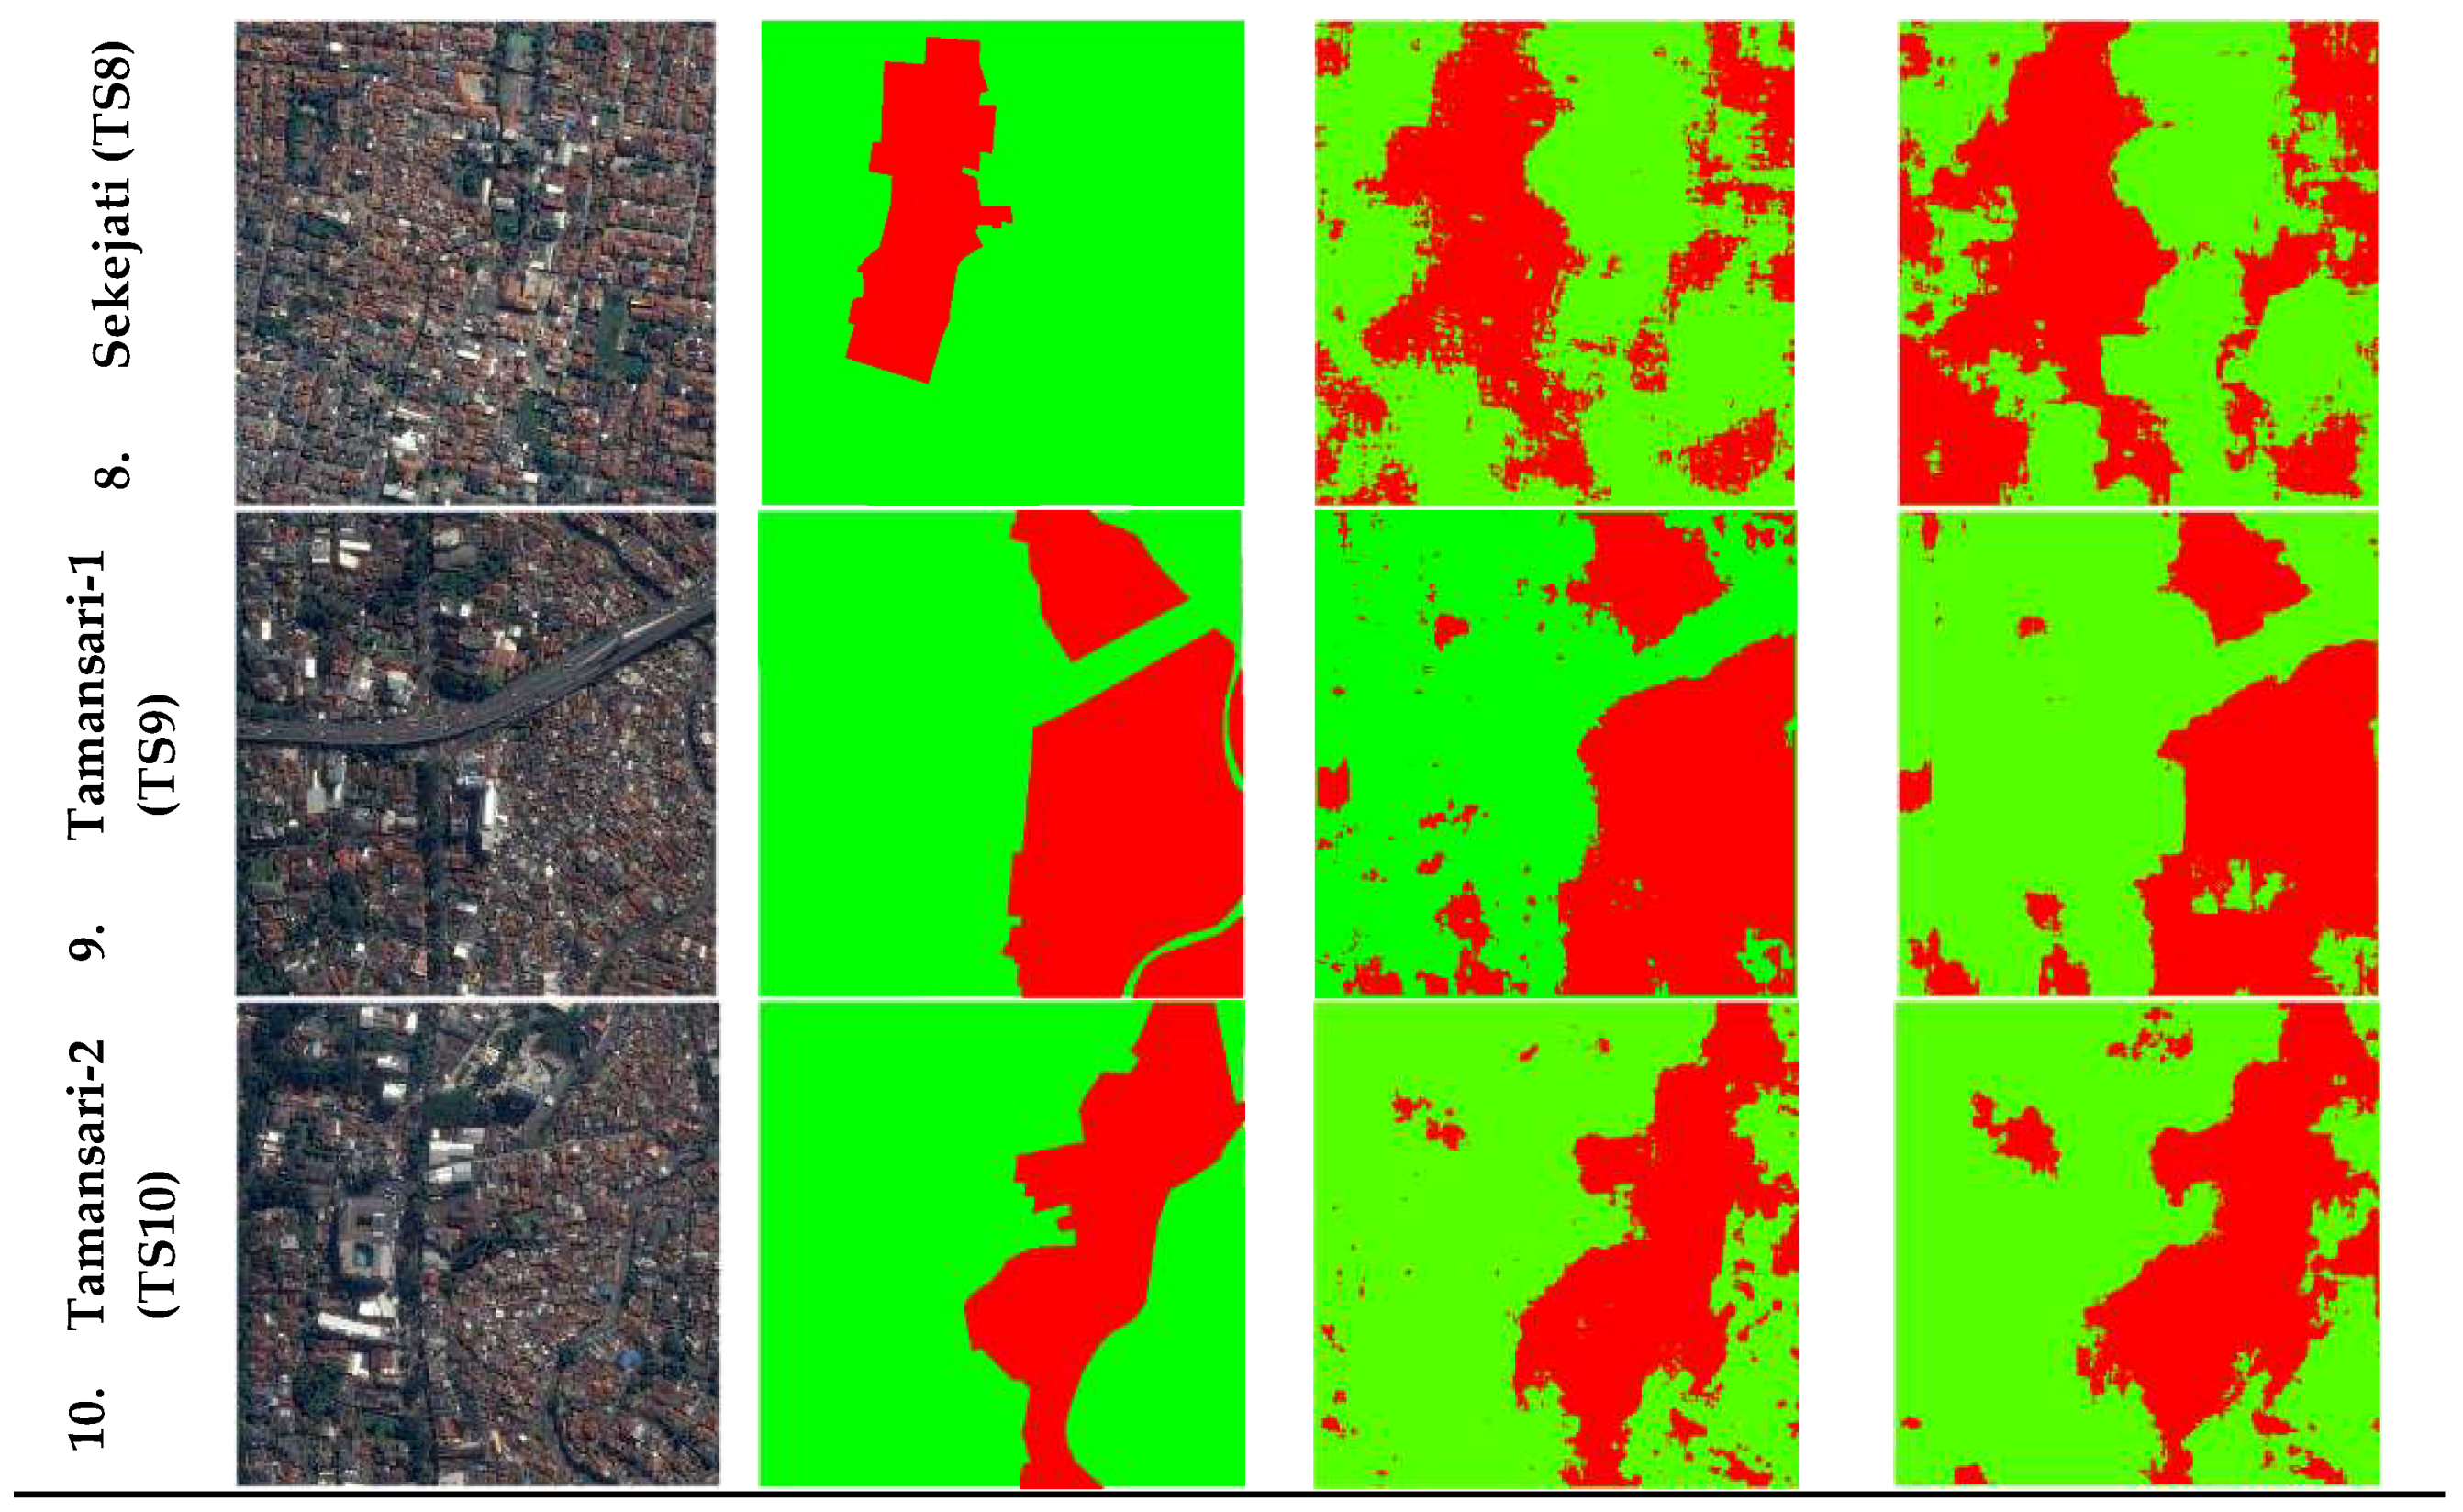
3.4. Classified Slum Map
3.5. Extending the Approach to a Larger Area
3.6. Comparing the Classified Map with the Survey-Based Slum Mapping Map
3.7. Strengths and Weaknesses
4. Discussion
4.1. Quantitative Analysis
4.2. Qualitative Analysis
4.2.1. Classified Map
4.2.2. Strengths and Weaknesses
4.2.3. Perception of the Stakeholders
5. Conclusions
Author Contributions
Funding
Acknowledgments
Conflicts of Interest
Appendix A
References
- Ministry of Public Works and Housing (Kemen PUPR). Slum Upgrading Programs; Ministry of Public Works and Housing: Jakarta, Indonesia, 2015; pp. 6–39.
- Ministry of Public Works and Housing (Kemen PUPR). Strategy for Achieving the Target of the Medium-Term Development Plan in 2015–2019; Ministry of Public Works and Housing: Jakarta, Indonesia, 2015.
- Ministry of Public Works and Housing (Kemen PUPR). City Without Slums (KOTAKU) Program Guide; Ministry of Public Works and Housing: Jakarta, Indonesia, 2016; pp. 1–148.
- Kuffer, M.; Pfeffer, K.; Sliuzas, R.; Baud, I. Extraction of slum areas From VHR imagery using GLCM variance. IEEE J. Sel. Top. Appl. Earth Obs. Remote Sens. 2016, 9, 1830–1840. [Google Scholar] [CrossRef]
- Kohli, D.; Sliuzas, R.; Stein, A. Urban slum detection using texture and spatial metrics derived from satellite imagery. J. Spat. Sci. 2016, 61, 405–426. [Google Scholar] [CrossRef]
- Pratomo, J.; Kuffer, M.; Martinez, J.; Kohli, D. Coupling uncertainties with accuracy assessment in object-based slum detections, case study: Jakarta, Indonesia. Remote Sens. 2017, 9, 1164. [Google Scholar] [CrossRef]
- Duque, J.C.; Patino, J.E.; Betancourt, A. Exploring the Potential of Machine Learning for Automatic Slum Identification from VHR Imagery. Remote Sens. 2017, 9, 895. [Google Scholar] [CrossRef]
- Kohli, D.; Kerle, N.; Sliuzas, R. Local ontologies for object-based slum identification and classification. In Proceedings of the 4th GEOBIA, Rio de Janeiro, Brazil, 7–9 May 2012; pp. 1–4. [Google Scholar]
- Wurm, M.; Weigand, M.; Schmitt, A.; Geiß, C.; Taubenböck, H. Exploitation of textural and morphological image features in sentinel-2a data for slum mapping. In Proceedings of the 2017 Joint Urban Remote Sensing Event (JURSE), Dubai, United Arab Emirates, 6–8 March 2017; pp. 1–4. [Google Scholar]
- Sharma, V.; Baruah, D.; Chutia, D.; Raju, P.; Bhattacharya, D.K. An assessment of support vector machine kernel parameters using remotely sensed satellite data. In Proceedings of the 2016 IEEE International Conference on Recent Trends in Electronics, Information & Communication Technology (RTEICT), Bangalore, India, 20–21 May 2016; pp. 1567–1570. [Google Scholar]
- Bachofer, F.; Quénéhervé, G.; Märker, M.; Hochschild, V. Comparison of SVM and boosted regression trees for the delineation of lacustrine sediments using multispectral ASTER data and topographic indices in the Lake Manyara Basin. Photogramm. Fernerkund. Geoinf. 2015, 2015, 81–94. [Google Scholar] [CrossRef]
- Rahmati, O.; Tahmasebipour, N.; Haghizadeh, A.; Pourghasemi, H.R.; Feizizadeh, B. Evaluation of different machine learning models for predicting and mapping the susceptibility of gully erosion. Geomorphology 2017, 298, 118–137. [Google Scholar] [CrossRef]
- Persello, C.; Bruzzone, L. Kernel-based domain-invariant feature selection in hyperspectral images for transfer learning. IEEE Trans. Geosci. Remote Sens. 2016, 54, 2615–2626. [Google Scholar] [CrossRef]
- Heung, B.; Ho, H.C.; Zhang, J.; Knudby, A.; Bulmer, C.E.; Schmidt, M.G. An overview and comparison of machine-learning techniques for classification purposes in digital soil mapping. Geoderma 2016, 265, 62–77. [Google Scholar] [CrossRef]
- Kotsiantis, S.B. Supervised machine learning: A review of classification techniques. Informatica 2007, 31, 249–268. [Google Scholar]
- Bruzzone, L.; Persello, C. Approaches Based on Support Vector Machine To Classification of Remote Sensing Data. In Handbook of Pattern Recognition and Computer Vision; Chen, C.H., Ed.; World Scientific: Singapore, 2009; pp. 329–352. [Google Scholar]
- Mboga, N.O. Detection of Informal Settlements from VHR Satellite Images Using Convolutional Neural Networks. Master’s Thesis, University of Twente, Enschede, The Netherlands, 2017. [Google Scholar]
- Statistical Agency of Bandung City. Bandung City in Figures; 9789791426442; Statistical Agency of Bandung City: Bandung, Indonesia, 2016; p. 350.
- Municipality of Bandung City. Areas in Bandung City; Statistical Agency of Bandung City: Bandung, Indonesia, 2008.
- Municipality of Bandung City. Planning Document: Slum Upgrading Programs in Bandung City in Press; Statistical Agency of Bandung City: Bandung, Indonesia, 2015; p. 282.
- Tarigan, A.K.M.; Sagala, S.; Samsura, D.A.A.; Fiisabiilillah, D.F.; Simarmata, H.A.; Nababan, M. Bandung City, Indonesia. Cities 2016, 50, 100–110. [Google Scholar] [CrossRef]
- Owen, K.K.; Wong, D.W. An approach to differentiate informal settlements using spectral, texture, geomorphology and road accessibility metrics. Appl. Geogr. 2013, 38, 107–118. [Google Scholar] [CrossRef]
- Pesaresi, M.; Gerhardinger, A.; Kayitakire, F. A robust built-up area presence index by anisotropic rotation-invariant textural measure. IEEE J. Sel. Top. Appl. Earth Obs. Remote Sens. 2008, 1, 180–192. [Google Scholar] [CrossRef]
- Pesaresi, M.; Ouzounis, G.K.; Gueguen, L. A new compact representation of morphological profiles: Report on first massive VHR image processing at the JRC. In Proceedings of the SPIE Defense, Security, and Sensing, Baltimore, MD, USA, 23–27 April 2012; p. 6. [Google Scholar]
- Politis, P.; Corbane, C.; Maffenini, L.; Kemper, T.; Pesaresi, M. Masada User Guide; Publications Office of the European Union: Luxembourg, 2017; Volume JRC106667. [Google Scholar]
- Ojala, T.; Pietikainen, M.; Maenpaa, T. Multiresolution gray-scale and rotation invariant texture classification with local binary patterns. IEEE Trans. Pattern Anal. Mach. Intell. 2002, 24, 971–987. [Google Scholar] [CrossRef] [Green Version]
- Ella, L.P.A.; van den Bergh, F.; van Wyk, B.J.; van Wyk, B.J. A comparison of texture feature algorithms for urban settlement classification. In Proceedings of the IGARSS 2008 IEEE International Geoscience and Remote Sensing Symposium, Boston, MA, USA, 7–11 July 2008; pp. III-1308–III-1311. [Google Scholar]
- Liao, W.; Dalla Mura, M.; Chanussot, J.; Bellens, R.; Philips, W. Morphological attribute profiles with partial reconstruction. IEEE Trans. Geosci. Remote Sens. 2016, 54, 1738–1756. [Google Scholar] [CrossRef]
- Liao, W.; Chanussot, J.; Dalla Mura, M.; Huang, X.; Bellens, R.; Gautama, S.; Philips, W. Taking optimal advantage of fine spatial resolution: Promoting partial image reconstruction for the morphological analysis of very-high-resolution images. IEEE Geosci. Remote Sens. Mag. 2017, 5, 8–28. [Google Scholar] [CrossRef]
- Gutierrez-Osuna, R. Pattern analysis for machine olfaction: A review. IEEE Sens. 2002, 2, 189–202. [Google Scholar] [CrossRef]
- Marcano-Cedeño, A.; Quintanilla-Domínguez, J.; Cortina-Januchs, M.G.; Andina, D. Feature selection using Sequential Forward Selection and classification applying Artificial Metaplasticity Neural Network. In Proceedings of the IECON 2010 36th Annual Conference on IEEE Industrial Electronics Society, Glendale, AZ, USA, 7–10 November 2010; pp. 2845–2850. [Google Scholar]
- Gevaert, C.M.; Persello, C.; Sliuzas, R.; Vosselman, G. Informal settlement classification using point-cloud and image-based features from UAV data. ISPRS J. Photogramm. Remote Sens. 2017, 125, 225–236. [Google Scholar] [CrossRef]
- Mao, K.Z. Orthogonal forward selection and backward elimination algorithms for feature subset selection. IEEE Trans. Syst. Man Cybern. Part B (Cybern.) 2004, 34, 629–634. [Google Scholar] [CrossRef]
- Dash, M.; Liu, H. Feature selection for classification. Intell. Data Anal. 1997, 1, 131–156. [Google Scholar] [CrossRef] [Green Version]
- Kavzoglu, T.; Colkesen, I. A kernel functions analysis for support vector machines for land cover classification. Int. J. Appl. Earth Obs. Geoinf. 2009, 11, 352–359. [Google Scholar] [CrossRef]
- Banko, G. A Review of Assessing the Accuracy of Classifications of Remotely Sensed Data and of Methods Including Remote Sensing Data in Forest Inventory; International Institute for Applied Systems Analysis: Laxenburg, Austria, 1998; p. 44. [Google Scholar]
- Bergado, J.R.; Persello, C.; Stein, A. Recurrent multiresolution convolutional networks for VHR mage Classification. IEEE Trans. Geosci. Remote Sens. 2018, 1–14. [Google Scholar] [CrossRef]
- Ministry of Public Works and Housing. The Minimum Amount of Remuneration for the Construction Workforce in Expert Positions for Construction Consultancy Services; Ministry of Public Works and Housing: Jakarta, Indonesia, 2018.
- Directorate Settlement Development. Salary Adjustment for an Independent Consultant in the City without Slum Programs; Directorate Settlement Development: Jakarta, Indonesia, 2018.
- Leichtle, T.; Geiß, C.; Wurm, M.; Lakes, T.; Taubenböck, H. Evaluation of clustering algorithms for unsupervised change detection in VHR remote sensing imagery. In Proceedings of the 2017 Joint Urban Remote Sensing Event (JURSE), Dubai, United Arab Emirates, 6–8 March 2017; pp. 1–4. [Google Scholar]
- Abe, B.T.; Olugbara, O.O.; Marwala, T. Experimental comparison of support vector machines with random forests for hyperspectral image land cover classification. J. Earth Syst. Sci. 2014, 123, 779–790. [Google Scholar] [CrossRef]
- Syrris, V.; Ferri, S.; Ehrlich, D.; Pesaresi, M. Image enhancement and feature extraction based on low-resolution satellite data. IEEE J. Sel. Top. Appl. Earth Obs. Remote Sens. 2015, 8, 1986–1995. [Google Scholar] [CrossRef]
- Adiningrat, D.P. Mapping Dominant Tree Species from Remotely Sensed Image Using Machine Learning Algorithms; ITC-University of Twente: Enschede, The Netherlands, 2017. [Google Scholar]
- Pratomo, J.; Kuffer, M.; Kohli, D.; Martinez, J. Application of the trajectory error matrix for assessing the temporal transferability of OBIA for slum detection. Eur. J. Remote Sens. 2018, 51, 838–849. [Google Scholar] [CrossRef]
- Wurm, M.; Taubenböck, H. Detecting social groups from space—Assessment of remote sensing-based mapped morphological slums using income data. Remote Sens. Lett. 2018, 9, 41–50. [Google Scholar] [CrossRef]
- Taubenböck, H.; Kraff, N.J.; Wurm, M. The morphology of the Arrival City—A global categorization based on literature surveys and remotely sensed data. Appl. Geogr. 2018, 92, 150–167. [Google Scholar] [CrossRef]
- Mboga, N.O.; Persello, C.; Bergado, J.R.; Stein, A. Detection of informal settlements from VHR images using convolutional neural networks. Remote Sens. 2017, 9, 1106. [Google Scholar] [CrossRef]
- Ministry of Public Works and Housing. Roads; Ministry of Public Works and Housing: Jakarta, Indonesia, 2006.
- Sliuzas, R.; Kuffer, M.; Kemper, T. Assessing the quality of Global Human Settlement Layer products for Kampala, Uganda. In Proceedings of the 2017 Joint Urban Remote Sensing Event (JURSE), Dubai, United Arab Emirates, 6–8 March 2017; pp. 1–4. [Google Scholar]
- Kohli, D.; Sliuzas, R.; Kerle, N.; Stein, A. An ontology of slums for image-based classification. Comput. Environ. Urban Syst. 2012, 36, 154–163. [Google Scholar] [CrossRef]
- Jochem, W.C.; Bird, T.J.; Tatem, A.J. Identifying residential neighbourhood types from settlement points in a machine learning approach. Comput. Environ. Urban Syst. 2018, 69, 104–113. [Google Scholar] [CrossRef] [PubMed]
- Vatsavai, R.R. Gaussian multiple instance learning approach for mapping the slums of the world using very high resolution imagery. In Proceedings of the 19th ACM SIGKDD International Conference on Knowledge Discovery and Data Mining, Chicago, IL, USA, 11–14 August 2013; pp. 1419–1426. [Google Scholar]
- Persello, C.; Stein, A. Deep fully convolutional networks for the detection of informal settlements in VHR images. IEEE Geosci. Remote Sens. Lett. 2017, 14, 2325–2329. [Google Scholar] [CrossRef]
- Sliuzas, R.; Kuffer, M.; Masser, I. The spatial and temporal nature of urban objects. In Remote Sensing of Urban and Suburban Areas; Rashed, T., Jürgens, C., Eds.; Springer: Dordrecht, The Netherlands, 2010; Volume 10, pp. 67–84. [Google Scholar]
- Kadhim, N.; Mourshed, M.; Bray, M. Advances in remote sensing applications for urban sustainability. Euro-Mediterr. J. Environ. Integr. 2016, 1, 1–22. [Google Scholar] [CrossRef]
- Pratomo, J. Transferability of The Generic and Local Ontology of Slum in Multi-temporal Imagery, Case Study: Jakarta. Master’s Thesis, University of Twente, Enschede, The Netherlands, 2016. [Google Scholar]
- Bialas, J.; Oommen, T.; Rebbapragada, U.; Levin, E. Object-based classification of earthquake damage from high-resolution optical imagery using machine learning. J. Appl. Remote Sens. 2016, 10, 16. [Google Scholar] [CrossRef]
- Kit, O.; Lüdeke, M. Automated detection of slum area change in Hyderabad, India using multitemporal satellite imagery. ISPRS J. Photogramm. Remote Sens. 2013, 83, 130–137. [Google Scholar] [CrossRef] [Green Version]
- Patino, J.E.; Duque, J.C. A review of regional science applications of satellite remote sensing in urban settings. Comput. Environ. Urban Syst. 2013, 37, 1–17. [Google Scholar] [CrossRef]
- Ministry of Public Works and Housing (Kemen PUPR). Acievement of Slums Upgrading Programs in 2017; Ministry of Public Works and Housing: Jakarta, Indonesia, 2017; pp. 1–24.
- Kuffer, M.; Pfeffer, K.; Sliuzas, R. Slums from space—15 years of slum mapping using remote sensing. Remote Sens. 2016, 8, 455. [Google Scholar] [CrossRef]
- Vatsavai, R.R. High-resolution urban image classification using extended features. In Proceedings of the 2011 IEEE 11th International Conference on Data Mining Workshops, Vancouver, BC, Canada, 11 December 2011; pp. 869–876. [Google Scholar]


| Data | Year | Data Sources | Category |
|---|---|---|---|
| Pleiades (pansharpened) images. Res: 0.5 m | 2016 (July and August) | European Space Agency (ESA) | Primary |
| Slum boundaries | 2015 | Ministry of Public Works and Housing | Secondary |
| Administrative boundary of Bandung city | 2015 | Municipality of Bandung | Secondary |
| Historical Google Earth images | 2013–2016 | Online data | Secondary |
| Validated slum boundaries | October 2017 | Ground truth checking | Primary |
| Expert interview scripts | October 2017 | Interview | Primary |
| GSO Dimension | Indicator | Local Indicator | Image Feature |
|---|---|---|---|
| Environs | Location | Hazardous areas, in between small alleys | No image feature was used explain the environs level |
| Neighborhood Characteristics | Proximity to industrial, commercial, formal residential, bus stations, and smelly and dirty areas | ||
| Settlement | Shape | Irregular pattern, elongated formation following the river or railway | Contextual (PanTex, LBP, GLCM) and morphological features (APPR) |
| Density | High density (more than 250 unit/ha), high roof coverage, less vegetation | Contextual (PanTex, LBP, GLCM) and spectral features (NDVI) | |
| Object | Access Network | Unpaved or poorly constructed streets, width ≤2.5 m, covered conduits or without conduits | Contextual features (PanTex, LBP, GLCM) |
| Building Characteristics | Permanent and nonpermanent structures, with the roofs made from corrugated iron, asbestos, plastic, fiber, and clay tiles; building size from 10–60 m2; poor sanitation, using well water or bought water | Spectral (original band) and morphological features |
| Features | Number of Bands |
|---|---|
| Original band | 4 |
| NDVI | 1 |
| PanTex with contrast adjustment 13 | 1 |
| PanTex with contrast adjustment 27 | 1 |
| PanTex with contrast adjustment 53 | 1 |
| PanTex with contrast adjustment 105 | 1 |
| GLCM 105 | 32 |
| LBP | 19 |
| APPR | 18 |
| Kelurahan | Area | Training and Validation Set | Training and Validation Pixel Number | Testing Set | Testing Pixel Number |
|---|---|---|---|---|---|
| Antapani | 1003 × 1004 | 28 polygons | 349 | 69 polygons | 866 |
| Babakan | 1002 × 1002 | 31 polygons | 385 | 50 polygons | 635 |
| Campaka 1 | 1004 ×1004 | 32 polygons | 400 | 63 polygons | 790 |
| Campaka2 | 1002 × 1002 | 30 polygons | 374 | 49 polygons | 608 |
| Cigondewah | 1002 × 1004 | 36 polygons | 455 | 69 polygons | 866 |
| Pasir Impun-1 | 1005 × 1006 | 36 polygons | 453 | 41 polygons | 519 |
| Pasir Impun-2 | 1003 × 1003 | 29 polygons | 350 | 44 polygons | 557 |
| Sekejati | 1002 × 1007 | 35 polygons | 434 | 61 polygons | 753 |
| Tamansari 1 | 1002 × 1009 | 32 polygons | 398 | 54 polygons | 679 |
| Tamansari 2 | 1002 × 1001 | 36 polygons | 450 | 59 polygons | 741 |
| Number of pixels in the training and validation sets: 4048; Number of pixels of all training sets (80%): 3238; and of all validation sets (20%): 810 | Number of all testing sets: 7014 pixels | ||||
| GLCM 13 | GLCM 27 | GLCM 53 | GLCM 105 |
|---|---|---|---|
| 72.7% | 77.7% | 82.1% | 83.8% |
| 81.3% | 81.1% | 81.2% | 81.6% | 80.7% |
| No. | Features | No. | Features | No. | Features |
|---|---|---|---|---|---|
| 1 | PanTex window size 105 | 12 | GLCM Dissimilarity Band-1 | 23 | GLCM Entropy Band-3 |
| 2 | PanTex window size 53 | 13 | LBP | 24 | GLCM Entropy Band-2 |
| 3 | LBP | 14 | LBP | 25 | APPR area 200 opening |
| 4 | PanTex window size 27 | 15 | GLCM Entropy Band-1 | 26 | LBP |
| 5 | LBP | 16 | GLCM Dissimilarity Band-2 | 27 | GLCM Correlation Band-2 |
| 6 | LBP | 17 | GLCM Variance Band-1 | 28 | GLCM Mean Band-1 |
| 7 | GLCM Homogeneity Band-1 | 18 | GLCM Variance Band-2 | 29 | Green Band |
| 8 | GLCM Homogeneity Band-2 | 19 | GLCM Dissimilarity Band-3 | 30 | GLCM Second Moment Band-1 |
| 9 | GLCM Homogeneity Band-3 | 20 | GLCM Variance Band-4 | 31 | LBP |
| 10 | PanTex window size 13 | 21 | GLCM Correlation Band-1 | 32 | GLCM Correlation Band-3 |
| 11 | GLCM Correlation Band-4 | 22 | GLCM Variance Band-3 |
| No. | Feature Type | Mean Decrease (Gini) | No | Feature Type | Mean Decrease (Gini) |
|---|---|---|---|---|---|
| 1 | PANTEX 53 | 57.998 | 18 | GLCM—Variance band 1 | 25.043 |
| 2 | GLCM—Correlation band 4 | 52.099 | 19 | GLCM—Dissimilarity band 1 | 24.272 |
| 3 | PANTEX 105 | 44.918 | 20 | GLCM—Variance band 3 | 24.246 |
| 4 | PANTEX 27 | 42.463 | 21 | GLCM—Variance band 2 | 24.066 |
| 5 | PANTEX 13 | 36.494 | 22 | LBP | 23.032 |
| 6 | GLCM—Homogeneity band 1 | 32.559 | 23 | GLCM—Homogeneity band 3 | 22.692 |
| 7 | LBP | 30.548 | 24 | GLCM—Homogeneity band 4 | 22.519 |
| 8 | GLCM—Correlation band 1 | 30.173 | 25 | GLCM—Mean band 1 | 21.647 |
| 9 | GLCM—Second moment band 3 | 29.326 | 26 | NDVI | 21.6 |
| 10 | GLCM—Homogeneity band 2 | 29.014 | 27 | LBP | 21.351 |
| 11 | LBP | 27.781 | 28 | LBP | 21.181 |
| 12 | GLCM—Second moment band 2 | 26.959 | 29 | LBP | 20.939 |
| 13 | GLCM—Variance band 4 | 26.866 | 30 | GLCM—Second moment band 4 | 20.866 |
| 14 | GLCM—Correlation band 2 | 26.374 | 31 | GLCM—Contrast band 3 | 20.676 |
| 15 | GLCM—Second moment band 1 | 26.148 | 32 | LBP | 20.633 |
| 16 | GLCM—Correlation band 3 | 26.137 | 33 | GLCM—Entropy band 2 | 20.408 |
| 17 | LBP | 26.038 |
| Without SFS | With SFS | ||
|---|---|---|---|
| SVM | RF | SVM | RF |
| 86.5% | 85.2% | 88.5% | 85.2% |
| No. | Selected Area | Time (s) | OA | Kappa | Completeness | Correctness | F1 Score |
|---|---|---|---|---|---|---|---|
| 1 | Antapani | 0.028 | 0.859 | 0.709 | 0.938 | 0.831 | 0.881 |
| 2 | Babakan | 0.023 | 0.938 | 0.861 | 0.876 | 0.941 | 0.907 |
| 3 | Campaka-1 | 0.021 | 0.882 | 0.758 | 0.861 | 0.941 | 0.899 |
| 4 | Campaka-2 | 0.019 | 0.799 | 0.599 | 0.721 | 0.8601 | 0.784 |
| 5 | Cigondewah | 0.022 | 0.869 | 0.730 | 0.804 | 0.878 | 0.839 |
| 6 | Pasir Impun-1 | 0.020 | 0.720 | 0.033 | 0.176 | 0.228 | 0.199 |
| 7 | Pasir Impun-2 | 0.020 | 0.863 | 0.704 | 0.815 | 0.807 | 0.811 |
| 8 | Sekejati | 0.025 | 0.806 | 0.588 | 0.911 | 0.789 | 0.846 |
| 9 | Tamansari-1 | 0.023 | 0.873 | 0.746 | 0.845 | 0.888 | 0.866 |
| 10 | Tamansari-2 | 0.021 | 0.869 | 0.738 | 0.880 | 0.859 | 0.869 |
| All | 0.294 | 0.856 | 0.712 | 0.845 | 0.849 | 0.847 | |
| Training Time | 3.673 |
| No. | Selected Area | Time (s) | OA | Kappa | Completeness | Correctness | F1 Score |
|---|---|---|---|---|---|---|---|
| 1 | Antapani | 0.075 | 0.895 | 0.784 | 0.956 | 0.868 | 0.91 |
| 2 | Babakan | 0.057 | 0.924 | 0.836 | 0.936 | 0.857 | 0.895 |
| 3 | Campaka-1 | 0.067 | 0.918 | 0.826 | 0.950 | 0.918 | 0.934 |
| 4 | Campaka-2 | 0.061 | 0.803 | 0.606 | 0.727 | 0.861 | 0.788 |
| 5 | Cigondewah | 0.072 | 0.908 | 0.813 | 0.935 | 0.856 | 0.894 |
| 6 | Pasir Impun-1 | 0.054 | 0.726 | 0.127 | 0.294 | 0.3 | 0.297 |
| 7 | Pasir Impun-2 | 0.053 | 0.856 | 0.698 | 0.875 | 0.761 | 0.815 |
| 8 | Sekejati | 0.064 | 0.908 | 0.811 | 0.929 | 0.914 | 0.921 |
| 9 | Tamansari-1 | 0.066 | 0.908 | 0.816 | 0.891 | 0.921 | 0.906 |
| 10 | Tamansari-2 | 0.057 | 0.903 | 0.806 | 0.939 | 0.871 | 0.904 |
| All | 0.510 | 0.885 | 0.769 | 0.894 | 0.865 | 0.879 | |
| Training Time | 1.928 |
| Actual | ||
|---|---|---|
| Predicted | Slums | Nonslums |
| Slums | 18 | 16 |
| Nonslums | 9 | 157 |
| Overall Accuracy | Kappa | Completeness | Correctness | F1 Score |
|---|---|---|---|---|
| 87.5% | 0.518 | 0.667 | 0.529 | 0.59 |
| Factors | Machine Learning-Based Slum Mapping (MLBSM) | Survey-Based Slum Mapping (SBSM) |
|---|---|---|
| Cost |
|
|
| Human resources |
|
|
| Infrastructures |
|
|
| Processing Time | Approximately one month depending on the capacity of the computer, as well as surveys on the field to get the training set. | Approximately six months depending on the capacity of surveyors and participatory process with the community. |
| Spatial Coverage | With one set of the resources (human, and infrastructures) in 2 months, it possibly produces one city | With one set of the resources (human, and infrastructures) in 2 months, it possibly produces only some parts of the city depending on how large the city is. |
| Accuracy | 88.5% of the reference (ground truth data) by the highest accuracy result from SVM | 80% (claimed by ministry); However, it is only an assumption, because they do not have a mechanism for the accuracy assessment. They realized results depend on surveyor’s understanding. Limitations are also caused by time and geographic barriers to collect data on the ground, meaning sometimes the surveyor only estimates the data. |
| Degree of automation | 33.33% From the three steps (surveying, making the slum maps, validating), one step (making the slum maps) is automated | 0% |
| Maintenance | The parameter should be adjusted for another city according to the local slum characteristics | Not relevant |
© 2018 by the authors. Licensee MDPI, Basel, Switzerland. This article is an open access article distributed under the terms and conditions of the Creative Commons Attribution (CC BY) license (http://creativecommons.org/licenses/by/4.0/).
Share and Cite
Leonita, G.; Kuffer, M.; Sliuzas, R.; Persello, C. Machine Learning-Based Slum Mapping in Support of Slum Upgrading Programs: The Case of Bandung City, Indonesia. Remote Sens. 2018, 10, 1522. https://doi.org/10.3390/rs10101522
Leonita G, Kuffer M, Sliuzas R, Persello C. Machine Learning-Based Slum Mapping in Support of Slum Upgrading Programs: The Case of Bandung City, Indonesia. Remote Sensing. 2018; 10(10):1522. https://doi.org/10.3390/rs10101522
Chicago/Turabian StyleLeonita, Gina, Monika Kuffer, Richard Sliuzas, and Claudio Persello. 2018. "Machine Learning-Based Slum Mapping in Support of Slum Upgrading Programs: The Case of Bandung City, Indonesia" Remote Sensing 10, no. 10: 1522. https://doi.org/10.3390/rs10101522