Article

A Novel Algorithm for Predicting Phycocyanin Concentrations in Cyanobacteria: A Proximal Hyperspectral Remote Sensing Approach

1
Geosystems Research Institute and Department of Geosciences, P.O. Box 5448, Mississippi State, MS 39762-5448, USA
2
Department of Biological Sciences, University of New Orleans, New Orleans, LA 70148, USA
*
Author to whom correspondence should be addressed.
Remote Sens. 2009, 1(4), 758-775; https://doi.org/10.3390/rs1040758
Submission received: 26 August 2009 / Revised: 8 September 2009 / Accepted: 9 October 2009 / Published: 19 October 2009

Abstract

:
The purpose of this research was to evaluate the performance of existing spectral band ratio algorithms and develop a novel algorithm to quantify phycocyanin (PC) in cyanobacteria using hyperspectral remotely-sensed data. We performed four spectroscopic experiments on two different laboratory cultured cyanobacterial species and found that the existing band ratio algorithms are highly sensitive to chlorophylls, making them inaccurate in predicting cyanobacterial abundance in the presence of other chlorophyll-containing organisms. We present a novel spectral band ratio algorithm using 700 and 600 nm that is much less sensitive to the presence of chlorophyll.

1. Introduction

A major threat to water quality and public health is the formation of Cyanobacterial Harmful Algal Bloom(s) (CHAB). CHAB not only hamper recreational activities and degrade aquatic habitats because they form a thick mat on the surface of water, they may also produce odorous compounds that destroy the aesthetics of the water and toxins that can sicken animals and humans, attracting the attention of coastal scientists, managers, and policy makers. Cyanobacteria, also known as blue-green (BG) algae, are the largest, most diverse group of prokaryotes and can multiply very rapidly in summer when temperature, light, and nutrient runoff from fertilizer increase. Some of the genera of these BG produce various types of neurotoxins and hepatotoxins that adversely affect animals and humans [1,2,3]. Hence BG detection and monitoring is critical in lakes, coastal and estuarine environments, but traditional sampling techniques for this process can be time-consuming and expensive, and real time spatial monitoring of cyanobacteria in large lakes, estuaries and coastal waters has been extremely difficult [4]. BG have certain photosensitive pigments with distinct optical characteristics, allowing their detection and mapping by airborne and space-borne optical sensors.
BG have photosynthetic reaction centers that are structurally and functionally similar to those found in eukaryotic chloroplasts, but their light-harvesting pigments are composed of Chlorophyll-a (Chl-a) and the phycobiliproteins (PBP)s [5,6]. BG minimally contain at least three different spectrally detectable PBPs including phycocyanin (PC) (Amax = 620 nm), allophycocyanin (AP) (Amax = 650 nm), and allophycocyanin B (APB) (Amax = 670 nm) [6,7]. Some BG may also contain phycoerythrin (PE) (Amax = 565 nm). These PBPs form a large protein complex which transfers energy primarily to Photosystem II reaction centers. Photosystem I reaction center binds approximately 100 Chl-a, the majority of which serve as antenna pigments for light absorption [5].
Hyperspectral remote sensing reflectance (Rrs) spectra for natural water bodies are generally complex because of the presence of many optically active constituents such as Chl-a, carotenoids, total suspended solids (TSS), and Colored Dissolved Organic Matter (CDOM). However, researchers have been reasonably successful in exploiting PC 620 nm absorption feature to develop empirical and semi-empirical models to detect PC as a marker for BG from water bodies [8]. Most research pertaining to the detection and mapping of cyanobacteria from in situ remote sensing spectra have used the absorption and reflectance features from 620 and 650 nm to develop a relationship between Rrs and PC concentrations. To date, three algorithms have been proposed to quantify PC based on its absorption feature at 620 nm: a single band ratio algorithm [9], a semi-empirical algorithm [10] and a nested semi-empirical band ratio algorithm [8].
Dekker [10] used a band addition and subtraction algorithm to quantify PC concentration from remote sensing reflectance while Schalles and Yacobi [9] developed a reflectance band ratio model using maximum reflectance between 640 and 660 nm to minimum reflectance between 615 and 635 nm to detect PC. The major drawbacks of these empirical models are that the researchers did not address the performance of the models in the case of varying Chl-a concentrations and did not account for the variable PC:Chl-a pigment ratio [11]. Although the reflectance peak between 640 and 660 nm has generally been used to develop empirical relationships to quantify PC, these empirical models for PC detection need narrower spectral resolution than is provided by commonly used ocean color satellite sensors [12]. In a separate study, Vincent et al. [13] developed a spectral band ratio model to quantify PC concentrations using Landsat 7 ETM+ data and were successful in detecting and mapping PC in the western basin of Lake Erie. They used all bands of Landsat 7 sensor except the band 6 (thermal infrared) in the band ratio model including the near-and middle infrared bands (i.e., band 4:760–900 nm; band 5:1,550–1,750 nm; and band 7: 2,080–2,350 nm). However, radiance (Lw) in these infrared bands is greatly reduced due to water absorption and modeling reflectance spectra beyond 750 nm could be accounting for turbidity in the lake caused by algal biomass instead of phycocyanin [12]. Simis et al. [8] developed a semi-empirical algorithm that used the band ratio from 709 nm to 620 nm to estimate PC. They discussed the influence of Chl-a absorption at 620 nm and also included the impact of the variable PC:Chl-a ratio on the performance of the algorithm. They concluded that the model error significantly increased as the PC:Chl-a ratio decreased, providing evidence for the effect of Chl-a absorption at 620 nm.
In a recent study, Simis et al. [11] documented the influence of phytoplankton pigments other than Chl-a on the remote estimation of cyanobacterial biomass. They concluded that the presence of Chl-a, b and c, and pheophytin tend to overestimate the PC concentrations in predictive models, and that estimation errors tend to be significant at low PC concentrations. Therefore, even if a semi-empirical model to predict PC concentrations is corrected for Chl-a, the absorption by the above mentioned pigments still influences the 620 nm absorption, affecting the accuracy of PC quantification. Randolph et al. [14] validated the semi-empirical algorithm developed by Simis et al. [8] and reported that the performance of the algorithm was promising in retrieving PC concentrations and estimating BG abundance in Geist and Morse reservoirs, Indiana. However, further validation and fine-tuning of Simis et al. [8] algorithm using spectroscopic studies was suggested.
Metsamaa et al. [15] documented that the absorption and reflectance features at 630 and 650 nm respectively on the reflectance spectra of a cyanobacterium are dependent on Chl-a concentrations in the water body. These optical features appear only when Chl-a concentration reaches 8–10 mg m−3 and, can be detected by specific remote sensing instruments with 10 nm spectral resolution and 1000:1 signal-to-noise ratio. They also concluded that the use of 630 nm absorption features in early warning systems for monitoring CHABs is not feasible by remote sensing techniques. Dekker [10] and Schalles and Yacobi [9] have used the reflectance peak between 640 and 660 nm with some success. Unfortunately, there have not been many other studies on the appearance and dynamics of these characteristic reflectance peaks at varying PC concentrations and also when PC is associated with other common optically active pigments like chlorophyll, present in other potential organisms in the environment such as green algae.
In this research, we studied the reflectance characteristics of two lab cultured blue-green algae species, particularly the dynamics of the reflectance peak between 640 and 660 nm and its dependence on varying Chl-a concentration. The two specific objectives of this research include, (1) to observe the appearance and dynamics of the reflectance peak between 640 and 660 nm and examine its usefulness in band ratio models for quantifying PC concentrations and (2) to evaluate the performance of the existing band ratio PC algorithms under varying Chl-a concentrations and to develop a novel band ratio algorithm to predict PC concentrations. To achieve these objectives, we cultured two BG species and one green algal species in the laboratory, studied their spectroscopic properties in four separate experiments using an in situ hyperspectral radiometer. The rationale behind our experimental approach was a basic assumption that the inherent relation between a band ratio algorithm and pigment concentration can sometimes be clearly understood by analyzing spectral data collected during controlled experiments and that the contribution from other optically active constituents in natural water and the common atmospheric interference found in remotely sensed data can easily be avoided.

2. Materials and Methods

2.1. Strains of Cyanobacteria, Green Algae, and Culture Condition

Two species of cyanobacteria, Synechocystis sp. (PCC 6803) and Anabaena (also known as Nostoc) sp. PCC 7120 and one species of green algae (Ankistrodesmus falcatus) were grown in BG11 medium [16] supplemented with 10 mM Hepes-KOH, pH 8.0. Small cultures of 100 mL were grown in 500 mL Erlenmeyer flasks with shaking under constant illumination of cool white light at 40–80 μmol photons m−1s−1 to the mid-to-late exponential phase of growth (OD730 = 0.8–1.5).

2.2. Data Collection

We conducted four experiments using a hyperspectral USB 4000 radiometer (Ocean Optics, Inc., Dunedin, FL, USA) for the spectroscopic analysis of the cyanobacterial species. The objective of these experiments was to study the spectral reflectance properties of cyanobacteria with changing pigment concentration. Synechocystis was used in the first three experiments whereas Anabaena was studied in the fourth experiment. In all experiments, we acquired the % reflectance (ρλ) data of the two cyanobacterial species at varying concentrations and also in association with different concentrations of green algae. In the experiments, water samples that were scanned to acquire (ρλ) data were prepared as follows. First, 100 mL of an exponential phase culture of a particular BG species was mixed with 500 mL of water for dilution and the dilution sequence was continued by adding 100, 200, and 500 mL of tap water subsequently to achieve the PC concentration levels shown in Table 1.
Samples were placed in containers painted black and scanned under controlled light from two 500 watt halogen lamps. Calibrated USB 4000 spectroradiometer with a 25o field of view (FOV) optical fiber was used to acquire the upwelling radiance (Lλ,target) data of the water samples. The spectroradiometer was calibrated by measuring the upwelling radiance (Lλ,cal) of a Spectralon reflectance standard with 99% reflectance (Labsphere, Inc., North Sutton, NH, USA). ρλ was computed using the calibration panel coefficient (calcoeff) (available in the CALMIT Data Acquisition Program (CDAP; CALMIT, University of Nebraska-Lincoln, NE, USA). ρλ data were collected within a range of 400–900 nm with a spectral resolution of 1 nm. The equation used to compute ρλ is presented below:
ρ λ = ( L λ , t arg   e t L λ , c a l ) × c a l c o e f f
PC and Chl-a concentrations were measured after each dilution step by using a chlorophyll sensor (part no. 6025) and BGA (PC) sensor (part no. 6131) attached to a YSI 6600 Multi-parameter water quality sonde (YSI Inc., Yellow Springs, OH, USA). Chl-a sensor measures in a range 0 to 500 µg L−1 with a resolution of 0.1 µg L−1 and linearity with an R2 of 0.9999 relative to serial dilution of rhodamine with solution in the range from 0 to 500 µg L−1. BGA (PC) sensor for PC measures in a range 0:280,000 cell mL−1. The resolution of the BGA (PC) sensor is 220 cells mL−1. Linearity of the BGA (PC) sensor has R2 of 0.99 for serial dilution of rhodamine with solution from 0 to 400 µg L−1 (YSI user's manual). Sensors were calibrated before use as per the instructions in the YSI user manual. However, the readings from YSI sensors are in cells mL–1, a relative unit, which should be considered as a proxy for PC concentrations or cyanobacterial biomass. In the first experiment (Exp I), measured ranges of Chl-a and PC were 0.7 to 7.8 µg L−1 and 7,050 to 247,960 cells mL−1, respectively. The same procedure and dilution sequence was repeated in the second experiment (Exp II) on a different day. The measured Chl-a and PC ranges for Exp II were varied from 1.8 to 3.7 µg L−1 and from 506 to 126,570 cells mL−1 respectively.
In experiment III and IV (Exp III and Exp IV), measurements were started with low concentrations of pigment in the water samples. BG cells from a dense culture were added step-wise to increase concentrations subsequently. The minimum and maximum concentration of recorded Chl-a and PC in Exp III were 2.1 and 21.9 µg L−1, and 4,095 and 273,883 cells mL−1 respectively. In Exp IV, we studied Anabaena with cell densities ranging from 4,550 to 244,500 cells mL−1. The descriptive statistics of all experimental data are summarized in Table 1.
Table 1. Descriptive statistics of pigment measurements in the four proximal sensing experiments. N refers to the total number of readings acquired. Chl-a data was not acquired in Exp. IV.
Exp.PigmentMeanStd. Dev.RangeMinMaxN
IPC (cells mL–1)85529.8275586.96240910.007050.00247960.0011
Chl-a (µg L–1)3.402.397.100.707.808
IIPC (cells mL–1)50409.4041727.17126064.00506.00126570.0020
Chl-a (µg L–1)2.480.781.901.803.705
IIIPC (cells mL–1)118360.00100771.72269788.004095.00273883.0012
Chl-a (µg L–1)13.327.1219.802.1021.9012
IVPC (cells mL–1)94137.0976424.23239950.004550.00244500.0011
Two additional datasets were acquired during Exp III and IV in order to study the reflectance spectra of Synechocystis and Anabaena in association with varying concentration of green algae (Ankistrodesmus falcatus). The data were used to study the influence of high Chl-a concentration on reflectance spectra of PC and the dynamics of various optical features in PC reflectance spectra. The PC concentration was kept constant at 180,000 cells mL−1 for Synechocystis and 220,000 cells mL−1 for Anabaena; whereas the green algae concentration was increased in sequence for both of the experiments. This was achieved by keeping the Synechocystis or Anabaena at the above described concentration level, while continuing to add Ankistrodesmus in order to increase the Chl-a concentration.

3. Results and Discussion

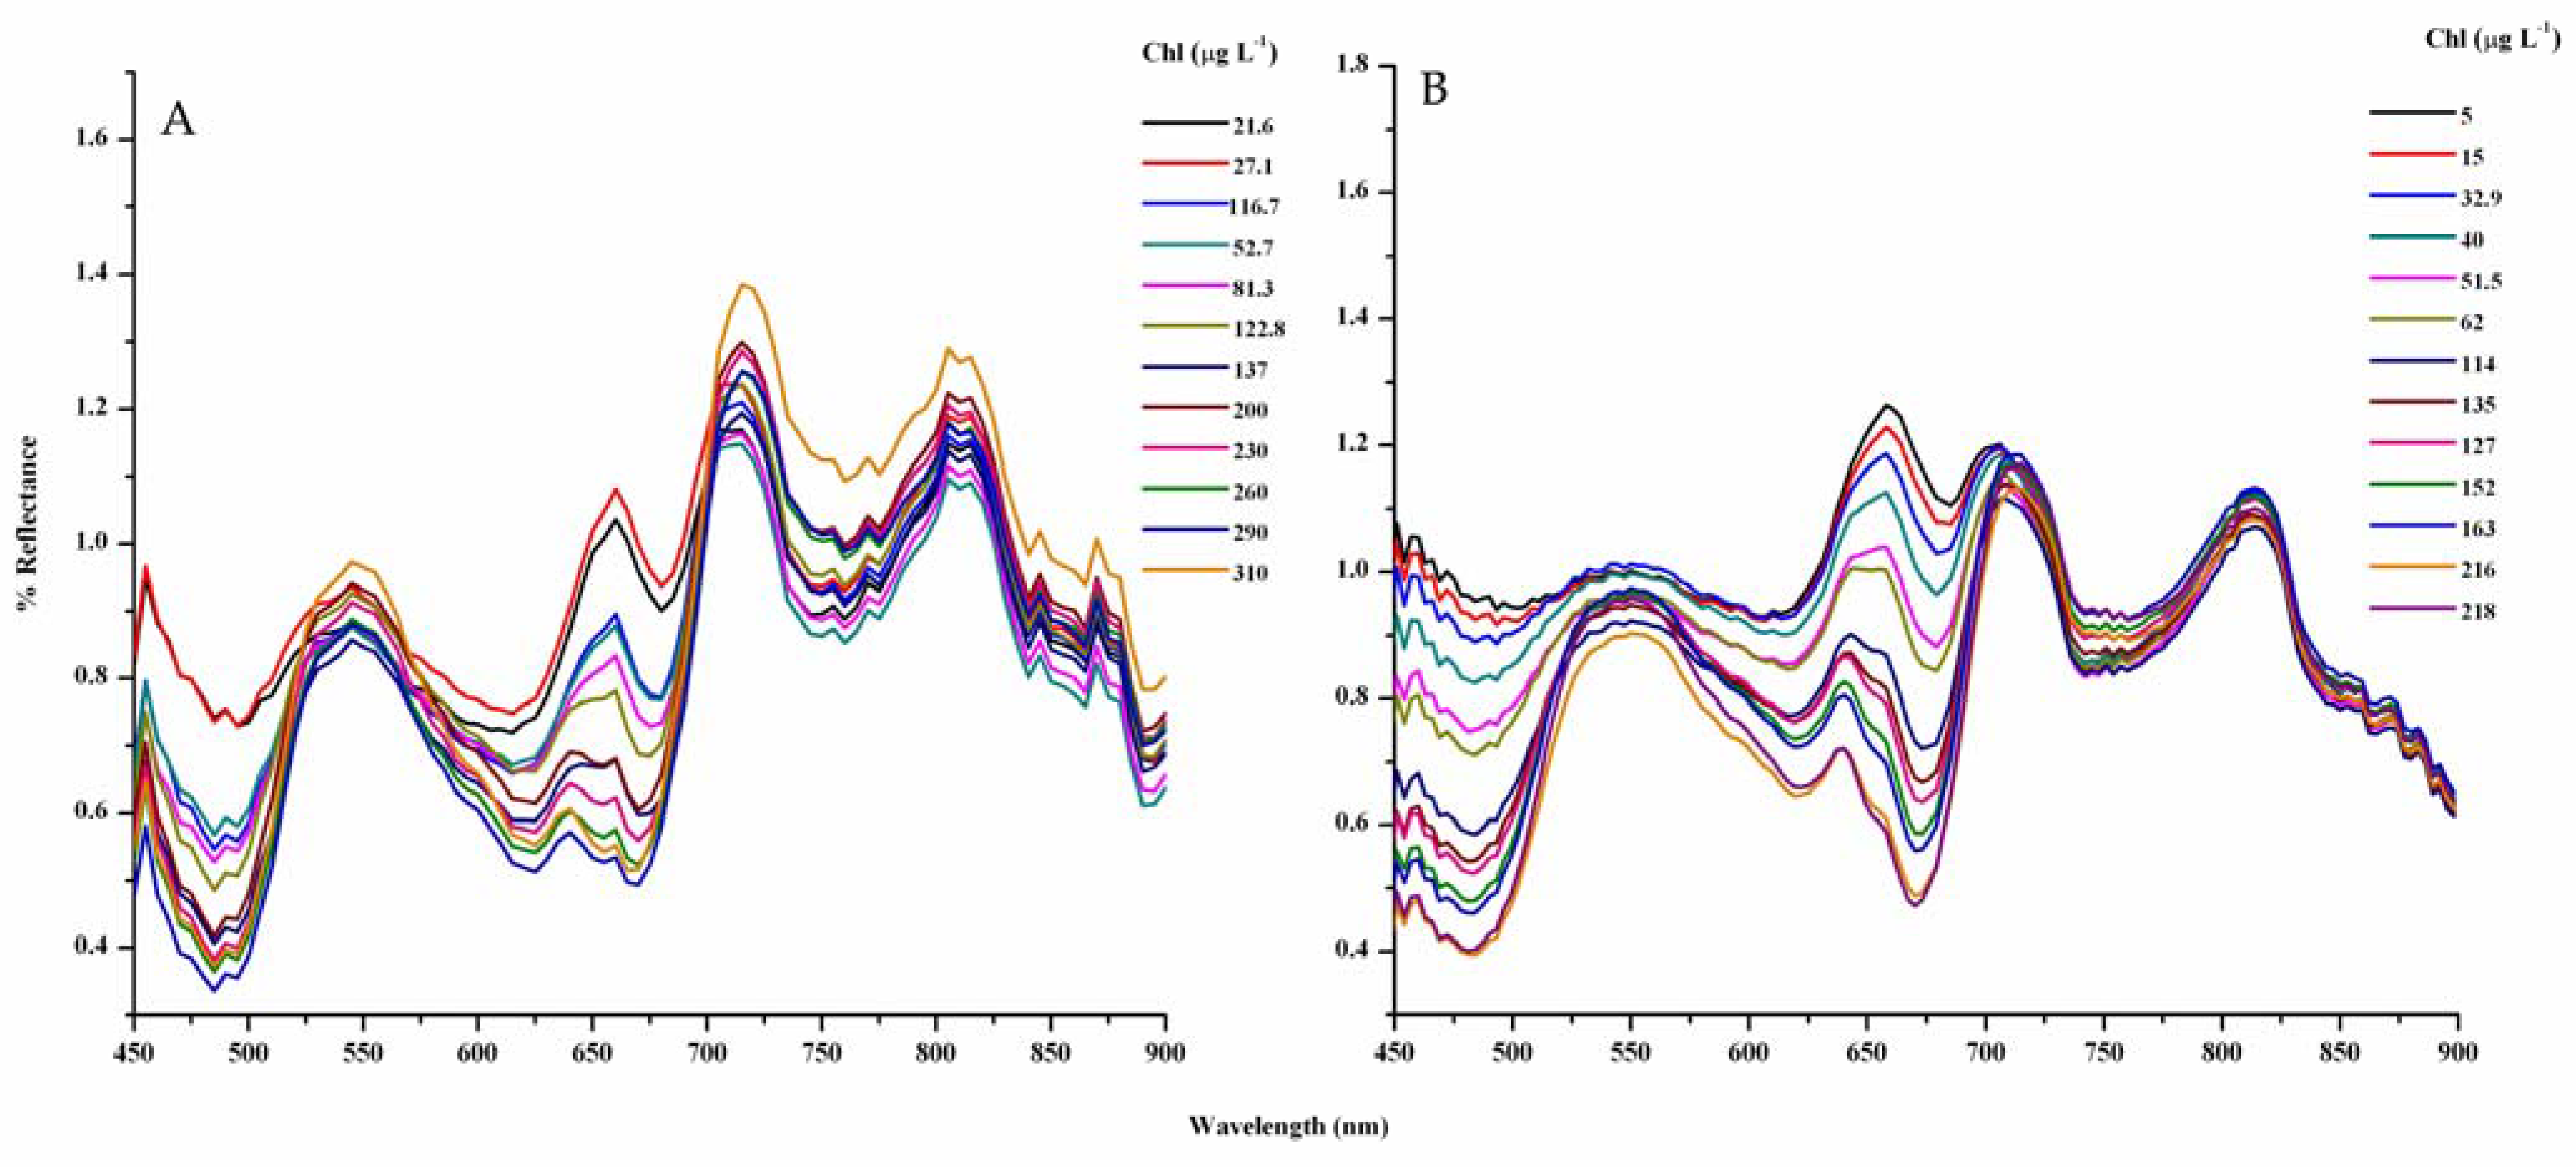
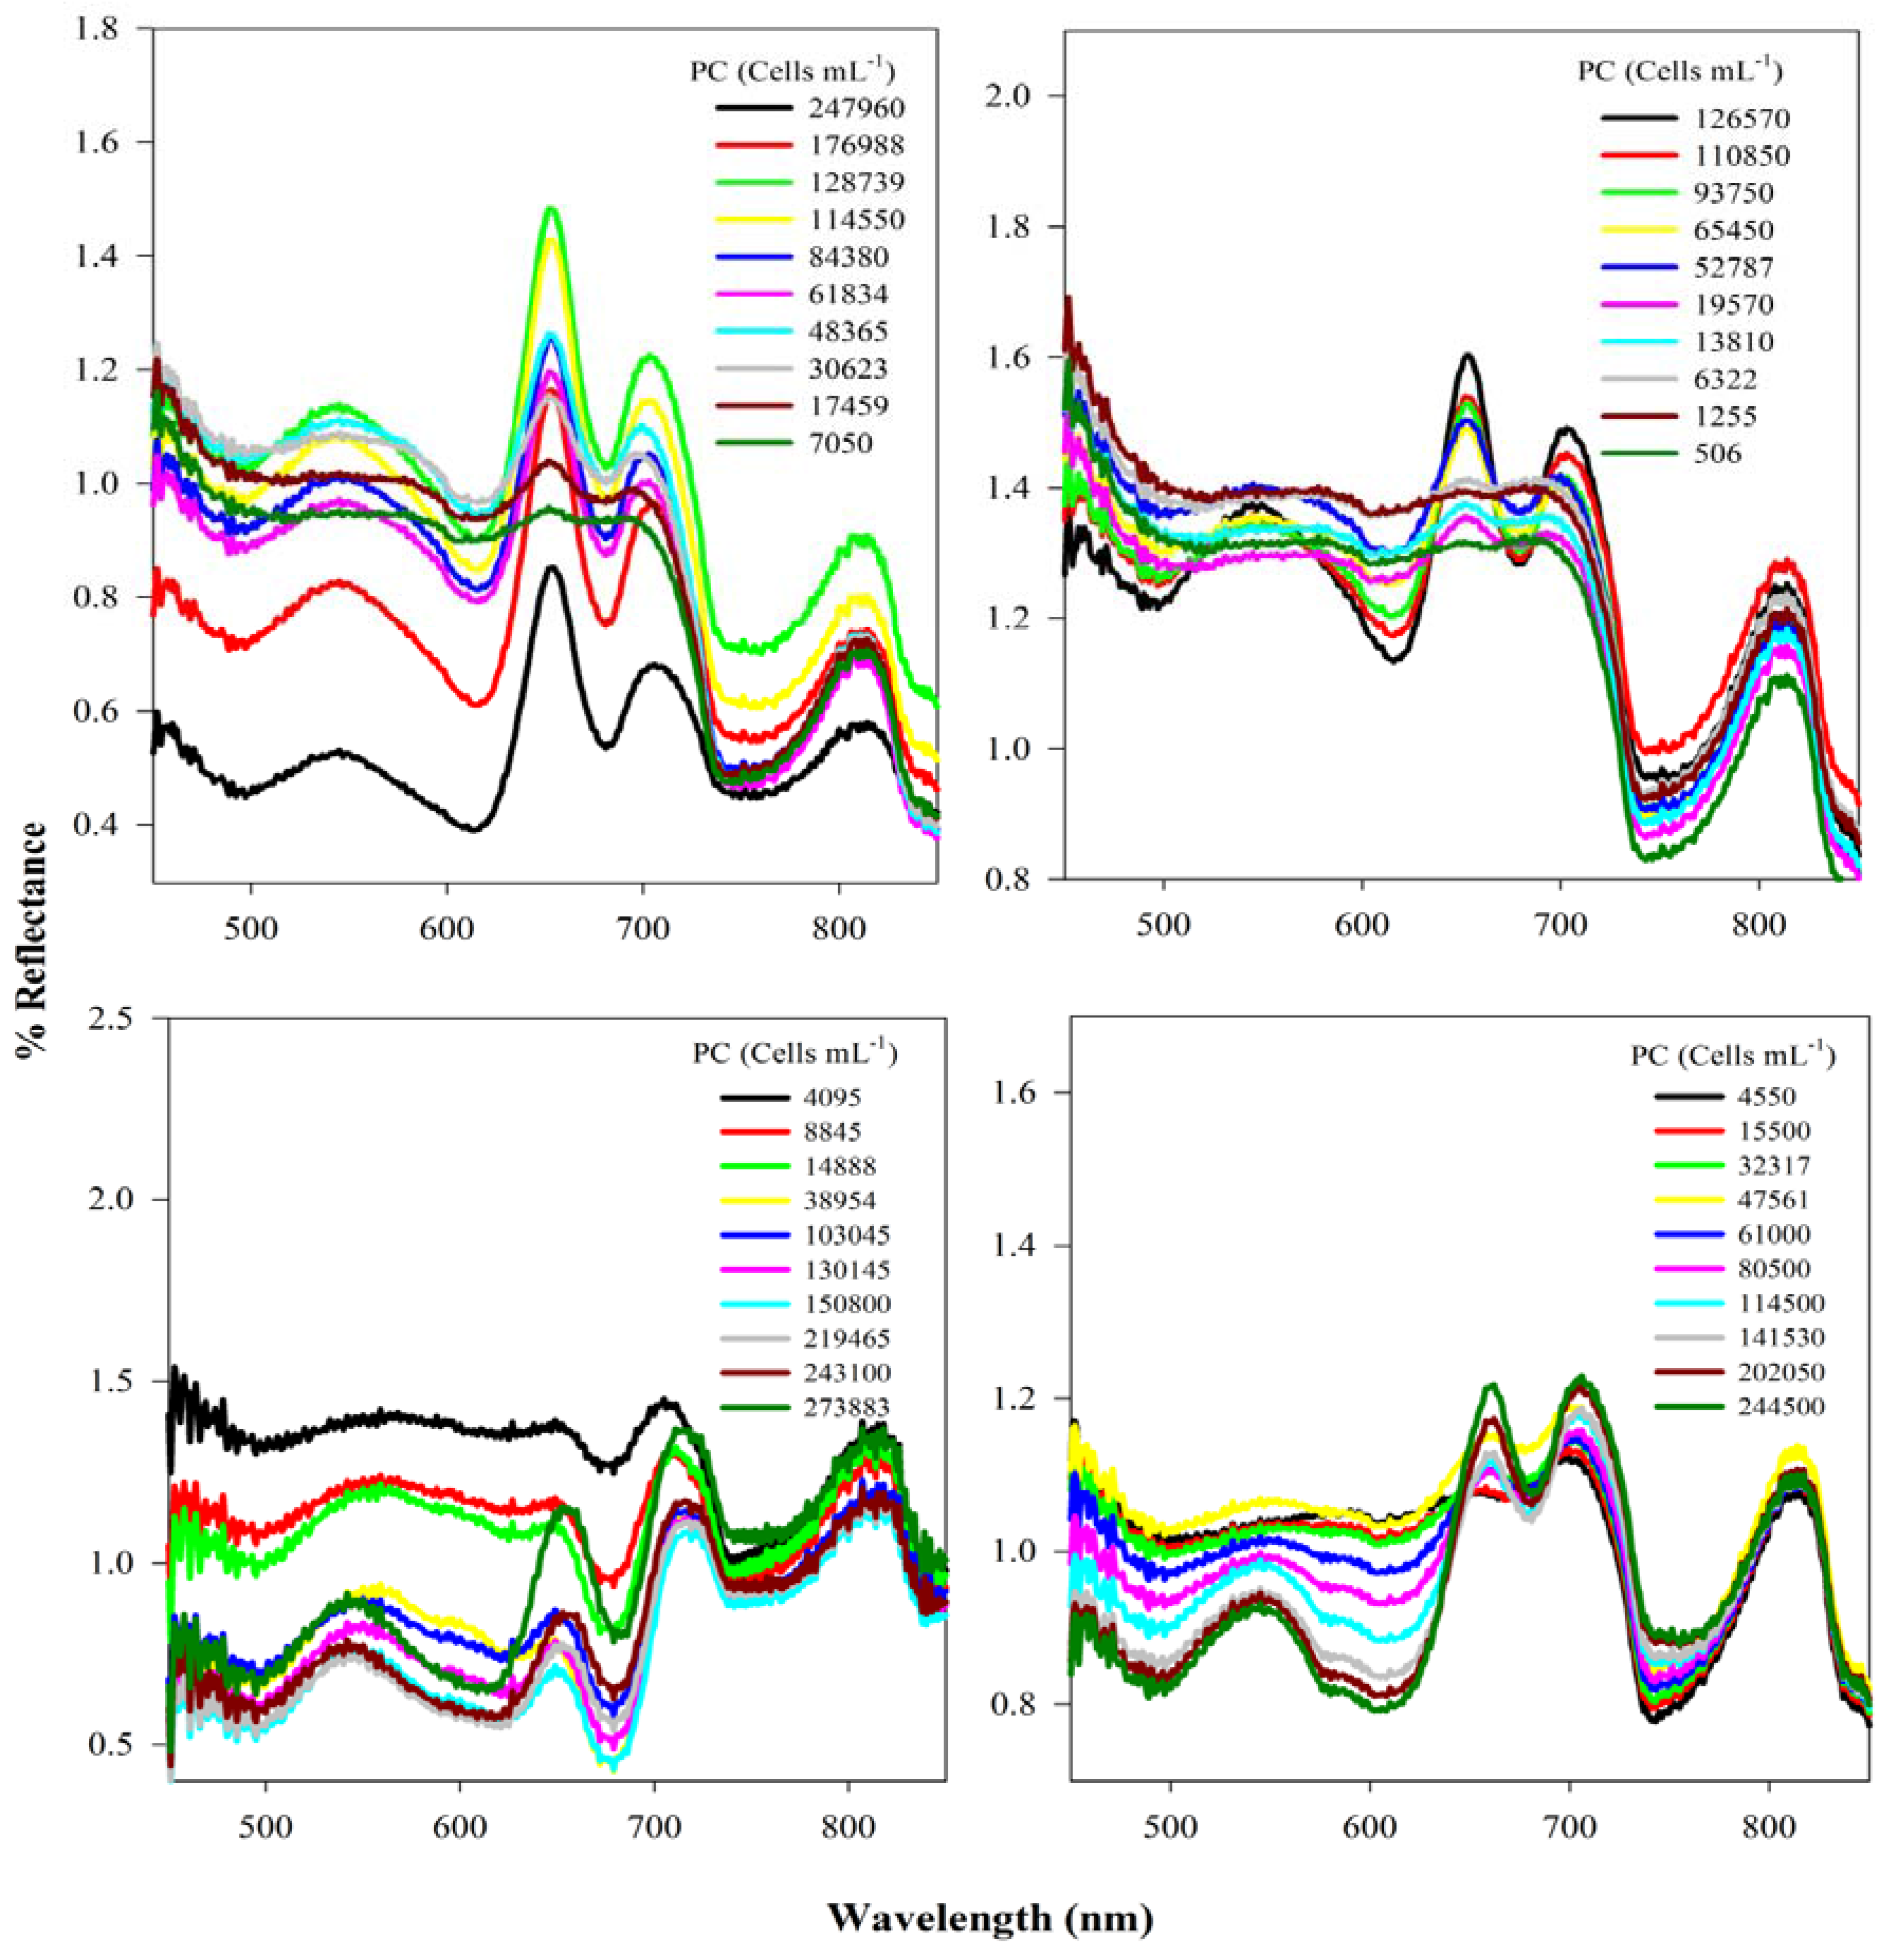
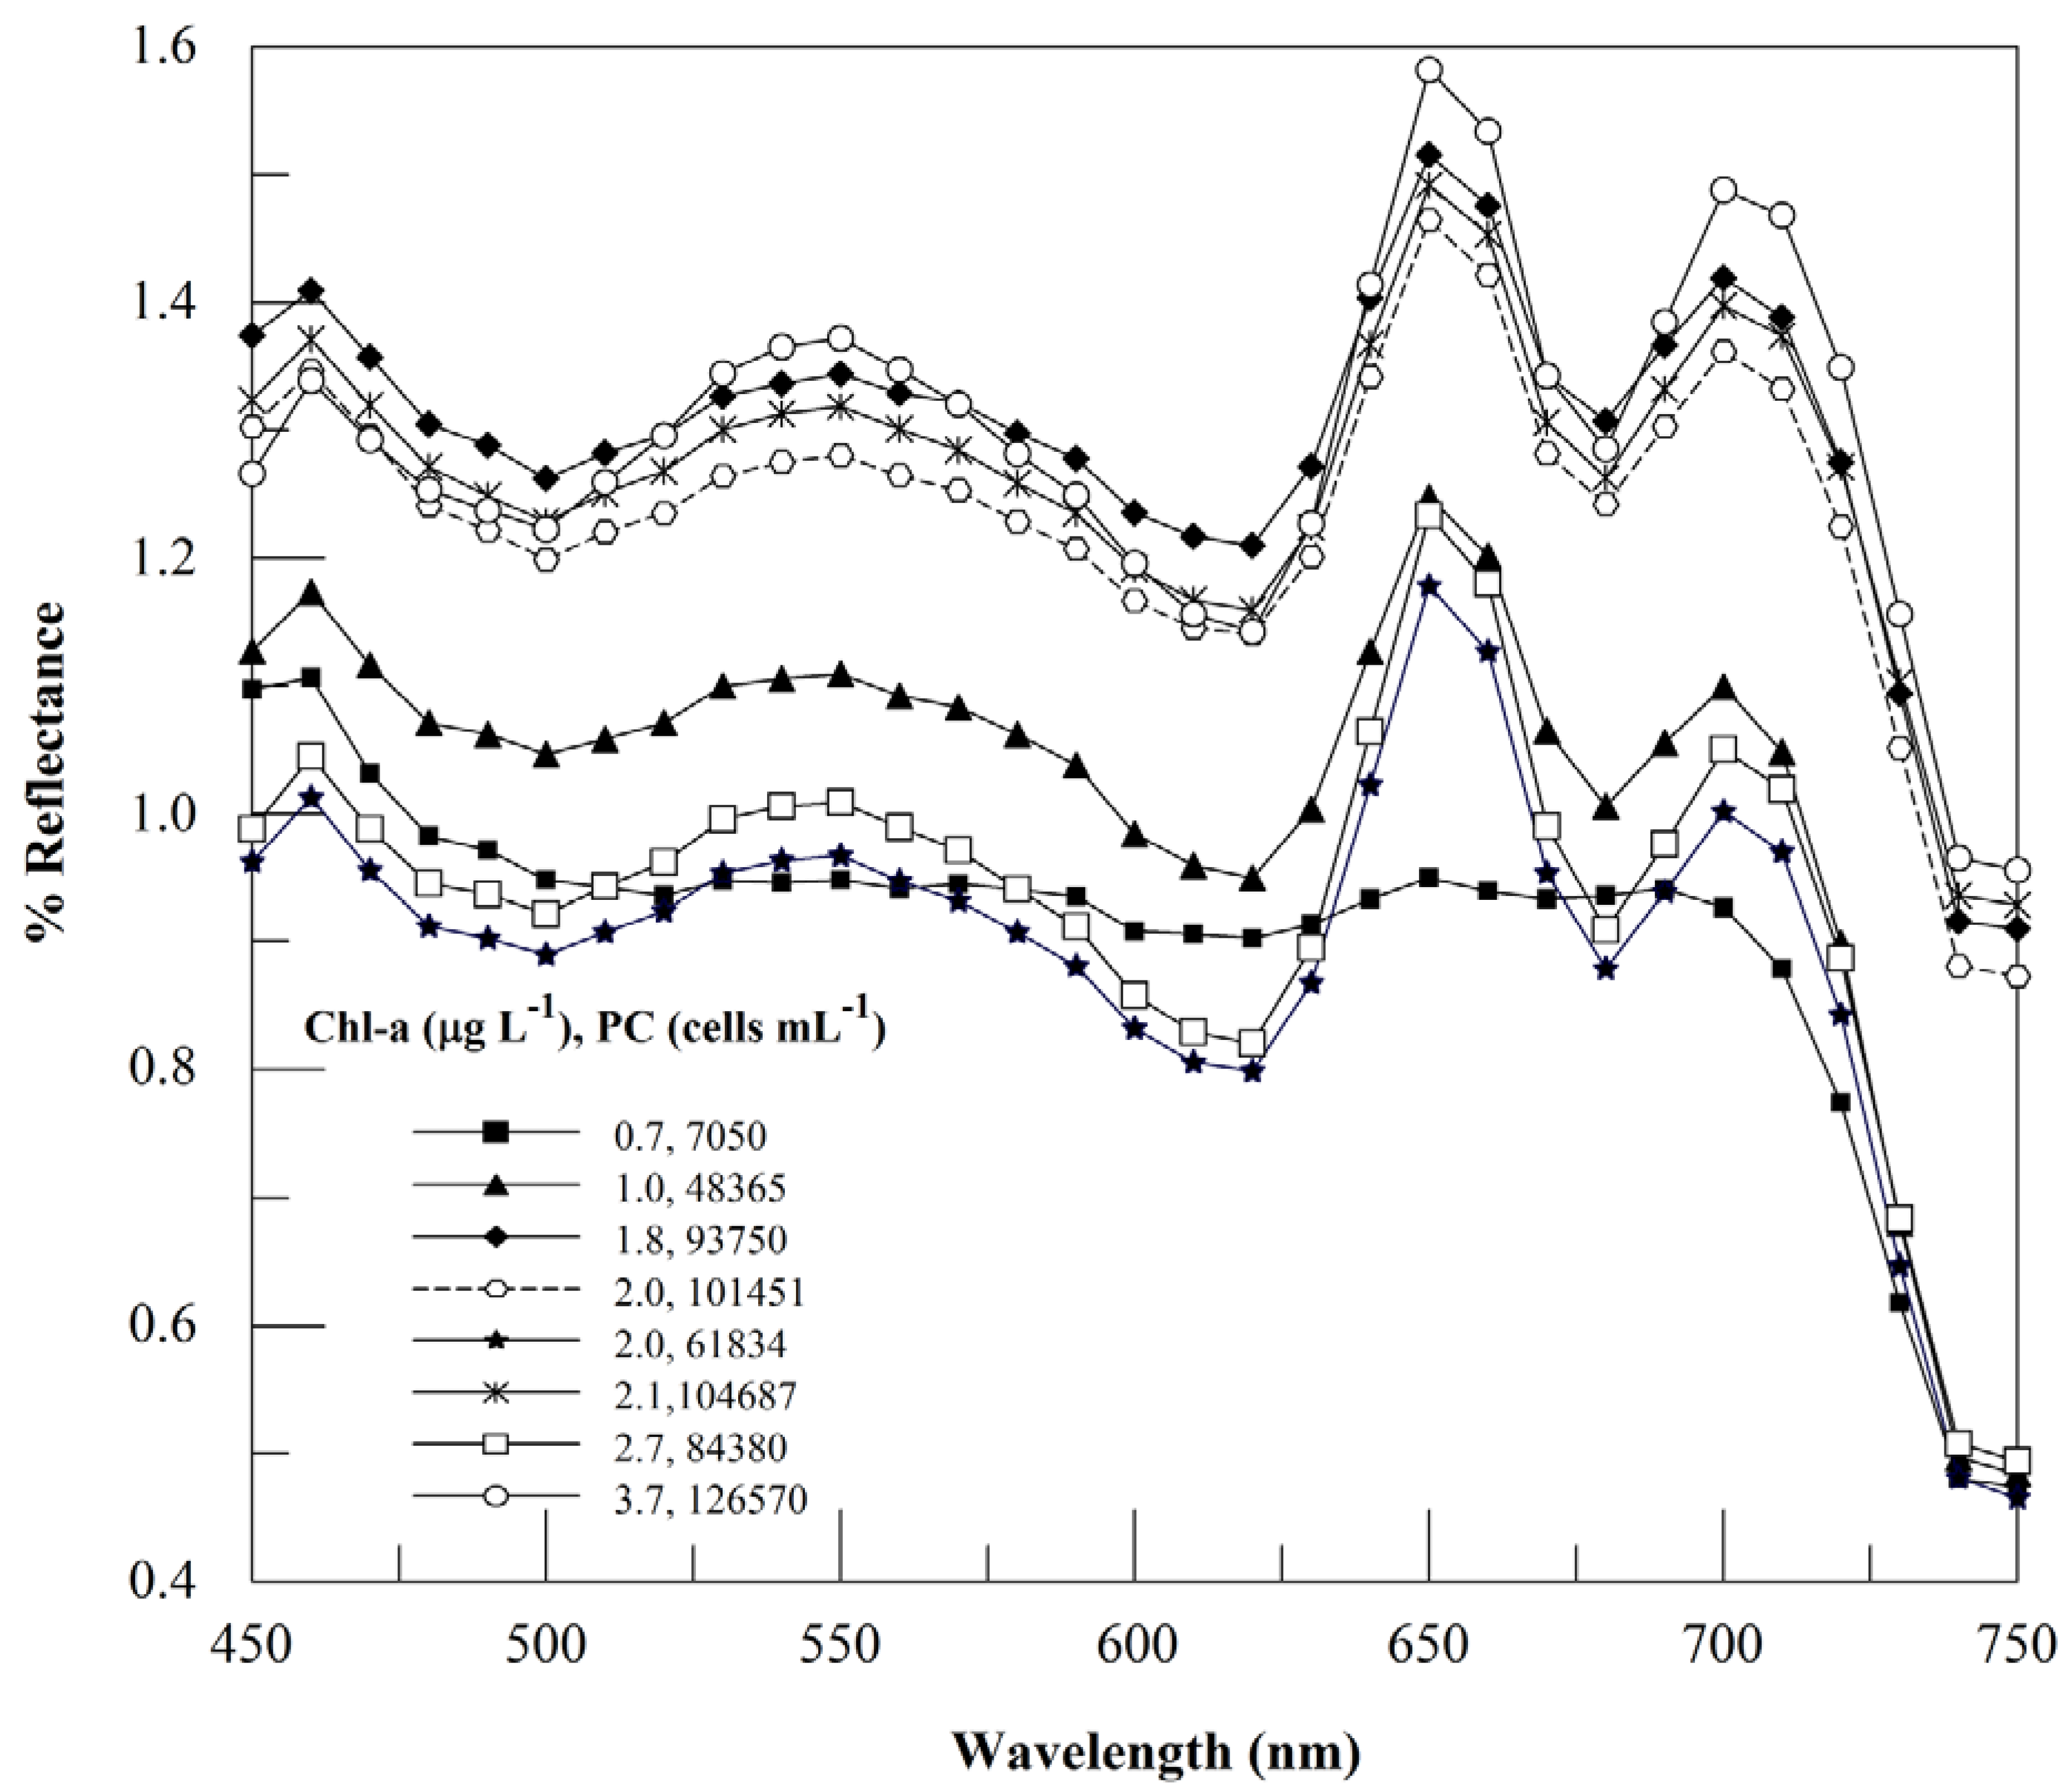
3.1. Analysis of Reflectance Spectra

Spectral characteristic features of the pigments Chl-a and PC are prominent in the reflectance spectra of Synechocystis (Exp I-III) and Anabaena (Exp IV) (Figure 1). The green peak at approximately 550 nm is due to the scattering from algal cells in the water and also due to the relatively low absorption by Chl-a and carotenoids [17,18] (Figure 1). The spectral troughs near 617 nm and 680 nm appear because of strong absorption by PC and Chl-a, respectively [9,18,19], whereas the peak at 654 nm appears because of the prominent absorption on both sides at 617 nm and 680 nm and also because of the phycocyanin fluorescence maximum at 650 nm [20]. The magnitudes of the 654 nm peak observed in the reflectance spectra of both laboratory cultured cyanobacteria species were significantly higher compared to several previously published spectra acquired from natural water [9,10,11,14]. Similarly, a peak near 700 nm appears because of two strong absorption features on either side, one by Chl-a at 680 nm and the other by water itself at 750 nm [17]. The spectral characteristics of Anabaena (the position of absorption minima and reflectance maxima) appeared similar to those found for Synechocystis PCC 6803 (Figure 1D).
Figure 1. (A, B, C) Percent reflectance spectra of Synechocystis PCC 6803 from Exp I, II, III respectively. (D) Percent reflectance spectra of Anabaena from Exp IV.
Remotesensing 01 00758 g001

3.2. Context for Model Development

We wanted to develop a relationship between PC concentration and several band ratios. Our first approach was to test previously used band ratio algorithms from the literature to quantify PC. The performance of two widely used band ratio algorithms including ( ρ 617 1 ρ 654 ) [9] and ( ρ 620 1 ρ 709 ) adopted from [8] is presented (Figure 2). During model calibration, simple linear regression was performed between band ratios and measured PC concentrations from the first three experiments. Both band ratios were highly correlated to PC concentration with high coefficients of determination (R2) of 0.96 and 0.97, respectively, in each individual experimental dataset, but they did not perform well during validation with the dataset from Exp IV (Figure 2). We concluded that the performance of existing band ratios are highly dependent of varying chlorophyll-a concentrations, and hence dependant on PC to Chlorophyll ratio. The poor validation result can be explained by analyzing the model calibration plot of both band ratio algorithms (Figure 2A,B). It showed that at the same PC concentration, spectral band ratios ( ρ 617 1 ρ 654 ) and ( ρ 620 1 ρ 709 ) (from three different experiments have different trend lines. Hence, it can be concluded that PC is not the only parameter, rather there might be other pigments, most likely Chl-a, that control the reflectance at both 620 and 654 nm. This preliminary research provided the context for studying the dynamics of 620 and 654 nm peaks and their usefulness in band ratio algorithms to quantify PC concentration from remote sensing data.
Figure 2. Scatter plots of spectral band ratios such as, A. ( ρ 617 1 ρ 654 ) B. ( ρ 620 1 ρ 709 ) and C. ( ρ 600 1 ρ 700 ) , versus measured PC concentration (cells mL−1). Note that the newly developed spectral band ratio (C) has similar trends in all three experiments and outperforms the existing spectral band ratios.
Remotesensing 01 00758 g002

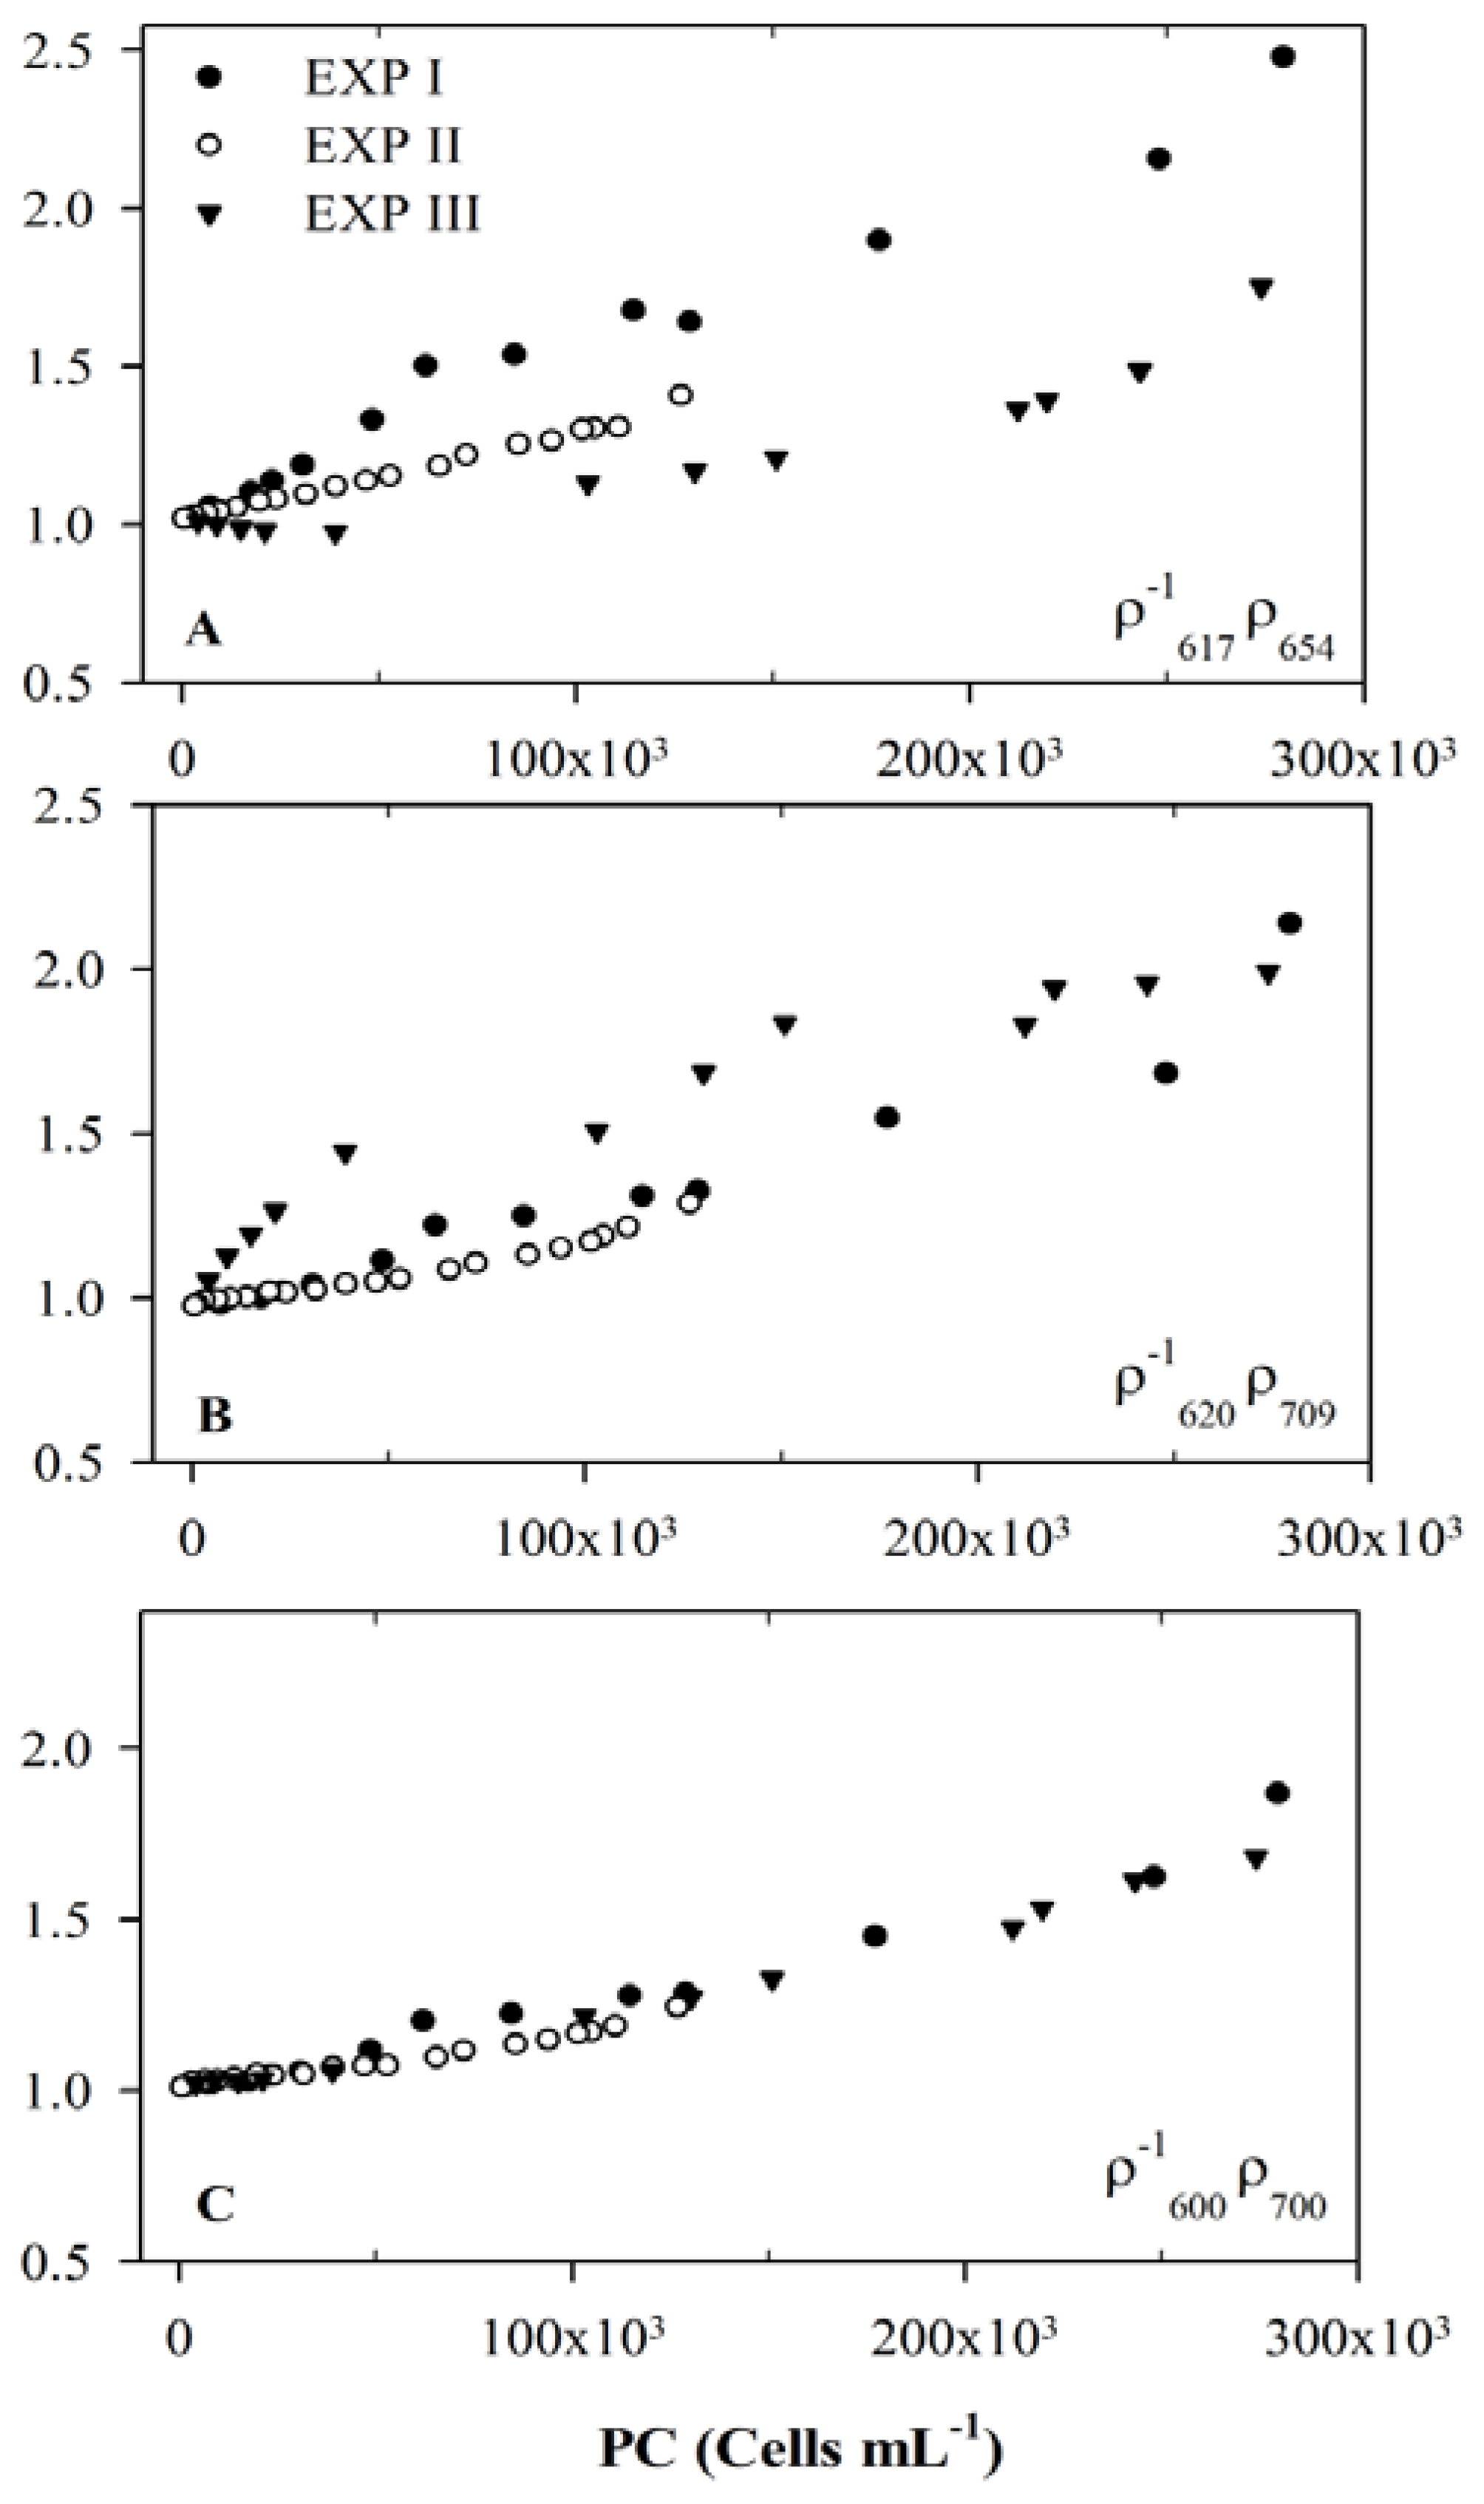
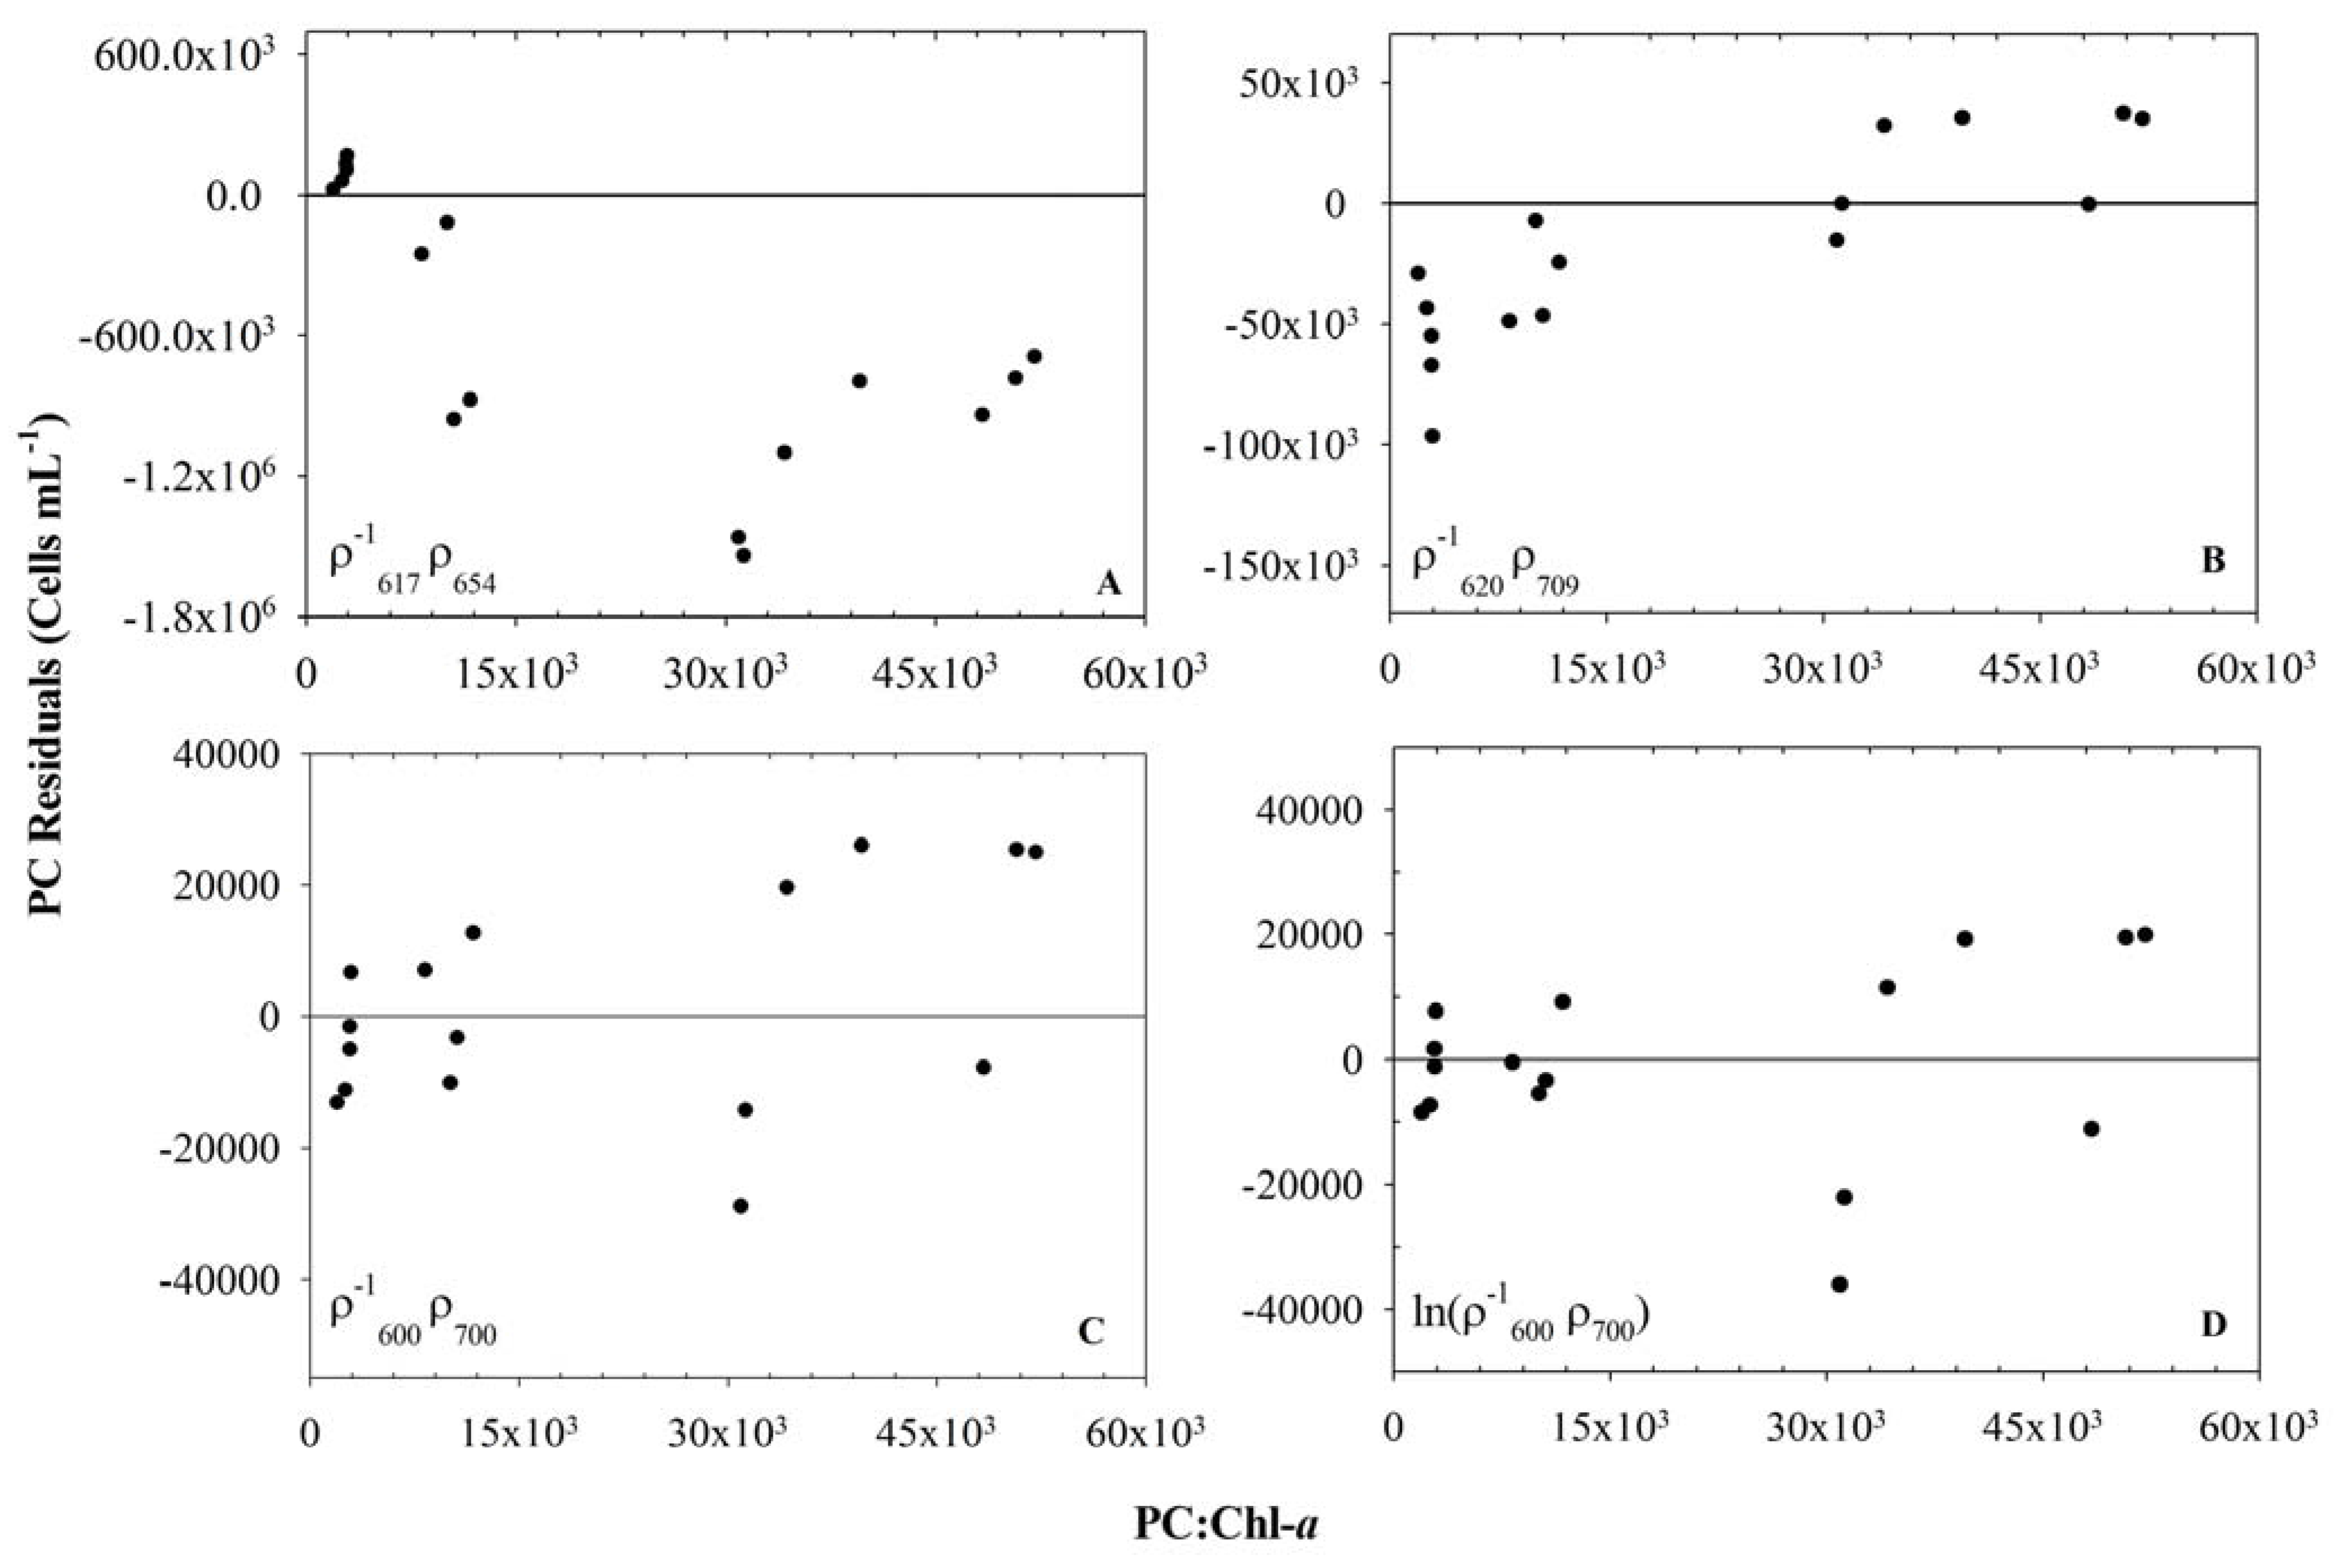
3.3. Usefulness of 654 nm Peak in PC Band Ratio Models

We observed from our experimental data that the peak at 654 nm, which appears because of the absorption by PC and Chl-a on both side at 617 and 680 nm respectively, is very dynamic in nature. Its appearance and magnitude depends on PC, Chl-a and b concentrations. Metsamaa et al. [15] reported that Rrs peak at 650 nm only appears and can be detected by remote sensing instruments (with 10 nm spectral resolution and 1,000:1 signal-to-noise ratio) when Chl-a concentration reaches 8–10 mg m−3. However, in a few experiments we observed that the 654 nm peak appeared on the reflectance spectra acquired by USB4000 (sampled at 10 nm spectral resolution with 250:1 signal-to-noise ratio) even when the Chl-a and PC concentration were 0.7 µg L−1 (or 0.7mg m−3) and 7,050 cells mL−1, respectively (Figure 3). On the other hand, in another experiment, we did not observe the peak at 654 nm even when the Chl-a and PC concentrations were 7.4 µg L−1 and 21,050 cells mL−1, respectively. That proved our initial conclusion that the proportion of the concentration of PC to Chl-a controls the appearance of the 654 nm peak.
Figure 3. Percent reflectance spectra of Synechocystis and Anabaena showing appearance and dynamics of 650 nm peak at different Chl-a concentrations.
Remotesensing 01 00758 g003
Similarly in Exp III, when the Chl-a concentration was 2.1–7.4 µg L−1 and PC concentration was 4,095–21,050 cells mL−1, the high Chl-a concentration strongly absorbed light at 654nm, thereby lowering the ( ρ 617 1 ρ 654 ) ratio. Consequently, no peak appeared at 654 nm even if the PC concentration was sufficient enough to form the peak. Hence, two conclusions can be drawn from the experimental data: (1) when Chl-a concentration is ≥2.1 µg L−1, the 654 nm peak does not appear on the reflectance spectra of BG even with cell concentrations up to 21,050 cells mL−1, whereas with the prescence of 0.5 µg L–1 of Chl-a and 7,050 cells mL–1 of PC, the 654 nm peak appeas; and therefore the appearance of 654 nm peak is entirely dependent on PC to Chl-a ratio; (2) 654 nm peak is dynamic and influenced by Chl-a, therefore cannot be used in algorithms to predict PC concentrations.
Therefore, it is clear from the experiments that the appearance of the 654 nm peak depends on both Chl-a and PC concentration, and also on the 654 to 617 nm reflectance ratio. The specific absorption spectrum of PC shows that the absorption at 617 nm is three-fold higher than at 654 nm [21], however, if Chl-a is also present in the water along with PC, the absorption at 654 nm would increase. Hence in the presence of high Chl-a, higher concentrations of PC are also required to be present in the water in order to form the prominent 654 nm peak. This suggests that Chl-a is the major contributing pigment that affects the magnitude of the 654 nm peak. The predictive ability of the spectral band ratio algorithms containing ρ654 therefore depends on the concentration of Chl-a, and because of this, the 654 nm peak cannot be accurately used to quantify PC efficiently in the case of variable PC:Chl-a ratios in water.
In the two additional experiments, the PC concentration was kept constant and the Chl-a concentration was increased in sequence by adding cultured Ankistodesmus, a green algae, to explore the dependence of the peak at 654nm on Chl-a and Chl-b. As the Chl-a concentration increased, the 654 nm peak shifted to 660 nm, and another reflectance peak appeared at 640 nm when the Chl-a concentration reached 122.8 µg L−1 (Figure 4A,B). Movement of the 654 nm peak to 660 nm might be due to absorption by Chl-b which is a major accessory photopigment in green algae. On the other hand, the Chl-a absorption feature blue-shifted from 680 nm to 670 nm at 310 µg L−1 of Chl-a. This blue-shift may be explained by the dominance of scattering by algal cells and fluoresence by Chl-a at 680 nm over absorption at the same wavelength. Thus the ρ678–682 started increasing and the absorption by Chl-a became prominent at 670 nm. This instability of the 654 nm peak with increasing Chl-a and b also points to the lack of utility of this peak in empirical models to quantify PC.

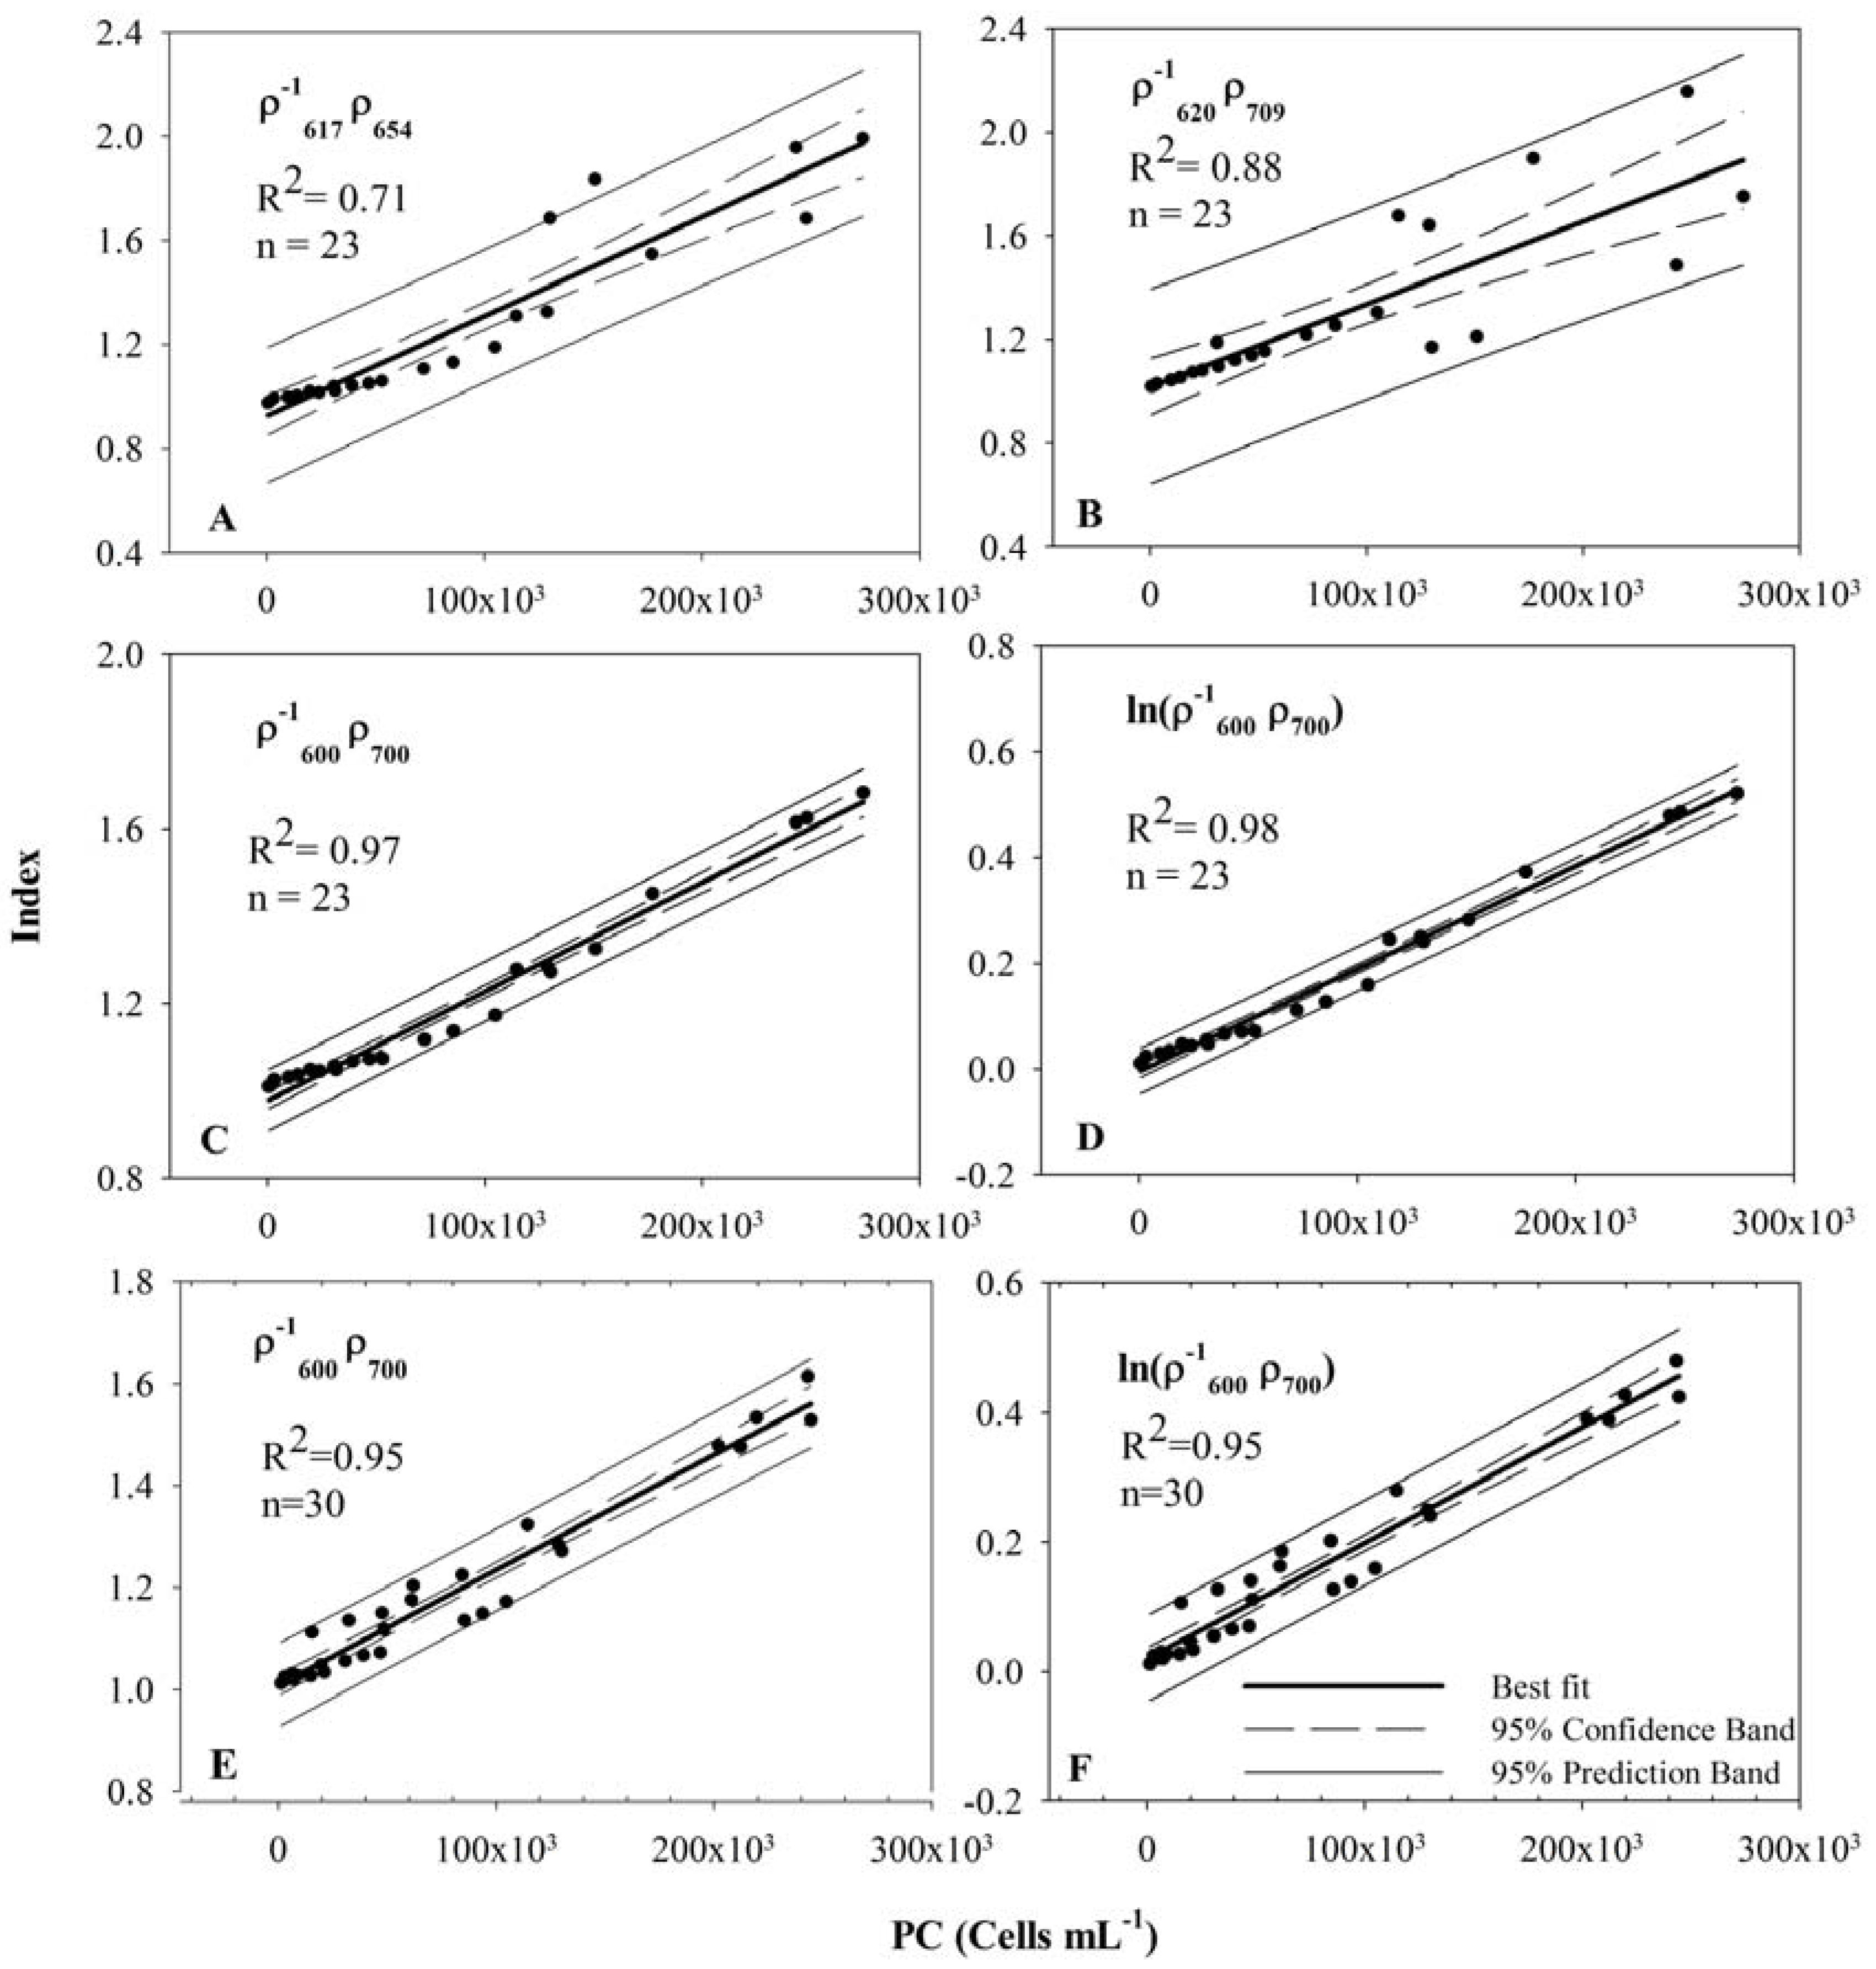
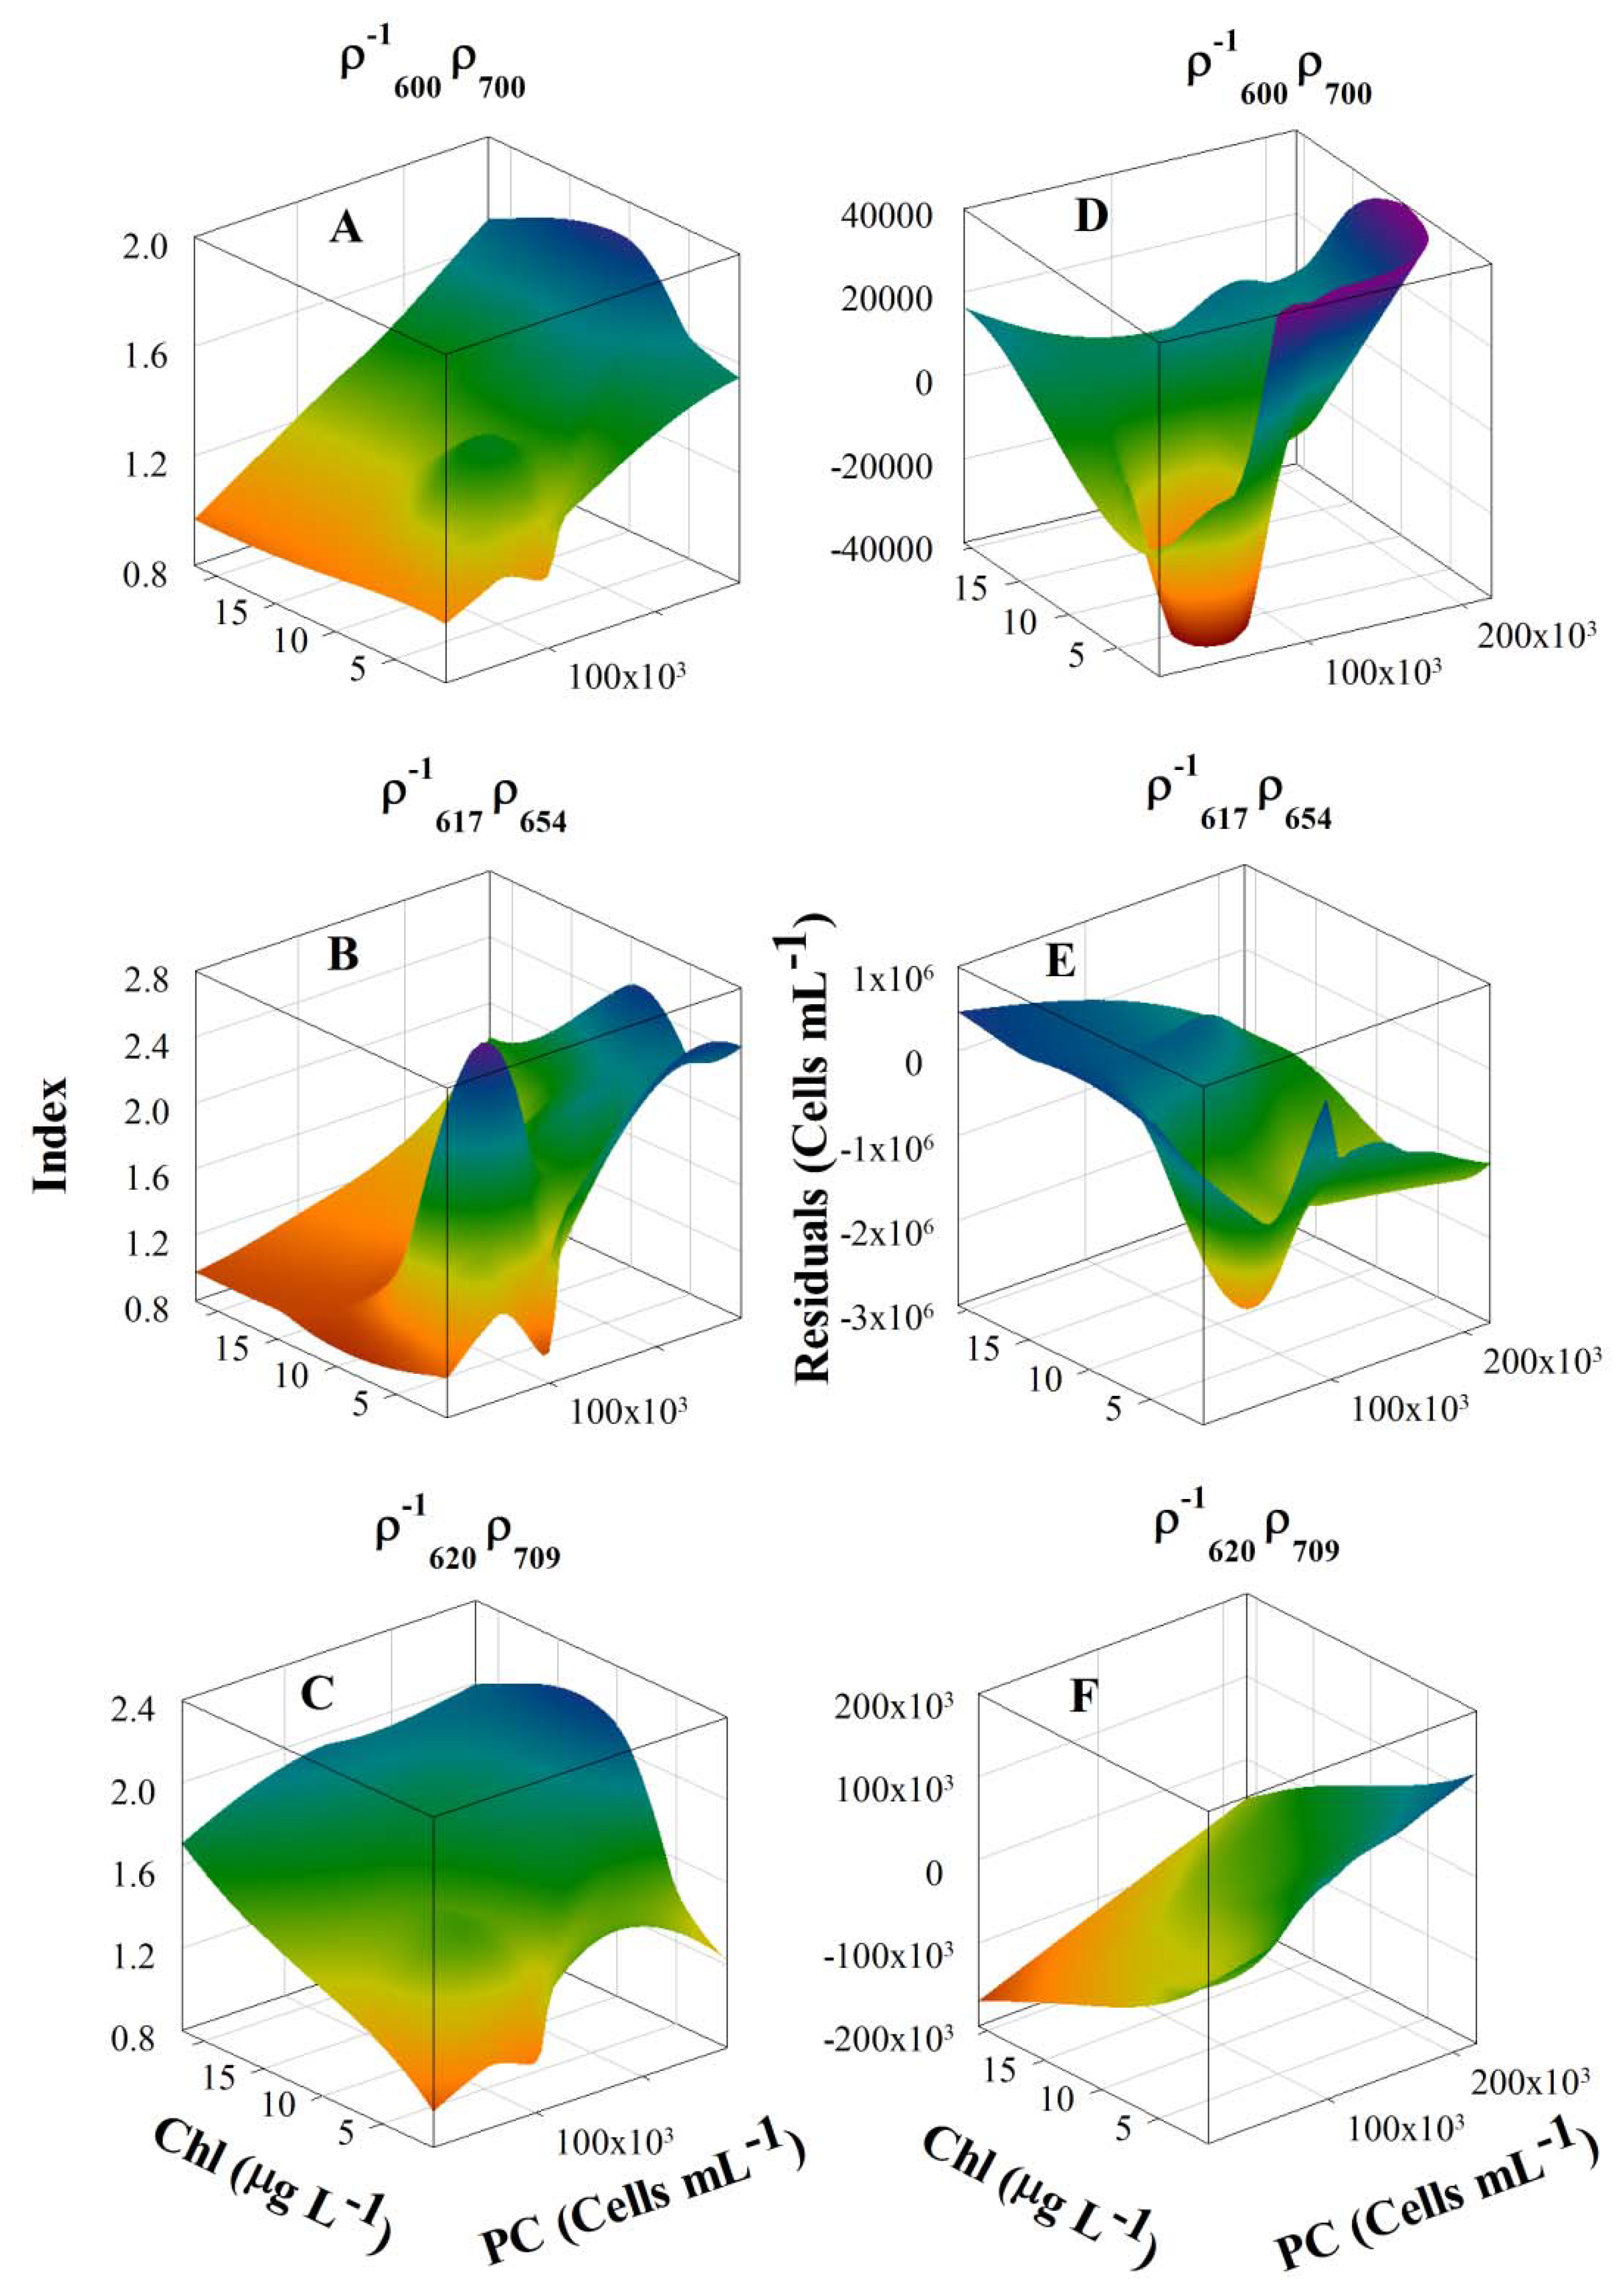
3.4. Model Development and Calibration

We discussed in the previous section that ( ρ 617 1 ρ 654 ) ratio does not have good PC predictive ability because both of the bands are sensitive and respond to the change in Chl-a and PC concentrations. Therefore, any empirical relation developed for one dataset using these bands will not hold for another dataset with varying Chl-a concentration. Hence, our research was designed to develop an empirical relationship between spectral reflectance and PC using a band ratio that would be nearly independent of Chl-a influence, so that it will have better PC predictive ability.
Figure 4. Effect of varying green algae concentrations on (A) Synechocystis and (B) Anabaena reflectance spectra.
Remotesensing 01 00758 g004
The desired band ratio required two wavelengths those that are maximally and minimally sensitive only to PC concentration. Absorption spectra of Chl-a, b, PC, PE, xanthophylls show that 695–705 nm is a narrow window where water, Chl-a, and PC absorbance are low [22]. Since PC absorption decreases significantly from 705 to 720 nm [22], 700 nm was selected as one spectral band with minimal sensitivity to PC and other pigments. Similarly, another band at 600 nm was selected instead of 617 nm, which is the location of PC absorption maxima, to avoid the influence of Chl-a absorption at 617 nm discussed earlier. Emerson and Lewis’s [23] findings on the photosynthetic efficiency of PC in Chroococcus, a cyanobacterium, shows that the total absorption of light by pigments at 600 nm is because of 89% absorption by PC and 11% absorption by chlorophylls, whereas at 617 nm, the chlorophyll absorption increases to approximately 18%. Hence 600 nm was selected as the second band with maximum sensitivity to change in PC concentration. Thus, ( ρ 600 1 ρ 700 ) ratio was developed on the assumption that it is most sensitive to changes in PC concentration and least sensitive to changes in any other pigment concentration. Scatter plots between the spectral band ratios and PC concentrations for the three experimental datasets show that the performance of the new spectral band ratio was promising in all datasets irrespective of the Chl-a concentration (Figure 2C). The most important finding was that the new algorithm is relatively insensitive to varying Chl-a concentration and also different cyanobacterial species.
All datasets acquired from the experiments I, II, and III were combined and randomly divided into two sets to be used for model calibration and validation. Simple linear regressions between several band ratio algorithms including, (i) ( ρ 600 1 ρ 700 ) (this paper); (ii) ( ρ 617 1 ρ 654 ) [9]; and (iii) ( ρ 620 1 ρ 709 ) (adopted from Simis et al. [8]), and measured PC concentration (Figure 5A-D; Table 2). The coefficient of determination involving ( ρ 617 1 ρ 654 ) and ( ρ 620 1 ρ 709 ) models were 0.71 and 0.88, respectively, whereas the newly developed algorithm ( ρ 600 1 ρ 700 ) was strongly correlated with PC (R2 = 0.97). However, we observed a small nonlinearity between ( ρ 600 1 ρ 700 ) and measured PC concentration, and therefore the natural logarithm of the same ratio was regressed with the measured PC concentration. The modified version of the new model ( ln ( ρ 600 1 ρ 700 ) ) was strongly correlated with measured PC concentration (R2 = 0.98) and also showed very strong predictive ability in the validation procedure. In the next step, we extended the model to a different BG species, Anabaena, which was studied in Exp IV to test the applicability of the developed models on other species. Observations from all four experiments were randomly divided into two datasets including one for model calibration (n = 30) and the other for validation (n = 24). The calibration results for both models yielded strong correlation (R2 = 0.95) (Figure 5E, F; Table 2). Calibration results suggest that both the ( ρ 600 1 ρ 700 ) and ( ln ( ρ 600 1 ρ 700 ) ) models can be applied to quantify the concentration of different species of cyanobacteria with high accuracy.
Figure 5. Calibration scatter plots (PC concentration versus Index) for different band ratio models: (A, B, C, D) data from EXP I, II and III (Synechocystis) and (E, F) data from EXP I–IV (Synechocystis and Anabaena). Coefficients of determinations (R2) for each model are also reported in corresponding figures. Outer pairs of lines (solid) represent 95% prediction band, inner pairs of lines (dash) represent 95% confidence band and the central solid lines are linear regression fits.
Remotesensing 01 00758 g005
Table 2. Model parameters and performance: Intercept (a0) and slope (a1) with corresponding standard error of estimate (STE); coefficient of determination (R2); adjusted coefficient of determination; STE of estimate for linear regression of different models obtained using the calibration dataset.
Band Combinationa0 (STE)a1 (STE)R2Adj. R2STE
Synechocystis dataset (Exp I, II and III)
( ρ 617 1 ρ 654 ) 1.0176 (0.0526)3.1921 × 10⁻⁷ (4.3934 × 10⁻⁷)0.710.700.1732
( ρ 620 1 ρ 709 ) 0.9270 (0.0365)3.8154 × 10⁻⁶ (3.0458 × 10⁻⁷)0.880.870.1201
( ρ 600 1 ρ 700 ) 0.9773 (0.0098)2.4985 × 10⁻⁶ (8.1863 × 10⁻⁸)0.970.970.0323
( ln ( ρ 600 1 ρ 700 ) ) −0.0044 (0.006)1.9394 × 10⁻⁶ (5.0150 × 10⁻⁸)0.980.980.0198
Synechocystis and Anabaena dataset (Exp I, II, III and IV)
( ρ 600 1 ρ 700 ) 1.0085 (0.0101)2.2589 × 10⁻⁶ (9.3327 × 10⁻⁸)0.950.950.0387
( ln ( ρ 600 1 ρ 700 ) ) 0.0199 (0.0083)1.7889 × 10⁻⁶ (7.616 × 10⁻⁸)0.950.950.0316

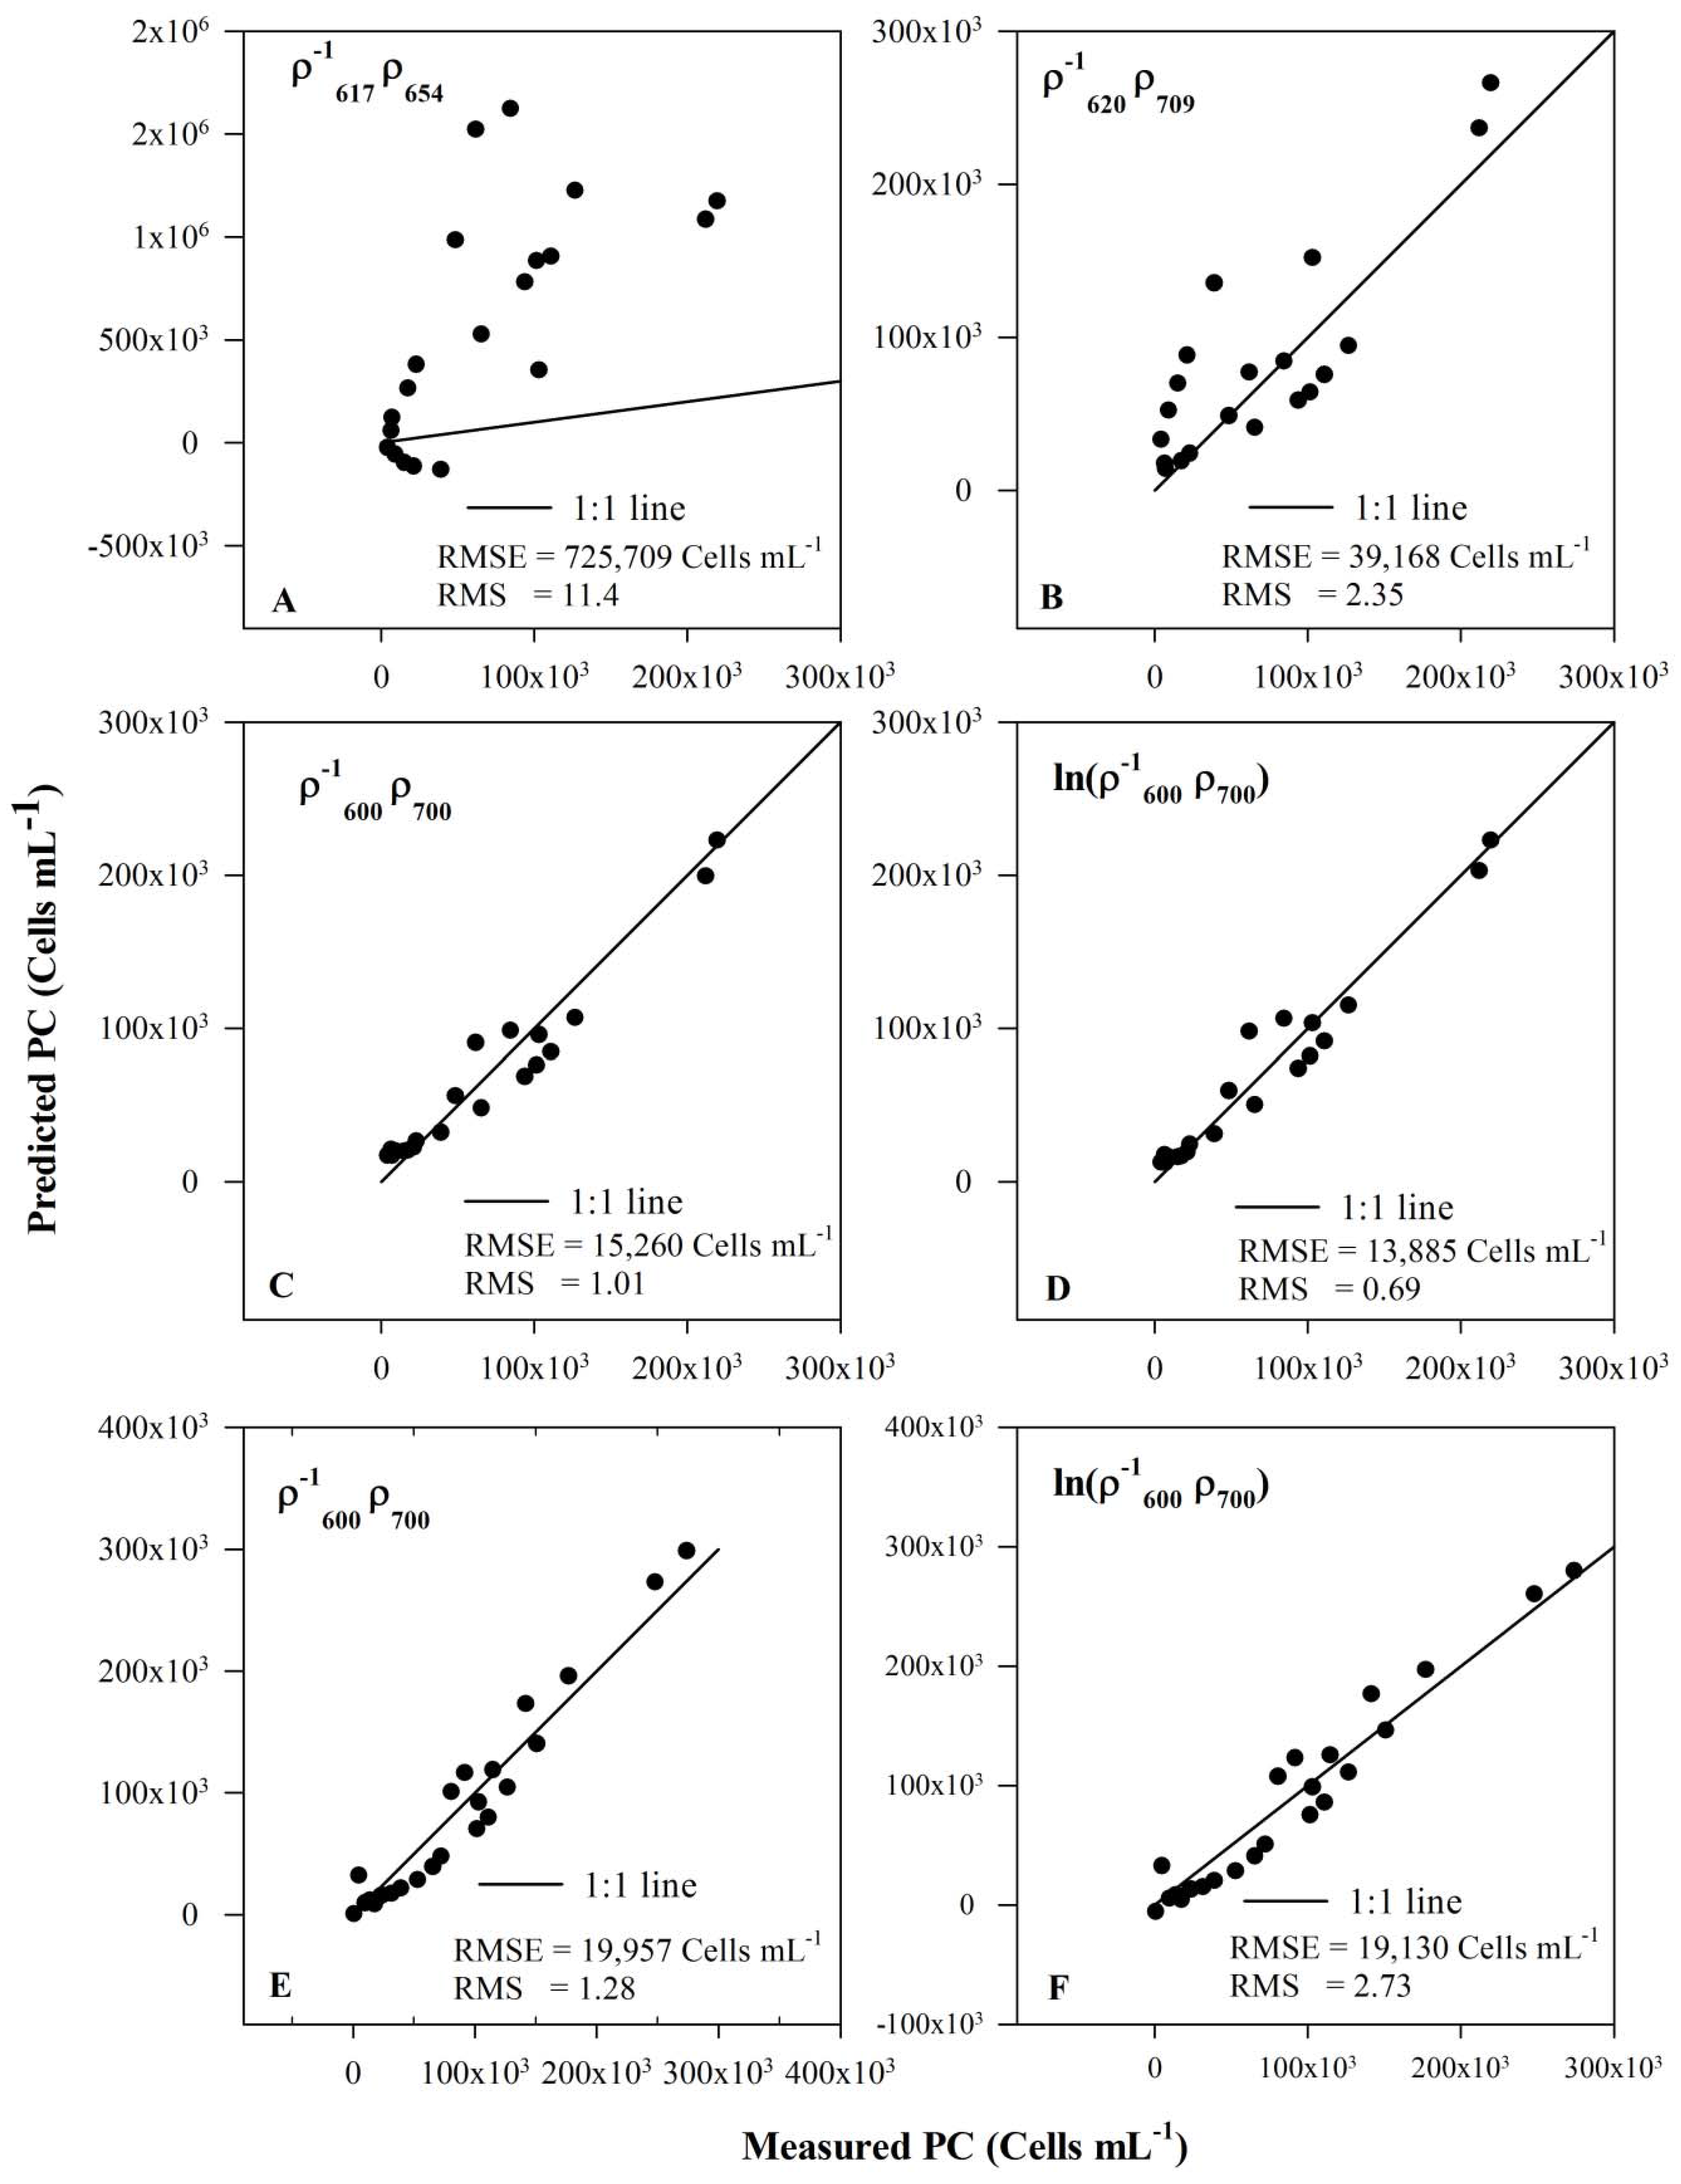
3.5. Model Validation

Model validation was performed using an independent dataset and the results were compared between the four algorithms (Table 3; Figures 6A-D). The Schalles and Yacobi [9] algorithm ( ρ 617 1 ρ 654 ) yielded the lowest accuracy with maximum root-mean-square-error (RMSE) and relative RMSE (RMS) and numerous negative values. The RMSE and RMS of PC prediction for the model was 725,709 cells mL−1 and 1,140% respectively with a coefficient of determination (R2) of 0.45. As discussed in earlier sections, the predictive ability of the PC detection band ratio algorithms is significantly dependent on the influence of Chl-a absorption on the selected bands. We believe that the poor accuracy is because the 654 nm peak is strongly affected by Chl-a absorption. Our experimental results show that the 654 nm peak is very sensitive to small changes in Chl-a concentration irrespective of the change in PC concentration.
Table 3. Model validation results: root-mean-square-error (RMSE) in cells mL–1, relative root-mean-square-error (RMS), and coefficient of determination (R2) are reported for all models.
Band CombinationRMSERMSR2
Synechocystis data set (Exp I, II and III)
( ρ 617 1 ρ 654 ) 725,70911.40.45
( ρ 620 1 ρ 709 ) 39,1682.350.70
( ρ 600 1 ρ 700 ) 15,2601.010.94
( ln ( ρ 600 1 ρ 700 ) ) 13,8850.690.95
Synechocystis and Anabaena dataset (Exp I, II, III and IV)
( ρ 600 1 ρ 700 ) 19,9571.280.94
( ln ( ρ 600 1 ρ 700 ) ) 19,1302.730.94
Figure 6. Validation scatter plots of different models. The solid lines represent the 1-to-1 lines: (A,B,C,D) data from EXP I,II and III (Synechocystis) and (E,F) data from EXP I–IV (Synechocystis and Anabaena). Root-mean-square-error (RMSE) and relative root-mean-square-error (RMS) for each model are also reported. Note that ( ρ 617 1 ρ 654 ) model predicts many negative values.
Remotesensing 01 00758 g006
Similarly, the band ratio used in Simis et al. [8] algorithm ( ρ 620 1 ρ 709 ) performed poorly with a prediction RMSE of 39,168 cells mL−1 and RMS of 2350 % (Figure 6B). Our initial observation is that the 620 nm peak is also slightly affected by Chl-a absorption and that this is the cause behind the poor performance of the model. In contrast, our newly developed model ( ρ 600 1 ρ 700 ) showed promising validation accuracy with an RMSE of 15,260 cell mL−1 and a comparatively low RMS of 101 % (Figure 6B; Table 3). Similarly, the natural logarithmic transformation of our index ( ln ( ρ 600 1 ρ 700 ) ) yielded very low RMSE of 13,885 cells mL−1 and RMS of 69 % (Figure 6D). Also, both models showed very high R2 of 0.94 and 0.95 respectively. In order to test that the newly developed models are independent of PC species, we performed a validation test on the multiple species dataset (Figure 6E, F). Validation results of newly developed models for the mixed species dataset are summarized in Figure 6E, F and Table 3. RMSE and RMS of the ( ρ 600 1 ρ 700 ) model are 19,957 cells mL−1 and 128 %, respectively, and similarly the RMSE and RMS of ( ln ( ρ 600 1 ρ 700 ) ) are 19,130 cells mL−1 and 273 %. The ( ln ( ρ 600 1 ρ 700 ) ) model produced slightly lower RMSE but yielded higher RMS. However, the R2 between measured and predicted PC for both models were found to be same (i.e., 0.94).We used PC: Chl-a pigment ratio as a proxy for PC abundance whereas the units of measurement for PC (cells mL−1) and Chl-a (µg L−1) were different. Hence the calculated pigment ratio in the residual analysis of all four models carries a pseudo unit (Figure 7).
Figure 7. Comparative scatter plots of PC residuals versus PC:Chl-a ratio for four spectral indices such as, A. ( ρ 617 1 ρ 654 ) B. ( ρ 620 1 ρ 709 ) C. ( ρ 600 1 ρ 700 ) , and D. ( ln ( ρ 600 1 ρ 700 ) ) .
Remotesensing 01 00758 g007
Simis et al. [8] documented that their PC model error significantly increased with a decrease in PC:Chl-a ratio which is consistent with our observation for the ( ρ 620 1 ρ 709 ) model. However, the residuals of the ( ρ 617 1 ρ 654 ) model showed a clear trend of either under-or over-estimation, and the error increased significantly when PC: Chl-a ratio increased. Newly developed models did not show any trend in the residual analysis.
Figure 8. (A, B, C) 3-D surface plots demonstrating the sensitivity of the three indices against Chl-a and PC. (D, E, F) 3-D surface plots of residuals, for the three models against Chl-a and PC.
Remotesensing 01 00758 g008
Errors associated with the spectral band ratio models can be primarily attributed to the model architecture such as selection of spectral bands and their sensitivity to Chl-a and PC concentrations (Figure 8). Unlike other band ratios, the newly developed band ratio is nearly insensitive to change in Chl-a concentration but is highly sensitive to changes in PC concentration (Figure 8A). Surface plot of residuals of the newly developed model does not show any trend in the error (Figure 8D). For the ( ρ 617 1 ρ 654 ) ratio, both of the spectral bands are sensitive to changes in Chl-a concentration at low PC concentration (Figure 8B). The spectral band ratio is insensitive to the change in Chl-a at low PC concentration, however, at high PC concentration, response of this spectral ratio is completely irregular, which explains the failure of this model at high PC levels (Figure 8B). Surface plot of residuals shows that the model error has a trend of either underestimating or overestimating PC concentration (Figure 8E). The spectral band ratio ( ρ 620 1 ρ 709 ) is highly sensitive to changes in the concentration of Chl-a (Figure 8C). The ratio has a linear trend with an increase in Chl-a concentration and a nonlinear trend with an increase in PC concentration. The surface residual plot for this band ratio also clearly shows the trend of over-and underestimation (Figure 8F).

4. Conclusions

We have discussed the dynamics and utility of the 654 nm peak in PC prediction models, and our results show that 654 nm peak of BG is highly sensitive to the changes in Chl-a concentration, therefore, algorithms using the 654 nm peak offer poor PC predictive ability. We also presented a novel band ratio algorithm for quantifying PC in water bodies. The newly developed model shows promising results by yielding low RMSE (15,260 cells mL−1), significantly low RMS (101%) as compared to the existing band ratio algorithms. Natural logarithmic transformation of the new model yielded the lowest RMSE (13,885 cells mL−1) and RMS (69%) with high coefficient of determination (0.95) between measured and predicted PC concentrations. One reason of the uncertainty observed in the newly developed model could be due to the specific absorption coefficient of PC ( a P C * ) that varies with cell morphology and photo-adaptation [24,25]. Unfortunately this study does not discuss the errors associated with change in ( a P C * ) Rather it discusses the effect of Chl-a as a confounding photo constituent on the performance of model.
We applied this newly developed model to calibrate and validate a mixed data set containing observations from experiments on two cyanobacterial species (Synechocystis sp. and Anabaena sp.). Calibration and validation results showed that this model has the ability to accurately predict PC concentrations in mixed species of BG. The newly developed algorithm is a simple band ratio algorithm that can assist in monitoring of BG in water bodies. A comparison of this algorithm with other known band ratio algorithms corroborates its superior predictive performance even with varying Chl-a conncentration. This band ratio algorithm can directly be used to quantify BG or can be used in semi-empirical algorithms to solve for PC absorption at 600 nm which can be safely assigned to PC and Chl-a. Although this is a proximal sensing study, the final application of this model is intended to be used by spaceborne hyperspectral sensors and other airborne sensors that can offer the required band combination. There is a strong demand for accurate satellite PC products for monitoring water quality in lakes, estuaries and coastal water bodies. Hyperspectral satellite sensors such as Earth Observation 1 (EO-1) Hyperion has the specified band combinations and hence, the newly developed model can be applied on Hyperion images to map spatial distribution of cyanobacteria.

Acknowledgements

The authors appreciate Avijit Biswas from the Department of Biological Sciences at University of New Orleans for his assistance in the growth of the cyanobacterial species. We thank the Office of Research and the College of Sciences Deans Office at the University of New Orleans for providing the funding for this research work.

References and Notes

  1. Carmichael, W.W. The cyanotoxins. Adv. Bot. Res. 1997, 27, 211–256. [Google Scholar]
  2. Iwasa, M.; Yamamoto, M.; Tanaka, Y.; Kaito, M.; Adachi, Y. Spirulina-associated hepatotoxicity. Am. J. Gastroenterol. 2002, 97, 3212–3213. [Google Scholar] [CrossRef] [PubMed]
  3. Ballot, A.; Stephan, P.; Wiegand, C.; Kotut, K.; Krienitz, L. Cyanobacterial toxins in Lake Baringo, Kenya. Limnologica. 2003, 33, 2–9. [Google Scholar] [CrossRef]
  4. Backer, L.C. Cyanobacterial harmful algal blooms: developing a public health response. Lake Reserv. Manage. 2002, 18, 20–31. [Google Scholar] [CrossRef]
  5. Golbeck, J.H.; Bryant, D.A. Photosytem I. In Current Topics in Bioenergetics, Light Driven Reactions in Bioenergetics; Lee, C.P., Ed.; Academic Press: New York, NY, USA, 1991; pp. 83–177. [Google Scholar]
  6. Richardson, L.L. Remote sensing of algal bloom dynamics. BioSci. 1996, 46, 492–501. [Google Scholar] [CrossRef]
  7. Glazer, A.N. Light guides: directional energy transfer in a photosynthetic antenna. J. Biol. Chem. 1989, 264, 1–4. [Google Scholar] [PubMed]
  8. Simis, S.; Peters, S.; Gons, H. Remote sensing of the cyanobacterial pigment phycocyanin in turbid inland water. Limnol. Oceanogr. 2005, 50, 237–245. [Google Scholar] [CrossRef]
  9. Schalles, J.; Yacobi, Y. Remote detection and seasonal patterns of phycocyanin, carotenoid and Chl-a pigments in eutrophic waters. Archive Hydrobiol. Sp. Issues Adv. Limnol. 2000, 55, 153–168. [Google Scholar]
  10. Dekker, A.G. Detection of the Optical Water Quality Parameters for Eutrophic Waters by High Resolution Remote Sensing. Ph.D. Thesis, Free Universit, Amsterdam, The Netherlands, 1993. [Google Scholar]
  11. Simis, S.; Ruiz-Verdú, A.; Domínguez-Gómez, J.; Peña-Martinez, R.; Peters, S.; Gons, H. Influence of phytoplankton pigment composition on remote sensing cyanobacterial biomass. Remote Sens. Environ. 2007, 106, 414–427. [Google Scholar] [CrossRef]
  12. Kutser, T.; Metsamaa, L.; Strombeck, N.; Vahtmae, E. Monitoring cyanobacterial blooms by satellite remote sensing. Estuar. Coast. Shelf S. 2006, 67, 303–312. [Google Scholar] [CrossRef]
  13. Vincent, R.K.; Qin, X.M.; McKay, R.M.L.; Miner, J.; Czajkowski, K.; Savino, J.; Bridgeman, T. Phycocyanin detection from LANDSAT TM data for mapping cyanobacterial blooms in Lake Erie. Remote Sens. Environ. 2004, 89, 381–392. [Google Scholar] [CrossRef]
  14. Randolph, K.; Wilson, J.; Tedesco, L.; Li, L.; Pascual, D.; Soyeux, M. Hyperspectral remote sensing of cyanobacteria in turbid productive water using optically active pigments, chlorophyll a and phycocyanin. Remote Sens. Environ. 2008, 112, 4009–4019. [Google Scholar] [CrossRef]
  15. Metsamaa, L.; Kutser, T.; Strombeck, N. Recognising cyanobacterial blooms based on their optical signature: a modeling study. Boreal Environ. Res. 2006, 11, 493–506. [Google Scholar]
  16. Stanier, R.Y.; Kunisawa, R.; Mandel, M.; Cohen-Bazire, G. Purification and properties of unicellular blue-green algae (order Chroococcales). Bacteriol. Rev. 1971, 35, 171–205. [Google Scholar] [PubMed]
  17. Gitelson, A.A.; Schalles, J.F.; Rundquist, D.C.; Schiebe, F.R.; Yacobi, Y.Z. Comparative reflectance properties of algal cultures with manipulated densities. J. Appl. Phycol. 1999, 11, 345–354. [Google Scholar] [CrossRef]
  18. Gitelson, A.A.; Yacobi, Y.Z.; Schalles, J.F.; Rundquist, D.C.; Han, L.; Stark, R.; Etzion, D. Remote estimation of phytoplankton density in productive waters. Archive Hydrobiol. Sp. Issues Adv. Limnol. 2000, 55, 121–136. [Google Scholar]
  19. Lemasson, C.; Marsac, N.T.D.; Cohen-Bazire, G. Role of allophycocyanin as a light-harvesting pigment in cyanobacteria. P. Natl. Acad. Sci. USA 1973, 70, 3130–3133. [Google Scholar] [CrossRef]
  20. Rowan, K.S. Photosynthetic Pigments of Algae, 1st ed.; Cambridge University Press: Cambridge, UK, 1989. [Google Scholar]
  21. Glazer, A.N. Phycobiliproteins. Method. Enzymol. 1988, 167, 291–303. [Google Scholar]
  22. Raven, P.H.; Evert, R.F.; Curtis, H. Biology of Plants; Worth Publishers: New York, NY, USA, 1976. [Google Scholar]
  23. Emerson, R.; Lewis, C.M. The photosynthetic efficiency of phycocyanin in Chroococcus, and the problem of carotenoid participation in photosynthesis. J. Gen. Physiol. 1942, 25, 579–595. [Google Scholar] [CrossRef]
  24. Sathyendranath, S.; Lazzara, L.; Prieur, L. Variations in the spectral values of specific absorption of phytoplankton. Limnol. Oceanogr. 1987, 32, 403–415. [Google Scholar] [CrossRef]
  25. Bricaud, A.; Babin, M.; Morel, A.; Claustre, H. Variability in the Chl-a specific absorption coefficients of natural phytoplankton-analysis and parameterization. J. Geophys. Res.—Oceans. 1995, 100, 13321–13332. [Google Scholar] [CrossRef]

