Article

Effect of Land Cover Heterogeneity on Soil Moisture Retrieval Using Active Microwave Remote Sensing Data

1
NOAA-Cooperative Remote Sensing Science & Technology Center (NOAA-CREST), City University of New York, NY 10031 USA
2
American University in Dubai P.O. Box: 28282 Dubai, UAE
*
Author to whom correspondence should be addressed.
Remote Sens. 2009, 1(2), 80-91; https://doi.org/10.3390/rs1020080
Submission received: 3 April 2009 / Revised: 11 May 2009 / Accepted: 13 May 2009 / Published: 13 May 2009

Abstract

:
This study addresses the issue of the variability and heterogeneity problems that are expected from a sensor with a larger footprint having homogenous and heterogeneous sub-pixels. Improved understanding of spatial variability of soil surface characteristics such as land cover and vegetation in larger footprint are critical in remote sensing based soil moisture retrieval. This study analyzes the sub-pixel variability (standard deviation of sub-grid pixels) of Normalized Difference Vegetation Index and SAR backscatter. Back-propagation neural network was used for soil moisture retrieval from active microwave remote sensing data from Southern Great Plains of Oklahoma. The effect of land cover heterogeneity (number of different vegetation species within pixels) on soil moisture retrieval using active microwave remote sensing data was investigated. The presence of heterogeneous vegetation cover reduced the accuracy of the derived soil moisture using microwave remote sensing data. The results from this study can be used to characterize the uncertainty in soil moisture retrieval in the context of Soil Moisture Active and Passive (SMAP) mission which will have larger footprint.

Graphical Abstract

1. Introduction

The spatial and temporal distribution of soil moisture and the controlling factors offer an excellent case study for understanding the importance of pattern and scale in soil texture, topography and land-cover. Most active microwave applications for soil moisture retrieval are based on the hypothesis that the signal backscattered from the observed scene is widely dependent on the contrast that exists between wet and dry soils. Indeed, under the same land cover condition, the stronger radar backscattering values were found for soils with high moisture content. However, soil moisture retrieval approach based exclusively on active microwave data may face several challenges since the microwave sensors are also sensitive to other land cover characteristics such as vegetation, surface roughness, and soil texture [1,2,3]. Soil moisture retrieval using active microwave remote sensing is convoluted by the within-pixel variability of vegetation because the remote sensors provide only one value per pixel. Hence, soil moisture variability could be related to the degree of variability of the soil surface characteristic that directly influences the moisture holding capacity of the soil. Thus, characterization of soil moisture variation with respect to change in soil surface characteristic is useful for: (1) estimating the uncertainty of soil moisture retrieval from soil moisture missions such as Soil Moisture and Ocean Salinity (SMOS) and Soil Moisture Active-Passive (SMAP), and (2) parameterization of surface soil moisture variations in land surface and hydrological models across a range of scales [4].
The variability is defined as the degree or range of divergence (standard deviation) of sub-grid pixels’ values of a parameter (backscatter, NDVI) from a given larger grid coarse pixel. Significance of spatial variability at the meter to kilometer scale in developing a better understanding of vegetation and soil texture is fairly obvious, but its importance for applied problems and making accurate predictions of soil moisture using remote sensing data is uncertain. The vegetation distribution and range assists in determining the important scale to understand the impact of heterogeneity on retrieval of soil moisture and other variables using remote sensing satellite data.
In simple terms, the heterogeneity defined as the presence of different land-cover within a pixel. The presence of spatial variability and heterogeneity in land surface over coarse spatial resolutions, introduces a range of complexities in the retrieval and validation of active microwave-based soil moisture. Mapping large scale soil moisture using remote sensing without considering the surface and the land cover variability undermine the retrieval by averaging the variability within the pixel and by masking the underlying heterogeneity observed at the land surface. Numerical models generally assume that sub-grid variability is averaged with equal areal weighting, while the satellite product is obtained through averaging by some combination of nonlinear antenna gain functions [5]. The physical connection between soil moisture estimates at the pixel scale and local values within the pixel weakens as the sensor resolution decreases [6]. The magnitude of heterogeneity observed at larger footprint has emerged as a major challenge in validating remote sensing based surface soil moisture mapping. Hence, it is necessary to understand the impact of this sub-pixel variability on retrieval accuracy [7].
The spatial distribution of land use and land-cover within a coarse pixel requires in depth study to understand its effect on retrieval of surface parameters. Statistical approaches such as, calculation of a measure of central tendency (mean or median) and variability (standard deviation or variance), have been used to deal with field-scale variability [6,7]. One of the great challenges of soil moisture retrieval from remotely sensed images is the mixed pixel problem at larger scale. The mixed pixel problem is due to the presence of multiple land-covers in the same pixel. Therefore, the understanding and the effects of the sub-pixel variability are very important in the development of a robust retrieval system.
The accuracy of satellite-derived soil moisture is usually affected by the presence of vegetation which significantly modifies and attenuates the scattered and backscattered microwave radiation and makes more difficult the retrieval of soil moisture for vegetated surfaces [3,8]. The amount of attenuation and backscatter depends on several vegetation parameters, such as vegetation height, leaf area index, and vegetation water content; and on sensor-related characteristics such as angle of incidence, frequency, and polarization. In fact, the presence of high and dense vegetation generally decreases the correlation between the backscattered signal and soil dielectric properties [9]. An accurate retrieval of soil moisture from microwave sensors under the complex conditions explained above seems difficult using a simple linear or non-linear algorithm. In such condition, non-parametric models, including artificial neural network and fuzzy logic, which do not require a prior assumption about the statistical behavior or about any specific relationship between variables, may serve as a better alternative. These models use the data itself to extract the relationship between the inputs and their corresponding outputs [10].
The objectives of this study are twofold. First, to analyze the relationship between spatial variability of vegetation and SAR backscatter. Second, to evaluate the effect of land-cover heterogeneity on the soil moisture retrieval.

2. Methodology

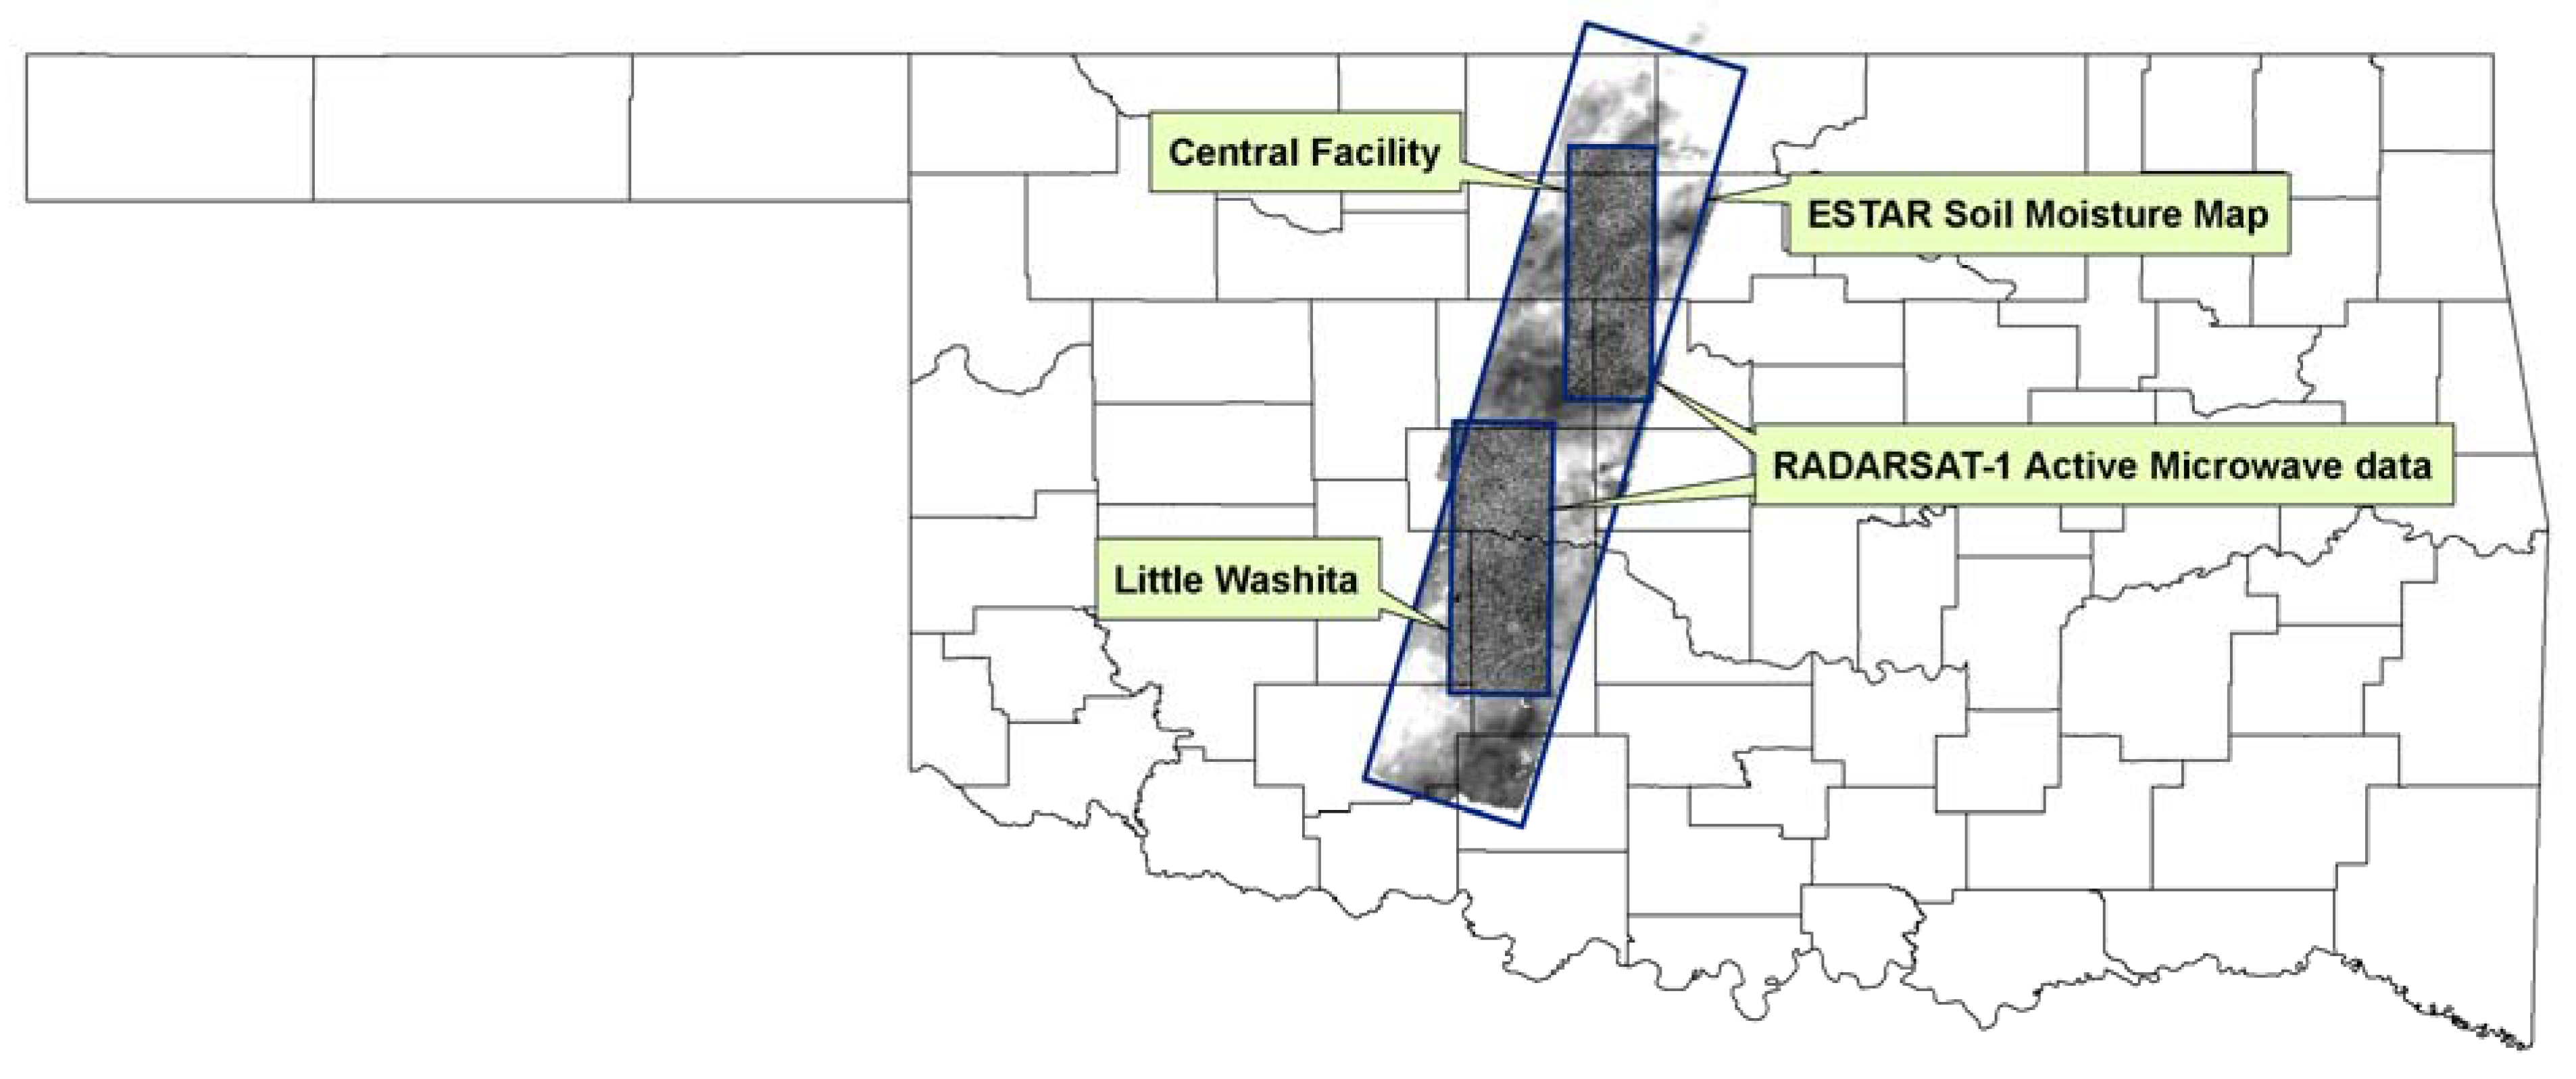
2.1. Study Area and Data Acquisition

The Southern Great Plain mission (SGP’97) was an interdisciplinary research campaign which conducted large-scale mapping of surface soil moisture in the summer of 1997 in Oklahoma and represents the study area of this research. The SGP region has a relatively stable humidity, large seasonal variation in temperature, and moderately rolling topography with a maximum relief of 200 m. The climate in the study area was classified as sub-humid with an average annual rainfall of 75 cm. The soil moisture conditions were generally dry throughout the study region. The land-use was dominated by pasture/rangeland and with areas of winter wheat and other crops. During the experiments the area dominated by winter wheat was ready for harvest or harvested (wheat stubble), but the pasture/rangeland areas were ungrazed and had significantly greater biomass.
Soil moisture data with spatial resolution of 800 m derived from an aircraft based passive microwave instrument: Electronically Scanned Thinned Array Radiometer (ESTAR) were used to train the neural network. The NDVI was derived from visible and infrared band from Landsat TM scene acquired during the field experiment (July 25, 1997). The NDVI was originally estimated at 30 m resolution, and then aggregated to 800 m resolution to match the soil moisture resolution. The same Landsat TM data was used to produce land-cover classification over the study area [11]. Two RADARSAT-1 images acquired on July 2nd and July 12th, 1997 by SCANSAR Narrow Mode with 25 m spatial resolution were used in this study. The geo-referencing of RADARSAT image with other images (NDVI, Land-cover image, and soil texture) were done by selecting standard ground control points. The association between the RADARSAT images with other images showed that the geo-referencing obtained was accurate to within a pixel error (9.40m) in average. Two windows that cover Central Facility and Little Washita area were extracted from all available data (RADARSAT-1 data, soil moisture, NDVI, land-cover data) as shown in Figure 1.
Figure 1. Two subset study Area (Central Facility and Little Washita) in Oklahoma are selected from overlapped ESTAR soil moisture product and RADARSAT-1 Active Microwave data from.
Remotesensing 01 00080 g001

2.2. Neural network application

Neural networks have been applied to a wide range of problems in remote sensing and have improved accuracy when compared to traditional statistical methods. The rapid increase of neural network applications in remote sensing is due mainly to their ability to perform more accurately than other classification techniques [10,12,13,14]. A multi-layer neural network (or perceptron) was used in this research for soil moisture retrieval from active microwave backscatter data.
To optimize the neural network architecture, the network was trained multiple times (25 times) with different architectural configurations. The final network architecture having three input layers (backscatter, soil texture, NDVI), one output layer (soil moisture) and single hidden layer with 10 nodes [3:10:1] was selected [15]. The internal neural network parameters such as: performance goal (0.001), maximum number of epochs to train (4,000), maximum validation failures (200), learning rate (0.01), ratio to increase learning rate (1.05), ratio to decrease learning rate (0.80), maximum performance increase (1.04), and momentum constant (0.90), were selected based on the author’s experience [15]. The details of neural network architectural configuration, number of training data and input parameter selection, can be found in [15,16]. The optimum architectural configuration of neural network model was used for soil moisture retrieval using inputs of SAR, soil texture, and NDVI data.
The neural network was trained using input layer of backscatter, soil texture, and NDVI, and output later of ESTAR derived soil moisture data [15]. The backscatter, NDVI and soil texture data were resampled to match ESTER spatial resolution (800 m). The schematic flow chart in Figure 2 shows the processes used in this study. Five hundred pixels were used to train the neural network with a single hidden layer. Then model was tested for area Central Facility and Little Washita of SAR images taken on 2nd July and 12th July using independent pixels, which are not used in training the neural network model. The root mean square error (RMSE) was varied between 3.39 to 5.50 of soil moisture percentage for area Central Facility and Little Washita for July 02 and July 12 data. The predicted soil moisture values using neural network were compared with ESTAR soil moisture to evaluate the effect of sub-pixel heterogeneity of land cover.
Figure 2. Schematic of flow chart data resolutions to analyze impact of sub-pixel variability and land-cover heterogeneity on soil moisture retrieval.
Remotesensing 01 00080 g002

3. Results and Discussion

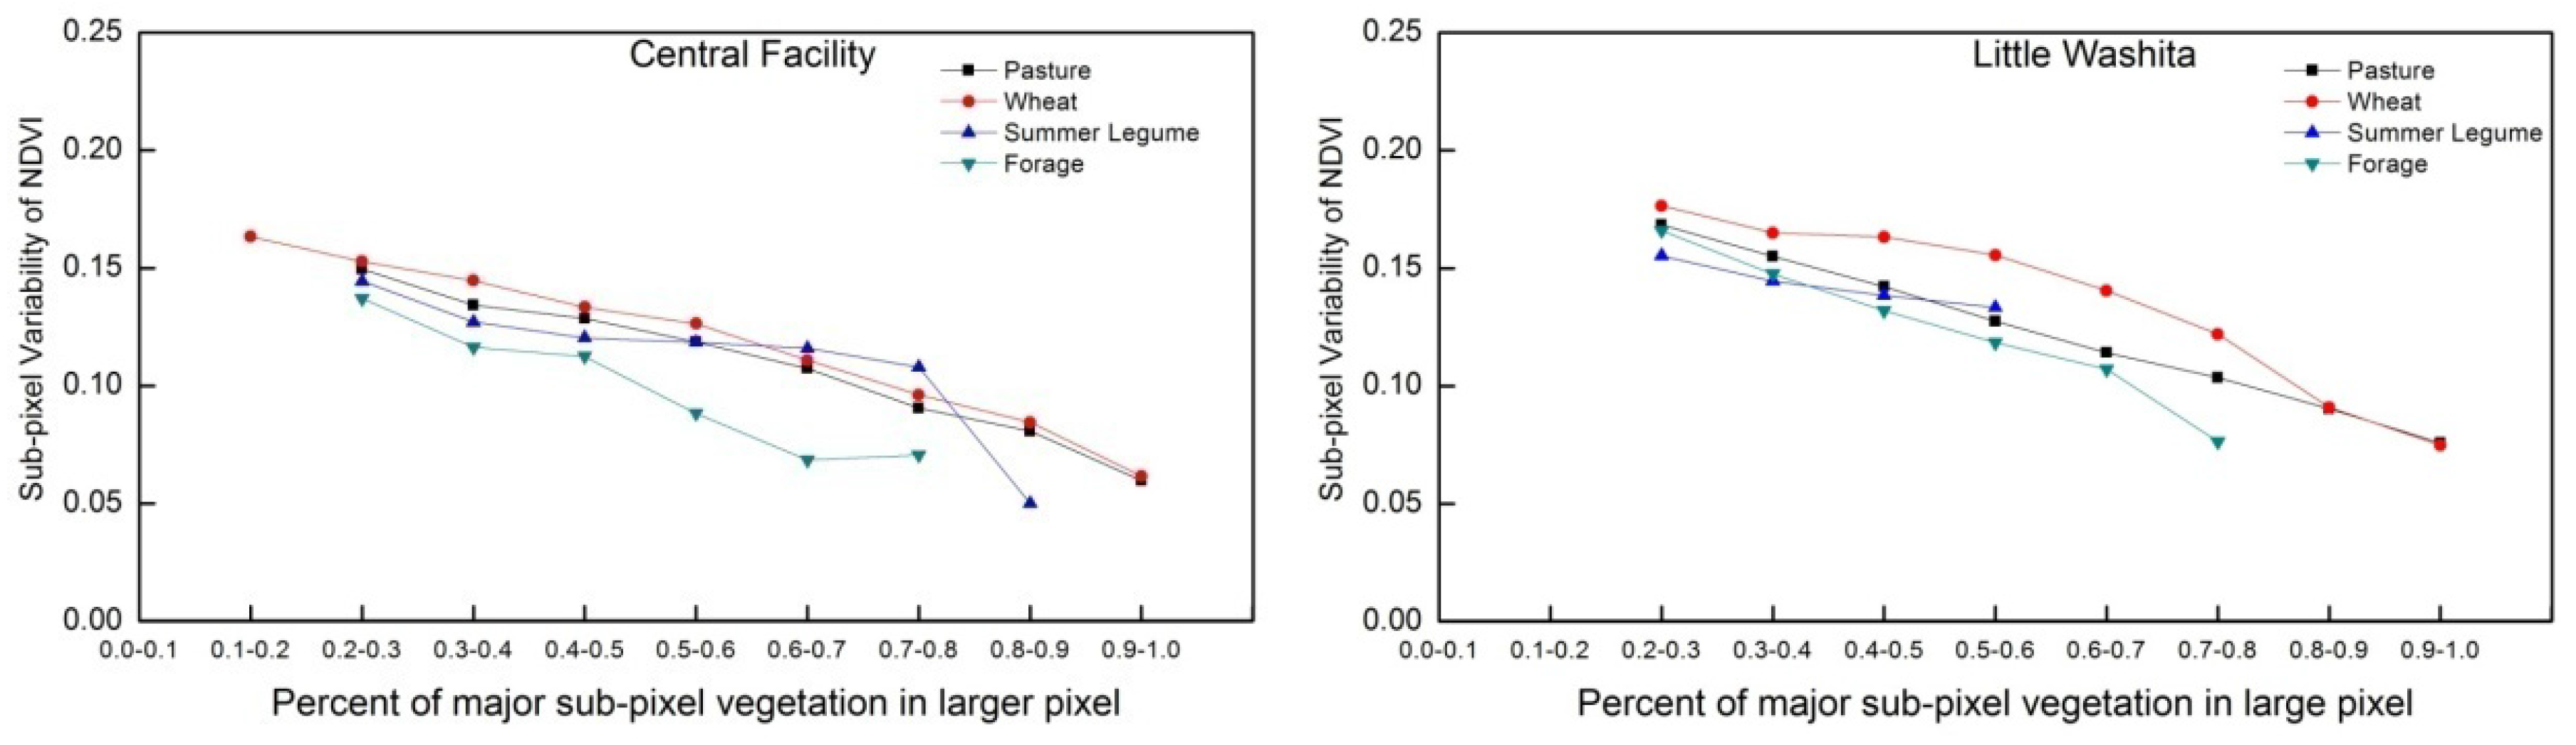
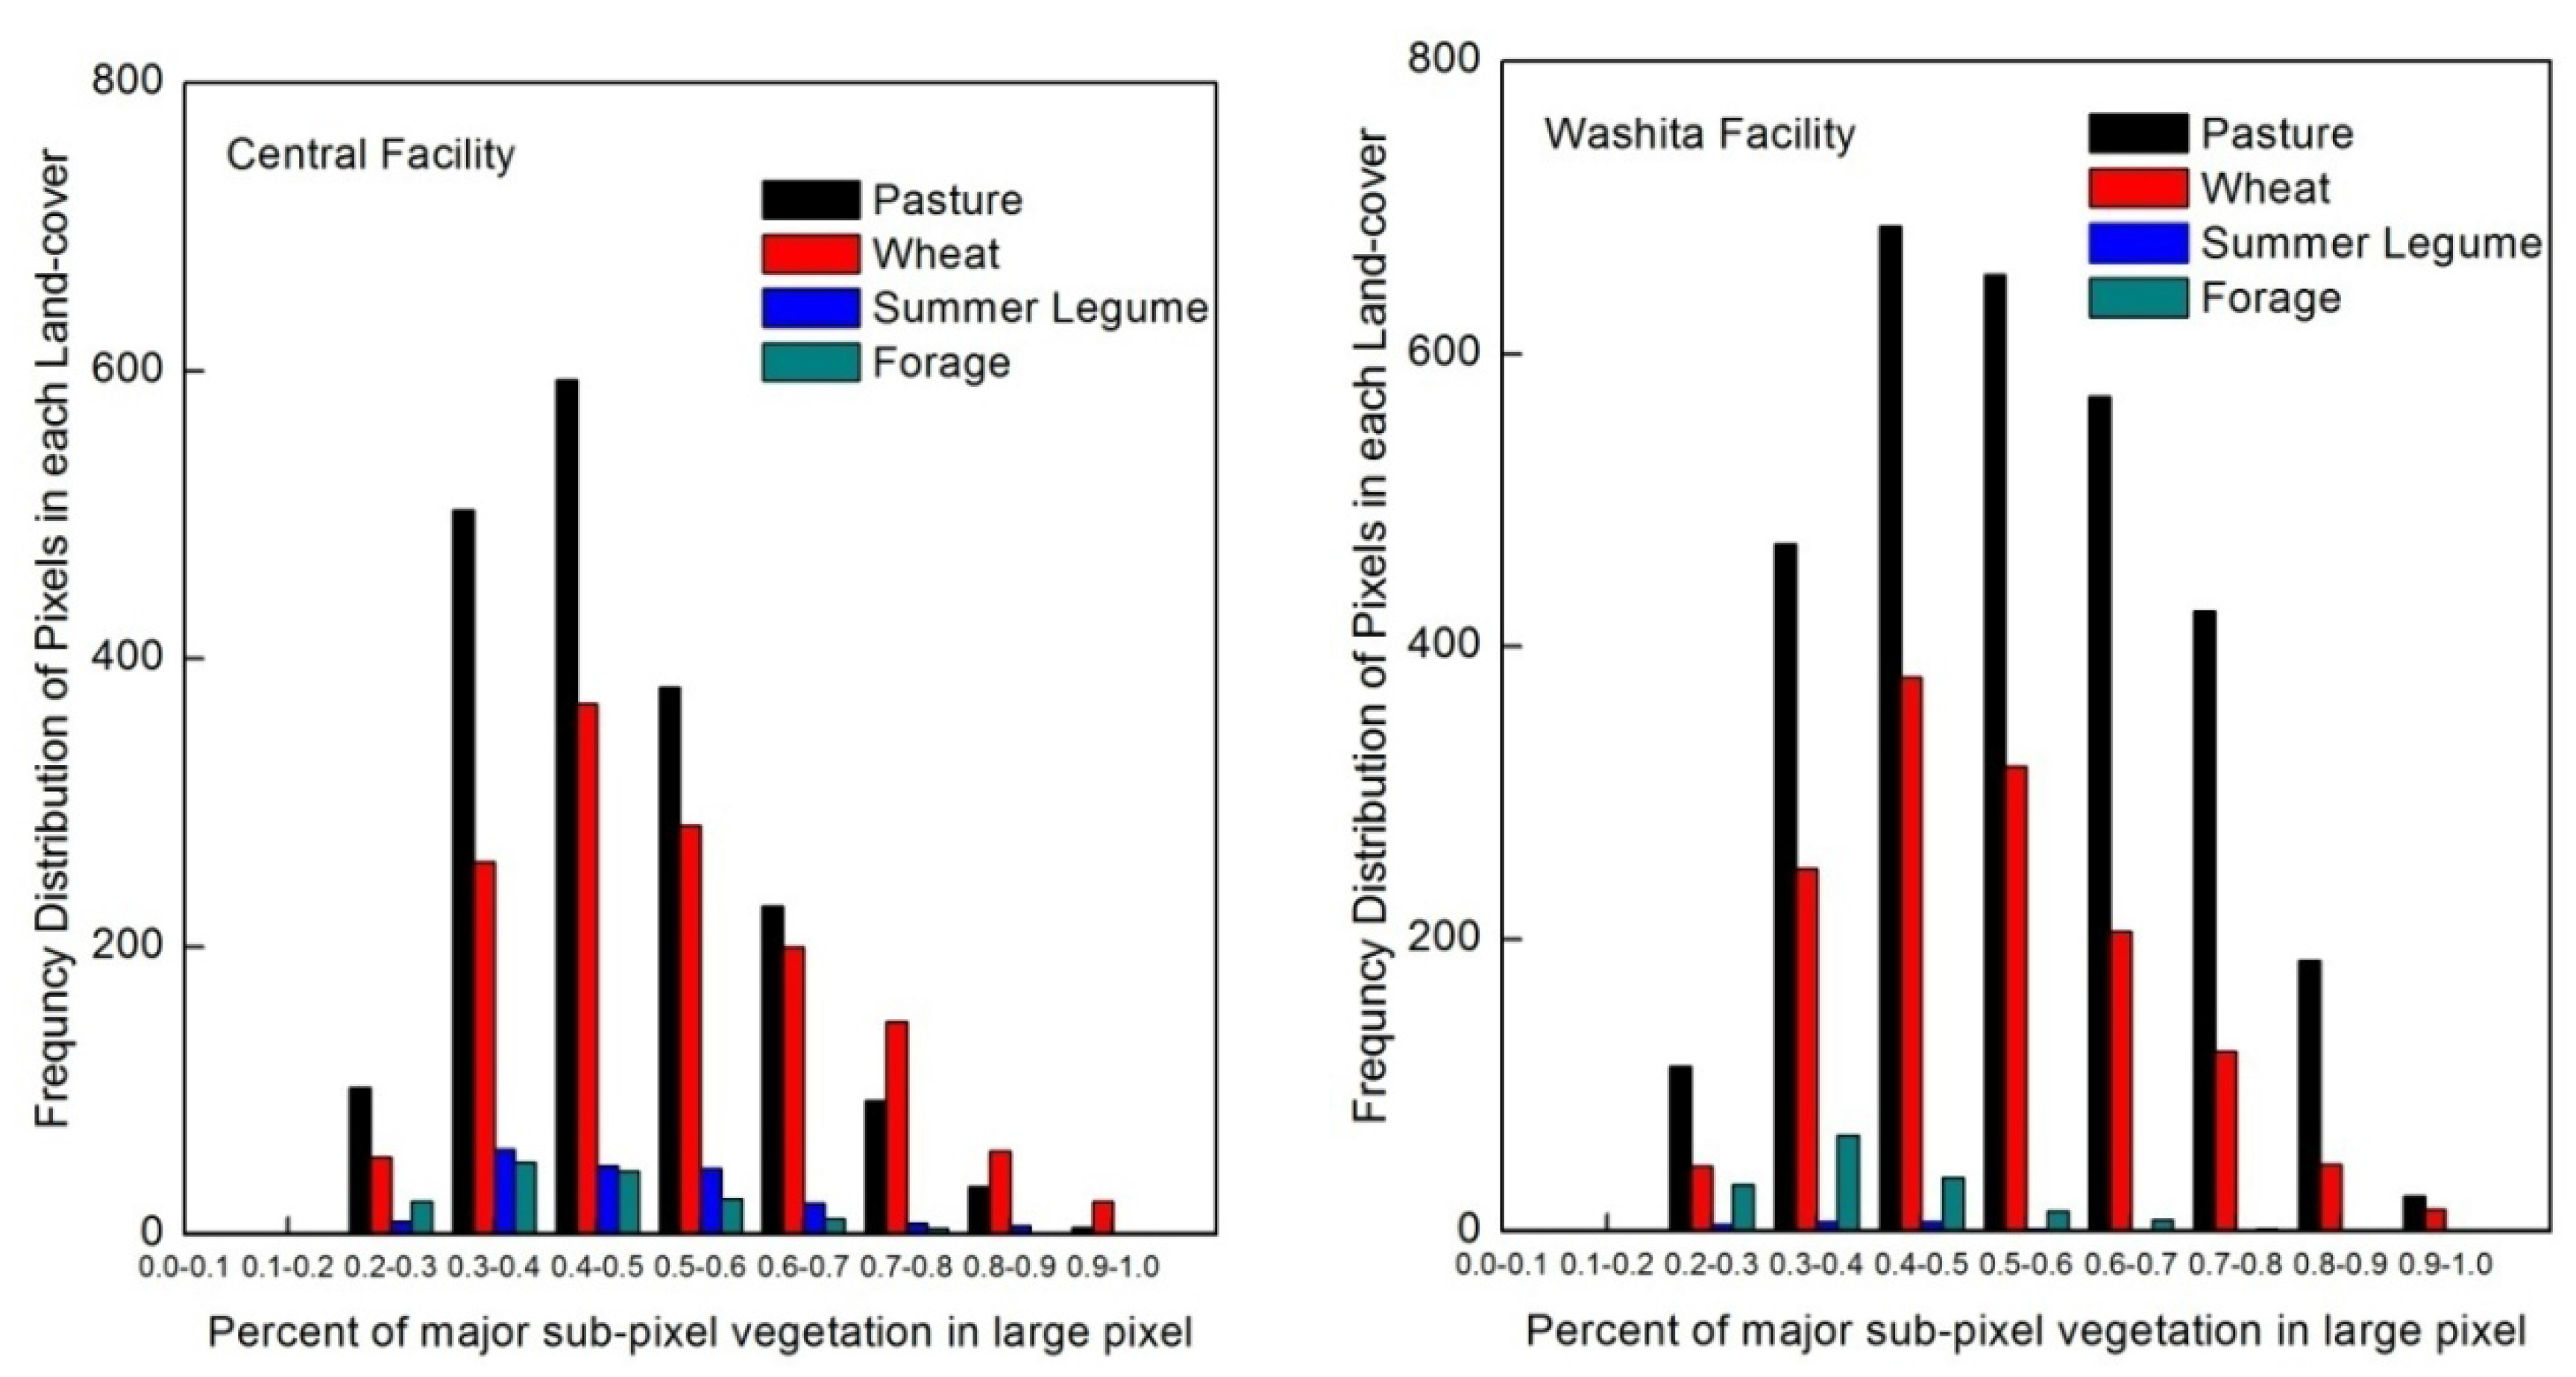
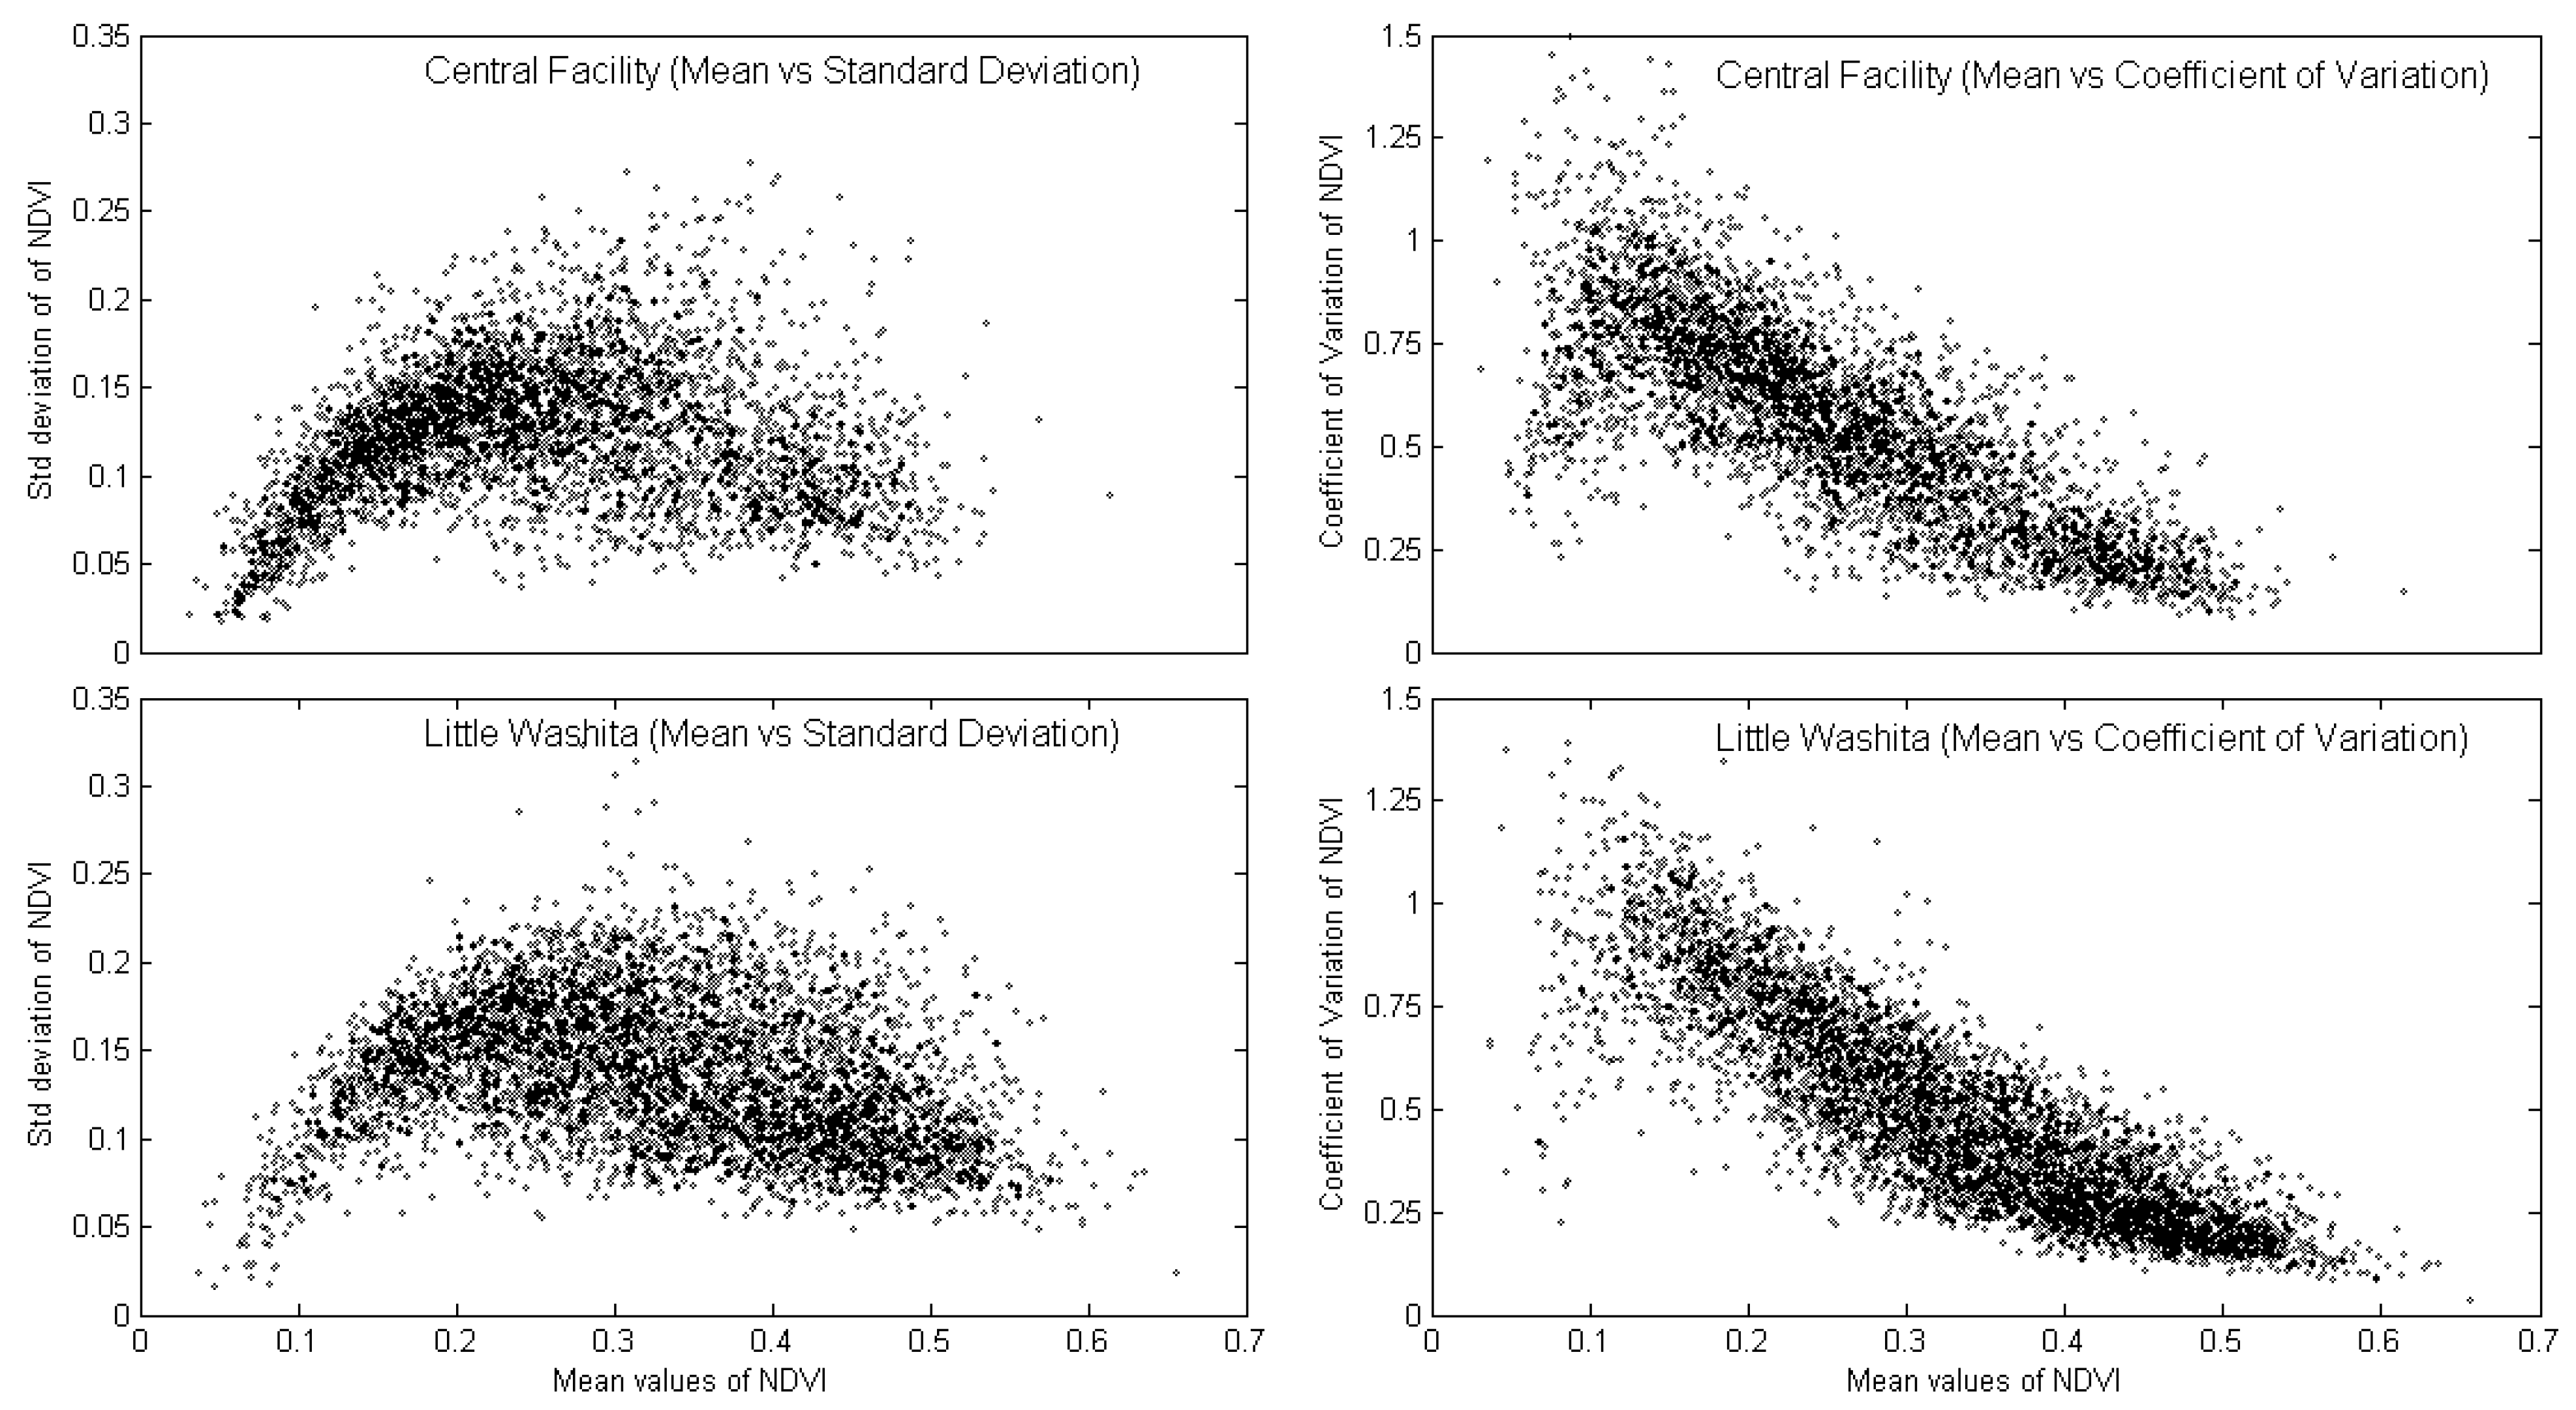
3.1. Sub-pixel variability of NDVI

The land-cover downscaling to an ESTAR footprint (800 m) was performed by the most commonly occurring vegetation class within sub-pixels. The frequency distribution of pixels varying land-cover fraction is shown in histogram (Figure 3). The histogram shows the distribution of heterogeneity of land-cover type within a footprint (800 m) for Central facility and Little Washita. For sake of simplicity, we defined a homogeneous pixel that should consist of more than 75% of sub-pixels should have single vegetation category. It was observed that, the majority (more than 80%) of pixels are heterogeneous, even though classified as to particular land cover type based its highest proportion in the pixel. As shown in Figure 3, a large number of pixels falls under the category between 0.4-0.5 percent of major sub-pixel vegetation in large pixel. These pixels were classified to a particular land-cover type, although having 0.4-0.5 proportion in the larger footprint.
Figure 3. Histograms of sub-pixels (30 m) heterogeneity of land-cover type in ESTAR footprint (800 m) in study area.
Remotesensing 01 00080 g003
Sub-pixel variability of NDVI is estimated for different land-cover including wheat, pasture/rangeland, forage and summer legume. The variability within the ESTAR footprint (800 m) is measured as a standard deviation of NDVI values at 30 m resolution. In many aggregation studies, vegetation variability is assumed to be constant or to be uniquely related (normally distributed) to mean vegetation parameters (NDVI, Leaf Area Index). These assumptions can prove to be inappropriate and need detailed understanding of sub-pixel variability in retrieving soil moisture or other surface related parameters. Figure 4 shows the relationship between heterogeneity of land-cover pixels within ESTAR footprint and sub-pixel variability of NDVI. The NDVI variability reduces from 0.15 to 0.08 for heterogeneous to homogeneous pixels for wheat and pasture/rangeland. The comparable similar trend was found in both Central Facility and Little Washita.
Figure 4. Sub-pixel variability of NDVI within the ESTAR footprint as measured by the standard deviation for different land-cover data at 30m resolution from Central Facility and Little Washita.
Remotesensing 01 00080 g004
Sub-pixel variability of NDVI estimated to its mean value is shown in Figure 5. The standard deviation increased with the mean to the intermediate values of NDVI (0.2-0.3), leveled off at about NDVI=0.3, and then decreased monotonically as mean NDVI values continue to increase. A similar trend occurs for both the Central Facility and Little Washita study regions. The mean values of NDVI are correlated with coefficient of variation of sub-pixels (Figure 5). The coefficient of variation (CV), the ratio of the standard deviation to the mean, is a normalized measure of dispersion of a probability distribution. The relative variability as measured by the coefficient of variation, in contrast, is higher for lower values of NDVI (0.1-0.2) and decreases exponentially with the increase in NDVI values.
The exponential fit in the form C V = P * e Q * N D V I   , explains the NDVI variability as function of mean NDVI values. The fitting parameter P and Q describe the relative variability range and the variability changes related to average values of NDVI. The parameter P and Q are related to maximum relative variability and slope of the relative variability, respectively. The correlation coefficients (R2) of fitting equations were 0.64 and 0.75 for Central Facility and Little Washita. This statistical variability information is important to estimate physical parameters including soil moisture and land surface temperature for land surface hydrologic modeling to improve its ability to characterize heterogeneity effects by extent, and scale.
Figure 5. Relationship between NDVI mean to its variability (standard deviation) and coefficient of variation for Central Facility and Little Washita.
Remotesensing 01 00080 g005

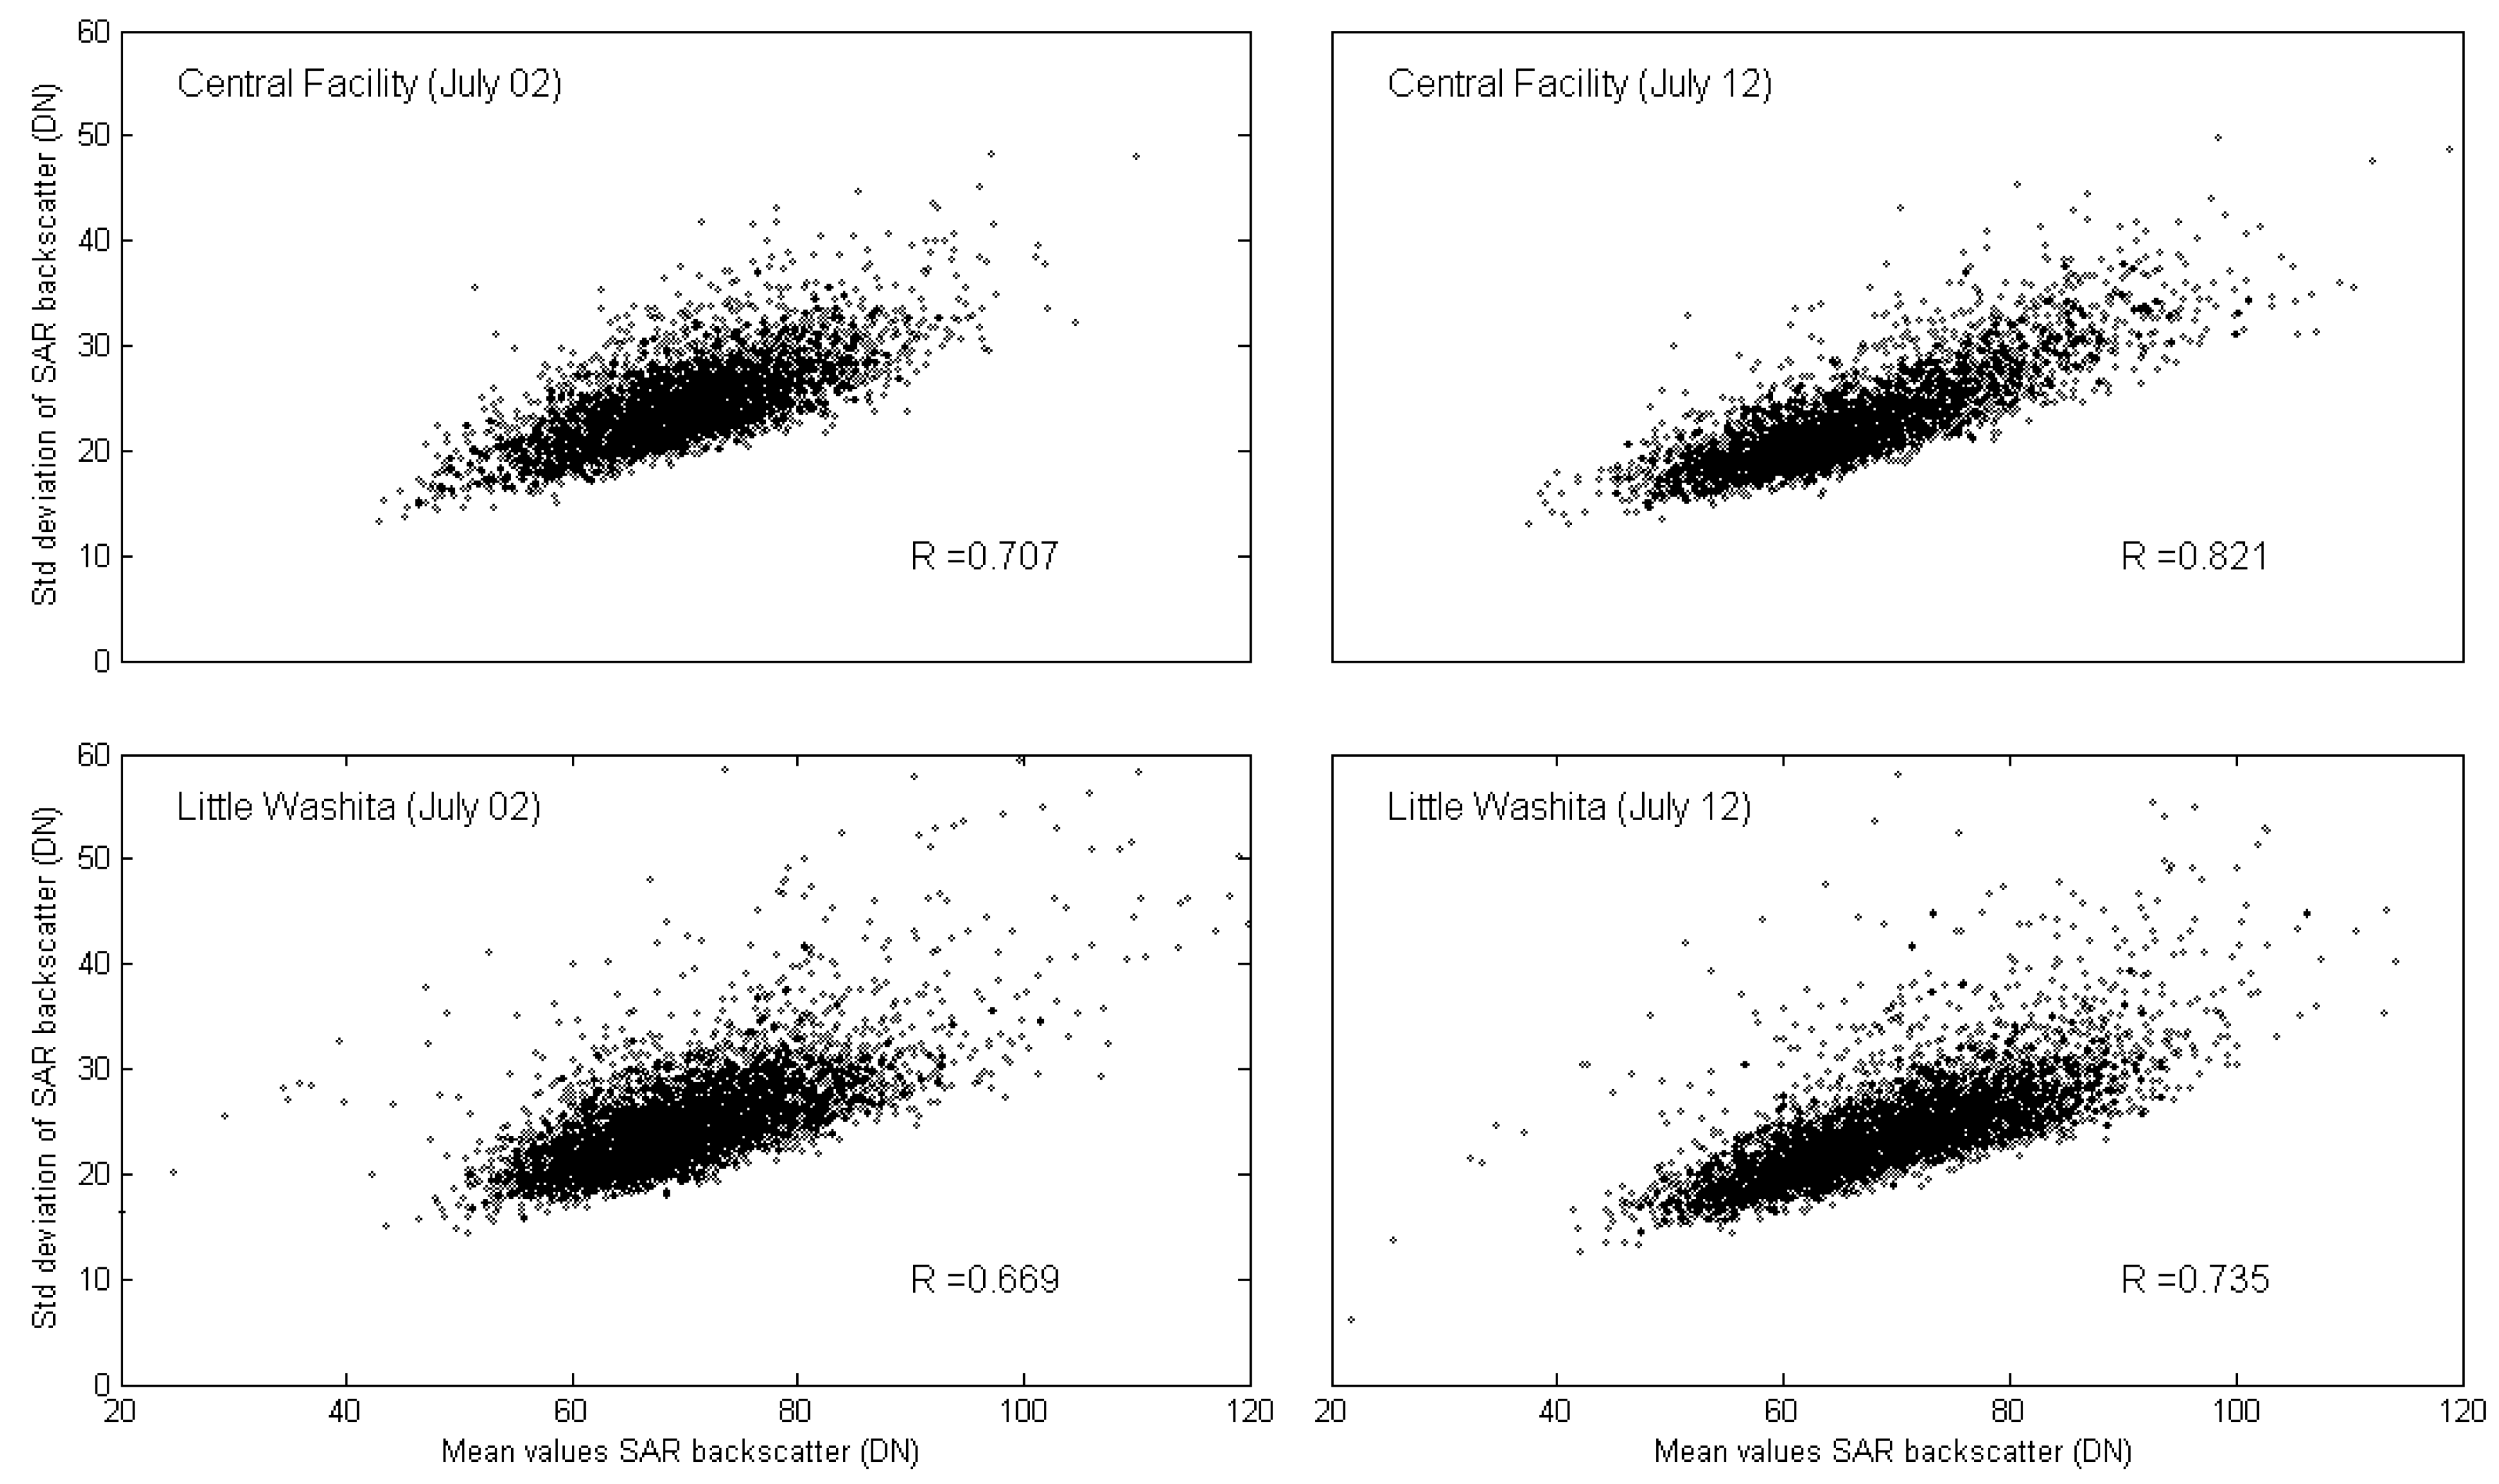
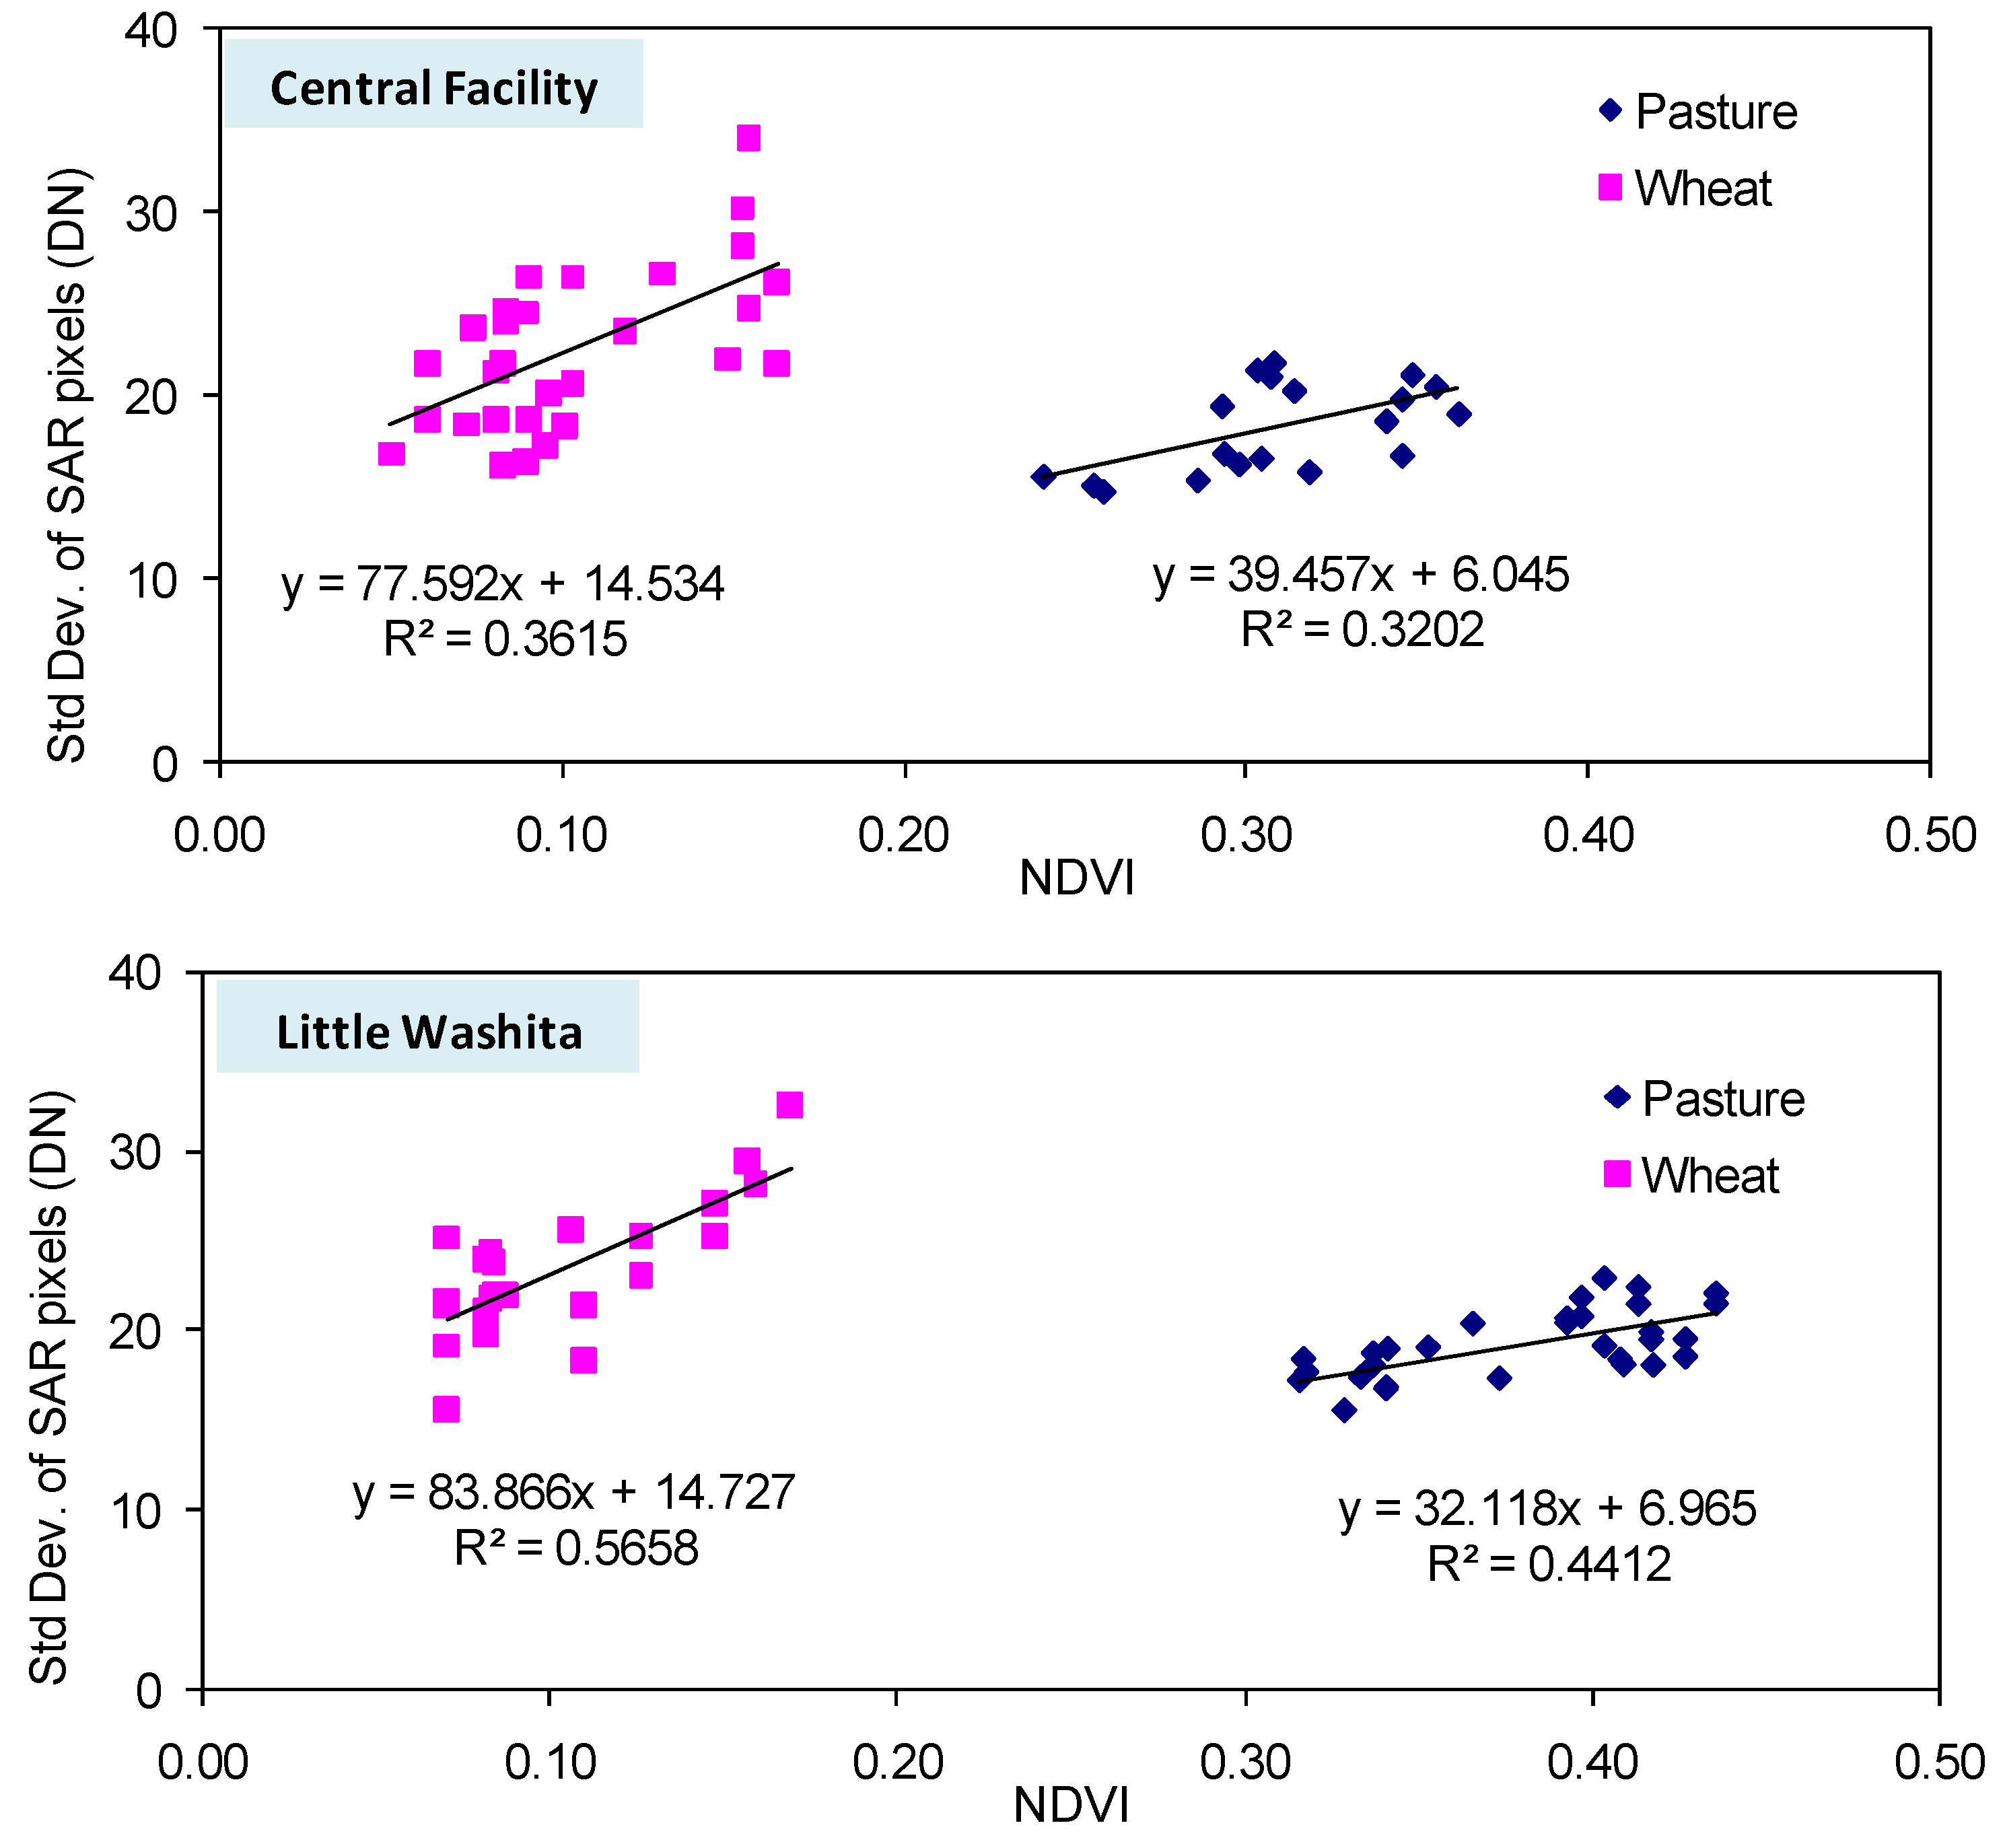
3.2. Backscatter and Vegetation Variability

The relationship between mean values of SAR backscatter and sub-pixel variability as measured at ESTAR footprint size is shown in Figure 6. A positive correlation was found for sub-pixel variability with the average values of SAR backscatter. The sub-pixel variability increases with increase in average SAR backscatter values, which is also associates to soil moisture, as higher SAR backscatter values corresponds to wet soil moisture conditions. Significant correlation was not observed between the coefficient of variance and mean values of SAR backscatter as found in the case of NDVI. This could be possible due to larger influence of surface roughness and vegetation structure on SAR backscatter values. Also, the SAR backscatter from vegetative soil surface consists of three major backscatter contributions: soil surface, vegetation backscatter and interaction between vegetation and soil surface. Therefore, further studies are requires to interpret the relationship between coefficient of variance and mean values of SAR backscatter.
Figure 6. Sub-pixel variability of SAR backscatter to the mean values within the ESTAR footprint as measured by the standard deviation for June 2nd and 12th at 25 m resolution.
Remotesensing 01 00080 g006
The backscatter variability is related to biophysical properties (NDVI) and land cover type in the field [6]. The reduction in SAR backscatter sensitivity to soil moisture is influenced by the presence of highly vegetated areas as well as to other surface-related parameters (vegetation and soil texture). The soil moisture retrieval accuracy is directly linked to the surface-related parameters. Therefore, soil moisture estimation will be affected by the sub-pixels variability of surface-related parameters within a single pixel.
Sub-pixel variability of SAR backscatter and NDVI was evaluated at ESTAR footprint size. The sub-pixels variability of SAR images is positively correlated with NDVI sub-pixels variability for Central Facility and Little Washita given in Table 1. The correlation coefficients values given in Table 1 are lower, but considering large number of data (3,960 pixels from Central Facility and 5,031 pixels from Little Washita) values are statistically significant.
Table 1. Relationship between SAR backscatter (DN) variability as function of NDVI variability in terms of correlation coefficient (R).
Date / SiteCentral FacilityLittle Washita
July 2nd 1997 data0.5150.376
July 12th 1997 data0.4270.466
Figure 7. Relationship between NDVI and Sub-pixel variability of SAR backscatter (DN) measured as a standard deviation within the ESTAR footprint (800 m) size for homogeneous Wheat and Pasture/rangeland for Area Central Facility and Little Washita.
Remotesensing 01 00080 g007
The impact of vegetation on sub-pixels variability of SAR backscatter was analyzed for Central Facility and Little Washita. The dynamic nature of vegetation variability has important implications on backscattering from soil surface and subsequently on surface soil moisture retrieval. The difference in structure of wheat and pasture/rangeland is expected to have an impact on backscatter variability. The relationship between the average value of NDVI and sub-pixel variability of SAR backscatter for wheat and pasture/rangeland were analyzed. For this analysis, 125 pixels were randomly selected from study area, such that each pixel covers more than 90% area of a pixel area by a land cover type. The standard deviation of SAR backscatter and respective NDVI values for wheat and pasture/rangeland fields are shown in Figure 7 for Central Facility and Little Washita. The NDVI values for wheat were lower compared to pasture/rangeland due to harvesting season in study area. These results show that average backscatter variability is lower for pasture/rangeland (18.38) compared to wheat field (22.80). A pasture/rangeland field has higher NDVI compared to a wheat field (Figure 7). A lower variation (lower slope and smaller residue for regression line) in backscatter has been observed for pasture/rangeland compared to wheat field. The lower backscattering variability in pasture/rangeland area would be attributed to dense vegetation (higher vegetation) resulting volume backscattering vegetated area.

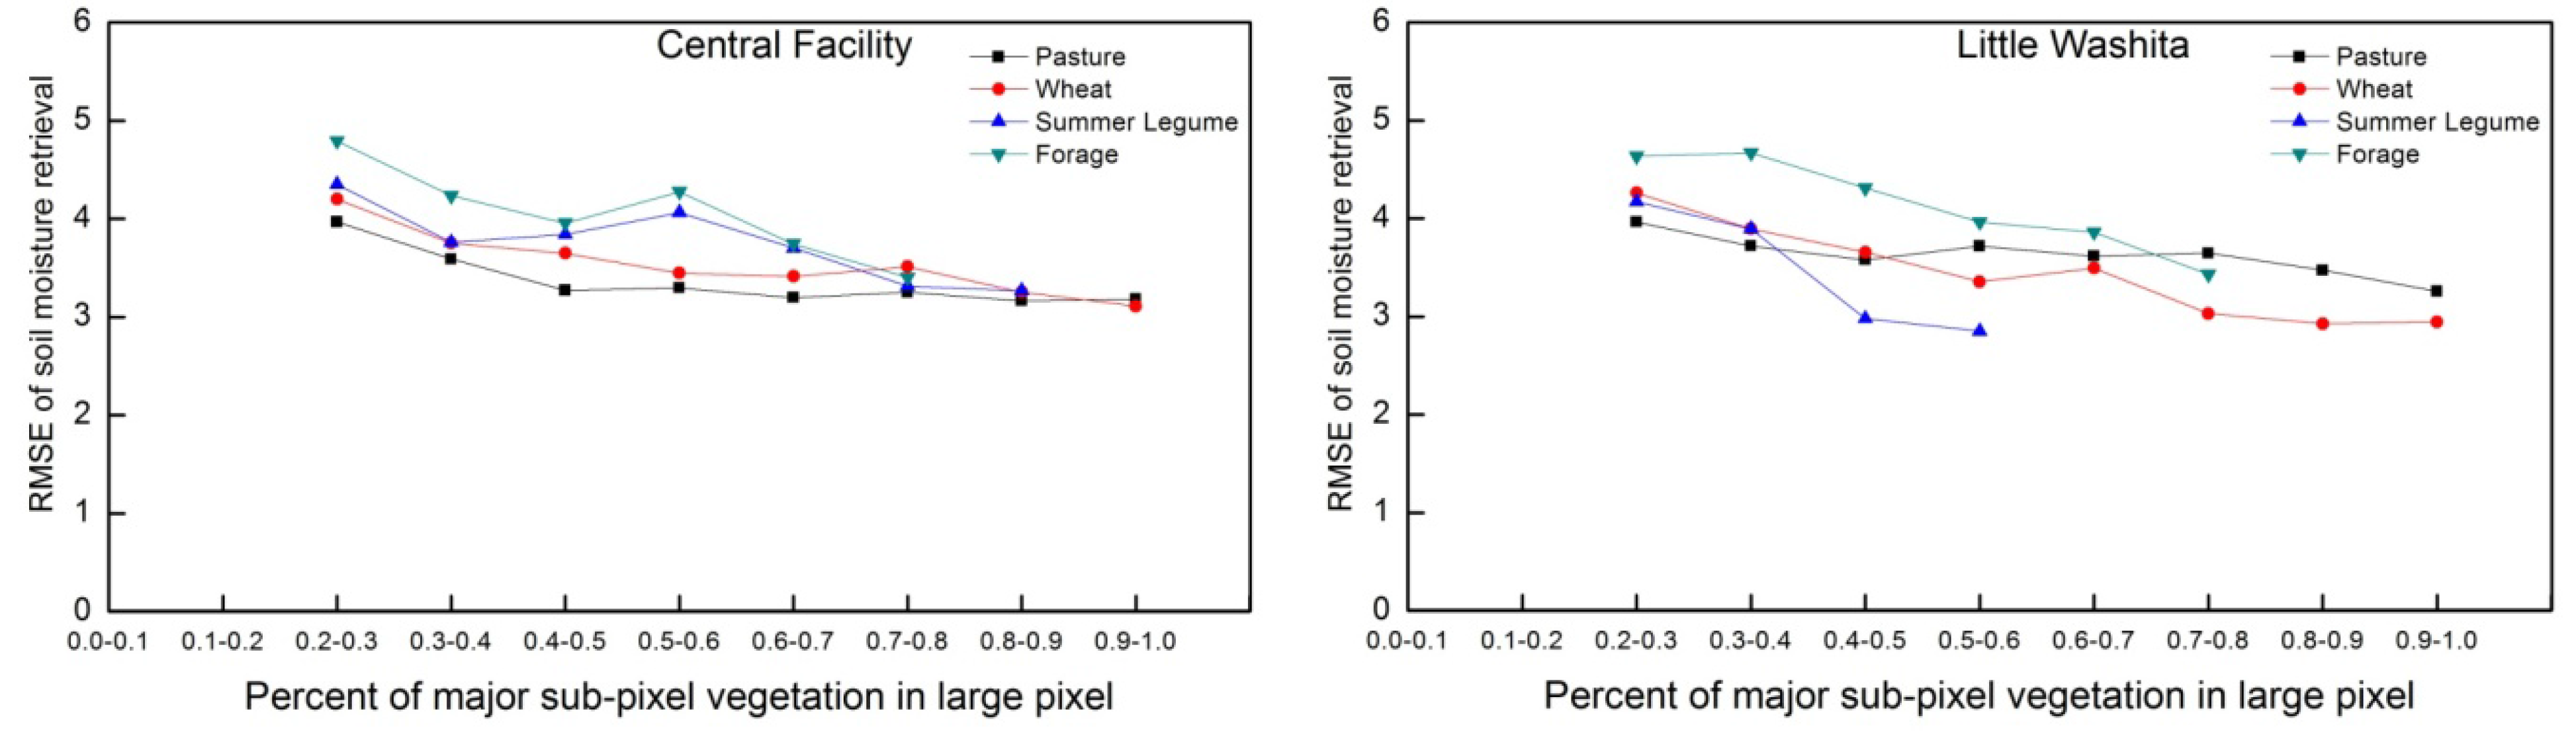
3.3. Land-cover Heterogeneity Impact on Soil Moisture Retrieval

The accuracy of soil moisture retrievals from active microwave data are depends on land cover type and its sub-pixel heterogeneity. A pixel covered by multiple vegetation types and non-uniform soil moisture have confounding influence on retrieval process. The information of sub-pixel spatial distributions of land cover classes in each pixel (e.g. that a given pixel is 65% wheat, 25% pasture/rangeland, and 10% forage) can be used to define the pixel in qualitative terms such as homogeneous or heterogeneous pixel. Therefore, retrieved soil moisture data were compared for different land cover types, to analyze the impact of within pixel land cover fraction on retrieval process.
The effect of land-cover heterogeneity in terms of root mean square error (RMSE) of soil moisture retrieval for different land cover types are illustrated in Figure 8. The RMS error provides information about the deviations between predicted soil moisture and ESTAR soil moisture. The results showed that homogeneous pixels have lower RMSE in soil moisture retrieval compared to heterogeneous pixels. The mean RMSE are higher by ~25% for heterogeneous pixels compared to homogeneous pixels at Central Facility and Little Washita area. The heterogeneity of land cover also linked to NDVI variability (Figure 4), where higher variability of NDVI observed at heterogeneous pixels. The results showed the complexity in retrieving soil moisture from a heterogeneous land surface. Such retrieval requires better understanding and quantification of the spatial distribution of vegetation categories.
Figure 8. Land-cover heterogeneity impact on soil moisture retrieval using active microwave data. Higher values of x-axis represent a homogenous pixel.
Remotesensing 01 00080 g008

4. Conclusions

This study examined the issue of variability and heterogeneity problems that are expected from the sensor with a larger footprint having homogenous and heterogeneous pixels. The statistical variability of vegetation (NDVI) and SAR backscatter were analyzed. Such statistical approach and variability information is critical in validation of land surface and hydrological models. The SAR backscatter variability is directly related to the type of land cover, as discussed in Section 3.2. The variability of SAR backscatter varied based on type of land cover (Wheat and Pasture/Rangeland).
The information on vegetation variability must be evaluated to understand the soil moisture retrieval using active microwave remote sensing where the measured signal is affected by the physical and structural properties of land cover. We noticed that, land-cover heterogeneity reduced the accuracy of soil moisture retrieval. Efforts to evaluate the relative importance of land-cover heterogeneity in soil moisture models will help determine the scale at which it is necessary to characterize land-cover heterogeneity in the field.
The results from this study can be used for soil moisture retrieval from future Soil Moisture Active and Passive (SMAP) mission which will have active microwave sensor with larger footprint (1 km spatial resolution) with homogenous and heterogeneous pixels. The research needs outlined in this study could affect our understanding of land-cover variability impact on soil moisture, as well as our ability to apply that understanding in fields of remote sensing application in water resources. Further, similar studies using 25 m SAR backscatter and 800 m ESTAR radiometer data can bridge the gap and improve our understanding between SMAP radar (1 km) and radiometer (10 km) sensor resolutions. Future SAR related studies should consider evaluating within footprint spatial vegetation variability impact on soil moisture retrieval to refine the current findings.

Acknowledgements

This study was supported and monitored by National Oceanic and Atmospheric Administration (NOAA) under Grant NA06OAR4810162. The views, opinions, and findings contained in this report are those of the author(s) and should not be construed as an official National Oceanic and Atmospheric Administration or U.S. Government position, policy, or decision.

References and Notes

  1. Engman, E.T.; Chauhan, N. Status of microwave soil moisture measurements with remote sensing. Remote Sens. Environ. 1995, 51, 189–198. [Google Scholar] [CrossRef]
  2. Santanello, J.J.A.; Peters-Lidard, C.D.; Garcia, M.E.; Mocko, D.M.; Tischler, M.A.; Moran, S.M.; Thoma, D.P. Using remotely-sensed estimates of soil moisture to infer soil texture and hydraulic properties across a semi-arid watershed. Remote Sens. Environ. 2007, 110, 79–97. [Google Scholar] [CrossRef]
  3. Ulaby, F.T.; Moore, R.; Fung, A. Microwave Remote Sensing Active and Passive From Theory to Applications; Artech House Norwood: MA, USA, 1986. [Google Scholar]
  4. Famiglietti, J.S.; Ryu, D.; Berg, A.A.; Rodell, M.; Jackson, T.J. Field observations of soil moisture variability across scales. Water Resour. Res. 2008, 44, W01423. [Google Scholar] [CrossRef]
  5. Crow, W.T.; Drusch, M.; Wood, E.F. An observation system simulation experiment for the impact of land surface heterogeneity on AMSR-E soil moisture retrievals. IEEE Trans. Geosci. Remote Sens. 2001, 39, 1622–1632. [Google Scholar] [CrossRef]
  6. Bindlish, R.; Barros, A.P. Sub-pixel variability of remotely sensed soil moisture: an inter-comparison study of SAR and ESTAR. Remote Sens. Environ. 2002, 40, 326–337. [Google Scholar] [CrossRef]
  7. Loew, A. Impact of surface heterogeneity on surface soil moisture retrievals from passive microwave data at the regional scale: The Upper Danube case. Remote Sens. Environ. 2008, 112, 231–248. [Google Scholar] [CrossRef]
  8. Kasischke, E.; Smith, K.; Bourgeau-Chavez, L.; Romanowicz, E.; Brunzell, S.; Richardson, C. Effects of seasonal hydrologic patterns in south Florida wetlands on radar backscatter measured from ERS-2 SAR imagery. Remote Sens. Environ. 2003, 88, 423–441. [Google Scholar] [CrossRef]
  9. Brakke, T.W.; Kanemasu, E.T.; Steiner, J.L. Microwave radar response to canopy moisture, leaf-area index, and dry weight of wheat, corn and sorghum. Remote Sens. Environ. 1981, 11, 207–220. [Google Scholar] [CrossRef]
  10. Benediktsson, J.; Swain, P.; Ersoy, O.K. Neural network approaches versus statistical methods in classification of multi-source remote sensing data. IEEE Trans. Geosci. Remote Sens. 1990, 28, 540–552. [Google Scholar] [CrossRef]
  11. Jackson, T.J.; Vine, D.L.; Hsu, A.Y.; Oldak, A.; Starks, P.; Swift, C.; Isham, J.; Haken, M. Soil moisture mapping at regional scales using microwave radiometry: the Southern Great Plains Hydrology Experiment. IEEE Trans. Geosci. Remote Sens. 1999, 37, 2136–2151. [Google Scholar] [CrossRef]
  12. Paola, J.; Schowengerdt, R.A. A review and analysis of back-propagation neural networks for classification of remotely-sensed multi-spectral imagery. Int. J. Remote Sens. 1995, 16, 3033–3058. [Google Scholar] [CrossRef]
  13. Low, H.K.; Chuah, H.T.; Ewe, H.T. A neural network land use classifier for SAR images using textural and fractal information. Geocarto Int. 1999, 14, 66–73. [Google Scholar] [CrossRef]
  14. Carpenter, G.A.; Gopal, S.; Macomber, S.; Martens, S.; Woodcock, C.E.; Franklin, J. A neural network method for efficient vegetation mapping. Remote Sens. Environ. 1999, 70, 326–338. [Google Scholar] [CrossRef]
  15. Lakhankar, T. Estimation of soil moisture using active microwave remote sensing data. Ph.D Thesis, City University of New York, New York, NY, USA, 2006. [Google Scholar]
  16. Lakhankar, T.; Ghedira, H.; Temimi, M.; Sengupta, M.; Khanbilvardi, R.; Blake, R. Non-parametric Methods for Soil Moisture Retrieval from Satellite Remote Sensing Data. Remote Sens. 2009, 1, 3–21. [Google Scholar] [CrossRef] [Green Version]

