1. Introduction
Driven by increasing environmental pressures and rising fuel costs the aerospace industry has a growing need to produce ever lighter and more efficient structures and components, leading to high levels of structural optimization and the increased use of composite materials. To ensure continued safe operation during long term service, large amounts of inspection and maintenance must be performed on the ground, accounting for up to one quarter of a commercial fleet’s running costs [
1]. A Structural Health Monitoring (SHM) system for aerospace structures would offer great potential for maintenance cost savings and a potential reduction in the safety factor required for optimized structures. Acoustic Emission (AE) can provide the real time global monitoring capability required for such a SHM system, unfortunately limits in the size, weight, robustness and adaptability to complex geometries of current commercially available sensors makes them less appropriate. If SHM techniques developed in the laboratory are to make the transition to field testing there is a requirement to address these issues. In response to this requirement a number of transducers have been developed utilising piezoelectric films.
Polyvinylidene fluoride (PVDF) transducers have been used to monitor AE in tensile and bending tests of composite materials [
2,
3] where simple analysis correlated trends in AE activity with reductions in load resulting from damage development. Additionally PVDF transducers have also been used for the generation and detection of transient waves for Acousto-Ultrasonic applications [
4,
5]. However, the use of PVDF transducers to monitor strain in fatigue applications identified a directional sensitivity [
6]. Although the PVDF transducers offer durability and flexibility compared with monolithic PZT transducers, they lack electro-mechanical coupling efficiency thus making them less sensitive, furthermore the electro-mechanical coupling efficiency demonstrates a large temperature dependency.
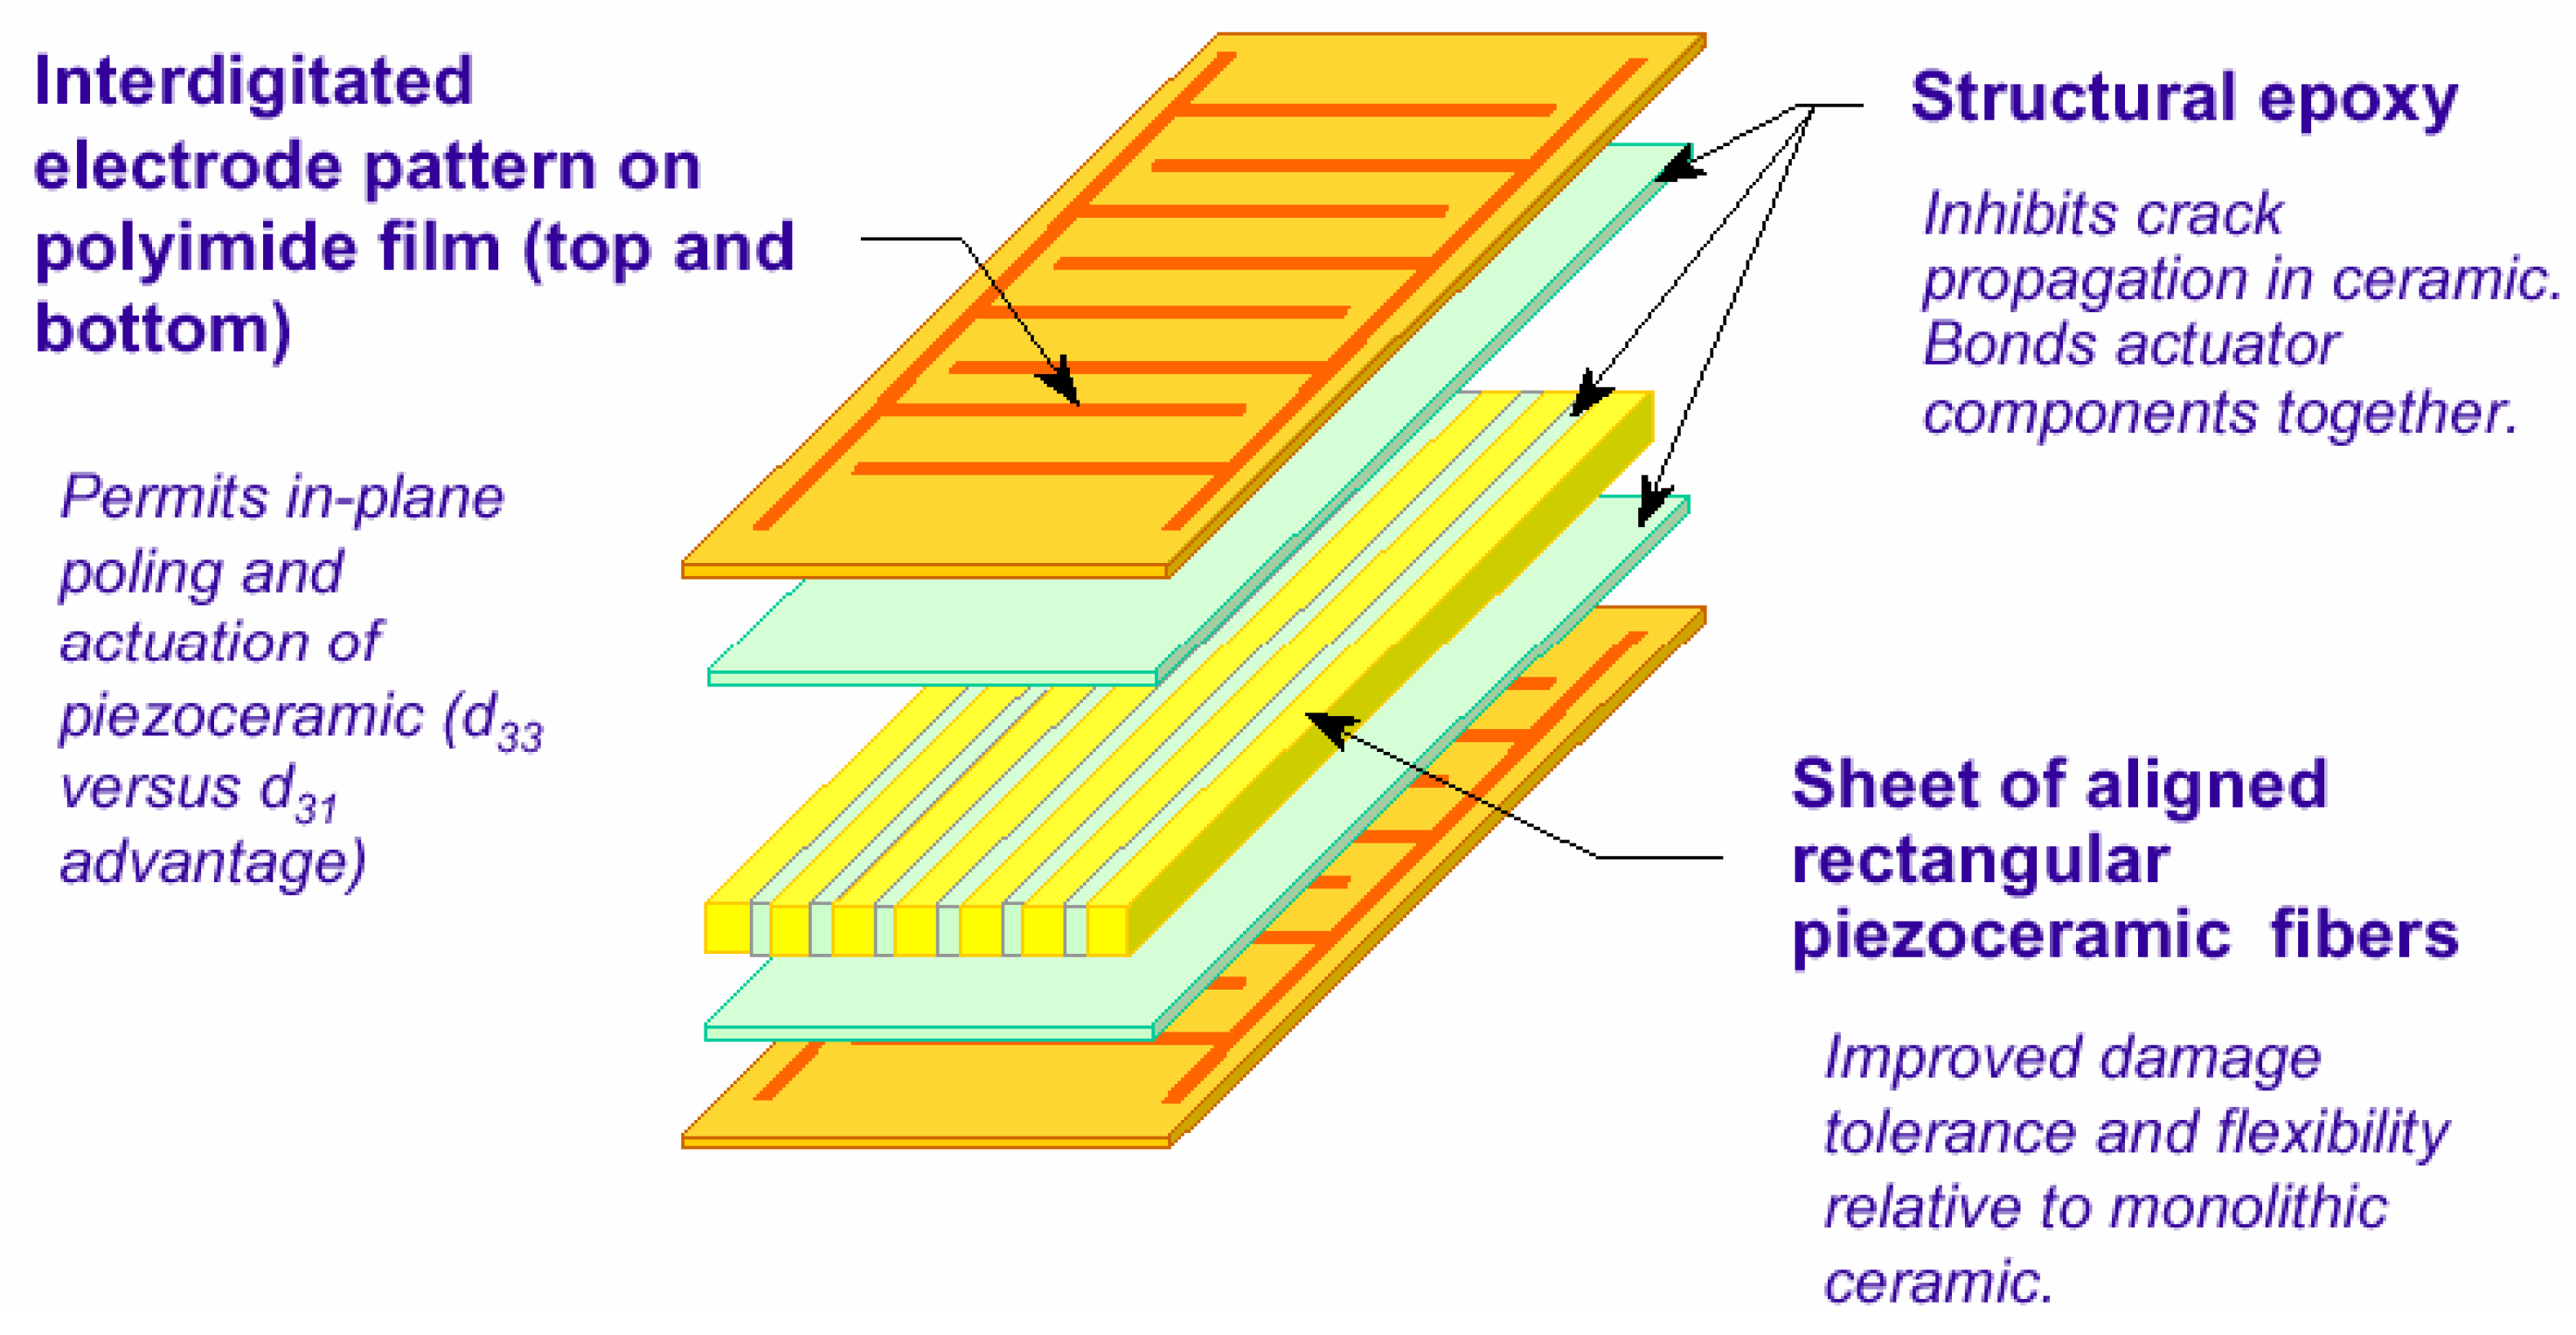
More recently Active Fibre Composite (AFC) and Macro Fibre Composite (MFC) transducers have been developed. Both transducers consist of very thin unidirectionally aligned piezoceramic fibres sandwiched between two sets of interdigitated electrode polymide films. This electrode arrangement provides an electric field that exploits the large, in-plane (3-3) electro-mechanical coupling [
7] (
Figure 1). Developed at the NASA Langley Research Centre, the MFCs use rectangular piezoceramic fibres, as opposed to the circular fibres of the AFCs, and are significantly cheaper to manufacture. They exhibit the same durability and flexibility as the PVDF transducer, but offer increased sensitivity, making them a potential alternative to commercial AE sensors. Additionally, due to their film-like construction, the transducers have the potential to be embedded in composite materials to provide an inbuilt SHM system. A study of AFC transducers showed them to have a low operating frequency range (30-100 kHz) and a resonance of approximately 50 kHz [
8]. The transducers were seen to be directionally dependant with peak sensitivity observed from signals propagating parallel to the piezoelectric fibres. Furthermore, impact damage was identified using AFC transducers to perform Acousto-Ultrasonics in tensile specimens. MFC transducers have also been used as both ultrasonic transducers and AE sensors for the detection of artificially induced corrosion in steel pipes [
9]. Source location techniques have also been performed using MFC transducer rosettes to locate artificial AE sources in aluminium and composite structures [
10].
It has been shown that AFC and MFC sensors are capable of recording AE data and simple analysis of activity trends has yielded some success for damage detection, however, the identified directionality is of some concern. Advanced analysis techniques for AE rely increasingly on waveform based analysis and any changes in signal shape resulting from the transducers directionality will be detrimental to this approach. Therefore it is vital that their suitability as an AE sensor is assessed and their sensing characteristics understood before they can be fully integrated into a SHM system.
This paper details an initial investigation into the suitability of MFC transducers as AE sensors. Tests were conducted to assess the directional sensitivity using signal feature data and cross-correlations of signals recorded from multiple directions. Detection sensitivity and attenuation with distance were investigated and comparison made to commercially available AE sensors. Additionally a series of compressive carbon fiber coupon tests were monitored simultaneously using both an MFC transducer and a commercially available AE sensor to allow further comparison of the MFC transducers’ performance.
Figure 1.
MFC transducer construction [
7].
Figure 1.
MFC transducer construction [
7].
2. Experimental Procedure
A number of tests were conducted in which MFC transducers were used in place of traditional AE sensors, in order to assess their suitability for this role and their performance was compared with that of commercially available AE sensors. Signals from both the MFC and AE sensors were amplified by 40 dB using Physical Acoustics Ltd. (PAL) 2/4/6 pre-amplifiers and the resulting signals were recorded using a PAL PCI-2 system in all cases. The system acquisition parameters used for all tests are presented in
Table 1.
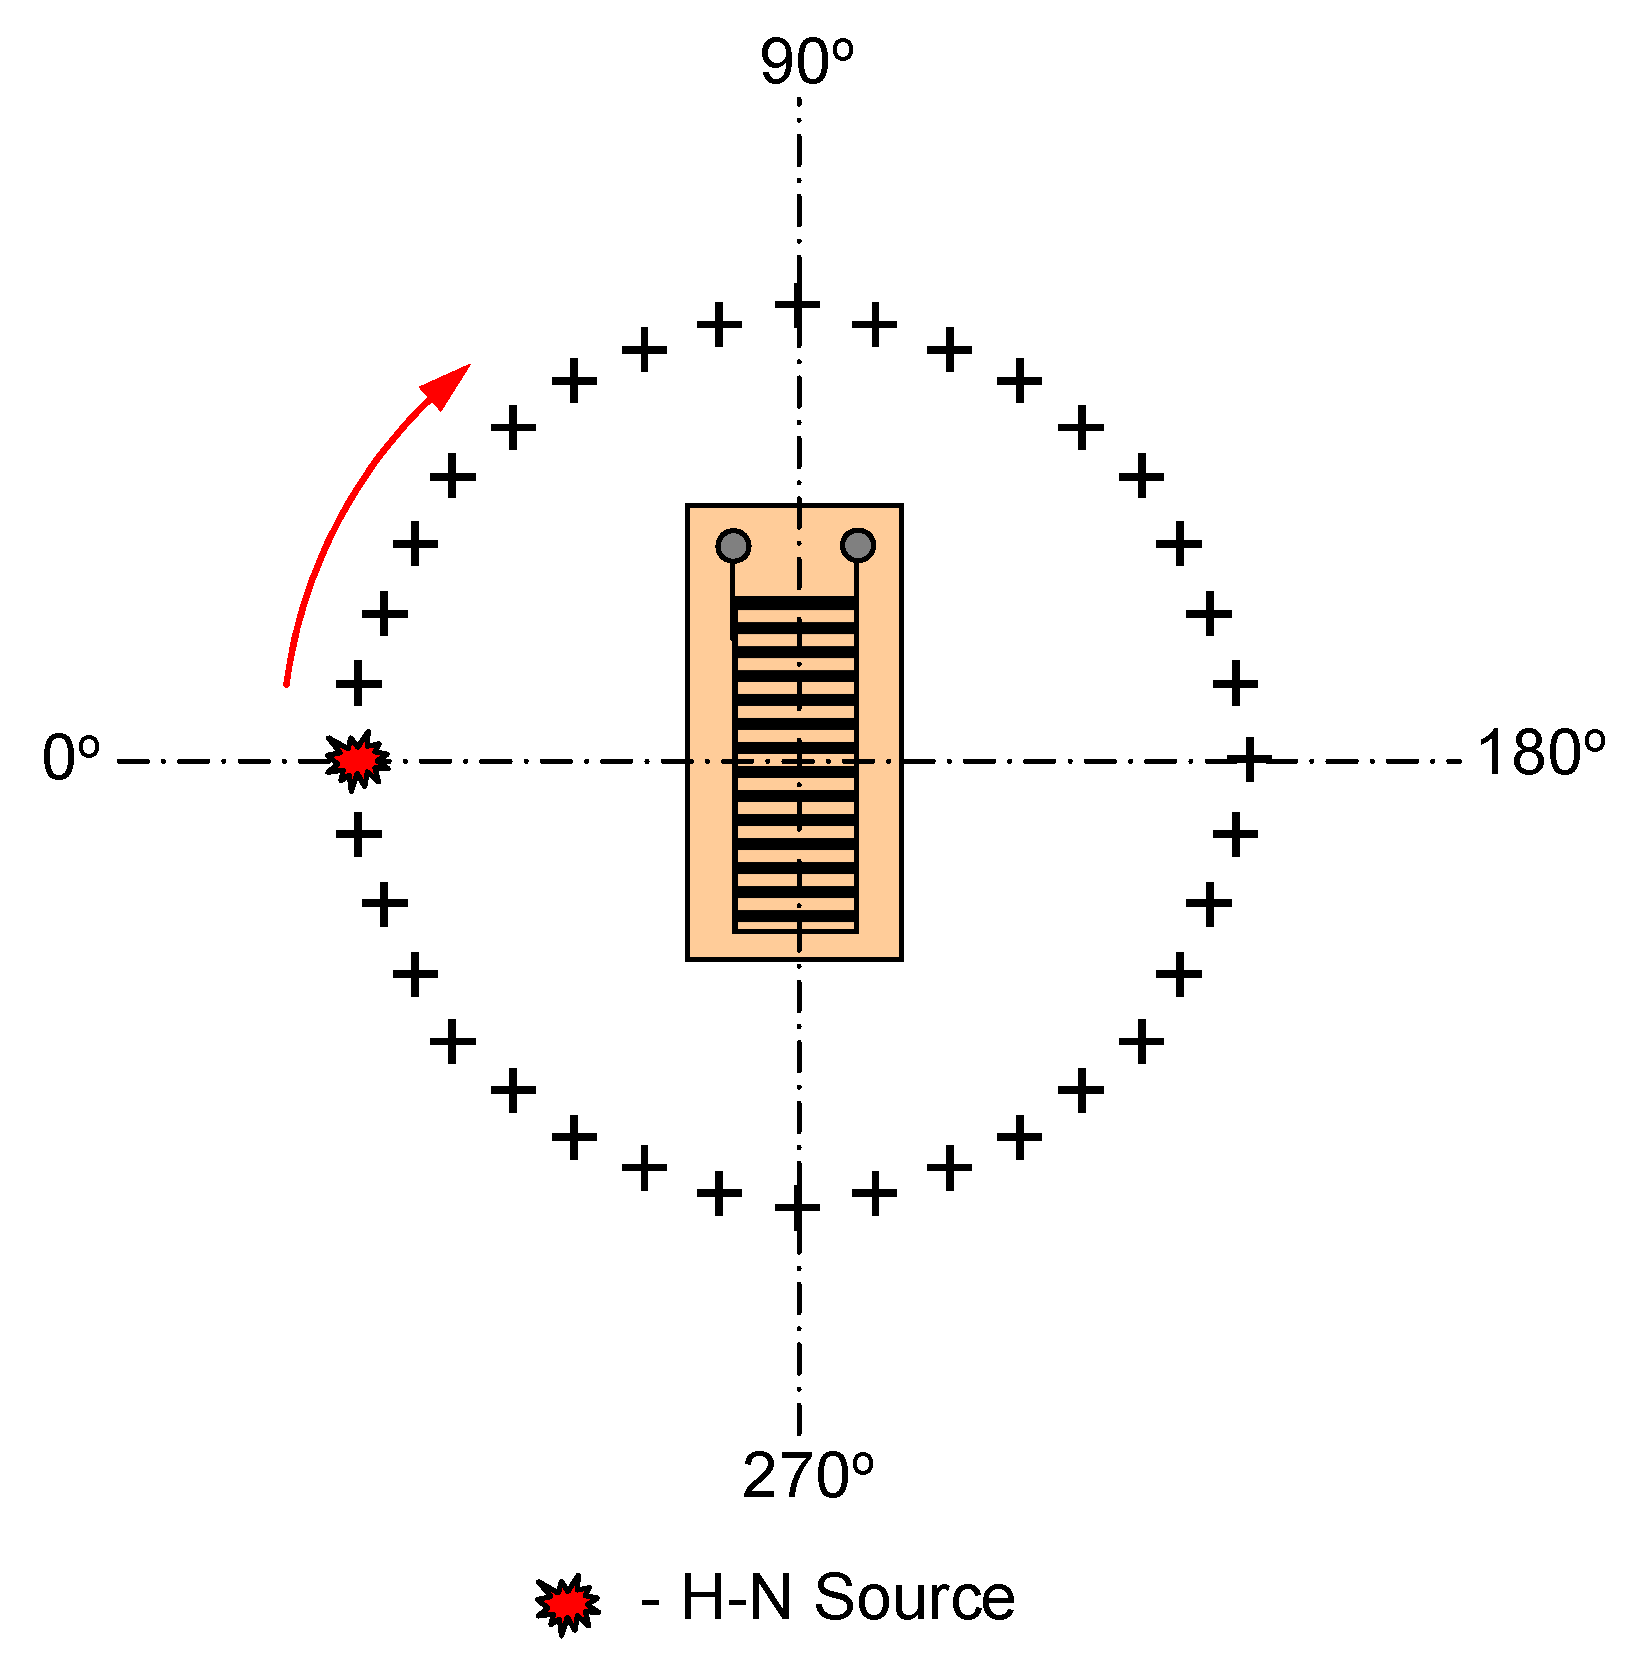
The directional sensitivity of MFC transducers was assessed using a Smart Materials M4010 MFC transducer bonded (using a cyanoacrylate adhesive) to the centre of a 300 mm × 300 mm × 3 mm aluminium plate. Starting at 0° (perpendicular to the piezoceramic fibre direction) signals were generated around the sensor at 10° intervals and 50 mm from the transducer centre point using a Hsu-Neilson (H-N) source [
11] (
Figure 2). To limit the effect of variance in the H-N source, ten signals were recorded at each test point and average values of signal feature data for each direction were compared. Additionally a cross-correlation technique was used that provides a measure of signal similarity and therefore is a good indication of change in the signals with direction. Cross-correlations of signals from each individual direction were performed to demonstrate the repeatability of the H-N source and then one signal from the 0° direction was used to perform cross-correlations with the signals from all other directions to assess there similarity. The cross-correlations were performed in MatLab using the following command
Table 1.
AE acquisition parameters.
Table 1.
AE acquisition parameters.
| | Threshold | Preamp | Filter | Sample Rate | PreTrigger | No. of Samples | PDT | HDT | HLT |
|---|
| MFC | 45 dB | 40 dB | 20-1200 kHz | 4 MSPS | 100 μs | 2048 | 20 μs | 20 μs | 50 μs |
| Pico | 45 dB | 40 dB | 20-1200 kHz | 4 MSPS | 100 μs | 2048 | 20 μs | 20 μs | 50 μs |
Figure 2.
Experimental set up of directional sensitivity test (active sensor area 40 mm × 10 mm and H-N source performed at 50 mm from centre of sensor).
Figure 2.
Experimental set up of directional sensitivity test (active sensor area 40 mm × 10 mm and H-N source performed at 50 mm from centre of sensor).
The x = max(xcorr(a1,a2,’coef’)) command
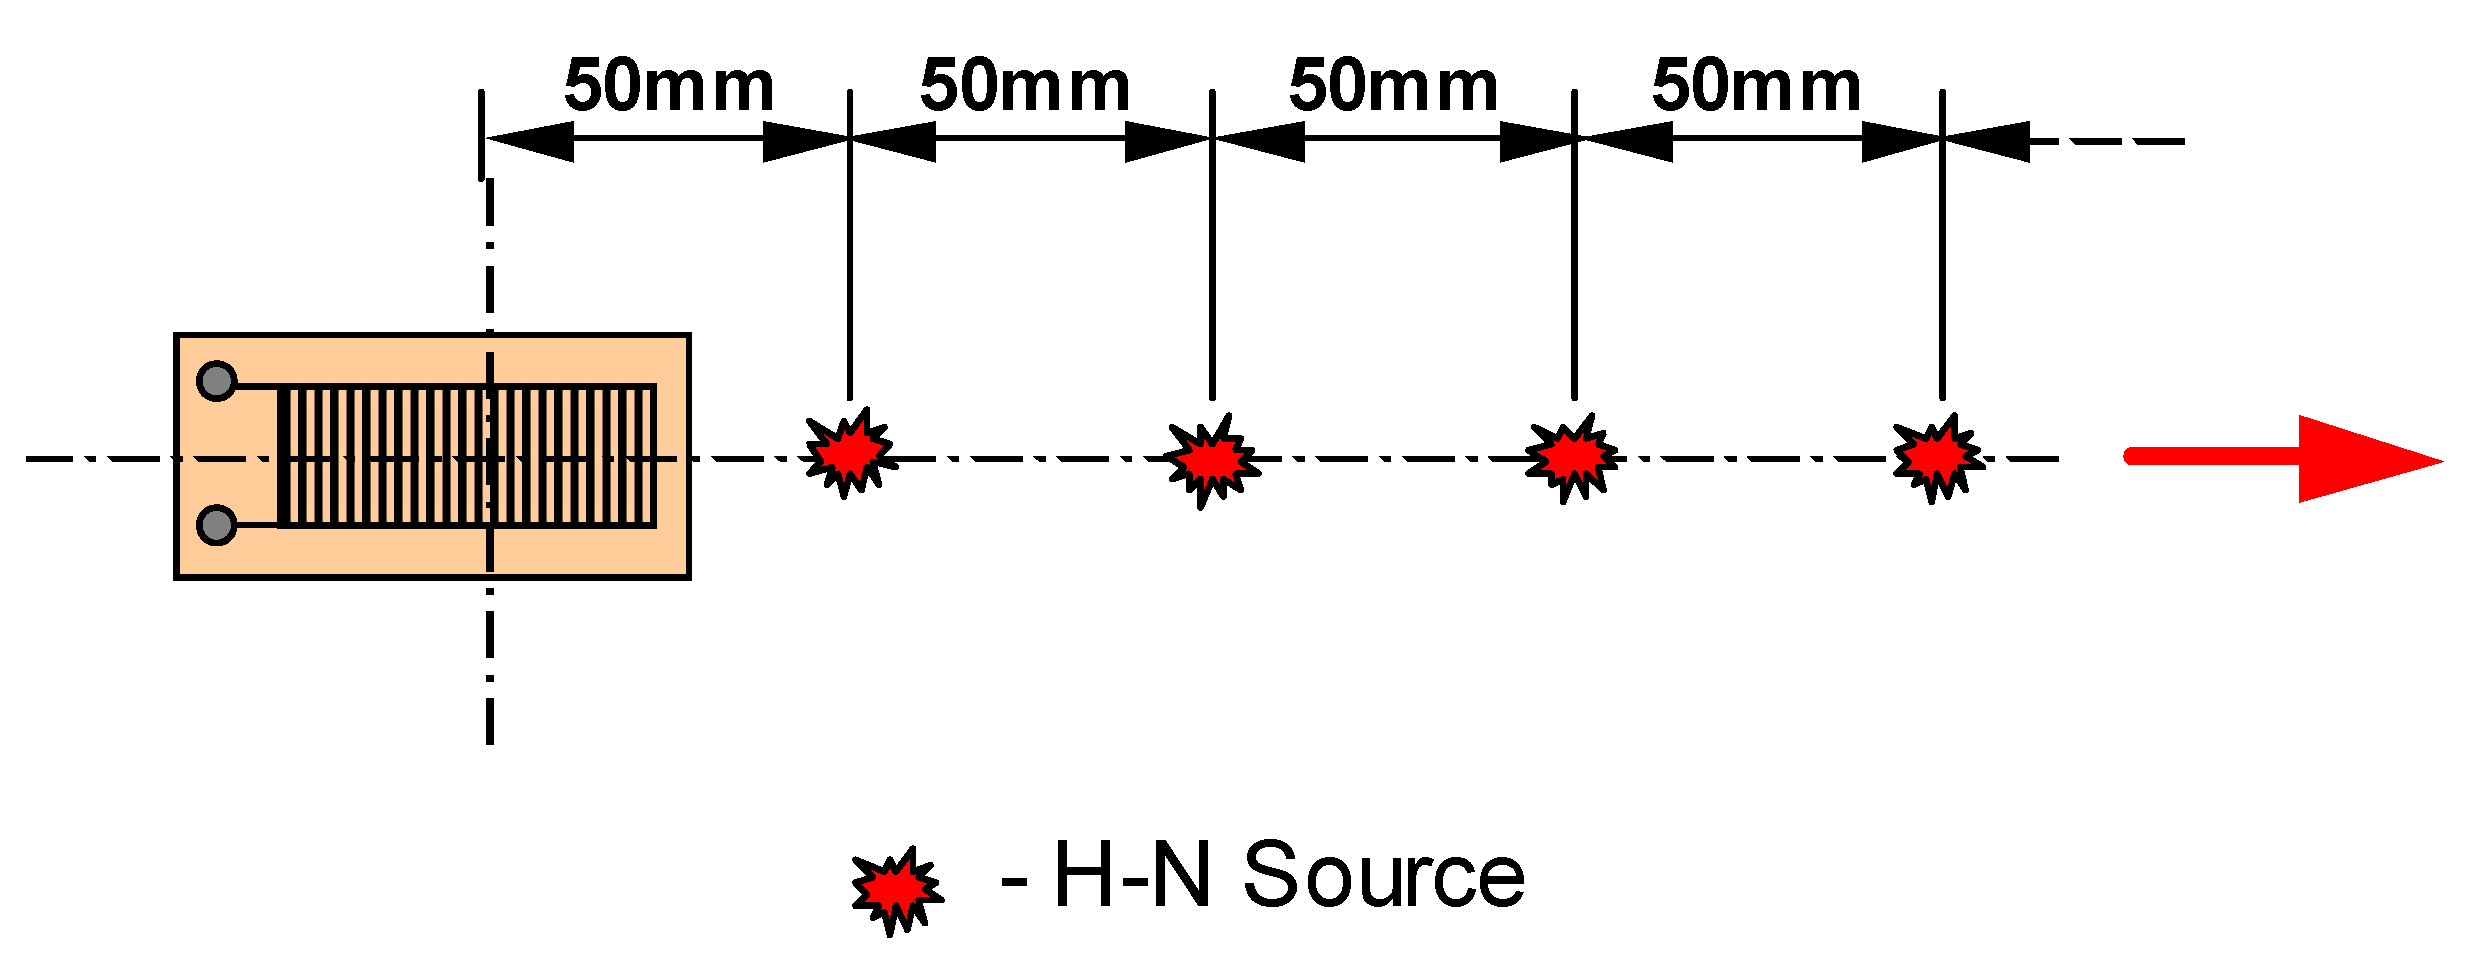
This command returns the maximum value from the cross-correlation of signals a1 and a2 that is normalised against the maximum value of the auto-correlation of signal a1. An attenuation investigation was conducted on a larger 900 mm × 900 mm × 5 mm aluminium plate (supported by rubber feet at each corner), to which a Smart Materials M4010 sensor was attached (using cyanoacrylate adhesive) along the centre line of the plate at 200 mm from one edge, in order to minimize the effects of reflections. Signals were generated using a H-N source at distances increasing from 50 mm to 500 mm from the sensor centre point in 50 mm intervals (
Figure 3). Ten signals were generated at each test point and average values are presented in the results. For comparison the same test was repeated using a PAL Nano 30 sensor (attached using cyanoacrylate adhesive) in place of the MFC transducer.
Additionally, signals were recorded from H-N sources at 50 mm from the centre of the Nano 30 sensor and MFC transducer both parallel to and perpendicular to the piezoelectric fibres. This was done in order to compare the frequency response of both sensors and to assess any directionality present in the MFC transducer.
Figure 3.
Experimental set up of attenuation study (active sensor area 40 mm × 10 mm).
Figure 3.
Experimental set up of attenuation study (active sensor area 40 mm × 10 mm).
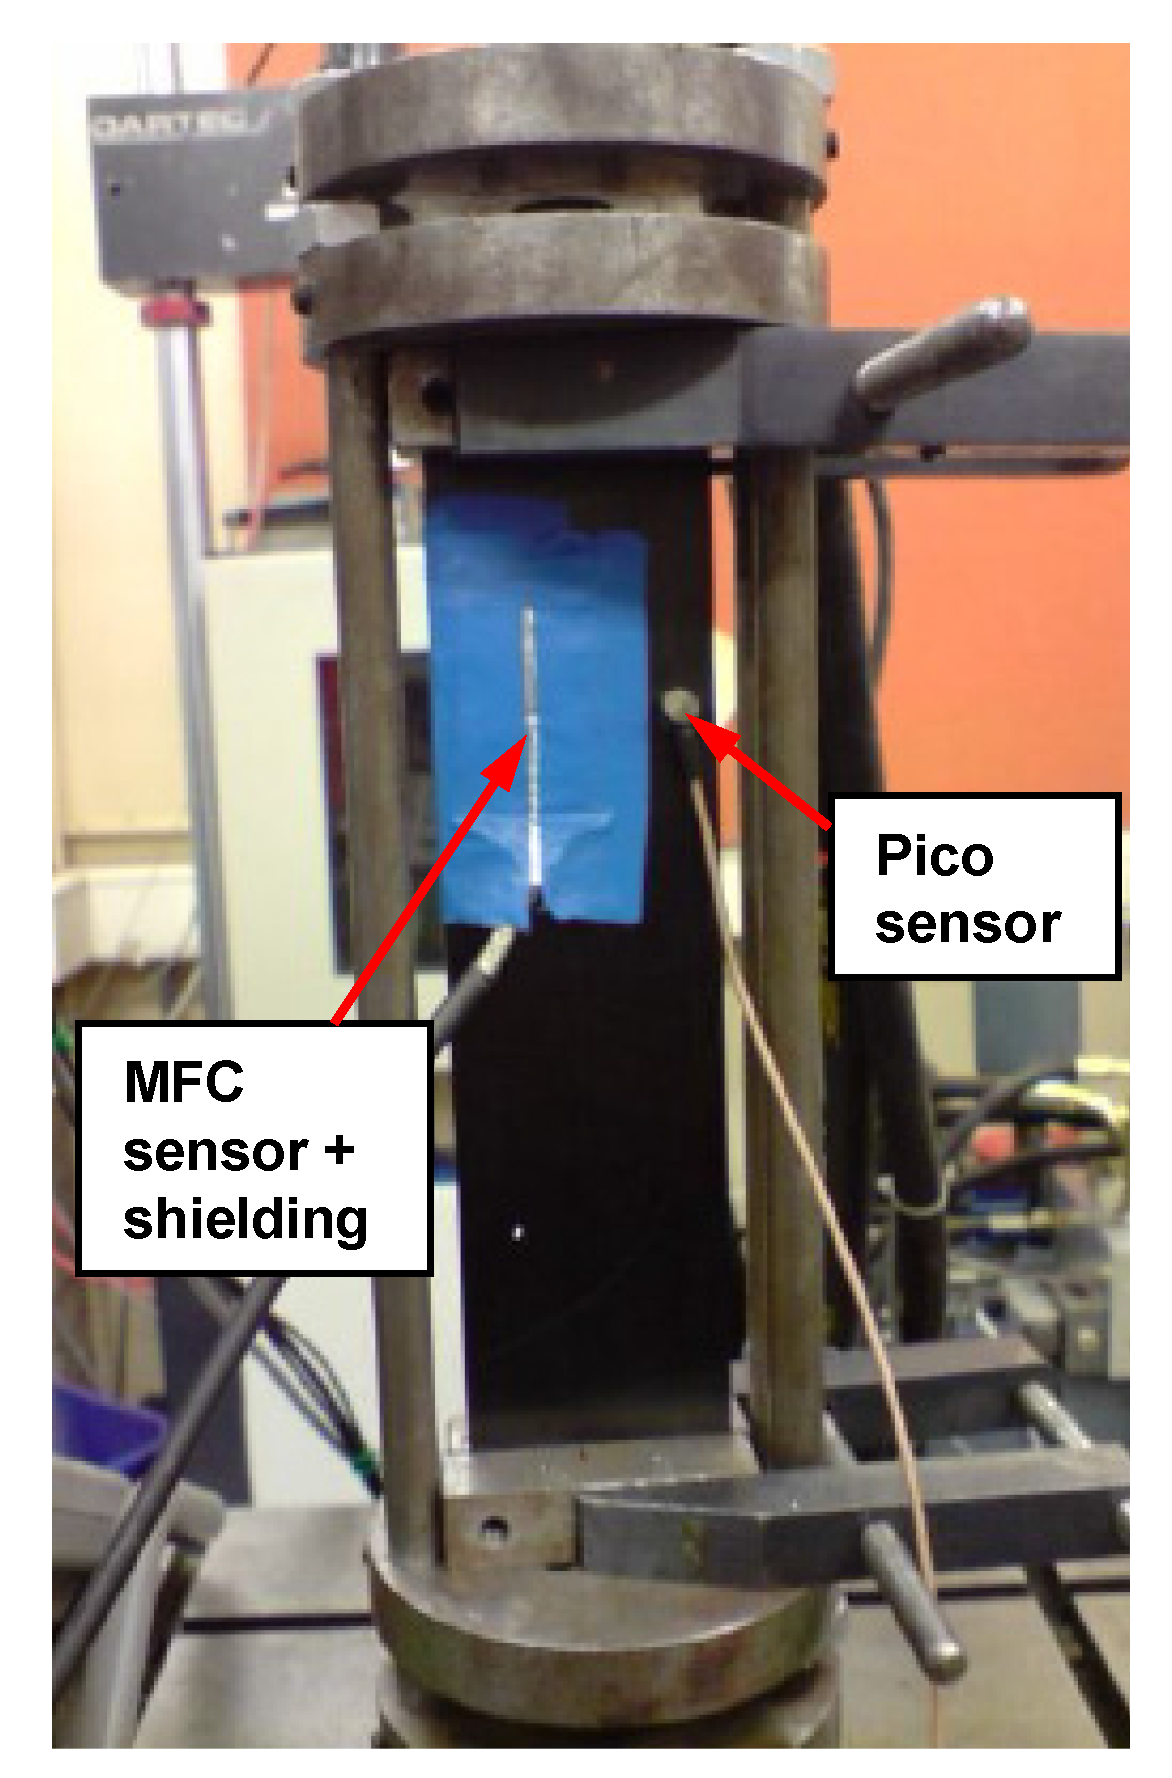
In order to compare the performance of an MFC transducer with a commercial AE sensor in a test environment both sensors were used to simultaneously monitor strip buckling tests on four carbon fibre coupon specimens. The specimens were 200 mm × 50 mm × 2 mm carbon fibre strips with a (0,90)
4S lay-up and subject to an in-plane compressive load along their length. This was facilitated by a loading cage that provides built-in supports at each end, reducing the unsupported length to 170 mm, and ensuring the supports remain aligned throughout the test. The specimens were loaded to a maximum displacement of 10 mm at a rate of 2 mm min
-1 and simultaneously monitored with a Smart Materials M4010 MFC sensor and a PAL Pico sensor (shown in
Figure 4) mounted with cyanoacrylate adhesive. To reduce electrical noise the MFC transducer was also covered with an aluminium foil shield that was attached to ground on the sensor cable. Both sensors used the same AE acquisition parameters used previously (
Table 1) with the exception of threshold level which was 35 dB for the MFC transducer and 45 dB for the Pico sensor to compensate for the reduced sensitivity of the MFC transducer, thus making the results from the two sensors more comparable.
Figure 4.
Strip buckling test experimental set up and instrumentation.
Figure 4.
Strip buckling test experimental set up and instrumentation.
3. Results and Discussion
3.1. Frequency response
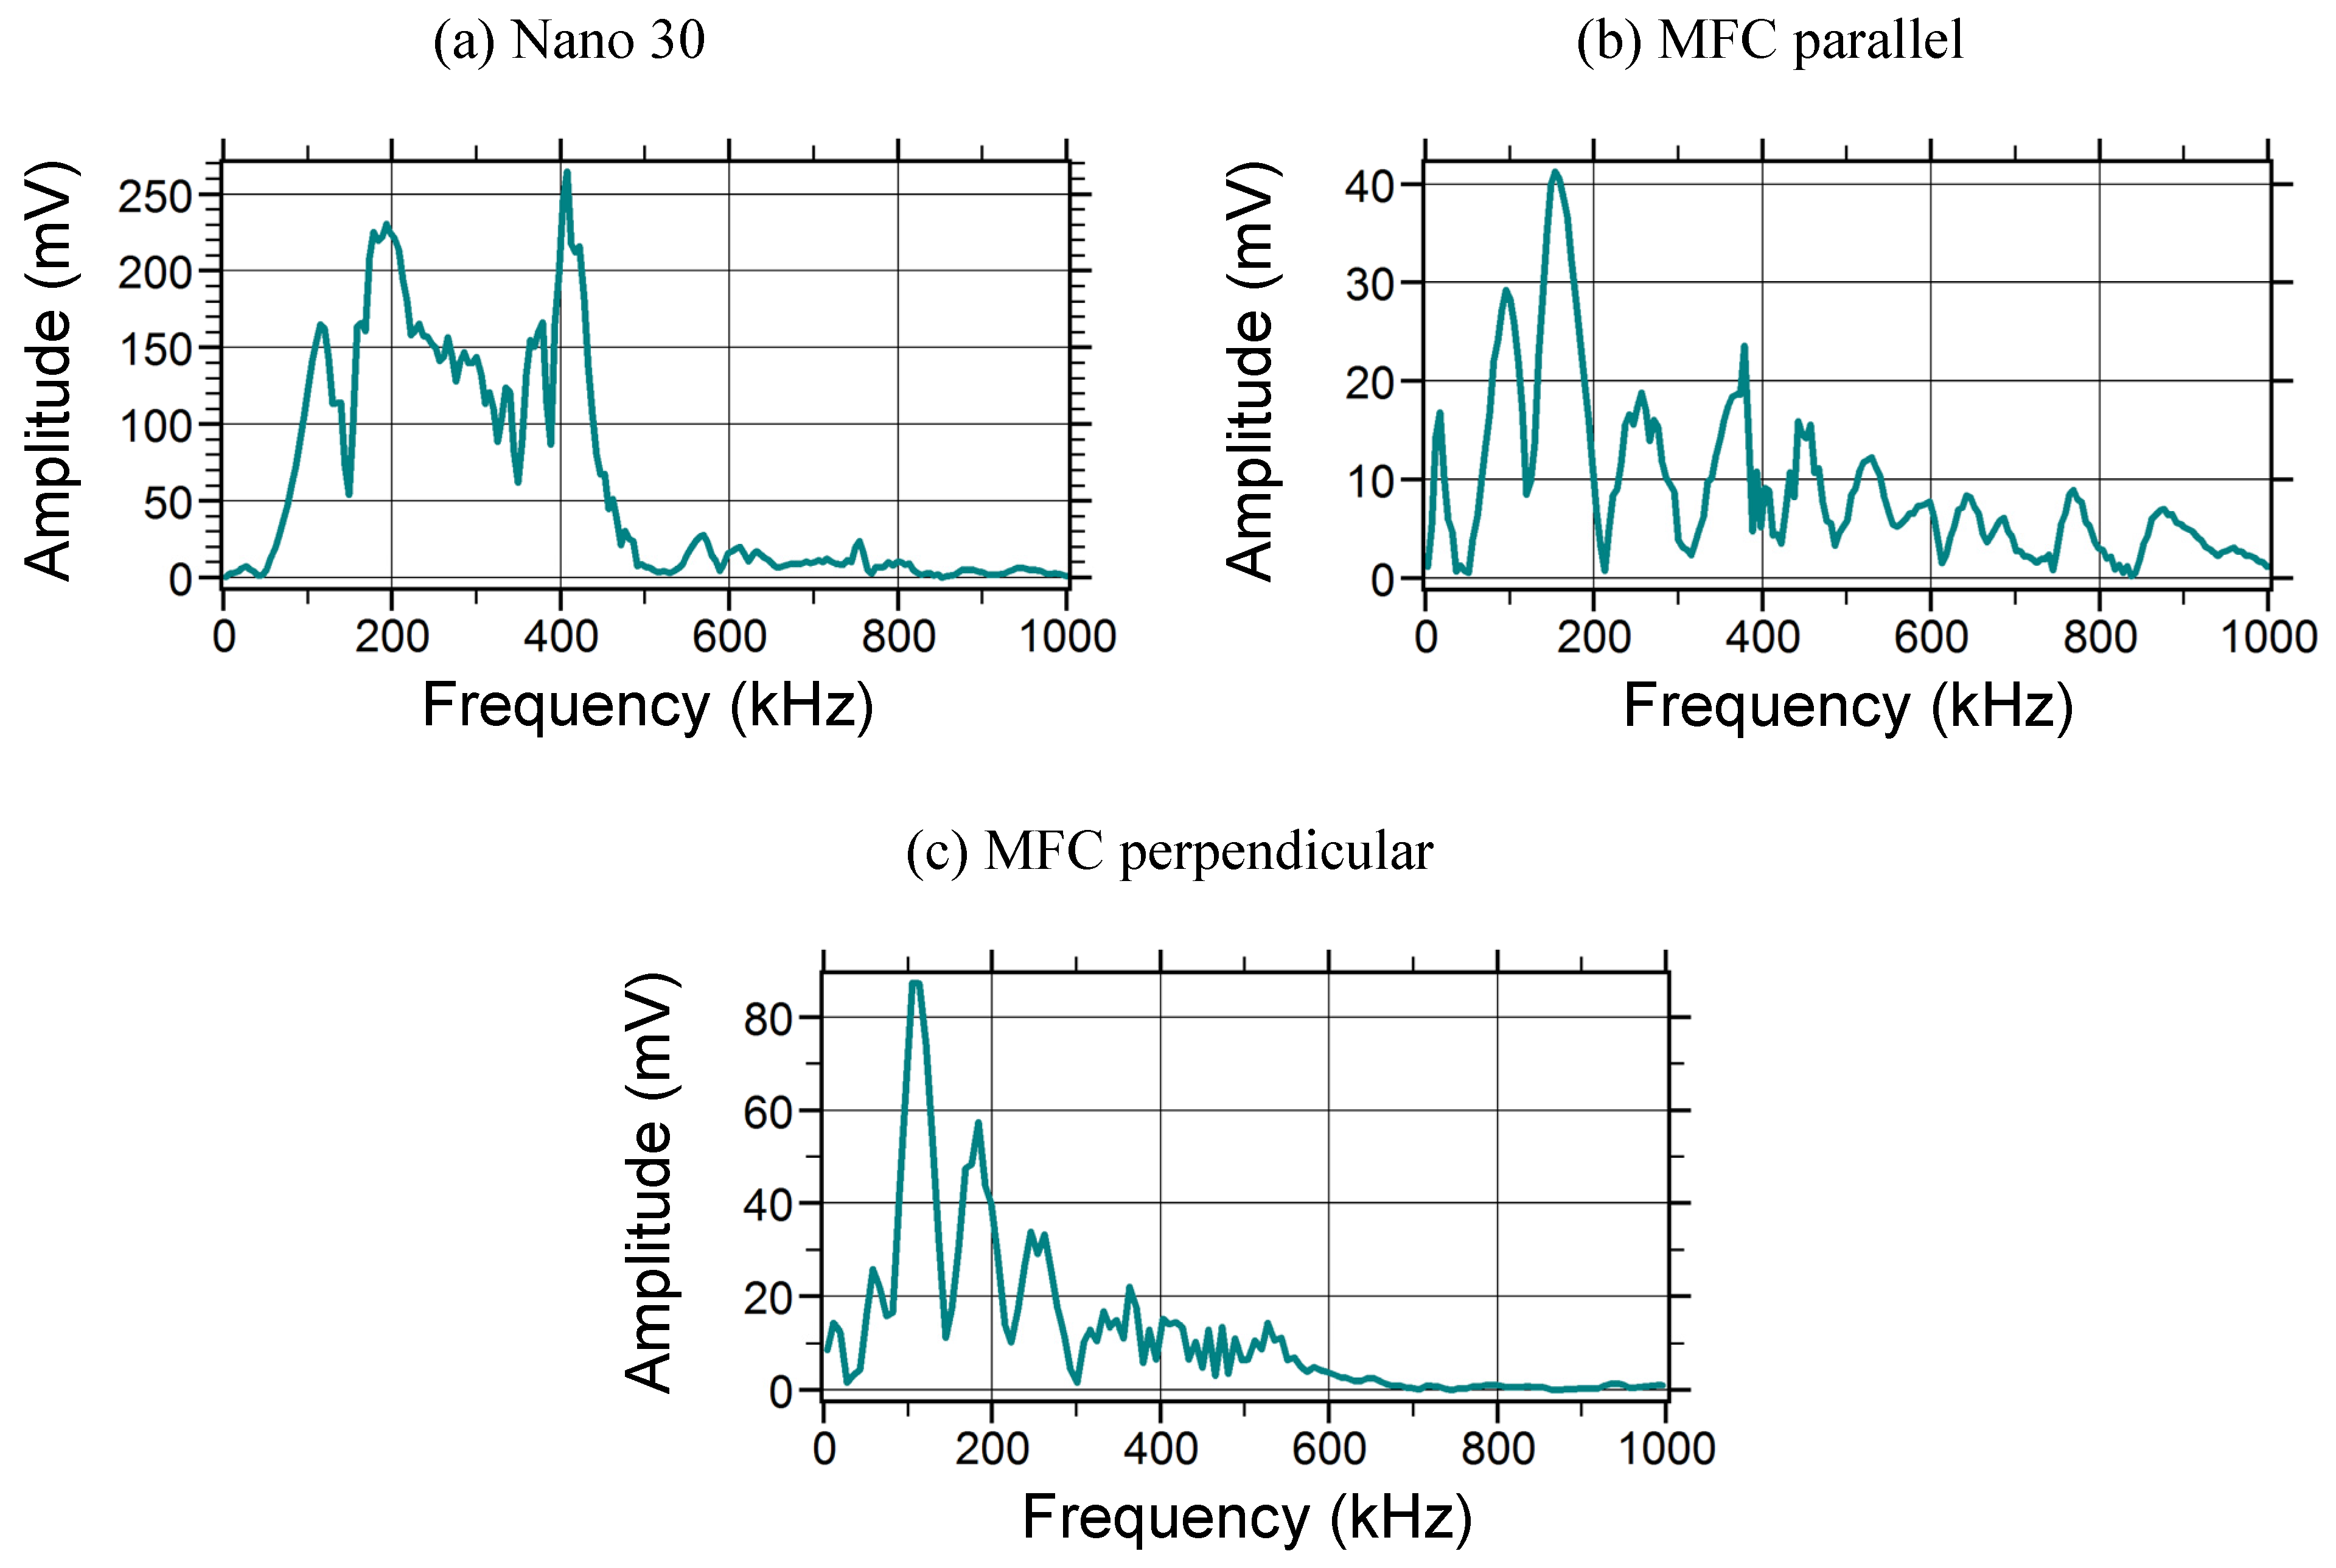
Figure 5a, b and c present the Fast Fourier Transforms (FFT) of signals recorded from a H-N source at 50 mm from the Nano 30 sensor, the MFC sensor parallel to the piezoelectric fibres and the MFC sensor perpendicular to the piezoelectric fibres, respectively. The FFTs were performed on the first 100 μs of the signals in order to avoid the inclusion of reflections from plate boundaries. The signal recorded by the Nano 30 (
Figure 5a) has its peak frequency content at approximately 400 kHz and second strong peak is also seen at approximately 200 kHz. Little energy is contained in the signal above 500 kHz and below 100 kHz. The signals recorded parallel and perpendicular to the piezoelectric fibres in the MFC sensor (
Figure 5b and c) have peak frequencies of approximately 150 kHz and 100 kHz, respectively. In both cases the majority of the energy in the signal is contained below 200 kHz, however the signal recorded parallel to the piezoelectric fibres contains more energy at higher frequencies (above 200 kHz) than the signal recorded perpendicular to the fibres. This is thought to be a result of the piezoelectric fibres being more sensitive to the in-plane motion of the symmetric plate wave propagation mode (which commonly contains energy at higher frequencies) in this direction. The same effects of signal propagation direction were observed in FFTs by Babezat
et al. [
8].
Figure 5.
FFTs of signals recorded by Nano 30 sensor and MFC transducer.
Figure 5.
FFTs of signals recorded by Nano 30 sensor and MFC transducer.
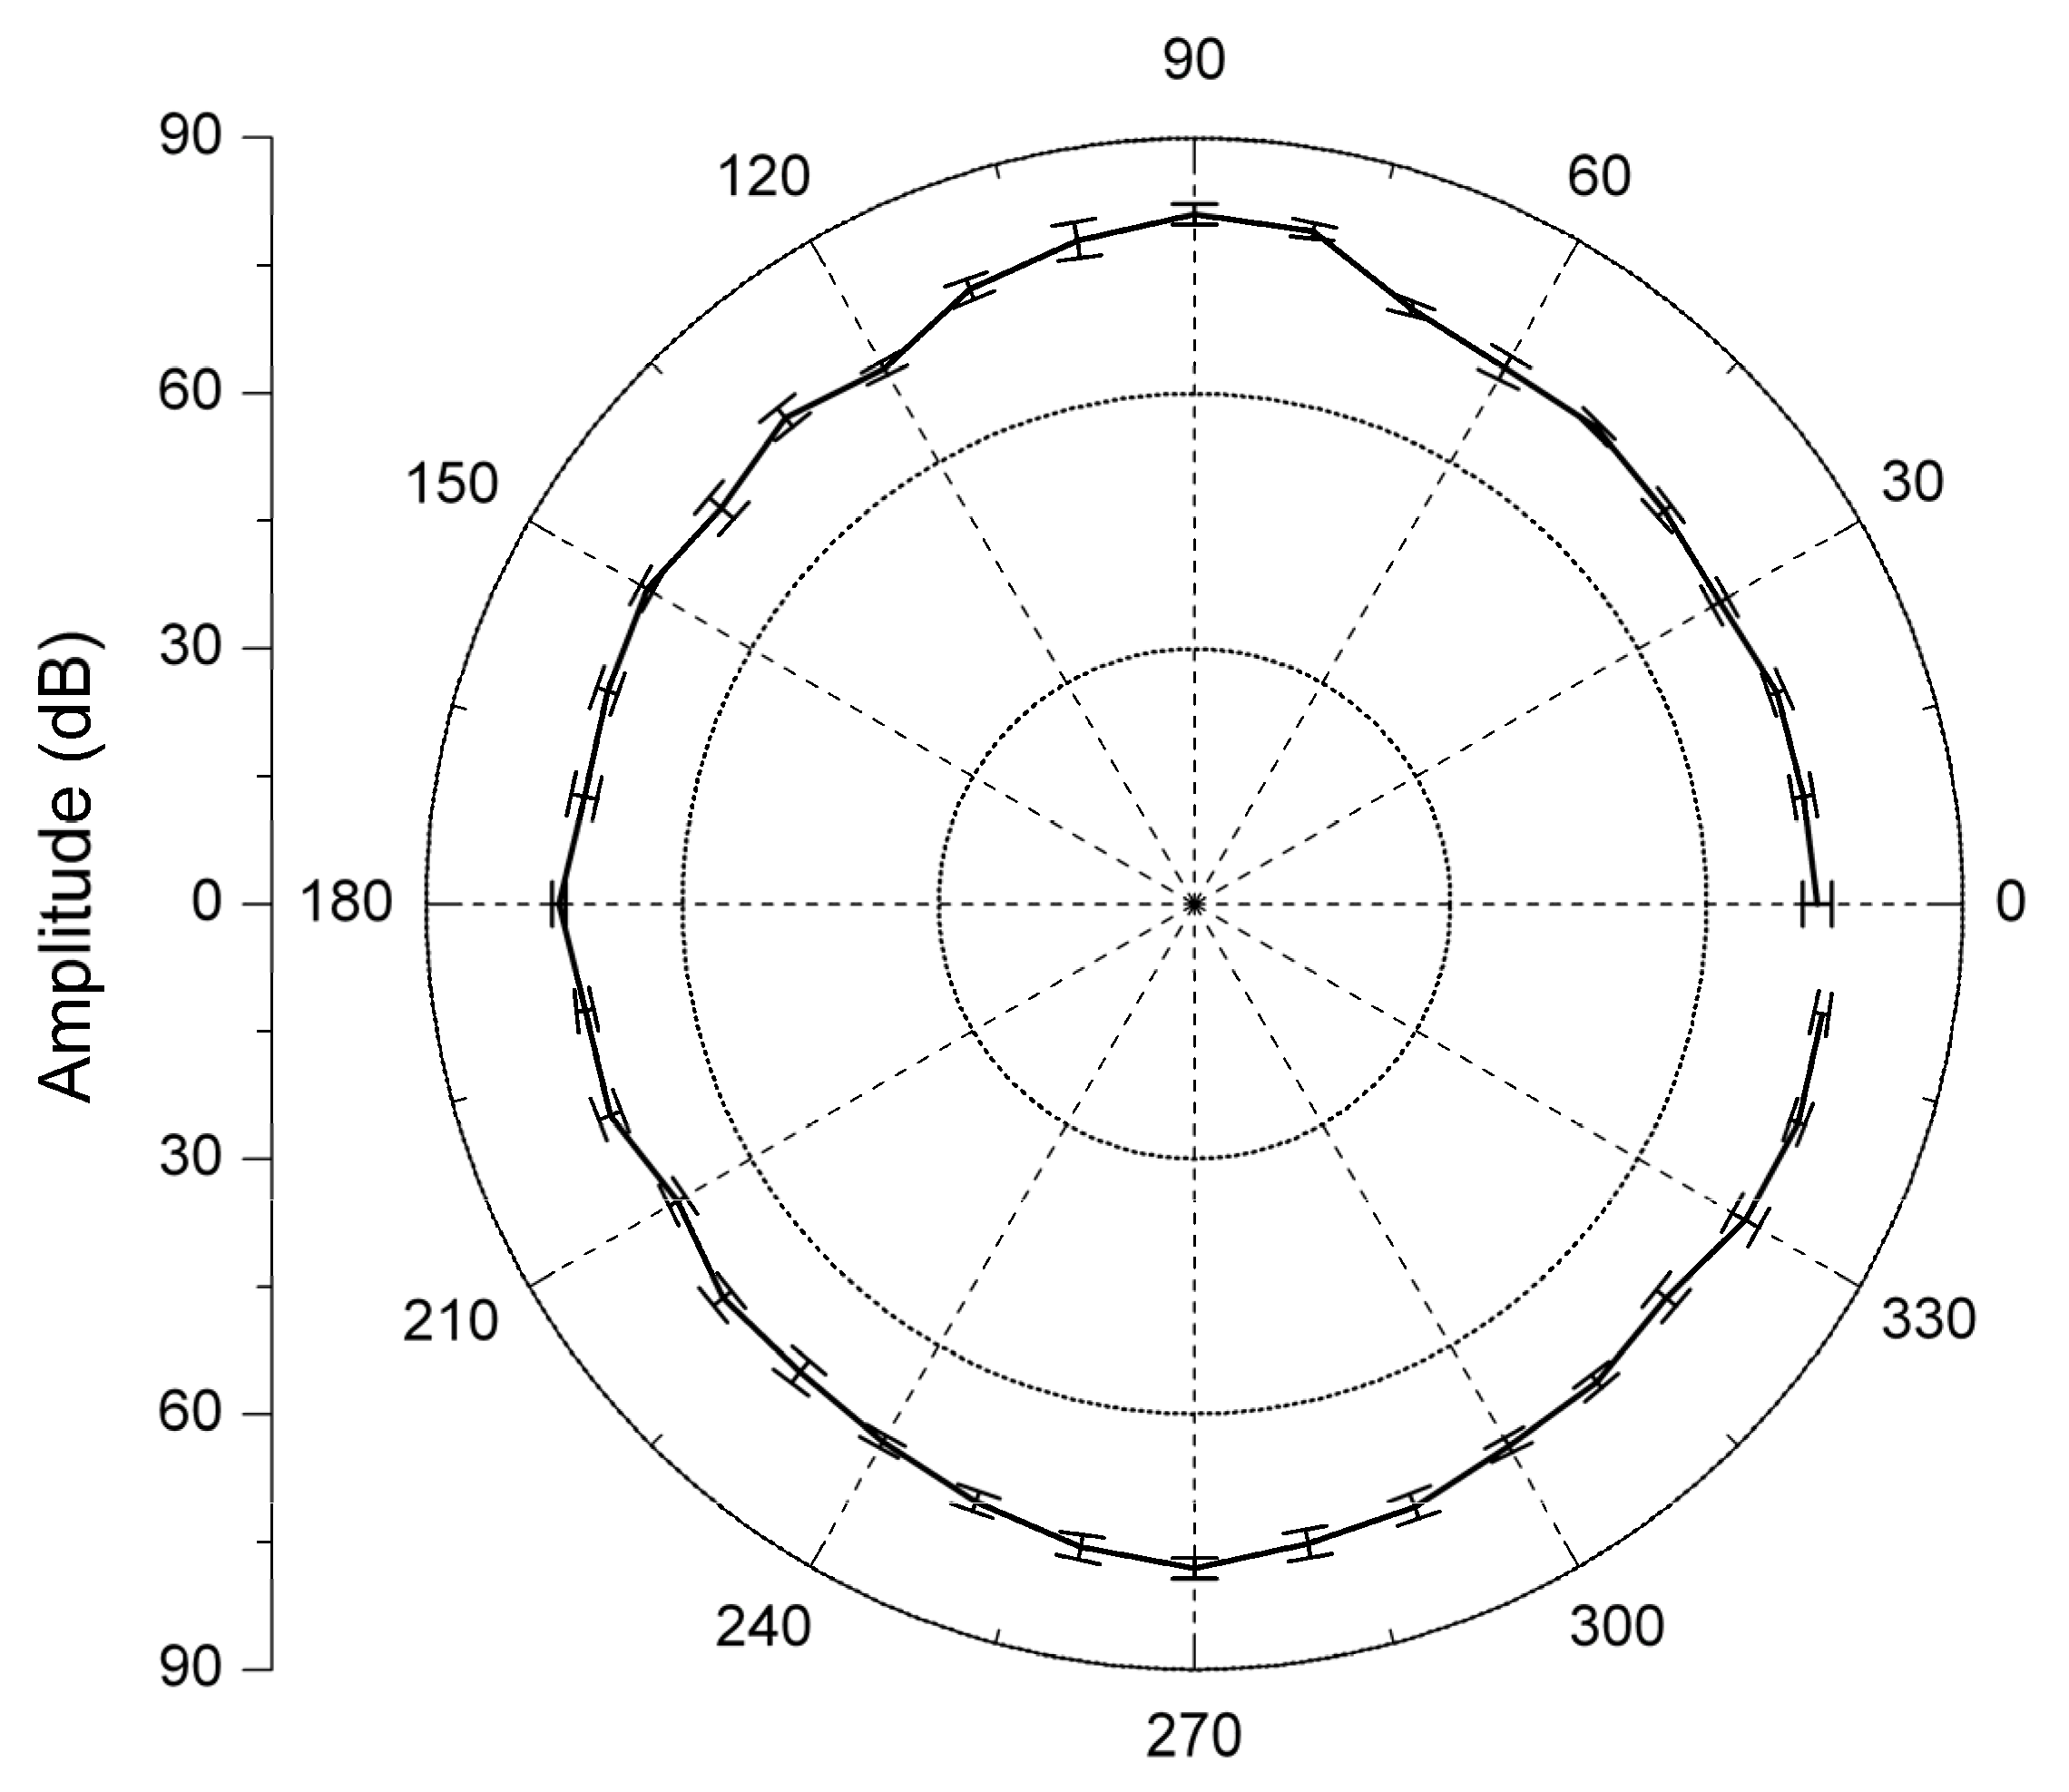
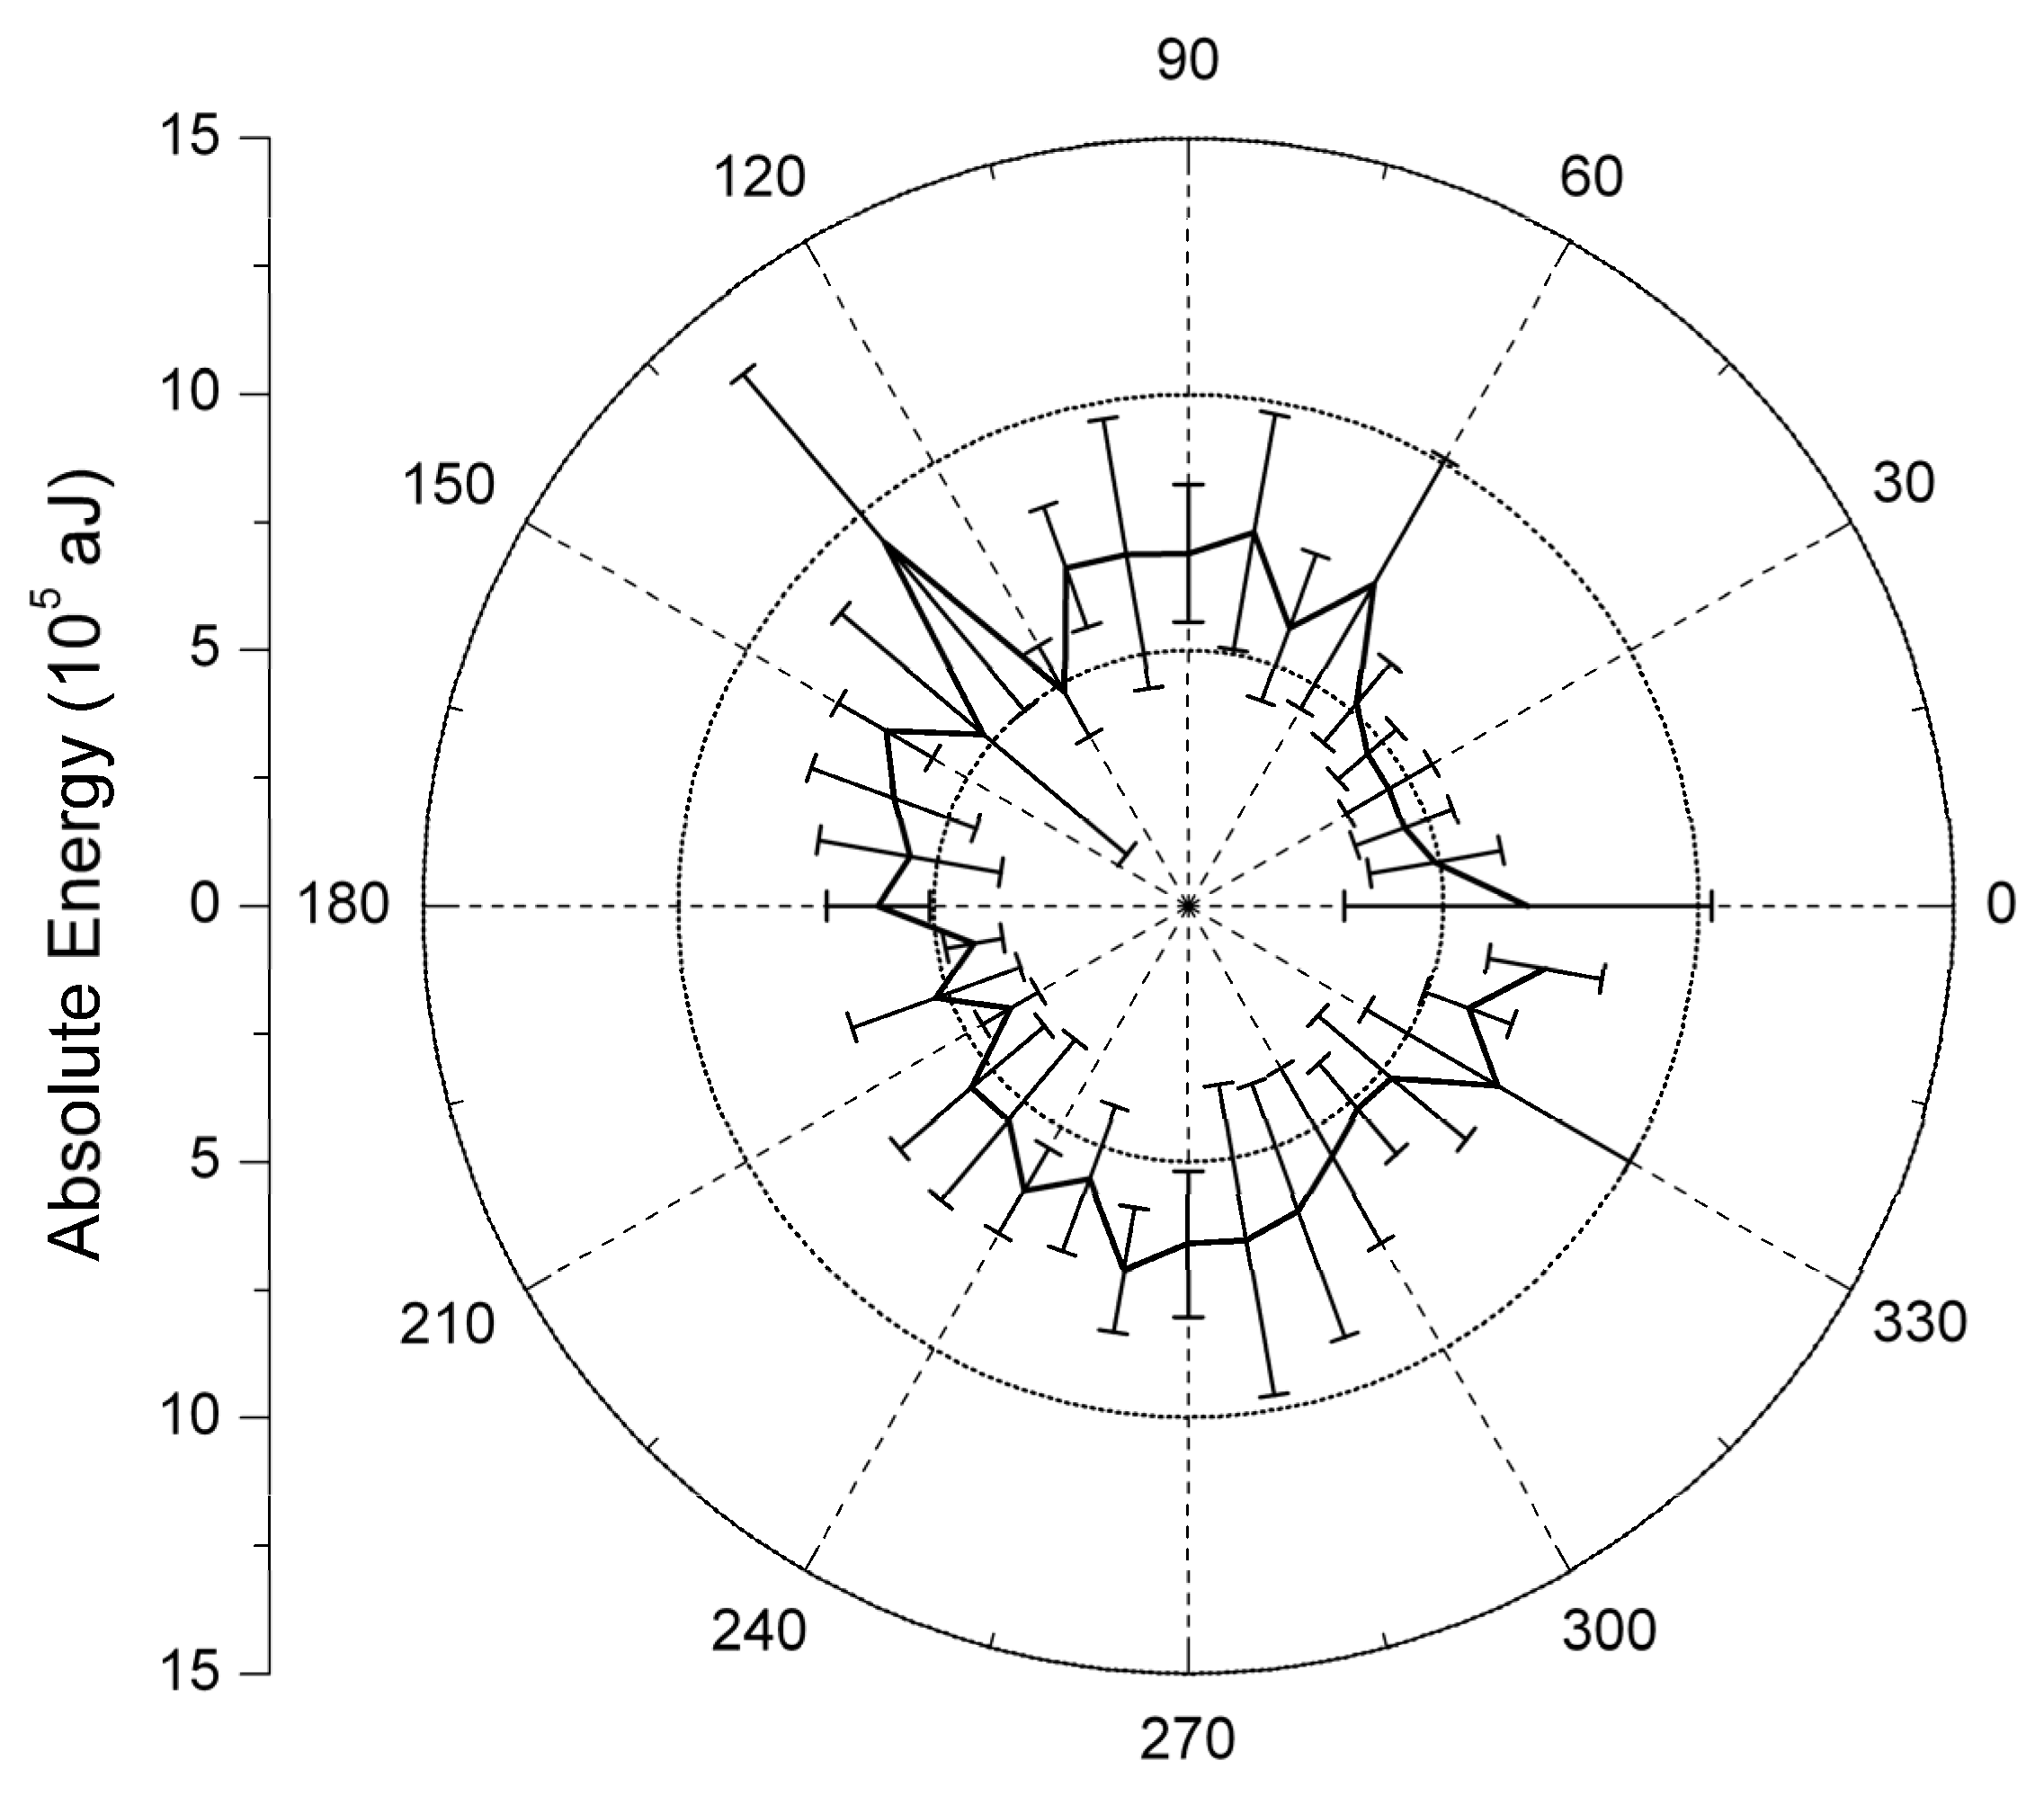
3.2. Directional sensitivity using feature data
An investigation into the directional sensitivity of an MFC transducer using signal feature data was conducted and the average values for amplitude, absolute energy and peak frequency are presented in
Figure 6,
Figure 7 and
Figure 8 respectively.
Figure 6.
Amplitude response versus direction at 50 mm from centre of transducer (piezoelectric fibres parallel to 90° direction).
Figure 6.
Amplitude response versus direction at 50 mm from centre of transducer (piezoelectric fibres parallel to 90° direction).
Figure 7.
Absolute energy versus direction at 50 mm from centre of transducer (piezoelectric fibres parallel to 90° direction).
Figure 7.
Absolute energy versus direction at 50 mm from centre of transducer (piezoelectric fibres parallel to 90° direction).
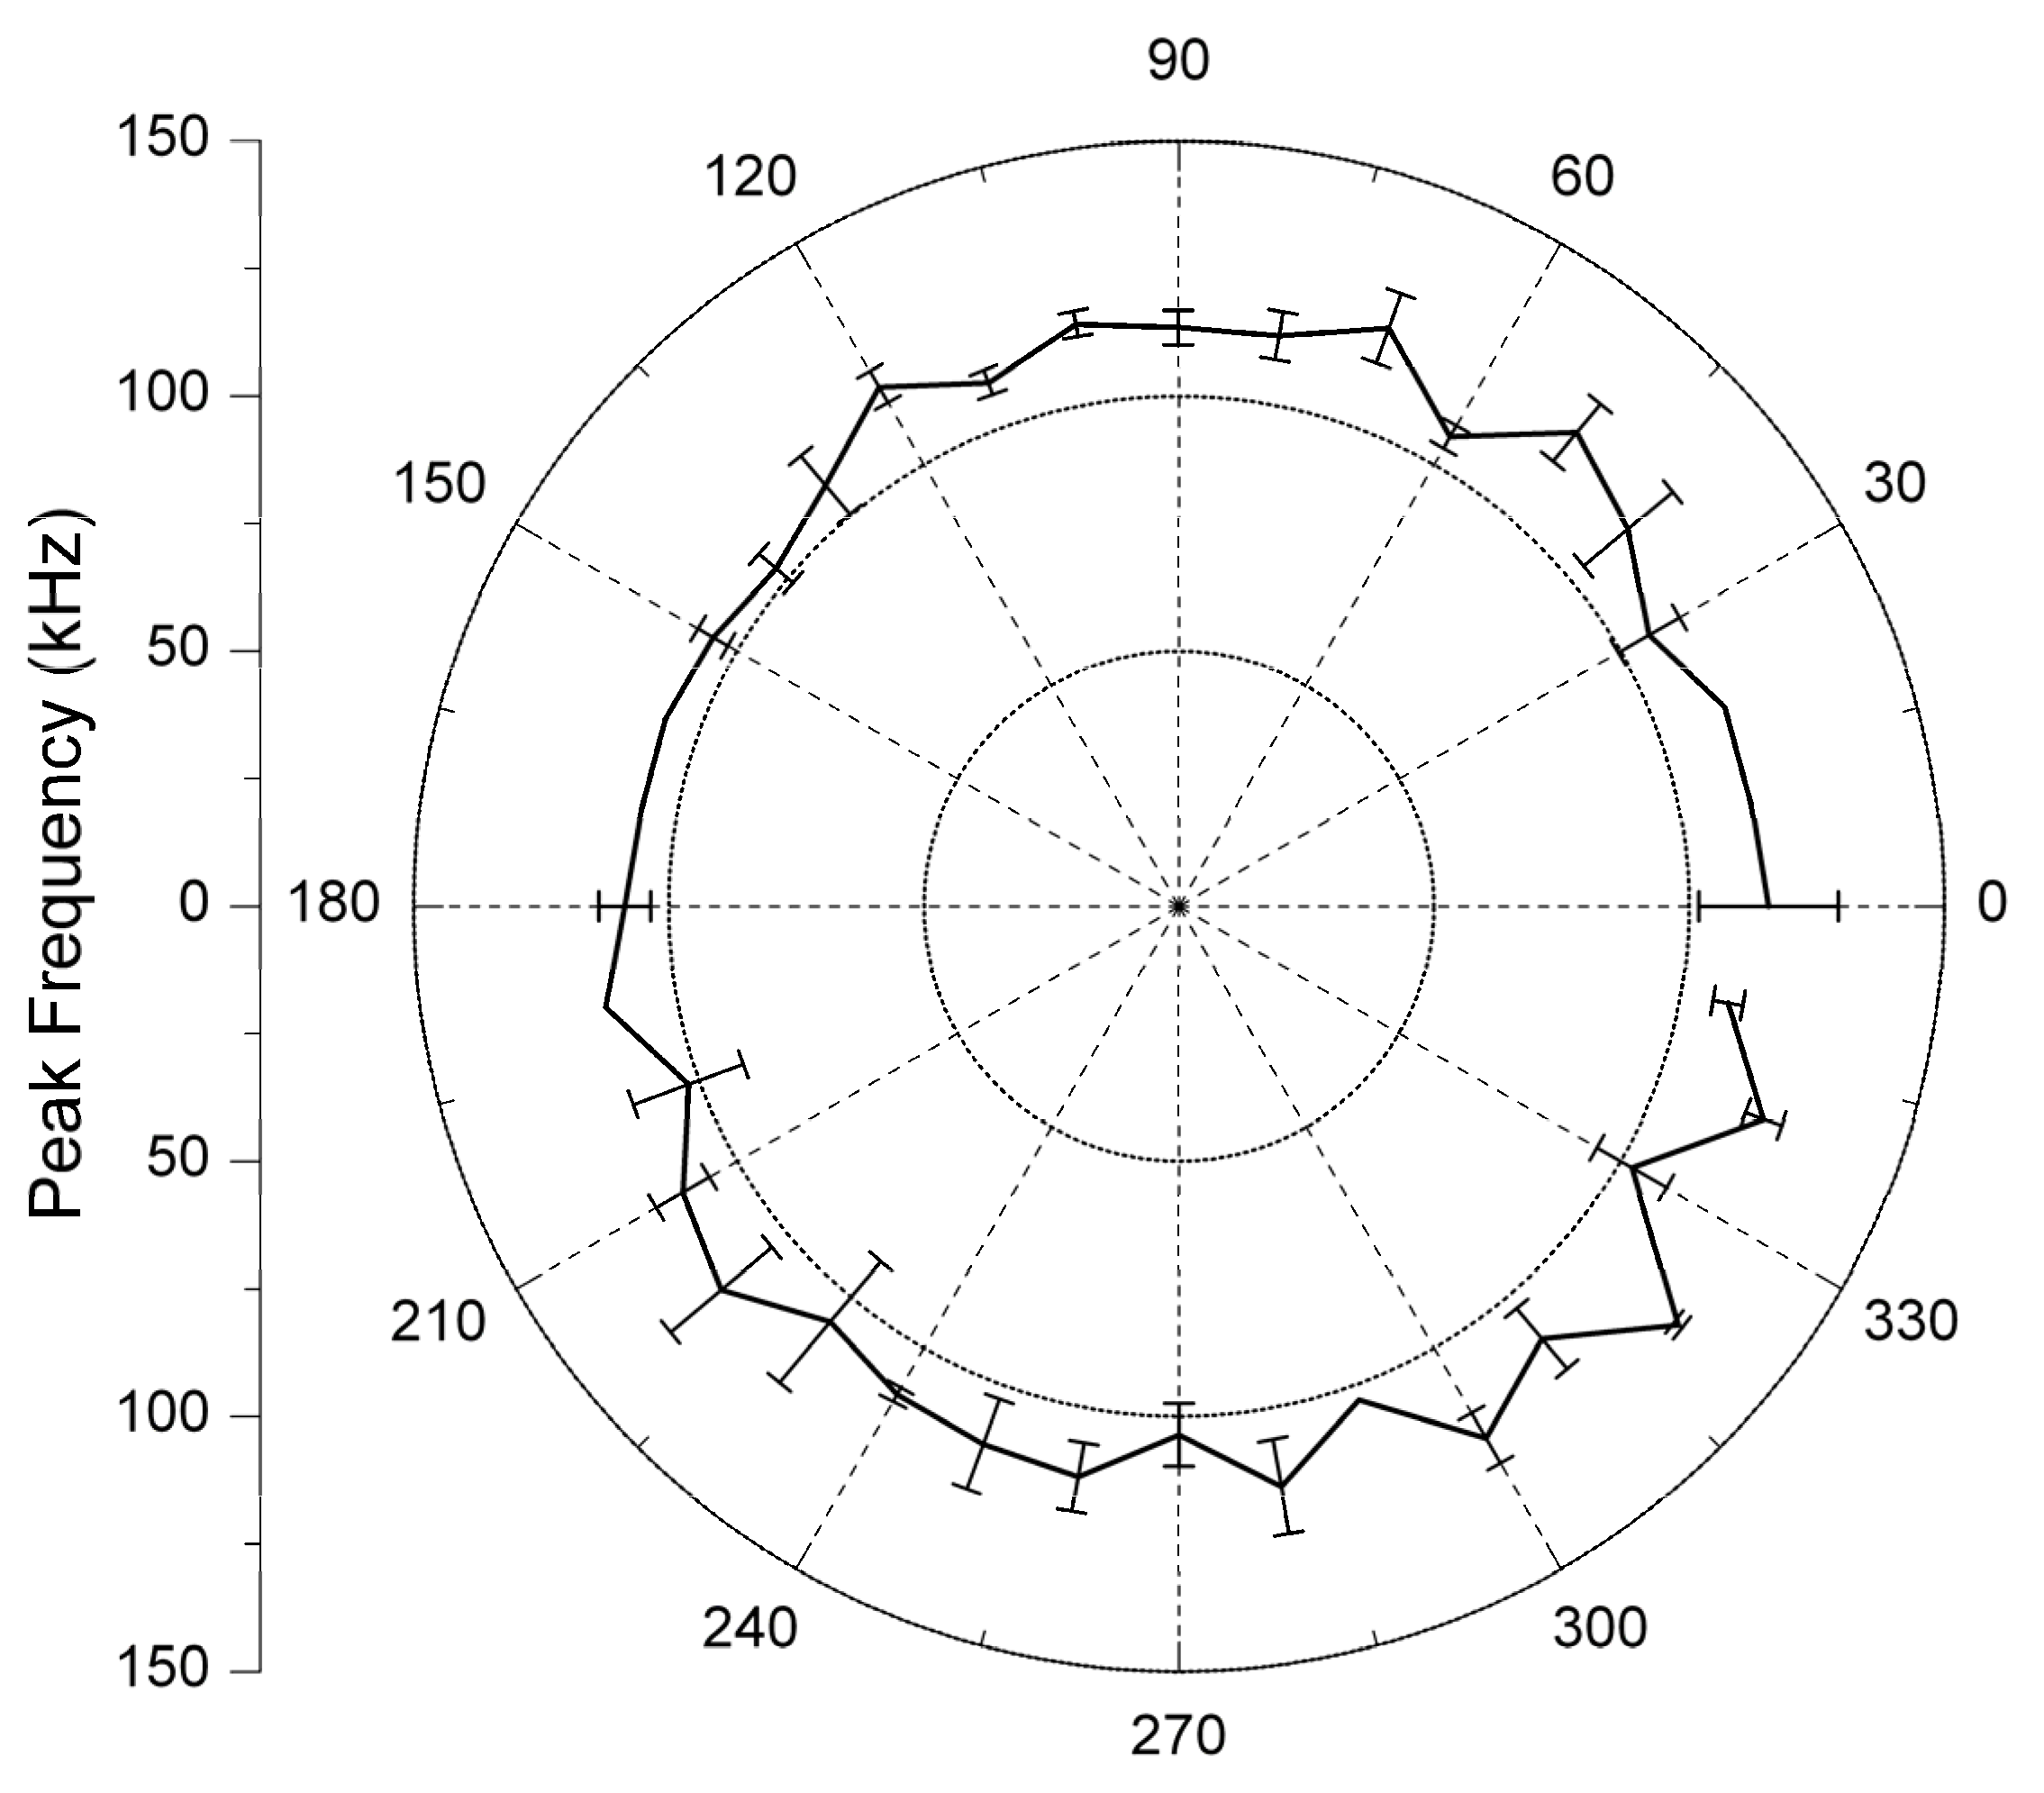
Figure 8.
Peak frequency versus direction at 50 mm from centre of transducer (piezoelectric fibres parallel to 90° direction).
Figure 8.
Peak frequency versus direction at 50 mm from centre of transducer (piezoelectric fibres parallel to 90° direction).
The amplitude response of the sensor is seen to be reasonably circular; however the response is slightly larger in the direction of the piezoelectric fibres (90° and 270°), running along the length of the sensor. Barbezat
et al. [
8] observed the same effect for AFC transducers, with greater sensitivity parallel to the piezoelectric fibre direction. It should however be noted that the amplitude scale is in dB and hence logarithmic, so small variations observed will be larger in terms of peak signal voltage. It is not known if the variation in sensitivity observed is due to the fibre orientation of the transducer or its geometry i.e. longer in the fibre direction. None the less this small variation is a promising result because it was expected that the sensor would be more sensitive to signal propagation direction. There is no overall trend for the average absolute energy and peak frequency to vary with direction, some variation is observed but it does not appear to be related to the sensor orientation. It may, however, be a function of the test plate geometry which is relatively small and therefore there is the potential for reflections to alter the signal form. This is again a promising result given the make up of the sensors and the expected level of directional sensitivity.
3.3. Directional sensitivity using cross-correlation
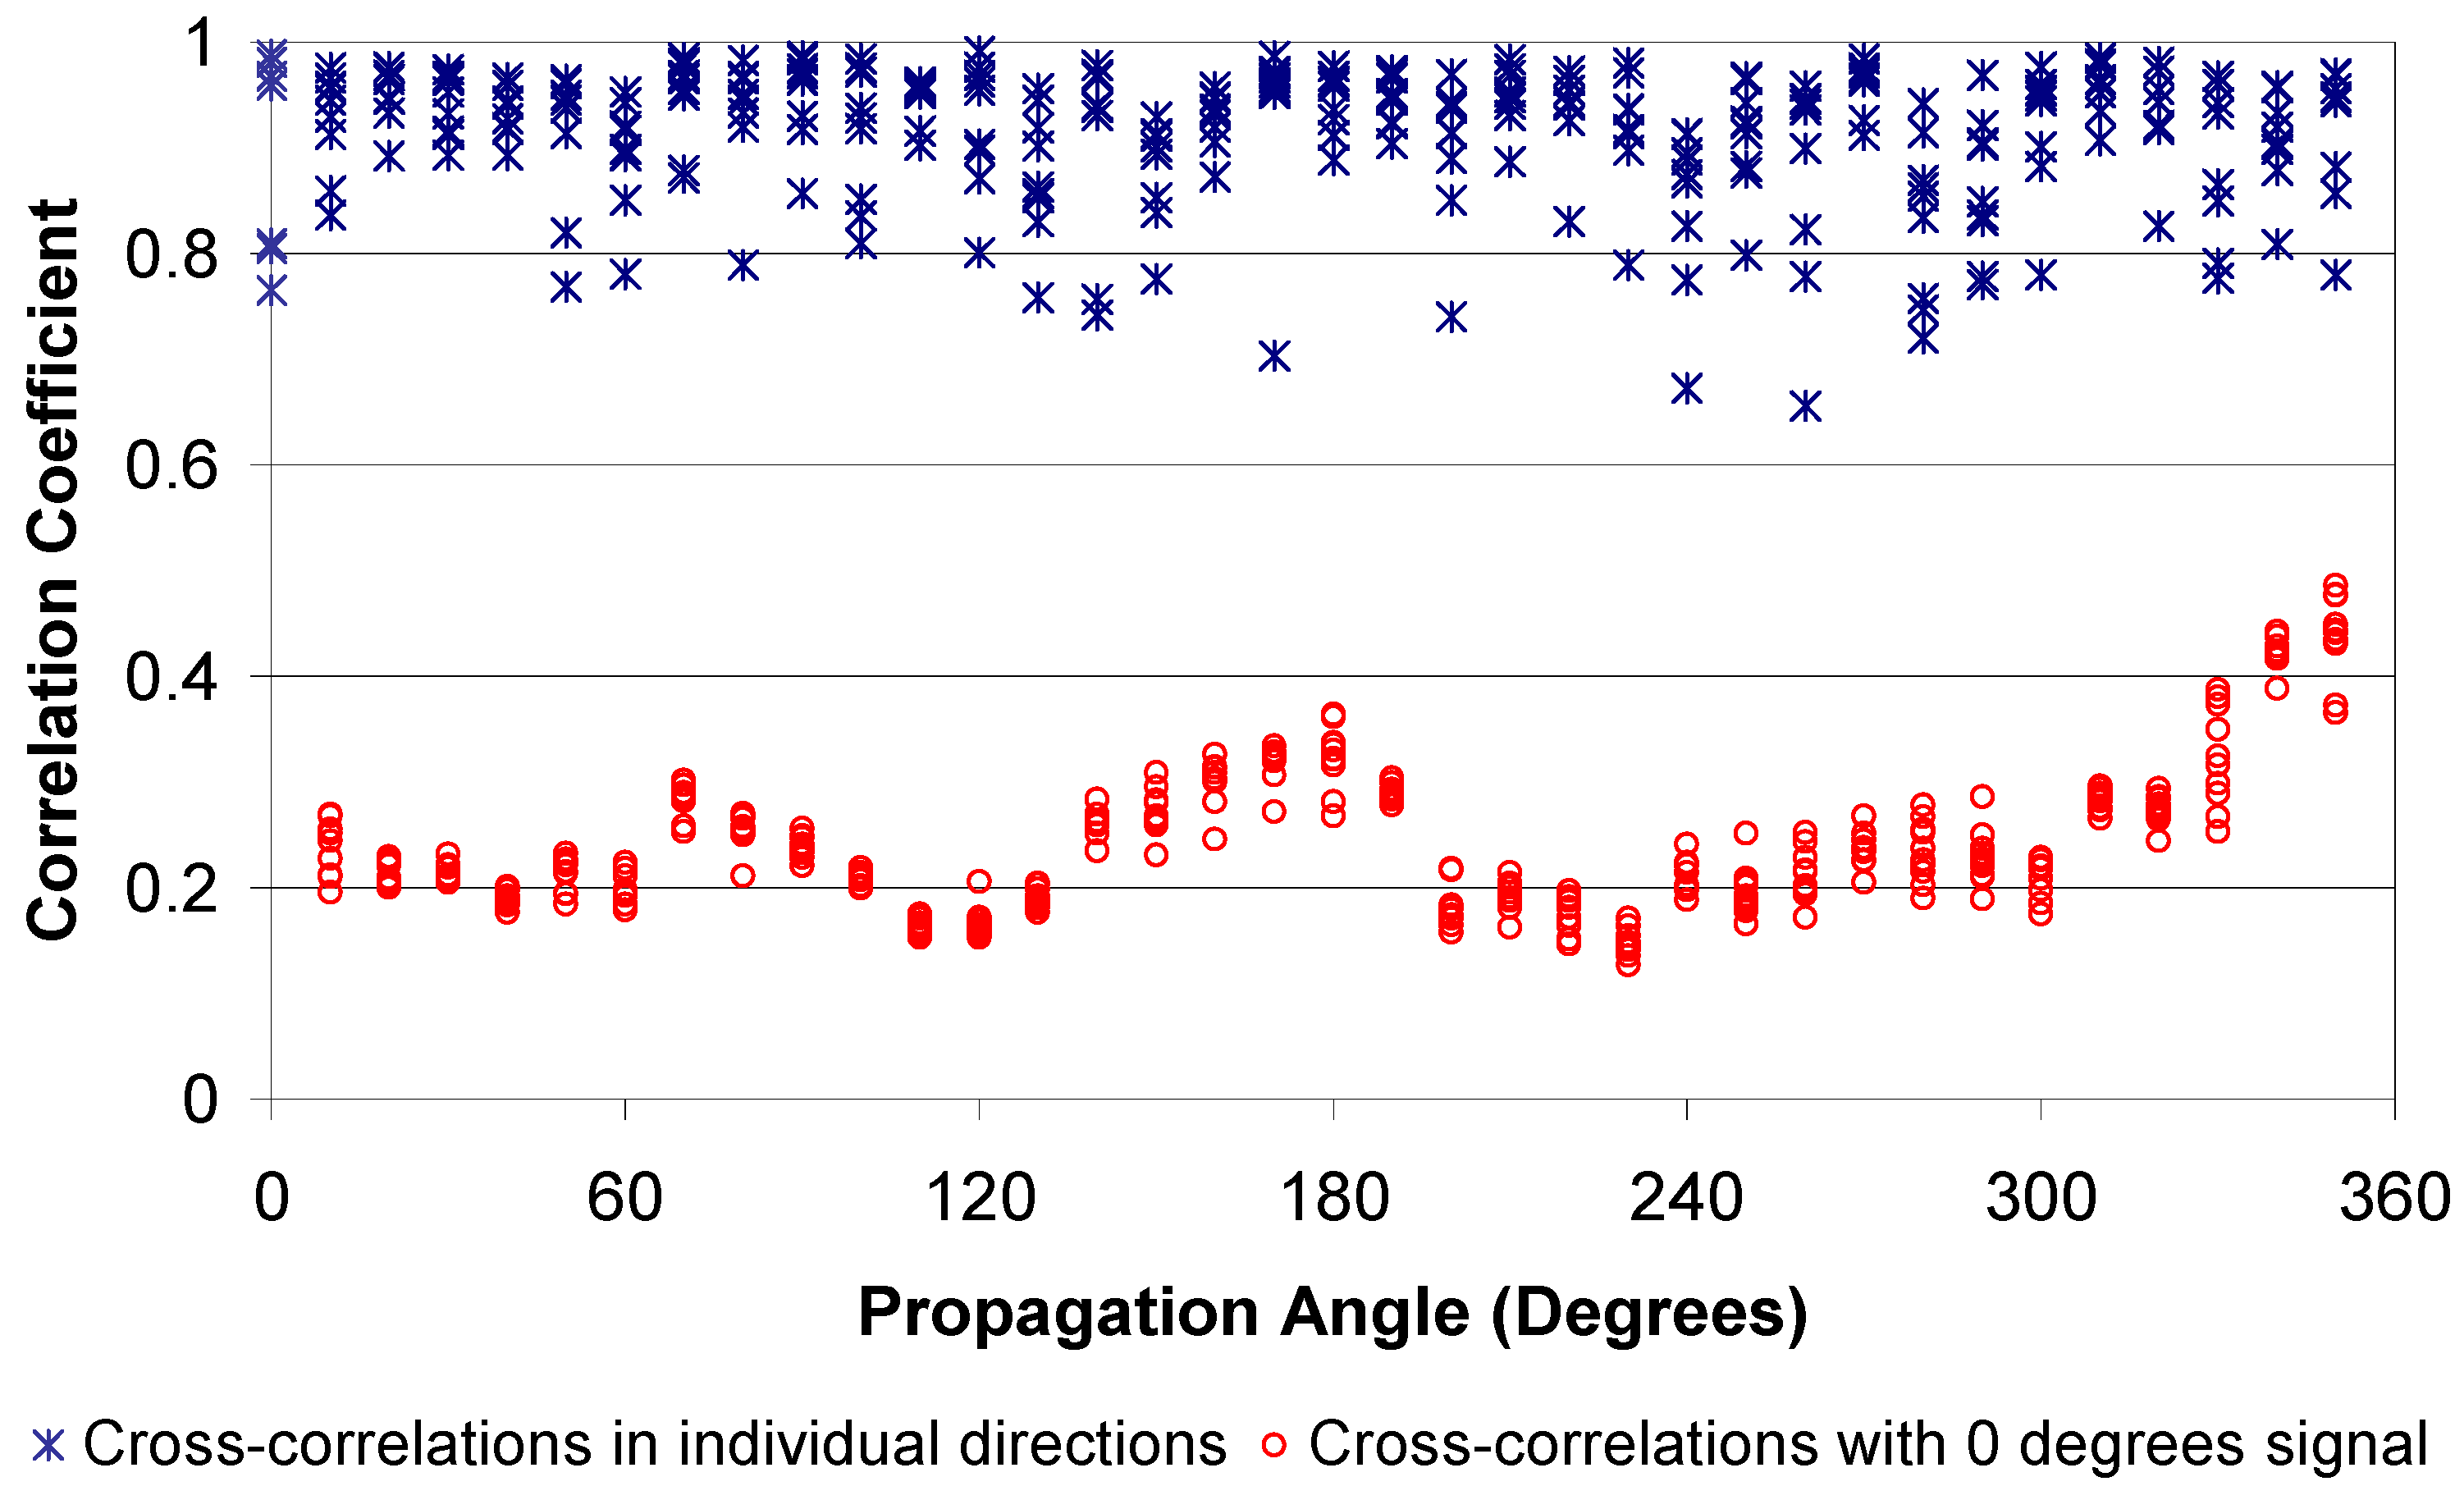
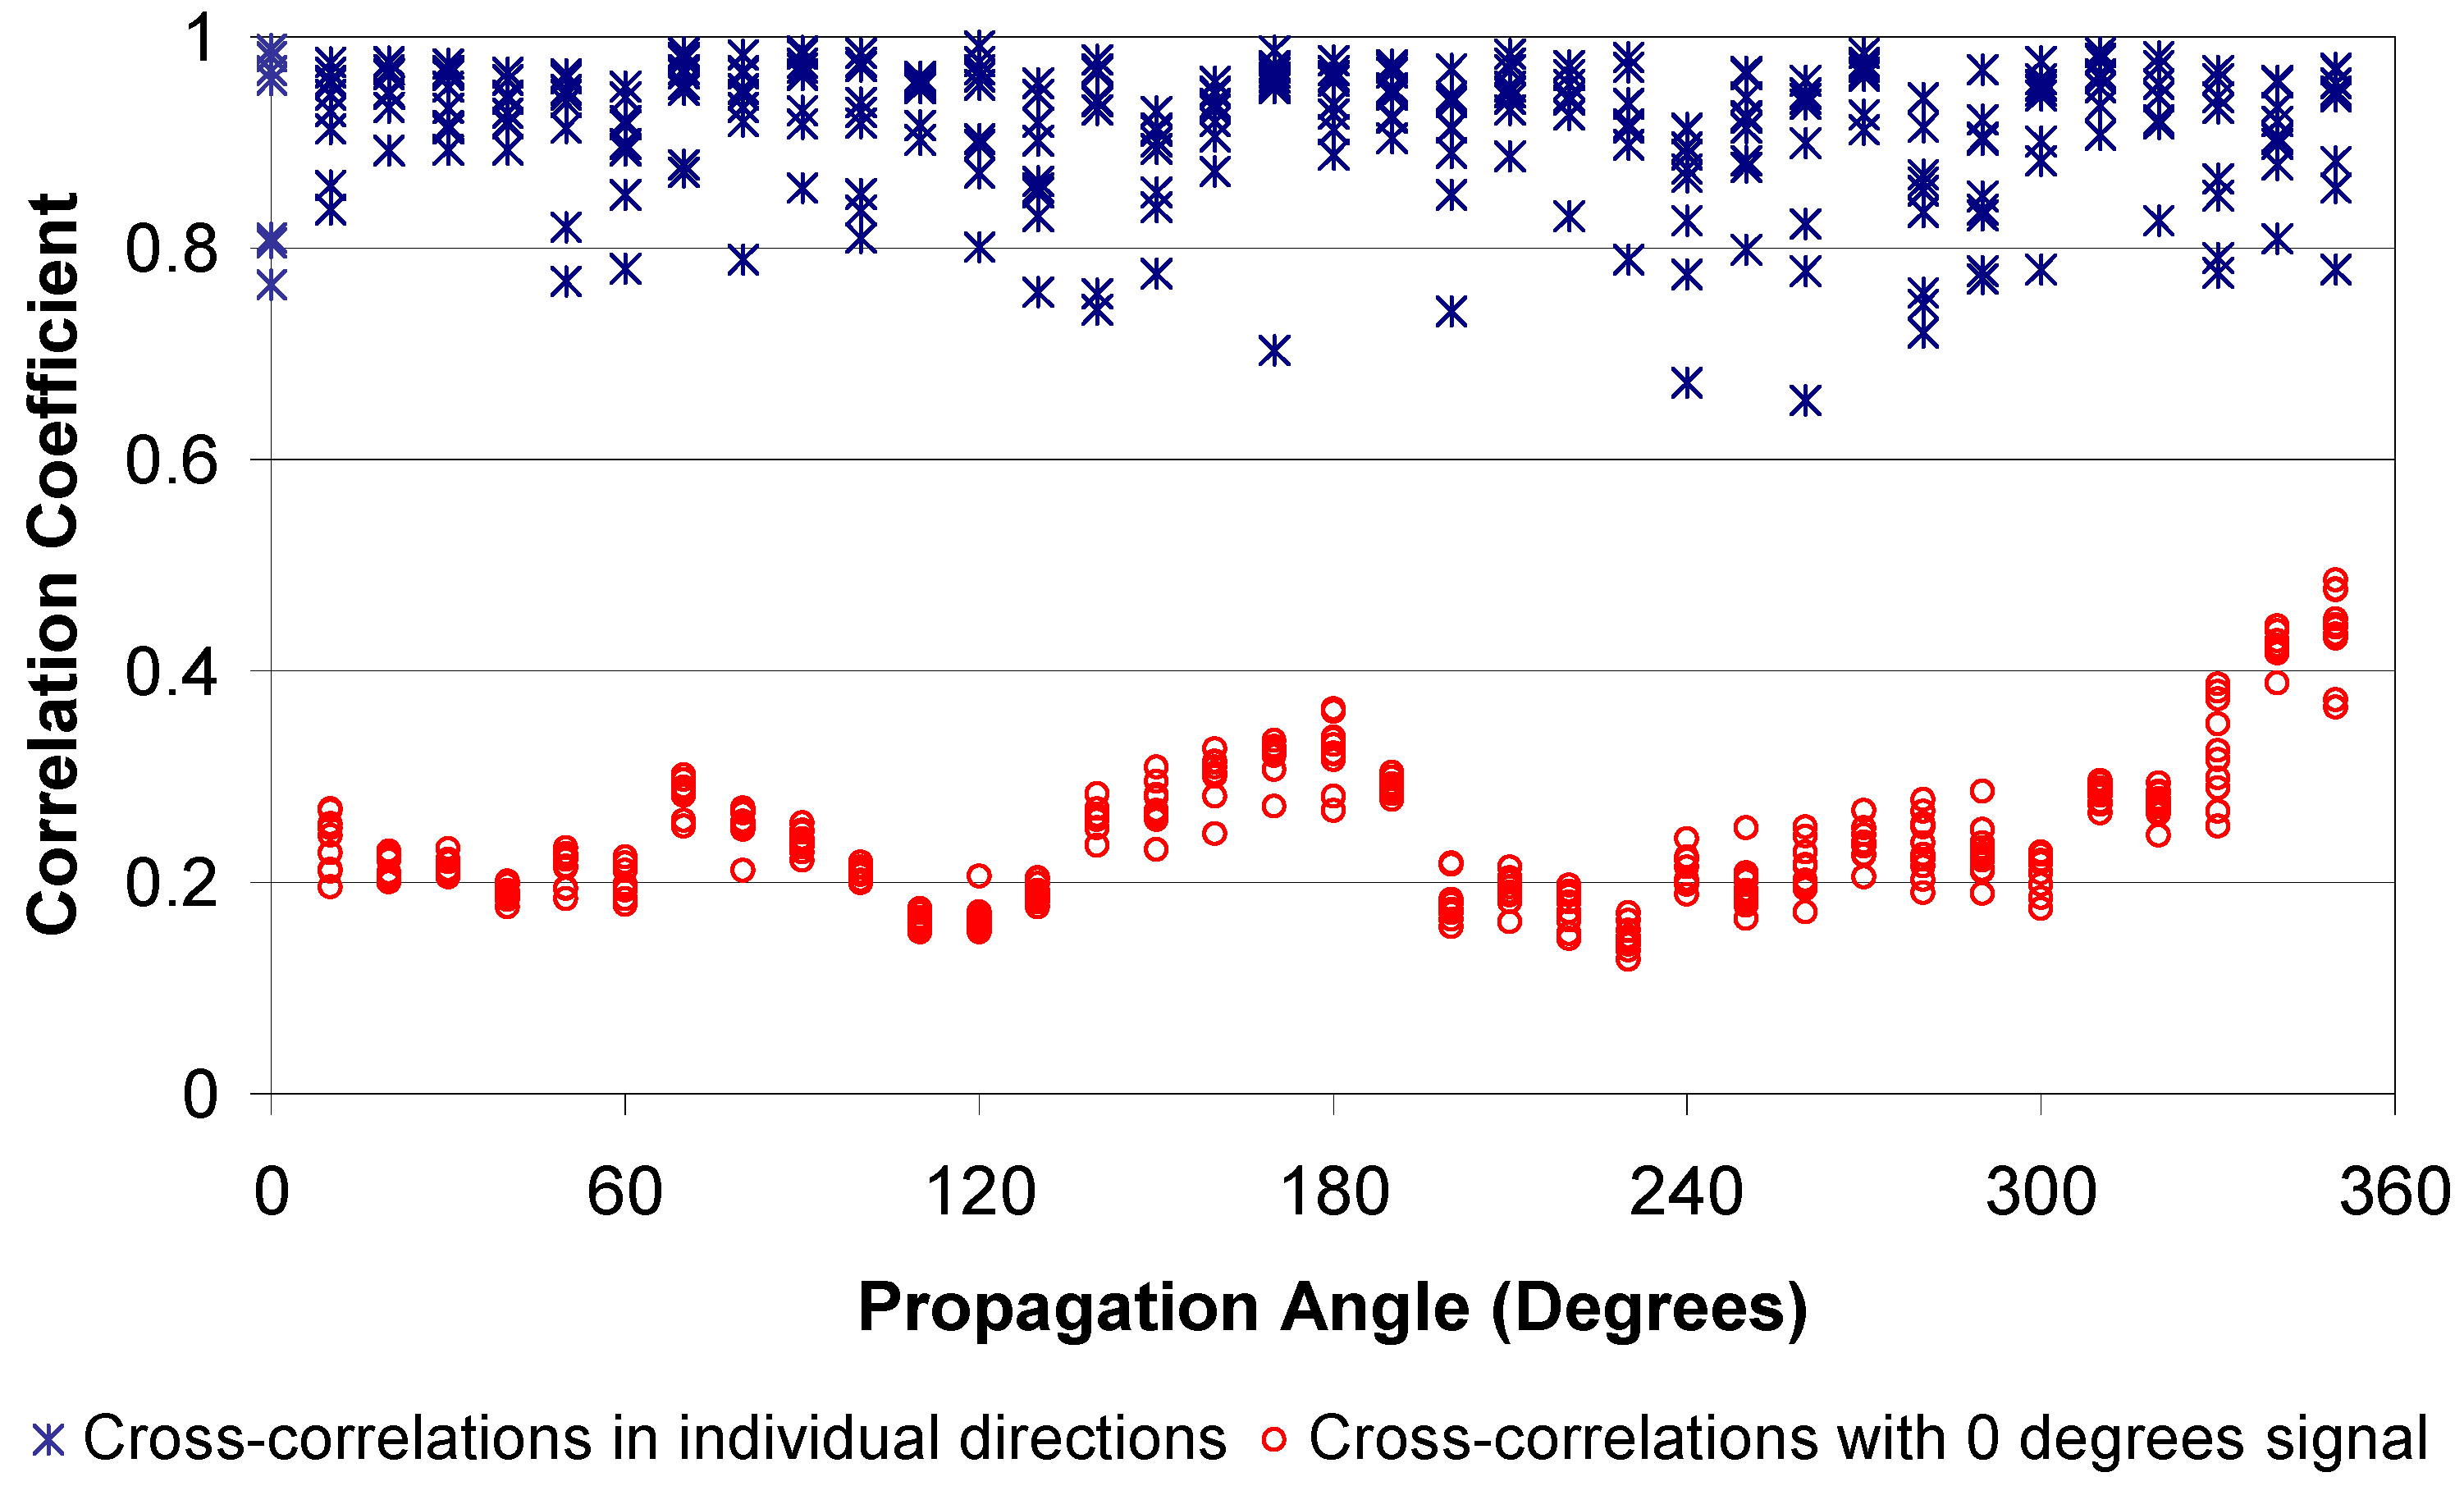
A further investigation into the directional sensitivity of the MFC transducers was conducted using cross-correlations of the recorded signals, the results of which are presented in
Figure 9. The figure presents two sets of data; in the first set (blue crosses) the first signal in each direction is used to perform the cross-correlation with the remaining signals in that direction. For the second data set (red circles) the first signal in the 0° direction was selected and used to perform cross-correlations with all other signals from all directions. The results are normalized relative to the auto-correlation of the initial signal being used for comparison; such that an identical signal will return a value of one, hence the greater the similarity of a signal to the initial selection the closer the cross-correlation coefficient will be to one.
In the first set of data (blue crosses in
Figure 9), representing the cross-correlations in individual directions, it can be seen that there is some variation in the coefficients, this is expected because the H-N source is not completely repeatable, however the majority of the coefficients are greater than 0.9 and few are seen below 0.8 suggesting that there is reasonably repeatability. Hence it can be assumed that any variation in signal with direction observed can be assumed to be a result of the sensor and not the source.
When the signals from all directions are compared with a signal from the 0° direction (red circles in
Figure 9) it can be seen that as soon as the propagation direction deviates from 0/360° (perpendicular to the piezoceramic fibres) the similarity in signals drops drastically with few coefficients seen above 0.4 and the majority below 0.3. There is variation in the coefficients seen from direction to direction with peaks in correlation coefficients occurring at approximately 90°, 180° and 270°, which may result from the non-uniform make up of the sensor or could be the result of reflections from the plate edges, because reflection paths will change as the source is moved. It should also be noted that although the signals from different directions have a similar level of correlation (or lack of) with the signal from 0°, it does not indicate any similarity between them. The most surprising result is the lack of similarity observed between signals from the 0° and 180° directions, given the nominal symmetry of the sensor construction along the 90° – 270° line.
Figure 9.
Cross-correlation coefficients.
Figure 9.
Cross-correlation coefficients.
3.4. Attenuation
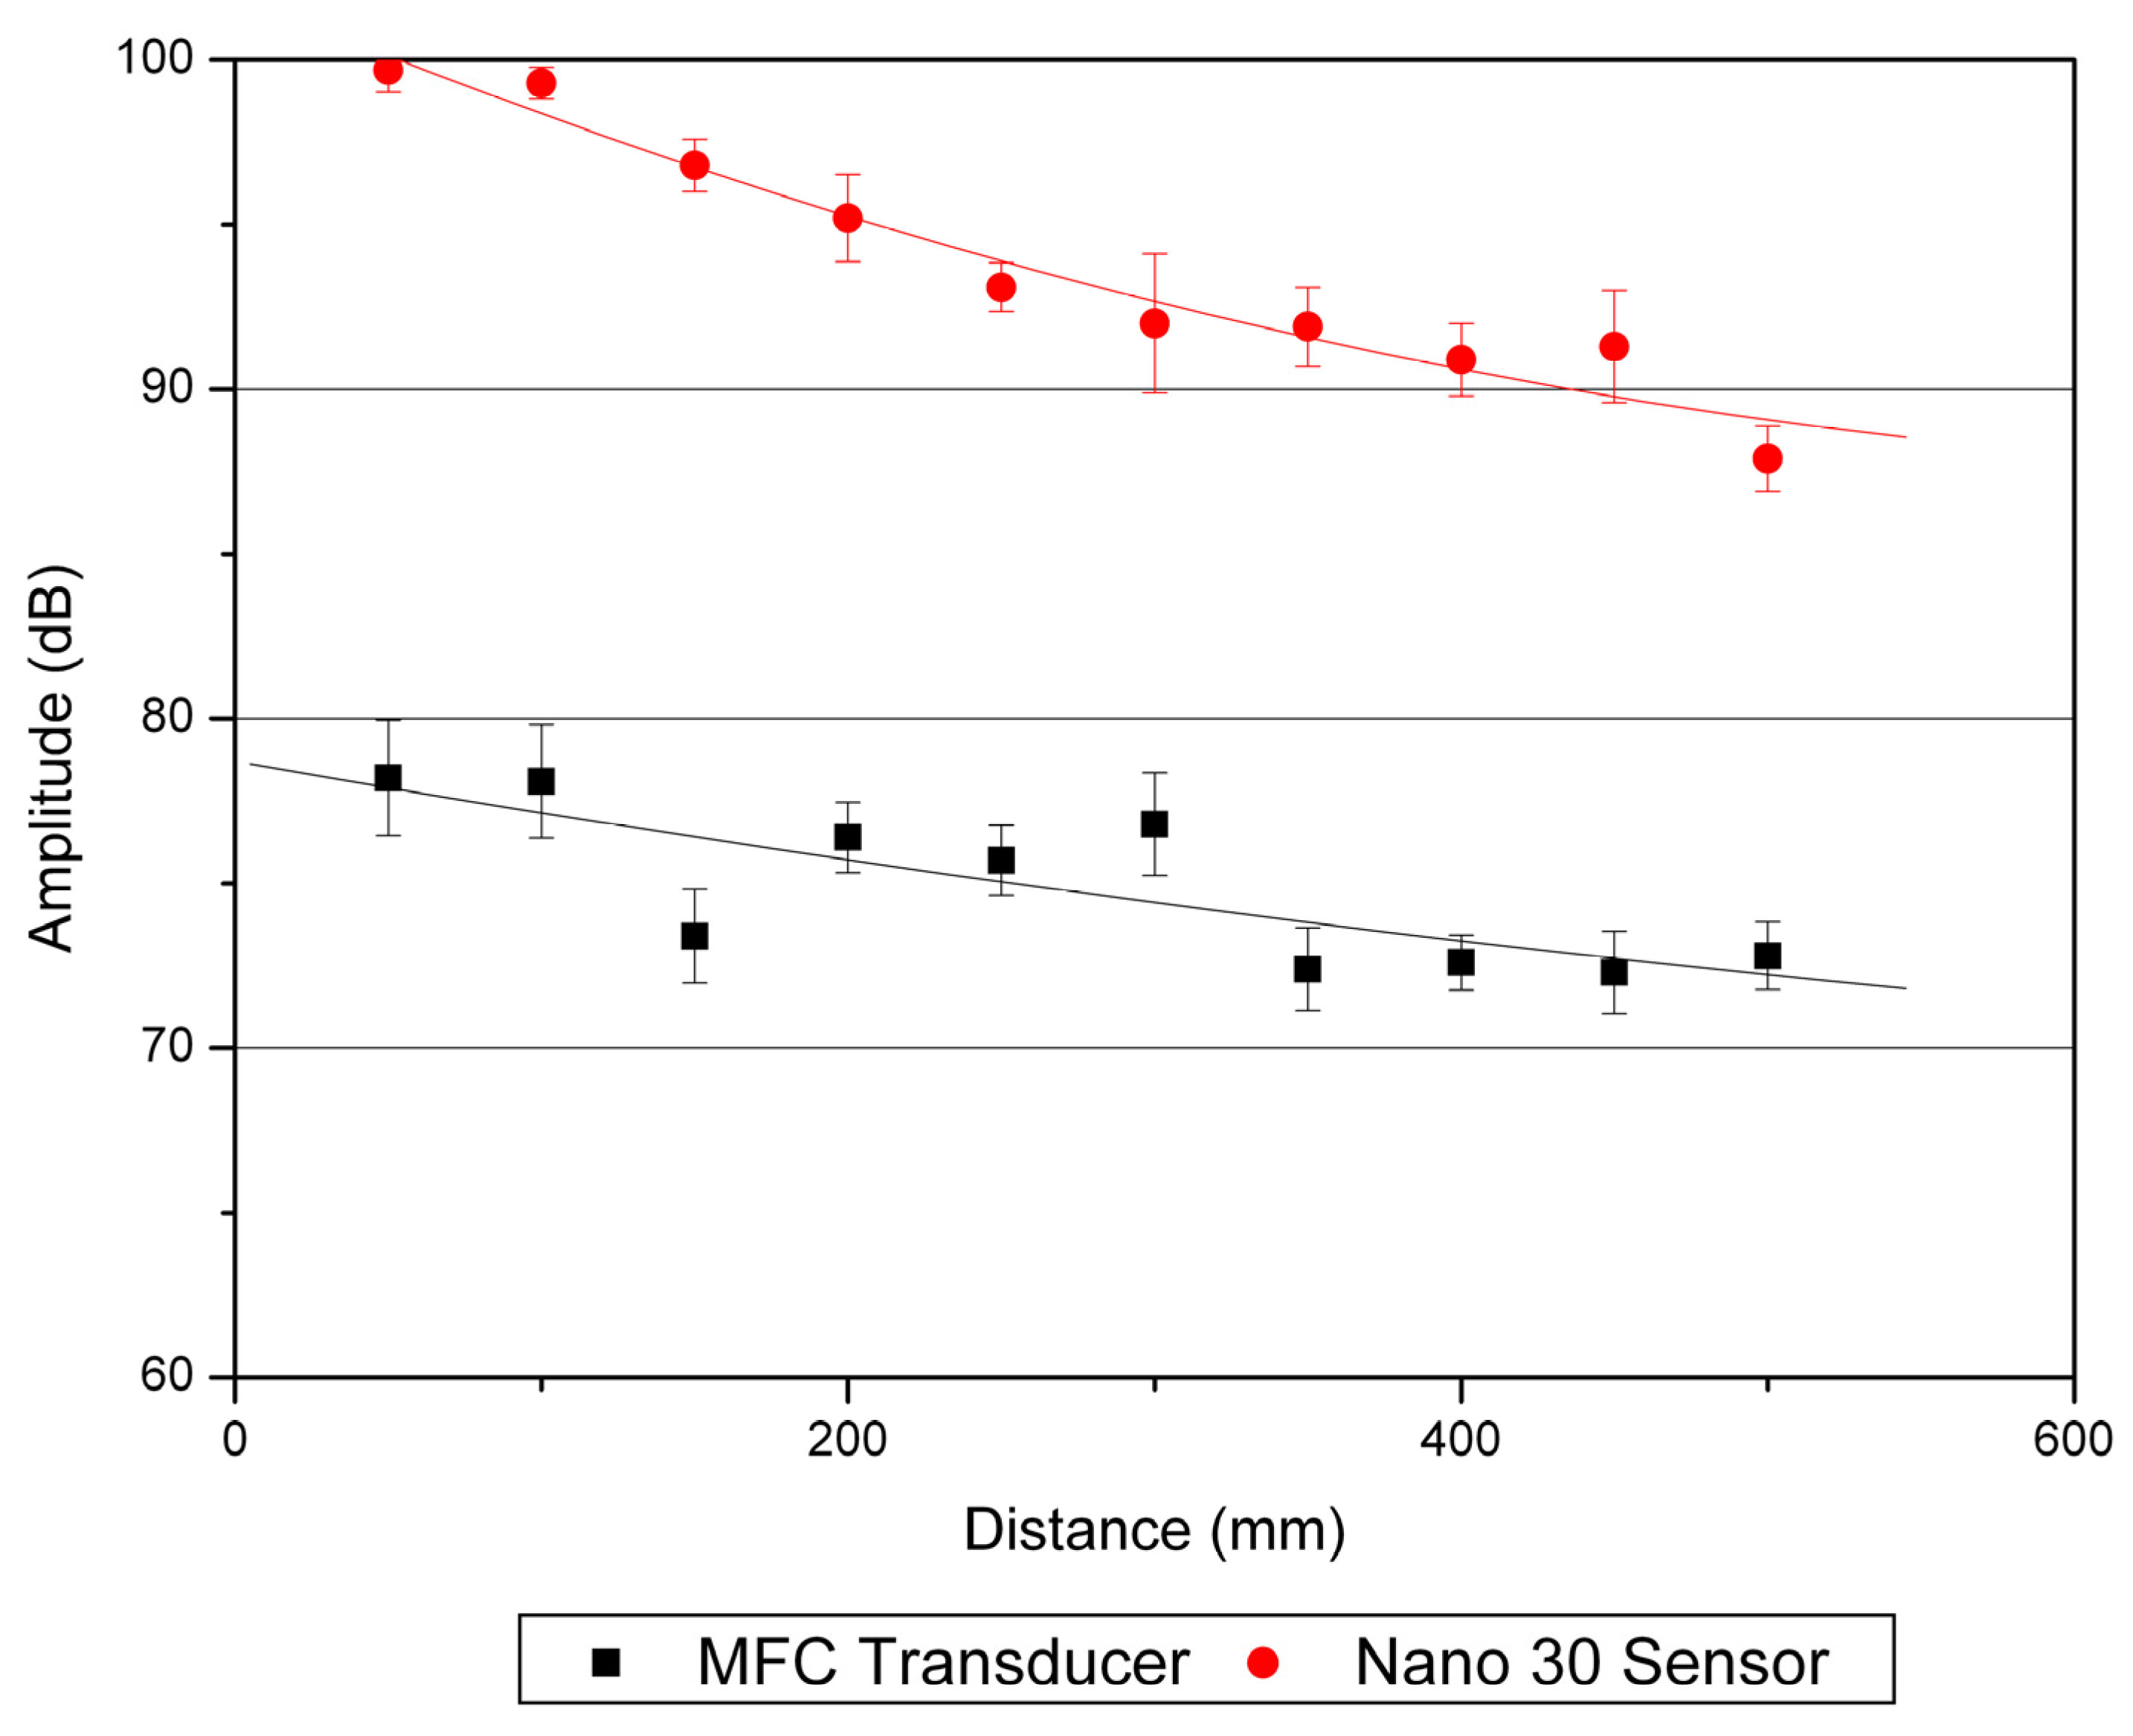
The results from the attenuation study are presented in
Figure 10 and a second order polynomial curve is fitted to both sets of data. It is clear that the MFC sensor is less sensitive than the commercially available PAL Nano 30 sensor used for comparison. The rate at which the signal recorded by the MFC sensor attenuates is less in the near field than that recorded by the Nano 30. In the far field the rates of attenuation become very similar. Obviously the amplitude of the propagating signal is not changed by the use of a different sensor, it is the measurement of the signal that is different. It is most likely that the MFC sensor is more sensitive to the lower frequency components of the signal that decay less with distance than higher frequencies.
For a H-N source to decay below threshold level (35 dB for the MFC transducer) in the aluminium test plate would take over 3 m. Although a monitoring system would be much more effective at distinguishing damage signals from background noise with a smaller minimum sensor spacing and in practice it is likely that a higher threshold than 35 dB would be necessary to eliminate background noise. If the MFC transducers were to be used on composite materials the minimum sensor spacing would need to reduce further because of the high attenuation levels experienced in composites.
Figure 10.
Signal attenuation versus distance for the MFC and Nano 30 sensors.
Figure 10.
Signal attenuation versus distance for the MFC and Nano 30 sensors.
3.5. Strip Buckling Tests
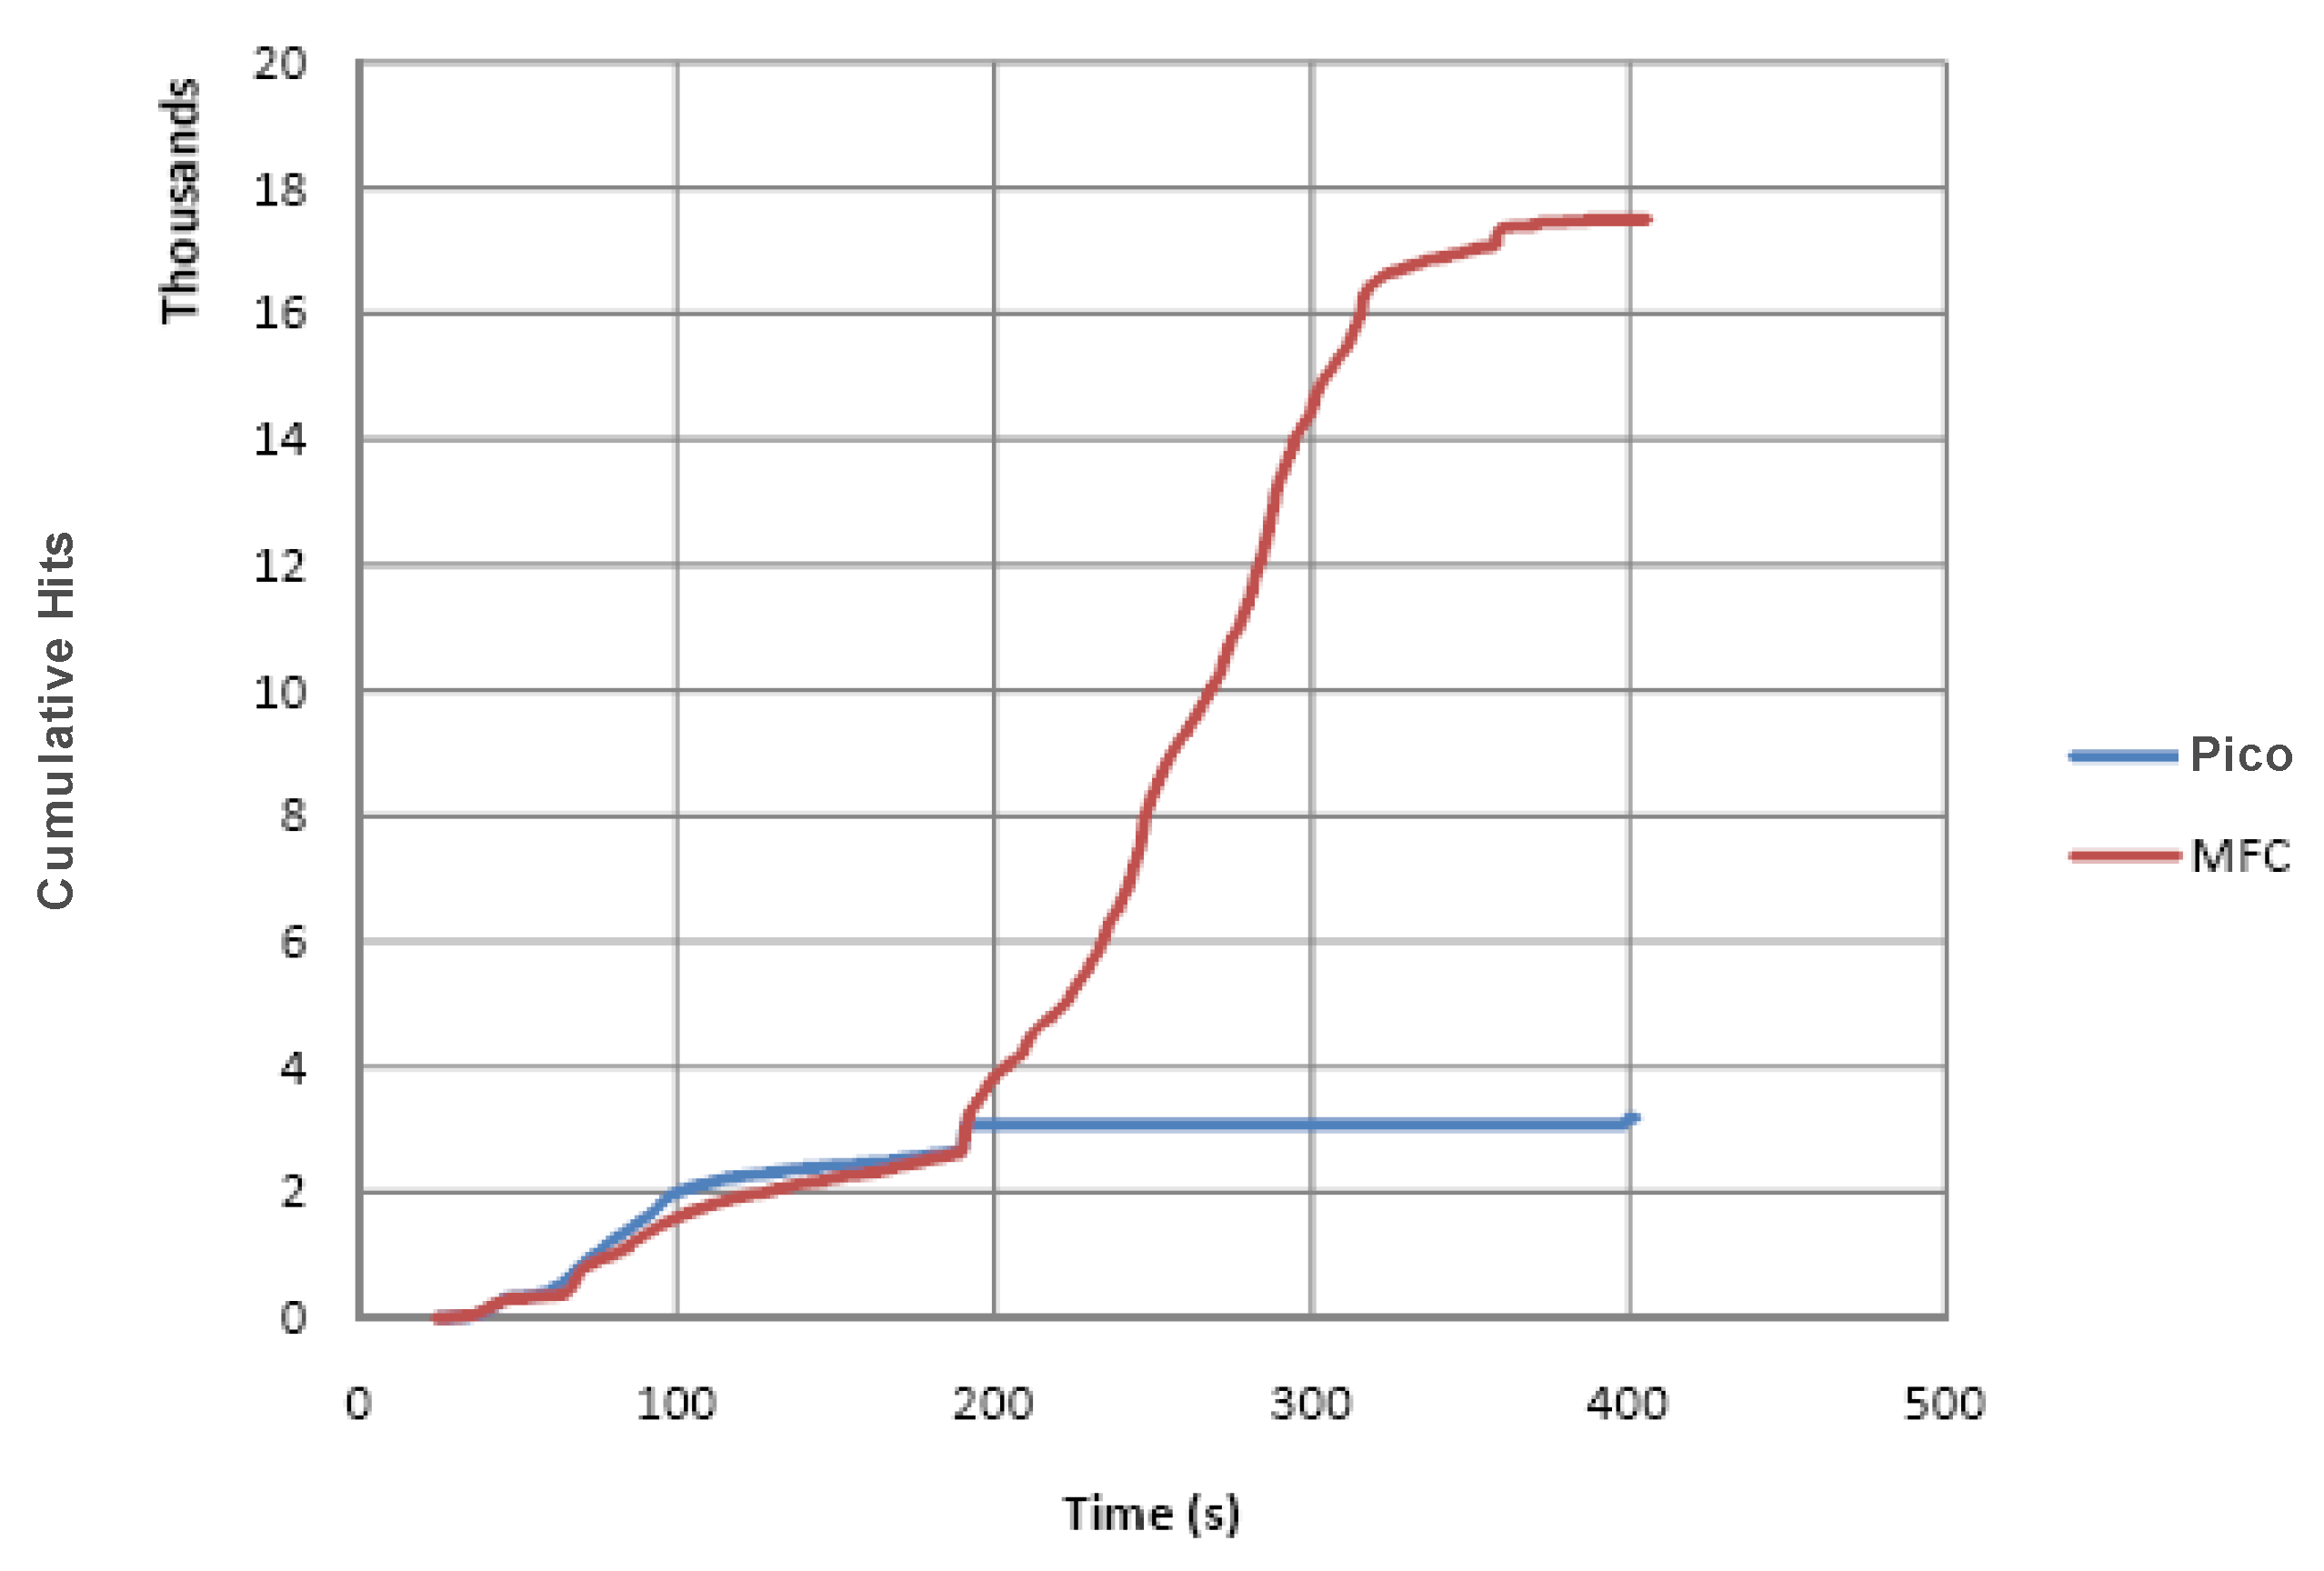
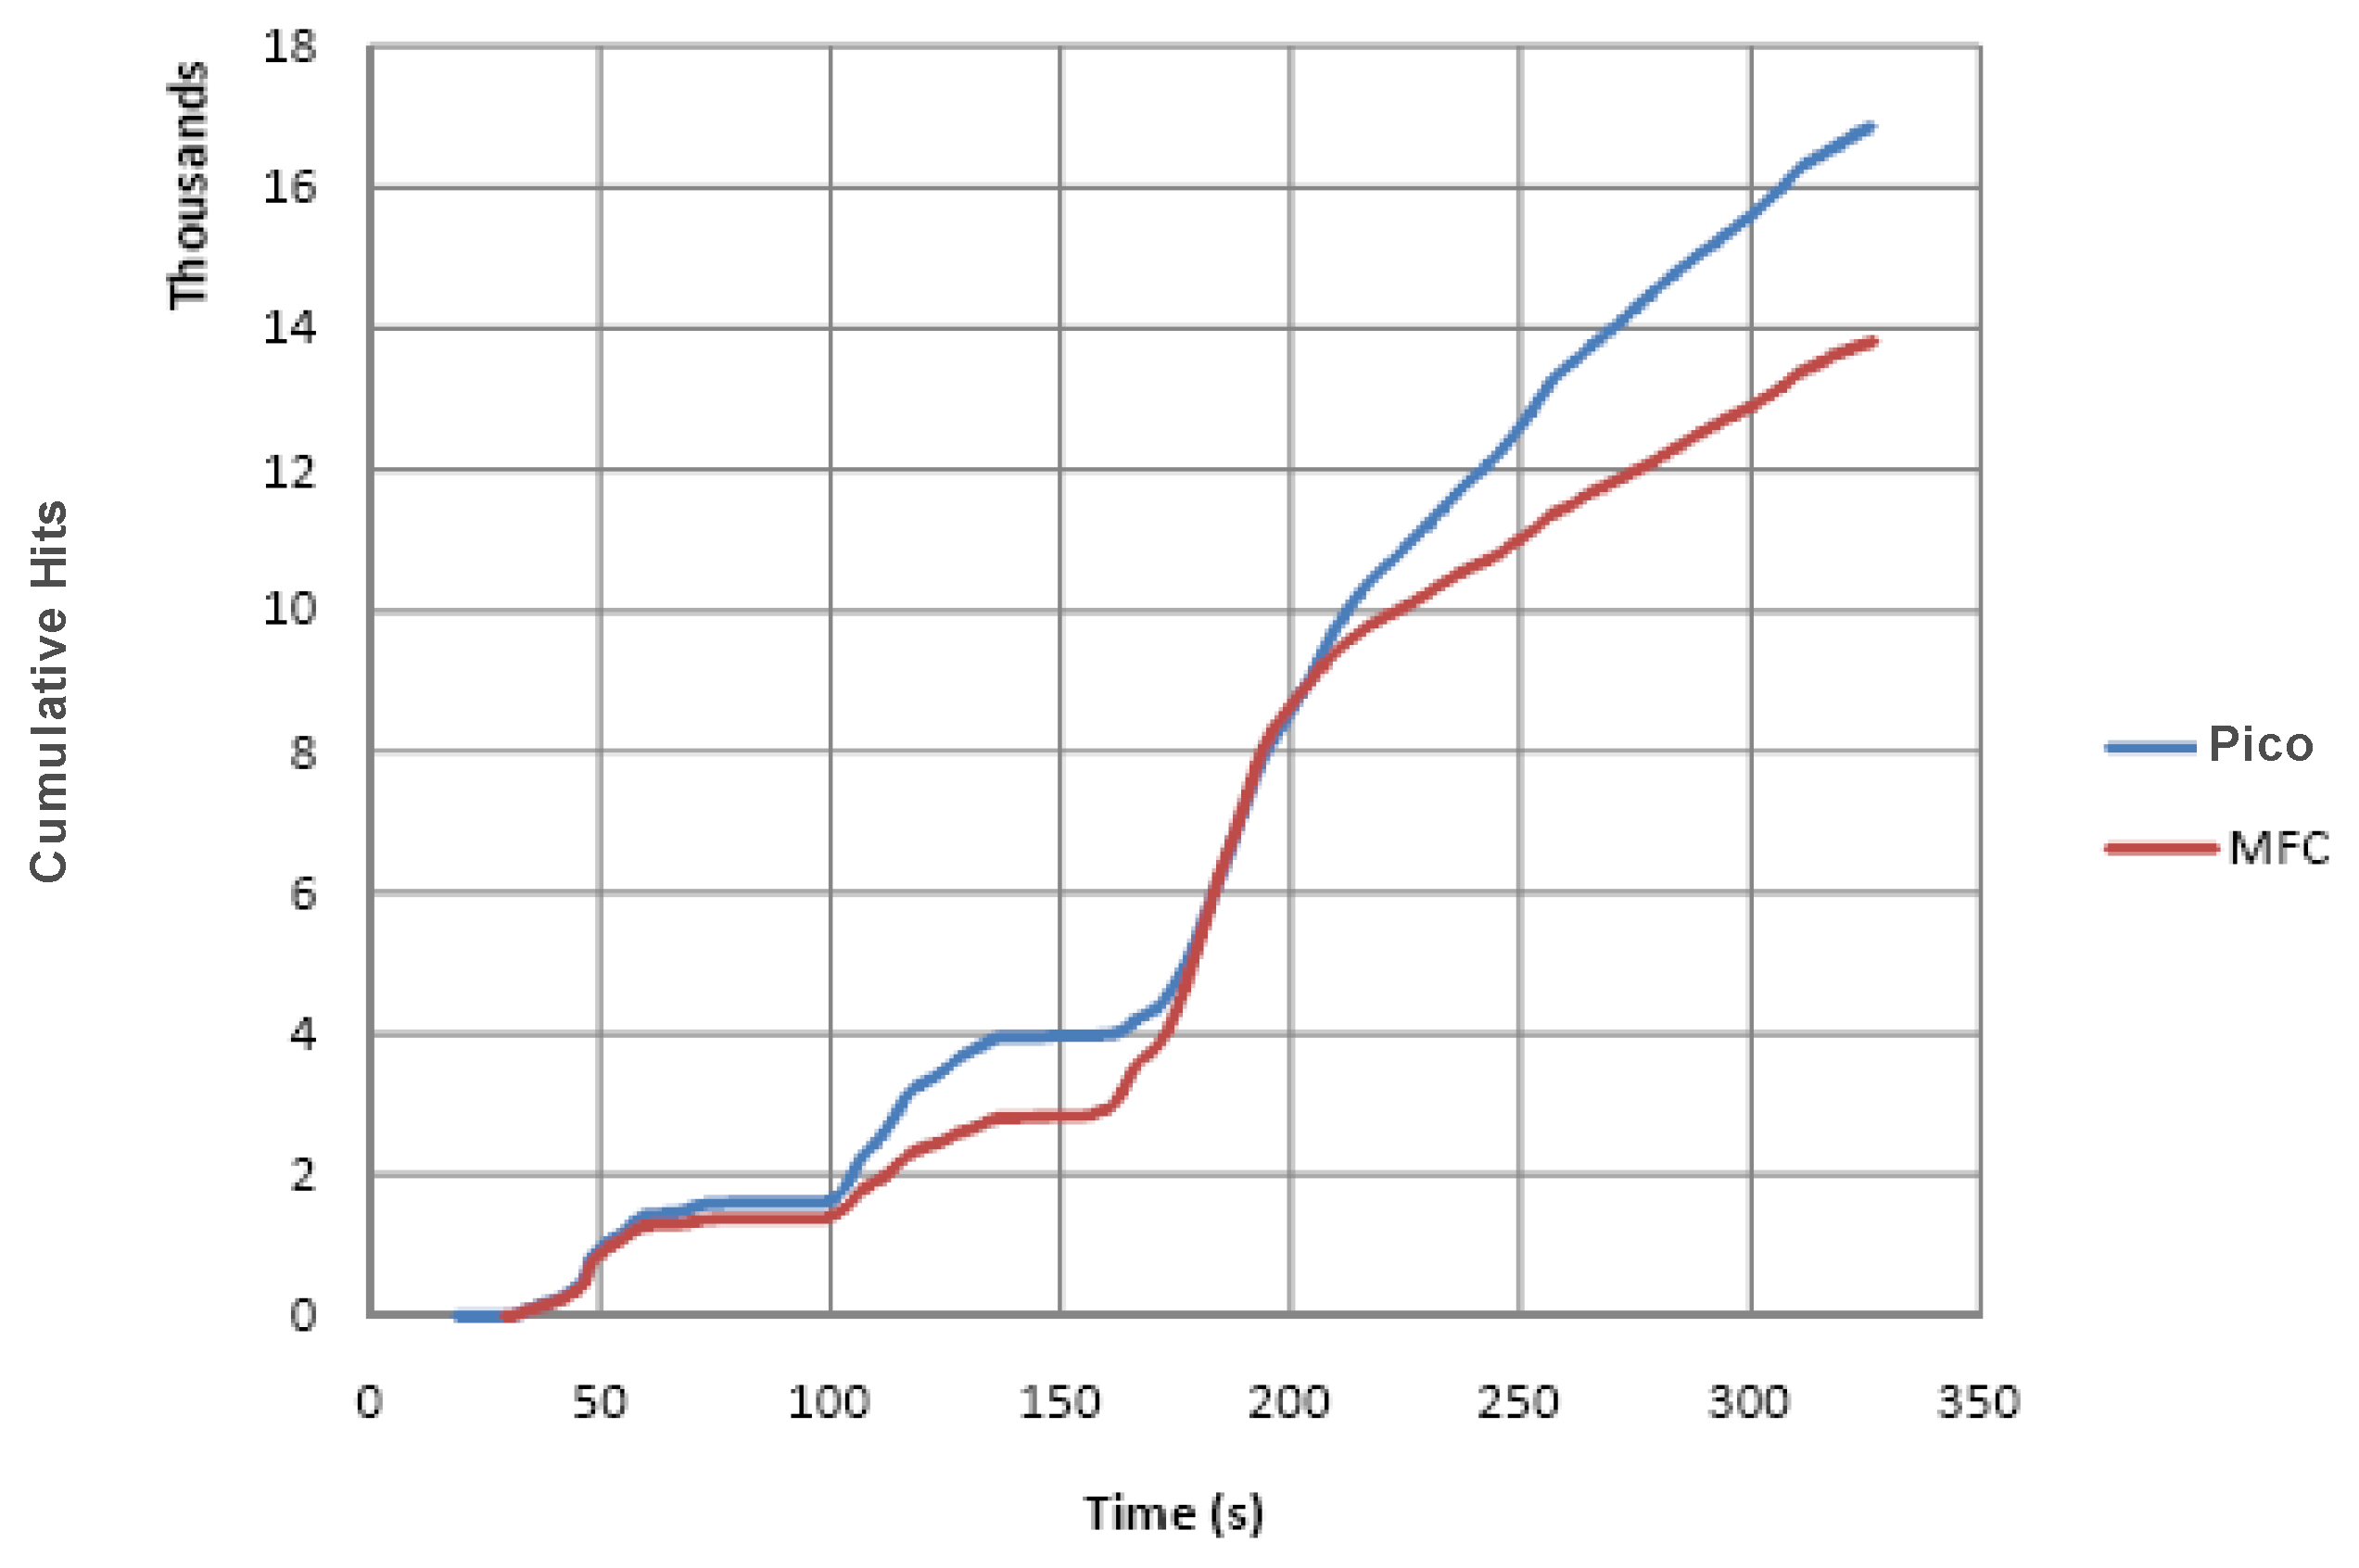
Figure 11 presents cumulative AE hits versus time of test from a carbon fibre strip buckling test for both the Pico sensor and MFC transducer. Increases in gradient observed in the figure are a result of more signals being recorded, which is an indication of damage development. The MFC transducer recorded less hits in total compared with the Pico sensor because of its reduced sensitivity, however it still follows the trend of the Pico sensor very closely and all three steep rises in gradient (indicating damage development) can be clearly identified in the MFC data. During two of the buckling tests the curvature became great enough to debond the Pico sensor, the data from such a test is presented in
Figure 12, where it can be seen that the MFC transducer data follows that of the Pico sensor closely up until the point where it debonds. This serves to further highlight the practical benefits of a sensor that is both flexible and robust.
Figure 11.
Cumulative AE hits versus time of test for compressive test specimen 1.
Figure 11.
Cumulative AE hits versus time of test for compressive test specimen 1.
Figure 12.
Cumulative AE hits versus time of test for compressive test specimen 2.
Figure 12.
Cumulative AE hits versus time of test for compressive test specimen 2.
4. Conclusions
It has been shown that the MFC transducers have potential for use in AE testing where basic feature data and trend analyses are performed, producing very similar results to that of a commercially available PAL Pico sensor for buckling tests. Practical testing also highlighted the benefit of the MFC transducer’s robustness and flexibility, relative to standard AE sensors which debonded due to specimen curvature.
Although the MFC transducers were observed to be less directionally sensitive than initially expected in terms of signal feature data, the high level of directional variance observed in the signal cross correlations will make the use of more advanced AE techniques, such as location and source characterization, very problematic. However with a deeper understanding of the sensors performance and directional behaviour it may be possible to overcome these problems.

