Article

Irrigated Area Maps and Statistics of India Using Remote Sensing and National Statistics

1
Southwest Geographic Science Center, U.S. Geological Survey, Flagstaff, AZ, USA
2
United Nations Joint Logistics Center, Juba, Sudan
3
University of Oklahoma, 101 David L. Boren Blvd, Norman, OK 73019, USA
4
National Bureau of Soil Survey & Land Use Planning, Nagpur, India
5
Department of Geography, University of Maryland, College Park, MD 20742, USA
6
Department of Applied Geology, Kuvempu University, Karnataka, India
7
Geographic Information Science Center of Excellence, South Dakota State University, Brookings SD 57007, USA
8
International Water Management Institute (IWMI), Hyderabad, India
*
Author to whom correspondence should be addressed.
Remote Sens. 2009, 1(2), 50-67; https://doi.org/10.3390/rs1020050
Submission received: 6 March 2009 / Revised: 12 April 2009 / Accepted: 16 April 2009 / Published: 17 April 2009

Abstract

:
The goal of this research was to compare the remote-sensing derived irrigated areas with census-derived statistics reported in the national system. India, which has nearly 30% of global annualized irrigated areas (AIAs), and is the leading irrigated area country in the World, along with China, was chosen for the study. Irrigated areas were derived for nominal year 2000 using time-series remote sensing at two spatial resolutions: (a) 10-km Advanced Very High Resolution Radiometer (AVHRR) and (b) 500-m Moderate Resolution Imaging Spectroradiometer (MODIS). These areas were compared with the Indian National Statistical Data on irrigated areas reported by the: (a) Directorate of Economics and Statistics (DES) of the Ministry of Agriculture (MOA), and (b) Ministry of Water Resources (MoWR). A state-by-state comparison of remote sensing derived irrigated areas when compared with MoWR derived irrigation potential utilized (IPU), an equivalent of AIA, provided a high degree of correlation with R2 values of: (a) 0.79 with 10-km, and (b) 0.85 with MODIS 500-m. However, the remote sensing derived irrigated area estimates for India were consistently higher than the irrigated areas reported by the national statistics. The remote sensing derived total area available for irrigation (TAAI), which does not consider intensity of irrigation, was 101 million hectares (Mha) using 10-km and 113 Mha using 500-m. The AIAs, which considers intensity of irrigation, was 132 Mha using 10-km and 146 Mha using 500-m. In contrast the IPU, an equivalent of AIAs, as reported by MoWR was 83 Mha. There are “large variations” in irrigated area statistics reported, even between two ministries (e.g., Directorate of Statistics of Ministry of Agriculture and Ministry of Water Resources) of the same national system. The causes include: (a) reluctance on part of the states to furnish irrigated area data in view of their vested interests in sharing of water, and (b) reporting of large volumes of data with inadequate statistical analysis. Overall, the factors that influenced uncertainty in irrigated areas in remote sensing and national statistics were: (a) inadequate accounting of irrigated areas, especially minor irrigation from groundwater, in the national statistics, (b) definition issues involved in mapping using remote sensing as well as national statistics, (c) difficulties in arriving at precise estimates of irrigated area fractions (IAFs) using remote sensing, and (d) imagery resolution in remote sensing. The study clearly established the existing uncertainties in irrigated area estimates and indicates that both remote sensing and national statistical approaches require further refinement. The need for accurate estimates of irrigated areas are crucial for water use assessments and food security studies and requires high emphasis.

1. Introduction

Irrigation is known to consume nearly 75 percent of all freshwater used by humans, yet the availability of exclusive irrigated area maps, which provide sub-national, national, continental, and global level statistics, are rare and inconsistent from one country or region to another. Irrigated areas are sometimes part of Land-Use/Land-Cover (LULC) maps with a single class or two. The biggest limitation of the existing irrigated area maps and statistics has been the failure to account for: (a) irrigation intensity, (b) irrigation source, (c) irrigated crop types, and (d) precise location of irrigated areas. Irrigation intensity and irrigation crop types have a huge influence in the quantum of water consumed. Knowledge about the irrigation source is a must to determine patterns of resource use and environmental impacts from major versus minor irrigation, and in determining the quantum of groundwater use and its overdraft issues. The economic studies will link location of irrigated areas to market access, populations, and virtual water studies. Given the huge implications of irrigated areas on water use, food production, population growth and distribution, environmental impacts, sustainability of ecosystems, and economics of virtual water trade, the need for precise estimates of irrigated areas and their spatial distribution cannot be over-emphasized.
Recently, there have been two major efforts in mapping global irrigation: (i) global irrigated area mapping (GIAM) by the International Water Management Institute (IWMI) [1] and (ii) global map of irrigated areas (GMIA) by the Food and Agriculture Organization (FAO) of the United Nations and the University of Frankfurt (FAO/UN) [2,3]. The IWMI GIAM [1,4,10] effort was overwhelmingly remote sensing based and the FAO/UF GMIA [5] effort was overwhelmingly based on national statistics, combined with GIS techniques. There are, however, significant differences in the irrigated area statistics reported by IWMI GIAM, FAO/UF, and various national statistics.
The need to understand the causes for these differences has become critical in order to harmonize and synthesize the irrigated area mapping and statistics for country like India using remote sensing data. This is especially important given the future of the irrigated area reported is likely to be heavily dependent on remote sensing data and methods. To understand the causes of such differences, we took India as the case study due to the following reasons. First, India is one of the leading irrigated area countries of the world. Second, the GIAM project has completed mapping of the irrigated areas for India at two resolutions using remote sensing: 10 km [1], and 500 m [6]. Third, extensive irrigated area statistics at national and sub-national level are available for India for comparative analysis with GIAM statistics. Irrigated agriculture is the chief contributor to the green revolution in India helping to feed a population of about 1.1 billion. Spatial data on distribution of irrigated areas and their dynamics are a prerequisite for effective planning, management and monitoring at the national, regional and local levels for agricultural development. The need for the timely availability of irrigated area statistics at various administrative units of India cannot be overemphasized. India has about 27.5 percent of the global annualized irrigated area, which is second only to China, which has 31.5 percent [1].
In India, traditionally grass root level revenue department officials (Village Patwari) report irrigation statistics as a part of agricultural statistics that are, in turn, compiled at different levels like village, tehsil, district, state, and national level. It is a rigorous, time-consuming, inconsistent and resources-intensive process. Also, it is difficult to visualize the spatial pattern of irrigated areas in the statistical data of any administrative unit. With the increase in spatial, spectral and temporal resolutions of the satellite sensors, medium to high resolution satellite data provide valuable information on location, spatial distribution and extent of irrigated areas in the country for accurate mapping of irrigated areas and to analyze their spatio-temporal changes in the Geographic Information Systems (GIS) environment.
The irrigated area statistics reported by the India’s Directorate of Economics and Statistics (DES) fully accounts for the 162 major and 221 medium irrigation projects. However, the minor irrigation (groundwater, small reservoirs and tanks) is inadequately accounted for in the DES statistics. There is widely held view that minor irrigation sources today irrigate more area than that of major irrigation sources. For example, in the early 1960s, there were only about 100,000 bore wells in India and today the estimates are anywhere between 21 and 26 million [7]. An overwhelming proportion of these are used for irrigation and use up about 200 cubic kilometers of water per year. These facts make it imperative to systematically account for minor irrigation statistics in addition to the major irrigation. India’s Ministry of Water Resources (MoWR) recently released 3rd minor irrigation statistics that systematically accounts for irrigation potential utilized (IPU) and irrigation potential created (IPC) from various minor irrigation sources along with major irrigation for the year 2001-2002.
Similarly, the irrigated areas computed using remote sensing have their own drawbacks [1,10]. First, resolution at which the mapping is done is important. At fine spatial resolution (<30 m) it is possible to discern irrigated areas significantly better than finer resolution [11]. However, it will take enormous resources and computing capacity to cover large areas using finer spatial resolution. To have time-series coverage at finer spatial resolution becomes even more daunting. In contrast, the coarser resolution imagery from AVHRR/SPOT 1-10km and MODIS 250/500 m are now widely available for free, have excellent temporal coverage, are well calibrated by science teams, and cover the entire world almost daily. However, the coarser resolution imagery cannot adequately map fragmented areas adequately [11] and require the use of sub-pixel area computation methods [22]. To derive areas based on SPAs is not always easy due to difficulties involved in determining irrigated area fractions [22].
The above discussions clearly imply the need to understand and reduce uncertainties in irrigated areas derived from remote sensing as well as national statistics. Given this background, the focus of this study was to compare the irrigated area statistics of India generated from the GIAM using remote sensing techniques at 10-km and 500-m resolution with the census-based national irrigated area statistics of MoWR and DES and discuss the causes of uncertainties Specific focus has been made to compare the irrigated area statistics of GIAM with MoWR because later accounts for minor irrigation statistics to a significant degree.

2. Methods

A comprehensive set of methods and techniques have been developed for mapping irrigated areas of the world in general [1] and of India in particular [6] using time-series remote sensing data at various scales.

2.1. Definitions

Two types of irrigated areas have been reported using the remote sensing-based GIAM work.

2.1.1. Total area available for irrigation (TAAI)

The TAAI is defined as the area irrigated at any given point of time, plus the area left fallow at the same point of time. TAAI does not consider intensity. There is no strict equivalent of TAAI in the national statistics. The nearest equivalent of TAAI in the national statistics is the net irrigated area (NIA) reported by DES. However, TAAI does include fallow areas whereas NIA does not.

2.1.2. Annualized irrigated areas (AIAs)

Annualized irrigated areas (AIAs) is defined as the sum of the actual areas irrigated during different seasons. The AIA sums up areas irrigated during season 1 (kharif), season 2 (rabi), and continuously year-round. Thereby, the AIA considers intensity of irrigation. The exact equivalent of AIA in the national statistics is the irrigation potential utilized (IPU) reported by MoWR (2005) or the gross irrigated area (GIA) reported by DES.
In MoWR, major irrigation (irrigated by major and medium surface water reservoirs) includes all areas irrigated from major irrigation (>10,000 hectare water spread area) and medium irrigation (>2,000 but <10,000 hectare) projects and almost exclusively from surface water reservoirs supplying water to irrigated croplands through network of canals by gravity flow. Minor irrigation as defined in this paper consists of ground water, small reservoirs, and tanks. The irrigation by tube-wells, open wells, small reservoirs (<2000 ha water spread area), and tanks is referred to as minor irrigation. Irrigation potential utilized (IPU) as defined by MoWR is the gross area actually irrigated during reference year out of the gross proposed area to be irrigated by the scheme during the year [8]. This is equivalent of AIA in GIAM. The net irrigated area (NIA) as defined by DES is the total area that is irrigated at least once per agricultural year. It does not include areas that were left fallow or that were entirely rainfed during the year of statistics [8]. The gross irrigated area (GIA) as defined by DES is the area irrigated under various crops during a year, counting the area irrigated under more than one crop during the same year as many times as the number of crops grown and irrigated [15].

2.2. Data used and resolutions

Maps and statistics were produced for India by the IWMI GIAM project at 10-km resolution and 500-m resolution using publicly available, high quality, time-series remote sensing data, secondary data, groundtruth data, and Google Earth data [1,6]. The GIAM work reports irrigated areas for India at two scales (or resolutions): One is GIAM India 10-km, which is primarily based on time-series AVHRR pathfinder data. Another one is GIAM India 500-m, which is primarily based on MODIS 8-day 7-band reflectance data.
The 10-km product used multiple satellite sensor data such as AVHRR 10-km for every month during 1997-1999, SPOT Vegetation 1-km for 1999, and JERS SAR 100-m data for the African and Amazonian rain forests. It also used a suite of secondary data such as 0.5 degree monthly precipitation of the world for 40 years (1961-2000), GTOPO30 1-km DEM data, and forest density map of the world from University of Maryland [1]. The product was referred to as 10-km due to the overwhelming use of AVHRR 10-km. The 500-m product was based on MODIS 500-m 7-band every 8-day reflectance data for 2001-2003, SRTM 90-m digital elevation data, and a suite of secondary datasets. The 30-m product was based on Landsat ETM+data for nominal year 2000, SRTM 90-m data, and MODIS time series for 2001-2003. In each product level, the multi-resolution, multi-source data are composed into a mega-file data-cube format that has hundreds or even thousands of data layers in a single file. This will mean that the primary satellite sensor and secondary data are fused and composed into a single re-sampled resolution of 10-km, 500-m and 30-m. The 10-km product was ideal for the national and state-level statistics while the 500-m product was good for national, state and district-level statistics. The 30 meter data will be used to generate statistics and maps at national, state, district and tehsil level. Detailed descriptions of these are provided for 10 km [1,9,10], for 500 m [6] and for 30-m [11] work.

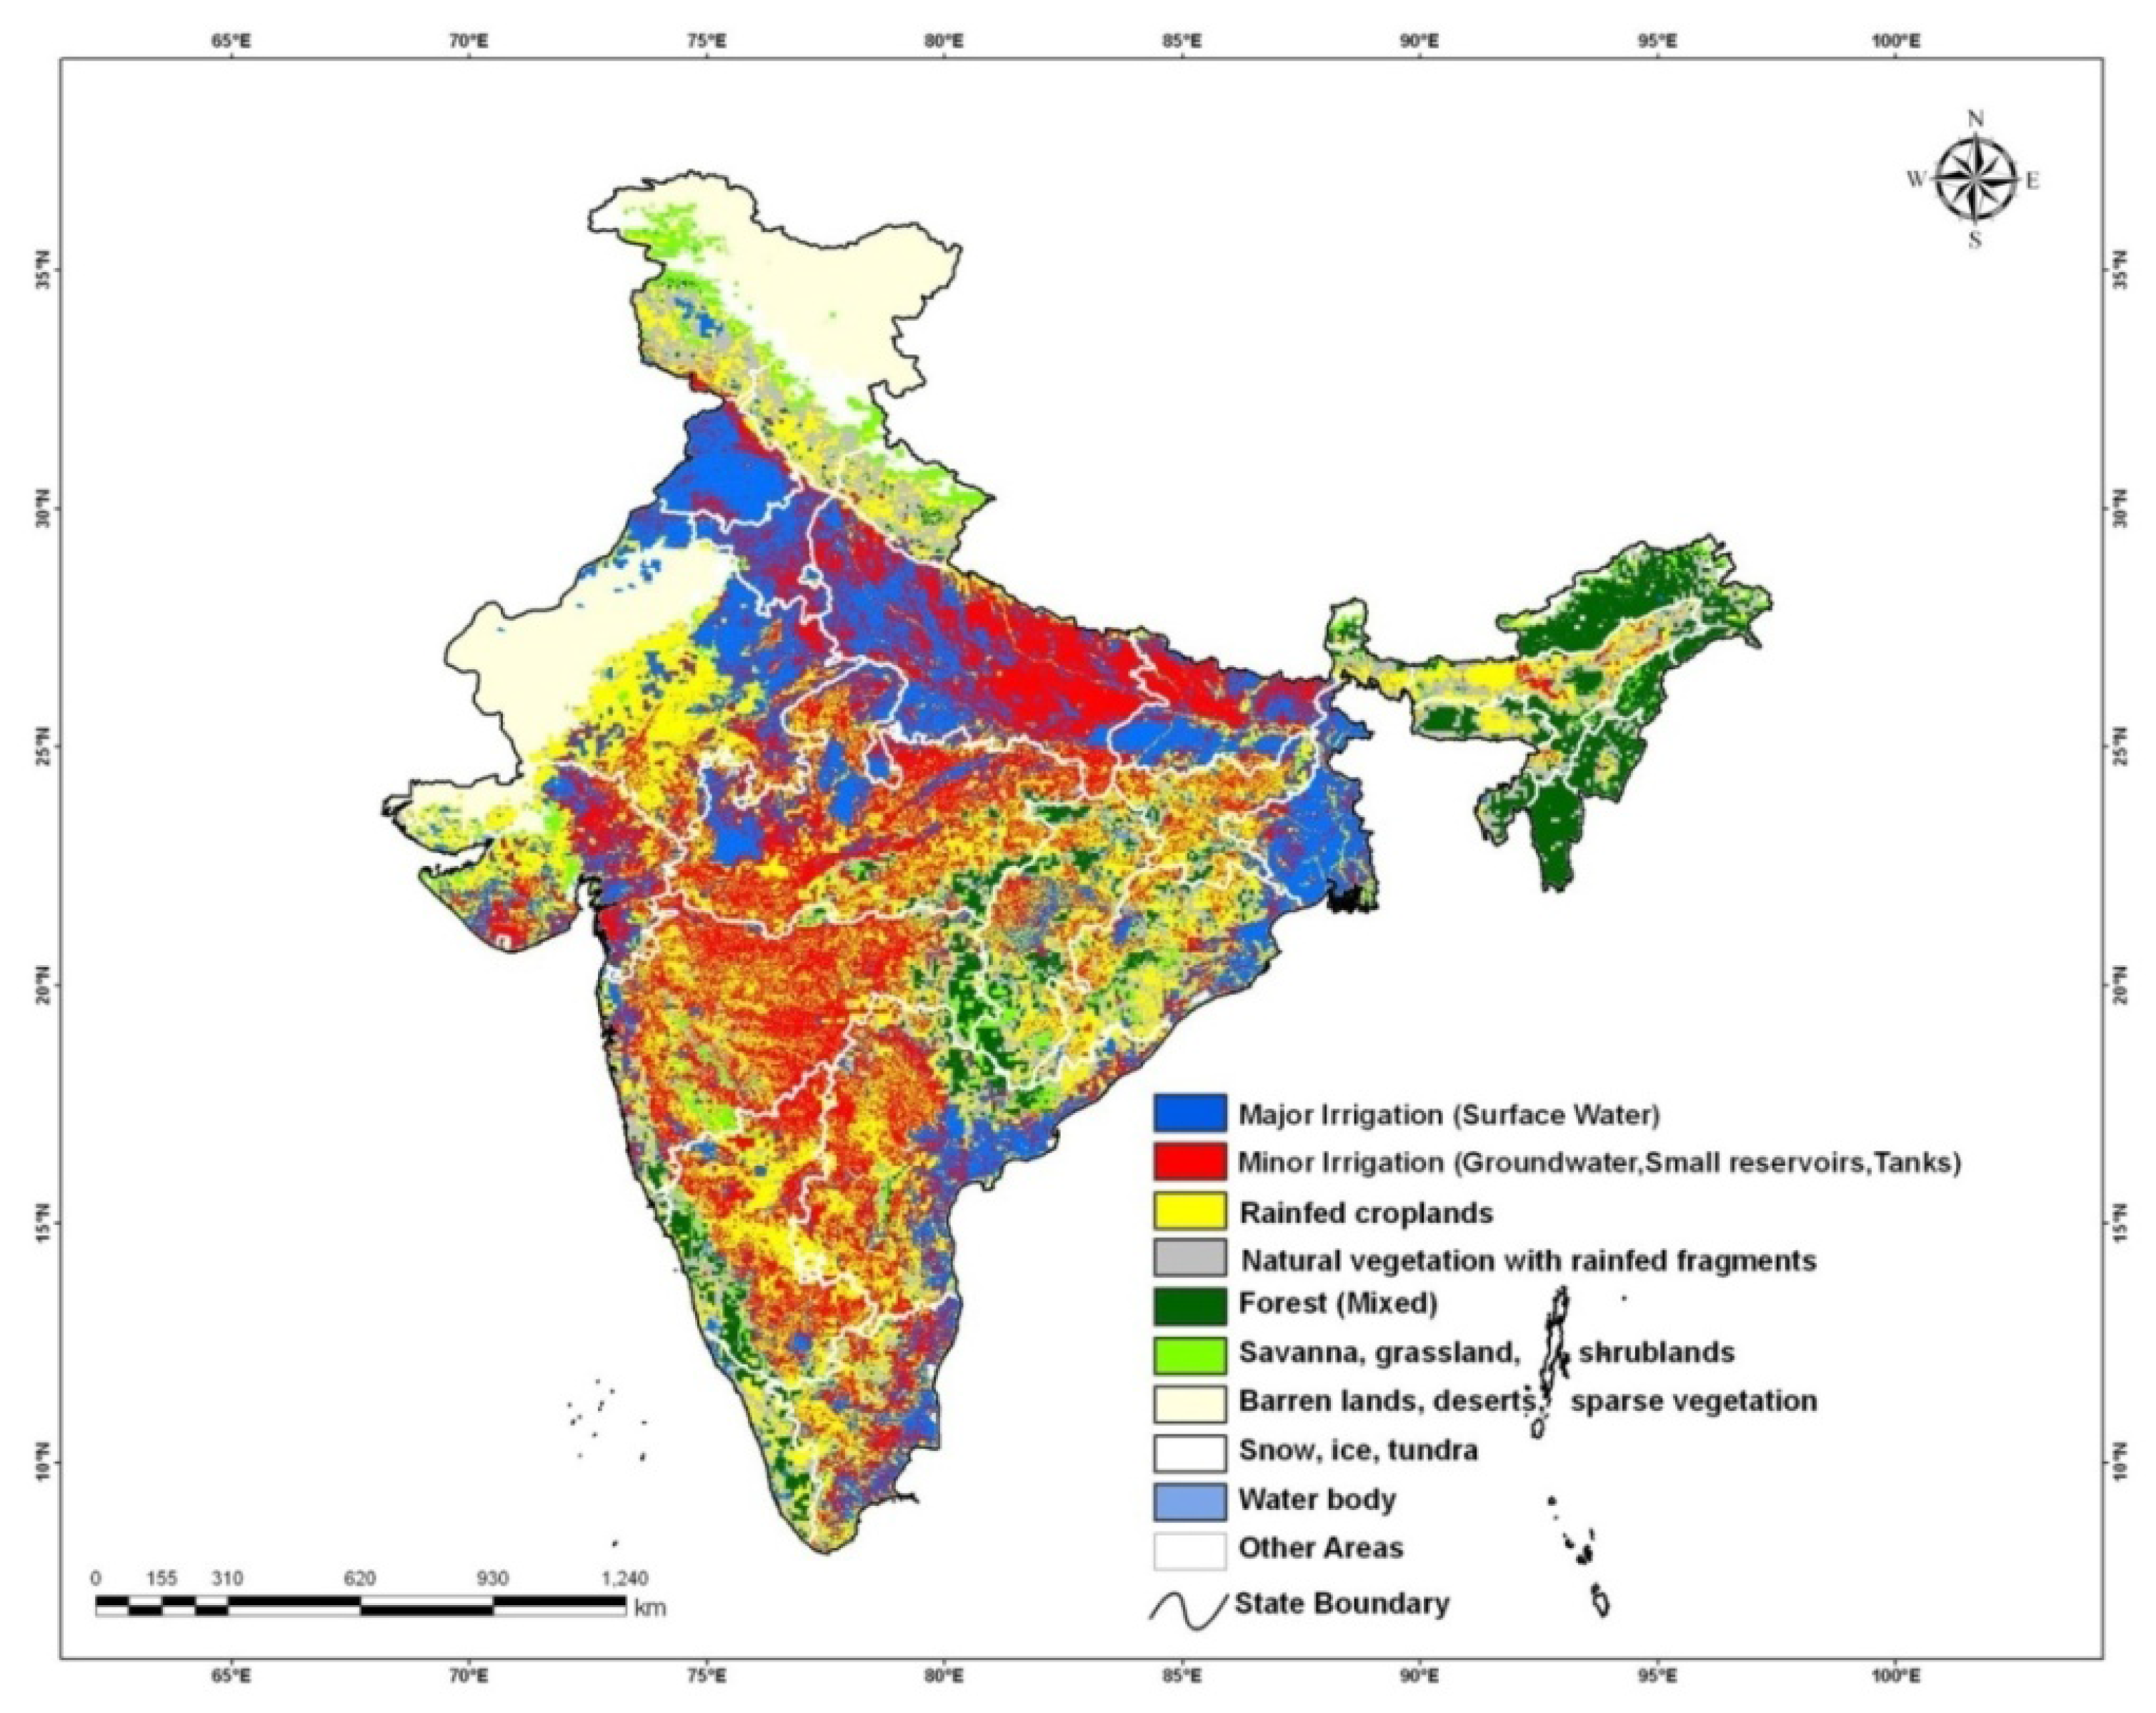
2.3. Methods for mapping irrigated areas using remote sensing

The GIAM work has developed innovative methods of mapping irrigated areas as enumerated in recently published work for 1 to 10-km [1,9,10,12,13,14,22] and 500-m [6] and for 30-m [11] work.

3. Results and Discussions

3.1. TAAI (GIAM) and its comparison with NIA (DES)

The total area available for irrigation (TAAI) for India at the end of the last millennium from GIAM 10-km was 101 Mha (Figure 1) and from GIAM 500-m was 113 Mha (Figure 2). The GIAM 10-km map of India (Figure 1) was derived from the GIAM world map [1]. Of the TAAI 101 Mha derived from GIAM 10-km, 41 percent was from major irrigation (major and medium irrigation schemes) and 59 percent was from minor irrigation (groundwater, small reservoirs, and tanks) (Figure 1). Of the 113 Mha derived from GIAM 500-m, 38 percent was from surface water and 62 percent was from groundwater (Figure 2).
Figure 1. Irrigated areas of India based on International Water Management Institute’s Global Irrigated Areas Map at 10-km resolution [derived from reference 1].
Remotesensing 01 00050 g001
Figure 2. Irrigated areas of India based on International Water Management Institute’s Global Irrigated Areas Map at 500m resolution (derived from reference 6).
Remotesensing 01 00050 g002
India’s Directorate of Economics and Statistics (DES) estimated the net irrigated area (NIA), an equivalent of TAAI, as 56.6 Mha for the year 2001-2002 [15]. The NIA statistics are mainly derived from 162 major and 221 medium surface water reservoirs, as depicted in India’s Central Board of Irrigation and Power (CBIP) [16] irrigated area map for India for the year 1992 and misses out significant portions of minor irrigations from privately owned ground water, which are over 20 million in India by current estimates [7]. This is obvious when we compare Figure 3 with Figure 1 and Figure 2. In the study, 8-day time-series MODIS data for the year 2001-2003 was used to determine the exact irrigated areas within the CBIP irrigated areas and found 48 percent was surface water, 34 percent groundwater and the rest 18 percent other land-use/land-cover (LULC) (Figure 3). This reduced the exact irrigated area within the CBIP map to 61.5 Mha (75 Mha full pixel area or FPA * 0.82 after deducting 18 percent for other LULC areas; Figure 3); of which major irrigated areas were 29.5 Mha (48%), minor irrigated areas were 20.9 Mha (34%), and other LULC 18 Mha (11.1%).

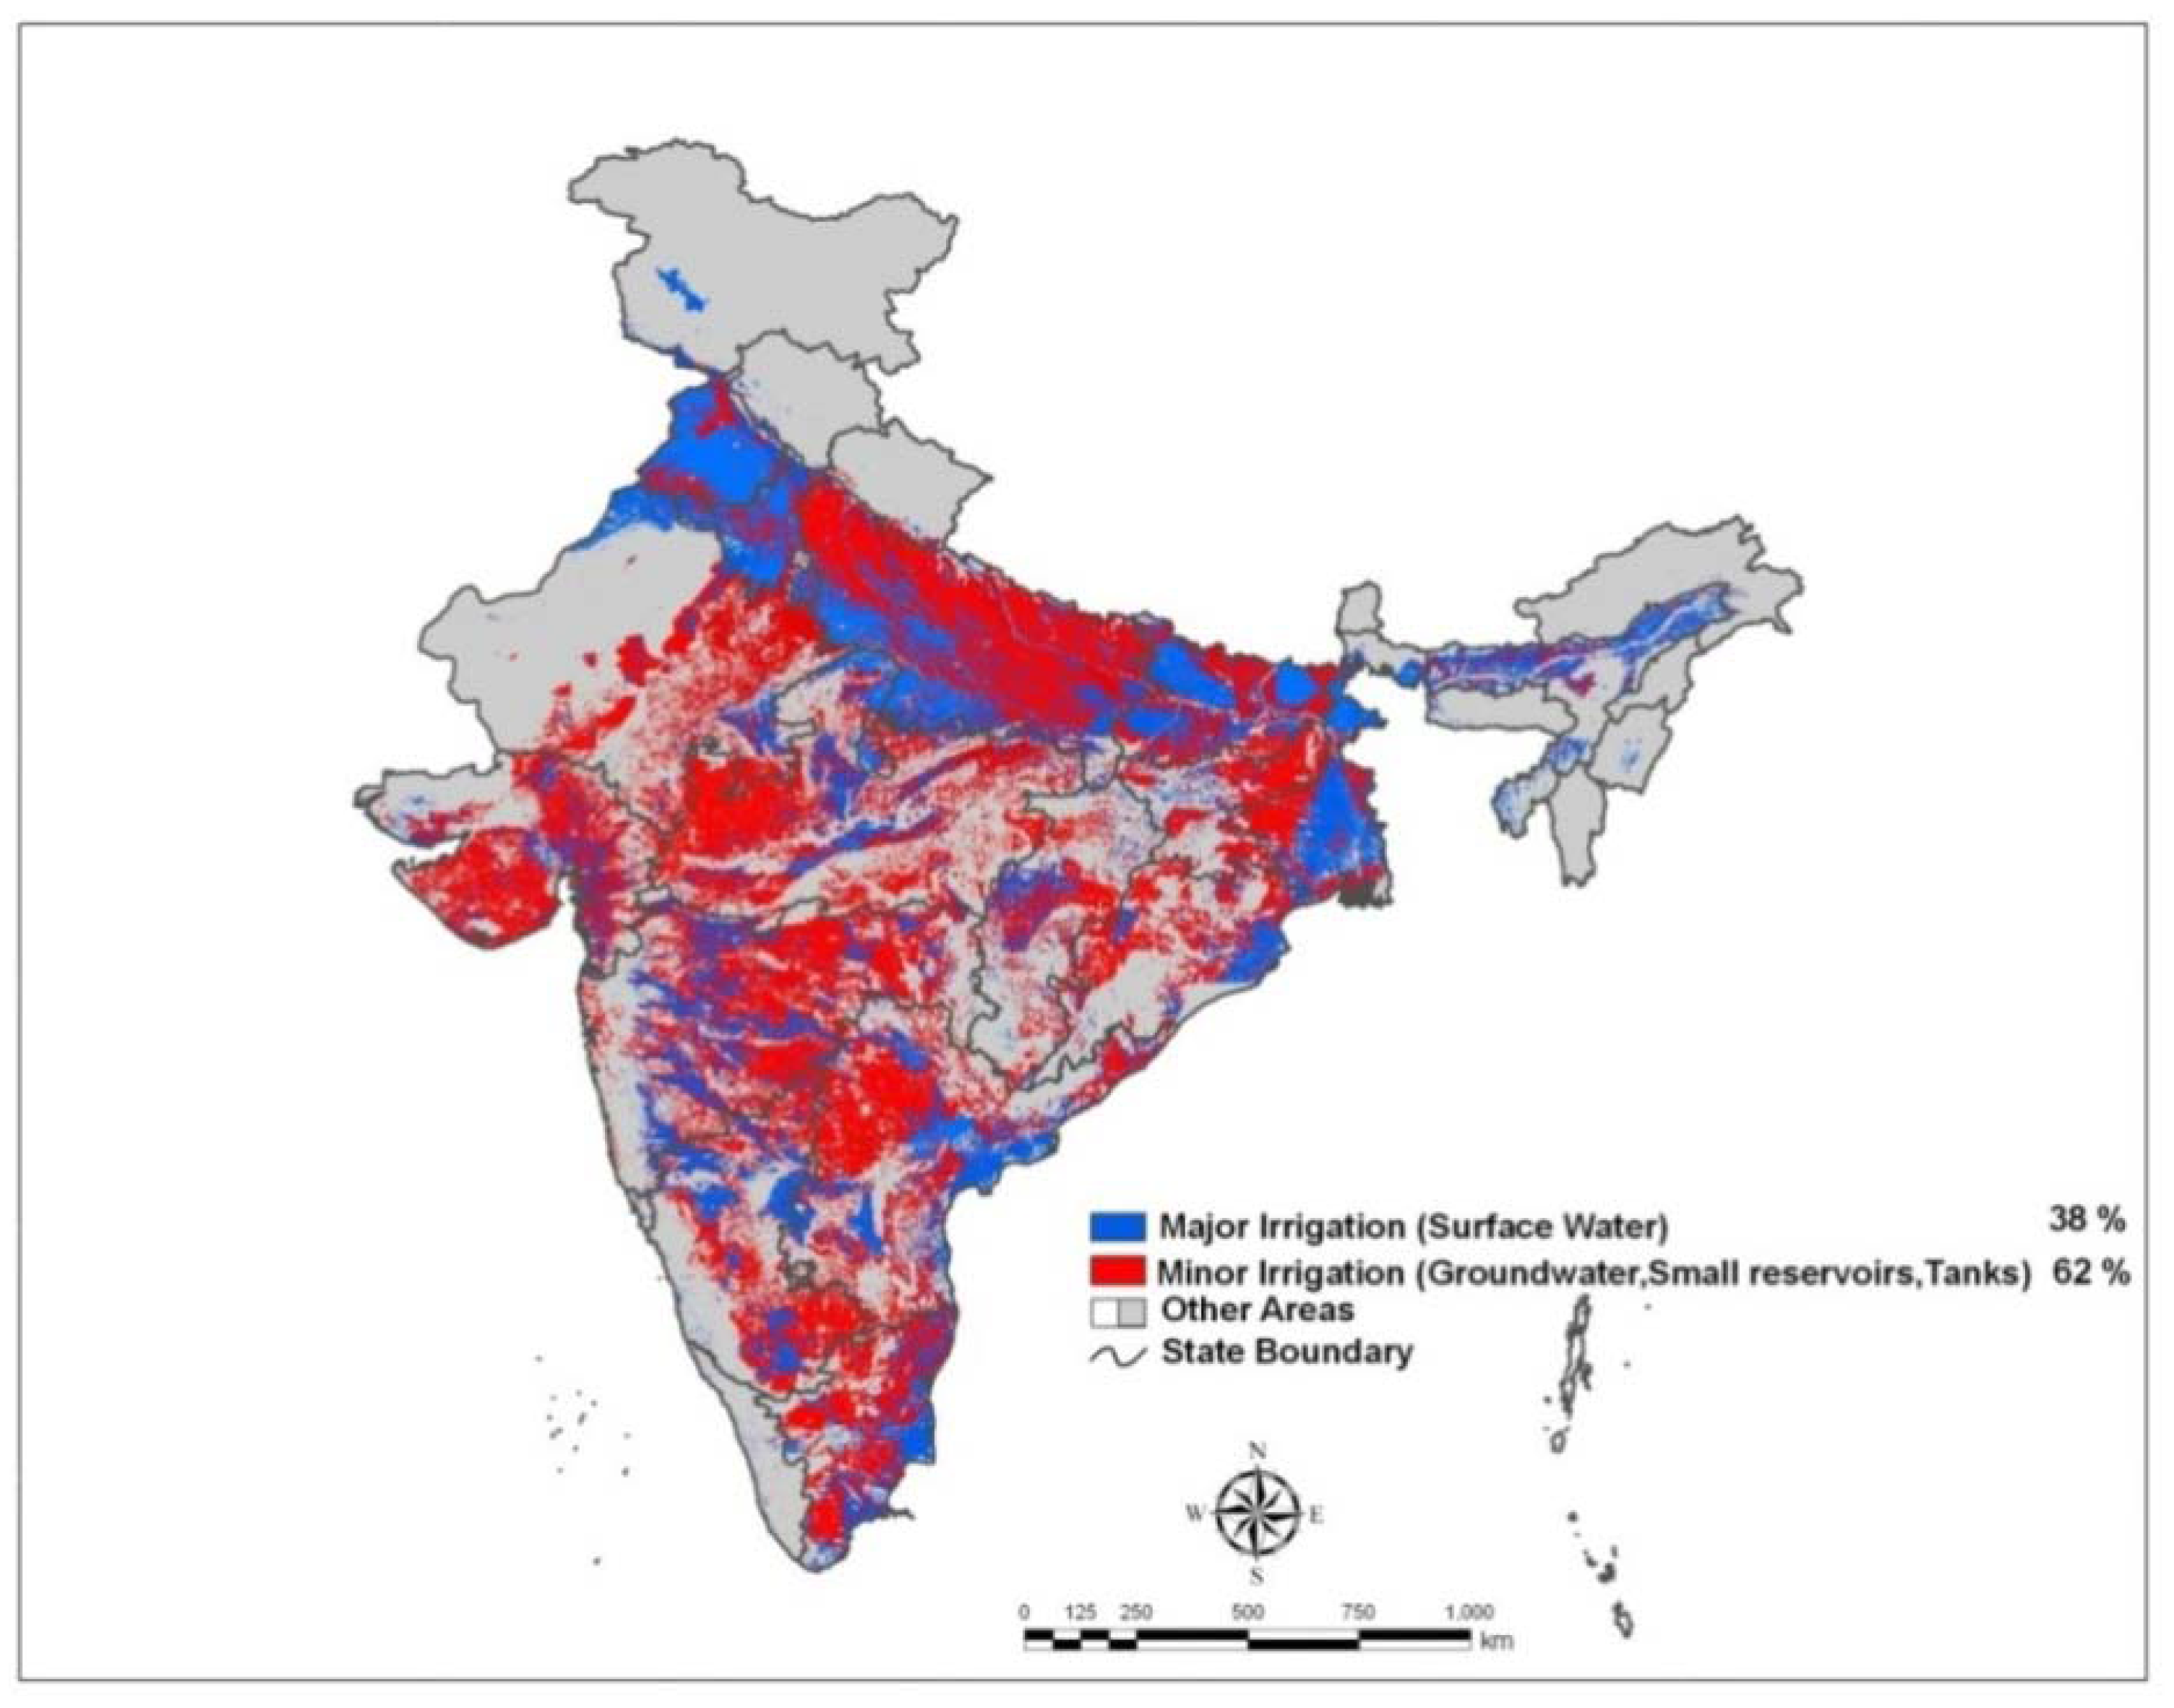
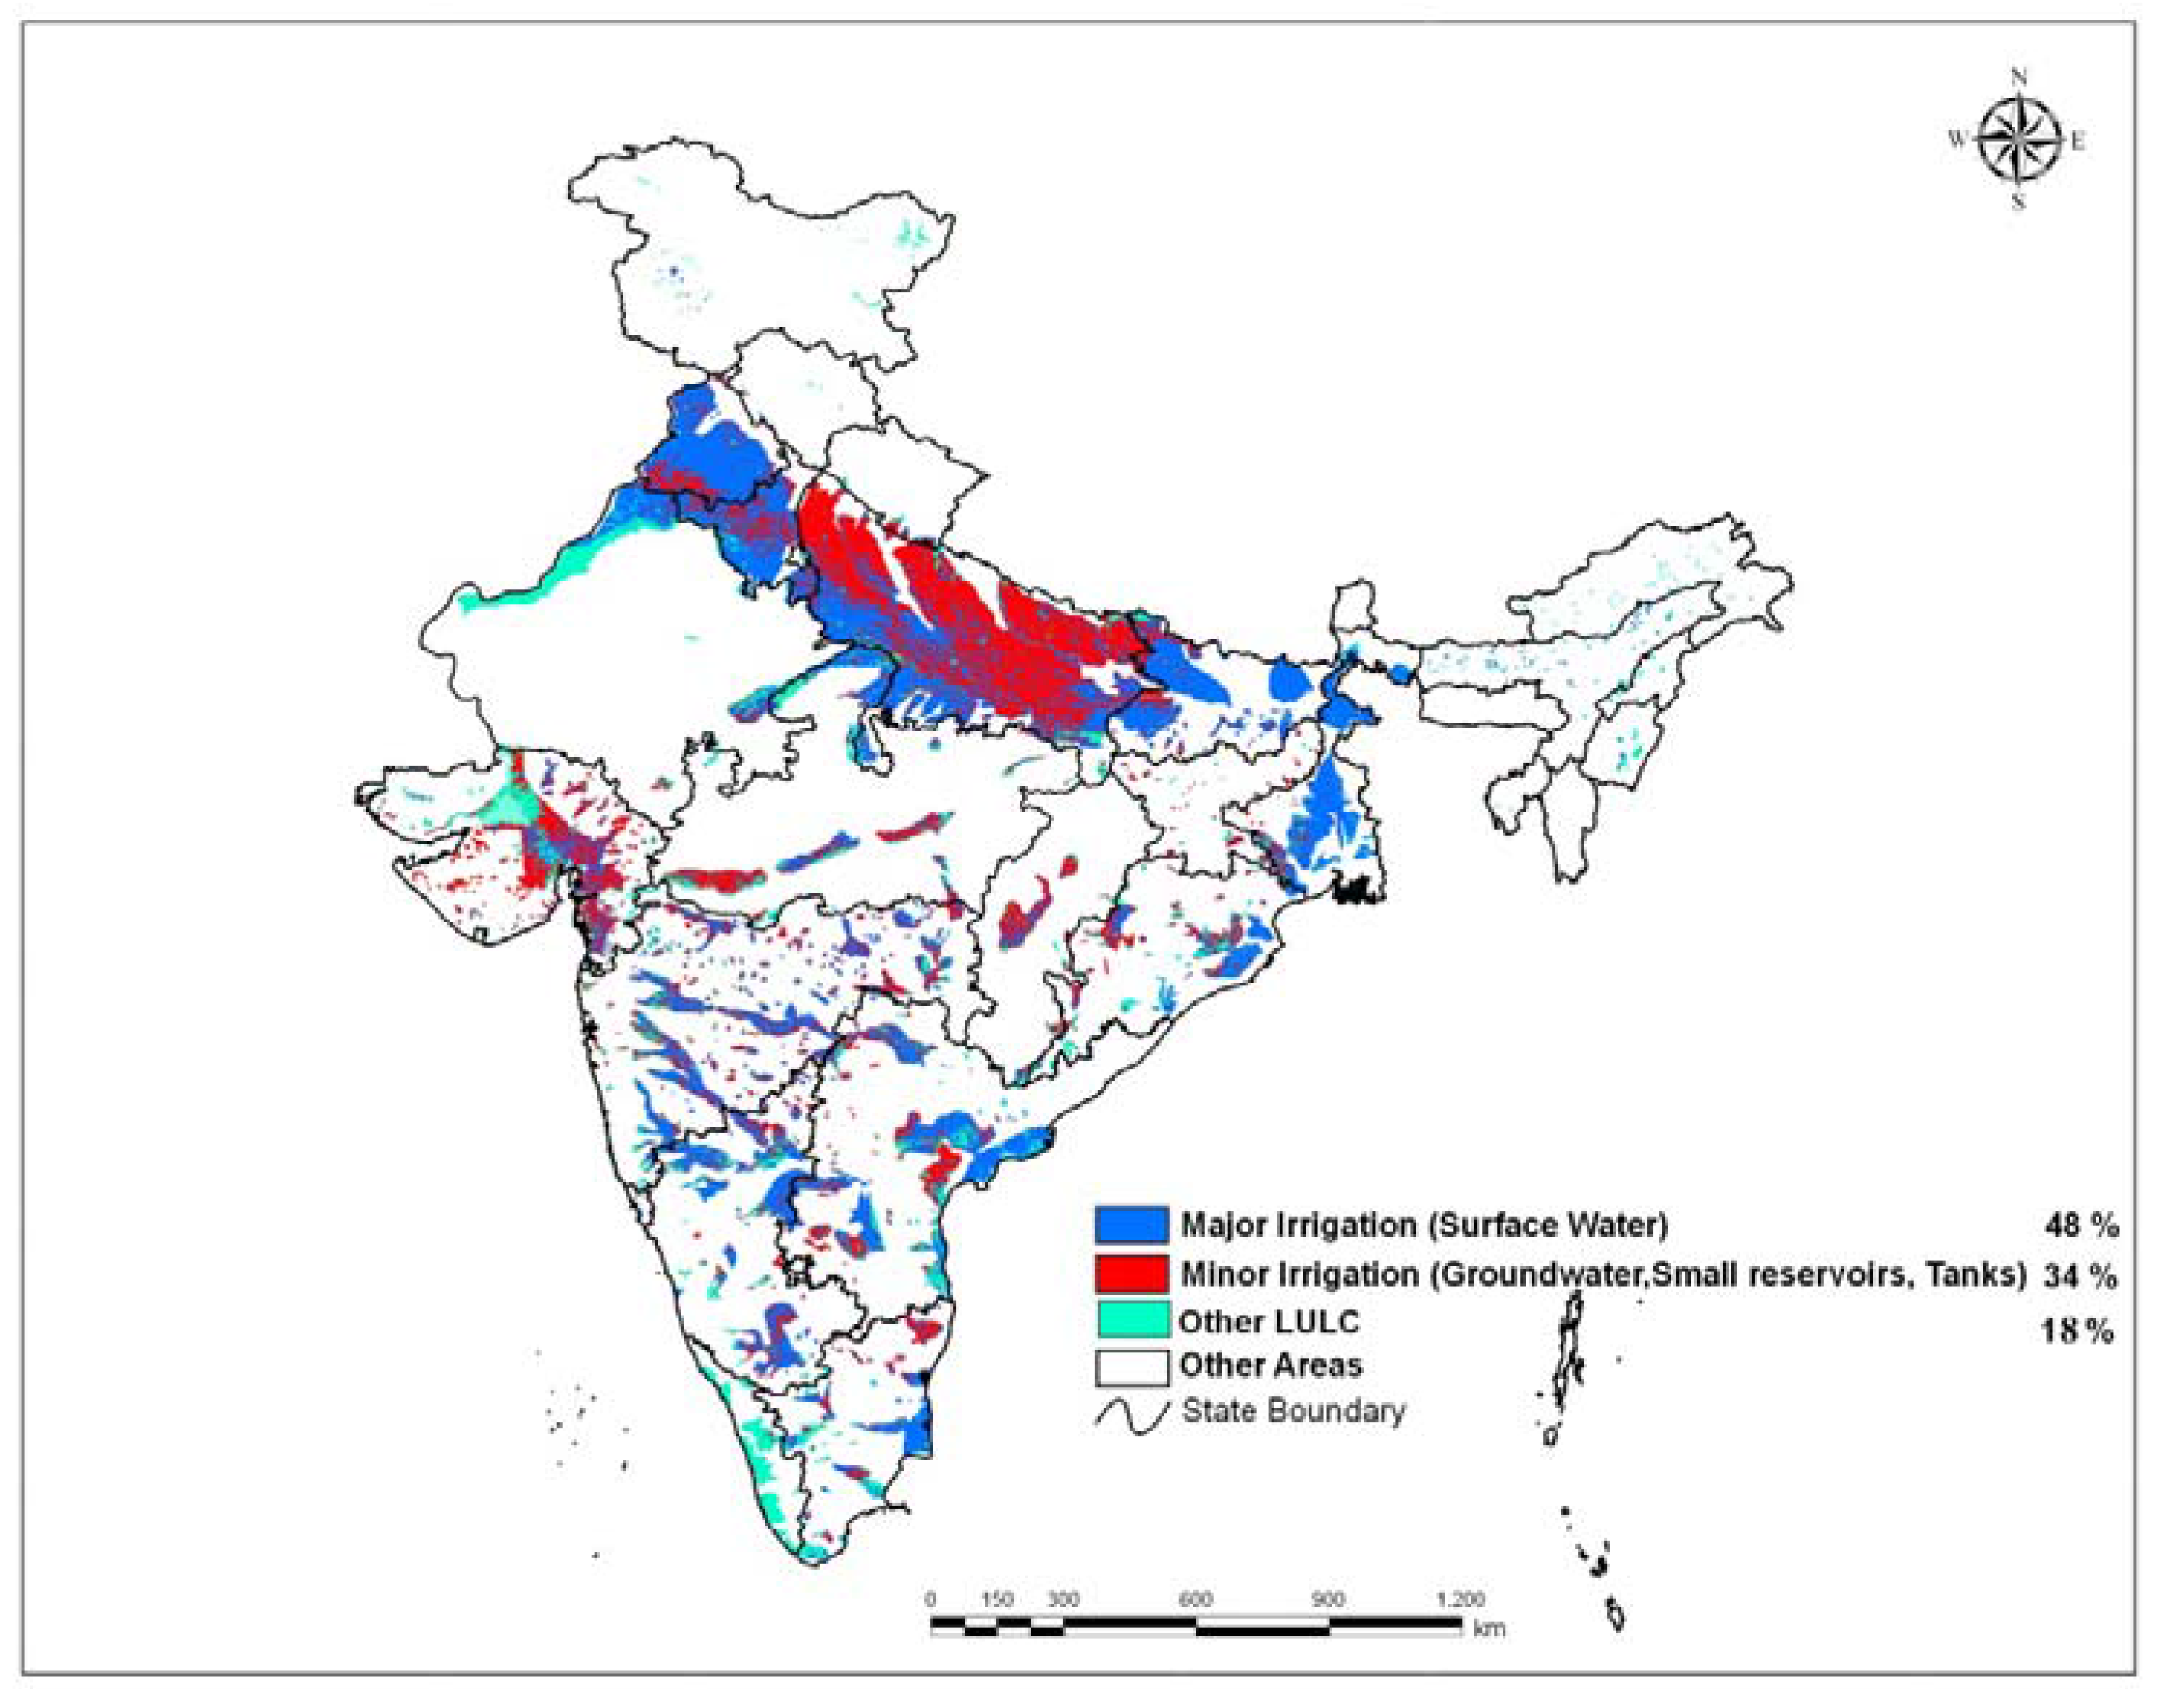
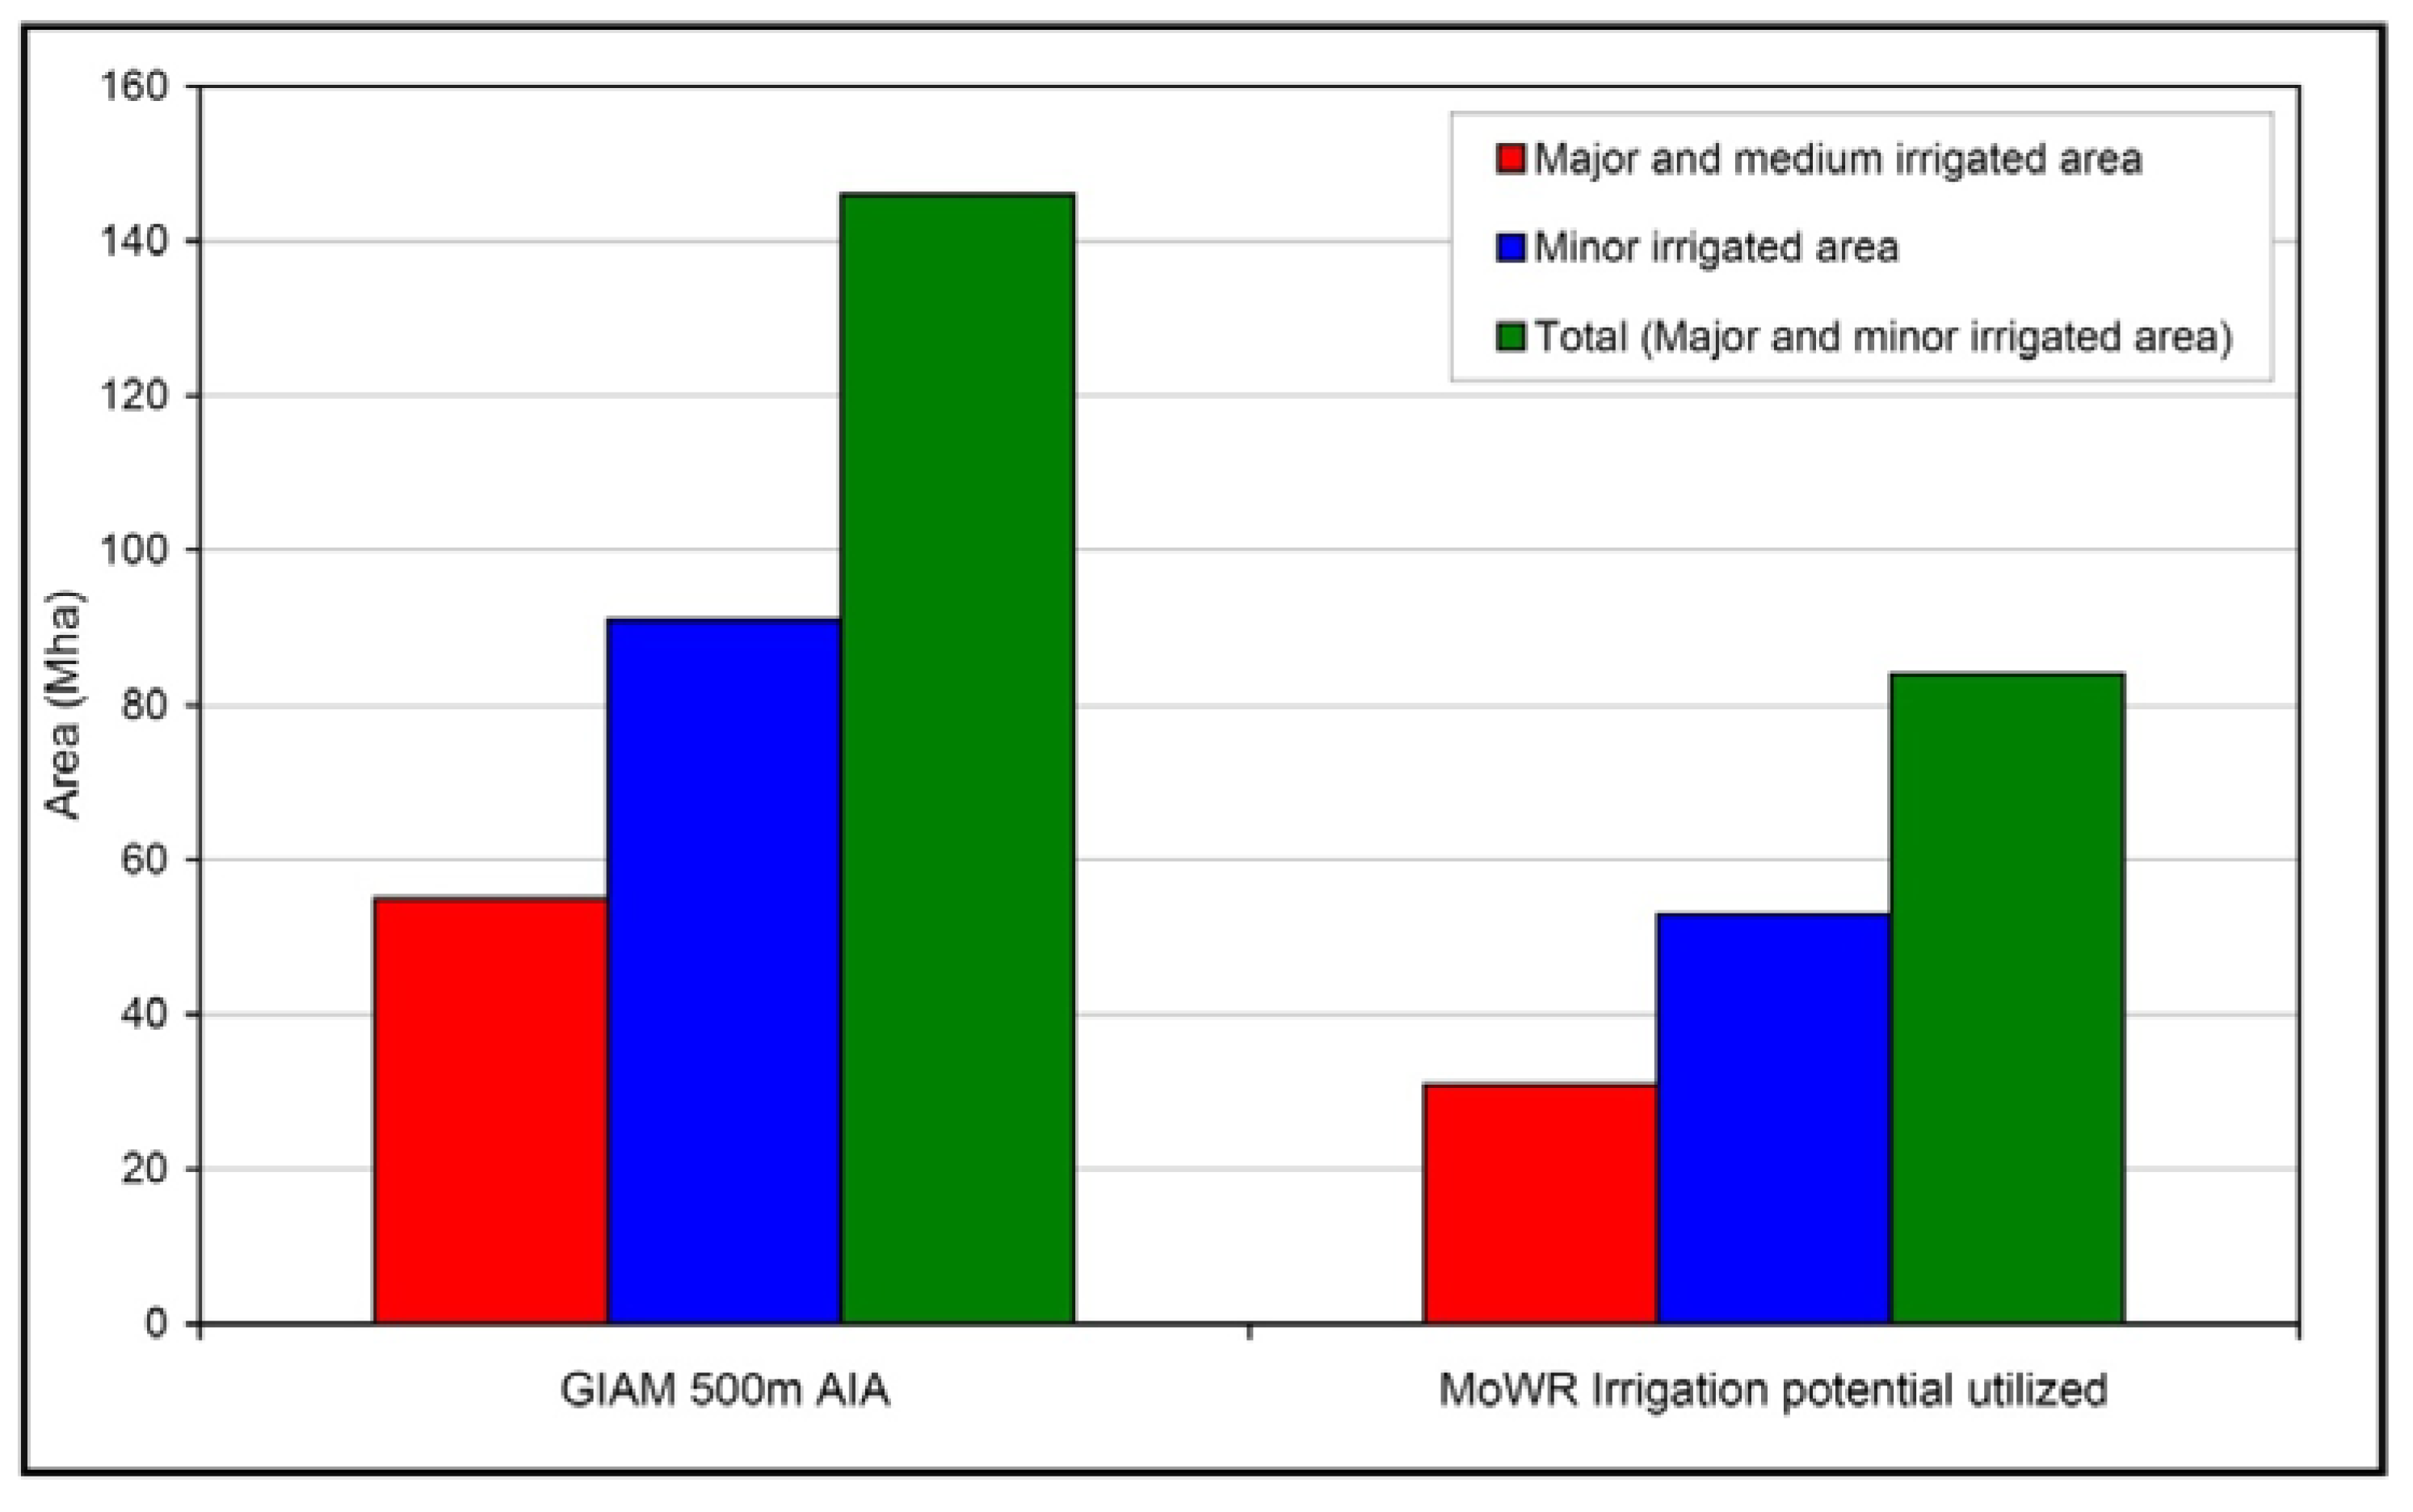
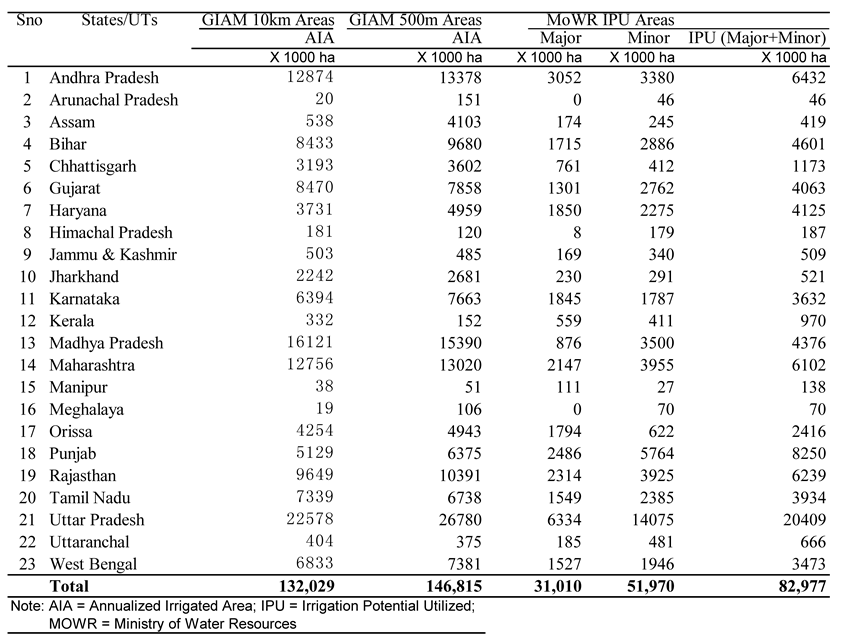
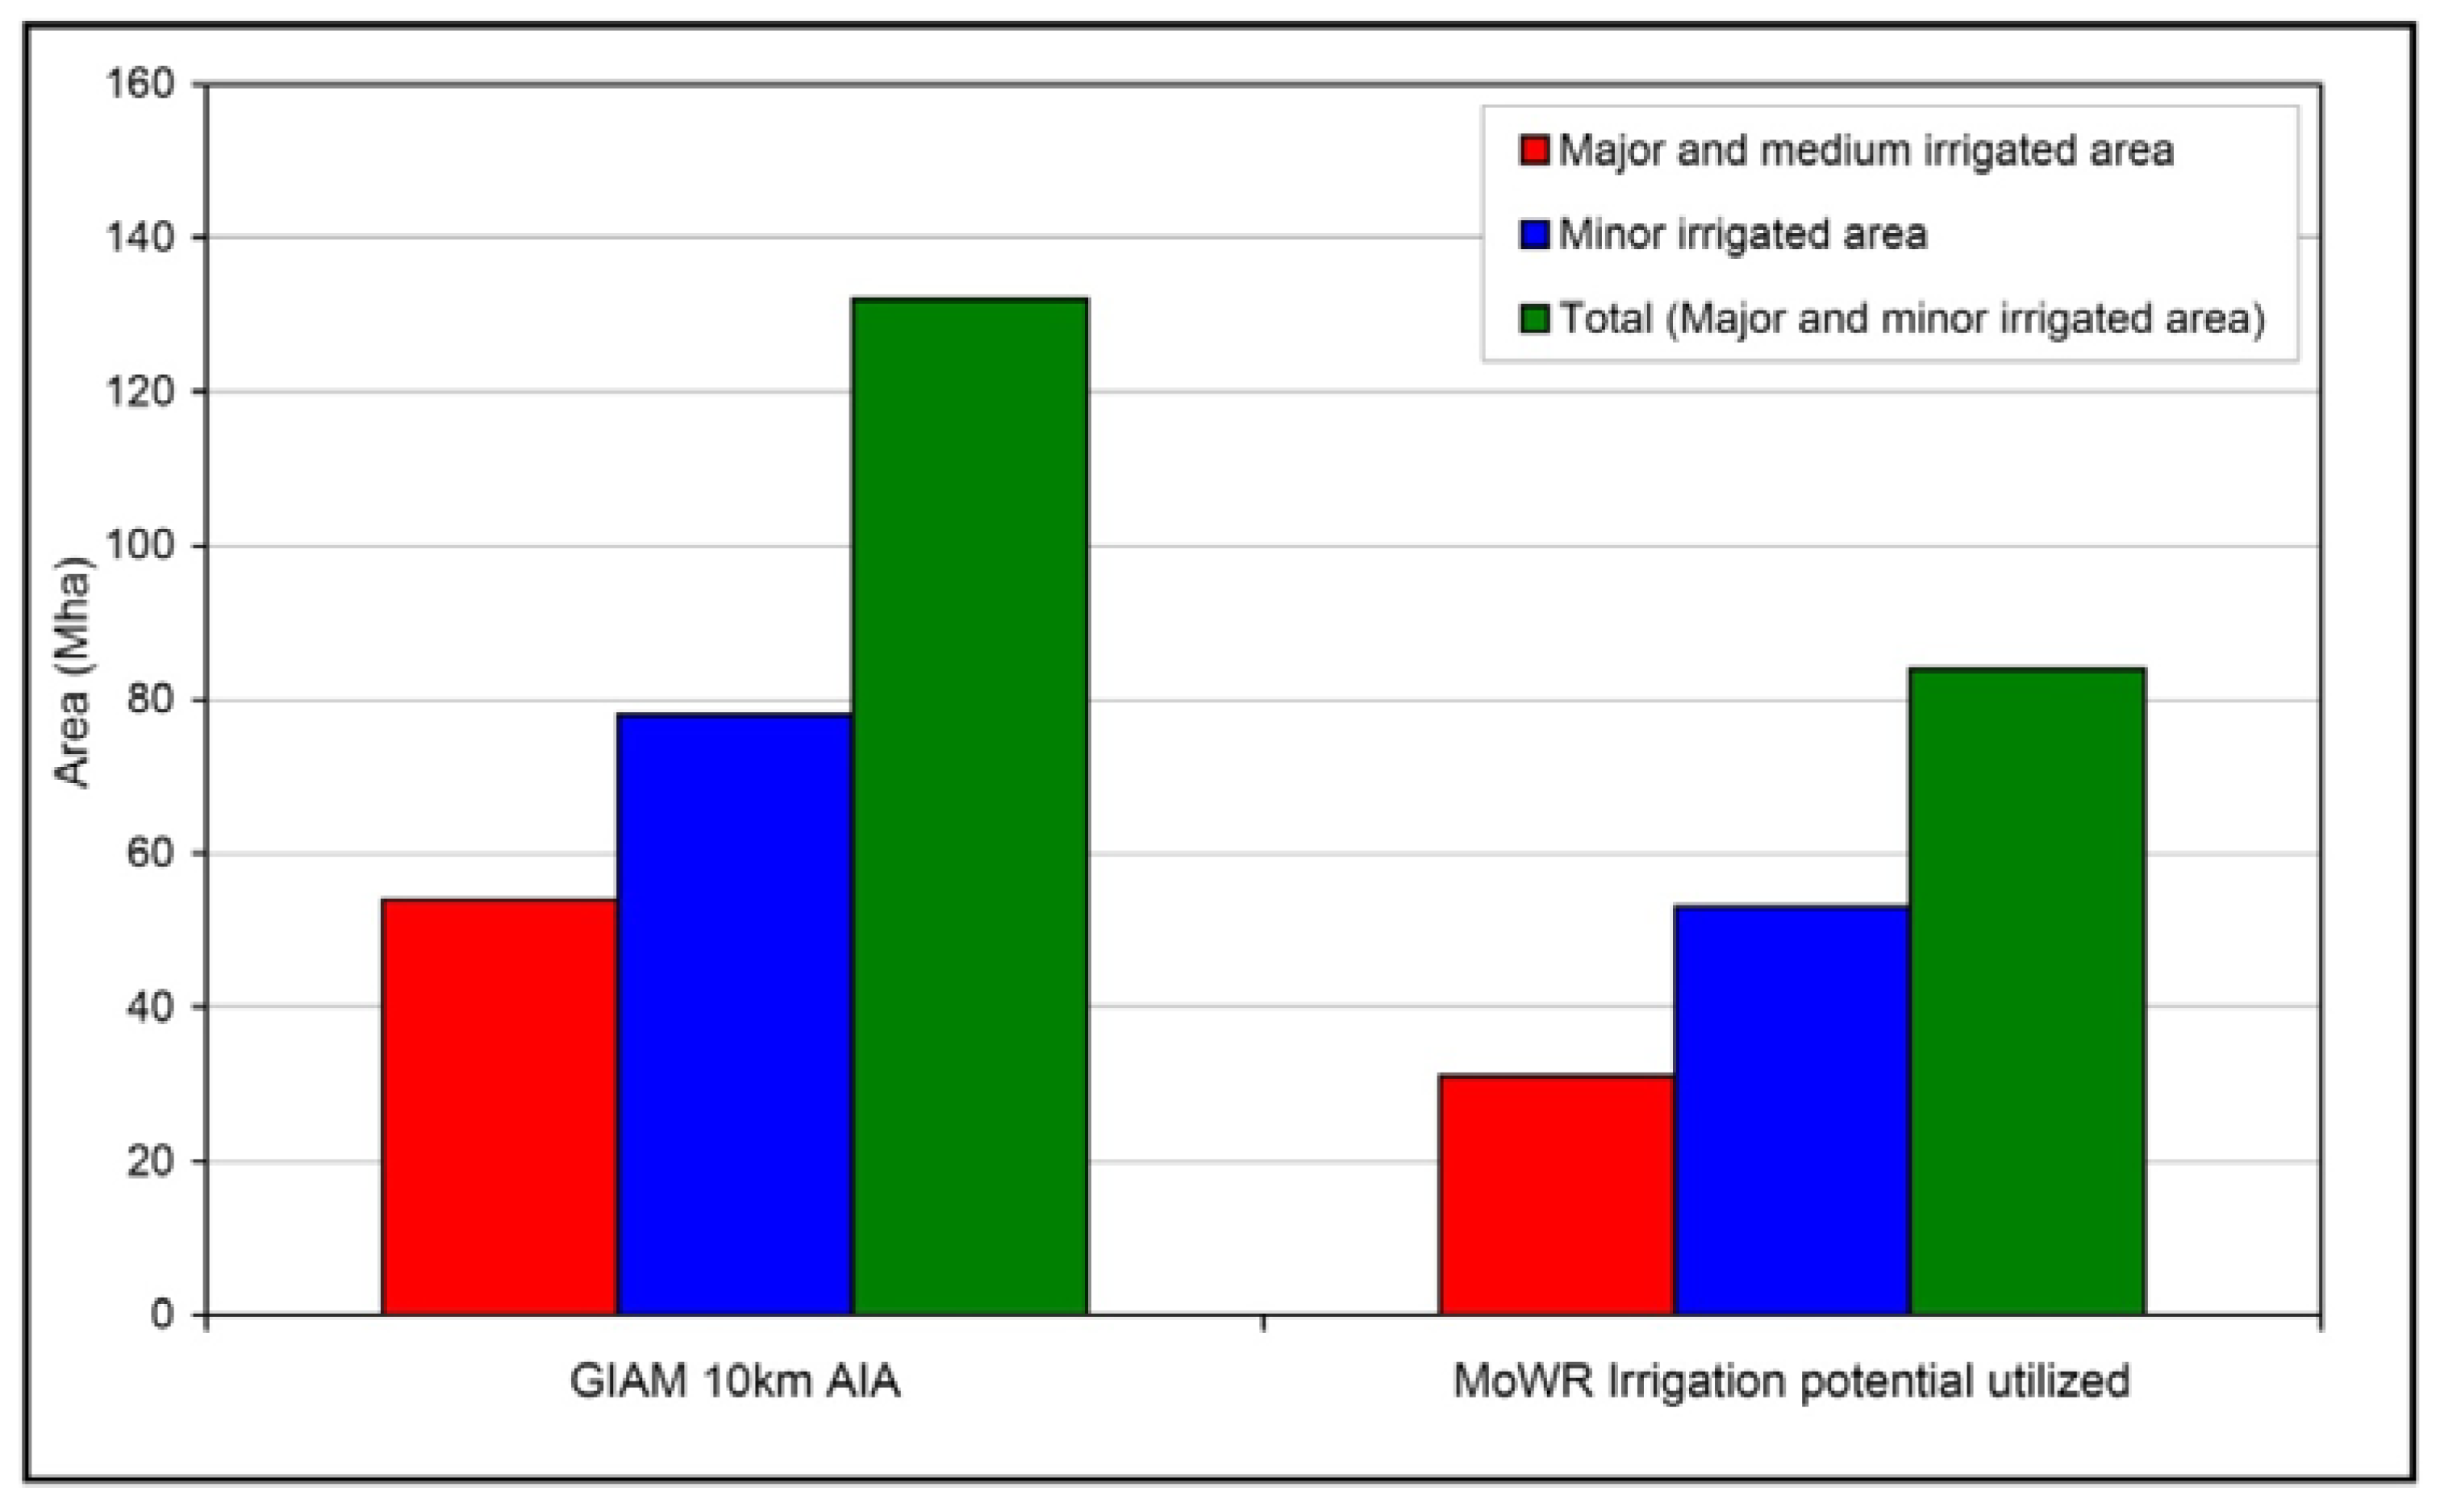
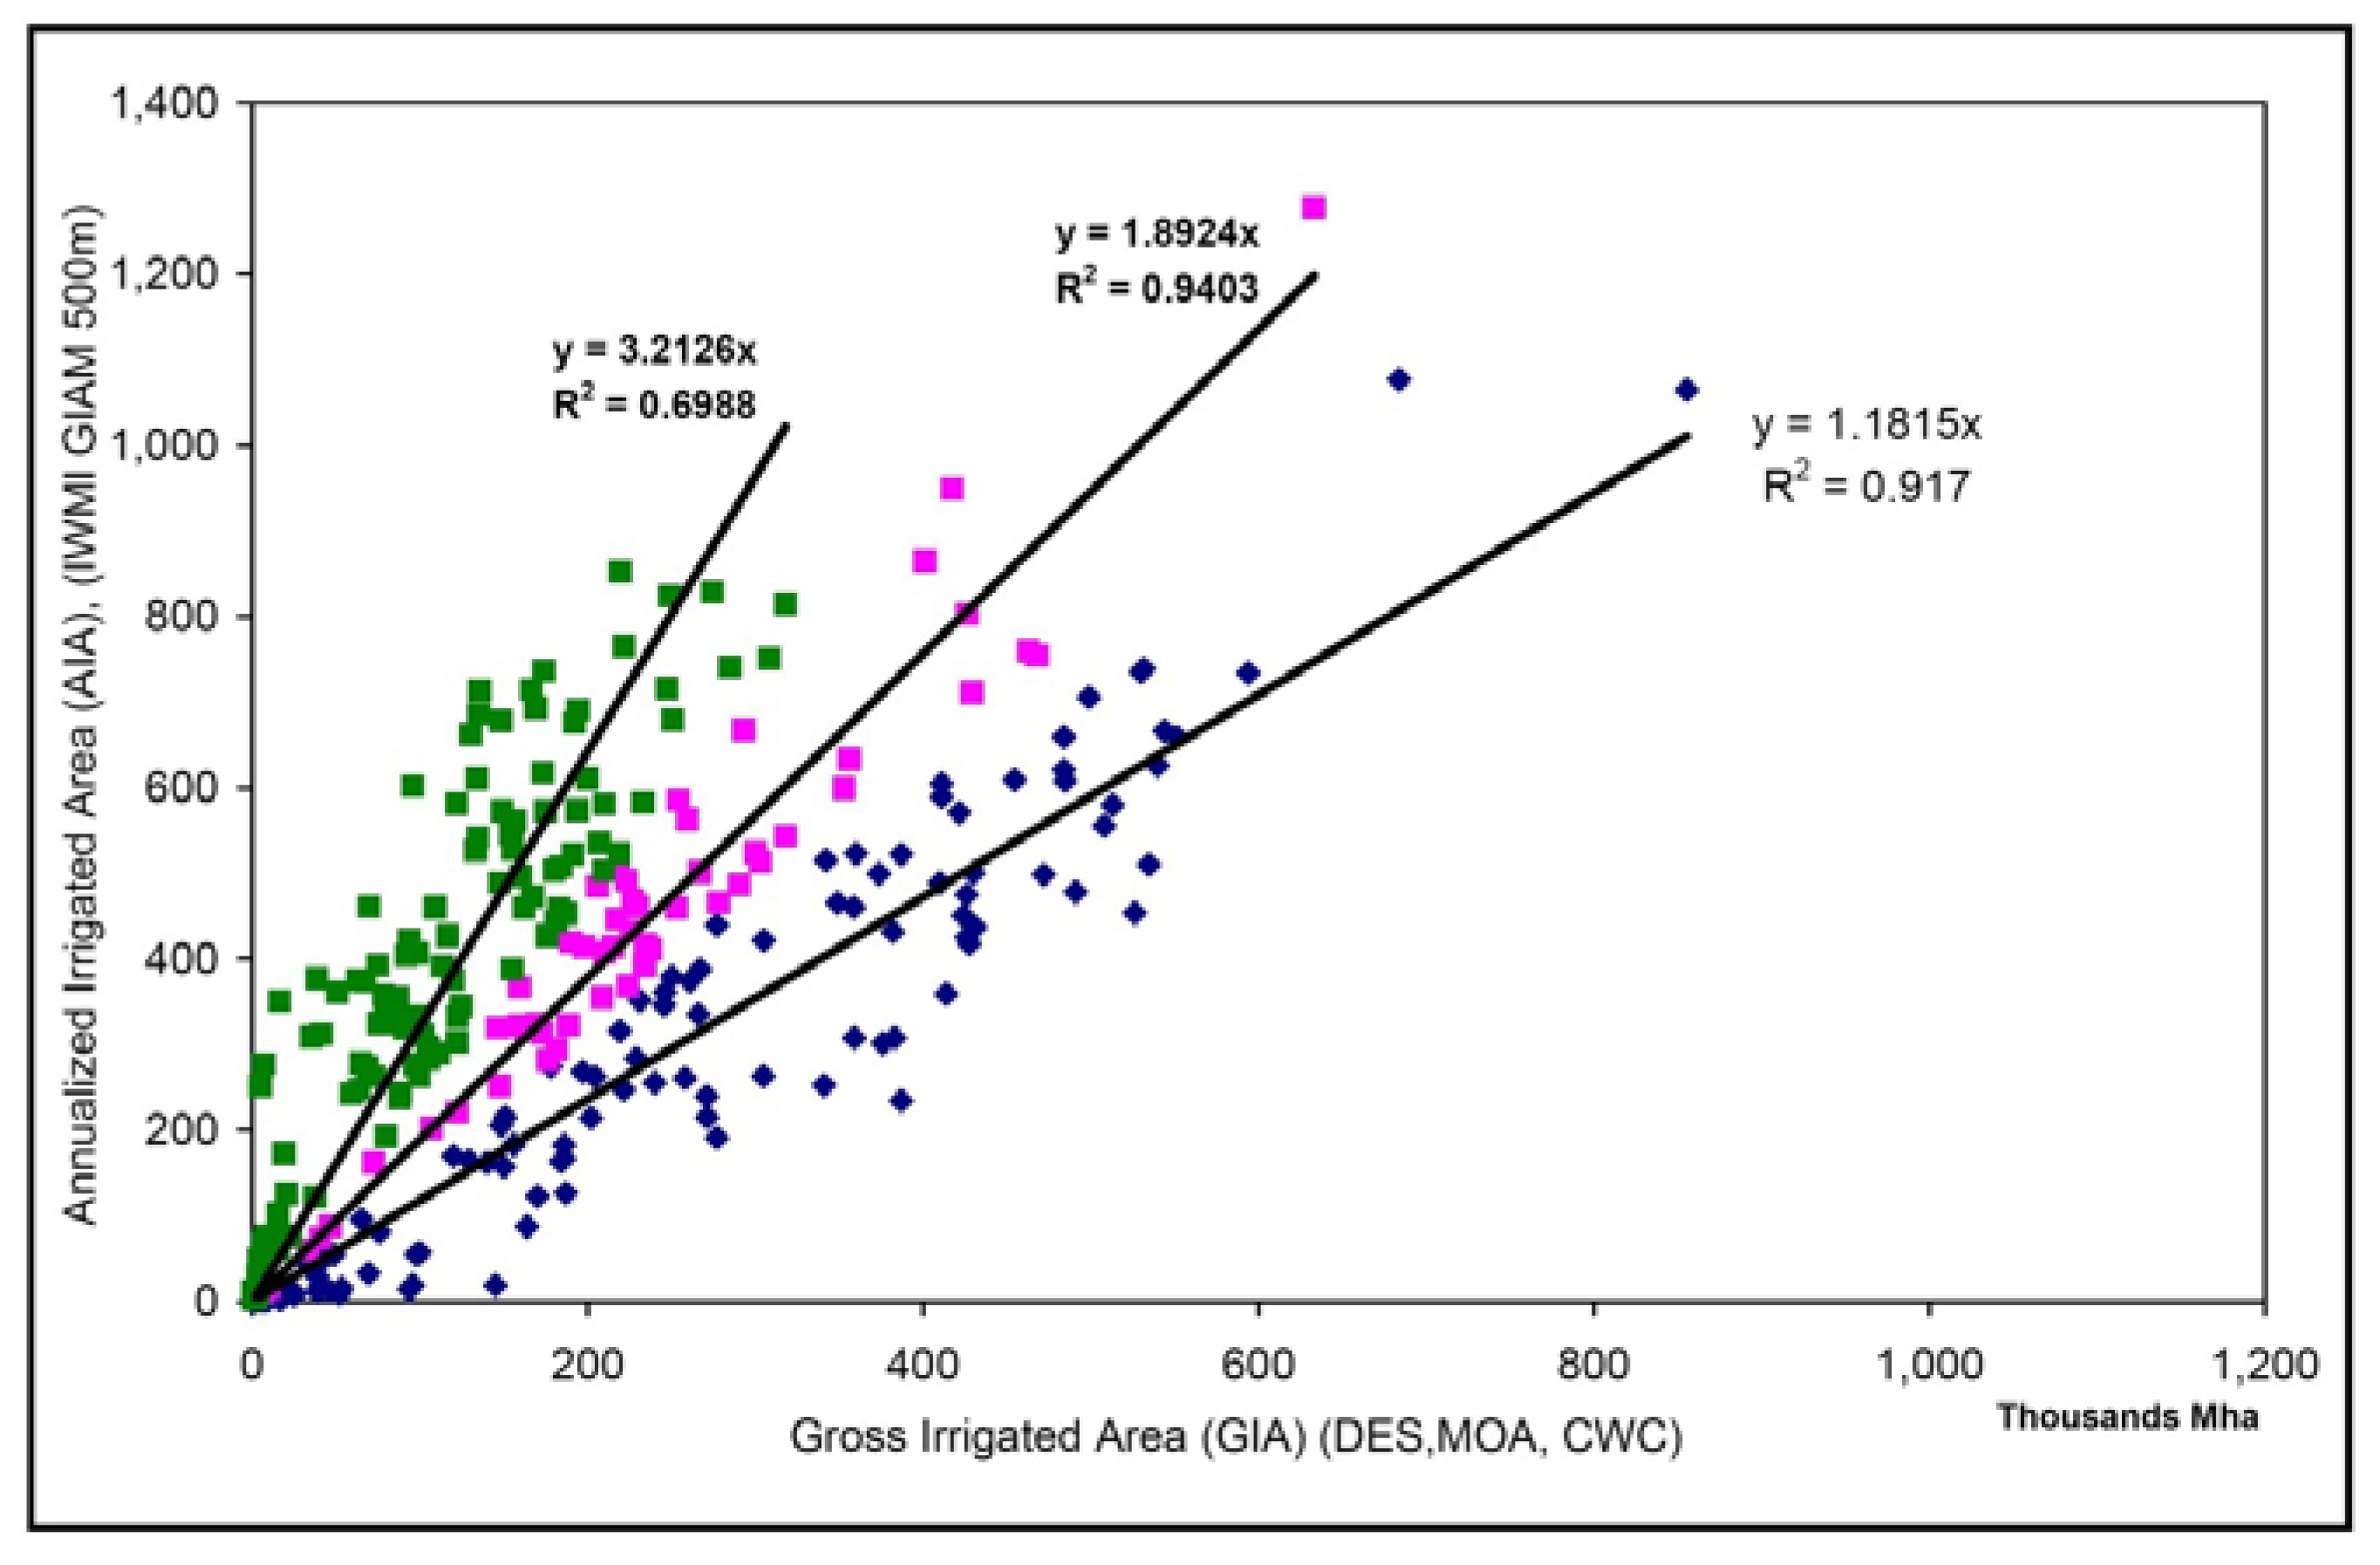
3.2. GIAM AIA and its comparison with MoWR IPU

The annualized irrigated areas (AIA) as per the GIAM 10 km were 132 Mha and GIAM 500-m was 146 Mha. In comparison, the gross irrigated area (GIA), equivalent of AIA, provided by the DES for AIA was reported as 78.7 Mha for the year 2001-02 [15]. Again, the differences between GIAM and the rest (DES and CBIP) are significant.
Figure 3. Actual irrigated areas derived using MODIS 500m data within the India’s Central Board of Irrigation and Power map [Reference 16].
Remotesensing 01 00050 g003
Figure 4. GIAM 10-km annualized irrigated areas (AIA) for India versus India’s Ministry of Water Resources (MoWR) derived irrigation potential utilized (IPU).
Remotesensing 01 00050 g004
The Ministry of Water Resources (MoWR) of India, recently released minor irrigation statistics for India [8,17]. As per these statistics, the irrigation potential utilized (IPU) from the major and the minor irrigation as on 2001-2002 was 84 Mha (Figure 4). Of the 83 Mha IPU, minor irrigation was 52 Mha (44 Mha ground water and tanks, 9 Mha small reservoirs) and major 31 Mha (MoWR, 2005). In contrast, GIAM 10-km shows AIA to be 132 Mha of which minor irrigation was 78 Mha and major 54 Mha (Figure 4). In contrast, GIAM 500-m shows AIA to be 146 Mha of which minor irrigation was 91 Mha and major 55 Mha (Figure 5).
Figure 5. GIAM 500-m annualized irrigated areas (AIA) for India versus India’s Ministry of Water Resources (MoWR) derived irrigation potential utilized (IPU).
Remotesensing 01 00050 g005

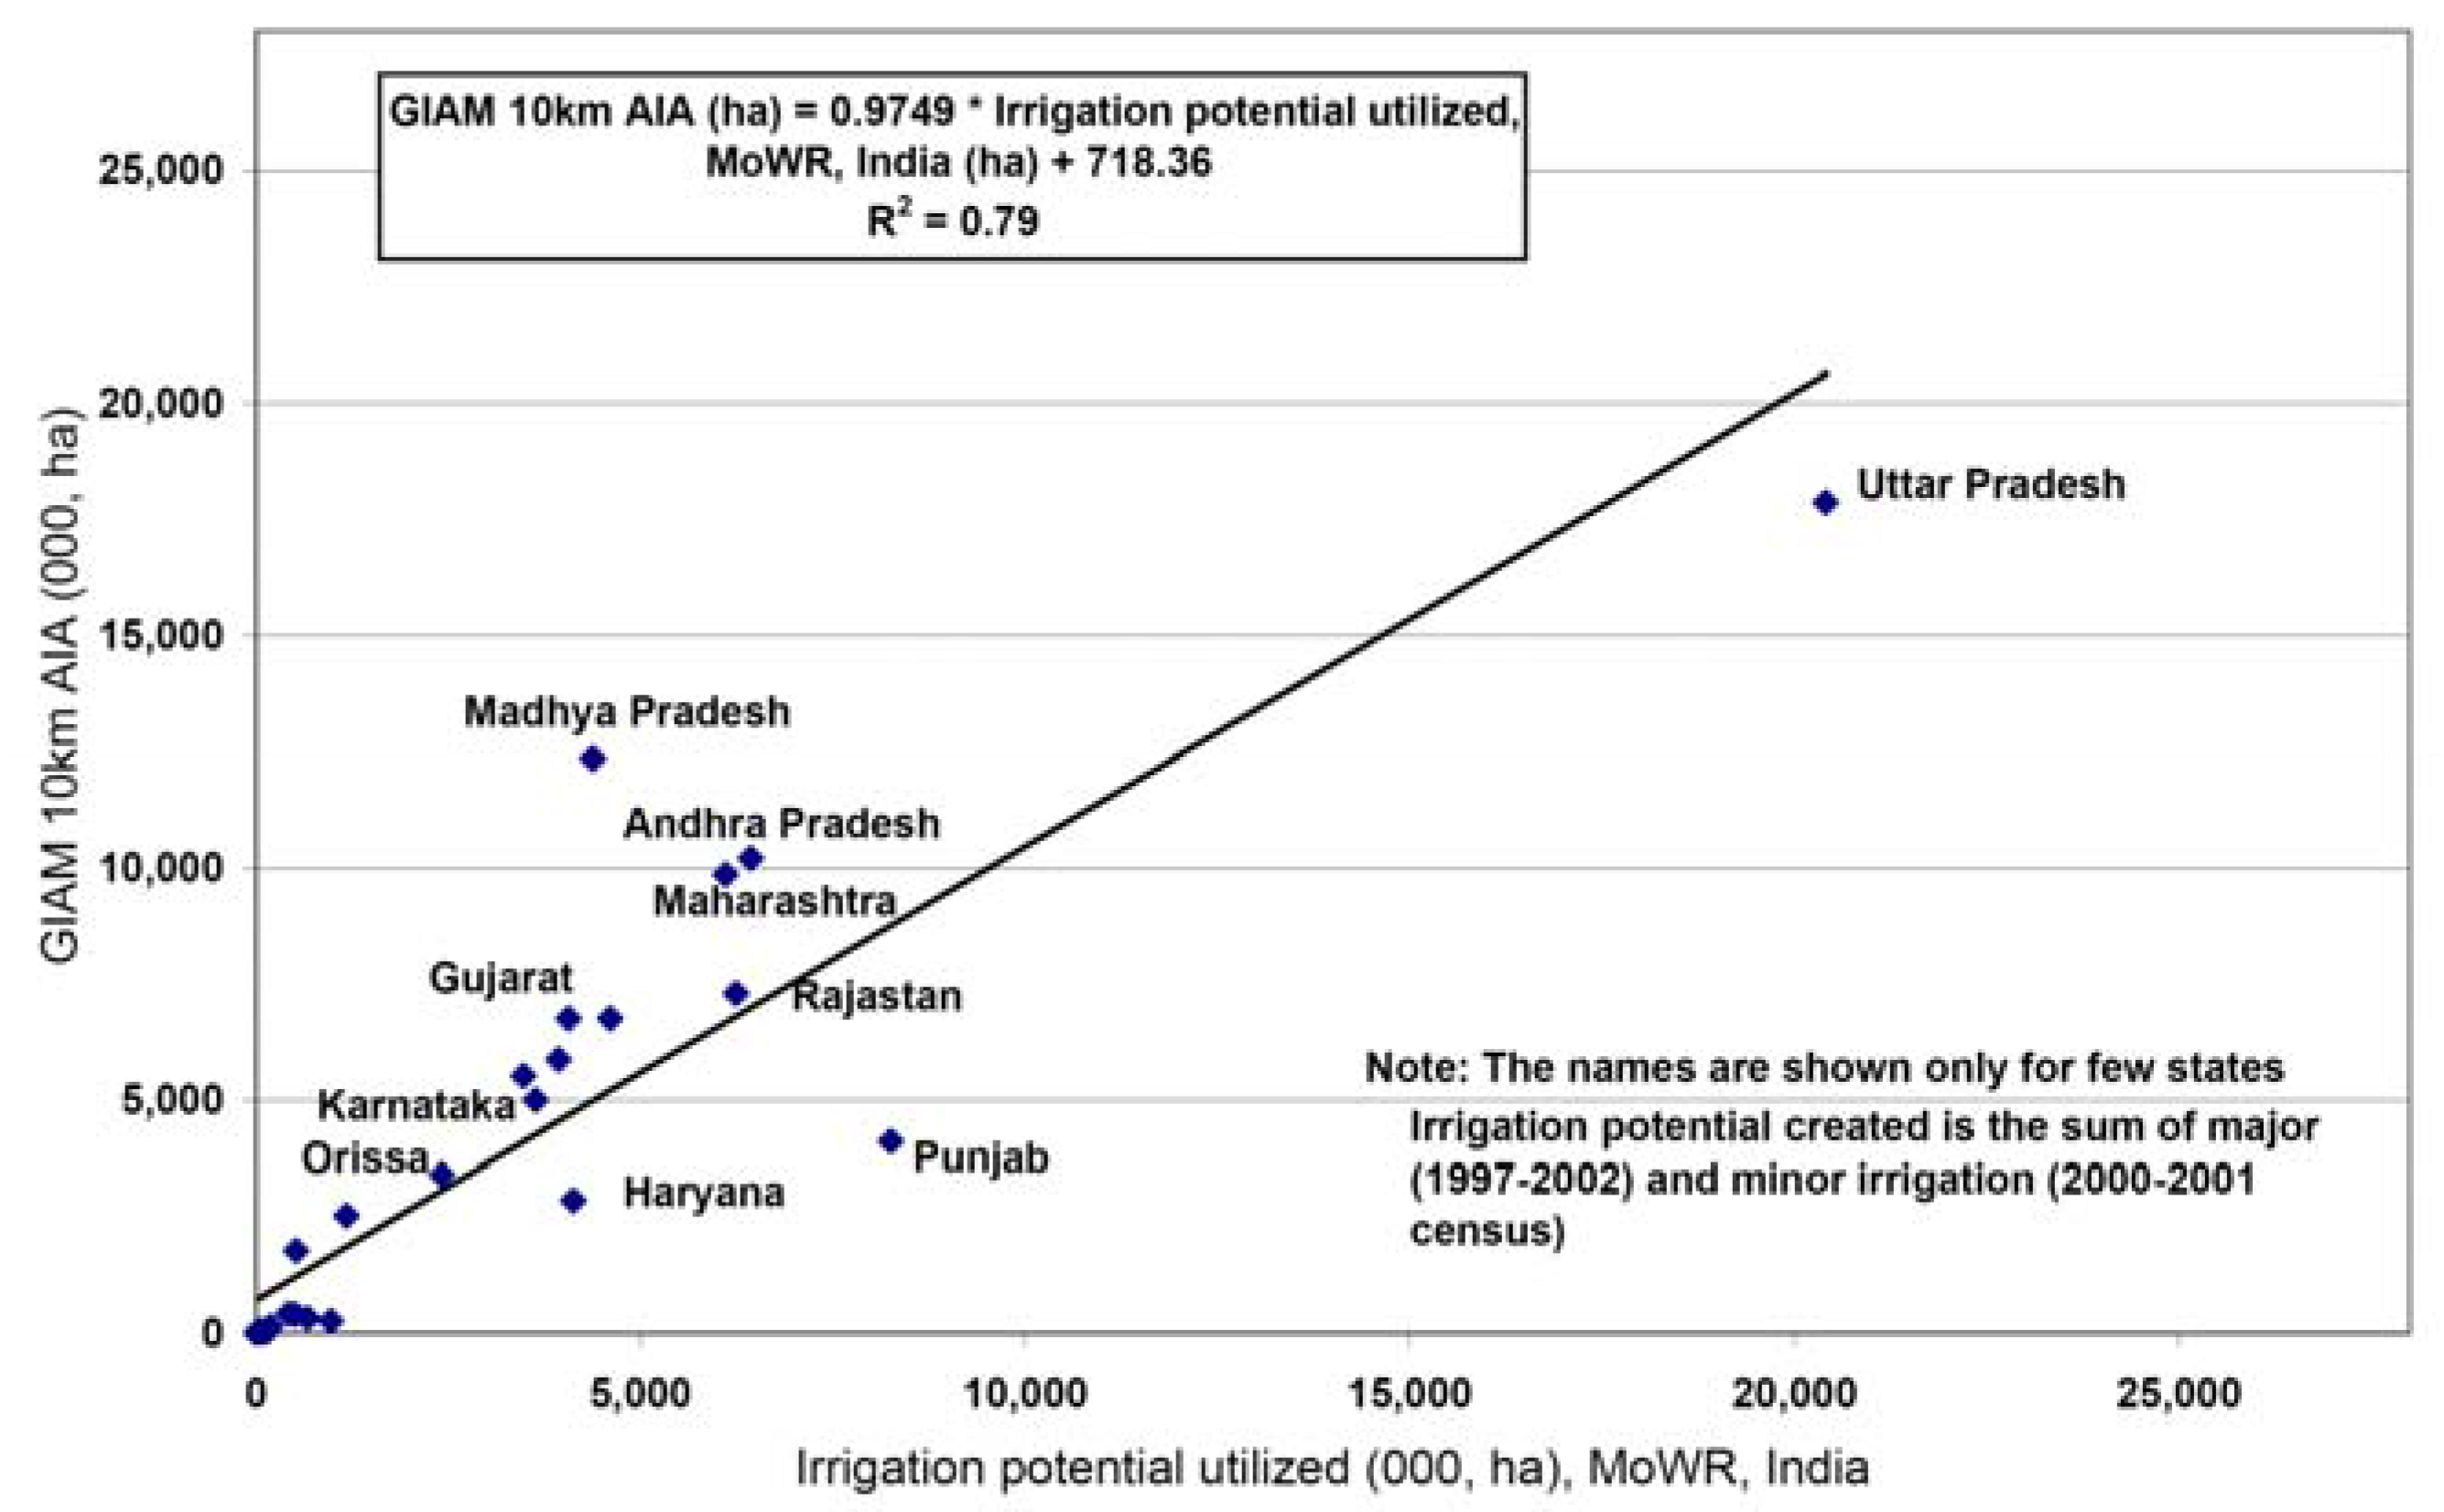
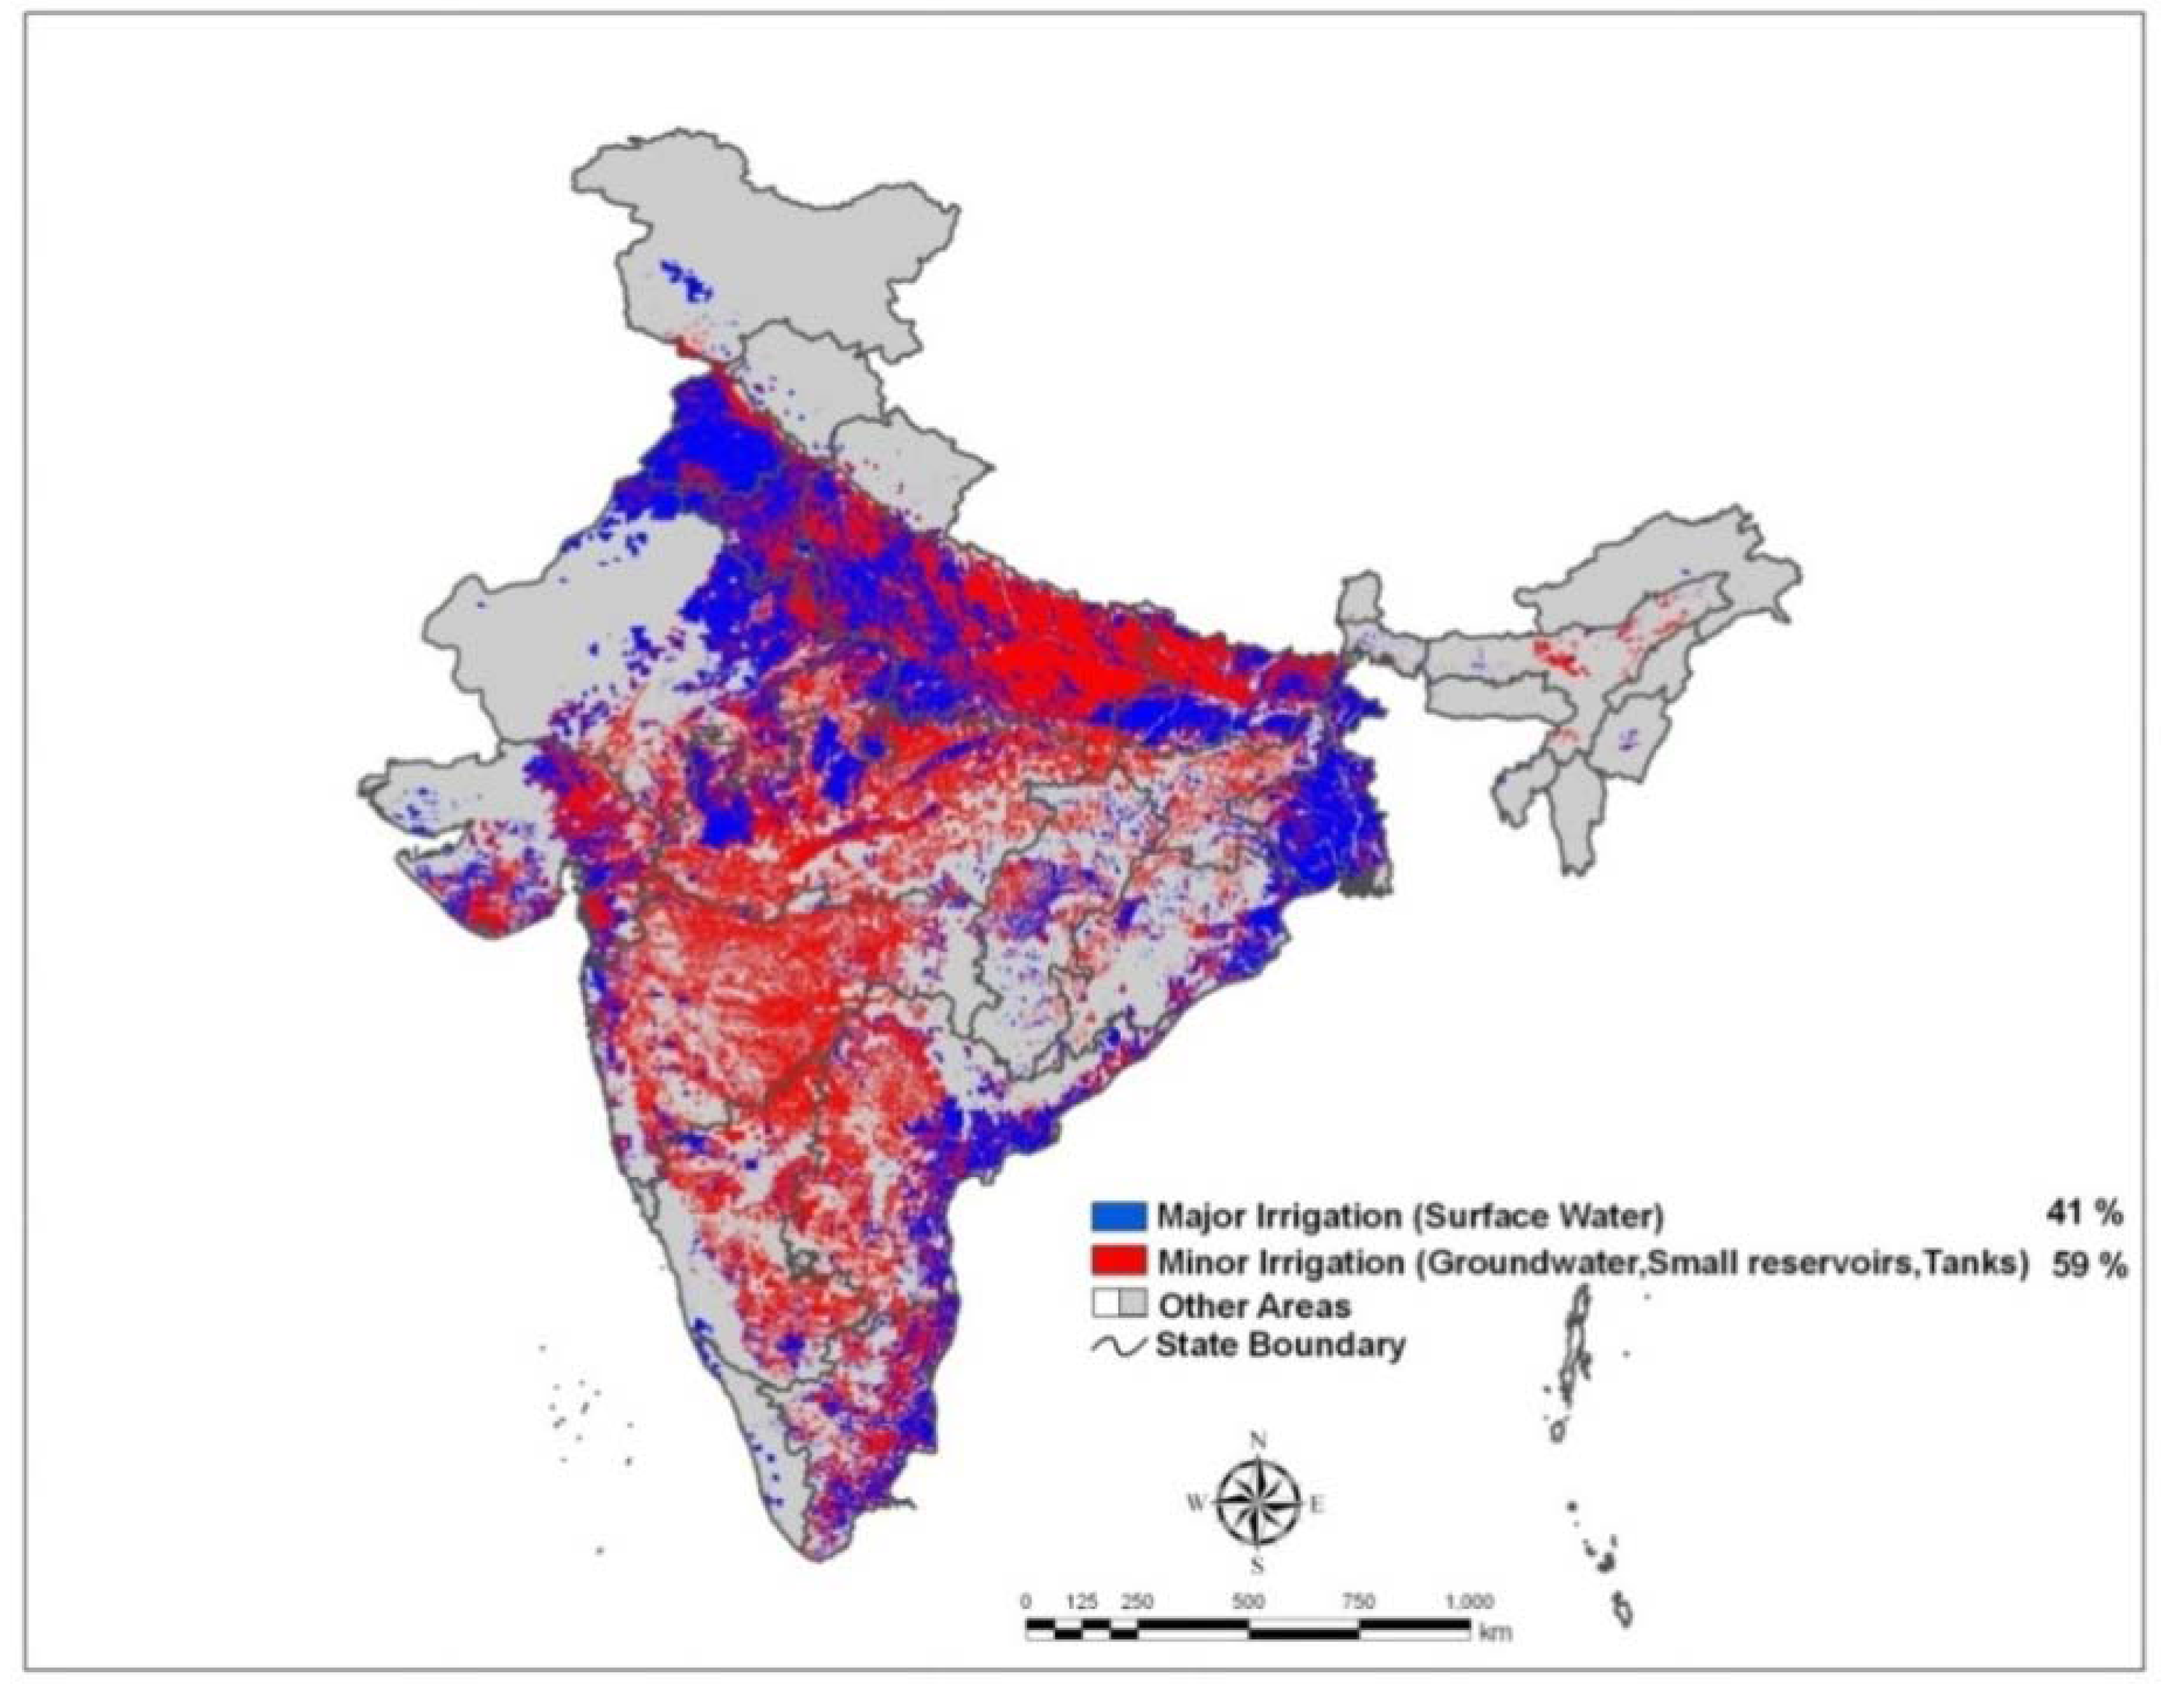
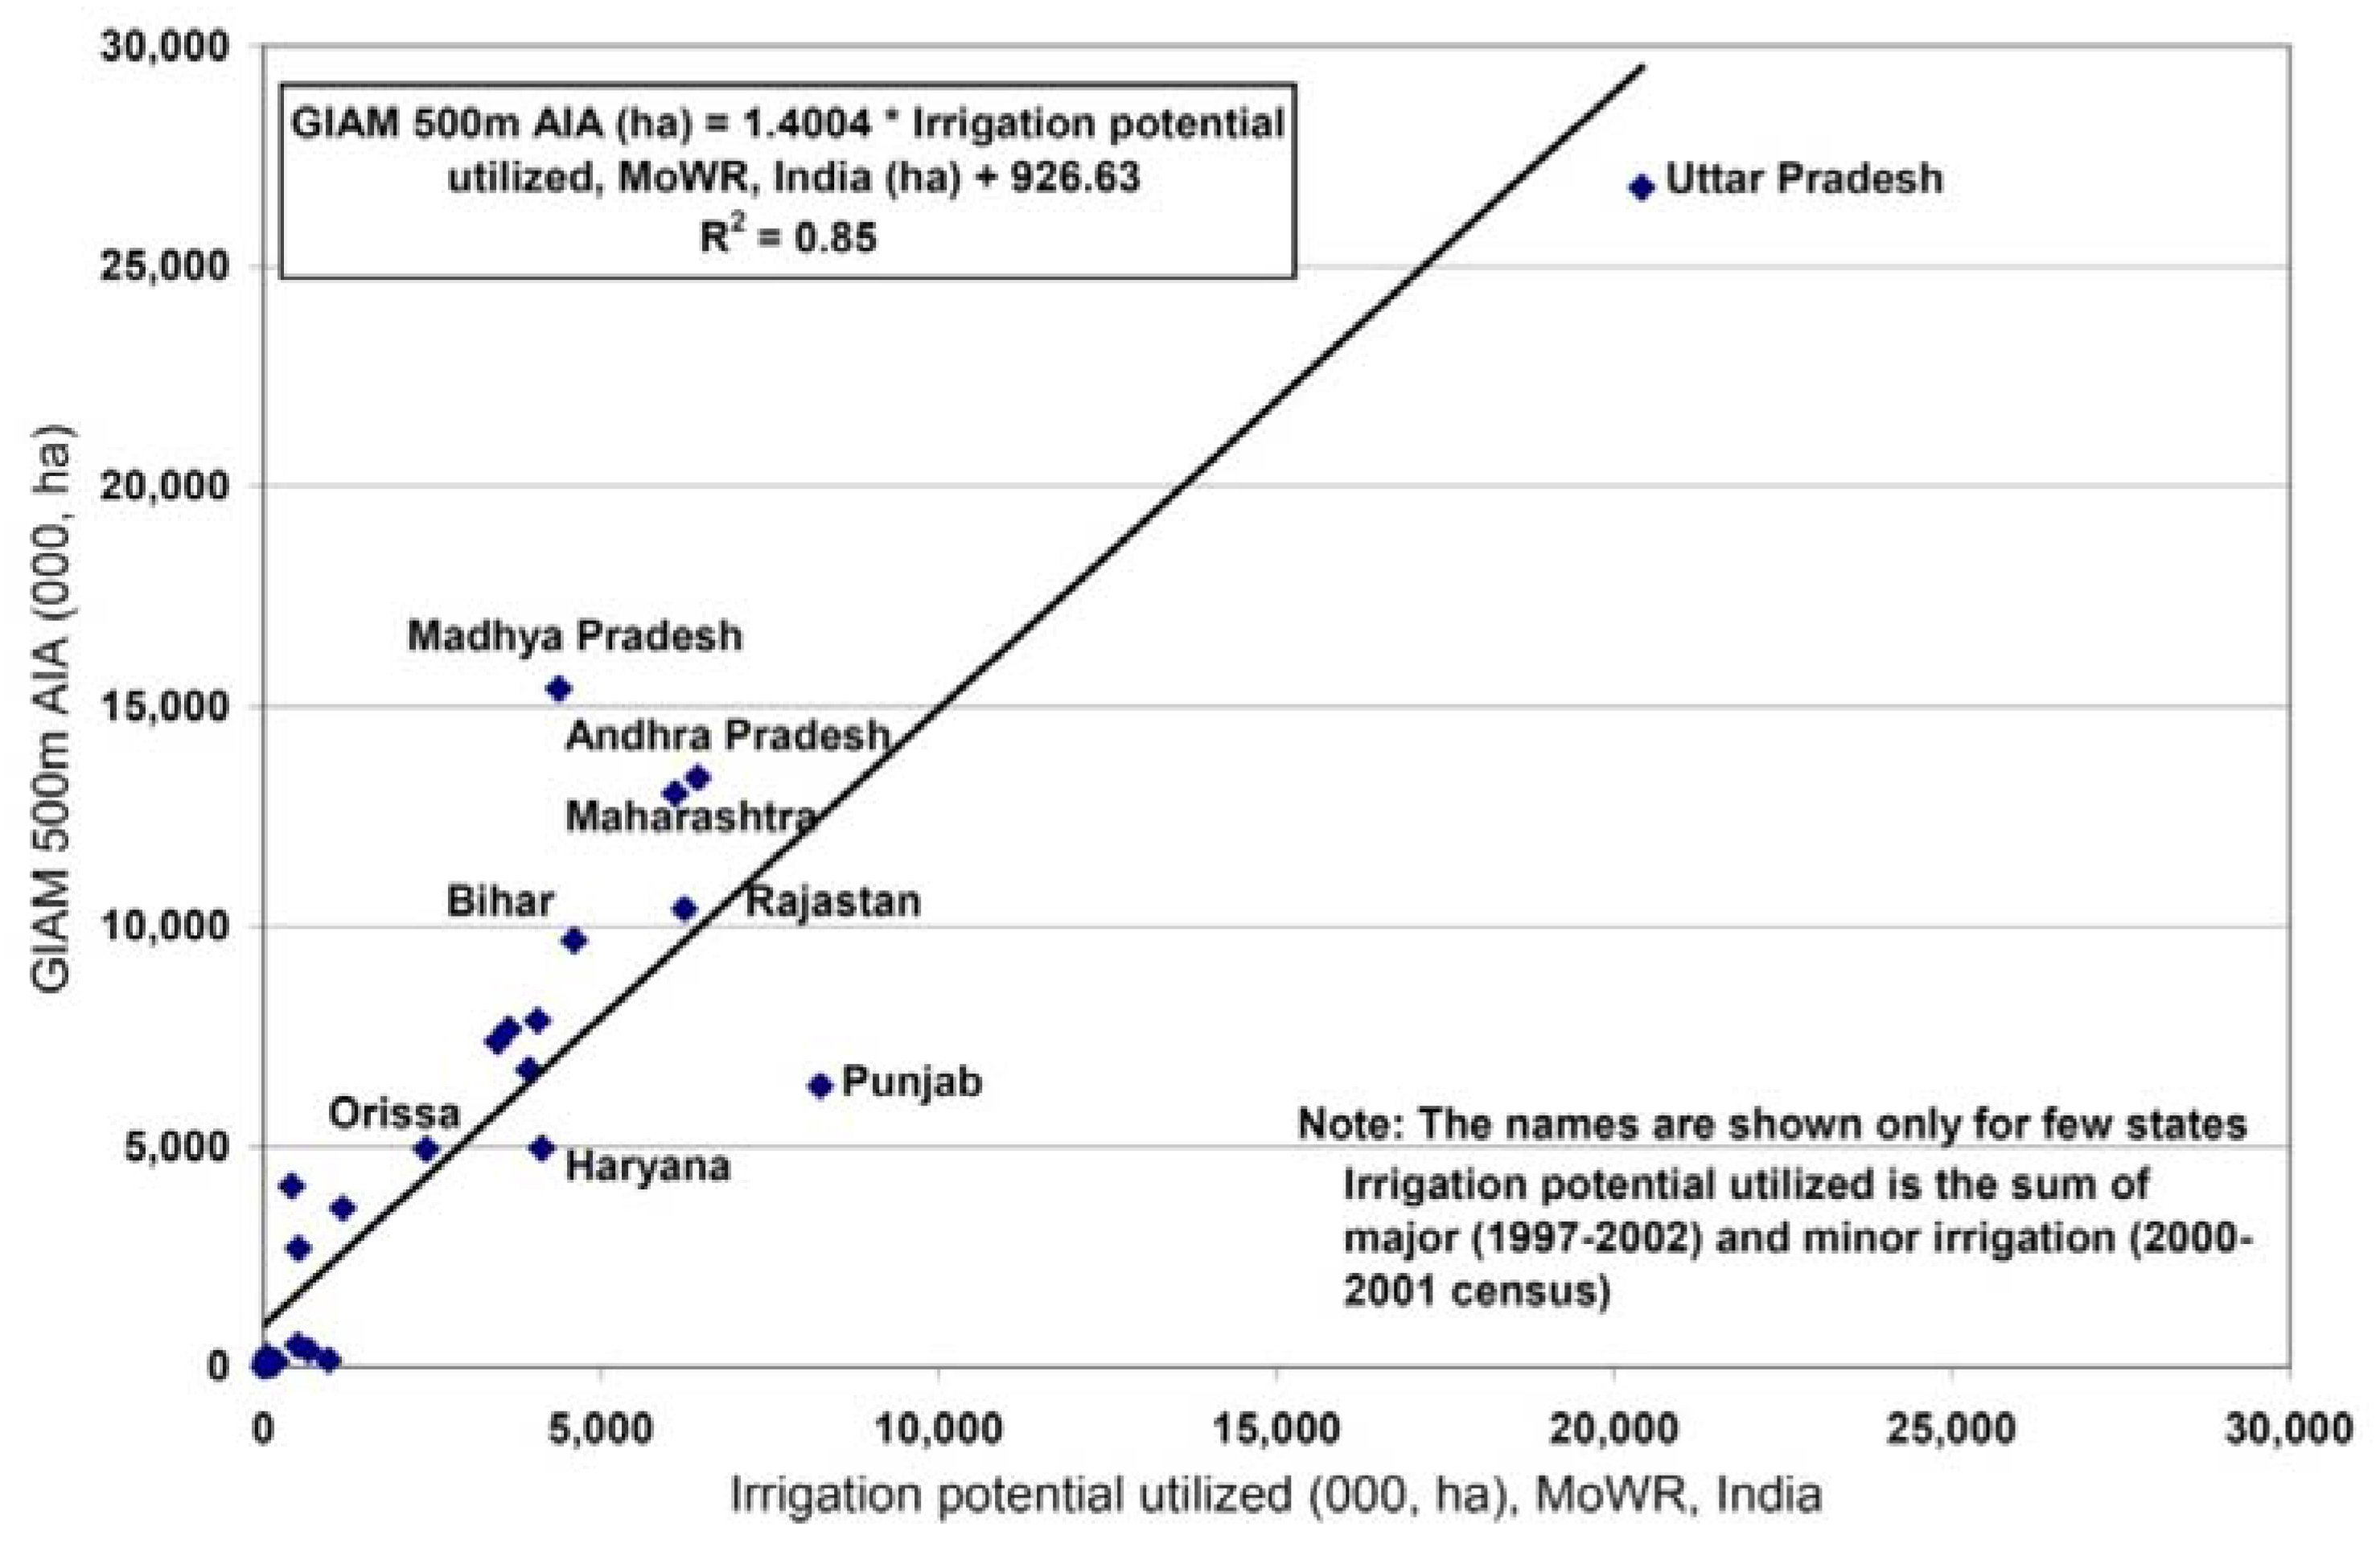
3.3. Comparison of state-wise GIAM irrigated areas with the MoWR and DES census

State-wise irrigated areas of India have been compared between the remote sensing derived GIAM statistics and India’s MoWR census statistics. The AIA of GIAM equivalent is IPU of MoWR. The AIA when compared with its equivalent IPU provided an R2 values of 0.79 for GIAM 10-km (Figure 6) and 0.85 for GIAM 500-m (Figure 7).
Figure 6. Irrigated areas of the Indian states. GIAM 10-km derived annualized irrigated areas (AIA) versus irrigation potential utilized (IPU) from India’s Ministry of Water Resources (MoWR).
Remotesensing 01 00050 g006
Figure 7. Irrigated areas of the Indian states. GIAM 500-m annualized irrigated areas (AIA) versus irrigation potential utilized (IPU) from India’s Ministry of Water Resources (MoWR).
Remotesensing 01 00050 g007
States such as Uttar Pradesh (Figure 6 and Figure 7; Table 1) where there is flat stretch of contiguous irrigated areas over large tracks of areas have excellent match between remotely sensed derived areas and census based areas. In states like Madhya Pradesh, Andhra Pradesh, and Maharashtra (Figure 6 and Figure 7; Table 1) there is high degree of fragmented minor irrigation from ground water, small reservoirs, and tanks leading to greater uncertainties in area estimations between two approaches.
The DES reports net irrigated area (NIA), an equivalent of TAAI, as 56.6 Mha and gross irrigated areas (GIA), an equivalent of AIA and IPU, as 78.8 Mha for the year 2001-02 [15]. The DES statistics are lower because they do not adequately account for the minor irrigation statistics, especially the irrigation from 20 million plus tube wells [7]. The district-wise irrigated area statistics for DES were available for 291 districts.
We used the GIA from DES for the 291 districts and compared them with GIAM AIA (Figure 8). The results showed that in 42 percent of the district’s there was near perfect match of areas (blue in Figure 8). These (blue in Figure 8) are districts with little or low levels of minor irrigation and are dominated by major irrigation. Once the minor irrigation becomes significant, the differences become higher. Investigating the rest of the districts (other than blue points in Figure 8), we were able to group the rest into two categories: (a) 19 percent of the districts, where GIAM was twice that of DES (magenta in Figure 8), and (b) 29 percent of the districts, where GIAM was thrice that of DES (green in Figure 8). These (magenta and green in Figure 8) are the districts where minor irrigation is highly significant.
Table 1. Irrigated areas of major states of India compared between remote sensing derived approaches and national statistics.
Remotesensing 01 00050 i001
Figure 8. District wise irrigated area statistics compared between GIAM 500m annualized irrigated areas (AIA’s) versus Directorate of Economics and Statistics of Ministry of Agriculture and Centre Water Commission gross irrigated areas (DES MOA, CWC, GIA).
Remotesensing 01 00050 g008

3.4. Causes of differences in irrigated areas between GIAM and Indian national statistics

There are several causes of differences in irrigated areas reported by remote sensing approach and the Indian National statistics. These differences are discussed in detail below:

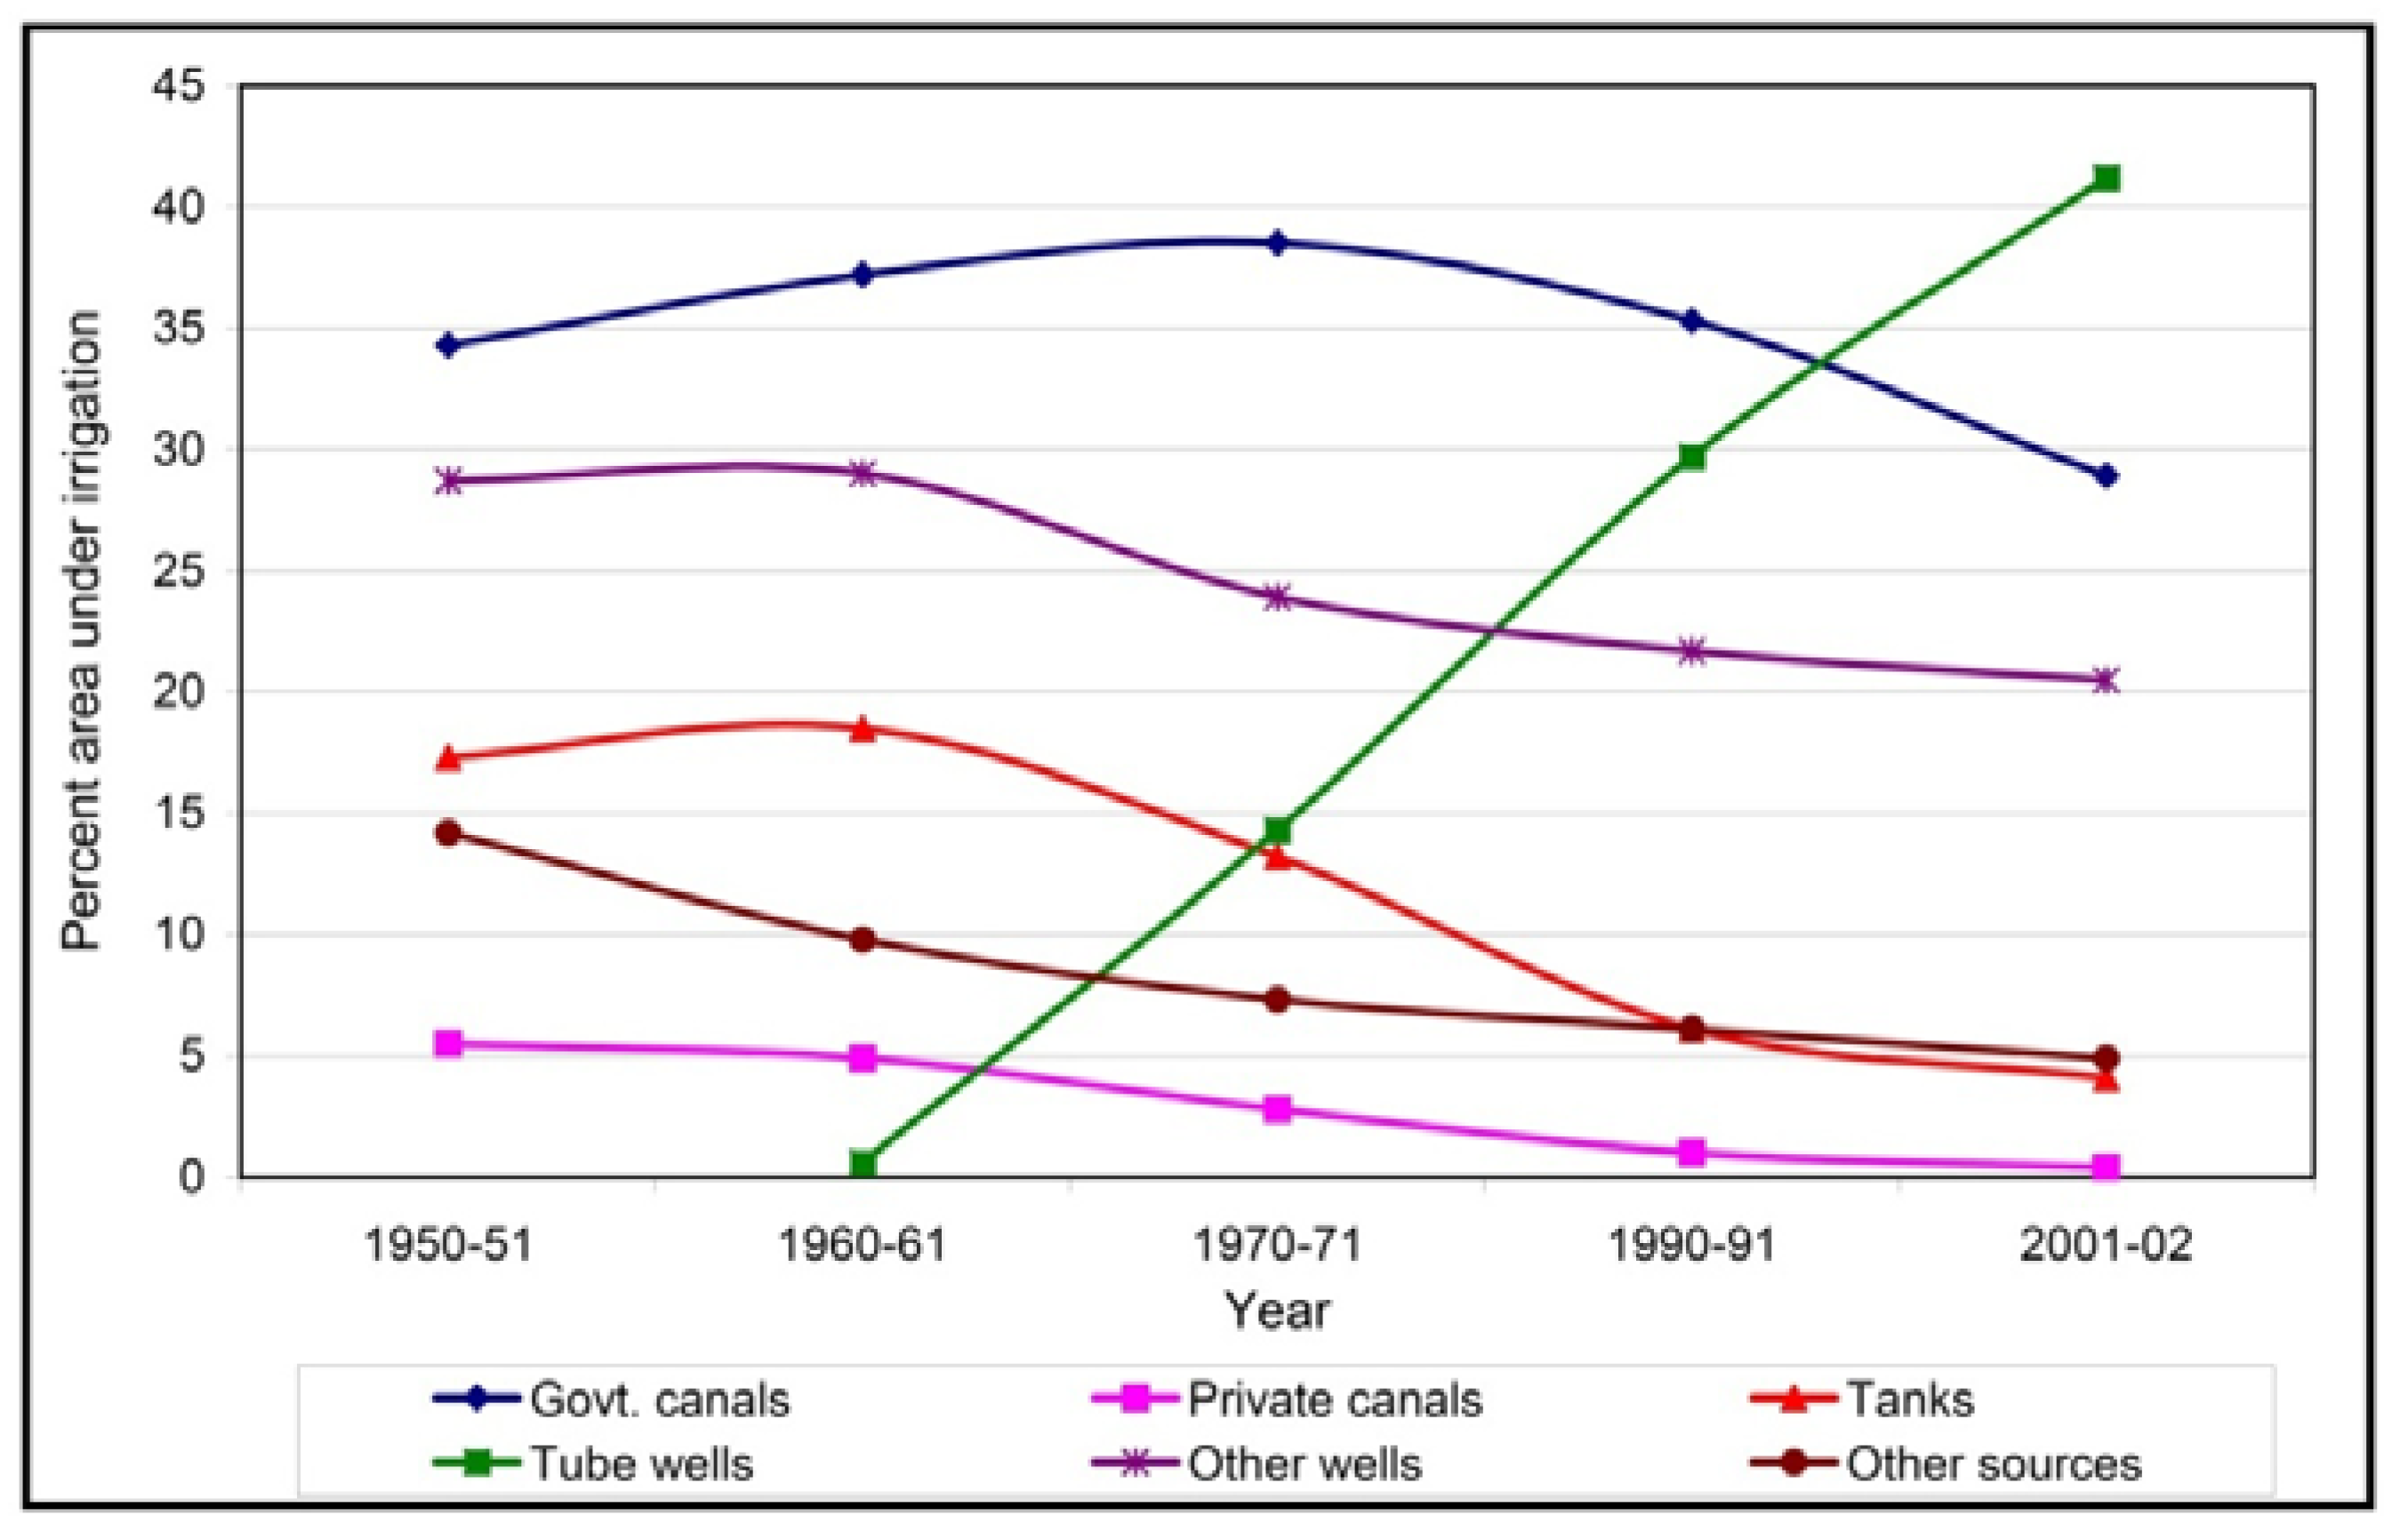
3.4.1 Inadequate accounting of irrigated areas in the National Statistics

There are sufficient indications that inadequate accounting of irrigated areas in the national statistics is one of the main causes of the differences. The causes include (http://mospi.nic.in/nscr/as.htm; see section 4.8 and its sub-sections): (a) reluctance on part of the states to furnish irrigated area data in view of their vested interests in sharing of water, and (b) reporting large volume of data with inadequate statistical analysis. This report admits that there is “large variation” between the statistics on irrigated areas reported even between two ministries (e.g., Directorate of Statistics of Ministry of Agriculture and Ministry of Water Resources) of the same national system.
Further, groundwater use for agriculture in India and China has developed so extensively and rapidly, that statistics may be little more than guesses [23]. Recent data indicates that the number of tube wells in India has gone up from about 100,000 in the early 1960s to anywhere between 19 to 26 million by early 2000 [7]. An overwhelming proportion of the tube-wells are used for irrigation. The national statistics also reports tube well irrigation to have gone up to about 42 percent of all irrigated areas in India (Figure 9).
Figure 9. Source of water irrigation. Sources of water used for irrigation in India from 1950-51 to 2001-02.
Remotesensing 01 00050 g009
However, the area irrigated by the 19 to 26 million tube-wells is quite often not accounted in statistics, as these are privately owned and government does not fully account for most of the wells. Even though we see that national statistics reporting total irrigated areas of India as 83 Mha (Table 1) even other non-remote sensing approaches have already indicated that the irrigated areas in India have already reached 100 Mha by the year 2000 [18]. Indeed, the overwhelming evidence show massive overexploitation of groundwater in most of India and in majority of areas potential is already exploited [7,19,20]. Further, the massive exploitation of surface water from small reservoirs and thousands of tanks is also a missing link [11]. In Krishna Basin alone (which occupies about 8% of India’s geographic area) the remote sensing based irrigated areas using Landsat 30 m showed at least twice the area reported in irrigation statistics [11]. One major factor for this was the 6,100 small reservoirs and tanks (Figure 10). These factors, clearly indicate the need to have more refined approaches of accounting for irrigated areas, rather than simple census based eye estimates.
Figure 10. Irrigation from 6,100 small reservoirs and tanks that irrigated about 52 percent of the irrigated areas in the basin. In comparison the 24 major and medium irrigation schemes irrigate 48 percent of the irrigated areas in the basin [Taken from reference 11].
Remotesensing 01 00050 g010

3.4.2. Resolution of the imagery

Significant differences in irrigated areas were found when mapped using imagery of different resolution [11]. The study [11] showed that lesser the spatial resolution (scale) of the imagery, higher was the area [11] - with the Krishna Basin irrigated area varying significantly from about 8 Mha when mapped using 10-km resolution imagery to 9.4 Mha at 30 m imagery. This was because at finer spatial resolution the fragmented minor irrigation are picked better than the coarser resolution imagery. In contrast, the national statistics reports the Krishna basin irrigated areas as 4 Mha [14] - only about 50% of the remote sensing approach. However, the detail study reported at 30 m [11, Figure 10] makes it clear that the national statistics is highly underestimating the area. Accurate remote sensing at finer resolution should allow unequivocal quantification of groundwater area, and provide a monitoring tool to reliably estimate net groundwater use [23].

3.4.3. Definition issues

Uncertainties in areas can be very significant as a result of definition issues. One example is how we define “supplemental irrigation”. If the definitions vary, then areas vary. In our study we define the “supplemental areas” as those where significant irrigation is required to sustain crop water requirements throughout the growing season. If the irrigation contributes to more than 50 percent of crop water requirements in the season, it is taken as “supplemental irrigated areas” [1]. This we determined by looking at the evapotranspiration (ET) and precipitation data taken from International Water Management Institute’s water and climate Atlas of the World (http://www.iwmi.cgiar.org/ WAtlas/Default.aspx). If long-term ET is less than long-term precipitation for 75 percent of the time over croplands, then these areas can sustain crop only through irrigation. This theory was also verified during groundtruth [1]. In many conventional statistics, these supplemental irrigated areas are accounted as rainfed. Thereby, one of the main reasons for the massive increase in irrigated areas in India seen in GIAM is as a result of the conversation a large proportion of previously used rainfed areas into irrigation through informal sources, especially, the 19 to 26 million tube wells contribute to this [7]. Also hidden are the large proportions of small reservoirs [Figure 10 and Figure 11]. For example, the Krishna river basin alone has 6,100 small tanks and small reservoirs that have same water spread area as the 24 major and medium irrigation systems in the basin (Figure 10).
Figure 11. The irrigated plus rain-fed cropland areas of India along with other land-use/land-cover (LULC) classes from the GIAM 10 km. Of the 330 Mha of geographic area, 101 Mha are irrigated, 49 Mha rain-fed and the rest other LULC.
Remotesensing 01 00050 g011
Of the 328.7 Mha of geographic area of India, 101 Mha are irrigated, 49 Mha rain-fed, and the rest other LULC. As a result, the total cropland areas in India were estimated at 150 Mha (46 percent of geographic area; Figure 11) in this study, which matches well with generally quoted figures of 43 percent for India in traditional statistics [21]. So the total cropland areas for India remain nearly the same between GIAM and traditional estimates. However, GIAM estimates for irrigated areas are significantly higher and rainfed significantly lower when compared with national statistics.
The GIAM estimates about 67 percent of India’s cropland as irrigated and the rest 33 percent rainfed. Accounting of minor irrigation and definition of “supplemental irrigation” are the two main causes for higher estimates in GIAM. As is clear from our detailed study in the Krishna Basin [11] the minor irrigation is accounted far better in GIAM remote sensing approaches. Further, it is important to account areas with significant “supplemental irrigation” under irrigated areas rather than under rainfed. Given these facts, the GIAM estimates need serious consideration. We would, however, recommend a more detailed study using 30m data in fusion with time-series MODIS 250/500 m data along with better understood definitions and reducing uncertainties in irrigated area fraction estimates to advance irrigated area mapping and water use estimates in the country.

3.4.4. Irrigated area factions (IAFs)

Coarse resolution imagery such as AVHRR and MODIS require sub-pixel area (SPA) computation techniques to obtain actual areas. The SPAs are computed by multiplying full pixel areas (FPAs) with irrigated area fractions (IAFs). This in turn would mean the accuracy of areas are dependent on accuracies with which irrigated area fractions (IAF) are determined. We adopted a robust method of computing IAFs [22]. Uncertainties in IAFs were kept to minimum by using 3 distinct methods and ensuring that the IAFs obtained from different methods do not differ by + 5%. Yet, as discussed in [22] there are uncertainties in computing IAFs. The best approach to overcome this would be use higher resolution imagery in conjunction with time-series coarser resolution imagery.

3.4.5. Improper computation of areas

If we look at the India’s Central Board of Irrigation and Power (CBIP) map (Figure 3), the total area irrigated is already 75 Mha. This no one can dispute as it is a simple calculation of areas from map provided by CBIP. Our detailed analysis of the areas within CBIP defined irrigated areas showed 18 percent of this total area is actually other land use land cover (LULC). This still retains 61.5 Mha as irrigated areas. The CBIP map only cover India’s major (>10,000 ha water spread area of reservoirs) and medium (>2000 ha < 10,000 ha) irrigation schemes and does not in any way account for thousands of small reservoirs and tanks outside CBIP areas. The overwhelming proportion of the 19-26 million tube-wells also fall outside the CBIP boundaries. So, it is quite obvious that if the areas irrigated within CBIP is itself 61.5 Mha or higher, the total irrigated area estimate of 83 Mha (Table 1) as estimated by MoWR is an under-estimate.

4. Conclusions

This paper compared remote sensing derived irrigated areas derived at two spatial resolution- AVHRR based 10-km and MODIS based 500-m, with National census derived statistics for India reported by traditional reporting systems by the India’s Ministry of Water Resources (MoWR) and Directorate of Economics and Statistics (DES) of Ministry of Agriculture (MOA). A state-wise comparison between remote sensing derived annualized irrigated areas (AIAs), which reports intensity of irrigation, when compared with its equivalent the irrigation potential utilized (IPU) reported by MoWR provided an R2 value of: (a) 0.79 with 10-km, and (b) 0.85 with 500-m. However, the GIAM satellite sensor derived areas were, in most cases, significantly higher than MoWR and DES derived areas.
Overall, the remote sensing based total area available for irrigation (TAAI), which does not consider intensity of irrigation, for nominal year 2000 for India was 101 Mha derived from 10-km and 113 Mha derived from 500-m. Of these areas, about 40 percent was from major irrigation (surface water) and the rest 60 percent from minor irrigation (ground water, small reservoirs, and tanks). The GIAM derived annualized irrigated areas (AIAs), which considers intensity of irrigation, was 132 Mha based on 10-km and 146 Mha based on 500-m. In contrast the Ministry of Water Resources (MoWR) derived estimates showed IPU as 84 Mha of which 31 Mha was from the major irrigation and 53 Mha was from minor irrigation.
There are large variations in irrigated area statistics: (a) even between 2 ministries within India, and (b) between remote sensing approaches and census-based statistical approaches. Generally, most studies agree that about 50% (about 164 Mha) of India’s geographic area (328.7 Mha) are croplands around year 2000. However, most studies disagree on the irrigated to rainfed cropland proportions. The traditional national statistics report net irrigated areas (NIAs), which does not consider intensity of irrigation, as about 56 Mha. There is no strict equivalent of this in GIAM. However, TAAI which considers net irrigated areas plus irrigated fallows comes close. The GIAM TAAI are 101 Mha (at 10 km) and 113 Mha (at 500m). GIAM reports net rainfed croplands as nearly 50 Mha, taking the total croplands to 150 Mha (10 km) and 163 Mha (500 m). These figures match very well with widely reported cropland areas of India. Further, the traditional statistical reports on gross irrigated area (GIA) or irrigated potential utilized (IPU), both of which consider intensity of irrigation, vary between 76-83 Mha for India. The equivalent of this in GIAM is AIA. The AIAs, 132 Mha (10 km) and 146 Mha (500m), are much higher than GIA and IPU. The causes of uncertainties are listed in the abstract.

Acknowledgements

Authors are very grateful to Prof. Frank Rijsberman, former DG, IWMI, for great support for GIAM project. Authors also thankful to Indian Council of Agricultural Research (ICAR), India for encouraging an India-focused GIAM work. The encouragement of Director, National Bureau of Soil Survey & Land Use Planning (NBSS&LUP) is greatly acknowledged. The support of staff at IWMI (Delhi office) has greatly acknowledged. The help and suggestions received from Mr. Upali Amarasinghe (IWMI) in preparation of manuscript are much appreciated. Authors would like to thank the 2 anonymous reviewers for providing very helpful and positive comments that certainly improved the quality of this paper. The manuscript is not internally reviewed by USGS, so in no way does the views expressed in the paper can be attributed to USGS.

References and Notes

  1. Thenkabail, P.S.; Biradar, C.M.; Noojipady, P.; Dheeravath, V.; Li, Y.J.; Velpuri, M.; Reddy, G.P.O.; Cai, X.L.; Krishna, M.G. A Global Irrigated Area Map (GIAM) Using Remote Sensing at the End of the Last Millennium. Int. J. Remote Sens. 2009, (in press). [Google Scholar]
  2. Siebert, S.; Hoogeveen, J.; Frenken, K. Irrigation in Africa, Europe and Latin America - Update of the digital global map of irrigation areas to version 4. In Frankfurt Hydrology Paper 05; Institute of Physical Geography, University of Frankfurt, Frankfurt am Main, Germany and Food and Agriculture Organization of the United Nations: Rome, Italy, 2006. [Google Scholar]
  3. Siebert, S.; Döll, P.; Hoogeveen, J.; Faurès, J-M.; Frenken, K.; Feick, S. Development and validation of the global map of irrigation areas. Hydrol. Earth Syst. Sci. 2005, 9, 535–547. [Google Scholar] [CrossRef]
  4. IWMI. Available online: http://www.iwmigiam.org (accessed on December 12, 2008).
  5. FAO. Available online: http://www.fao.org/AG/agL/aglw /aquastat/main/index.stm (accessed on December 15, 2008).
  6. Dheeravath, V.; Thenkabail, P.S.; Chandrakantha, G.; Noojipady, P.; Biradar, C.M.; Turral, H.; Reddy, G.P.O.; Velpuri, M. Irrigated Areas of India derived using MODIS 500 m data for years the 2001-2003. ISPRS J. Photogram. Remote Sens. 2009. (submitted). [Google Scholar]
  7. Endersbee, L. A voyage of discovery: A history of ideas about the earth, with a new understanding of the global resources of water and petroleum, and the problems of climate change. Monash University Bookshop: Frankston, Victoria, Australia, 2005. [Google Scholar]
  8. MoWR (Ministry of Water Resources). 3rd Census of Minor Irrigation Schemes (2000-01); Ministry of Water Resources: New Delhi, India, 2005.
  9. Thenkabail, P.S.; Biradar, C.M.; Turral, H.; Noojipady, P.; Li, Y.J.; Vithanage, J.; Dheeravath, V.; Velpuri, M.; Schull, M.; Cai, X. L.; Dutta, R. An Irrigated Area Map of the World (1999) derived from Remote Sensing. Research Report # 105; International Water Management Institute: Colombo, Lanka, 2006; p. 74. Available online: http://www.iwmigiam.org.
  10. Biradar, C.M.; Thenkabail, P.S.; Noojipady, P.; Yuanjie, L.; Dheeravath, V.; Velpuri, M.; Turral, H.; Gumma, M.K.; Reddy, O.G.P.; Xueliang, L.C.; Schull, M.A.; Alankara, R.D.; Gunasinghe, S.; Mohideen, S.; Xiao, X. A global map of rainfed cropland areas (GMRCA) at the end of last millennium using remote sensing. Int. J. Appl. Earth Obs. Geoinf. 2009, 11, 114–129. [Google Scholar] [CrossRef]
  11. Velpuri, M.; Thenkabail, P.S.; Gumma, M.; Biradar, C.M.; Dheeravath, V.; Noojipady, P.; Yuanjie, L. Influence of Resolution or Scale in Irrigated Area Mapping and Area Estimations. Photogram. Eng. Remote Sens. 2007. (accepted). [Google Scholar]
  12. Thenkabail, P.S.; GangadharaRao, P.; Biggs, T.; Krishna, M.; Turral, H. Spectral Matching Techniques to Determine Historical Land use/Land cover (LULC) and Irrigated Areas using Time-series AVHRR Pathfinder Datasets in the Krishna River Basin, India. Photogramm. Eng. Remote Sensing. 2007, 73, 1029–1040. [Google Scholar]
  13. Thenkabail, P.S.; Schull, M.; Turral, H. Ganges and Indus river basin land use/land cover (LULC) and irrigated area mapping using continuous streams of MODIS data. Remote Sens. Environ. 2005, 95, 317–341. [Google Scholar] [CrossRef]
  14. Biggs, T.; Thenkabail, P.S.; Krishna, M.; GangadharaRao, P.; Turral, H. Vegetation phenology and irrigated area mapping using combined MODIS time series, ground surveys, and agricultural census data in Krishna River Basin, India. Int. J. Remote Sens. 2006, 27, 4245–4266. [Google Scholar] [CrossRef]
  15. Agricultural Statistics at a Glance, Directorate of Economics and Statistics.; Department of Agriculture and Co-operation, Ministry of Agriculture, Government of India: India, 2008.
  16. CBIP (Central Board of Irrigation and Power). Central Board of Irrigation and Power irrigated area map of India for 1994; CBIP.17. MOWR: New Delhi, India. Available online: http://mowr.gov.in/micensus/mi3census/index.htm.
  17. Sinha, S. Rs 24,500cr plan for harvesting rainwater. Times of India, January 6 2003. [Google Scholar]
  18. Shah, T.; Singh, O.P.; Mukherjee, A. Groundwater irrigation and South Asian agriculture: Empirical analyses from a large-scale survey of India, Pakistan, Nepal, Terai, and Bangladesh. In Paper presented at IWMI-Tata Annual Partners’ Meeting, Anand, India, 2004, February, 17–19.
  19. Shah, T.; Roy, A.D.; Qureshi, A.S.; Wang, J. Sustaining Asia’s groundwater boom: An overview of issues and evidence. Nat. Resour. Forum 2003, 27, 130–140. [Google Scholar] [CrossRef]
  20. Wikipidia. Available online: http://en.wikipedia.org/wiki/Agriculture_in_India (accessed on January 15, 2009).
  21. Thenkabail, P.S.; Biradar, C.M.; Noojipady, P.; Cai, X.L.; Dheeravath, V.; Li, Y.J.; Velpuri, M.; Gumma, M.; Pandey., S. Sub-pixel irrigated area calculation methods. Sensors 2007, 7, 2519–2538. [Google Scholar] [CrossRef] [Green Version]
  22. Turral, H.; Thenkabail, P.S.; Lyon, J.G.; Biradar, C.M. Context, Need: The Need and Scope for Mapping Global Irrigated and Rain-fed Areas. In Remote Sensing of Global Croplands for Food Security; Thenkabail, P.S., Lyon, J.G., Turral, H., Biradar, C.M., Eds.; CRC Press: Boca Raton, FL, USA, 2009. [Google Scholar]

