Tourism Eco-Efficiency Measurement, Characteristics, and Its Influence Factors in China


1
Institute of Mountain Hazards and Environment, Chinese Academy of Sciences, Chengdu 610041, China
2
University of Chinese Academy of Sciences, Beijing 100049, China
3
College of Resources and Environment, University of Chinese Academy of Sciences, Beijing 100190, China
*
Author to whom correspondence should be addressed.
Sustainability 2017, 9(9), 1634; https://doi.org/10.3390/su9091634
Submission received: 20 May 2017
/
Revised: 8 September 2017
/
Accepted: 12 September 2017
/
Published: 15 September 2017
(This article belongs to the Section Economic and Business Aspects of Sustainability)
Abstract
:As an emerging field of eco-efficiency, tourism eco-efficiency is becoming an important way to measure the sustainable development of tourism. This study calculated and decomposed tourism CO2 emissions in China, explored its evolution and distribution characteristics by using the ratio method of tourism eco-efficiency, and analyzed the influencing factors by adopting a regression model. The results indicate that: (1) tourism CO2 emissions in China have increased significantly, their largest source is transportation. Its characteristics can be divided into carbon emission intensity factor, income structure factor, consumption level factor, and tourist scale factor through utilizing the Logarithmic Mean Divisia Index (LMDI) method, which also shows that the decisive factor of increased of tourism CO2 emissions has been the tourist scale factor. (2) Tourism eco-efficiency is marked by spectacular but unstable growth, which can be divided into three stages: inefficient stagnation stage, fluctuating growth stage, and efficient development stage. (3) Tourism eco-efficiency in China has shown that the remarkable high–high cluster and low–low cluster, and the 31 provinces, can be divided into four groups, namely: a high-efficiency high-growth group, a high-efficiency low-growth group, a low-efficiency high-growth group, and a low-efficiency low-growth group. (4) The main influencing factors of tourism eco-efficiency are the scale effect, the structural effect, the technical effect, and the environmental regulation. Since these four factors have different impacts on the tourism eco-efficiency of different groups according to panel data regression, more effective policies should be adopted for the improvement of tourism eco-efficiency in China. Finally, the significances and deficiencies of this study are discussed.
1. Introduction
Eco-efficiency is a concept of how to decrease the consumption of material resources and energy, reduce the influences on the natural environment, and enhance the value of products and services in the production of products and services [1,2]. Since eco-efficiency, which was proposed by Sehaltegger and Sturm in 1990 and was presented by the World Business Council for Sustainable Development (WBCSD) in 1992 [3,4,5], has been widely recognized. As an important research field of sustainable development, eco-efficiency has become the common focus of economics, ecology, geography, sociology, and other disciplines. The core idea of eco-efficiency is “minimum input and the maximum output”, and it measures environmental efficiency from the perspective of economic benefits, striving to improve both economic efficiency and environmental benefits [6,7].
It was not until the 1990s that studies of eco-efficiency started; in the beginning they focused on the concepts, theories, measurement methods, and the empirical research in different scales and fields [8,9]. In recent years, the research on eco-efficiency has shown some new characteristics. Specifically, research objects are extended from enterprises [10] to industries [11]; the scale of studies are expanded from the microscopic perspective [12] to the intermediate and the macroscopic perspective [13,14,15,16]; the research methods are extended from the ordinary ratio method [17] to more comprehensive methods [18]; and the research contents are extended from the theoretical and conceptual framework research [19] to the empirical research [20]. At present, the research on the regional and larger-scale eco-efficiency is warming up, and as an effective method for sustainable development, eco-efficiency has been applied to industrial research. The driving factors are discussed, so as to put forward the feasible strategies of industrial eco-efficiency in terms of policy, management, and technology.
Eco-efficiency is an index that takes into account both ecological and economic efficiencies. There are three measurement methods, namely the ratio method, the index method, and the model method. The ratio method uses the internationally generally accepted calculation formula: eco-efficiency = value/environmental impact, wherein value is usually measured by the total value and the growth value, whereas environmental impact is mainly measured by resource consumption and pollution emission [21,22]. The index method is adopted to comprehensively reflect the development level and the coordination degree of each subsystem of the society, economy, and nature through the establishment of the independent but integrated index system, which includes factor input, energy consumption, and pollutant emission [23]. Data envelopment analysis, factor analysis, and other models are used to study the eco-efficiency of the tourism destination [24,25,26]. These three methods have their advantages and disadvantages. To be specific, the result of the ratio method is a ratio, but it cannot distinguish the impacts between different environment [27]; the index method can comprehensively reflect the level of development and the coordination degree of each system, but is easily affected by subjective factors in the weighting process [28]; the model method has its unique advantages, but does not consider the influence of random factors, and it is inclined to show data quality error in larger-scale studies, but it cannot test the model [29].
Tourism has promoted economic growth and contributed to environmental pollution, so it is a “dilemma” for tourism management that has resulted in research on tourism eco-efficiency. As an emerging field of eco-efficiency, tourism eco-efficiency is a variable that describes the environmental impact of the economic output of tourism of each unit, and becomes an important index for measuring the sustainable development of tourism. The achievements of tourism eco-efficiency research focus on the concept, theoretical evolution, measurement, influencing mechanisms, planning, and improvement measures of tourism eco-efficiency [30,31]. With regard to the measurement methods, the ratio method and the model method are more commonly used. Specifically, taking the ratio of the economic income of tourism to the environmental impact as the eco-efficiency value of tourism [32], regarding the life cycle assessment or the input–output analysis as the theoretical basis, the ratio method adopts the bottom-up or top-down carbon footprint method to measure the tourism CO2 emissions, and is an important approach for assessing the environmental impact of tourism [33,34,35,36]; the model method mainly draws lessons from the eco-efficiency measurement method using data envelopment analysis [37], etc. to estimate tourism eco-efficiency. In these studies, the research on tourism eco-efficiency is mainly based on the single time point rather than the long-term evolution process. It basically draws lessons from the eco-efficiency measurement, but doesn’t combine well with tourism characteristics. It is also primarily based on the single scale, whereas the studies of multi-scale combinations and spatial heterogeneity are not enough. Lastly, it chiefly focuses on the structural analysis and ignores the influencing mechanisms.
There are three main purposes of this study: (1) to clarify the changes in tourism CO2 emissions and discover the main driving forces of these changes; (2) to explore the evolution of Chinese tourism eco-efficiency and the change of carbon emission intensity in different tourism sectors; and (3) to analyze the spatial pattern and the influencing factors of tourism eco-efficiency in China, and put forward relevant policy recommendations. In order to achieve the above targets, this paper estimates Chinese tourism eco-efficiency, validates the trajectory and spatial pattern of tourism eco-efficiency, discusses the determinants, and puts forward some policy suggestions, so as to enrich the understanding of the sustainable development of tourism.
The research frameworks of this study are as follows: Section 1 presents a literature review of eco-efficiency and tourism eco-efficiency, which points out the purpose and the structure of this study; following the introduction, the measurement methods are elaborated in Section 2, which includes the bottom-up method to estimate tourism CO2 emissions, the LMDI method to explore the driving factors of the tourism CO2 emission changes, the ratio method to measure tourism eco-efficiency, the local spatial autocorrelation method to identify the spatial distribution, and the panel regression model to explore the influencing factors of tourism eco-efficiency; Section 3 explains the measurement results of CO2 emissions and the eco-efficiency of tourism, shows the regression model estimation results, and proposes policy implications; and Section 4 puts forward the conclusions, and points out the significance and shortcomings of this study.
2. Materials and Methods
2.1. The Tourism Eco-Efficiency Measurement Method
Tourism involves several industries, including transportation, accommodation, catering and other industries. Three steps are taken to arrive at the tourism eco-efficiency measurement.
Step 1 Estimation of tourism-related CO2 emissions.
There are multiple ways of accounting for tourism CO2 emissions, so figures can only be estimated. Two main methods of estimating tourism CO2 emissions are the “top-down” and “bottom-up” carbon footprint method—the former estimates tourism CO2 emissions by calculating the proportion of tourism CO2 emissions to total CO2 emissions, and the latter calculates tourism CO2 emissions by analyzing CO2 emissions in different tourism sectors. We draw lessons from the previous research, and utilized the “bottom-up” method to estimate the CO2 emissions of tourism in China.
where C indicates the tourism carbon footprint; and , , and represent the transportation carbon footprint, the accommodation carbon footprint, the tourism activity carbon footprint, and the catering carbon footprint, respectively. The detailed calculations are shown in Equations (2)–(5).
where, l denotes the transportation mode (air, rail, car, and ferry), means the number of visitors of mode l, refers to the per capita travel distance of mode l, stands for the CO2 emission factor of mode l, presents the equivalence of mode l; j indicates the star level, represents the number of beds of level j, denotes the average room occupancy rate of level j, means the CO2 emission per bed night for level j; m refers to the visitor type, stands for the number of tourists from type m, presents the average duration of stay for visitors from type m, indicates per capita daily CO2 emissions from type m; k represents the food consumption type, refers to the total visitor days, denotes the per capita daily consumption of type k, and means the CO2 emission factor of type k.
This study argues that the domestic tourists take the airplane, the train, the car, and the ship, while all of the foreign tourists take the airplane. The number of tourists taking various types of transportation is determined by the proportion of the passenger volume of this type of transportation in the total passenger volume, the CO2 emission factor, and the equivalence factor are learnt from the results by Yao et al. [38] (Table 1).
As the statistical data is mainly on star-rated hotels, therefore, this paper estimates the tourism accommodation carbon footprint of star-rated hotels. In terms of the study by Tang et al. [39], the energy intensities and CO2 emissions of different star levels of hotels are presented in the Table 2.
In the absence of the statistics on the average duration of stay of domestic tourism, the disposal methods for China from the World Tourism Organization are adopted [40], and domestic overnight visitors and day-trippers are estimated in accordance with the proportion of 3:7. According to China’s Tourism Statistics Bulletin, the average duration of stay of domestic overnight visitors is 2.81 days. The purposes of tourism are mainly sightseeing, family visits, leisure vacations, and business travel, and combined with the results presented by Wu et al. [41], CO2 emission is taken as 0.9 kg per capita daily.
This study assumes that the average daily food consumption of tourists is consistent with that of urban residents, and according to the conclusions drawn by Tan [42], the CO2 emission coefficients of various foods are shown in the Table 3.
Step 2 Identification of the driving factors of the changes of tourism CO2 emissions using the Logarithmic Mean Divisia Index (LMDI).
In recent years, increasing numbers of scholars have applied structural decomposition analysis (SDA) to explore the driving factors of carbon emissions [43]. The Logarithmic Mean Divisia Index (LMDI) method is a complete and non-residual decomposition method, and it is also a good way to study the mechanism of carbon emission changes [44]. Based on Equations (2)–(5), this study uses LMDI to decompose the influencing factors of tourism CO2 emissions in China. According to the Kaya identity, Equation (1) is extended as:
where i indicates the sector in tourism , indicates the tourism income of sector i, refers to the total tourism income, and denotes the total number of tourists. Let , , , and represent the carbon emission intensity factor, income structure factor, consumption level factor, and tourist scale factor, respectively. Then, tourism CO2 emissions can be decomposed into four factors:
Tourism CO2 emissions in the initial year and the target year are set as and , respectively, so tourism CO2 emission changes from the initial year to the target year are as follows:
The LMDI method is used to decompose Equation (8), and the results obtained after the decomposition of various factors are expressed as follows:
Step 3 Calculation of tourism eco-efficiency.
Based on the quantitative measurement framework of tourism eco-efficiency, tourism eco-efficiency (E) is the ratio of the total tourism income (V) to the tourism carbon footprint (C):
where indicates the carbon emission intensity of sector i. According to Equation (13), the tourism eco-efficiency of China and various provinces are calculated respectively.
2.2. The Local Spatial Autocorrelation Index
As a reflection of the degree of spatial correlation between each region and the adjacent region, the local spatial autocorrelation index can effectively explain the spatial distribution characteristics of tourism eco-efficiency in China [45].
where denotes the local Moran’s I index for the region i; n stands for the total number of regions; represents the attribute value of the region i; indicates the average value of the corresponding attribute; refers to the spatial weight between the region i and the region j. If the local Moran’s I index is significantly positive, it is indicated that the regions with similar attribute values are clustered in space; if the local Moran’s I index is obviously negative, it is suggested that the regions with different attribute values are clustered in space. The test statistics are Z statistics, is expectation and is variance:
2.3. The Regression Analysis
The tourism eco-efficiency is described as the product of two factors in Equation (13), but since it can be affected by many factors, it is necessary to explain the influencing factors of tourism eco-efficiency theoretically. The environmental Kuznets curve (EKC) is the classic hypothesis of environmental economics; it expounds the relationship between economic development and environmental quality. Specifically, with the increase in income levels, environmental quality presents a degradation-improvement trend. Since then, the relationship between environmental quality and income has been further explored theoretically, and the scale effect, the technical effect, the structural effect, the environmental quality demand, environmental regulation, the market mechanism, the pollution-reduction investment, and other factors are also used to explain the relationship [46,47,48]. Combined with previous research on the factors affecting eco-efficiency [49,50,51,52], this paper argues that the main influencing factors of tourism eco-efficiency are the scale effect, the structural effect, the technical effect, and the environmental regulation.
The scale effect: Tourism eco-efficiency is affected in two ways, namely, economic scale and population size. On the one hand, with the expansion of economic scale and the constant improvement of tourism development level, the public continuously put forward higher requirements for environmental quality in the process of tourism, and driven by internal demand and external competition, various regions, especially the regions with higher economic development levels, tend to intensify resource and environmental protection, so as to promote the improvement of the ecological efficiency of tourism. On the other hand, while promoting the increase in tourism income, the expansion of the tourism market scale will inevitably lead to the increase in resource consumption and environmental pollution emissions, and as the tourists’ comfort requirements for tourism transportation and accommodation grow, the environmental pollution emissions of tourism will multiply. Thus, this paper selects two indicators, which are per capita tourism income (PCTI) and number of visitors per capita (NVPC).
The structural effect: There are significant differences in growth rates, contributions to the national economy, energy and resource consumption, pollutant emissions, and other aspects between various sectors of tourism, and the tourism eco-efficiency in a region is reflected by the structures of various sectors. From the perspective of income, if tourism is dominated by transportation, accommodation, catering and other basic consumption factors, the regional tourism income will be relatively low; if shopping, entertainment, and other high-level consumption factors are dominant, the tourism income will be relatively high. From the emissions point of view, if the sectors with high energy consumption and high pollution are the main tourism sectors, the tourism pollution emissions will be more; if the sectors with low energy consumption and low pollution are the main tourism sectors, the tourism pollution emissions will be fewer. Therefore, the ratio of the star hotel’s revenue that accounts for total tourism income (RSHR) is adopted to reflect the impact of tourism structure on tourism eco-efficiency.
The technical effect: The endogenous growth theory argues that the economy can achieve the sustained growth without relying on external forces, and the decisive factor is technical progress. The resource utilization efficiency and pollution control capacity can be improved by the development and application of energy-saving emission-reduction technology, which is conducive to the reduction of carbon intensity, so as to have a positive impact on eco-efficiency. We use energy consumption per ten thousand yuan of tourism revenue (ECTR), and the discharge of wastewater per ten thousand yuan of tourism revenue (DWTR) as the two representative indicators.
The environmental regulation: The “Porter hypothesis” believes that reasonable and strict environmental regulation can promote an enterprise’s innovation activities, as well as improve productivity and competitiveness. The implementation of active and rigorous environmental policies can promote scientific and technological progress, improve resource utilization efficiency, reduce the environmental pollution, decrease the emissions of resource consumption, minimize the economic losses, and facilitate the growth of ecological efficiency. We use the ratio of pollution charges to tourism revenue (RPCR) to reflect environmental regulation.
To avoid the non-stationary problem of parameter estimation caused by different data dimensions, the natural logarithms of various variables are taken to preserve the characteristics of the panel data to the maximum extent. The following model is constructed:
where t represents the year; is the dependent variable that refers to the provincial tourism eco-efficiency, which calculated according to Equation (13), and is a continuous variable with approximately normal distribution after logarithmic transformation; refers to the intercept term; PCTI, NVPC, RSHR, ECTR, DWTR, and RPCR are the independent variables; , , , , , are the parameters to be estimated; and denotes the random error. Eviews 8.0 is used to conduct to the panel data regression analysis from 1995 to 2014. Before the panel data are used for regression analysis, the unit root test is required. If the variables under consideration are not stable, the model cannot be run; then, the Hausman test of the model is carried out to determine whether the fixed effect or the random effect coefficient estimation method is adopted.
It is indicated from the results that there are unit roots in various variables, and the stability requirement is met after the first order difference is carried out. According to the Hausman test, the panel data in this paper are determined as the fixed effect models; the regression is conducted by cross-section weights, and it is indicated that heteroscedasticity in different cross sections is allowed; the estimation method is based on the panel corrected standard errors (PCSE) method introduced by Beck and Katz [53], and especially when the sample is relatively small, it can effectively deal with the complex panel error structures.
2.4. Research Units and Data Sources
The basic units of this study are 31 provinces and autonomous regions of China, which do not include the Hong Kong Special Administrative Region, the Macao Special Administrative Region and the Taiwan Province. The data come from the Yearbook of China Tourism Statistics, the China Statistical Yearbook, the China Statistical Yearbook on Environment, the China Energy Statistical Yearbook and various provincial statistics yearbooks, and the individual missing data are estimated by the average value or the growth rate. The consumer price index (CPI) is used to convert the total tourism income, GDP, the revenue of star-related hotels and other value indexes in this study into the constant price, which takes the year 1995 as the base period (Table 4). Due to the lack of some data in Tibet, it is not included in the analysis of influencing factors.
3. Results and Discussion
3.1. Tourism CO2 Emissions, Tourism Income and Driving Factors of Tourism CO2 Emissions Changes in China
Figure 1 shows the Chinese CO2 emissions and total revenue of tourism. From 1995 to 2014, China’s tourism carbon emissions showed a marked increasing trend, increasing from 13.684 billion kg to 158.357 billion kg, with an annual increase of 13.77% (Figure 1a). Consistent with the conclusions by Shi and Wu [54], transportation was the largest source of carbon emissions in the process of tourism, and transportation carbon emissions accounted for 74% of the total emissions. This created certain economic benefits. Accommodation also became an important source of tourism carbon emissions, and accommodation carbon emissions accounted for 12.08% of the total emissions. Tourism activity and catering carbon emissions were relatively fewer, accounting for 6.90% and 6.55%, respectively, but as the content of the tourists’ experiences, they had great research significance. It is seen from the study that between 1995 and 2014, the proportion of transportation carbon emissions increased from 71.11% to 77.65%, likely because medium-and-long distance tourists chose to travel by airplane, which is the most convenient method of transportation. The proportion of accommodation carbon emissions decreased from 17.27% to 6.12%, presenting the increasing-decreasing trend. The proportion of tourism activity carbon emissions changed little, slightly increasing from 6.88% to 7.69%. The proportion of catering carbon emissions showed the upward tendency, increasing from 5.31% to 8.54%. Chinese total tourism income showed an incredible increase (from 399.43 billion yuan to 6028.33 billion yuan), with an annual increase of 15.59% (Figure 1b). The proportion of transportation, accommodation, tourism activities, and catering changed from 35.48%, 17.45%, 28.37% and 18.71% in 1995 to 25.25%, 9.30%, 51.05% and 14.04% in 2014, respectively.
According to the results of LMDI analysis, the effects of various driving factors on tourism CO2 emission changes are shown in Figure 2. It can be seen that CO2 emissions increased by 143.48 million kg between 1995 and 2014 (with an increase of 8.89 million kg, 19.44 million kg, 38.81 million kg and 76.35 million kg between 1995–1999, 2000–2004, 2005–2009, and 2010–2014, respectively). These increases indicate that in general, the promoting effects are greater than the inhibitory effects on tourism CO2 emissions, and the promoting effects are steadily strengthening. From 1995 to 2014, the cumulative contributions of the carbon emission intensity factor (Δf), income structure factor (Δg), consumption level factor (Δq), and tourist scale factor (Δr) to CO2 emission changes were −1.99 million kg, −6.77 million kg, 0.81 million kg, and 151.44 million kg, and the cumulative contribution rates were −1.39%, −4.72%, 0.56%, and 105.55%, respectively (Table 5). During the study period, the effects of the carbon emission intensity factor on CO2 emission changes were characterized by periodic positive and negative fluctuations, and except for the positive effect between 2000 and 2004, the negative effects were shown in the other three stages. The effects of income structure factor on CO2 emission changes were always negative, so it reduced the CO2 emissions to a great extent, and was the most critical factor for promoting carbon emission reductions in tourism. Similar to carbon emission intensity factor, the consumption level factor was also characterized by the positive and negative fluctuation effects during the study period, and showed the positive effects on the increase of CO2 emissions on the whole. The tourist scale factor presented the marked positive effects on the increase of CO2 during the study period, and the positive effects were significantly greater than the inhibitory effects of other factors, so the tourist scale factor was the decisive factor for promoting the continuous increase of tourism CO2 emissions.
3.2. The Evolution and Structure of Tourism Eco-Efficiency in China
During the 1995–2014 period, tourism eco-efficiency in China achieved significant growth, increasing from 26.85 yuan/kg to 38.07 yuan/kg. Based on the evolution process, tourism eco-efficiency in China can be divided into three stages: inefficient stagnation stage, fluctuating growth stage, and efficient development stage (Figure 3). To be specific, in the first stage, the average level and the annual growth rate of tourism eco-efficiency were 26.96 yuan/kg and 0.22%, respectively; during 1998 and 2008, the average level was 30.40 yuan/kg at an average annual growth rate of 1.25%; during 2009 and 2014, the tourism eco-efficiency increased rapidly from 32.52 yuan/kg to 38.07 yuan/kg at an average annual rate of 2.18%, and the average was 35.70 yuan/kg. In general, the evolution of tourism eco-efficiency in China was consistent with China’s tourism development. In the early 1990s, China’s tourism development basically followed the mode of operation and management under the planned economy mode, and tourism eco-efficiency was in the state of inefficient stagnation. Since 1998, the Guiding Opinions on Developing the Tertiary Industry and Expanding the Employment in 1998, the Circular of the General Office of the State Council on the Transmission of Several Recommendations Submitted by the State Tourism Administration and Other Departments Concerning the Further Development of Holiday Tourism in 2000, the Opinions on Further Promoting the Development of Tourism in 2007, and other laws and regulations have been issued, and the focus of the tourism development began to transform from inbound tourism to domestic tourism, whose absolute dominance was established. In this stage, the tourism scale expanded rapidly, but tourism development was still at a low level; after 2009, the Opinions on Accelerating the Development of Tourism in 2009, the Tourism Law of the People’s Republic of China in 2013, and a series of comprehensive laws and regulations were promulgated, and the development of tourism eco-efficiency in China entered an efficient development stage, so that domestic tourism, inbound tourism, and outbound tourism achieved comprehensive prosperity. In short, the adjustment of each tourism development strategy has revolutionary significance for tourism eco-efficiency in China, and the arrangement of the national tourism policy system has vigorously promoted the improvement of tourism eco-efficiency.
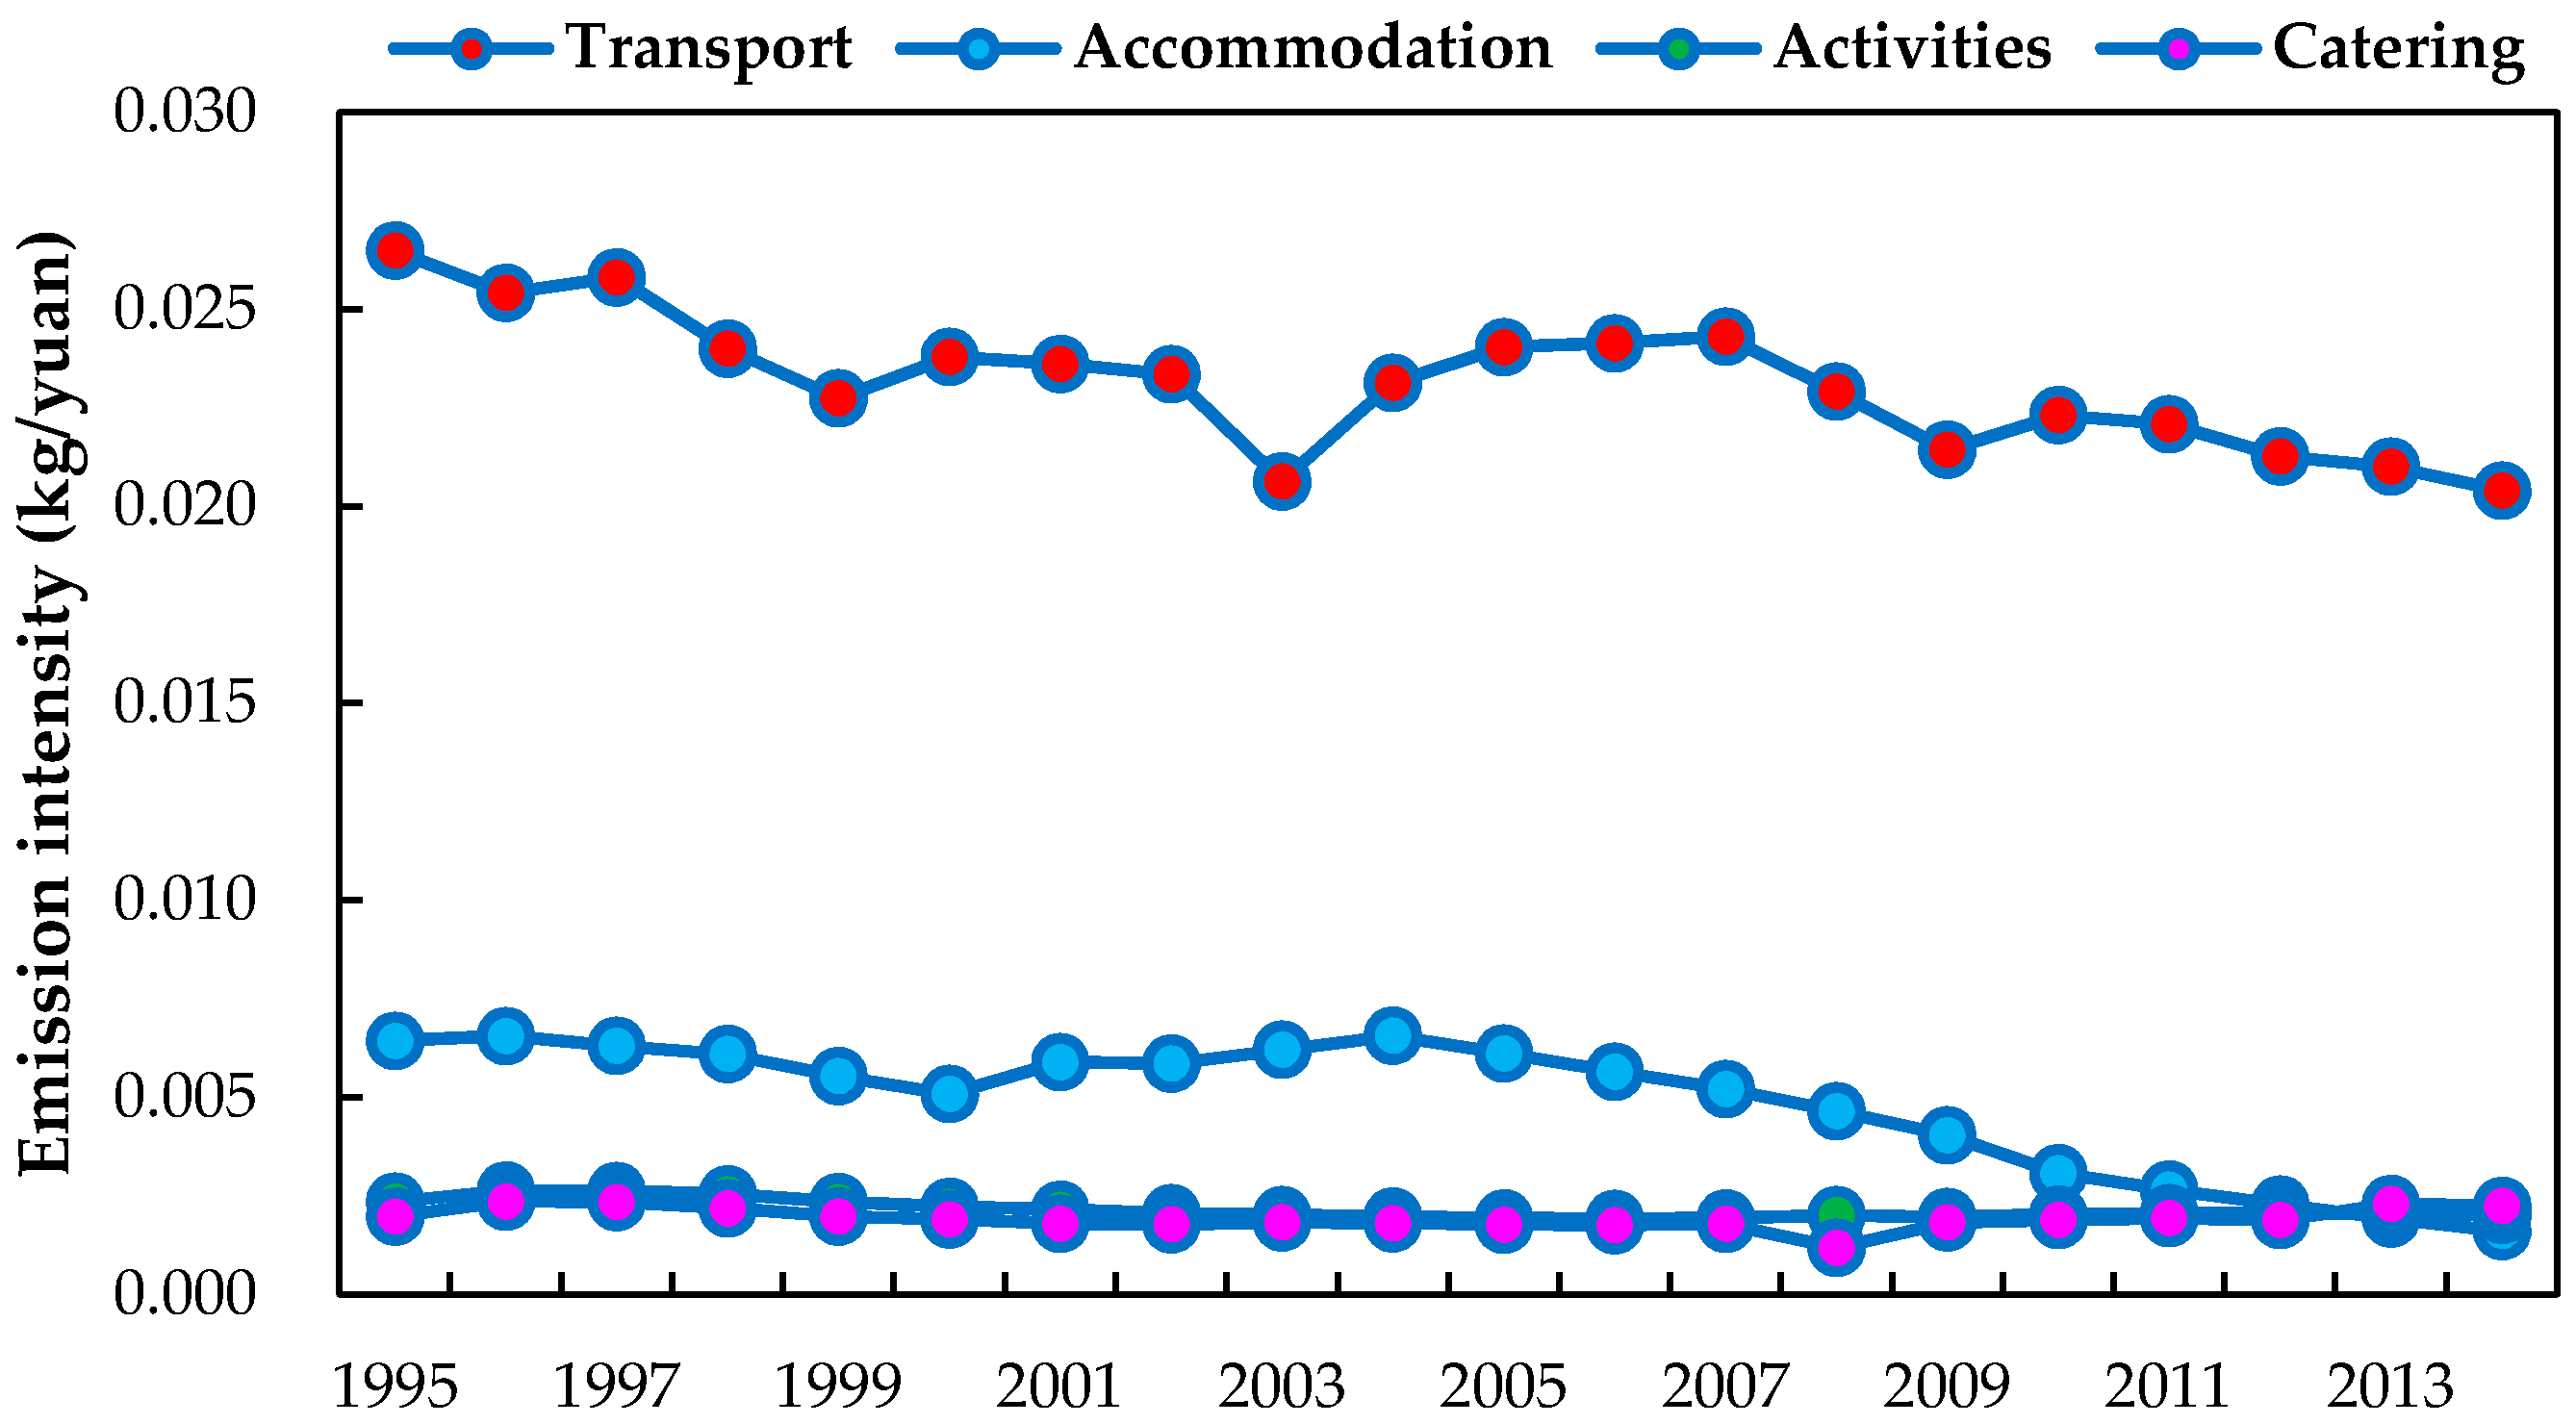
Figure 4 shows the carbon emission intensity of tourism from 1995 to 2014. The carbon emission intensity of tourism transportation sectors was largest, reaching 0.023 kg/yuan. Accommodation sectors had an important impact on the environment as well; the accommodation carbon emission intensity was 0.005 kg/yuan. Meanwhile, the carbon emission intensities of tourism activities and catering sectors were relatively small (only 0.002 kg/yuan). Overall, due to the implementation of an energy-saving emission-reduction strategy in recent years, tourism carbon emission intensity has shown a downward trend, and in particular, the transportation and accommodation carbon emission intensities have decreased significantly. However, great efforts should be made to reduce CO2 emissions. On the one hand, it is necessary to pay attention to the controls for carbon emissions in the transportation sectors, and enhance the energy utilization efficiency by guiding tourists to adopt greener means of transportation. On the other hand, the transportation carbon emission intensity can be reduced by improving the service quality, increasing tourism consumption, increasing the tourists’ duration of stay, and increasing the frequency of tourists’ participation in tourism activities, so as to reduce the carbon emission intensity of tourism and improve tourism eco-efficiency.
3.3. The Spatial Pattern of Tourism Eco-Efficiency in China
From the perspectives of the five time points of 1995, 2000, 2005, 2010, and 2014, the local spatial correlation of tourism eco-efficiency in China has presented the following features (Figure 5). Firstly, tourism eco-efficiency has shown the remarkable phenomenon of high-high cluster and low-low cluster, and high-low cluster and low-high cluster, are scattered. Among them, most of the provinces in the low-low cluster, which accounts for about 35.48% of the total provinces; provinces in the high-high cluster accounting for about 19.35%; provinces in the high-low cluster and low-high cluster are fewer, accounting for 3.87% and 7.10%, respectively. Secondly, the high-high cluster are mainly distributed in the eastern coastal and the northeast, whereas the low-low cluster are primarily distributed in the southwest and northwest regions. The cluster types are unstable in the southern coastal, the northern coastal, and the lower-middle reaches of the Yangtze and the Yellow River. Thirdly, the cluster has changed constantly, especially in the high-high cluster and the low-low cluster, and the high-high cluster has presented an increasing–decreasing trend, while the low-low cluster has shown a decreasing–increasing trend. The cluster types in the southern coastal and northern coastal have undergone a major change during the study period. The former has evolved from the high-high cluster to the low-low cluster, whereas the latter has undergone the evolution from the low-low cluster to the high-high cluster.
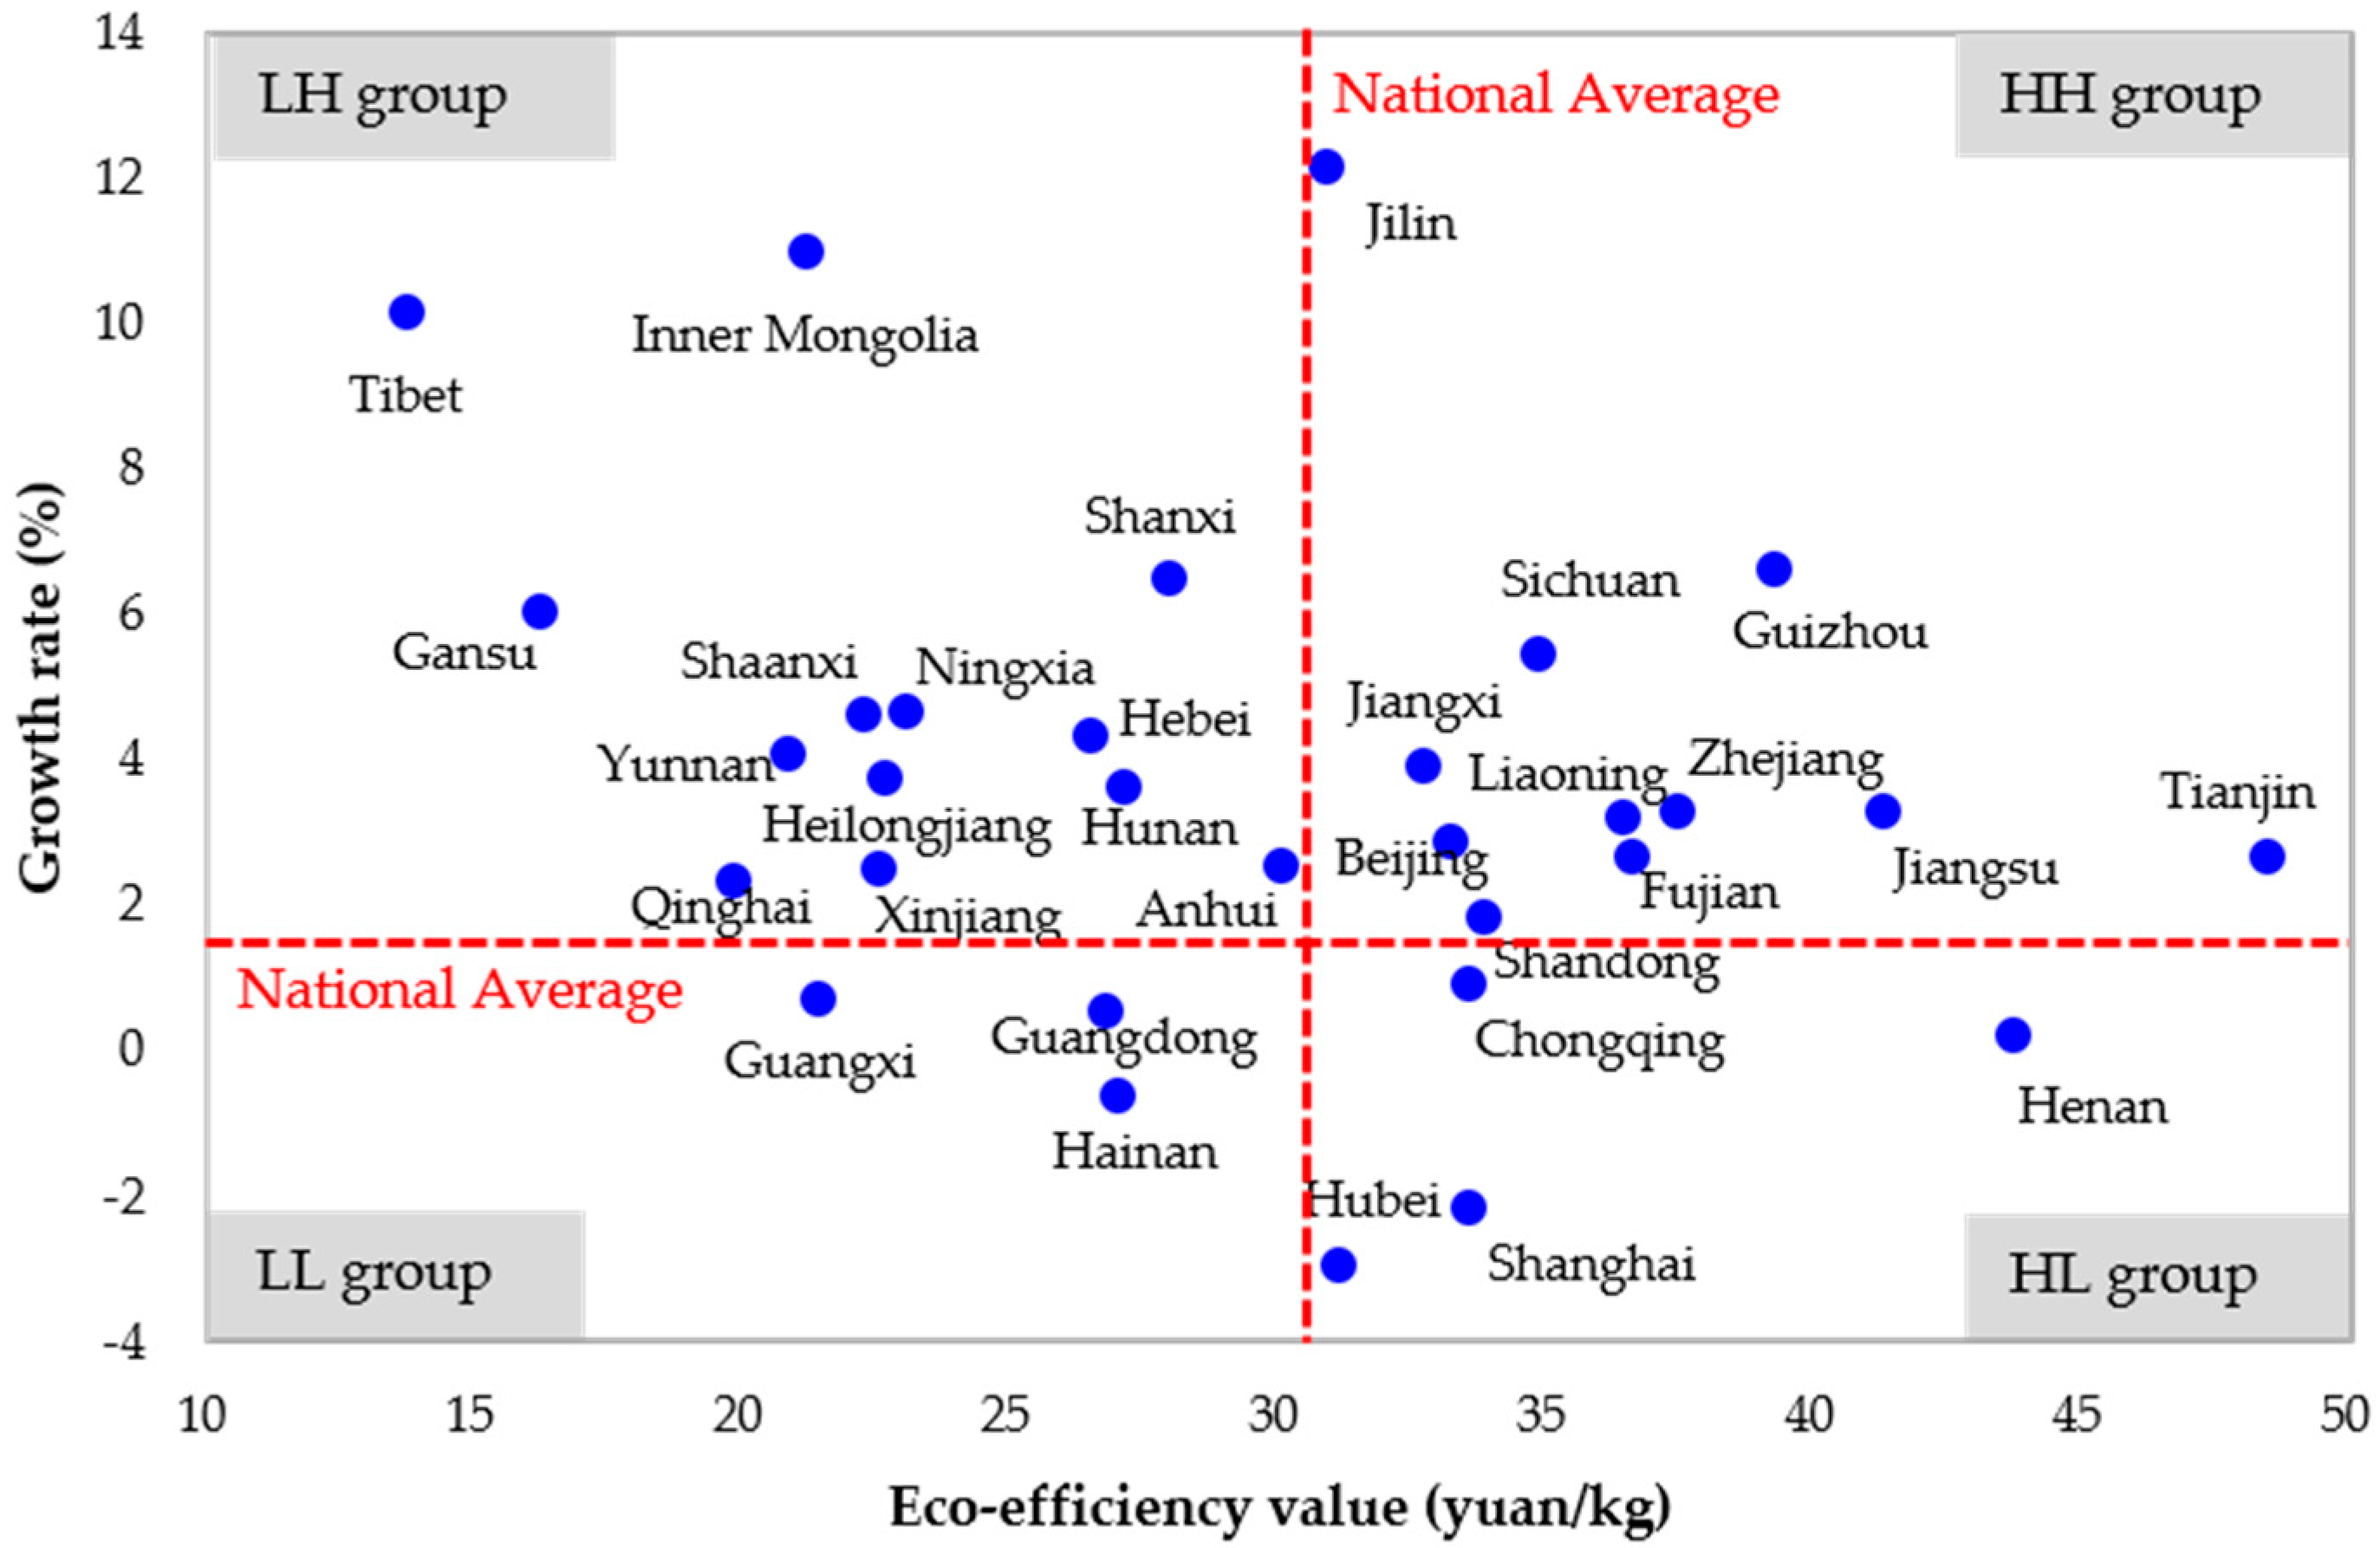
Comparing with the national average, the 31 provinces in China have different tourism eco-efficiency values and the growth rates, and based on this, they are divided into four groups (Figure 6). The first group is the high-efficiency high-growth group (HH group), which refers to the provinces whose tourism eco-efficiency and growth rate are both higher than the national average. The second group is the high-efficiency low-growth group (HL group); it represents the provinces whose tourism eco-efficiency is higher than the national average (31.47 yuan/kg) and growth rate is lower than the national average (1.85%). The third group is the low-efficiency high-growth group (LH group), which stands for the provinces with low tourism eco-efficiency and high growth rate. The last one is the low-efficiency low-growth group (LL group), which denotes the provinces that both have lower tourism eco-efficiency and lower growth rates than the national average.
The HH group is presented by eleven provinces, including Beijing, Tianjin, Shandong, Zhejiang, Jiangsu, Fujian, Liaoning, Jilin, Sichuan, Jiangxi, and Guangxi; many of these provinces lie in the eastern developed areas. The HL group consists of four provinces with high efficiency and low growth: Shanghai, Hubei, Chongqing, and Henan, which are located in central China. The third LH group includes Tibet, Inner Mongolia, Gansu, Shaanxi, Yunnan, Qinghai, Heilongjiang, Ningxia, Xinjiang, Hebei, Hunan, Anhui and Shanxi; among them, most are located in western China. Three provinces are in LL group (Hainan, Guangdong, Guizhou); they are located in the southern coastal areas (Table 6).
3.4. Influencing Factors of Tourism Eco-Efficiency in China
According to the analysis in Section 3.3, the panel data regression of different groups is carried out, and the results are shown in Table 7.
(1) Scale effect. The first influencing factor considered is per capita tourism income (PCTI), which has a significant positive influence on tourism eco-efficiency in the four groups. The influence is significant at the level of 1%, but the differences in impact degree are remarkable. The positive influence from largest to smallest is LH group, HH group, LL group, and HL group, and with every 1% increase in per capita tourism income, tourism eco-efficiency in the above groups of areas increases by 0.82%, 0.76%, 0.74%, and 0.55%, respectively. It can be seen that the positive influence of tourism development levels on tourism eco-efficiency decreases from the high-growth group to the low-growth group, and the marginal effect of tourism development in high-growth areas is higher, indicating that in order to enhance tourism eco-efficiency, China should focus on promoting the tourism development of high-growth areas.
It is surprising that the number of visitors per capita (NVPC), however, has a noticeable negative effect on the four groups, and the effect is significant at the level of 1%. The largest to smallest negative effect are in the LL group, HH group, LH group, and HL group; with every 1% increase in number of visitors per capita, tourism eco-efficiency in the above groups decreases by 0.84%, 0.78%, 0.64%, and 0.46%, respectively. The findings are of warning significance for tourism development, which takes enhancing tourism eco-efficiency as the goal. The local one-day tour based on sightseeing is the main form of the expansion of China’s tourism scale at present, but its characteristics are low development levels, single product structure, and tourists’ weak consumption ability. Simply relying on the increase in the number of tourists has been unable to meet the requirements for improving tourism eco-efficiency. It is necessary to be aware of the traps of tourism scale expansion, and pay attention to the quality of tourism development and enhance the attractiveness for high-end tourism markets.
(2) Structure effect. As was expected, the ratio of the star hotel’s revenue (RSHR) that accounts for total tourism income has a negative impact on tourism eco-efficiency, but the negative impact on the LL group was not supported by the significance test. With every 1% increase in the ratio of the star hotel’s revenue that accounts for total tourism income, the tourism eco-efficiency of HH group, HL group, and LH group decreases by 0.17%, 0.15%, and 0.08%, respectively. According to Maslow’s hierarchy of needs, tourism consumption can be divided into three levels: namely, the basic requirements (catering, accommodation, and transportation), the intermediate requirements (shopping), and the core requirements (sightseeing and entertainment). In regard to these levels, the star hotel’s revenue belongs to the basic tourism consumption. The negative impact of RSHR on tourism eco-efficiency shows that stimulating the consumption of the intermediate requirements and the core requirements is the key to improving the levels of tourism development and tourism eco-efficiency in the tourism income structure.
(3) Technical effect. The energy consumption per ten thousand yuan of tourism revenue (ECTR) has a negative influence on tourism eco-efficiency, but the negative influence on the LH group and the LL group was not significant. With every 1% decrease in the energy consumption per ten thousand yuan of tourism revenue, the tourism eco-efficiency of the HH group and the HL group increases by 0.08% and 0.24%, respectively. The discharge of wastewater per ten thousand yuan of tourism revenue (DWTR) has a positive impact on tourism eco-efficiency, but the positive impact on the LL group was not significant. With every 1% increase in DWTR, the tourism eco-efficiency of the HH group, the HL group and the LH group increases by 0.14%, 0.35%, and 0.23%, respectively. ECTR has only promoted tourism eco-efficiency in the HH group and the HL group, which means that the energy-saving technology has not promoted tourism eco-efficiency improvement in the LH and LL group. What’s more, the unexpected positive effect of DWTR on tourism eco-efficiency shows the application of emission-reduction technology not only has not promoted tourism eco-efficiency, but also hinders its growth. The possible reason is that China’s energy-saving emission-reduction technology is mainly used for the secondary industry, whereas tourism belongs to the tertiary industry and is regarded as “smoke-free industry”, and the application of energy-saving emission-reduction technology in tourism is not prevailing. Therefore, it is necessary to strengthen the application of energy-saving emission-reduction technology in tourism.
(4) Environmental regulation. The ratio of pollution charges to tourism revenue (RPCR) has an obvious negative effect on the tourism eco-efficiency of HH group, and with every 1% increase in the ratio of pollution charges to tourism revenue, the tourism eco-efficiency of HH group decreases by 0.07%. Although RPCR has a positive influence on the HL group, it has not passed the significance test; it has a negative influence on the LH group and the LL group, but the negative impact was not supported by the significance test. It is indicated from the results that the increase of RPCR has not promoted the improvement of tourism eco-efficiency in all of the groups. The possible reasons are as follows: firstly, China’s sewage charges were adjusted in 1998, 2003, 2007, and 2015, and the increase in the proportion was merely caused by the increase in the sewage charges standard, while the intensity of the environmental regulation has not increased; secondly, there is a great deal of human factor interference in the sewage charges system in China, and the efficiency of pollution control is weaker, so the sewage charges are only taken as a means of local financing [55].
3.5. Policy Implication for Improve Tourism Eco-Efficiency
According to the results of regression analysis, we should carry out a policy adjustment from income increase and emission reduction to improve Chinese tourism eco-efficiency. In terms of income increase, we must improve the quality of tourism and optimize the consumption structure; in terms of emission reduction, we should pay attention to energy-saving emission-reduction technology in the key sectors and implement stricter environmental regulations.
The development of tourism should be comprehensively promoted. In recent years, China has promulgated The Outline of National Tourism and Leisure (2013), Several Opinions of the General Office of the State Council on Further Promoting Tourism Investment and Consumption (2015), and a series of policies and regulations, and China’s tourism has entered a rapid development period of transformation and upgrading. Circular of the State Council Regarding Printing and Distributing the ‘13th Five-Year’ Tourism Development Planning (2016) has shown the direction for the tourism development during the “13th Five-Year” plan period in China, and “ecotourism”, “rural tourism”, “cultural tourism”, “smart tourism” and “all-for-one tourism” have become the focus of the tourism development. For the HH and HL groups with higher tourism development levels, it is necessary to focus on the development of ecotourism and rural tourism, and insist on the equal importance of protection and development, and improvement of the quality of tourism services. For the LH and LL group where the tourism development level is lower, the promotion effect of per capita tourism income on tourism eco-efficiency is more obvious, and all-for-one tourism should be developed in order to comprehensively promote the development of tourism.
The structure of tourism consumption should be optimized. At present, China’s tourism consumption presents the characteristics of the larger proportion of the basic tourism consumption expenditure and the sightseeing-based tourism product consumption, and tourists’ consumption levels are still very low. Several Opinions of the State Council on Promoting the Reform and Development of Tourism (2014) has pointed out that there is a need to adapt to people’s consumption habits by upgrading and expanding tourism shopping consumption. It is indicated from this study that RSHR has a negative effect on tourism eco-efficiency improvement, which effectively proves the importance of optimizing the structure of tourism consumption. Therefore, for all of the groups, especially the LL group, stimulating the tourists’ consumption desires and increasing the proportions of consumption of the intermediate requirements and the core requirements are the key to optimizing the structure of tourism consumption.
The application of energy-saving emission-reduction technology in key sectors should be promoted. In Several Opinions on the Tourism Industry‘s Response to Climate Change promulgated in 2008, China proposed energy conservation and the emission reduction of tourism in government documents for the first time. The key sectors of tourism emissions are transportation and accommodation, and in order to promote energy conservation and emission reduction within tourism, improvement in these sectors must be emphasized [56]. At present, energy conservation and emission reduction in tourism sectors focus on the water and electricity in star hotels and A-level scenic spots, whereas it is difficult to implement energy conservation and emission reduction in tourism transportation. According to this study, in terms of the HH group and the HL group, it is necessary to continue insisting on energy-saving technology; with regard to the LH group and the LL group, energy conservation should be profoundly understood and widely used in order to play its promoting role on tourism eco-efficiency. For all of the groups, the emission reduction should be equally emphasized in the transportation, the hotel, and scenic spots, and there is an urgent need to change the positive effect of emission reduction on tourism eco-efficiency into negative impact.
Reasonable and strict environmental regulations should be implemented. It is indicated that only implementing the stricter environmental regulations with smaller regional differences will have a significant effect on reducing the local pollutant emissions [57]. At present, China’s environmental regulations mainly include the environmental protection legislation, the total energy-saving emission-reduction control, and the sewage charge, but there are remarkable differences in the enforcement between different regions, and the implementation effects are obviously different as well. It is seen from this study that the environmental regulations have not promoted tourism eco-efficiency improvement except in the HL group. Thus, for the HL group, there is a need to continue implementing the strict environmental regulations and reduce tourism pollutant emissions; for the HH group, the LH group and the LL group, it is necessary to check the existing problems in the implementation of the current environmental regulations and establish the long-term monitoring mechanism. At the same time, more effective environmental regulations, such as environmental taxes, emissions trading, emission reduction subsidies, and so on, should be explored in order to reduce tourism carbon emissions.
4. Conclusions
In the past 20 years, sustainable tourism has become the world’s most highly recommended tourism development concept. With the emergence of green tourism, ecotourism, low-carbon tourism, and other sustainable tourism forms, tourism eco-efficiency has become a popular topic of discussion. In order to explore the tourism CO2 emissions and the main driving forces of CO2 emission changes, as well as analyze the evolution, spatial pattern, and determinants of Chinese eco-efficiency, this study used a bottom-up approach to estimate China’s CO2 emissions. This work analyzed the changes of CO2 emission by using the LMDI method, calculated the tourism eco-efficiency by using the ratio method, identified the spatial distribution characteristics by using the local spatial autocorrelation index, and explained the influencing factors of tourism eco-efficiency by using panel regression model. Empirical findings show that tourism CO2 emissions in China have increased significantly, its main sources were transportation and accommodation, and the decisive factor of increase of tourism CO2 emissions was the tourist scale factor. Chinese tourism eco-efficiency achieved significant growth during 1995–2014. Over the entire period, the evolution of tourism eco-efficiency was consistent with China’s tourism development; Chinese tourism eco-efficiency has shown a phenomenon of spatial cluster, and was affected by the scale effect, the structural effect, the technical effect, and the environmental regulation.
The results of this study are of direct significance to the Chinese government. Firstly, the adjustment of the national social and economic development strategy objectives and the arrangement of the national tourism policy system have vigorously promoted the improvement of tourism eco-efficiency, so it is necessary to improve tourism development strategies and policy measures. Meanwhile, the proportion of transportation carbon emissions is increasing year by year, so there is an urgent need to develop new energy, improve the energy utilization efficiency of transportation, and encourage tourists to choose cleaner methods of transportation. Furthermore, tourism eco-efficiency in China has obvious characteristics of spatial agglomeration, so it is necessary to pay attention to the formulation of the regional tourism development plan. In addition, tourism eco-efficiency is affected by many factors, which requires us to make full use of favorable factors and overcome unfavorable factors in the process of tourism development, so as to promote the positive effects of various factors.
Although some valuable findings have been obtained in this study, there are still some aspects that need to be improved. Firstly, due to the progress of technology and the improvement of energy utilization efficiency, emission factors and equilibrium factors are a dynamic process, but they are only regarded as a static process in this study. Secondly, because of the availability of data, sectors other than transportation, accommodation, and catering are all classified as tourism activities instead of being subdivided into sightseeing, entertainment, shopping and so on, and this needs to be further improved in the future research. Ultimately, the data of this study are derived from the “Tourism Statistics Yearbook of China” and statistics yearbooks of various provinces and cities, but there may be inconsistencies in the statistical calibers of different provinces and different years, which would affect the accuracy of the estimation results to a certain extent. Therefore, the problem of how to accurately measure tourism eco-efficiency will be a meaningful subject in future research.
Acknowledgments
This work was supported by the National Natural Science Foundation of China (Grants No. 41571523, 41661144038), the National Basic Research Program of China (973 Program) (Grant No. 2013CBA01808) and the National Key Technology Research and Development Program of the Ministry of Science and Technology of China (Grant No. 2014BAC05B01).
Author Contributions
Xiaoping Qiu, Yiping Fang, Xueting Yang and Fubiao Zhu conceived and designed the experiments; Xiaoping Qiu and Xueting Yang collected and processed the data; Xiaoping Qiu analyzed the data; Xiaoping Qiu and Yiping Fang wrote the paper.
Conflicts of Interest
The authors declare no conflict of interest.
References
- WBCSD (World Business Council for Sustainable Development). Eco-Efficiency—Creating More Value with Less Impact; World Business Council for Sustainable Development: Geneva, Switzerland, 2000; pp. 8–13. [Google Scholar]
- Van Berkel, R. Eco-efficiency in the Australian minerals processing sector. J. Clean. Prod. 2007, 15, 772–781. [Google Scholar] [CrossRef]
- Picazo-Tadeo, A.J.; Gómez-Limón, J.A.; Reig-Martínez, E. Assessing farming eco-efficiency: A Data Envelopment Analysis approach. J. Environ. Manag. 2011, 92, 1154–1164. [Google Scholar] [CrossRef] [PubMed]
- Yin, K.; Wang, R.; An, Q.; Yao, L.; Liang, J. Using eco-efficiency as an indicator for sustainable urban development: A case study of Chinese provincial capital cities. Ecol. Indic. 2014, 36, 665–671. [Google Scholar] [CrossRef]
- Mahlberg, B.; Luptacik, M. Eco-efficiency and eco-productivity change over time in a multisectoral economic system. Eur. J. Oper. Res. 2014, 234, 885–897. [Google Scholar] [CrossRef]
- Ayres, R.; Ferrer, G.; Van Leynseele, T. Eco-Efficiency, Asset Recovery and Remanufacturing. Eur. Manag. J. 1997, 15, 557–574. [Google Scholar] [CrossRef]
- Bleischwitz, R. Cognitive and institutional perspectives of eco-efficiency. Ecol. Econ. 2003, 46, 453–467. [Google Scholar] [CrossRef]
- Li, D.Z.; Hui, E.C.M.; Leung, B.Y.P.; Li, Q.M.; Xu, X. A methodology for eco-efficiency evaluation of residential development at city level. Build. Environ. 2010, 45, 566–573. [Google Scholar] [CrossRef]
- Yu, Y.; Chen, D.; Zhu, B.; Hu, S. Eco-efficiency trends in China, 1978–2010: Decoupling environmental pressure from economic growth. Ecol. Indic. 2013, 24, 177–184. [Google Scholar] [CrossRef]
- Côté, R.; Booth, A.; Louis, B. Eco-efficiency and SMEs in Nova Scotia, Canada. J. Clean. Prod. 2006, 14, 542–550. [Google Scholar] [CrossRef]
- Maia, R.; Silva, C.; Costa, E. Eco-efficiency assessment in the agricultural sector: the Monte Novo irrigation perimeter, Portugal. J. Clean. Prod. 2016, 138, 217–228. [Google Scholar] [CrossRef]
- Passetti, E.; Tenucci, A. Eco-efficiency measurement and the influence of organizational factors: Evidence from large Italian companies. J. Clean. Prod. 2016, 122, 228–239. [Google Scholar] [CrossRef]
- Woon, K.S.; Lo, I.M.C. An integrated life cycle costing and human health impact analysis of municipal solid waste management options in Hong Kong using modified eco-efficiency indicator. Resour. Conserv. Recy. 2016, 107, 104–114. [Google Scholar] [CrossRef]
- Korhonen, J.; Snäkin, J.-P. Quantifying the relationship of resilience and eco-efficiency in complex adaptive energy systems. Ecol. Econ. 2015, 120, 83–92. [Google Scholar] [CrossRef]
- Mickwitz, P.; Melanen, M.; Rosenström, U.; Seppälä, J. Regional eco-efficiency indicators e a participatory approach. J. Clean. Prod. 2006, 14, 1603–1611. [Google Scholar] [CrossRef]
- Yan, X.; Fang, Y.-P. CO2 emissions and mitigation potential of the Chinese manufacturing industry. J. Clean. Prod. 2015, 103, 759–773. [Google Scholar] [CrossRef]
- Cha, K.; Lim, S.; Hur, T. Eco-efficiency approach for global warming in the context of Kyoto Mechanism. Ecol. Econ. 2008, 67, 274–280. [Google Scholar] [CrossRef]
- Carvalho, H.; Govindan, K.; Azevedo, S.G.; Virgílio, C.-M. Modelling green and lean supply chains: An eco-efficiency perspective. Resour. Conserv. Recy. 2017, 120, 75–87. [Google Scholar] [CrossRef]
- Angelis-Dimakis, A.; Arampatzis, G.; Assimacopoulos, D. Systemic eco-efficiency assessment of meso-level water use systems. J. Clean. Prod. 2016, 138, 195–207. [Google Scholar] [CrossRef]
- Masuda, K. Measuring eco-efficiency of wheat production in Japan: A combined application of life cycle assessment and data envelopment analysis. J. Clean. Prod. 2016, 126, 373–381. [Google Scholar] [CrossRef]
- Müller, K.; Holmes, A.; Deurer, M.; Clothier, B.E. Eco-efficiency as a sustainability measure for kiwifruit production in New Zealand. J. Clean. Prod. 2015, 106, 333–342. [Google Scholar] [CrossRef]
- Ng, R.; Yeo, Z.; Low, J.S.C.; Song, B. A method for relative eco-efficiency analysis and improvement: Case study of bonding technologies. J. Clean. Prod. 2015, 99, 320–332. [Google Scholar] [CrossRef]
- Marileena, K. Measuring eco-efficiency in the Finnish forest industry using public data. J. Clean. Prod. 2015, 98, 316–327. [Google Scholar] [CrossRef]
- Berre, D.; Vayssieres, J.; Boussemart, J.-P.; Leleu, H.; Tillard, E.; Lecomte, P. A methodology to explore the determinants of eco-efficiency by combining an agronomic whole-farm simulation model and efficient frontier. Environ. Modell. Softw. 2015, 71, 46–59. [Google Scholar] [CrossRef]
- Beltrán-Esteve, M.; Reig-Martínez, E.; Estruch-Guitart, V. Assessing eco-efficiency: A metafrontier directional distance function approach using life cycle analysis. Environ. Impact Asses. 2017, 63, 116–127. [Google Scholar] [CrossRef]
- Ullah, A.; Perret, S.R.; Gheewala, S.H.; Soni, P. Eco-efficiency of cotton-cropping systems in Pakistan: An integrated approach of life cycle assessment and data envelopment analysis. J. Clean. Prod. 2016, 134, 623–632. [Google Scholar] [CrossRef]
- Quariguasi Frota Neto, J.; Walther, G.; Bloemhof, J.; van Nunen, J.A.E.E.; Spengler, T. A Methodology for Assessing Eco-Effciency in Logistics Network. Eur. J. Oper. Res. 2009, 193, 670–682. [Google Scholar] [CrossRef]
- Van Caneghem, J.; Block, C.; Cramm, P.; Mortier, R.; Vandecasteele, C. Improving-efficiency in the Steel Industry: The ArcelorMittal Gent Case. J. Clean. Prod. 2010, 18, 807–817. [Google Scholar] [CrossRef]
- Li, G.D.; Fang, C.L. Analyzing the multi-mechanism of regional inequality in China. Ann. Reg. Sci. 2014, 52, 155–182. [Google Scholar] [CrossRef]
- Kelly, J.; Haider, W.; Williams, P.W.; Englund, K. Stated preferences of tourists for eco-efficient destination planning options. Tour. Manag. 2007, 28, 377–390. [Google Scholar] [CrossRef]
- Zhen, Y. Tourism Ecological Efficiency Evaluation—Based on the comparative study of the ecological footprint and carbon footprint. Issues For. Econ. 2014, 34, 474–480. (In Chinese) [Google Scholar]
- Gössling, S.; Peeters, P.; Ceron, J.-P.; Dubois, G.; Patterson, T.; Richardson, R.B. The eco-efficiency of tourism. Ecol. Econ. 2005, 54, 417–434. [Google Scholar] [CrossRef]
- Dong, X.; Zhang, J.; Zhang, J.; Cheng, S. A Critical review on several issues of regional tourism-related carbon emissions or its carbon footprint. Acta Ecol. Sin. 2016, 36, 554–568. [Google Scholar] [CrossRef]
- Kuo, N.W.; Chen, P.H. Quantifying energy use, carbon dioxide emission, and other environmental loads from island tourism based on a life cycle assessment approach. J. Clean. Prod. 2009, 17, 1324–1330. [Google Scholar] [CrossRef]
- Tao, Y.-G.; Huang, Z.-F. Review of accounting for carbon dioxide emissions from tourism at different spatial scales. Acta Ecol. Sin. 2014, 34, 246–254. [Google Scholar] [CrossRef]
- Sun, Y.-Y. A framework to account for the tourism carbon footprint at island destinations. Tour. Manage. 2014, 45, 16–27. [Google Scholar] [CrossRef]
- Peng, H.; Zhang, J.; Lin, L.; Tang, G.; Yan, B.; Xiao, X.; Han, Y. Eco-efficiency and its determinants at a tourism destination: A case study of Huangshan National Park, China. Tour. Manag. 2017, 60, 201–211. [Google Scholar] [CrossRef]
- Yao, Z.; Chen, T.; Yin, S.; Li, X. Regional Tourism Eco-Efficiency Model and an Empirical Research of Hainan Province. Sci. Geogr. Sin. 2016, 36, 417–423. (In Chinese) [Google Scholar]
- Tang, Z.; Shang, J.; Shi, C.; Liu, Z.; Bi, K. Decoupling indicators of CO2 emissions from the tourism industry in China: 1990–2012. Ecol. Indic. 2014, 46, 390–397. [Google Scholar] [CrossRef]
- UNWTO (The World Tourism Organization). Compendium of Tourism Statistics, Data 1999–2003; China Travel & Tourism Press: Beijing, China, 2005. (In Chinese) [Google Scholar]
- Wu, P.; Han, Y.J.; Tian, M. The measurement and comparative study of carbon dioxide emission from tourism in typical provinces in China. Acta Ecol. Sin. 2015, 35, 184–190. [Google Scholar] [CrossRef]
- Tan, Q.-C. Greenhouse Gas Emission in China’s Agriculture: Situation and Challenge. China Popul. Resour. Environ. 2011, 21, 69–75. (In Chinese) [Google Scholar]
- Wang, C.; Wang, F. Structural Decomposition Analysis of Carbon Emissions and Policy Recommendations for Energy Sustainability in Xinjiang. Sustainability 2015, 7, 7548–7567. [Google Scholar] [CrossRef]
- Tao, Y.; Huang, Z.; Wu, L.; Yu, F.; Wang, K. Measuring carbon dioxide emissions for regional tourism and its factor decomposition: A case study of Jiangsu province. Acta Geogr. Sin. 2014, 10, 1438–1448. (In Chinese) [Google Scholar]
- Getis, A.; Ord, J.K. The analysis of spatial association by use of distance statistics. Geogr. Anal. 1992, 24, 189–206. [Google Scholar] [CrossRef]
- Grossman, G.M.; Krueger, A.B. Environmental Impacts of a North American Free Trade Agreement; National Bureau of Economic Research: Cambridge, MA, USA, 1991. [Google Scholar]
- Copeland, B.R.; Taylor, M.S. Trade and the Environment: Theory and Evidence; Princeton University Press: Princeton, NJ, USA, 2003. [Google Scholar]
- Torras, M.; Boyce, J. Income, Inequality and Pollution: A Reassessment of the Environmental Kuznets Curve. Ecol. Econ. 1998, 25, 147–160. [Google Scholar] [CrossRef]
- Fan, Y.; Bai, B.; Qiao, Q.; Kang, P.; Zhang, Y.; Guo, J. Study on eco-efficiency of industrial parks in China based on data envelopment analysis. J. Environ. Manag. 2017, 192, 107–115. [Google Scholar] [CrossRef] [PubMed]
- Zhang, J.; Liu, Y.; Chang, Y.; Zhang, L. Industrial eco-efficiency in China: A provincial quantification using three-stage data envelopment analysis. J. Clean. Prod. 2017, 143, 238–249. [Google Scholar] [CrossRef]
- Chen, J.; Cheng, J.; Dai, S. Regional eco-innovation in China: An analysis of eco-innovation levels and influencing factors. J. Clean. Prod. 2017, 153, 1–14. [Google Scholar] [CrossRef]
- Díaz-Villavicencio, G.; Didonet, S.R.; Dodd, A. Influencing factors of eco-efficient urban waste management: Evidence from Spanish municipalities. J. Clean. Prod. 2017, 164, 1486–1496. [Google Scholar] [CrossRef]
- Beck, N.; Katz, J.N. What To Do (and Not To Do) with Times-Series Cross-Section Data in Comparative Politics. Am. Political Sci. Rev. 1995, 89, 634–647. [Google Scholar] [CrossRef]
- Shi, P.; Wu, P. A Rough Estimation of Energy Consumption and CO2 Emission in Tourism Sector of China. Acta Geogr. Sin. 2011, 66, 235–243. (In Chinese) [Google Scholar]
- Markandya, A.; Shibli, A. Regional Overview: Industrial Pollution Control Policies in Asia: How Successful Are the Strategies? Asian J. Environ. Manag. 1995, 3, 87–118. [Google Scholar]
- Wu, P. Research into Several Key Problems Existing in Energy-saving and Emission-reducing of China’s Tourism Industry. J. Beijing Int. Stud. Univ. 2013, 3, 28–34. (In Chinese) [Google Scholar]
- Liu, Y.; Chen, Z. Environmental Regulations in China: Policies and Their Effects. Comp. Econ. Soc. Syst. 2016, 1, 164–173. (In Chinese) [Google Scholar]
Figure 1.
CO2 emissions (a) and total revenue (b) from tourism in China (1995–2014).
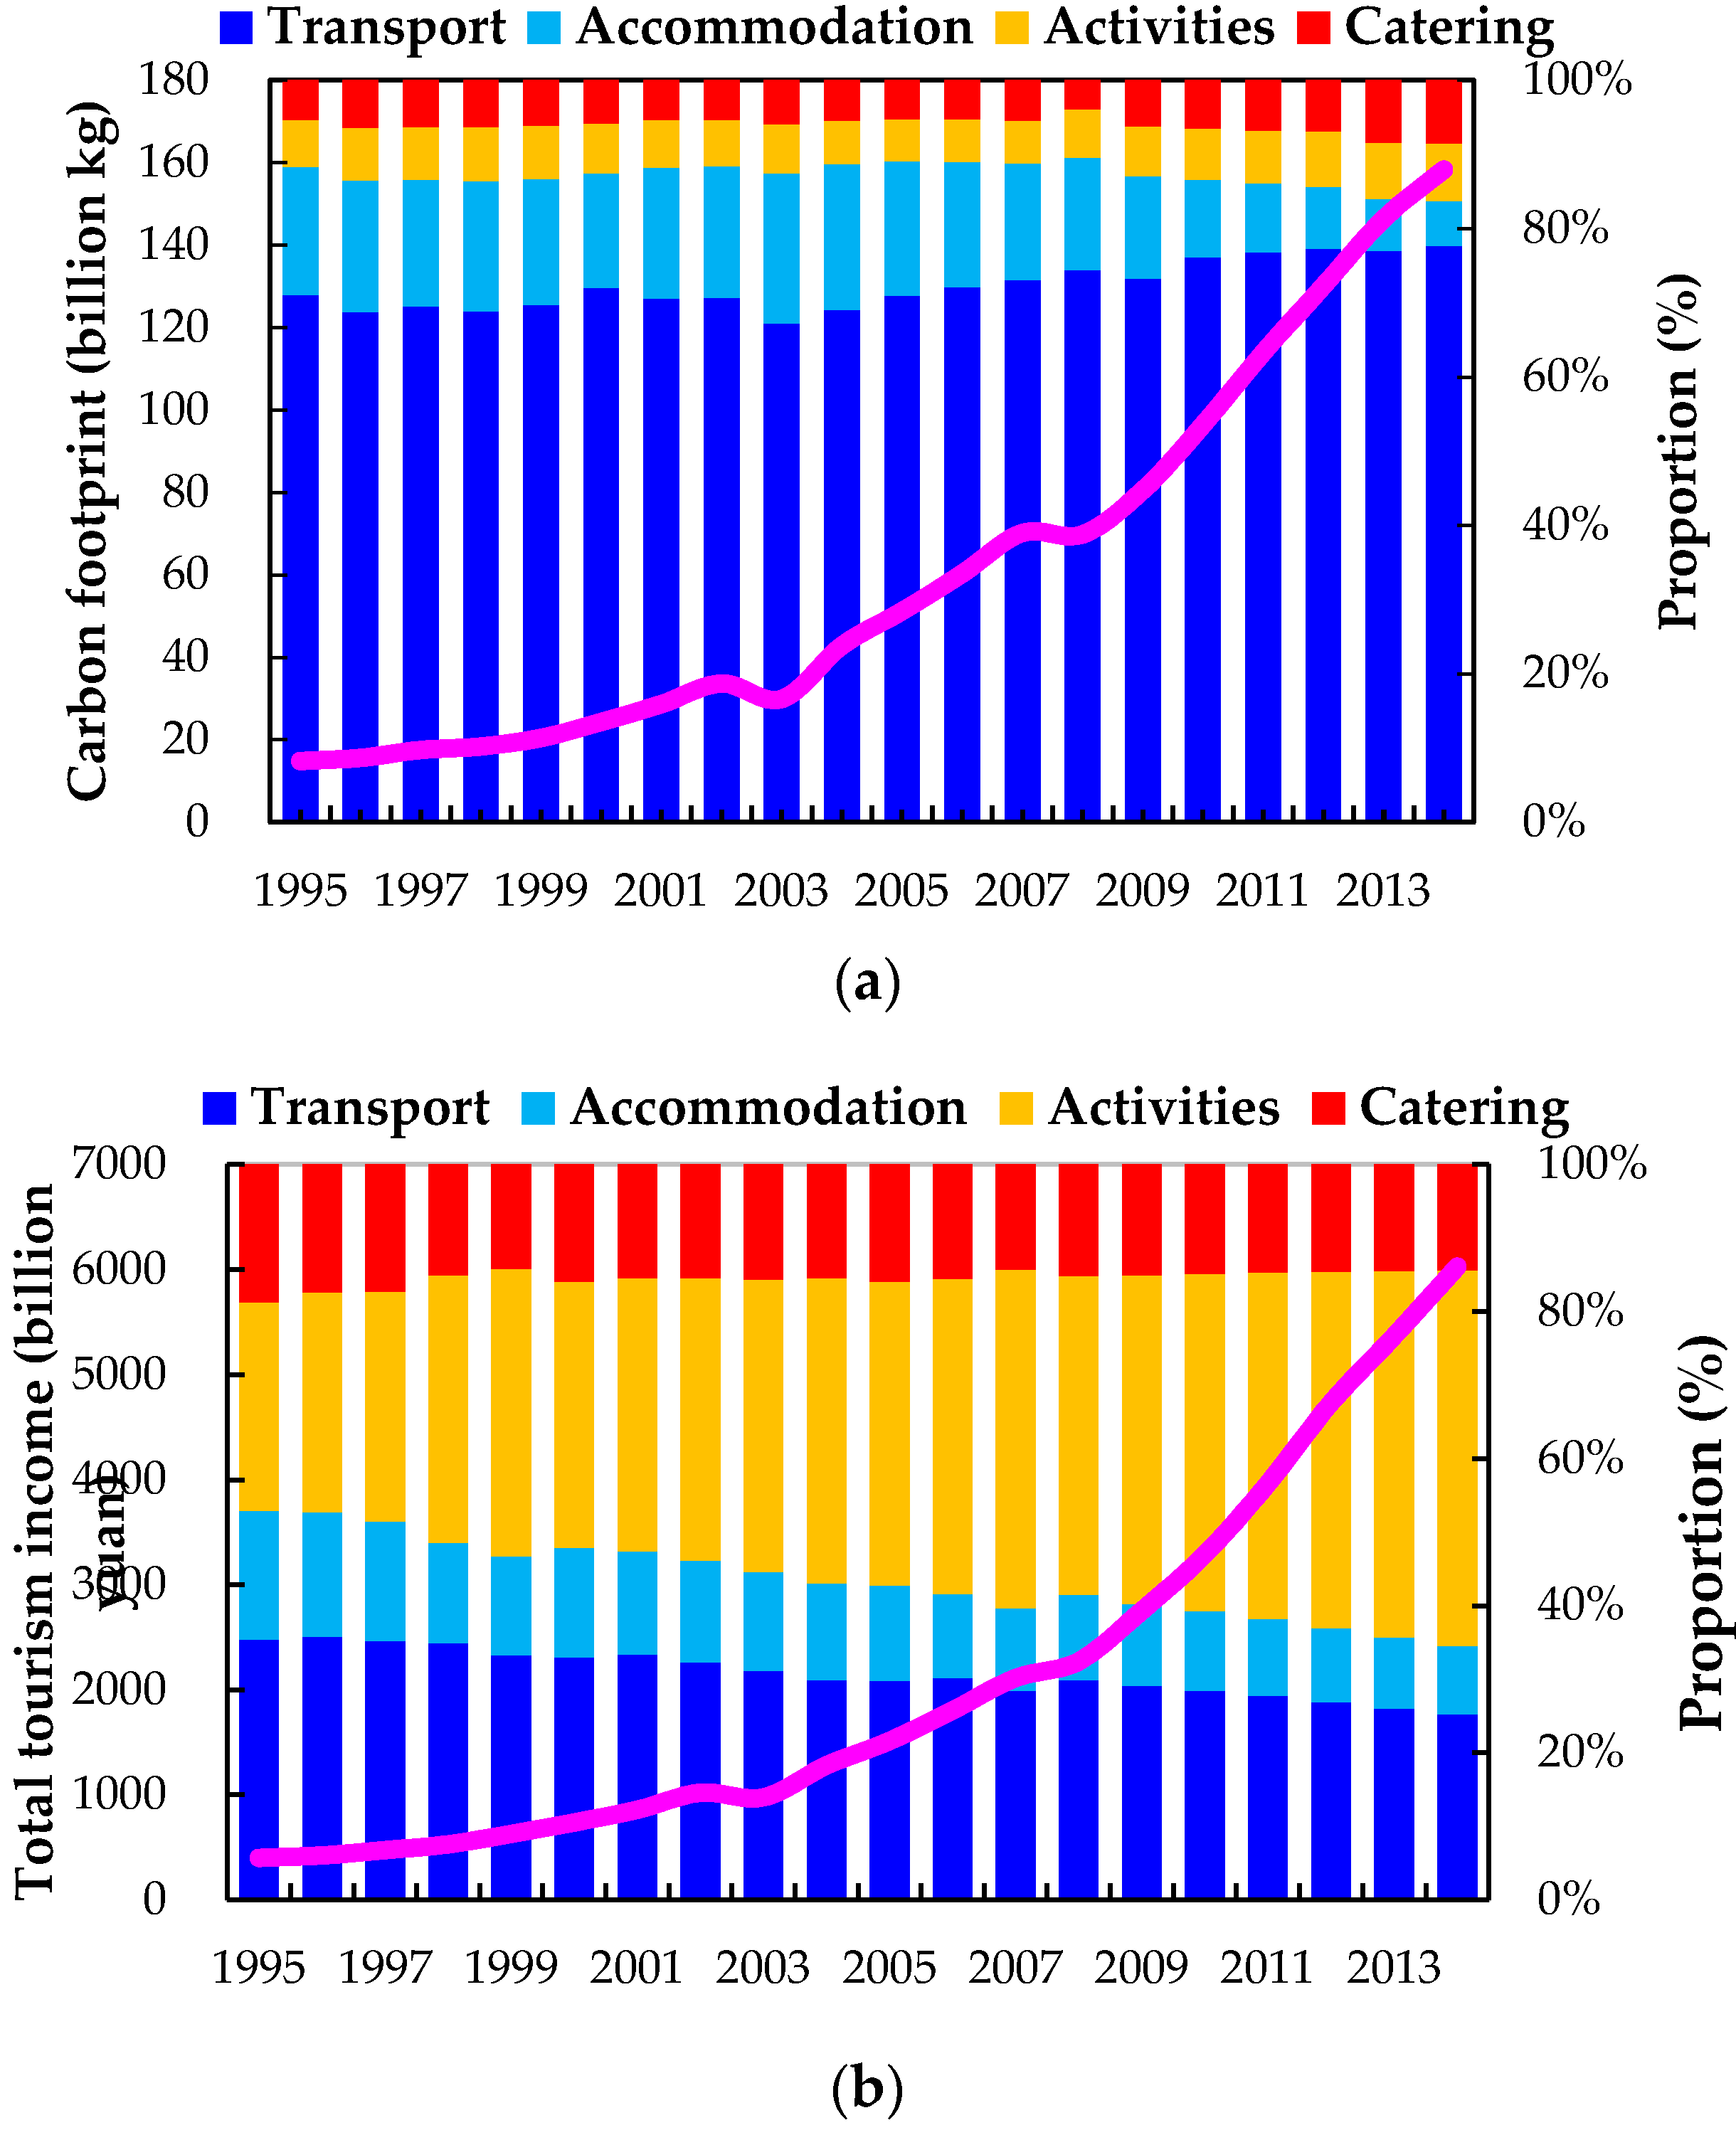
Figure 2.
The factor decomposition of tourism CO2 emissions in China from 1995–2014.
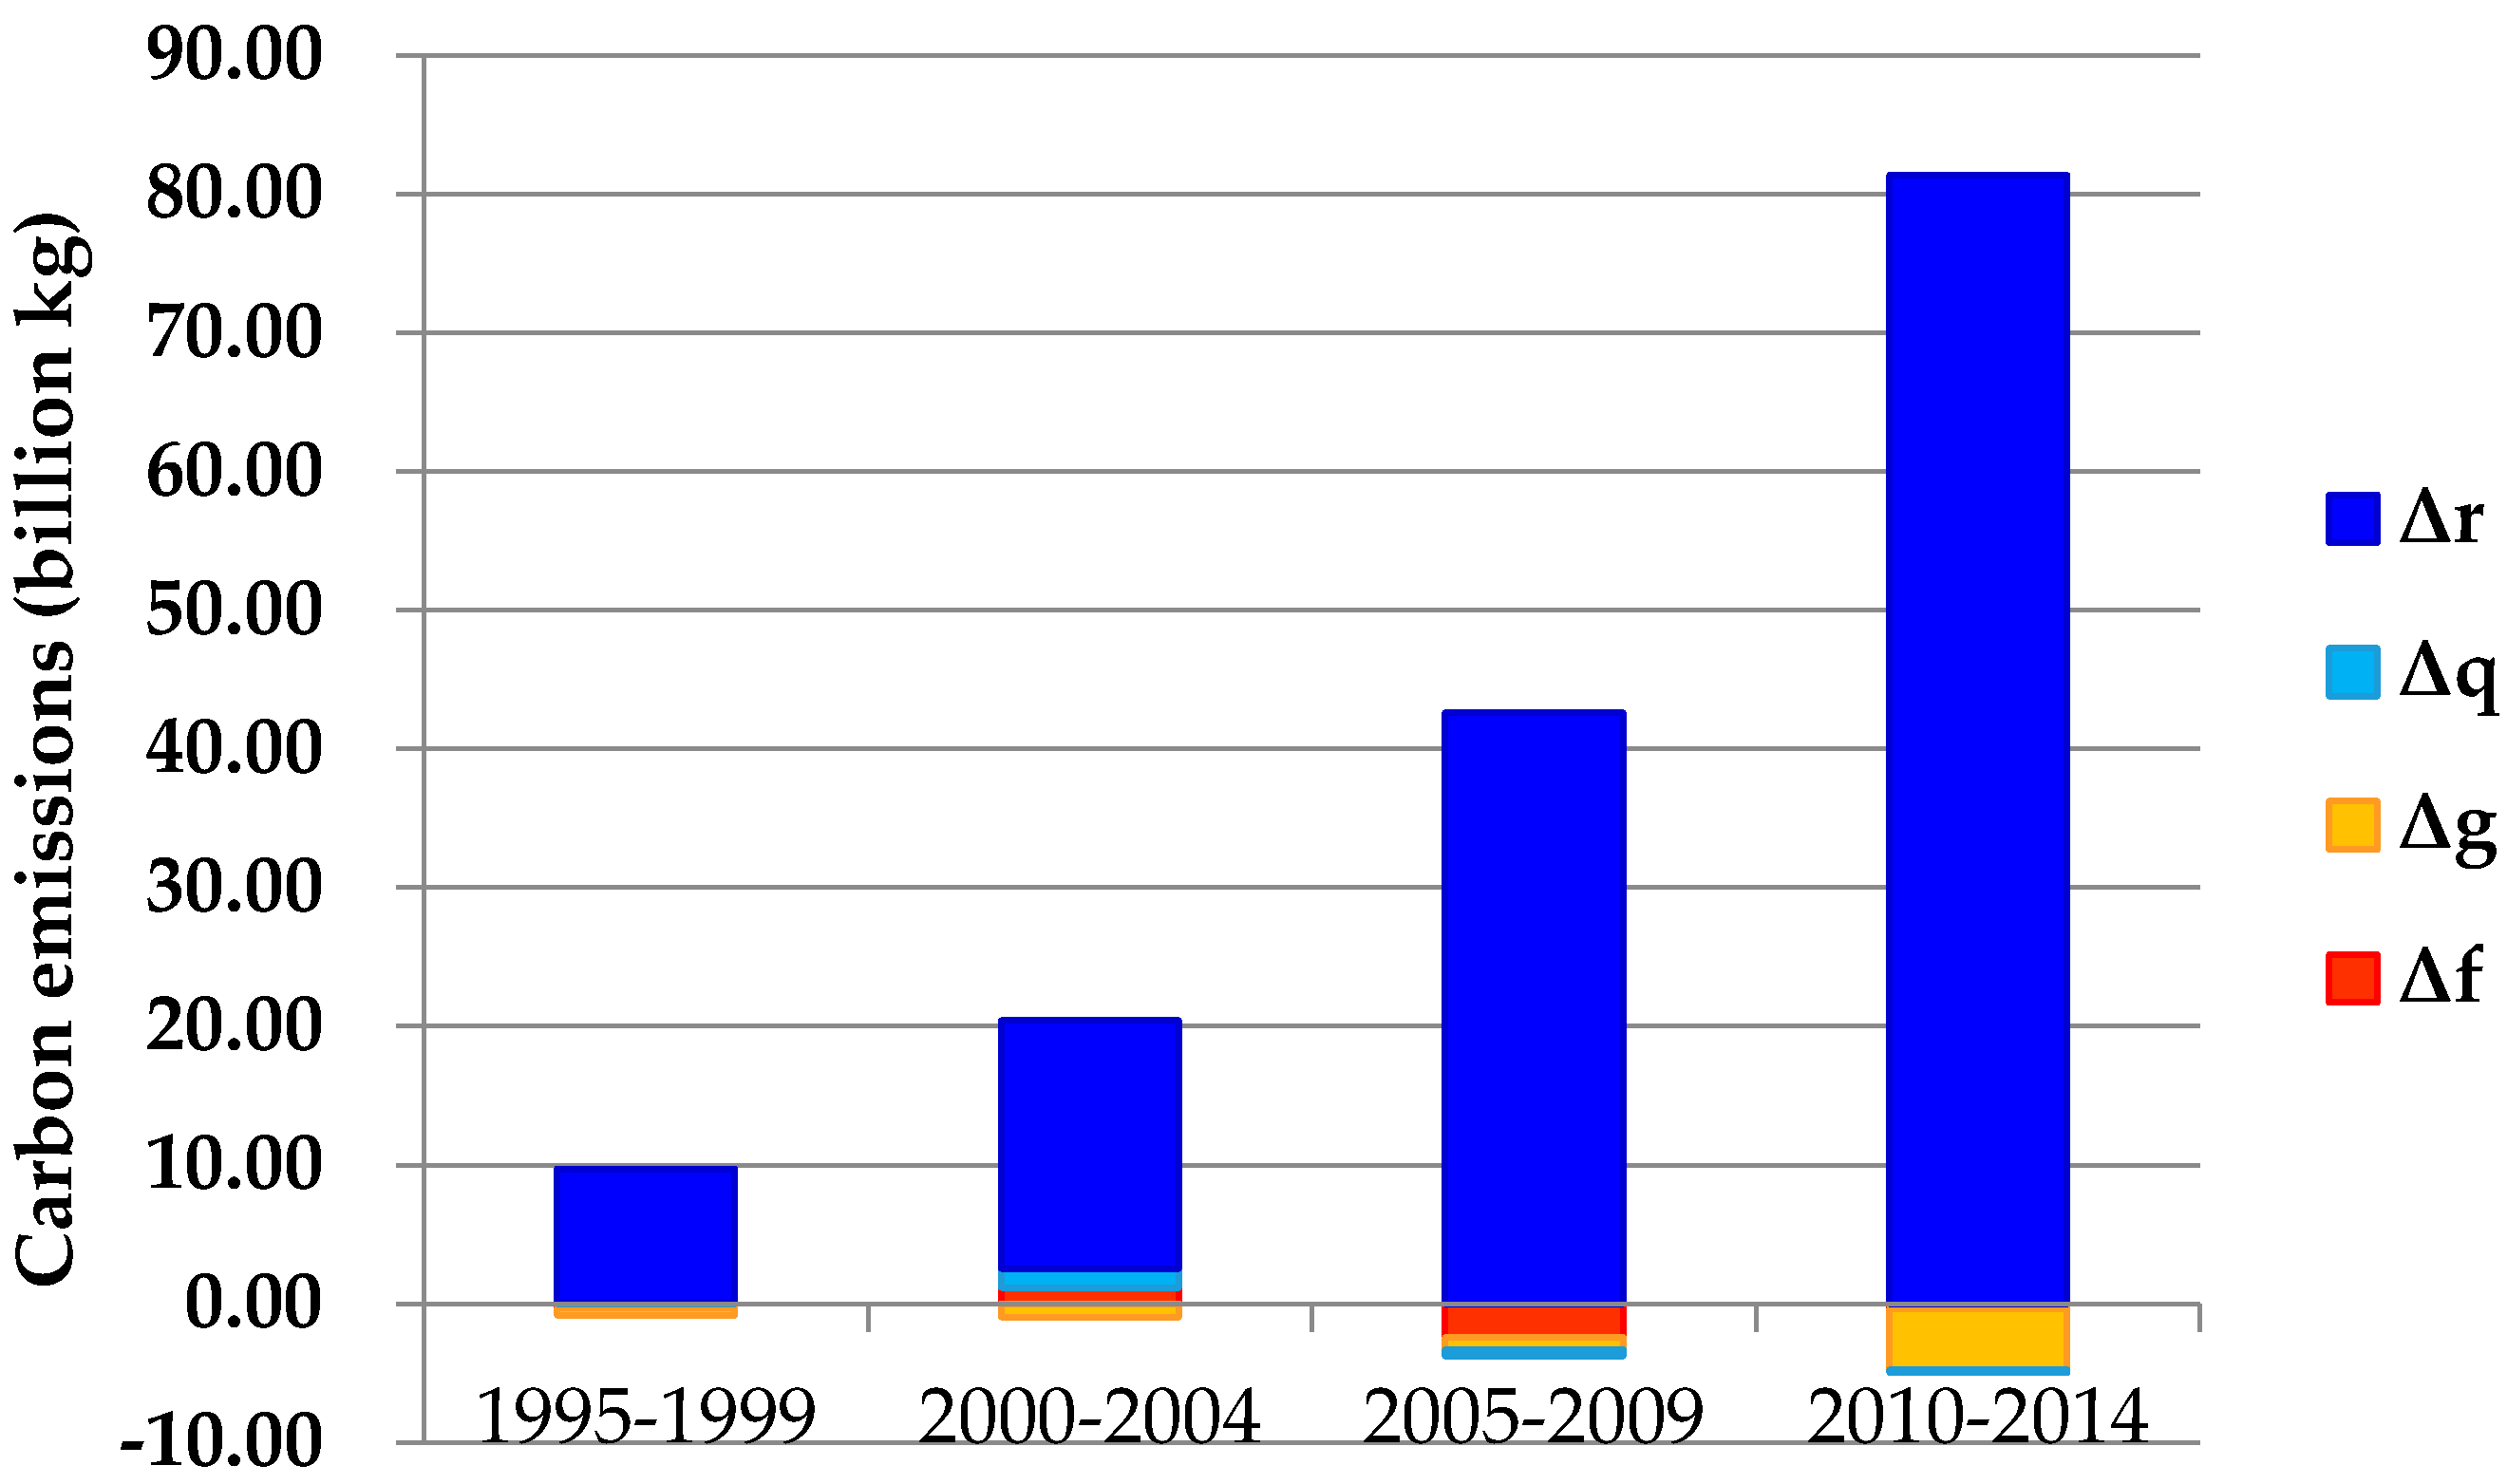
Figure 3.
Trajectory of eco-efficiency in Chinese tourism between 1995 and 2014.
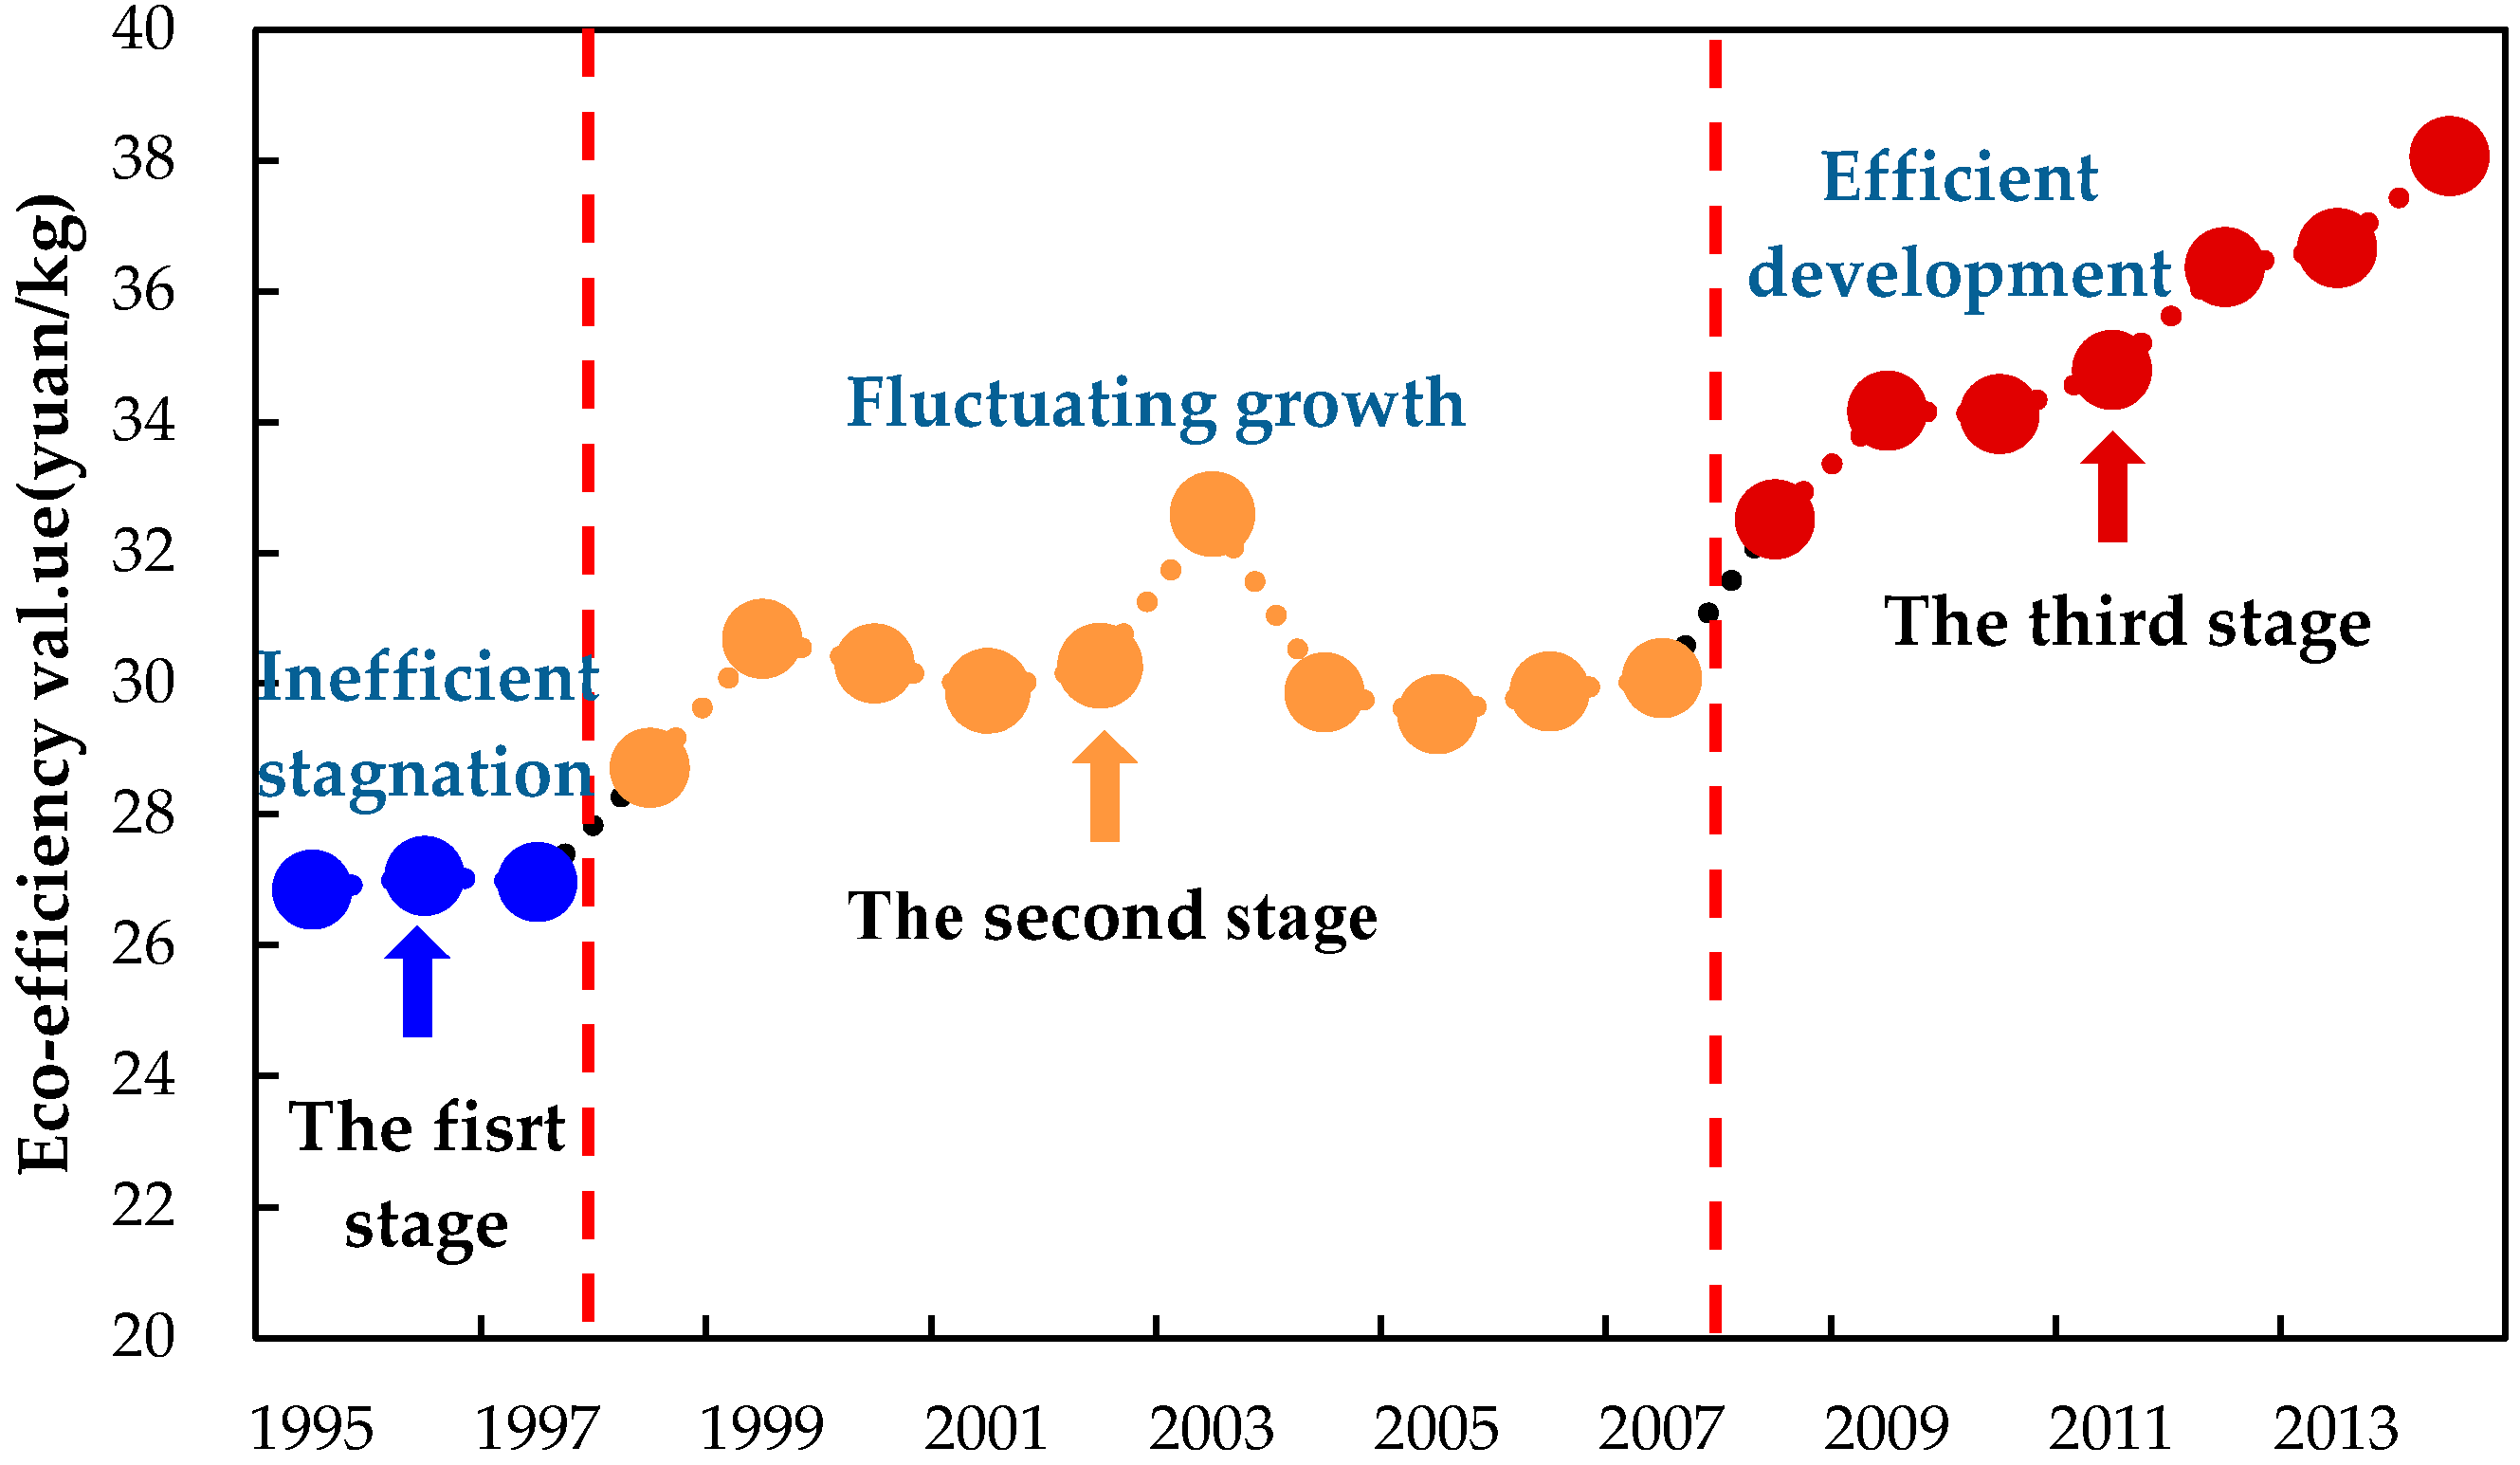
Figure 4.
Carbon emission intensity during the 1995–2014 period.

Figure 5.
The local spatial autocorrelation for tourism eco-efficiency in typical years.
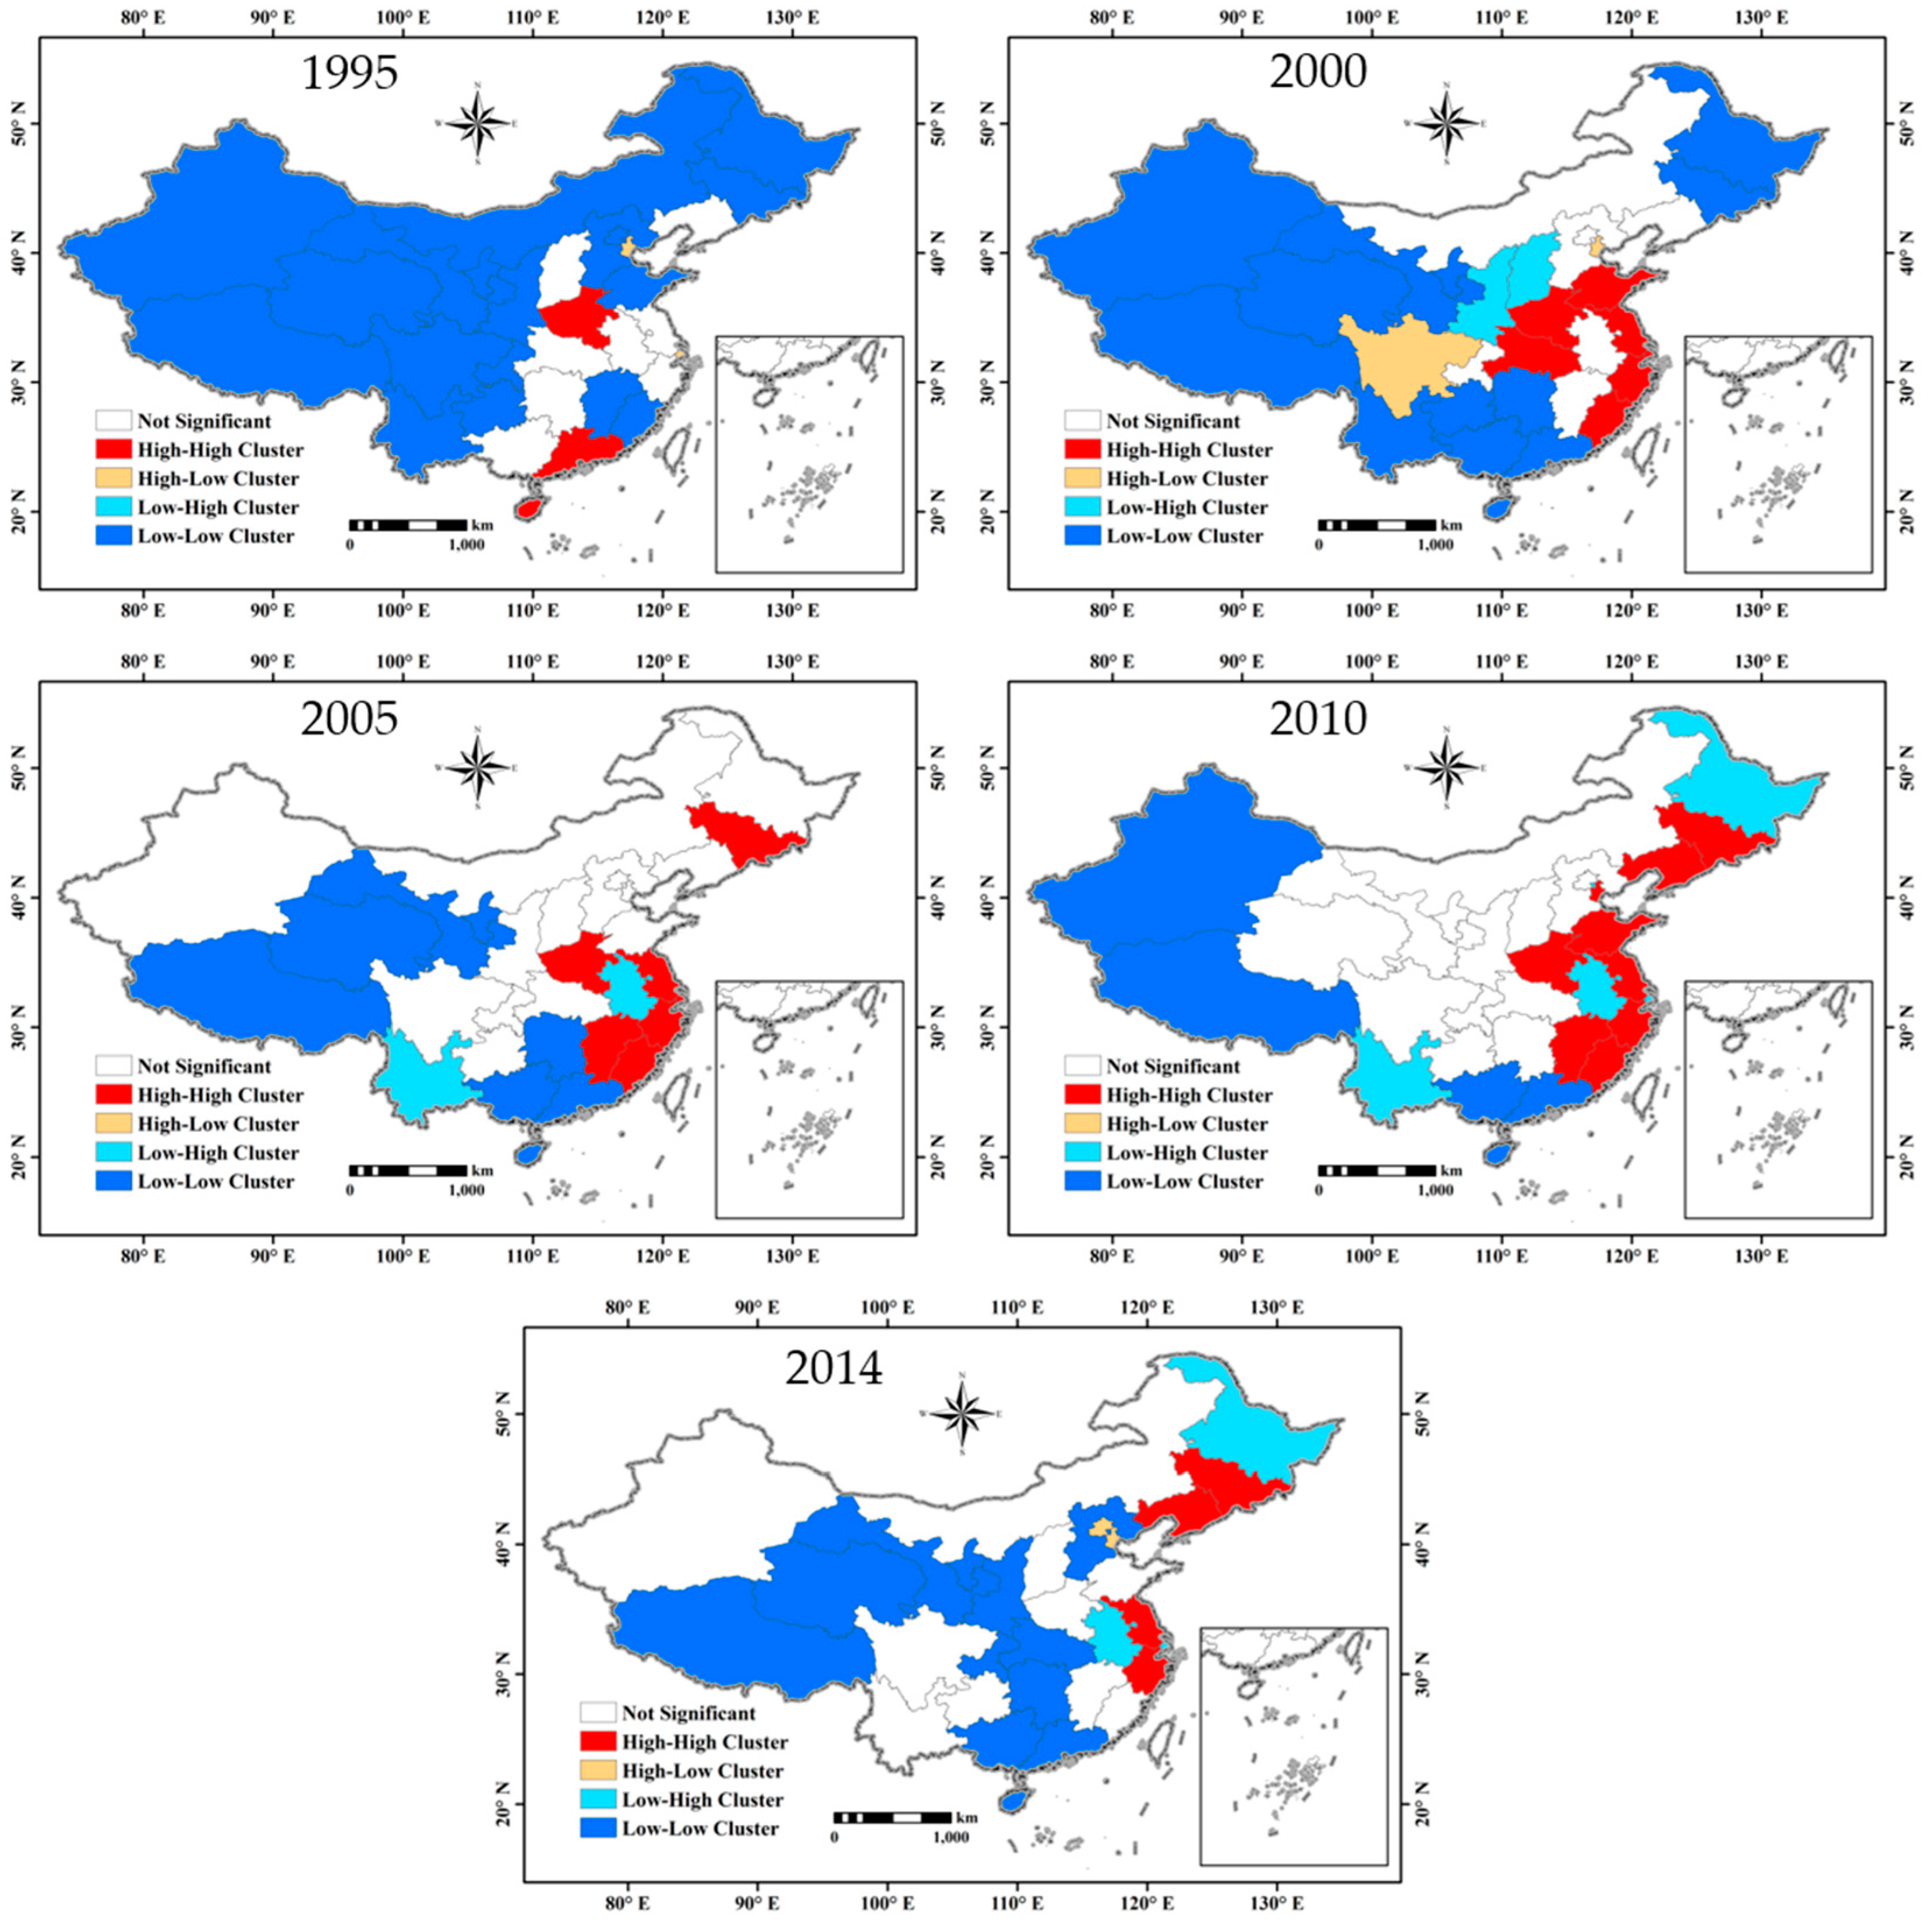
Figure 6.
Tourism eco-efficiency and growth rate of 31 provinces in China.

Table 1.
Factors for different transport modes.
| Transport Mode | Emission Factor () | Equivalence Factor |
|---|---|---|
| Air | 0.150 | 1.07 |
| Rail | 0.025 | 1.05 |
| Car | 0.075 | 1.05 |
| Ferry | 0.070 | 1.05 |
Table 2.
Energy intensities and emission factors for different levels of hotels.
| Star Levels of Hotels | Energy Intensity (MJ/per Bed Night) | Emission Factor (kg/per Bed Night) |
|---|---|---|
| Five-star hotels | 155 | 24.57 |
| Four-star hotels | 130 | 20.61 |
| Three-star hotels | 110 | 17.44 |
| Two-star hotels | 70 | 11.10 |
| One-star hotels | 40 | 6.34 |
Table 3.
emissions for different foods.
| Grain | Pork | Beef and Mutton | Poultry | Egg | Milk | |
|---|---|---|---|---|---|---|
| emissions (kg/kg) | 1.74 | 1.67 | 25.08 | 0.55 | 0.81 | 1.53 |
Table 4.
Descriptive stats of the variables in the regression model.
| Variable | Mean | Min | Max | SD |
|---|---|---|---|---|
| Tourism eco-efficiency (yuan/kg) | 29.502 | 3.555 | 70.836 | 10.705 |
| Per capita tourism income (yuan) | 1787.826 | 15.325 | 12,200.408 | 2185.366 |
| Number of visitors per capita (person times) | 2.508 | 0.135 | 12.151 | 2.486 |
| The ratio of the star hotel’s revenue that accounts for total tourism income (%) | 7.923 | 0.805 | 83.820 | 6.946 |
| Energy consumption per ten thousand yuan of tourism revenue (Tons of standard coal./10,000 yuan) | 44.255 | 2.602 | 732.835 | 76.133 |
| Discharge of wastewater per ten thousand yuan of tourism revenue (Tons/10,000 yuan) | 691.206 | 54.010 | 6674.788 | 839.909 |
| The ratio of pollution charges to tourism revenue (%) | 0.988 | 0.007 | 7.497 | 1.045 |
Table 5.
Contribution of different influencing factors to changes in tourism CO2 emissions (%).
| Factors | 1995–1999 | 2000–2004 | 2005–2009 | 2010–2014 | Total |
|---|---|---|---|---|---|
| Carbon emission intensity factor | −3.51 | 5.91 | −6.28 | −0.52 | −1.39 |
| Income structure factor | −5.82 | −5.01 | −2.32 | −5.74 | −4.72 |
| Consumption level factor | 1.07 | 7.01 | −1.11 | −0.28 | 0.56 |
| Tourist scale factor | 108.26 | 92.09 | 109.71 | 106.54 | 105.55 |
Table 6.
Classifications based on comparison with the national average.
| Group Types | Provinces | Division Standards |
|---|---|---|
| HH group | Beijing, Tianjin, Shandong, Zhejiang, Jiangsu, Fujian, Liaoning, Jilin, Sichuan, Jiangxi, Guangxi | E 1 > 31.47, r 2 > 1.85 |
| HL group | Shanghai, Hubei, Chongqing, Henan | E > 31.47, r < 1.85 |
| LH group | Tibet, Inner Mongolia, Gansu, Shaanxi, Yunnan, Qinghai, Heilongjiang, Ningxia, Xinjiang, Hebei, Hunan, Anhui, Shanxi | E < 31.47, r > 1.85 |
| LL group | Hainan, Guangdong, Guizhou | E < 31.47, r < 1.85 |
Note: 1 denote tourism eco-efficiency (yuan/kg), 2 denotes growth rate (%).
Table 7.
Panel corrected standard errors (PCSE) estimation results for tourism eco-efficiency in China.
Table 7.
Panel corrected standard errors (PCSE) estimation results for tourism eco-efficiency in China.
| Variable | HH Group | HL Group | LH Group | LL Group |
|---|---|---|---|---|
| Ln(PCTI) | 0.7590 | 0.5470 | 0.8218 | 0.7393 |
| (14.9550) *** | (5.7683) *** | (18.4579) *** | (7.5392) *** | |
| Ln(NVPC) | −0.7793 | −0.4646 | −0.6356 | −0.8391 |
| (−16.1679) *** | (−6.4242) *** | (−15.9624) *** | (−14.9796) *** | |
| Ln(RSHR) | −0.1663 | −0.1492 | −0.0787 | −0.0482 |
| (−5.9177) *** | (−4.4485) *** | (−3.6970) *** | (−0.9176) | |
| Ln(ECTR) | −0.0764 | −0.2403 | −0.0667 | −0.0983 |
| (−1.6870) * | (−2.6673) *** | (−1.5580) | (−1.2244) | |
| Ln(DWTR) | 0.1439 | 0.3536 | 0.2313 | 0.0078 |
| (4.7851) *** | (5.3788) *** | (6.8082) *** | (0.0904) | |
| Ln(RPCR) | −0.0728 | 0.0492 | −0.0062 | −0.0456 |
| (−3.9672) *** | (0.8772) | (−0.2753) | (−1.0086) | |
| Constant | −1.7745 | −1.1834 | −2.9874 | −1.2630 |
| (−4.2427) *** | (−1.0681) | (−6.5952) *** | (−1.0944) | |
| Adjusted R-squared | 0.9398 | 0.8984 | 0.9131 | 0.9538 |
| F-statistic | 214.8612 *** | 76.6806 *** | 148.7301 *** | 153.3823 *** |
Note: Numbers in parentheses are t-statistics. *** denotes significance at 1%, and * denote significance at 10%.
© 2017 by the authors. Licensee MDPI, Basel, Switzerland. This article is an open access article distributed under the terms and conditions of the Creative Commons Attribution (CC BY) license (http://creativecommons.org/licenses/by/4.0/).
Share and Cite
MDPI and ACS Style
Qiu, X.; Fang, Y.; Yang, X.; Zhu, F. Tourism Eco-Efficiency Measurement, Characteristics, and Its Influence Factors in China. Sustainability 2017, 9, 1634. https://doi.org/10.3390/su9091634
AMA Style
Qiu X, Fang Y, Yang X, Zhu F. Tourism Eco-Efficiency Measurement, Characteristics, and Its Influence Factors in China. Sustainability. 2017; 9(9):1634. https://doi.org/10.3390/su9091634
Chicago/Turabian StyleQiu, Xiaoping, Yiping Fang, Xueting Yang, and Fubiao Zhu. 2017. "Tourism Eco-Efficiency Measurement, Characteristics, and Its Influence Factors in China" Sustainability 9, no. 9: 1634. https://doi.org/10.3390/su9091634
Note that from the first issue of 2016, this journal uses article numbers instead of page numbers. See further details here.