Demand-Oriented Design Strategies for Low Environmental Impact Housing in the Tropics


1
Department of Architecture, National Cheng Kung University, Tainan 701, Taiwan
2
Department of Real Estate & Built Environment, College of Public Affairs, National Taipei University, Taipei 104, Taiwan
*
Author to whom correspondence should be addressed.
Sustainability 2017, 9(9), 1614; https://doi.org/10.3390/su9091614
Submission received: 18 August 2017
/
Revised: 7 September 2017
/
Accepted: 8 September 2017
/
Published: 11 September 2017
Abstract
:This study aims to propose design strategies for low environmental impact (low-EI) housing in the tropics while incorporating user needs to increase its acceptance in the market. The Fuzzy Delphi method (FDM) is adopted initially to draw the user needs for contemporary housing, after which the crucial design factors are identified. The analytic network process (ANP) and house of quality (HOQ) are further utilized to incorporate weightings of user needs into crucial design factors to establish appropriate design strategies. The results show “utility” (0.177), “durability” (0.169), and “comfort” (0.168) are the three greatest user needs for housing. After incorporating the weightings of user needs into design factors, building layout (0.334) and materials (0.302) turned out to be the most important considerations during the planning phase of the design procedure. Correspondingly, during the detailed design phase in the procedure, the most important factors are “low-EI material” (0.195), “orientation” (0.176), “building relationship” (0.158), and “energy-saving material” (0.107). The findings stress the significance of architectural programming and passive design for wider acceptance of low-EI housing in the tropics.
1. Introduction
The building sector consumes 40% of fossil fuels, 30% of raw materials, 25% of water, and 12% of land globally [1], which has contributed to the gravity of the energy shortage while expediting human-caused climate change. Among different building types, residential buildings are responsible for 27% of global energy consumption and produce 17% of global CO2 emissions [2]. The consequent impact on the environment cannot be ignored. To implement sustainable development in the built environment, reducing energy consumption, lowering CO2 emissions, and adopting low-environmental-impact (low-EI) materials are essential for the corresponding measures [3]. Buildings constructed with high energy materials have higher energy demand in the building production stage. Furthermore, inappropriate materials induce extra energy consumption due to heating, cooling or ventilation during the occupation and demolition stages [4,5]. The occupation phase alone accounts for approximately 70–90% of the total environmental impact [6,7]. Thus, making the right decision on construction methods, materials and installations is critical to reducing environmental impact [6,8]. Material selection as well as the bioclimatic characteristics of a building must be well evaluated or analyzed at the early design phase [3,8]. Consequently, it is vital to reduce the energy use and environmental impact attributed to the housing sector, especially in the early planning and design phases, which preordain the environmental impact levels of housing. Design principles for low-EI buildings in the tropics, where 41.49% of the world’s population reside [9], greatly differ from those in temperate and cold regions [10,11]. These scarcely discussed design principles are worth exploring to increase the usage rate of this type of housing in the tropics, and ultimately enhance the environmental sustainability of the world.
As opposed to design and production technology for producing low-EI housing, there are other factors associated with user needs that influence the acceptance of this housing type. Users and suppliers, i.e., developers, designers and constructors, often have different understandings of the building requirements, also known as the user–supplier discrepancy [12]. Hence, acceptance for this type of product is low on the market when they only address technical solutions but neglect user needs.
Under such circumstances, this study aims to propose design strategies which incorporate the user needs for low-EI housing, especially in the tropical climate, to increase the acceptance of the types of housing on the market, and to subsequently reduce environmental impact to improve the sustainability of the environment.
2. Literature Review
2.1. User Needs for Housing Performance
In addition to reducing environmental impact, low-EI housing must also satisfy basic performance requirements as a residential building. However, different stakeholders have different considerations and needs, which result in different functional requirements [13]. While a supplier attaches more importance to economic considerations, users value issues such as comfort, health and safety instead. Hence, such discrepancies should be taken into consideration when trying to achieve ideal building performance [14,15,16]. Specifically, suppliers should consider user needs when formulating design strategies.
Basic standards for the living environment have long been established, excepting adjustments responding to the rapidly aging society. In 1961, the World Health Organization (WHO) recommended that the fundamentals of a healthy residential environment include effective fulfillment of human needs and harmony with local factors such as climate, geography, and social practice, as well as customs and traditions, which may be summarized into four key characteristics: safety, health, convenience, and comfort [17]. The International Organization for Standardization (ISO) published the Performance Standards in Building in 1984, which address user requirements in and around buildings in various categories such as stability, fire safety, safety in use, tightness, air purity, acoustical requirements, visual requirements, hygiene requirements, dynamic requirements and durability [18]. Huovila et al. classified user needs into six categories based on the building energy performance indicators of the International Energy Agency (IEA): (1) function (including usability, adaptability, and maintainability); (2) environmental loading (including use and construction); (3) resource use (including energy, water, and materials); (4) lifecycle cost (including the cost of investment, use, and maintenance); (5) indoor quality (including acoustic comfort, thermal comfort, lighting and indoor temperature and humidity; and (6) building quality [19]. McLennan put forth 15 principles for the living spaces of the future: (1) adjust indoor lighting and temperature according to changes in the season and day; (2) reconnect humans with the external environment using landscaping and natural light; (3) adjust thermal comfort, ventilation and lighting controls according to the body conditions; (4) use primarily natural lighting; (5) use low-maintenance but healthy and durable materials; (6) use passive strategies to leverage natural ventilation and sunlight to reach thermal comfort; (7) invest in art and design artistic products to create an aesthetically pleasing environment; (8) acoustic comfort; (9) improve landscaping and enhance visual perception; (10) regular maintenance for good building performance; (11) indoor air quality; (12) personalized space; (13) ergonomic design; (14) reduce environmental impact and waste; (15) reconnect nature and architecture with biophilic design [20].
When compared with other building types, users of residential buildings attach a special value to comfort. People feel a strong sense of attachment toward their homes and want to have an environment that is physiologically and psychologically comfortable [21]. In developed countries, people spend more than 90% of their time indoors [22] and nearly 100% of their sleeping time indoors, making thermal comfort, noise, light, air quality and natural landscape critical factors for the indoor environment and sense of well-being [21,23]. Users will modify their physical environment for more satisfaction. Adaptability and flexibility of housing, which allow certain transitions of uses during occupation, can increase the comfort level and quality of a space [24,25].
Kim et al. presented a housing performance evaluation model for homebuyers to compare and decide on the performance of a home. In this model, residential comfort is classified into four aspects: (1) thermal comfort (including temperature, humidity, and thermal insulation); (2) acoustic comfort (including noise and sound insulation); (3) visual comfort (including daylighting, artificial lighting, and view); and (4) indoor air (including indoor air quality and ventilation) [26].
2.2. Low-EI Building and Techniques
Regardless of whether user needs are reflected, techniques associated with low-EI housing lie in the competence of suppliers, and usually are delivered by designers and manufacturers. Low-EI buildings, also called green buildings, generally refer to both the construction process and building usage that are environmentally responsible and resource-efficient throughout the entire life cycle of the building: from site planning, construction, operation, maintenance, renovation, and demolition [8,27,28,29]. Techniques for low-EI buildings have been the subject of much research in past decades. The Royal Institute of British Architects (RIBA) proposed six significant principles for low-EI design: comprehend energy use for the building type, utilize the form and fabric of the building to reduce energy demand, concentrate on insulation and air tightness, adopt high-efficiency building services with low-carbon fuels, apply low-carbon operations within the building, and incorporate renewable energy systems [30]. Based on the ecological and carbon footprint of different development densities, housing design of zero energy development (ZED) utilizes various sets of low-carbon housing strategies for non-urban, urban, domestic, work and urban high-rise categories. They include the use of renewable energy such as solar and wind power generation systems in addition to micro fuel, biofuel or local wood-based fuel to reduce the consumption of fossil fuel [31]. Lovell pointed out the design techniques used in low-EI housing, including passive energy-saving design, thermal efficiency considerations and the use of renewable energy [32]. In addition, a careful selection of low-EI materials can reduce CO2 emission by up to 30% in the construction phase [14]. Previous research into low-EI buildings strongly emphasizes the value of the early planning and design phases during the building production processes, such as the orientation of buildings, bioclimate characteristics, and material selection [3,8,33,34].
2.2.1. Passive Design Approach in the Tropics
After the first energy crisis in 1973, passive design came to light, and there was growing focus on reducing dependence on artificial lighting, ventilation and air-conditioning, as well as developing energy-smart techniques based on vernacular and climate-sensitive architecture [35]. The shape, internal spatial arrangement, size of a building and the azimuth of the sun all affect the energy consumption of a building.
Contrary to cold-climate countries requiring mainly heating, buildings in hot and humid climates need to minimize unnecessary solar radiation and utilize natural ventilation to reduce energy use [36]. Buildings should be arranged to maximize shading and thereby reduce heat gain. The direction of the wind is more important than the duration of sunshine when orienting buildings, and natural ventilation should be ensured [37,38,39]. The shape of the building should be slender and flat in order to maximize cross ventilation and natural lighting [39]. Heat gain from fenestration should be minimized. The smallest facades should face east–west [39] and ventilation and shading should be enhanced. The longer axis of the building should be perpendicular to the summer wind, and an open plan should be adopted with its spatial layout adjusted according to the directions of wind and sun [40,41]. The provision of a veranda can help block rain, excessive light, and indoor heat gain while helping to diffuse natural light. The roof form should facilitate ventilation. In a building with a deep plan, the inclusion of a courtyard enables natural ventilation and lighting [39]. Building materials for the walls and floors should be lightweight [39]. Using materials with a low thermal conductance for walls alone could reduce energy demand by as much as 28% [42].
Because natural ventilation reduces energy consumption [43], it should be incorporated at the very beginning of the design stage, i.e., during architectural programming. Standard 55 of American Society of Heating, Refrigerating and Air-Conditioning Engineers (ASHRAE) [44] provides the comfort standards for natural ventilation in hot and humid climates. It suggests that a wind velocity of 0.8 m/s helps reduce the operative temperature by 2.6 degrees. The following architectural elements have an effect on the movement of wind inside a building: the form and size of windows [45,46], the form and height of roofs [47], shading, overhangs, balconies [48], courtyards and gardens [49,50], building depth-to-height ratio [51], building orientation [52], and density [53].
Since diurnal temperature variation in tropical climates is relatively small, horizontal cross ventilation should be used primarily. This means bigger is better for both interior and exterior wall openings [37], where shades are needed to avoid direct solar gain. To achieve comfort and good ventilation, the total area of operable windows should account for 20% of the floor area and be evenly distributed over shaded windward and leeward facades. Due to high humidity and abundant rain in hot and humid climates, large overhangs should be provided as shelter from rain, and windows should be kept open in any weather and throughout the day [54]. A thermal buffer zone should be incorporated in residential design, with primary spaces at the core and secondary spaces or those with shorter usage periods wrapping the perimeter as a buffer [55].
2.2.2. Active Design Approach
Contrary to passive design, active design utilizes building systems to take advantage of natural resources or enhance the efficiency of fossil fuels [35]. Common active design techniques in housing generate renewable energy by using photovoltaic installations, solar water heaters or wind turbines, and reduce energy demand by enhancing automation through intelligent building control systems.
Smart living space utilizes a network of sensors and automatic control systems to regulate home appliances [56], provide indoor temperature control, window shading, rain and wind shelter, lighting and security, and monitor energy use in terms of water, electricity and gas [57]. In recent years, the use of information technology and the internet to automate controls over air-conditioning, lighting and home appliances has grown increasingly common, helping to improve quality of life and achieving energy-efficient residential design [58].
3. Methodology and Research Design
3.1. Research Process
As in any typical design problem, the criteria for user needs (quantitative and qualitative) in low-EI housing in the tropics must undergo a transformation into design factors, which affect the design and production process as well as product quality. In this study, house of quality (HOQ) is adopted to perform this intricate and crucial transformation (Figure 1). To prepare for the HOQ, two measures were conducted. Firstly, user needs were generated with Fuzzy Delphi method (FDM) and evaluated with the analytic network process (ANP) to assess their interdependency. Secondly, the crucial design factors for low-EI housing were determined. The interdependency was also evaluated with ANP.
3.2. Fuzzy Delphi Method (FDM)
The Delphi method (DM) is an established and widely used interactive forecasting method for consensus building, which requires repetitive surveys to allow forecast values to converge [59]. However, in order to address its vagueness and ambiguity, Murray et al. combined it with the fuzzy set theory [60]. Max–min, fuzzy integration algorithms [59], and triangular fuzzy number [61] were then applied to DM as the Fuzzy Delphi method (FDM) to take into account the expert opinions. In this study, a max–min triangular fuzzy set is incorporated to identify the consensus importance value for the forecasting item. The FDM steps are as follows [62]: (1) Design Fuzzy Delphi questionnaire for selected items. Each item of the questionnaire is assessed by an evaluator team with a minimum value representing the evaluators’ most “conservative cognitive value” () of the item, and a maximum representing the most “optimistic cognitive value” (). (2) Calculate the tree scores of of each item i respectively, i.e., minimum , geometric mean , and maximum scores . Repeat the calculation for the tree scores of ”, i.e., minimum , geometric mean , and maximum scores . (3) Examine whether evaluators’ judgments converge using Figure 2: (a) If , and is larger than , it indicates there is no consensus among the evaluators. Steps 1 to 3 must be revised until all assessed items receive a consensus importance value Gi respectively. (b) If , and is smaller than , though there is no obvious consensus among evaluators, the result is acceptable. “Cognitive importance” Gi can be calculated from the responding value of the maximal membership of the intersection of fuzzy sets. (c) If the evaluator opinions about item i have an obvious consensus, .
A small sample size, mostly between 15 to 20 [63,64], is used in FDM, which is an attractive characteristic of the method. With a limited sample size, FDM can build consensus despite different perspectives from the participants while obtaining a reliable and objective opinion. It not only saves time and cost required for collecting expert opinions, but the experts’ opinions will also be sufficiently expressed without being distorted [65,66]. To determine user needs toward housing, a questionnaire was compiled based on the literature review in Section 2.1 and incorporated into the Fuzzy Delphi questionnaire. The questionnaire first underwent several rounds of expert scrutiny on its face and content validity, and was then administered to 42 potential homebuyers throughout Taiwan during one-on-one interviews. FDM was then applied to compile the user needs for this study.
3.3. The Analytic Network Process (ANP)
The Analytic Network Process (ANP) was generalized from the Analytic Hierarchy Process (AHP)—a broadly utilized method for multi-criteria decision-making—and the hierarchies are replaced with networks (Figure 3). AHP analyzes and deconstructs a phenomenon or situation into several independent components obtained from pairwise comparisons on the same level of the hierarchy [67]. However, the criteria and alternatives are often interdependent. ANP modifies the constitution based on the interactions between elements [68] and allows more complex interrelationships, such as interdependency and feedback in a network system. AHP can be seen as a special variation of ANP.
Since ANP is extended from AHP, both use the mathematical rule of pair comparison between elements in each pair and follow the logical order among all elements. However, ANP is more complicated, which allows inner dependence among elements to be included in a node and provides feedback among the nodes, because the importance of the criteria determines the importance of the alternatives as in a hierarchy, and vice versa [69]. This relationship can be presented through a suspermatrix composed of submatrices [70]. ANP, just like AHP, can be used in conjunction with many other methods in the multi-criteria decision analysis (MCDA) family [71], such as FDM, HOQ, Technique for Order of Preference by Similarity to Ideal Solution (TOPSIS), and Elimination and Choice Expressing Reality (ELECTRE), for a wide range of applications to choose or rank alternatives, allocate resources, create benchmarks, manage quality, formulate policies, and develop strategies [72]. Due to its high predictability, ANP can through a very small sample size achieve an adequate prediction [69].
ANP is adopted as a method of MCDAin various fields, such as educational administration, human resource management, corporate management, and environmental management, to conduct multidimensional forecasting, decision-making, alternative planning, and project selection [73,74]. The ANP approach was adopted to address the dependencies in the HOQ, as discussed in Section 3.4.
3.4. House of Quality (HOQ)
The goal of this study is to translate the user needs into housing design factors during the design progress to generate appropriate design strategies. With this purpose in mind, quality function deployment (QFD) [75,76] is an overall conceptual methodology fitting for this objective. QFD was introduced to convert the user needs, also called the voice of the customer [77], into technical or engineering requirements related to manufacturers [78,79,80]. It can cover the entire product development process, such as establishing marketing strategies, planning, design, production, and sales [81]. The most widely recognized and used form of QFD is house of quality (HOQ) [82,83,84,85], which utilizes matrices to translate user needs into design or production requirements [86] (Figure 4).
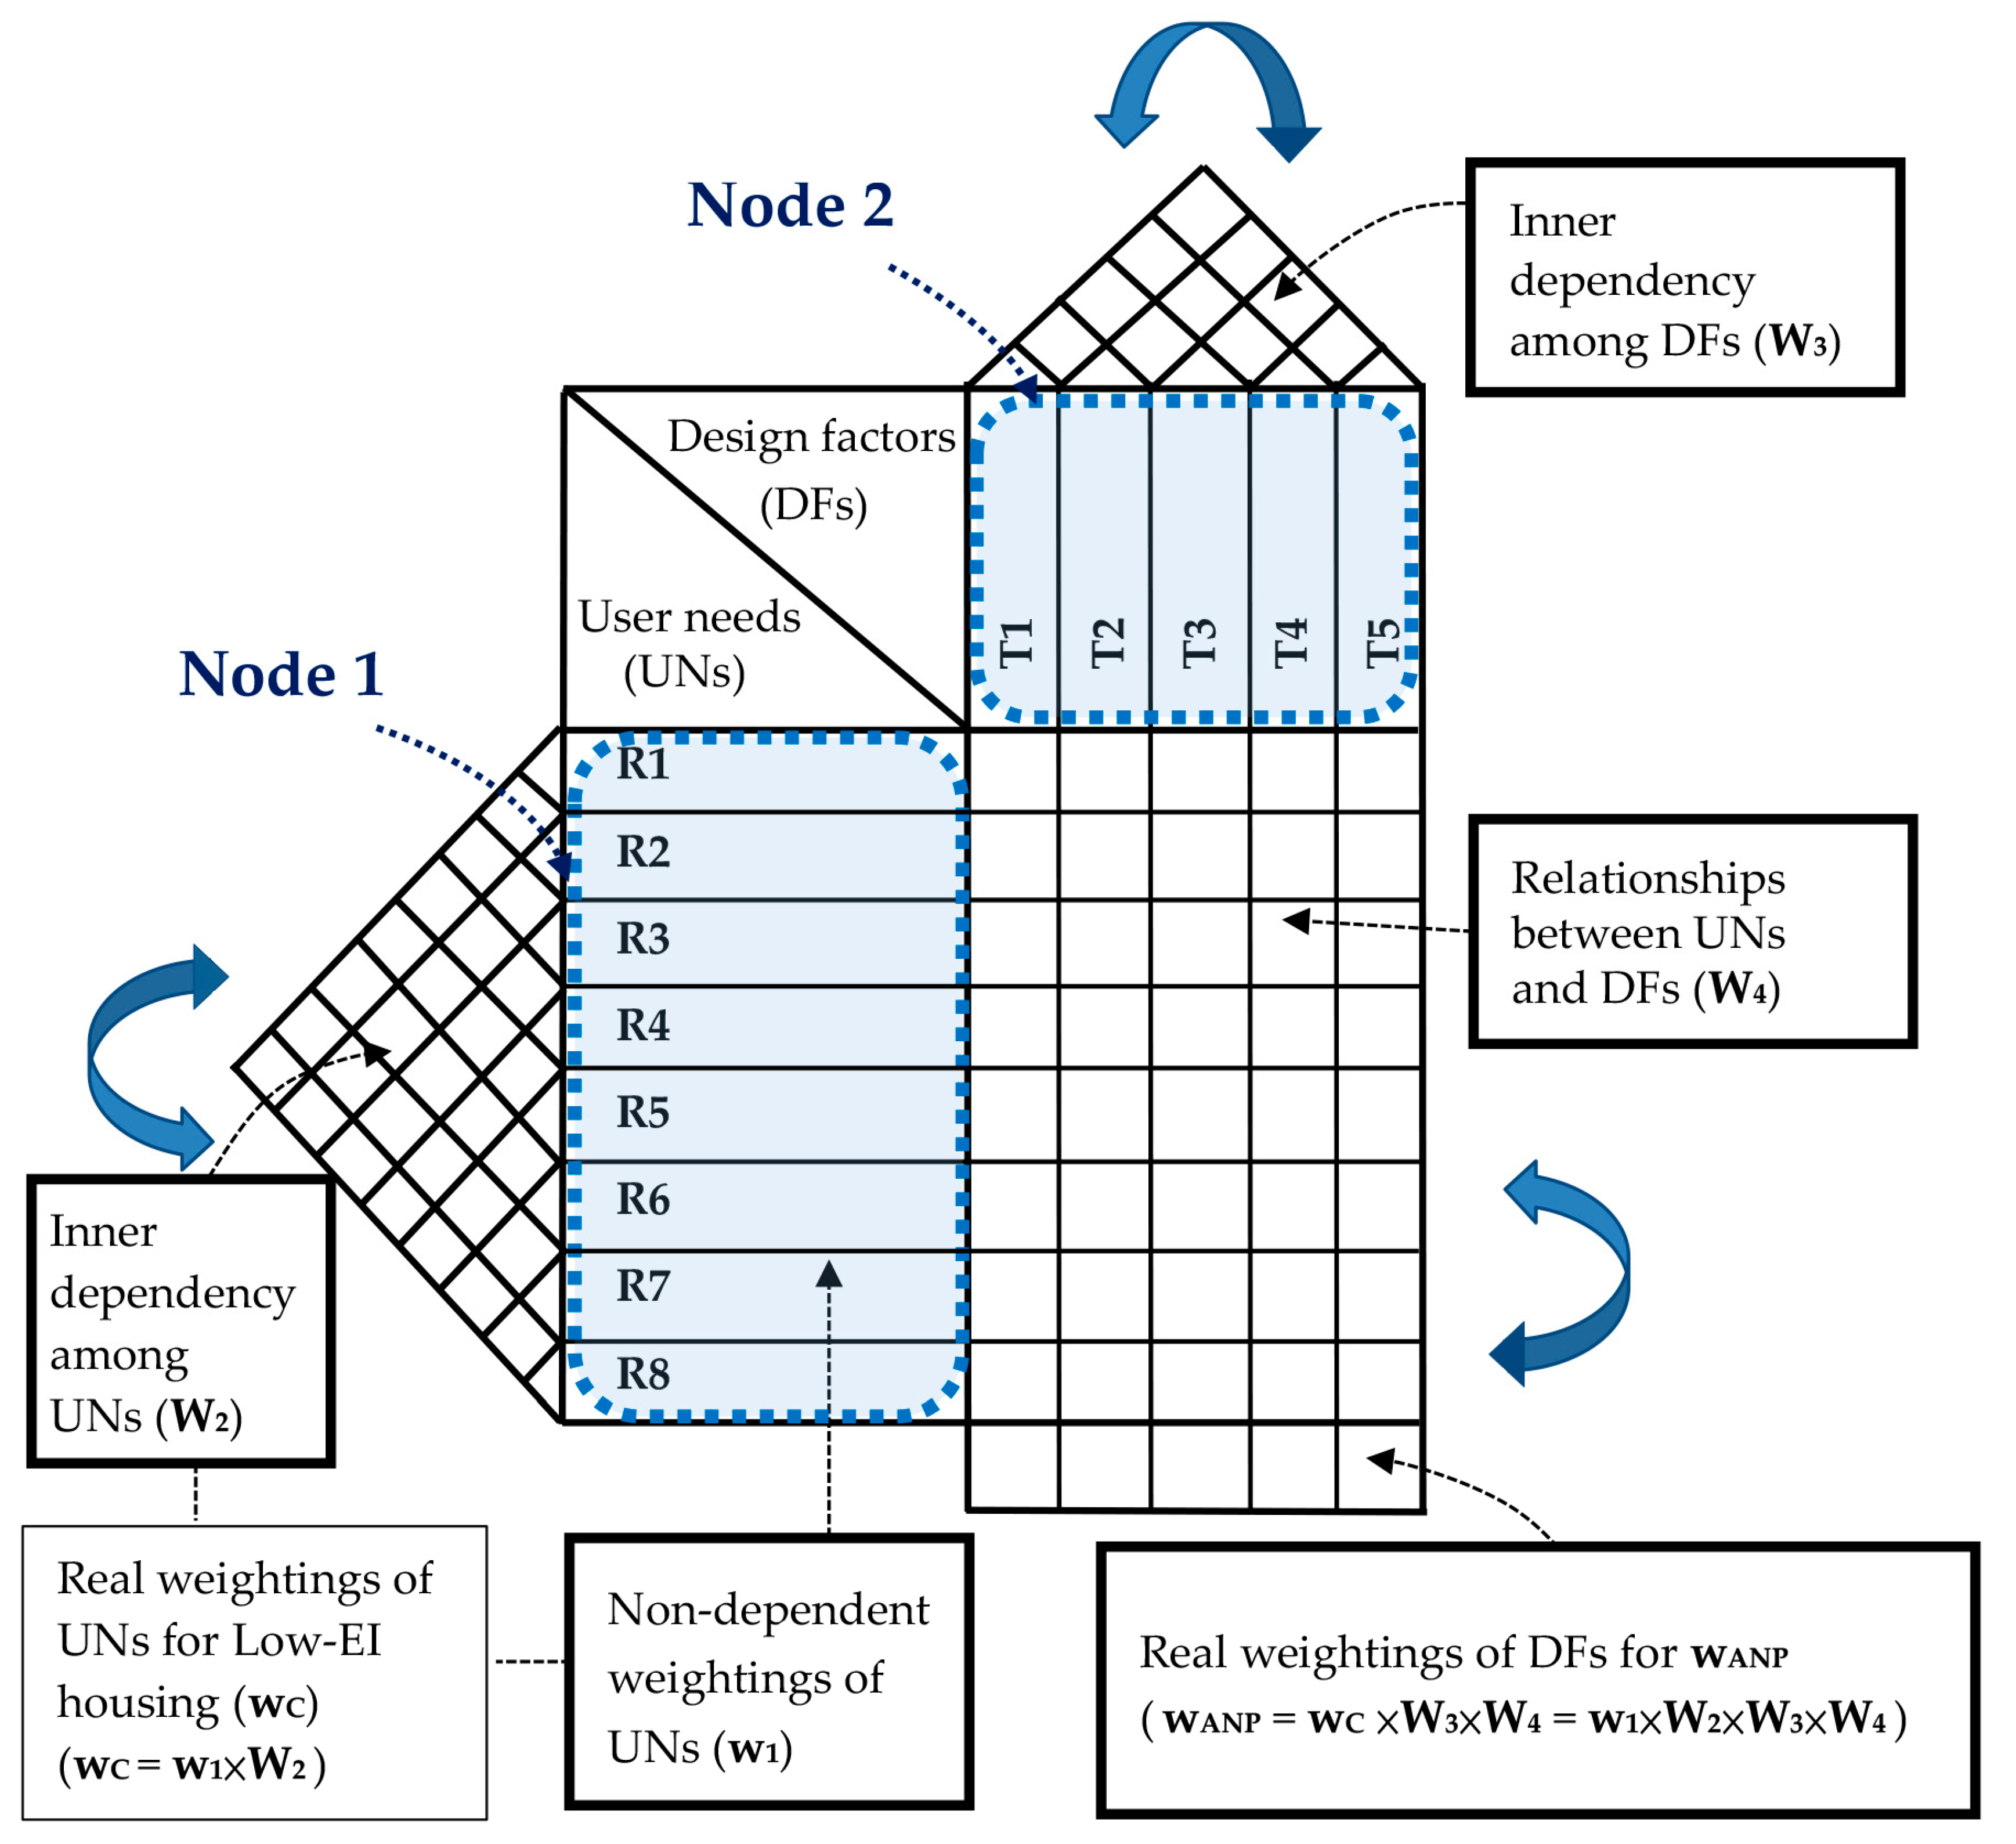
House of quality (HOQ) forms the core analysis of this study, and is implemented to transform user needs (UNs) into design factors (DFs) (Figure 5) in order to establish the appropriate design strategies for low-EI housing in the tropics, as described in the following procedure: (1) Assess the non-dependent weightings of UNs (w1). The UNs were established using FDM as described in Section 3.2, and the pairwise-compared values of the UNs for assessing w1 were also obtained from the same questionnaire for potential homebuyers. [67]. (2) Assess the inner dependency among the UNs using ANP to get the matrix W2. (3) Calculate the real weighting of the UNs (wC): Multiply the non-dependent weightings of UNs (w1) by their inner dependent matrix (W2) to obtain the real weightings of UNs. wC = w1 × W2. (4) Assess the inner dependency among design factors (DFs) using ANP to get the matrix W3. (5) Assess the bilateral relationship between UNs and DFs of low-EI housing using ANP to get the matrix W4. (6) Transfer the weightings of the UNs into DFs through multiplying W3 × W4 by wC to obtain the DF weightings incorporating user needs, i.e., wANP. wANP = wC × W3 × W4 = w1 x W2 x W3 x W4.
Due to the complexity of and expertise required for assessing interdependency among the factors, an expert team consisted of 12 professionals conducted the assessment of interdependency among the UNs (W2) and the DFs (W3). The bilateral relationships between the UNs and DFs (W4) were also evaluated.
3.5. Summary of Research Methods
The study aims to transfer user needs to design strategies, which includes several phases. Each phase has a different goal, and therefore requires a different method. First, the Fuzzy Delphi method (FDM) was adopted to draw user needs for contemporary housing, after which crucial design factors were identified from previous researches. The analytic network process (ANP) and house of quality (HOQ) were further utilized to incorporate the weightings of user needs into crucial design factors to establish appropriate design strategies. These research methods also demonstrate a design process with concurrent consideration of user needs and efficient resource allocation during housing production.
4. Results and Discussion
4.1. User Needs (UNs) for Housing and Their Weightings
Based on the literature review provided in Section 2.1, user needs (UNs) concerning temporary housing were compiled into three dimensions—residential environment, economy and function. They were further subdivided into nine factors in the homebuyer assessment—R1 comfort, R2 health, R3 resource economy, R4 cost efficiency, R5 safety, R6 durability, R7 utility, R8 maintainability, and R9 aesthetics (Table 1). FDM was then used to determine the actual UNs.
A questionnaire was then administered to 42 potential homebuyers throughout Taiwan. The questionnaire aimed at nuclear and two-generation families in northern, central, and southern Taiwan, where 17, 10, and 15 questionnaires were distributed, respectively. Multi-criteria decision analysis (MCDA), such as the Fuzzy Delphi method and ANP, require a smaller sample size, which is typically between 15 and 20 respondents [63,64], while still deriving objective and reasonable results. This method is not only time- and cost-saving for collecting expert opinions but also sufficient for obtaining experts opinions without distortion [61,65,66]. Among the 42 questionnaires, 20 were valid, and 22 were invalid because they failed the consistency test [67] for ANP due to the lack of logical consistency in their responses. Of the 20 valid participants, seven were female and 13 were male; eight were between the age of 20 to 35, seven were between 36 and 50, and five were over 50 years old.
The consensus value for each factor was obtained after analyzing the data with gray zone testing using fuzzy number calculation (Table 2). The threshold of the consensus value was set at 6.0 [87]. Therefore, R9 Aesthetics was eliminated. This indicates that the homebuyers consider aesthetics to be a less consensual UN than others. The framework of selected UNs is shown in Figure 6. The UNs were then incorporated into an ANP questionnaire for the HOQ procedure.
The software, SuperDecisions, was used during the ANP evaluation. According to the selected UNs, the weighting of the non-dependent UNs, i.e., w1, was generated with the pairwise comparison of the homebuyers’ needs (Table 3). The real weightings of the UNs (wC.) were then obtained through multiplying the non-dependent weightings (w1) by interdependency weightings (W2) (Table 4). In W2, the values in the diagonal line across the matrix from left to right are the highest numbers in each column, which indicates that when considering a particular factor, it holds the highest relative importance towards achieving the goals under such factor. The relationships within the ANP network, i.e., nodes, their inner dependence, and the correlations, are shown in Figure 7 in the form of a supermatrix.
Due to the inner dependence or redundancy within the UNs, the difference between weightings with and without incorporating the interdependency is clear (Table 5). This is the reason behind the modification of AHP with ANP to obtain more appropriate weightings that consider the overlaps among factors. Once the interdependency of factors is evaluated, suppliers and designers can make more accurate decisions when allocating resources during the design and production phases to avoid redundant investments.
As the results show, homebuyers attach the greatest value to the first three UNs—utility, durability, and comfort—if the redundancy in demand is considered, instead of safety, health, and comfort, without considering the replication (Table 5). The bottom two factors, resource economy and cost efficiency, received noticeably lower real weightings after the weightings were redistributed for interdependency among the needs. In other words, demand for the last two factors is partially covered if that for the first six is fulfilled.
4.2. The Design Factors (DFs) for Low-EI Housing in the Tropics and Their Interdependency
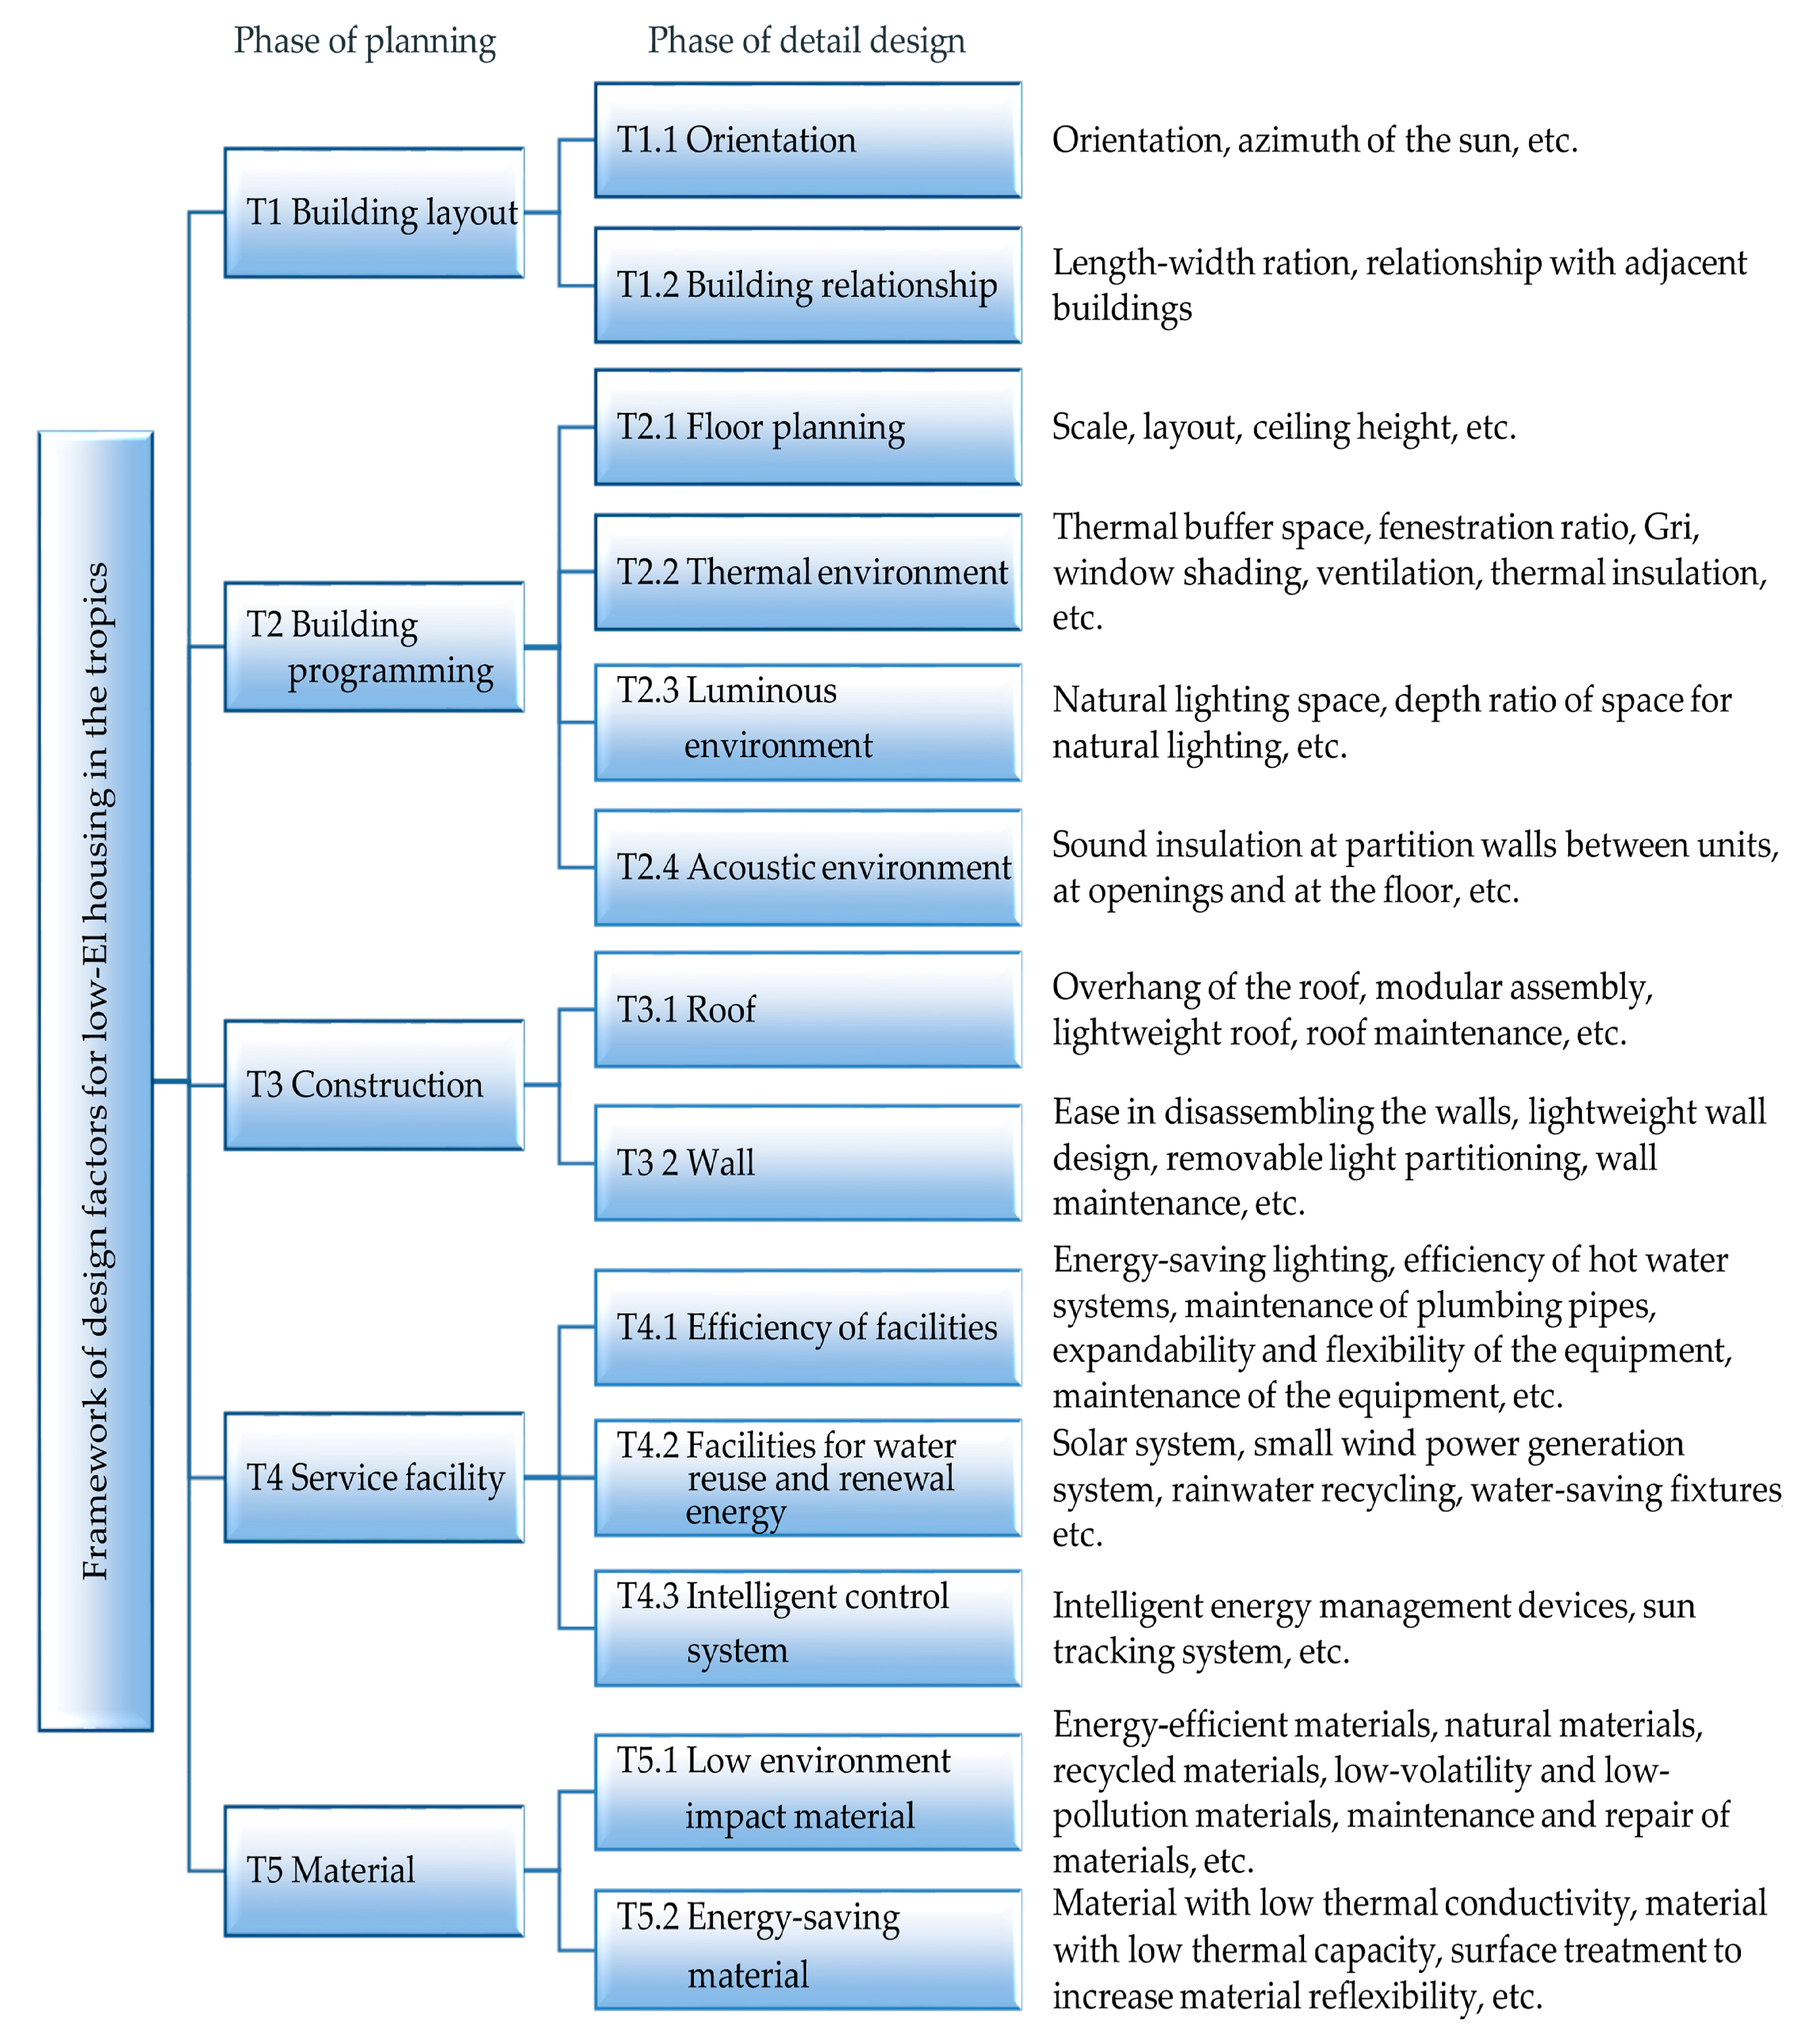
The concept of QFD stipulates that qualitative user needs be transformed into quantitative parameters for the design or production procedures. Figure 8 illustrates the framework of the DFs towards low-EI housing in the tropics based on practical considerations and the literature review, provided in Section 2.2, in preparation for the HOQ in the next step. To achieve design quality, the framework should be divided into subsystems and components [76]. In this case, the framework of the DFs was divided into the “planning phase” as the primary level and “detailed design phase” as the sub-level. Based on their interrelationship, the interdependency between DFs (W3) can be calculated using ANP (Table 6).
4.3. The Real Weightings of Design Factors (DFs) for Low-Environmental Impact Housing in the Tropics
After compiling the UNs, DFs, and the corresponding inner dependencies, w1, W2, and W3, HOQ was applied to translate the weightings of the UNs to the respective real weightings of the DFs (wANP). The relationship between the UNs and DFs, W4, was assessed as shown in Table 7. Using wc × W3 × W4, the real weightings of the DFs (wANP) in the planning phase were thus obtained (Table 8).
Identical to the redundancy in the UNs, the DFs with higher real weightings partially overlap with the factors with lower real weightings when interdependency is considered. Formulating a design strategy according to the real weightings would help avoid such redundancy or waste in allocating resources during the design and production phases. In the planning phase, “building layout” (T1, 0.334) and “material” (T5, 0.302) are the most important DFs, both exceeding 30% importance. Concentrating on building layout and material, designers would cover 63.6% of the user needs towards low-EI housing in the tropics, and over 81.4% if building programming is added. What is noteworthy is that “building layout” (T1) and “building programming” (T2) both fall under “architectural programming”, with over 51.2% importance for fulfilling user needs. In other words, “architectural programming” (T1 and T2) and material (T5) yield a combined 81.4% coverage for UNs. Notably, the importance of “service facilities” (T4), which refer to facilities with active design, such as solar and wind power systems, as well as efficient and intelligent facility control, is lower because the UNs for comfort and resource economy can be better achieved through passive design in the tropics than in temperate or cold regions. This is consistent with previous research regarding housing design for tropical areas [34,36,42,48,51]. These results serve as a useful reference in the planning phase in the design procedure for low-EI housing in the tropics.
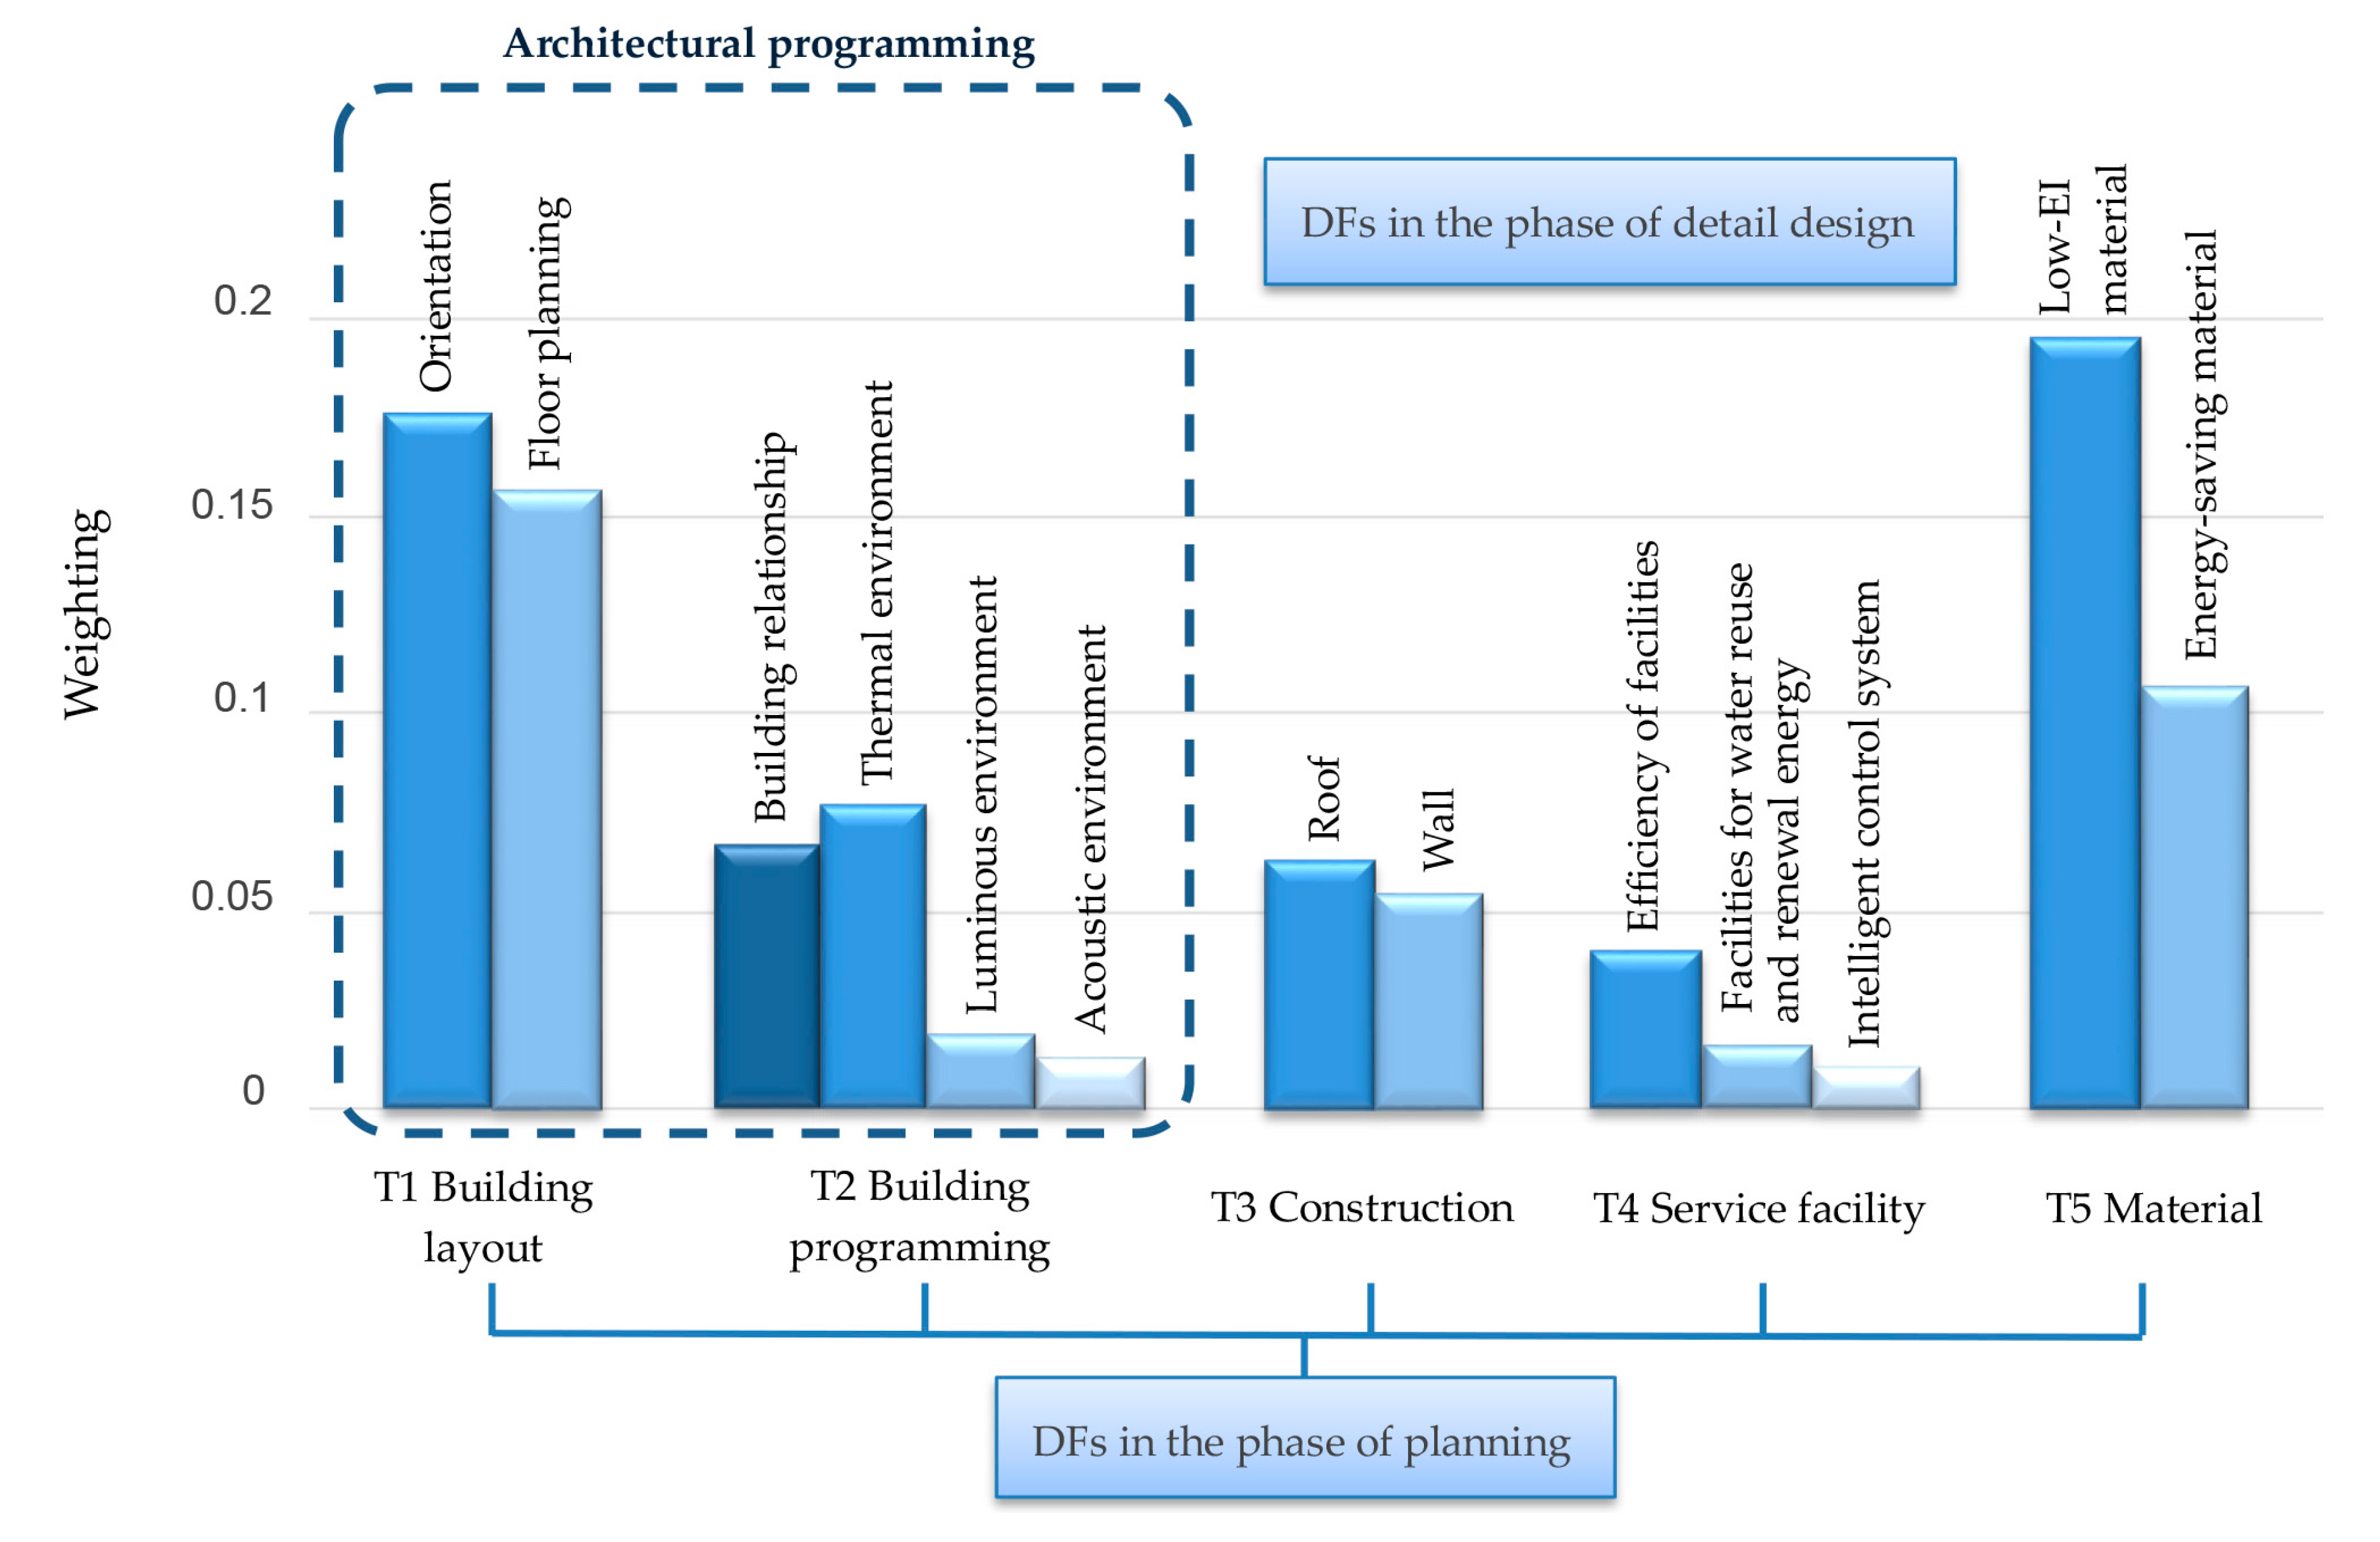
Using the relative weightings among the factors (w5i), the weightings in the planning phase were apportioned to the detailed design phase [67] (Table 9, Figure 9). The w5i are as follows: w51 = (0.526, 0.474), w52 = (0.380, 0.434, 0.108, 0.077), w53 = (0.535, 0.465), w54 = (0.587, 0.250, 0.162), and w55 = (0.646, 0.354). The nine essential DFs are “low-EI material” (T5.1, 0.195), “orientation” (T1.1, 0.176), “building relationship” (T1.2, 0.158), and “energy-saving material” (T5.2, 0.107), followed by “thermal environment” (T2.2, 0.077), “floor planning” (T2.1, 0.068), “roof” (T3.1, 0.063), “wall” (T3.2, 0.055), and “efficiency of facilities” (T4.1, 0.039).
Among the DFs in the detailed design phase, the most important is “low-environmental impact material” (T5.1, 0.195). In addition to being eco-friendly, the importance of low-environmental impact material is underlined partly because it corresponds to the UNs on health, comfort, durability, and resource economy, which highlights the consideration of recyclable and recycled materials and the need to incorporate the reduce–reuse–recycle strategy during the design stage in order to minimize waste and reduce the impact on the environment. The durability and volatile toxicity of materials should also be considered. Next in the ranking of importance are “orientation” (T1.1, 0.176) and “building relationship” (T1.2, 0.158). Both are critical to energy conservation in the tropics with each exceeding 15% importance. To implement passive design, the orientation, shape, and length–width ratio of the building should be inspected at the beginning of the design stage. The directions of both sun and wind must be reflected, and the building design should be sensitive to its surrounding topography and development density. “Energy-saving material” (T5.2, 0.107) is next in importance, indicating the significance of using materials with low heat conductivity and high reflexivity. Next in line are “thermal environment” (T2.2, 0.077) and “floor planning” (T2.1, 0.068), with both falling under “building programming” and accounting for a total of 14.5% importance, which show strong interdependency. Their importance suggests that careful consideration must be given to the design of openings, such as the fenestration ratio, form of windows, shading, thermal buffer space, optimal ventilation corridors, and ventilation through stack effects. The building envelope, i.e., “roof” (T3.1, 0.063) and “wall” (T3.2, 0.055), make up 11.8% importance. DFs related to building facilities and installations rank lower in importance since the DFs with higher weightings encourage passive design approaches [34,36,42,48,51] and already help satisfy most of the UNs, as discussed in the previous paragraph. Designers could take advantage of the results for the detailed design when designing low-EI housing in the tropics.
4.4. Limitations
This study aimed to transform UNs into DFs that form strategies for designing low-EI housing in the tropics in hope of strengthening its acceptability in the housing market. The results stress the importance of architectural programming, such as orientation, building layout, and building program, as well as the use of low-EI and energy-saving materials, in other words, adopting “passive design” approaches to meet the UNs. The limitations of this study prevent the estimation of physical performance or the environmental contribution of the strategies provided. Future research may be pursued further to confirm such performance and the contribution of the strategies discussed in this paper.
5. Conclusions
This study employed HOQ to incorporate user needs (UNs) into the design procedure for low-EI housing in the tropics through transforming the weightings of UNs into weightings for design factors (DFs). ANP was used to evaluate the interdependency between factors to derive the real weightings of the UNs and DFs. From the perspective of efficient resource management during the production process, real weightings are crucial for formulating design or production strategies as they enhance the functional performance of the products, and avoid investment waste while allocating resources during the design and production. The weightings of the DFs in the study for low-EI housing in the tropics provide references for designers when considering UNs for establishing design strategies.
1. Real weightings of user needs (UNs)
FDM eliminates the aesthetics factor due to the lack of user consensus, which leaves eight factors for the UNs in low-EI housing. After interdependency is factored in, the real UN weightings in descending order are: utility (0.177), durability (0.169), comfort (0.168), safety (0.154), health (0.132), maintainability (0.131), resource economy (0.042), and cost efficiency (0.026). The results show that users assign a high value to utility, durability, comfort, safety, health, and maintainability of housing. The importance of resource economy and cost efficiency is apportioned by the other factors when interdependency is considered.
2. Real weightings of design factors (DFs) after transforming weightings from user needs (UNs)
When ANP is completed, HOQ was adopted to transform the UNs into DFs to generate the real weightings of each DF based on the UNs. In the planning phase, the DFs in order of importance are: building layout (T1, 0.334), material (T5, 0.302), building programming (T2, 0.178), construction (T3, 0.118), and service facilities (T4, 0.067). “Building layout” and “material” appear to carry the highest importance compared to the others with both exceeding 30%, indicating the gravity of site-specific design and sensitivity to the location, climate and geography. Furthermore, care must be taken in the choice of building materials to reduce energy consumption and avoid the waste of materials. “Architectural programing”, i.e., building layout (T1) and building programing (T2) collectively, accounts for over 50% importance in the DFs for low-EI housing in the tropics. Therefore, architectural programming, which takes place during the early stage of design, is the most essential technique for such housing in the planning phase of the design procedure. The importance of “service facilities” is lower, at 10%, indicating that it is possible to achieve an energy-smart and comfortable living environment for houses in tropical areas just through passive design strategies.
With UNs as a starting point, the most important DFs for designers conducting detailed design during the design procedure is “low-environmental impact material” (T5.1, 0.195), which has an importance of almost 20% and partially reflects on the UNs, including health, comfort, durability, and resource economy. Materials that are healthy, natural, durable, recyclable and low in pollution and carbon footprint make the greatest contribution to carbon reduction. Other considerations during the early design stage are “orientation” (T1.1, 0.176), which encompasses the directions of the sun and wind, as well as “building relationship” (T1.2, 0.158), i.e., the shape and length–width ratio of the building and its relationship with adjacent buildings. “Energy-saving material” (T5.2, 0.107) translates to the use of materials with low thermal conductivity and high reflexivity. In response to “thermal environment” (T2.2, 0.077) and “floor planning” (T2.1, 0.068), designers should provide a thermal buffer zone, and give due attention to window form selection, the fenestration ratio, optimal ventilation corridors, and ventilation. Most of the DFs with lower importance are related to equipment, which indicates that building layout and passive design strategies rather than advanced equipment or technology are the key to fulfilling UNs in the tropics.
The design strategies suggested in this paper could help accomplish the UNs for low-EI housing in the tropics, and further contribute to decreasing environmental impact when such housing options gain acceptance on the market, which will enhance the sustainability of the built environment. In addition to highlighting strategies for low-EI housing in the tropics, the demonstrated research method could also be adopted for similar design processes as a model to consider user needs and the efficiency of resource allocation concurrently in the production procedure.
Acknowledgments
This study was supported by a grant from the Ministry of Science and Technology with the project number: 104-2918-I-006-008.
Author Contributions
Heng Zhang conceived, designed the study, and wrote the paper; Wann-Ming Wey contributed analysis tools; Syuan-Jhang Chen performed the survey and analyzed the data.
Conflicts of Interest
The authors declare no conflict of interest. The funding sponsors had no role in the design of the study; the collection, analyses, or interpretation of data; the writing of the manuscript; or the decision to publish the results.
References
- Ibn-Mohammed, T.; Greenough, R.; Taylor, S.; Ozawa-Meida, L.; Acquaye, A. Operational vs. embodied emissions in buildings—A review of current trends. Energy Build. 2013, 66, 232–245. [Google Scholar] [CrossRef]
- Nejat, P.; Jomehzadeh, F.; Taheri, M.M.; Gohari, M.; Majid, M.Z.A. A global review of energy consumption, CO2 emissions and policy in the residential sector (with an overview of the top ten CO2 emitting countries). Renew. Sustain. Energy Rev. 2015, 43, 843–862. [Google Scholar] [CrossRef]
- Azzouz, A.; Borchers, M.; Moreira, J.; Mavrogianni, A. Life cycle assessment of energy conservation measures during early stage office building design: A case study in London, UK. Energy Build. 2017, 139, 547–568. [Google Scholar] [CrossRef]
- Bribián, I.Z.; Capilla, A.V.; Usón, A.A. Life cycle assessment of building materials: Comparative analysis of energy and environmental impacts and evaluation of the eco-efficiency improvement potential. Build. Environ. 2011, 46, 1133–1140. [Google Scholar] [CrossRef]
- Coelho, A.; de Brito, J. Influence of construction and demolition waste management on the environmental impact of buildings. Waste Manag. 2012, 32, 532–541. [Google Scholar] [CrossRef] [PubMed]
- Cabeza, L.F.; Rincón, L.; Vilariño, V.; Pérez, G.; Castell, A. Life cycle assessment (LCA) and life cycle energy analysis (LCEA) of buildings and the building sector: A review. Renew. Sustain. Energy Rev. 2014, 29, 394–416. [Google Scholar] [CrossRef]
- Buyle, M.; Braet, J.; Audenaert, A. Life cycle assessment in the construction sector: A review. Renew. Sustain. Energy Rev. 2013, 26, 379–388. [Google Scholar] [CrossRef]
- González, J.M.; Navarro, J.G. Assessment of the decrease of CO2 emissions in the construction field through the selection of materials: Practical case study of three houses of low environmental impact. Build. Environ. 2006, 41, 902–909. [Google Scholar] [CrossRef]
- Edelman, A.; Gelding, A.; Konovalov, E.; McComiskie, R.; Penny, A.; Roberts, N.; Templeman, S.; Trewin, D.; Ziembicki, M.; Trewin, B. State of the Tropics 2014 Report; James Cook University: Cairns, Australia, 2014. [Google Scholar]
- Manzano-Agugliaro, F.; Montoya, F.G.; Sabio-Ortega, A.; García-Cruz, A. Review of bioclimatic architecture strategies for achieving thermal comfort. Renew. Sustain. Energy Rev. 2015, 49, 736–755. [Google Scholar] [CrossRef]
- Gómez-Baggethun, E.; Reyes-García, V.; Olsson, P.; Montes, C. Traditional ecological knowledge and community resilience to environmental extremes: a case study in Doñana, SW Spain. Glob. Environ. Chang. 2012, 22, 640–650. [Google Scholar] [CrossRef]
- Hershberger, R. Architectural Programming and Predesign Manager; Routledge: Oxon, UK, 2015. [Google Scholar]
- Bakens, W.; Foliente, G.; Jasuja, M. Engaging stakeholders in performance-based building: Lessons from the Performance-Based Building (PeBBu) Network. Build. Res. Inf. 2005, 33, 149–158. [Google Scholar] [CrossRef]
- Sexton, M.; Barrett, P. Performance-based building and innovation: Balancing client and industry needs. Build. Res. Inf. 2005, 33, 142–148. [Google Scholar] [CrossRef]
- Meacham, B.; Bowen, R.; Traw, J.; Moore, A. Performance-based building regulation: Current situation and future needs. Build. Res. Inf. 2005, 33, 91–106. [Google Scholar] [CrossRef]
- Cole, R.J. Emerging trends in building environmental assessment methods. Build. Res. Inf. 1998, 26, 3–16. [Google Scholar] [CrossRef]
- WHO. Expert Committee on the Public Health Aspects of Housing; Technical Report Series; World Health Organization (WHO): Geneva, Switzerland, 1961. [Google Scholar]
- International Organization for Standardization (ISO). Performance Standards in Building: Principles for Their Preparation and Factors to be Considered; International Organization for Standardization: Geneva, Switzerland, 1984. [Google Scholar]
- Huovila, P.; Lakka, A.; Laurikka, P.; Vainio, M. Involvement of Customer Requirements in Building Design; Lean Construction: Balkema, Rotterdam, 1997; pp. 403–416. [Google Scholar]
- McLennan, J.F. The Philosophy of Sustainable Design: The Future of Architecture; Ecotone publishing: Kansas, MO, USA, 2004. [Google Scholar]
- Augustin, S. Place Advantage: Applied Psychology for Interior Architecture; John Wiley & Sons: Hoboken, NJ, USA, 2009. [Google Scholar]
- Frontczak, M.; Wargocki, P. Literature survey on how different factors influence human comfort in indoor environments. Build. Environ. 2011, 46, 922–937. [Google Scholar] [CrossRef]
- Höppe, P. The physiological equivalent temperature—A universal index for the biometeorological assessment of the thermal environment. Int. J. Biometeorol. 1999, 43, 71–75. [Google Scholar] [CrossRef] [PubMed]
- Altaş, N.E.; Özsoy, A. Spatial adaptability and flexibility as parameters of user satisfaction for quality housing. Build. Environ. 1998, 33, 315–323. [Google Scholar] [CrossRef]
- Schneider, T.; Till, J. Flexible housing: Opportunities and Limits. ARQ Archit. Res. Q. 2005, 9, 157. [Google Scholar] [CrossRef]
- Kim, S.-S.; Yang, I.H.; Yeo, M.S.; Kim, K.W. Development of a housing performance evaluation model for multi-family residential buildings in Korea. Build. Environ. 2005, 40, 1103–1116. [Google Scholar] [CrossRef]
- Kibert, C.J. Sustainable Construction: Green Building Design and Delivery; John Wiley & Sons: Hoboken, NJ, USA, 2016. [Google Scholar]
- Howe, J.C. Overview of green buildings. Natl. Wetl. Newsl. 2010, 33, 3–14. [Google Scholar]
- Akadiri, P.O.; Chinyio, E.A.; Olomolaiye, P.O. Design of a sustainable building: A conceptual framework for implementing sustainability in the building sector. Buildings 2012, 2, 126–152. [Google Scholar] [CrossRef]
- Royal Institure of British Architects (RIBA). Climate Change Toolkit : 03 Principles of LowCarbon Design and Refurbishment; RIBA: London, UK, 2009. [Google Scholar]
- Bill Dunster, C.S.; Gilbert, B. The ZEDbook: Solutions for a Shrinking World; Taylor & Francis: New York, NY, USA, 2008. [Google Scholar]
- Lovell, H. Framing sustainable housing as a solution to climate change. J. Environ. Policy Plan. 2004, 6, 35–55. [Google Scholar] [CrossRef] [Green Version]
- Ochoa, C.E.; Capeluto, I.G. Strategic decision-making for intelligent buildings: Comparative impact of passive design strategies and active features in a hot climate. Build. Environ. 2008, 43, 1829–1839. [Google Scholar] [CrossRef]
- Miller, W.; Buys, L. Anatomy of a sub-tropical Positive Energy Home (PEH). Sol. Energy 2012, 86, 231–241. [Google Scholar] [CrossRef] [Green Version]
- Ikaga, T. Architecture for a Sustainable Future: All about the Holistic Approach in Japan; Institute for Building Environment and Energy Conservation (IBEC): Tokyo, Japan, 2005. [Google Scholar]
- Bastide, A.; Lauret, P.; Garde, F.; Boyer, H. Building energy efficiency and thermal comfort in tropical climates: Presentation of a numerical approach for predicting the percentage of well-ventilated living spaces in buildings using natural ventilation. Energy Build. 2006, 38, 1093–1103. [Google Scholar] [CrossRef]
- Koch-Nielsen, H. Stay Cool: A Design Guide for the Built Environment in Hot Climates; James & James: London, UK, 2002. [Google Scholar]
- Hyde, R. The environmental Brief: Pathways for Green Design; Taylor and Francis: London, UK, 2007. [Google Scholar]
- Hyde, R. Climate Responsive Design: A Study of Buildings in Moderate and Hot Humid Climates; Taylor & Francis: London, UK, 2000. [Google Scholar]
- Barnett, D.L.; Browning, W.D. A Primer on Sustainable Building; Rocky Mountain Institute: New York, NY, USA, 1995. [Google Scholar]
- DeKay, M.; Brown, G. Sun, Wind, and Light: Architectural Design Strategies; John Wiley & Sons: Hoboken, NJ, USA, 2001. [Google Scholar]
- Rattanongphisata, W.; Rordprapatb, W. Strategy for Energy Efficient Buildings in Tropical Climate. Energy Procedia 2014, 52, 10–17. [Google Scholar] [CrossRef]
- Sherman, M.; Levin, H. Renewables in ventilation and indoor air quality. Renew. Energy. 1996, 8, 236–240. [Google Scholar] [CrossRef]
- American Society of Heating, Refrigerating and Air-Conditioning Engineers Inc. (ASHRAE). Standard 55, Thermal Environmental Conditions for Human Occupancy; American Society of Heating, Refrigerating and Air-Conditioning Engineers Inc.: Atlanta, GA, USA, 2004. [Google Scholar]
- Amador, A.G.; López, F.A. Ventilation Performance in a Funneling Window. In Proceedings of the 25th Conference on Passive and Low Energy Architecture, Dublin, Ireland, 22–24 October 2008. [Google Scholar]
- Heiselberg, P.; Bjørn, E.; Nielsen, P.V. Impact of open windows on room air flow and thermal comfort. Int. J. Vent. 2002, 1, 91–100. [Google Scholar] [CrossRef]
- Kindangen, J.; Krauss, G.; Depecker, P. Effects of roof shapes on wind-induced air motion inside buildings. Build. Environ. 1997, 32, 1–11. [Google Scholar] [CrossRef]
- Prianto, E.; Depecker, P. Characteristic of airflow as the effect of balcony, opening design and internal division on indoor velocity: A case study of traditional dwelling in urban living quarter in tropical humid region. Energy Build. 2002, 34, 401–409. [Google Scholar] [CrossRef]
- Sharples, S.; Bensalem, R. Airflow in courtyard and atrium buildings in the urban environment: A wind tunnel study. Sol. Energy 2001, 70, 237–244. [Google Scholar] [CrossRef]
- Tablada de la Torre, A. Shape of New Residential Buildings in the Historical Centre of Old Havana to Favour Natural Ventilation and Thermal Comfort; Katholieke University Leuven: Leuven, Belgium, 2006. [Google Scholar]
- Lauber, W. Tropical Architecture; Prestel Varlag: Munich, Germany, 2005. [Google Scholar]
- Bady, M.; Kato, S.; Takahashi, T.; Huang, H. Experimental investigations of the indoor natural ventilation for different building configurations and incidences. Build. Environ. 2011, 46, 65–74. [Google Scholar] [CrossRef]
- Van Moeseke, G.; Gratia, E.; Reiter, S.; De Herde, A. Wind pressure distribution influence on natural ventilation for different incidences and environment densities. Energy Build. 2005, 37, 878–889. [Google Scholar] [CrossRef]
- Lechner, N. Heating, Cooling, Lighting: Sustainable Design Methods for Architects; John Wiley & Sons: Hoboken, NJ, USA, 2009. [Google Scholar]
- Karol, E.; Lai, V.V.C. Climatic Design and Changing Social Needs in the Tropics: A Case Study in Kuching, Sarawak. Sustainability 2014, 6, 6278–6292. [Google Scholar] [CrossRef]
- Hsu, C.-L. Constructing intelligent living-space controlling system with blue-tooth and speech-recognition microprocessor. Exp. Syst. Appl. 2009, 36, 9308–9318. [Google Scholar] [CrossRef]
- Cook, D.; Das, S. Smart Environments: Technology, Protocols and Applications; John Wiley & Sons: Hoboken, NJ, USA, 2004; Volume 43. [Google Scholar]
- Moskow, K. Sustainable Facilities: Green Design, Construction, and Operations; McGraw Hill Professional: New York, NY, USA, 2008. [Google Scholar]
- Ishikawa, A.; Amagasa, M.; Shiga, T.; Tomizawa, G.; Tatsuta, R.; Mieno, H. The max-min Delphi method and fuzzy Delphi method via fuzzy integration. Fuzzy Sets Syst. 1993, 55, 241–253. [Google Scholar] [CrossRef]
- Murray, T.J.; Pipino, L.L.; van Gigch, J.P. A pilot study of fuzzy set modification of Delphi. Hum. Syst. Manag. 1985, 5, 76–80. [Google Scholar]
- Hsu, T.H.; Yang, T.H. Application of fuzzy analytic hierarchy process in the selection of advertising media. J. Manag. Syst. 2000, 7, 19–39. [Google Scholar]
- Chan, S.-L.; Wey, W.-M.; Chang, P.-H. Establishing disaster resilience indicators for Tan-sui river basin in Taiwan. Soc. Indic. Res. 2014, 115, 387–418. [Google Scholar] [CrossRef]
- Ameyaw, E.E.; Hu, Y.; Shan, M.; Chan, A.P.; Le, Y. Application of Delphi method in construction engineering and management research: A quantitative perspective. J. Civ. Eng. Manag. 2016, 22, 991–1000. [Google Scholar] [CrossRef]
- Hsu, C.-C.; Sandford, B.A. The Delphi technique: Making sense of consensus. Pract. Assess. Res. Eval. 2007, 12, 1–8. [Google Scholar]
- Kuo, Y.-F.; Chen, P.-C. Constructing performance appraisal indicators for mobility of the service industries using Fuzzy Delphi Method. Exp. Syst. Appl. 2008, 35, 1930–1939. [Google Scholar] [CrossRef]
- Ma, Z.; Shao, C.; Ma, S.; Ye, Z. Constructing road safety performance indicators using fuzzy delphi method and grey delphi method. Exp. Syst. Appl. 2011, 38, 1509–1514. [Google Scholar] [CrossRef]
- Saaty, T.L. The Analytic Hierarchy Process: Planning, Priority Setting, Resources Allocation; McGraw: New York, NY, USA, 1980. [Google Scholar]
- Saaty, T.L. Decision Making with Dependence and Feedback: The Analytic Network Process: The Organization and Prioritization of Complexity; RWS Publications: Pittsburgh, PA, USA, 1996. [Google Scholar]
- Saaty, T.L.; Vargas, L.G. Decision Making with the Analytic Network Process: Economic, Political, Social and Technological Applications with Benefits, Opportunities, Costs and Risks, 2nd ed.; Hillier, F.S., Ed.; International Series in Operations Research & Management Science; Springer: Berlin, Germany, 2013; Volume 195. [Google Scholar]
- Saaty, T.L.; Vargas, L.G. Diagnosis with dependent symptoms: Bayes theorem and the analytic hierarchy process. Oper. Res. 1998, 46, 491–502. [Google Scholar] [CrossRef]
- Ishizaka, A.; Nemery, P. Multi-Criteria Decision Analysis: Methods and Software; John Wiley & Sons: Hoboken, NJ, USA, 2013. [Google Scholar]
- Forman, E.H.; Gass, S.I. The analytic hierarchy process—An exposition. Oper. Res. 2001, 49, 469–486. [Google Scholar] [CrossRef]
- Chung, S.-H.; Lee, A.H.; Pearn, W.-L. Analytic network process (ANP) approach for product mix planning in semiconductor fabricator. Int. J. Prod. Econ. 2005, 96, 15–36. [Google Scholar] [CrossRef]
- Wu, W.-W.; Lee, Y.-L. Selecting knowledge management strategies by using the analytic network process. Exp. Syst. Appl. 2007, 32, 841–847. [Google Scholar] [CrossRef]
- Akao, Y. Quality Function Deployment; Taylor & Francis: London, UK, 2004. [Google Scholar]
- Akao, Y. Development History of Quality Function Deployment. The Customer Driven Approach to Quality Planning and Deployment; Asian Productivity Organization: Tokyo, Japan, 1994; ISBN 92-833-1121-3. [Google Scholar]
- Shillito, M.L. Acquiring, Processing, and Deploying: Voice of the Customer; CRC Press: Boca Raton, FL, USA, 2000. [Google Scholar]
- Shillito, M.L. Advanced QFD: Linking Technology to Market and Company Needs; John Wiley & Sons: Hoboken, NJ, USA, 1994. [Google Scholar]
- Guinta, L.R.; Praizler, N.C. The QFD Book: the Team Approach to Solving Problems and Satisfying Customers through Quality Function Deployment; Amacom: New York, NY, USA, 1993. [Google Scholar]
- Sireli, Y.; Kauffmann, P.; Ozan, E. Integration of Kano’s model into QFD for multiple product design. IEEE Trans. Eng. Manag. 2007, 54, 380–390. [Google Scholar] [CrossRef]
- Chan, L.-K.; Wu, M.-L. Quality function deployment: A literature review. Eur. J. Oper. Res. 2002, 143, 463–497. [Google Scholar] [CrossRef]
- Miguel, P.A.C. The state-of-the-art of the Brazilian QFD applications at the top 500 companies. Int. J. Qual. Reliab. Manag. 2003, 20, 74–89. [Google Scholar] [CrossRef]
- Martins, A.; Aspinwall, E.M. Quality function deployment: An empirical study in the UK. Total Qual. Manag. 2001, 12, 575–588. [Google Scholar] [CrossRef]
- Tapke, J.; Muller, A.; Johnson, G.; Sieck, J. House of Quality; Harvard Business School Publishing: Boston, MA, USA, 1997. [Google Scholar]
- Carnevalli, J.A.; Miguel, P.C. Review, analysis and classification of the literature on QFD—Types of research, difficulties and benefits. Int. J. Prod. Econ. 2008, 114, 737–754. [Google Scholar] [CrossRef]
- Hauser, J.R.; Clausing, D. The House of Quality; Harvard Business Review: Boston, MA, USA, 1988. [Google Scholar]
- Klir, G.J.; Folger, T.A. Fuzzy Sets, Uncertainty, and Information; Prentice Hall: Englewood Cliffs, NJ, USA, 1988. [Google Scholar]
Figure 1.
The research process contains four main components: (I) find user needs, (II) determine crucial design factors, (III) transform the user needs to the crucial design factors, and (IV) yield design strategies. This design progress model can be used in design processes which consider user needs.
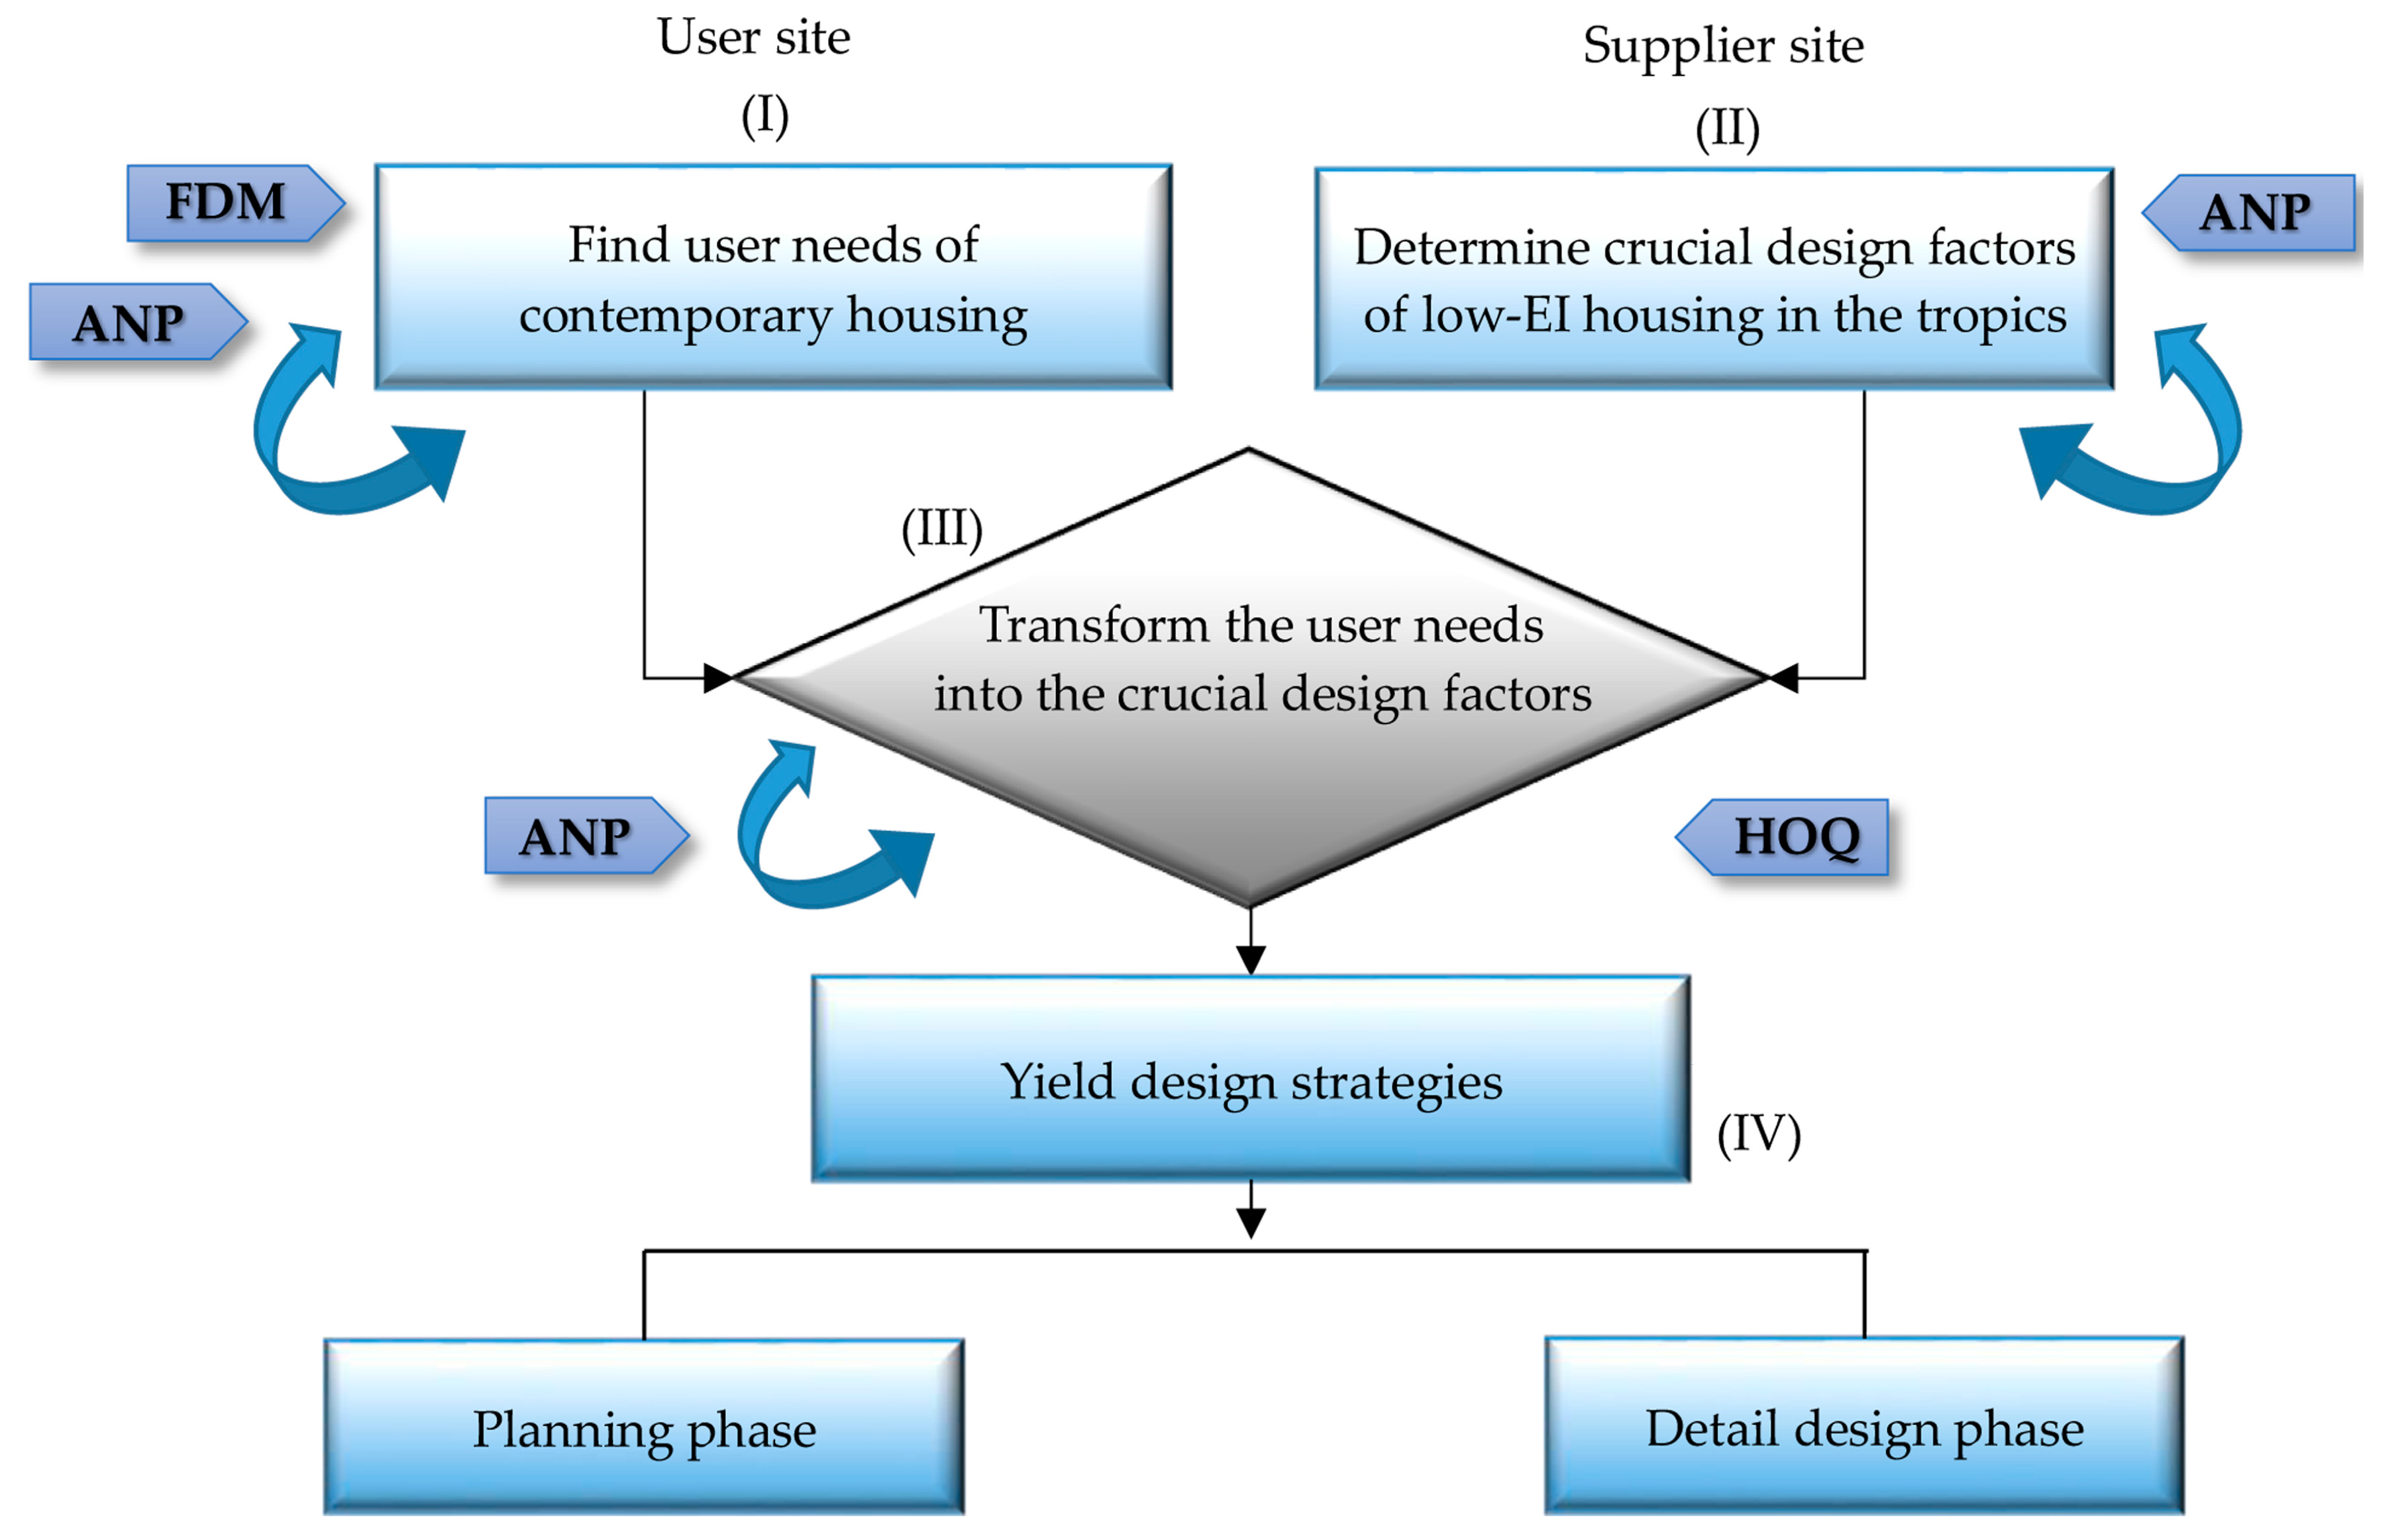
Figure 2.
Determination of the consensus of opinions by fuzzy trigonometric values.
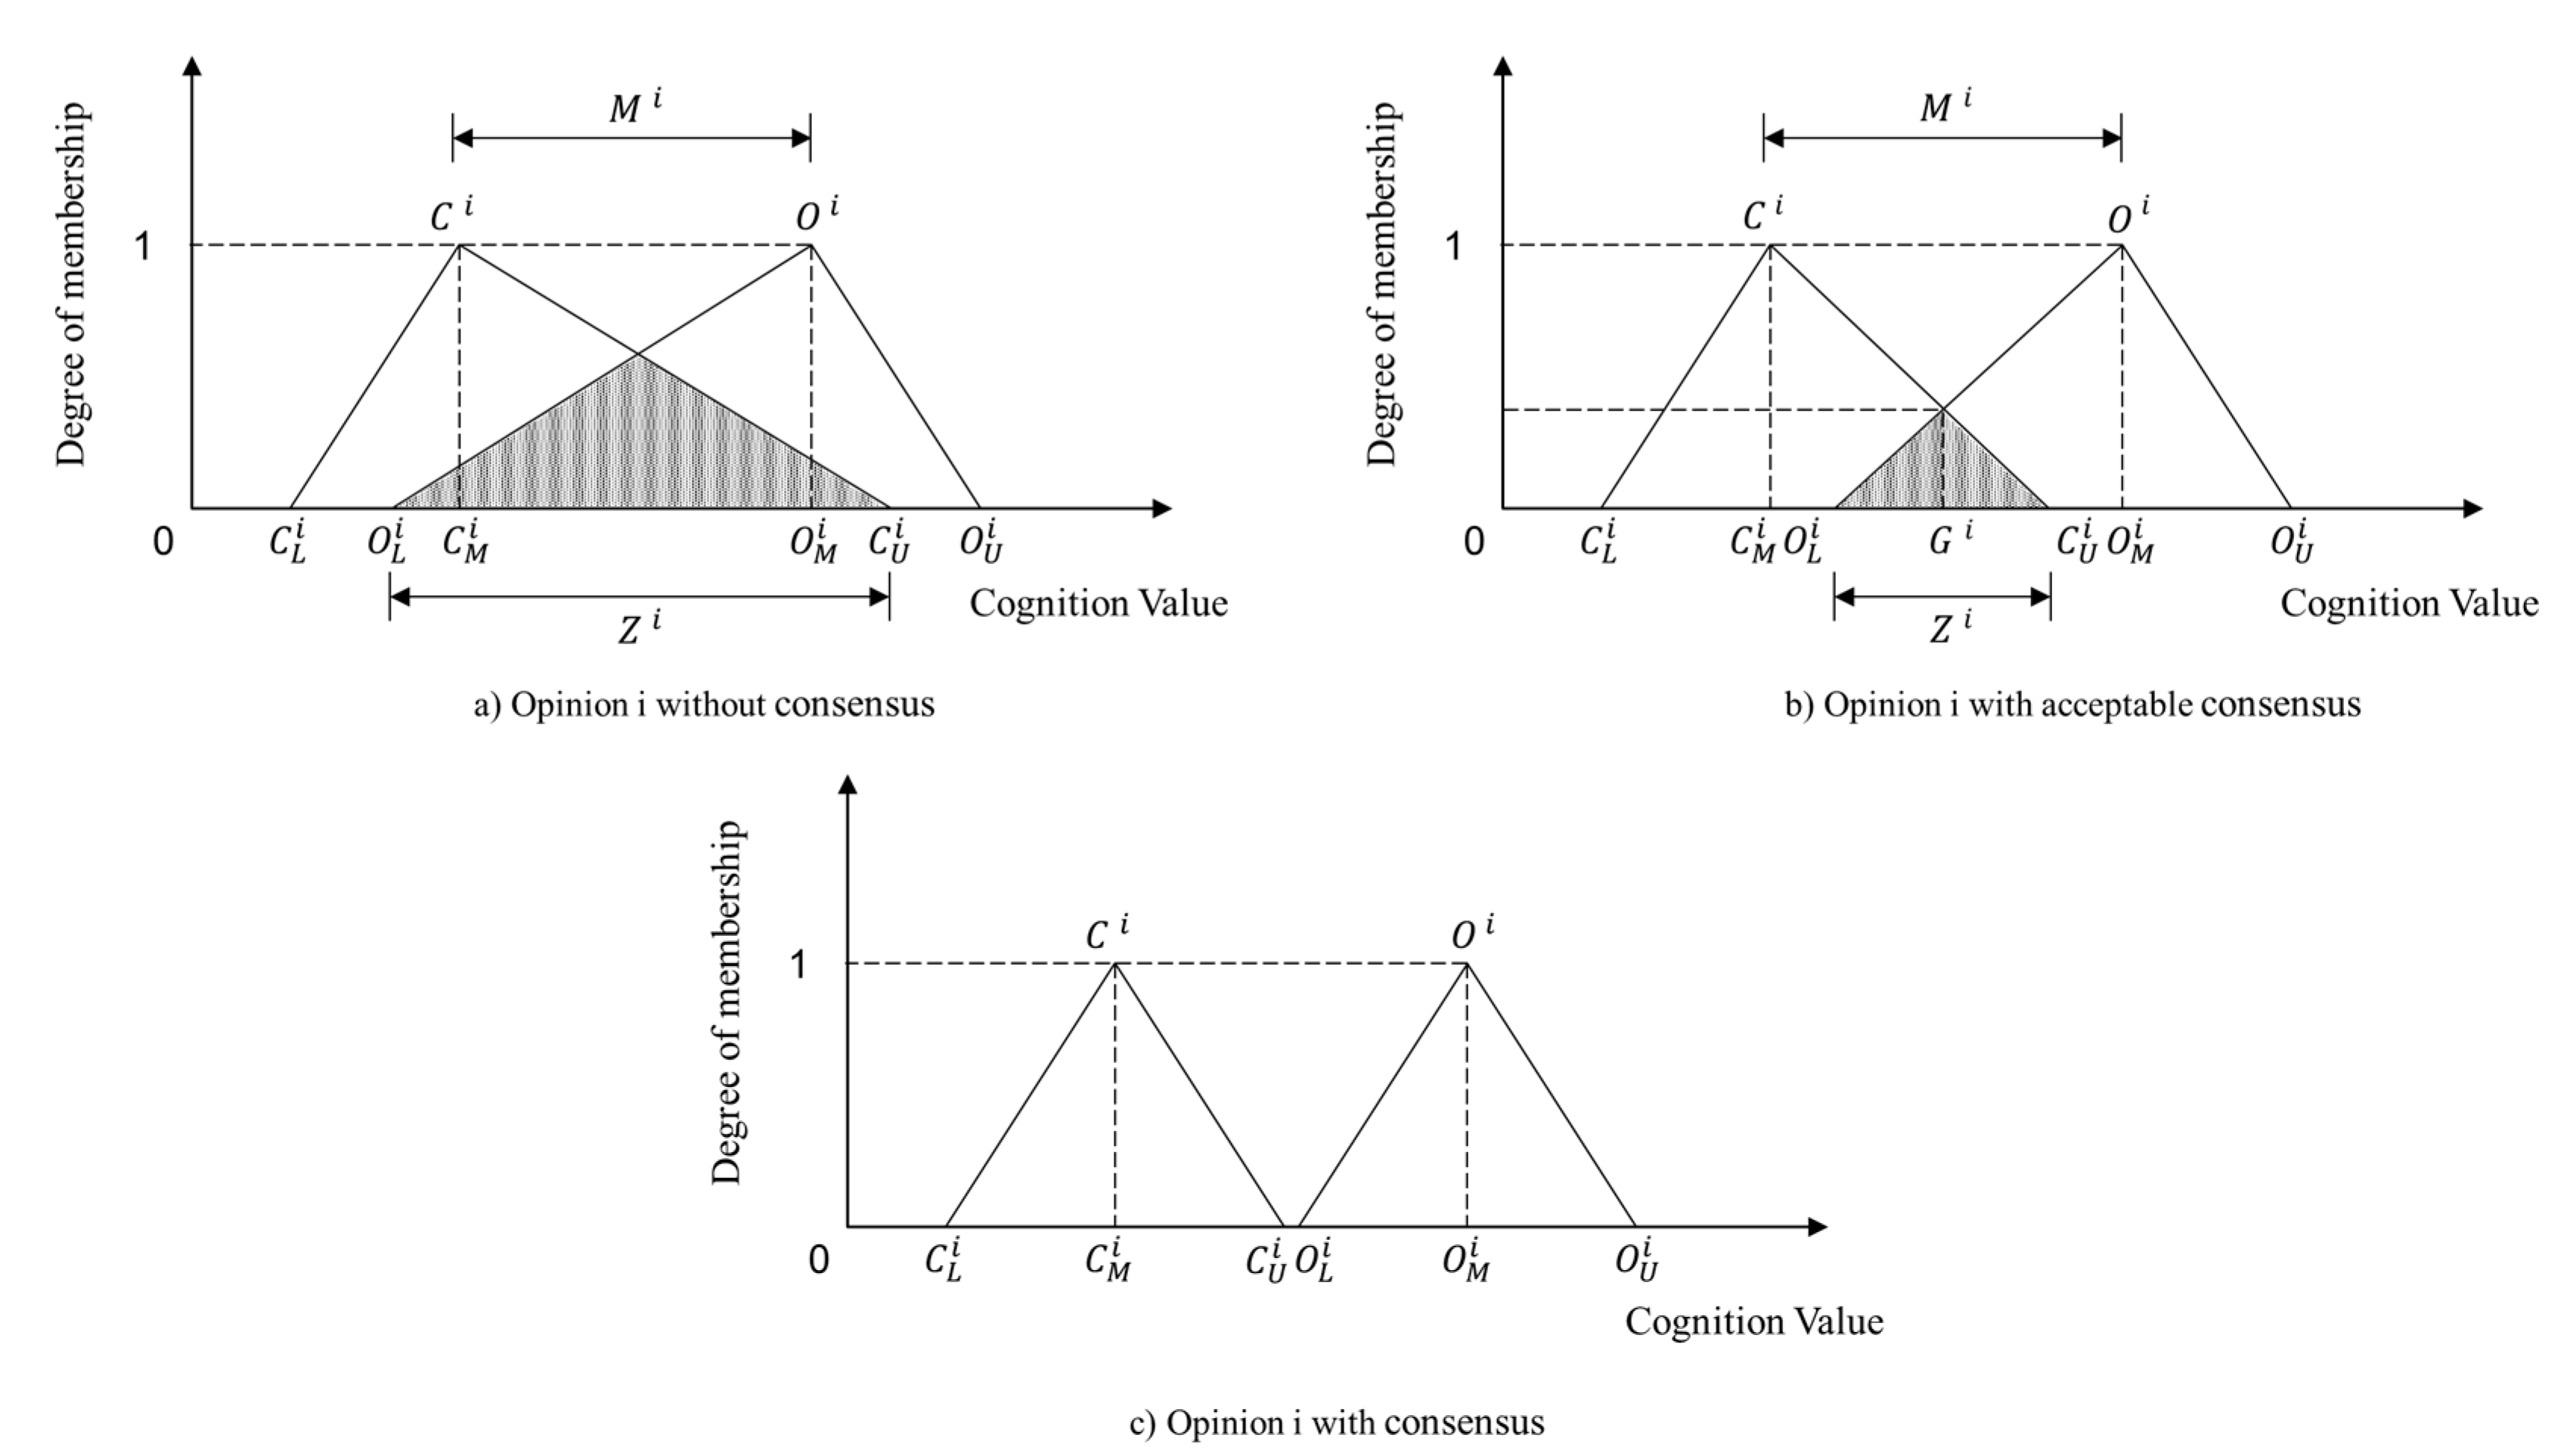
Figure 3.
Concept of Analytic Hierarchy Process (AHP) and Analytic Network Process (ANP). ANP replaces hierarchical relationships among components in AHP with networks [68].
Figure 3.
Concept of Analytic Hierarchy Process (AHP) and Analytic Network Process (ANP). ANP replaces hierarchical relationships among components in AHP with networks [68].
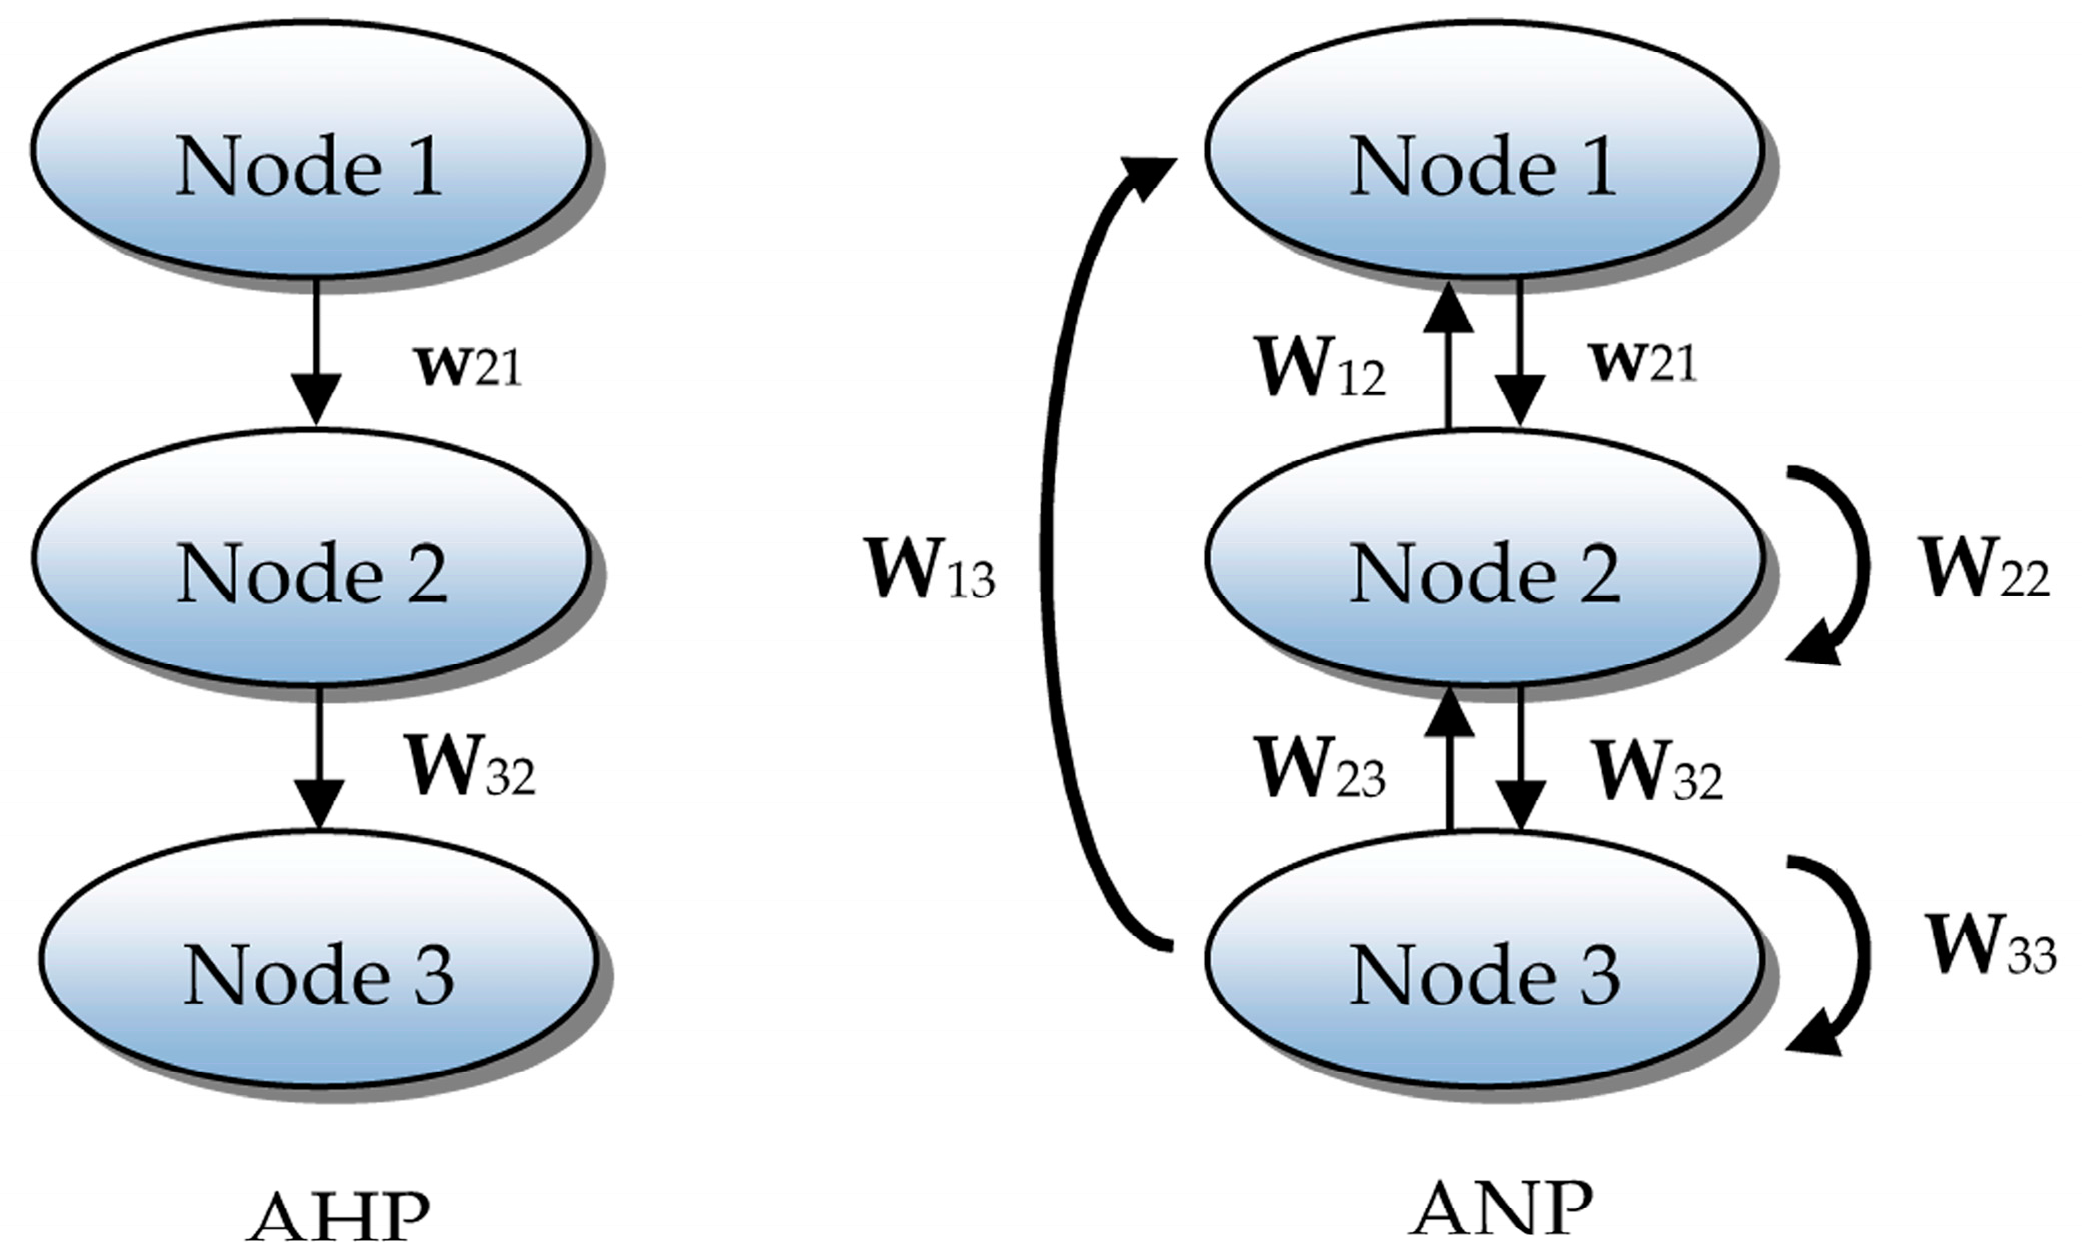
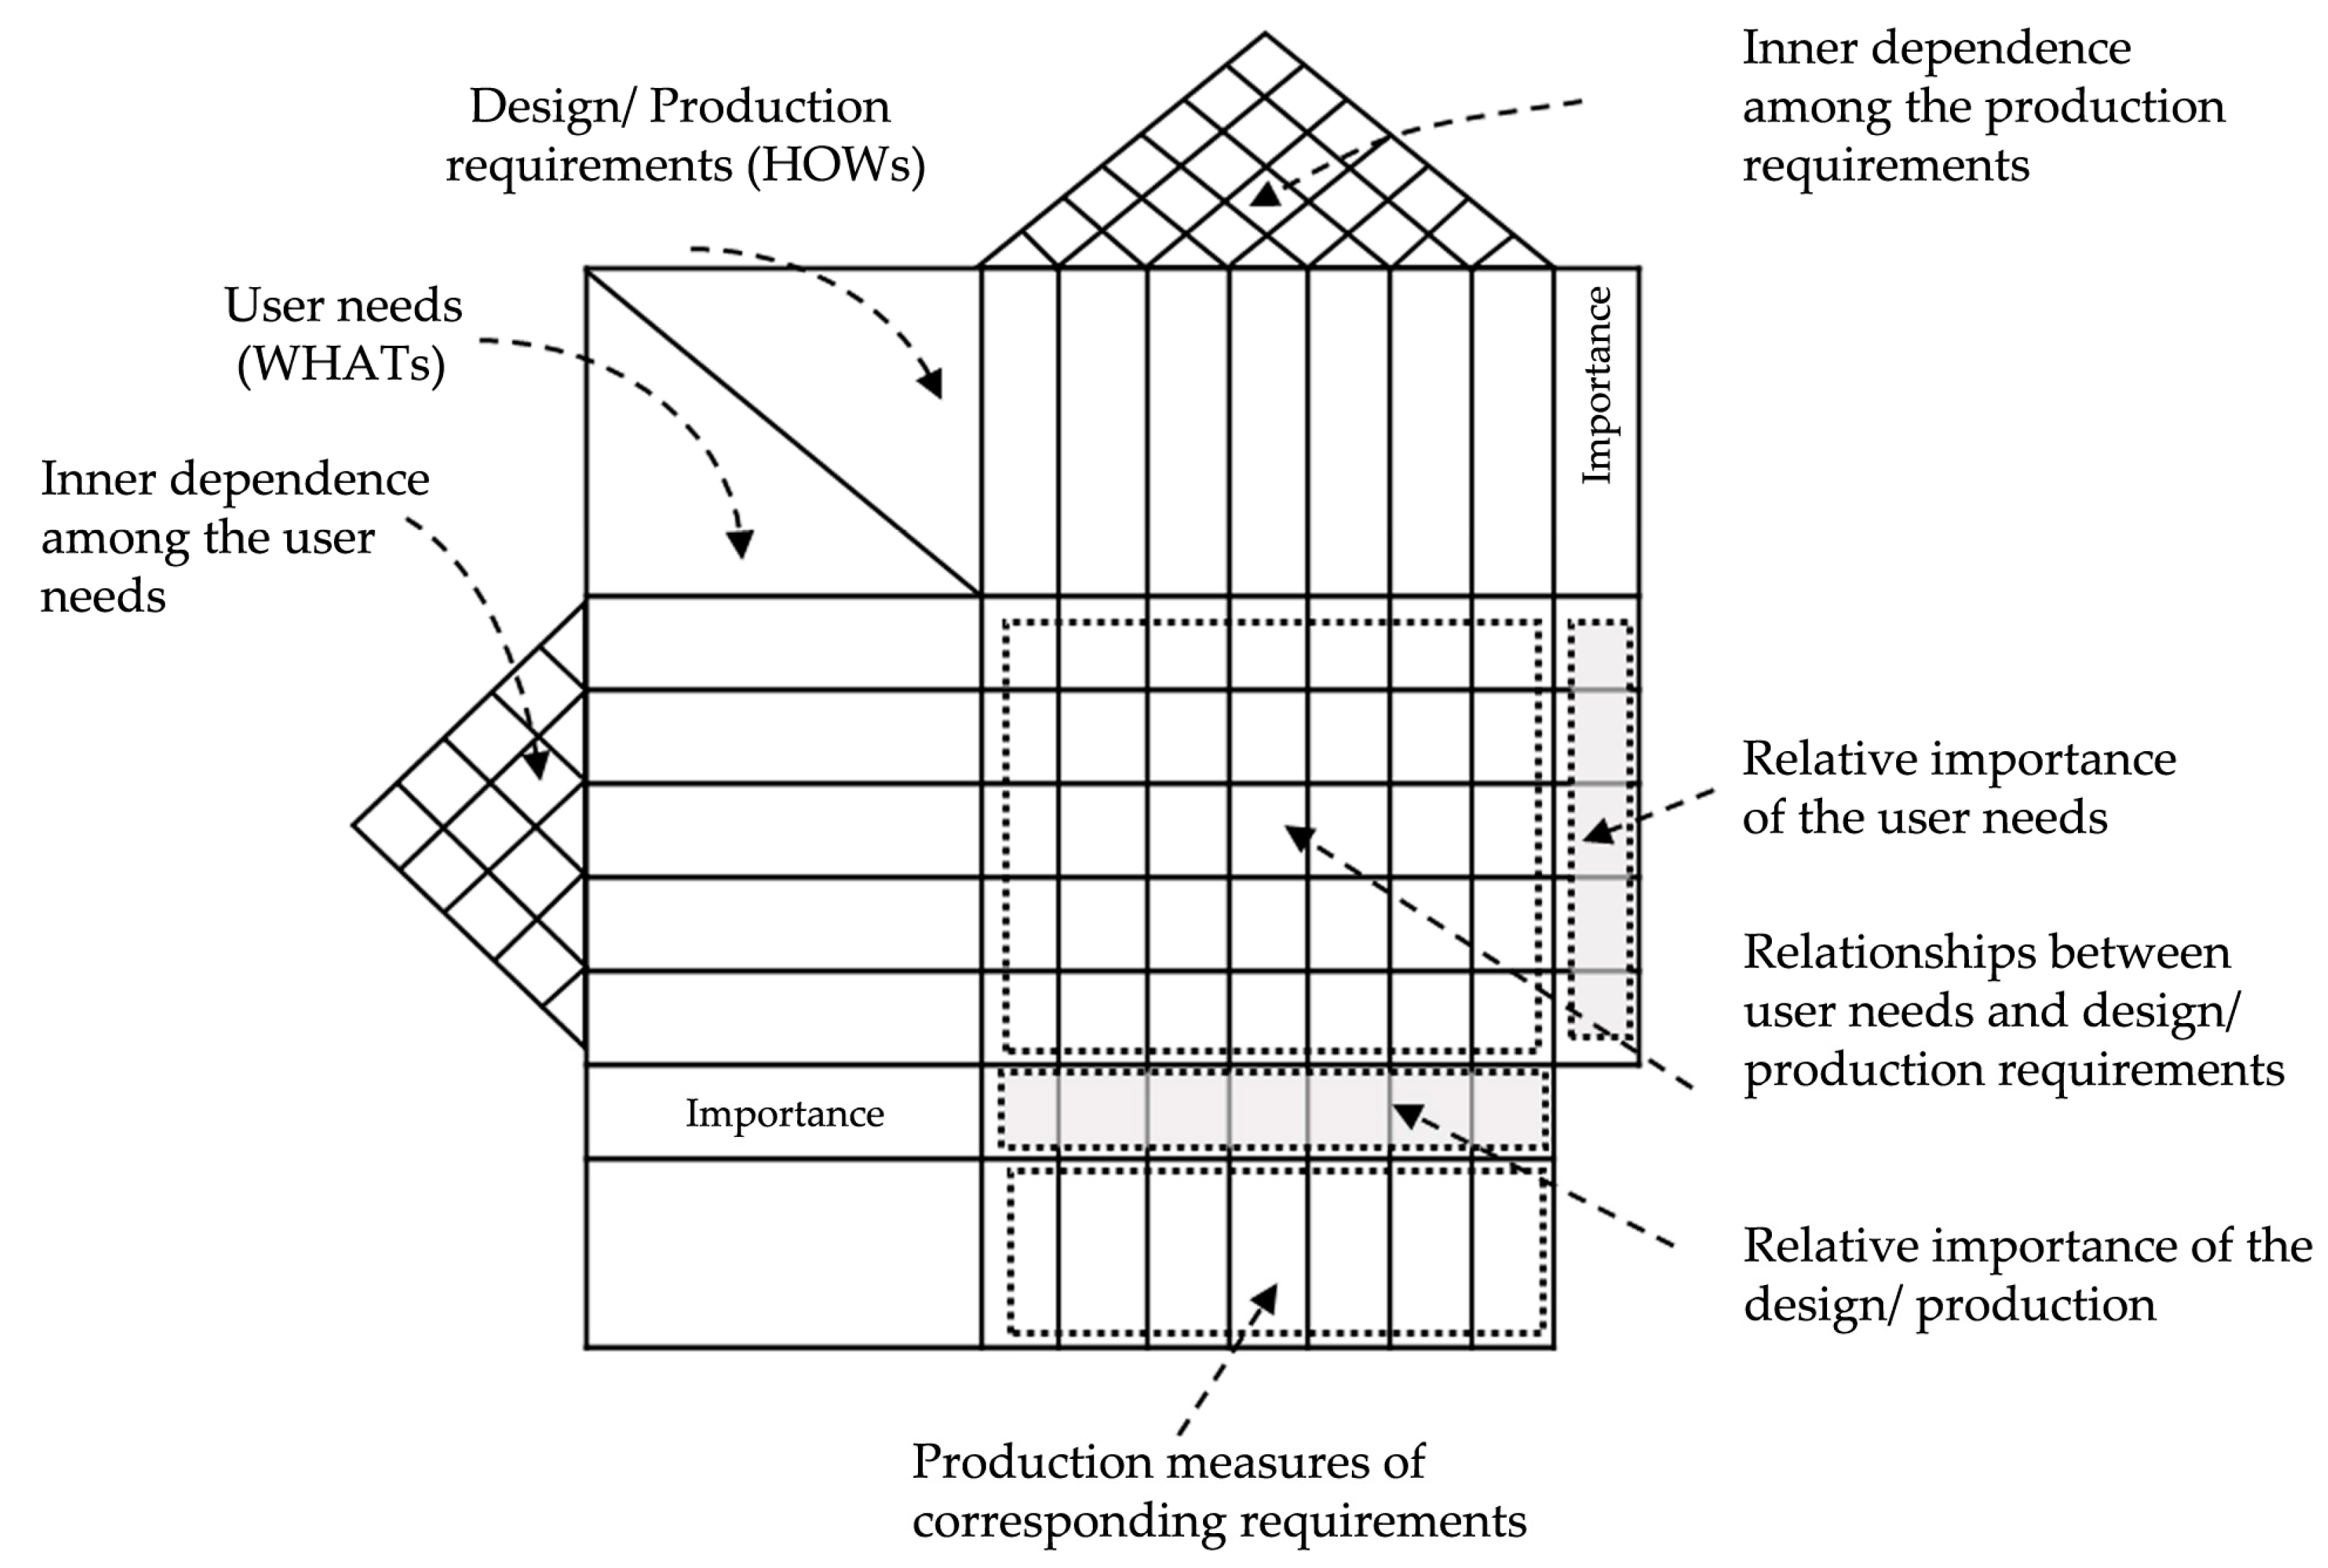
Figure 4.
Concept of house of quality (HOQ) and its essential elements: utilizes matrices containing information on relationships between user needs and production requirements as well as additional data on production measures in order to translate user needs to production requirements in the design progress.

Figure 5.
Weightings and related matrices of house of quality for low environmental impact housing in the tropics: non-dependent weightings of user needs (UNs) (w1), inner dependency among UNs (W2), inner dependency among design factors (DFs) (W3), relationships between UNs and DFs (W4), real weightings of UNs (wC), and real weightings of DFs (wANP).

Figure 6.
Selected user needs (UNs) for temporary housing in the tropics after Fuzzy Delphi method (FDM) evaluation of potential homebuyers.
Figure 6.
Selected user needs (UNs) for temporary housing in the tropics after Fuzzy Delphi method (FDM) evaluation of potential homebuyers.
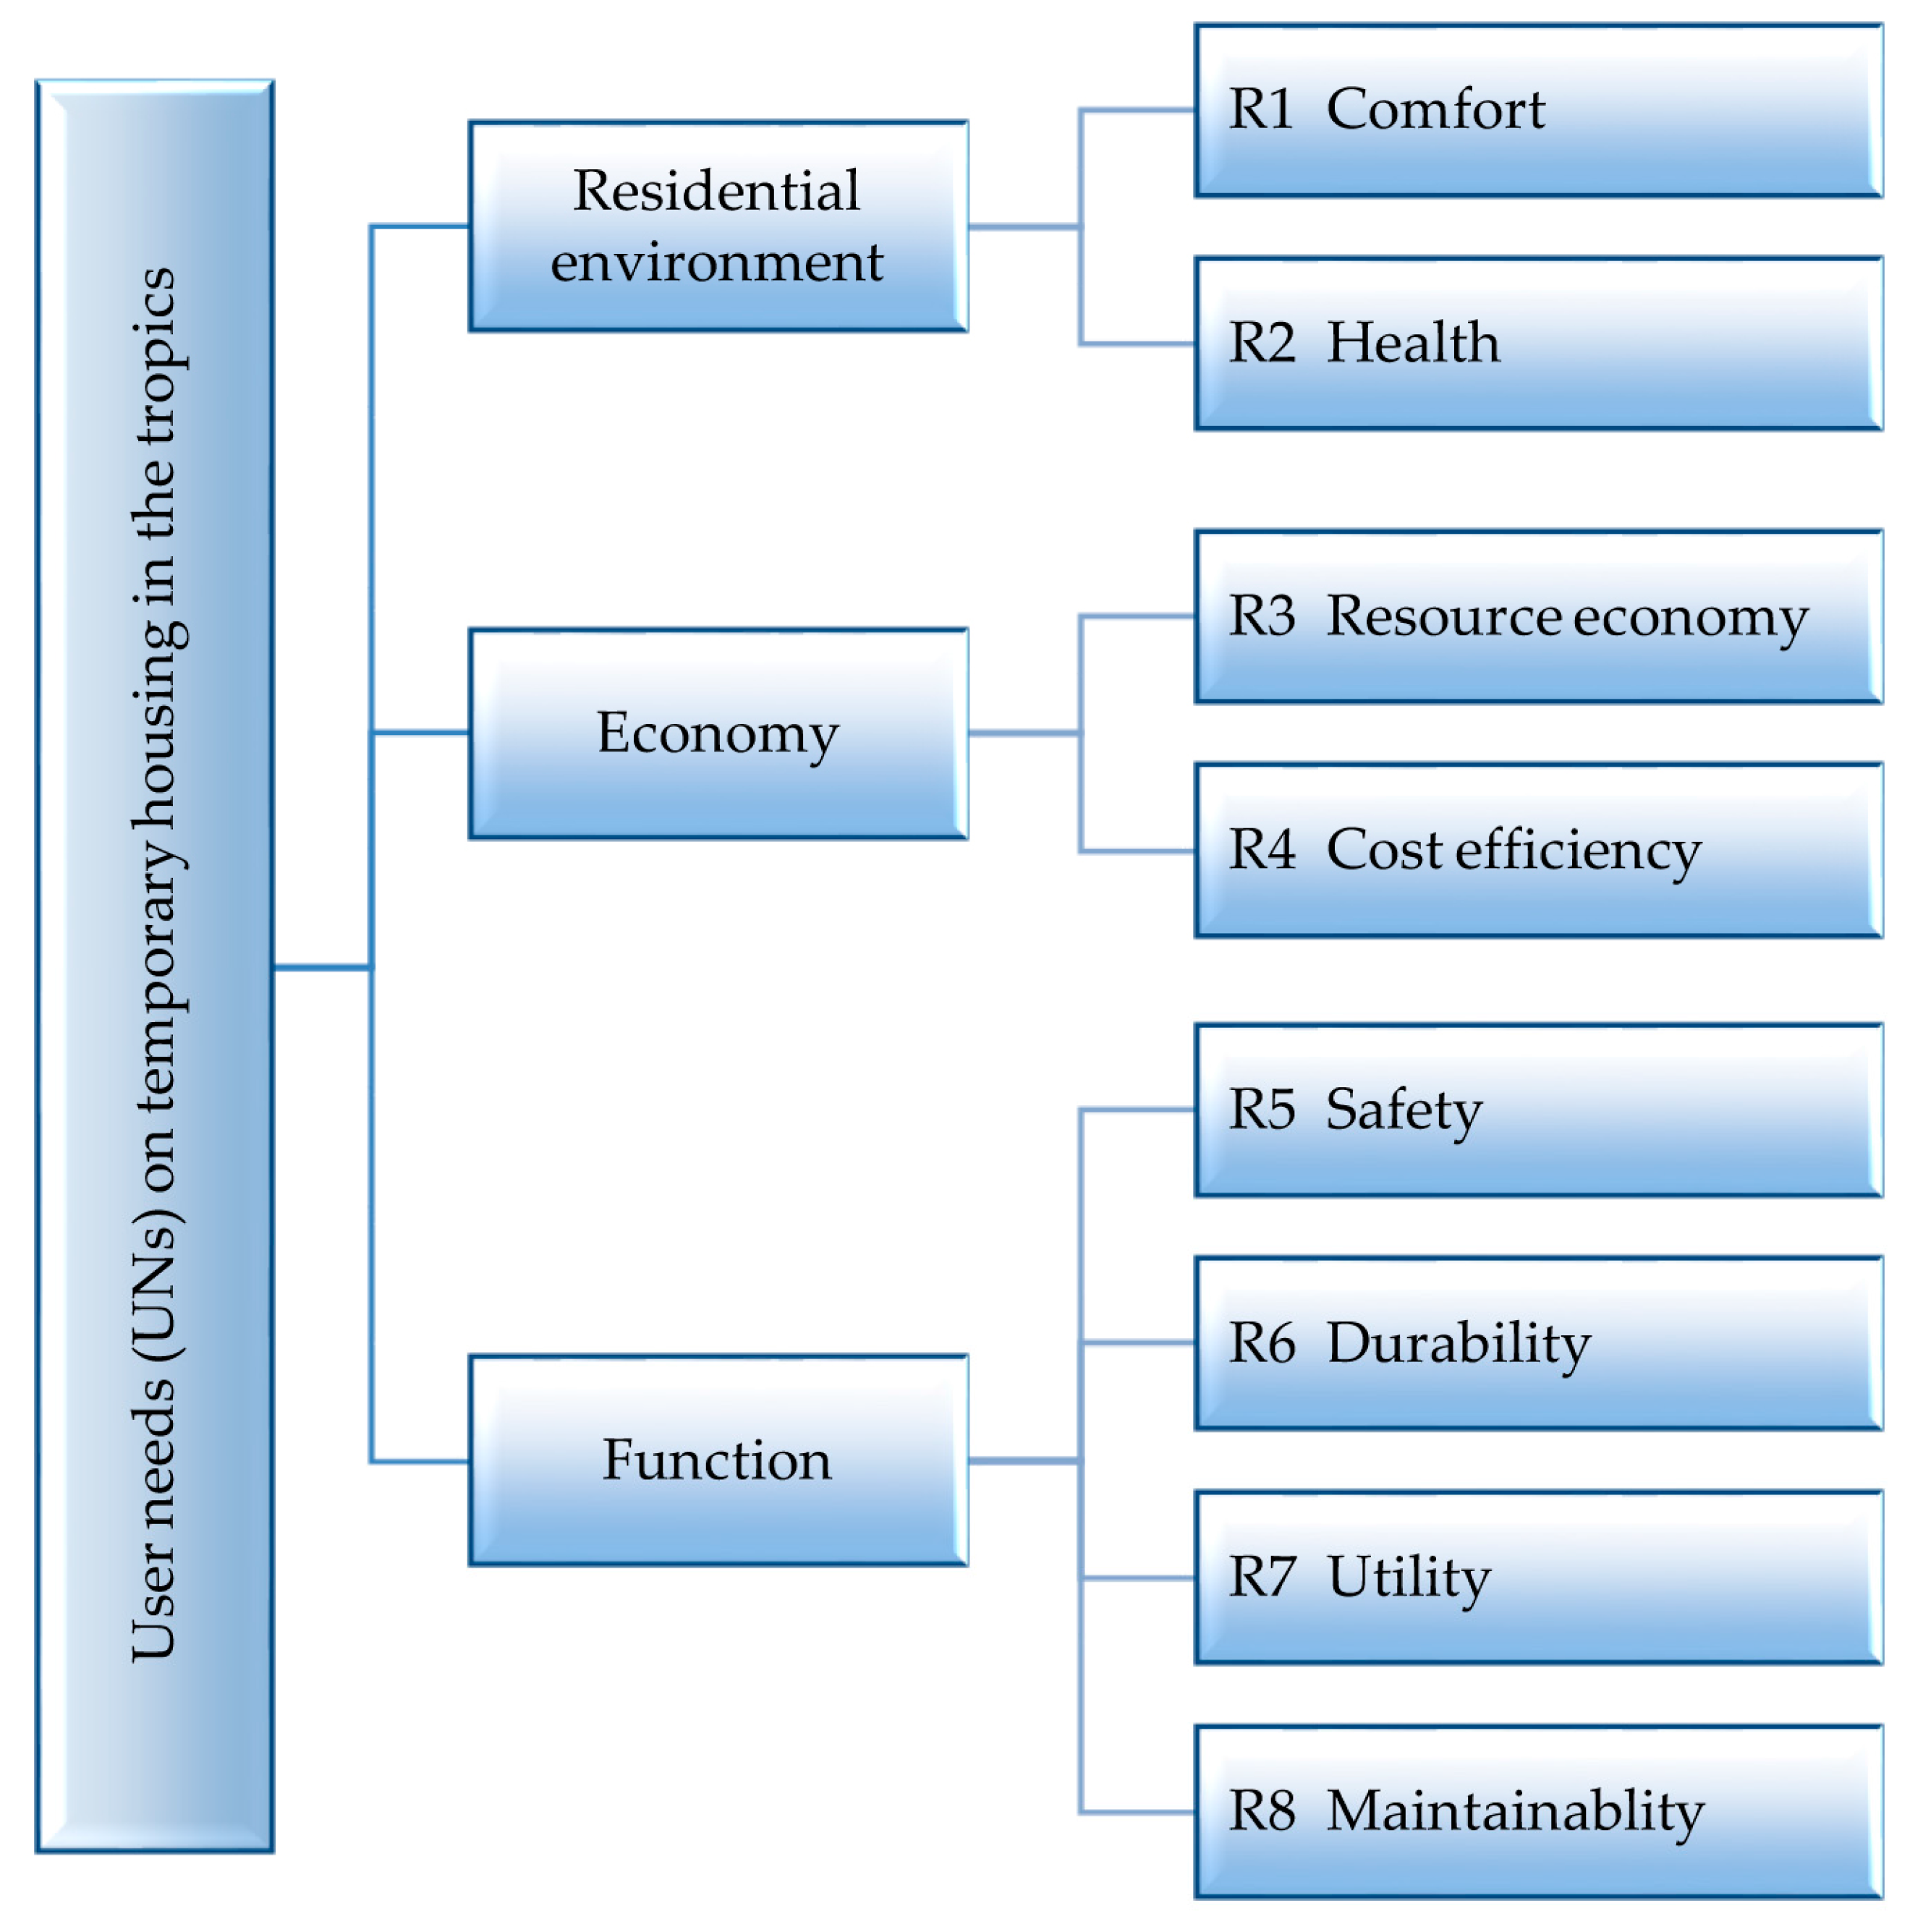
Figure 7.
Supermatrix of the ANP used in the research. The supermatrix displays the relationships among the nodes (w1, W4), and their inner dependence (W2, W3). The values of the relationships are shown in the corresponding tables.
Figure 7.
Supermatrix of the ANP used in the research. The supermatrix displays the relationships among the nodes (w1, W4), and their inner dependence (W2, W3). The values of the relationships are shown in the corresponding tables.
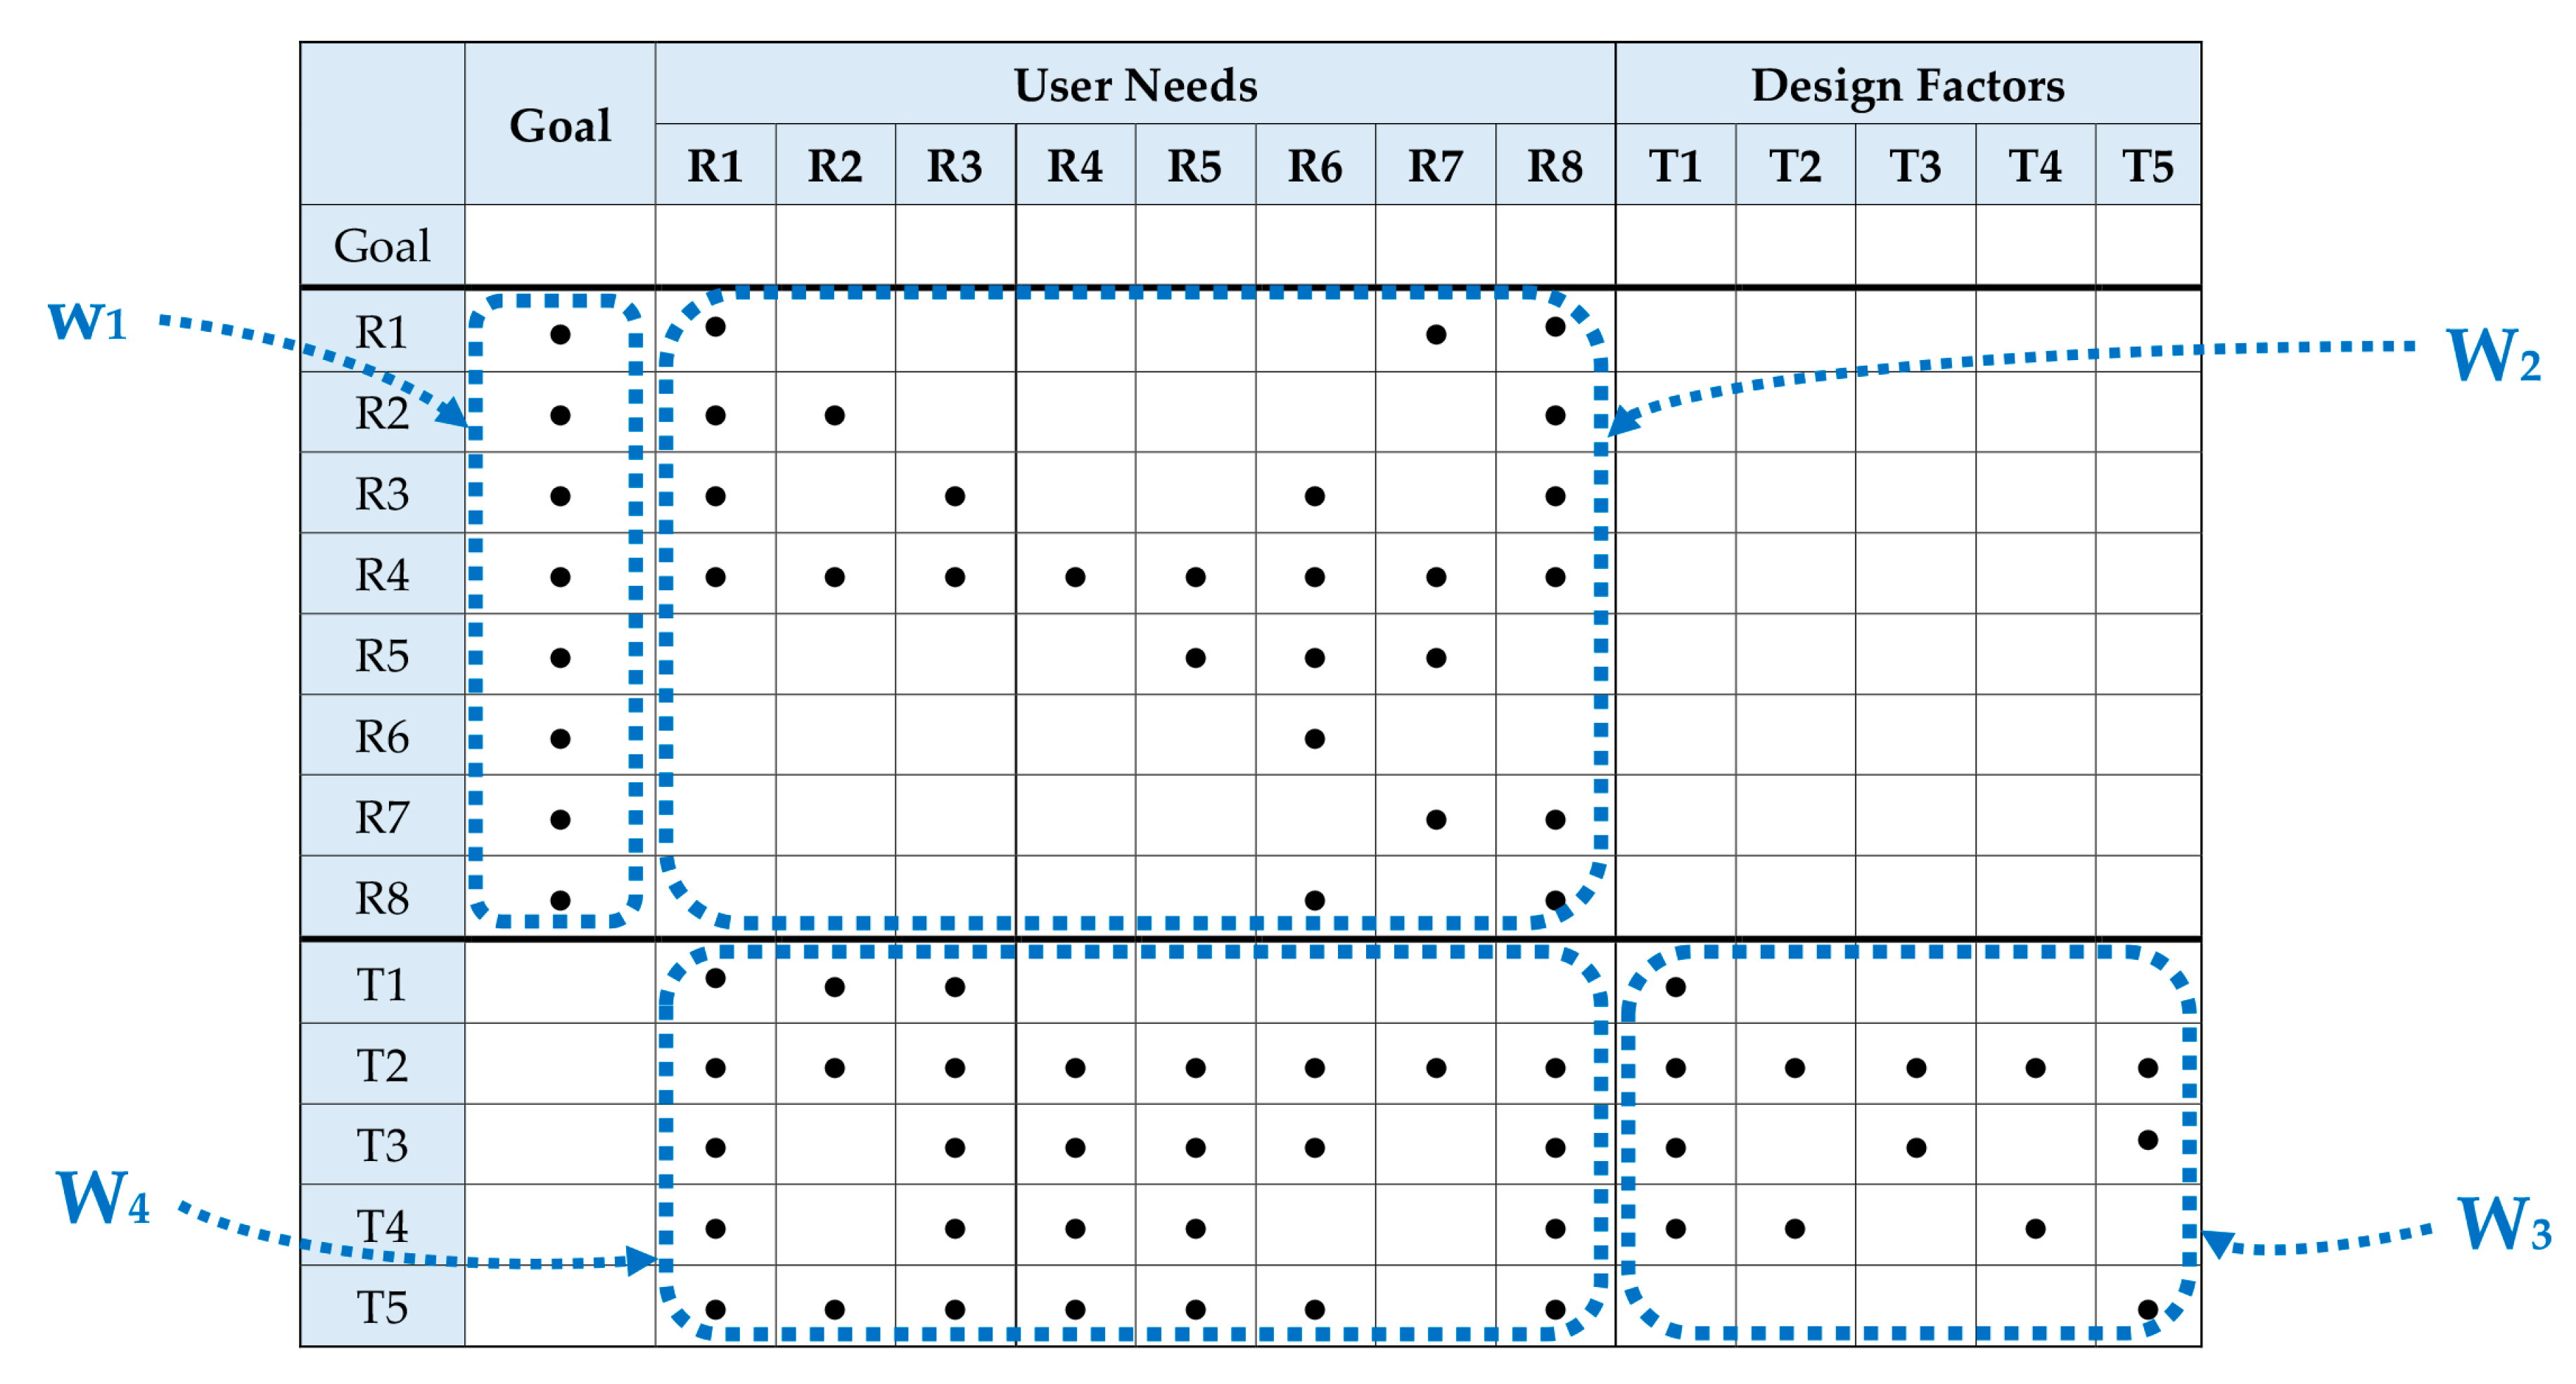
Figure 8.
Framework of the design factors for low-EI housing in the tropics. This framework contains two levels: phase of planning and phase of detail design.
Figure 8.
Framework of the design factors for low-EI housing in the tropics. This framework contains two levels: phase of planning and phase of detail design.

Figure 9.
Weightings of design factors (DFs) incorporating user needs for low environmental impact housing in the tropics. Weightings for building layout and material are the highest in phase of planning. Low-EI material, orientation, building relationship, and energy-saving material are the highest in phase of detail design. Architectural programming (T1 and T2) and material (T5) yield a combined 81.4% coverage for the UNs. The framework of the DFs can be found in Figure 8.


Table 1.
Proposed functional requirements for low environmental impact housing based on user needs (UNs).
Table 1.
Proposed functional requirements for low environmental impact housing based on user needs (UNs).
| Dimension | Factor | Description |
|---|---|---|
| Residential environment | R1 Comfort |
|
| R2 Health |
| |
| Economy | R3 Resource economy |
|
| R4 Cost efficiency |
| |
| Function | R5 Safety |
|
| R6 Durability |
| |
| R7 Utility |
| |
| R8 Maintainability |
| |
| R9 Aesthetics |
|
Table 2.
Evaluation of performance requirements of user needs (UNs) through the Fuzzy Delphi method (FDM).
Table 2.
Evaluation of performance requirements of user needs (UNs) through the Fuzzy Delphi method (FDM).
| Factor | Ci Score | Oi Score | > | Mi − Zi | Consensus Value Gi | ||||
|---|---|---|---|---|---|---|---|---|---|
| R1 Comfort | 6 | 8 | 6.86 | 8 | 10 | 9.38 | yes | -- | 8.12 |
| R2 Health | 6 | 9 | 7.26 | 8 | 10 | 9.67 | no | 1.41 | 8.49 |
| R3 Resource economy | 4 | 9 | 6.10 | 7 | 10 | 8.82 | no | 0.72 | 7.77 |
| R4 Cost efficiency | 3 | 7 | 5.09 | 5 | 10 | 7.38 | no | 0.29 | 6.11 |
| R5 Safety | 6 | 9 | 7.30 | 9 | 10 | 9.73 | yes | -- | 8.52 |
| R6 Durability | 4 | 9 | 6.23 | 7 | 10 | 8.82 | no | 0.59 | 7.79 |
| R7 Utility | 4 | 7 | 5.51 | 6 | 10 | 8.35 | no | 1.83 | 6.61 |
| R8 Maintainability | 4 | 8 | 5.87 | 6 | 10 | 8.41 | no | 0.54 | 7.06 |
| R9 Aesthetics | 3 | 7 | 4.81 | 5 | 10 | 7.08 | no | 0.26 | 5.97 |
| Threshold value: | 6.0 | ||||||||
Notes. 1. Ci = Most conservative cognition value; Oi = Most optimistic cognition value; Gi = importance degree of consensus. 2. Factors with Gi values greater than the threshold value (6.0) are highlighted in gray.
Table 3.
Pairwise comparison of user needs.
| R1 | R2 | R3 | R4 | R5 | R6 | R7 | R8 | |
|---|---|---|---|---|---|---|---|---|
| R1 Comfort | 1 | 0.760 | 1.807 | 2.239 | 0.526 | 1.934 | 2.027 | 1.761 |
| R2 Health | 1.315 | 1 | 2.027 | 2.088 | 0.594 | 2.069 | 2.299 | 2.096 |
| R3 Resource economy | 0.553 | 0.493 | 1 | 1.546 | 0.381 | 1.316 | 1.593 | 1.577 |
| R4 Cost efficiency | 0.447 | 0.479 | 0.647 | 1 | 0.296 | 0.834 | 1.238 | 0.996 |
| R5 Safety | 1.902 | 1.683 | 2.623 | 3.381 | 1 | 3.297 | 3.381 | 3.525 |
| R6 Durability | 0.517 | 0.483 | 0.760 | 1.199 | 0.303 | 1 | 1.362 | 0.986 |
| R7 Utility | 0.493 | 0.435 | 0.628 | 0.808 | 0.296 | 0.734 | 1 | 0.978 |
| R8 Maintainability | 0.568 | 0.477 | 0.634 | 1.004 | 0.284 | 1.015 | 1.022 | 1 |
Table 4.
Inner dependency of user needs (W2).
| R1 | R2 | R3 | R4 | R5 | R6 | R7 | R8 | |
|---|---|---|---|---|---|---|---|---|
| R1 Comfort | 0.563 | 0.245 | 0.332 | 0.136 | 0 | 0 | 0 | 0 |
| R2 Health | 0 | 0.636 | 0 | 0.178 | 0 | 0 | 0 | 0 |
| R3 Resource economy | 0 | 0 | 0.370 | 0.057 | 0 | 0 | 0 | 0 |
| R4 Cost efficiency | 0 | 0 | 0 | 0.293 | 0 | 0 | 0 | 0 |
| R5 Safety | 0 | 0 | 0 | 0.127 | 0.577 | 0 | 0 | 0 |
| R6 Durability | 0 | 0 | 0.177 | 0.063 | 0.110 | 1 | 0 | 0.458 |
| R7 Utility | 0.282 | 0 | 0 | 0.086 | 0.314 | 0 | 0.684 | 0 |
| R8 Maintainability | 0.155 | 0.119 | 0.121 | 0.059 | 0 | 0 | 0.316 | 0.542 |
Table 5.
Weightings of user needs (UNs) without and with interdependency.
| User Needs (UNs) for Low-EI Housing | Weighting without Considering Interdependency | Weighting Incorporating Interdependency | ||
|---|---|---|---|---|
| Weighting (w1) | Priority | Weighting (wC) | Priority | |
| R7 Utility | 0.077 | 8 | 0.177 | 1 |
| R6 Durability | 0.079 | 7 | 0.169 | 2 |
| R1 Comfort | 0.138 | 3 | 0.168 | 3 |
| R5 Safety | 0.248 | 1 | 0.154 | 4 |
| R2 Health | 0.182 | 2 | 0.132 | 5 |
| R8 Maintainability | 0.085 | 6 | 0.131 | 6 |
| R3 Resource economy | 0.100 | 4 | 0.042 | 7 |
| R4 Cost efficiency | 0.090 | 5 | 0.026 | 8 |
Note. wC = w1 × W2.
Table 6.
Inner dependency of design factors (DFs) in planning phase (W3).
| T1 | T2 | T3 | T4 | T5 | |
|---|---|---|---|---|---|
| T1 Building layout | 1 | 0.316 | 0.431 | 0.352 | 0 |
| T2 Building programming | 0 | 0.425 | 0 | 0 | 0 |
| T3 Construction | 0 | 0.111 | 0.410 | 0 | 0 |
| T4 Facilities | 0 | 0.071 | 0 | 0.648 | 0 |
| T5 Materials | 0 | 0.077 | 0.159 | 0 | 1 |
Table 7.
Relationship between the user needs (UNs) and design factors (DFs) (W4).
| R1 | R2 | R3 | R4 | R5 | R6 | R7 | R8 | |
|---|---|---|---|---|---|---|---|---|
| T1 | 0.353 | 0.262 | 0.284 | 0 | 0 | 0 | 0 | 0 |
| T2 | 0.359 | 0.343 | 0.338 | 0.271 | 0.306 | 0.230 | 1.000 | 0.225 |
| T3 | 0.114 | 0 | 0.133 | 0.366 | 0.367 | 0.311 | 0 | 0.239 |
| T4 | 0.081 | 0 | 0.148 | 0.119 | 0.095 | 0 | 0 | 0.151 |
| T5 | 0.093 | 0.395 | 0.098 | 0.243 | 0.232 | 0.460 | 0 | 0.385 |
Table 8.
Real weightings of the design factors (DFs) incorporating user needs (UNs) in the planning phase (wANP).
Table 8.
Real weightings of the design factors (DFs) incorporating user needs (UNs) in the planning phase (wANP).
| Priority | DFs in Planning Phase | Weighting | Accumulated Importance |
|---|---|---|---|
| 1 | T1 Building layout | 0.334 | 33.4% |
| 2 | T5 Material | 0.302 | 63.6% |
| 3 | T2 Building programming | 0.178 | 81.4% |
| 4 | T3 Construction | 0.118 | 93.2% |
| 5 | T4 Service facilities | 0.067 | 100% |
Note: wANP = wC × W3 × W4 = w1 × W2 × W3 × W4.
Table 9.
Real weightings of the design factors (DFs) incorporating user needs (UNs) in the detailed design phase.
Table 9.
Real weightings of the design factors (DFs) incorporating user needs (UNs) in the detailed design phase.
| Priority | Design Factors in Detailed Design Phase | Weighting |
|---|---|---|
| 1 | T5.1 Low-EI material | 0.195 |
| 2 | T1.1 Orientation | 0.176 |
| 3 | T1.2 Building relationship | 0.158 |
| 4 | T5.2 Energy-saving material | 0.107 |
| 5 | T2.2 Thermal environment | 0.077 |
| 6 | T2.1 Floor planning | 0.068 |
| 7 | T3.1 Roof | 0.063 |
| 8 | T3.2 Wall | 0.055 |
| 9 | T4.1 Efficiency of facilities | 0.039 |
| 10 | T2.3 Luminous environment | 0.019 |
| 11 | T4.2 Facilities for water reuse and renewal energy | 0.017 |
| 12 | T2.4 Acoustic environment | 0.014 |
| 13 | T4.3 Intelligent control system | 0.011 |
© 2017 by the authors. Licensee MDPI, Basel, Switzerland. This article is an open access article distributed under the terms and conditions of the Creative Commons Attribution (CC BY) license (http://creativecommons.org/licenses/by/4.0/).
Share and Cite
MDPI and ACS Style
Zhang, H.; Wey, W.-M.; Chen, S.-J. Demand-Oriented Design Strategies for Low Environmental Impact Housing in the Tropics. Sustainability 2017, 9, 1614. https://doi.org/10.3390/su9091614
AMA Style
Zhang H, Wey W-M, Chen S-J. Demand-Oriented Design Strategies for Low Environmental Impact Housing in the Tropics. Sustainability. 2017; 9(9):1614. https://doi.org/10.3390/su9091614
Chicago/Turabian StyleZhang, Heng, Wann-Ming Wey, and Syuan-Jhang Chen. 2017. "Demand-Oriented Design Strategies for Low Environmental Impact Housing in the Tropics" Sustainability 9, no. 9: 1614. https://doi.org/10.3390/su9091614
Note that from the first issue of 2016, this journal uses article numbers instead of page numbers. See further details here.