Environmental Regulation and Industrial Structure Change in China: Integrating Spatial and Social Network Analysis


1
School of Economics, Jinan University, Guangzhou 510632, China
2
Department of Geography and Computational Social Science Lab, Kent State University, Kent, OH 44240, USA
*
Author to whom correspondence should be addressed.
Sustainability 2017, 9(8), 1465; https://doi.org/10.3390/su9081465
Submission received: 21 June 2017
/
Revised: 23 July 2017
/
Accepted: 16 August 2017
/
Published: 18 August 2017
Abstract
:Social networking has become a crucial factor affecting regional economic activities. Employing the panel data of the Yangtze River Delta and the Pearl River Delta in China, we examine the influence of environmental regulation on industrial structure and the role that social networks play in the spillover effect. Using the social media data from the Weibo API and the geo-information of enterprises, we construct the Weibo network and the enterprise network, then we analyze the network structures by employing a social network analysis method. The empirical results find the evidence of the spillover effects of environmental regulation through the above two networks by using network linkages as weight matrices in spatial econometric regressions.
1. Introduction
Environmental regulations impact the industrial structure [1,2]. Although the intention of environmental regulation is to reduce pollution emissions and improve environmental quality, it has an indirect impact on the performance and distribution of economic activities due to changes in the burden of firms and the prices of products. Some literature claimed that environmental regulation increases the burden of manufacturing firms, while having an insignificant effect on the service industry, leading to a change in the relative share of these industries [3,4,5]. One recent development is to shift the focus from its impact inside an economy to the spillover effect. Many studies have proven that environmental regulation would influence the location choice of manufacturing firms and spillover effects have been shown across administrative boundaries [6,7,8,9].
Economic activities are closely connected under different networks, especially for the cities in urban agglomeration [10,11]. Social networks are treated as the backbone of social and economic life and emphasized for the importance of network diversity in the research of social science, due to the interrelated nature of modern society [12]. The existing literature also emphasized that the focus of city theories should “no longer be on location, but on interactions and connections, on networks and the concomitant processes that define flows between places and spaces” [13]. The interaction effects through social networks have also been emphasized and treated as crucial factors affecting regional economic activities [14,15]. For the researchers of environmental-economic sustainability, more attention should also be paid to test the impacts of these social networks on sustainable issues.
In these social networks, social media networks have become more and more important to show people’s concerns about environmental issues and influence governments’ environmental regulation policies [16]. With the development of the Internet and information explosion, social media networks have become a crucial method for people, enterprise, and government to influence each other, which also offers us large-scale data for sustainability research [17]. The rise of “big data” and the importance of incessant streams of data have been widely discussed in science research [18]. Using the content of social media posts to reflect residents’ social attitude towards relevant issues has become an important method to study the impact of social attitudes on infectious diseases [19] and public relations [20]. Additionally, scholars have already paid attention to the role of social media on smart cities [21], spatial communities [22], spatial planning [23], human behavior [24], human mobility pattern [25], urban growth [26,27], regional policy [28], emergency response [29], and spatial economic activities [30].
In this paper, we utilize the datasets of China’s two major urban agglomerations: the Yangtze River Delta and the Pearl River Delta. Based on the social media data from Weibo API and the geo-information of enterprises, we construct the Weibo network and the enterprise network to represent the linkages between cities. We then employ social network analysis in the GIS (Geographic Information System) environment to visualize and analyze the linkages in the two networks. We adapt spatial econometric methods to reveal the impact of environmental regulation on industrial structure, as well as the network spillover effects. Additionally, we employ four types of weight matrices that include the Weibo network and the enterprise network to examine spillover channels and reflect the influences of social networks in the urban agglomeration.
The results of social network analysis show that “core-periphery” structure occurs in the Weibo network and the enterprise network. Further empirical analyses show that environmental regulation has a significant positive effect on industrial structure. The spatial econometric results indicate that the Weibo network and the enterprise network play a vital role in the spillover effect. By introducing social media into the analysis of spillover effects, this research will contribute to the study of environmental-economic sustainability on how environmental regulation impacts urban agglomerations’ industrial structure, thus helping us understand the influence of social networks when making environmental regulation policies.
2. Background and Data
2.1. Background
China, one of the largest developing countries, is paying more and more attention to environmental protection. Although China has made great achievements in economic development, the government realized that the development pattern at the cost of environmental regulation could not be sustainable [31]. Over recent years, China’s central government has set mandatory targets for the reduction of pollution, sparking local governments’ attention on environment protection [32]. Especially for the cities in the above two urban agglomerations, local governments have passed various laws and policies to achieve the goal of environmental protection [33]. For example, Shenzhen, one city in the Pearl River Delta, has set severe industrial policies and carried out a great deal of investment to move some heavily-polluting enterprises out, aiming to control environmental pollution.
For the cities in urban agglomerations, economic activities are closely connected with each other through various methods. To have a better understanding about the impact of environmental regulation on urban agglomerations’ industrial structure and sustainable development, we should consider the interaction effects between cities. The mechanism of how social networks affect spillover effects can be indicated by the following methods: through the interactions in social networks, on the one hand, the demand for environmental regulation permeates among cities, and so the changes of environmental regulation in one region results in changing environmental regulation policies in other regions that are connected with each other through social networks; on the other hand, the economic activities that are impacted by environmental regulation may transfer within urban agglomerations through these social networks. These factors then result in network spillover effects in the industrial structure.
There are various networks in urban agglomeration and each network type provides one aspect of information about our research question. Four different network linkages are considered in the analysis: the social media network, the enterprise network, the environmental regulation disparity, and spatial position relations, which reflect cities’ mutual social media concerns, enterprise connections, differences in environmental regulation stringency, and geographical position. Of the four network linkages, the social media network is our most pressing concern. In the big data era, user-generated content in Web 2.0 can be increasingly utilized as a source to estimate the relatedness of the communities [34]. In the last decade, social media websites have undergone rapid growth in China [35]. With the help of social media, environmental issues have received more and more public attention, which puts pressure on governments to control pollution. Sina Weibo is a microblogging website with the largest user group in China, whose monthly active users reached 236 million in 2015 (twitter had 302 million monthly active users during the same period). Weibo has become the main channel for Chinese people to express their opinions, and environmental issues are always hot topics in Weibo. As mentioned before, social media data and other geo-information data have been widely utilized in many studies, which have verified the validity of employing these data in social science research. Especially, social media data can reflect the information flows and the extent of mutual concern between cities, and can be treated as one aspect of the city network [36]. Furthermore, we use the added social media data to construct the linkages between cities, and employ it to analyze the network structure of the urban agglomerations.
Our study areas include the Yangtze River Delta and the Pearl River Delta, which are the two largest urban agglomerations in China. As shown in Figure 1, the Yangtze River Delta is located in Southeast China and consists of 16 cities in three provinces, which include metropolises like Shanghai, Hangzhou, and Nanjing. The Pearl River Delta is located in South China and is made up of nine cities in Guangdong Province, including metropolises like Guangzhou and Shenzhen. The two urban agglomerations occupy 16.7% and 12.1% of the country's GDP, respectively, with just 2% and 0.57% of the country’s area (during our study period). Additionally, the two urban agglomerations are trade, commerce, and manufacturing centers of China.
2.2. Data
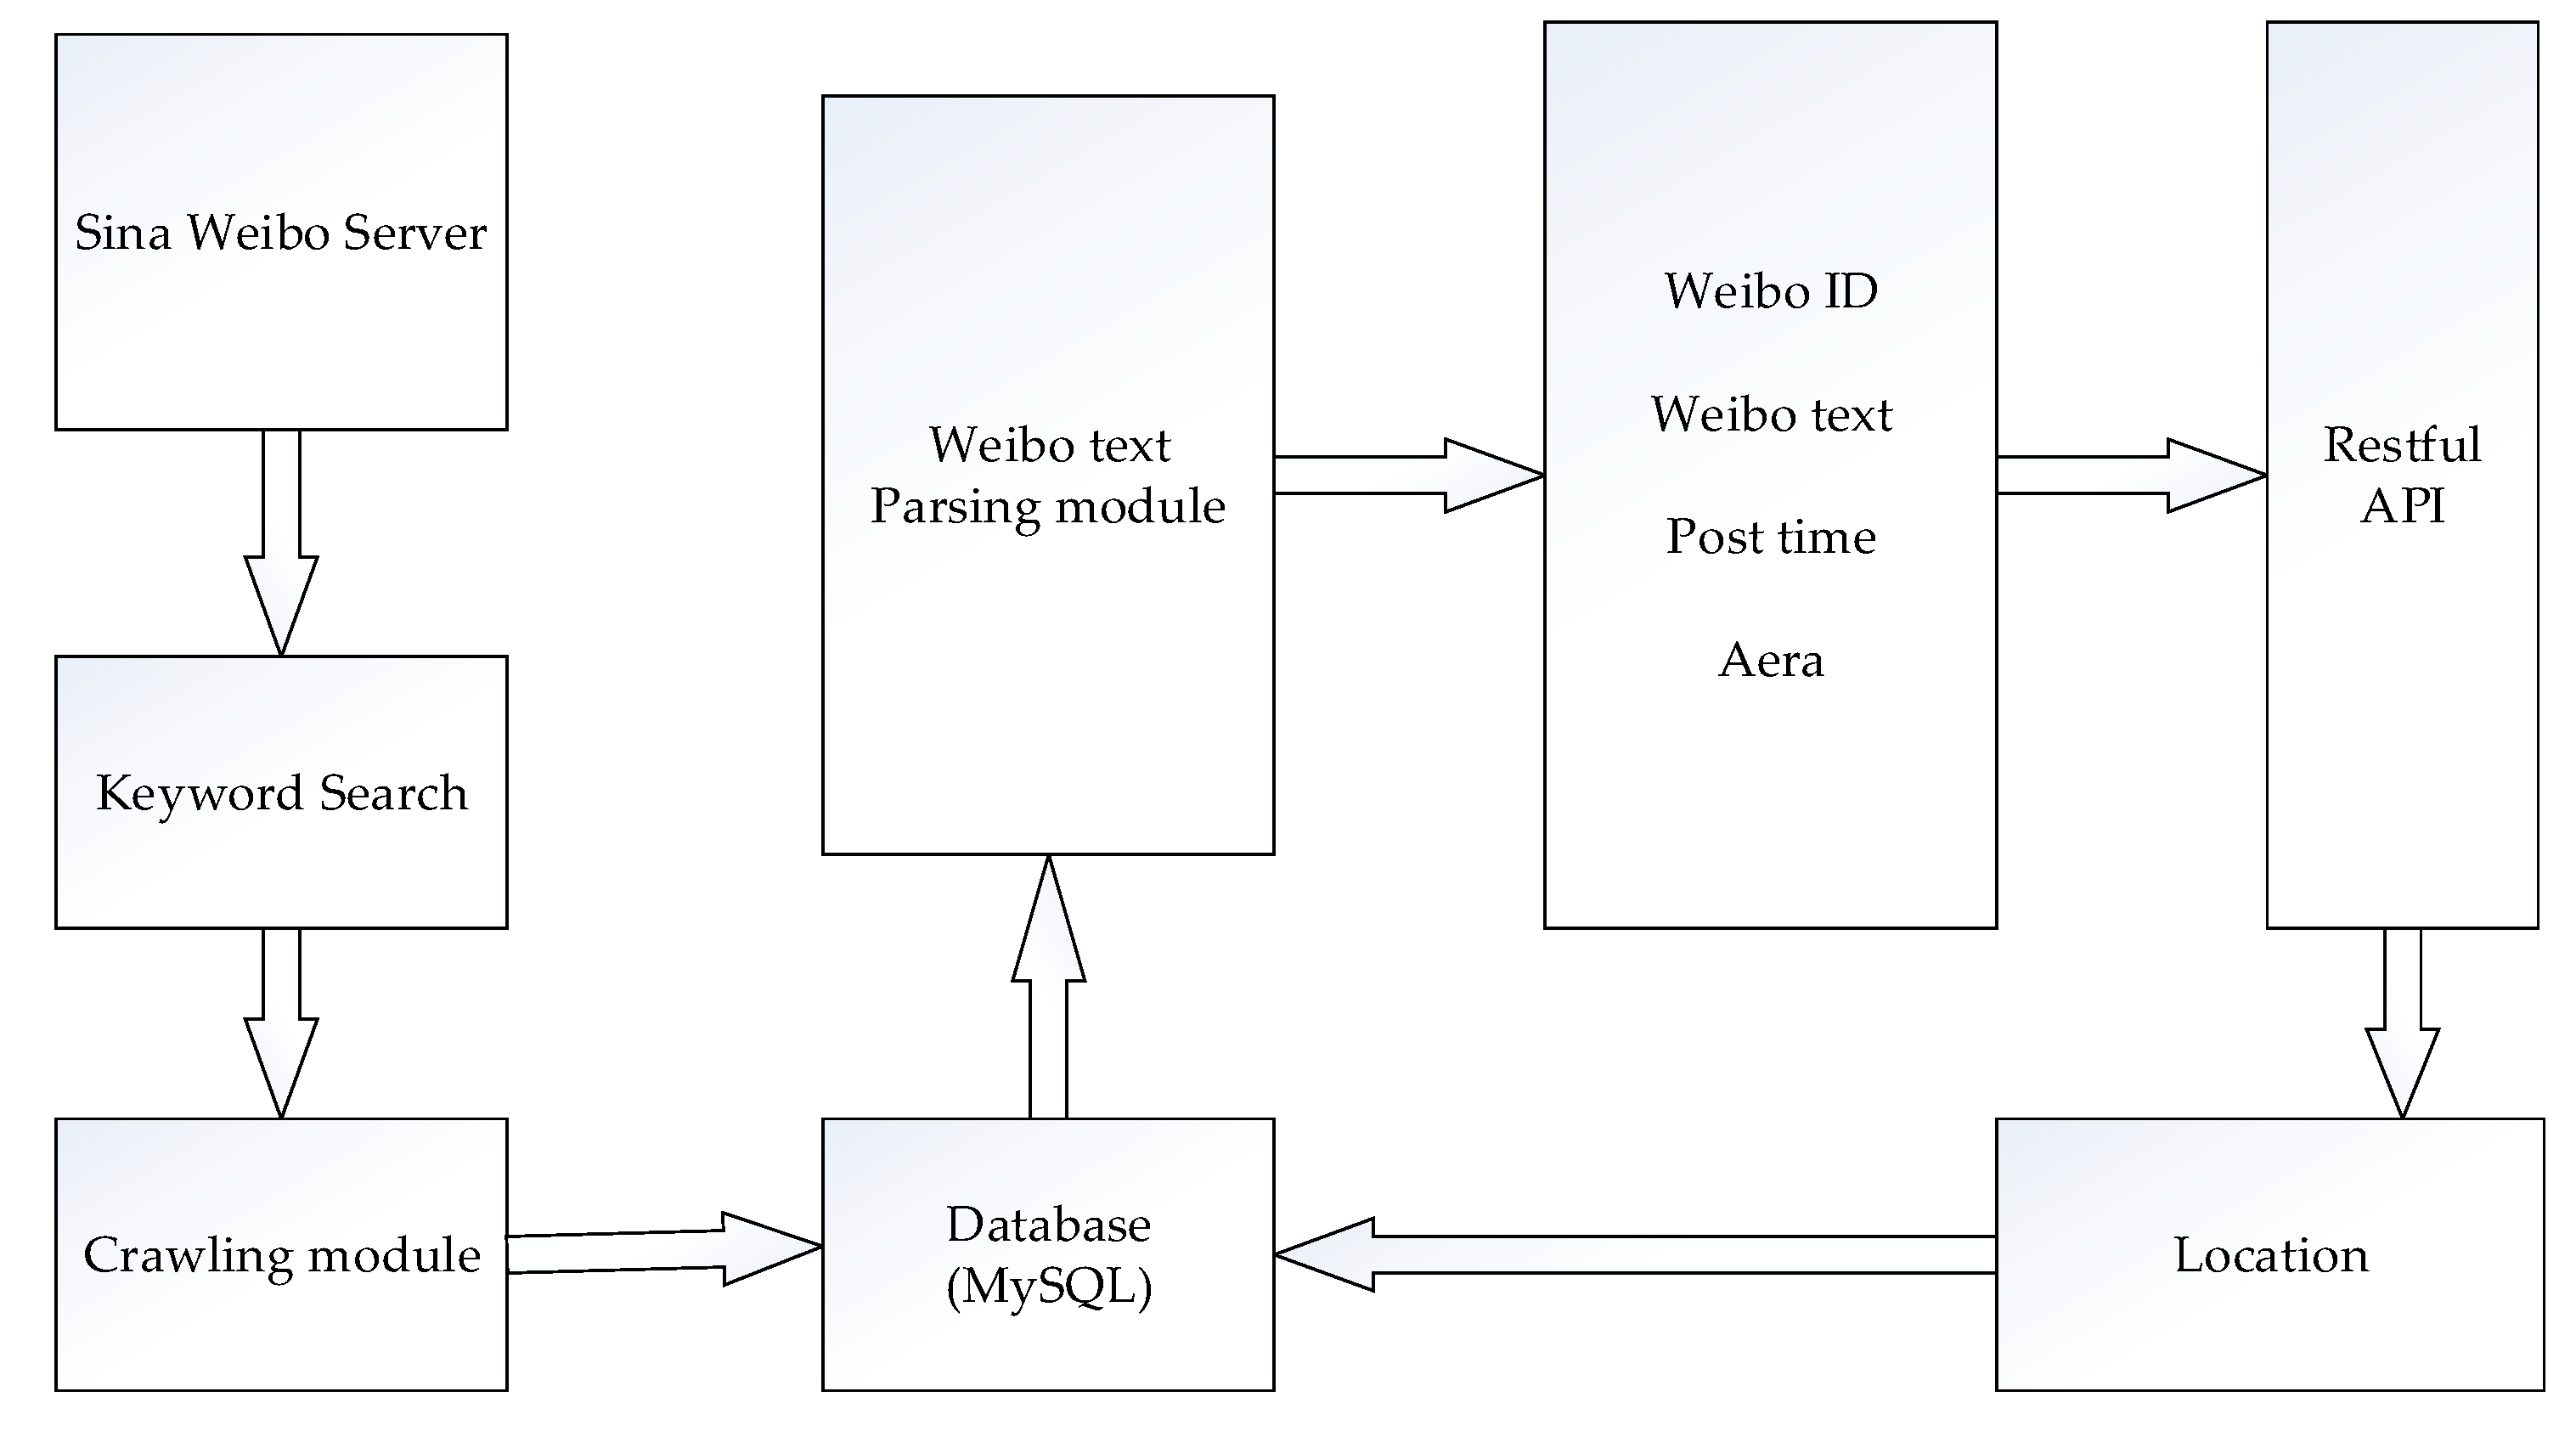
In the above four kinds of social networks, how to construct the social media network and the enterprise network are the key issues to be solved in this paper. Firstly, we use the data from Sina Weibo to construct the social media network (namely the Weibo network). Specifically, the Weibo posts with specific keywords can reflect residents’ concern on certain issues. Using these social media data, we can construct the social media linkage between cities. From a series of API provided by Sina Weibo for developers, we can use a web crawler to obtain a relatively complete dataset (see Figure 2). The developed web crawler functions in the following manner: With the crawler, posts can be collected by keywords, timing, and location. The keywords consist of the most concerned environmental topics, including smog, water pollution, air pollution, and pollution emission (all in Chinese), which can reflect the local peoples’ attitude towards environmental pollution directly.
Due to the ambiguity and typographical errors of many place names, we cannot obtain coordinates in many cases. Thus, we use a Weibo API to send a request to the Weibo server with the post ID, in order to retrieve the actual location of the Weibo post. Then a post can be described as a six-tuple Weibo (id, text, post time, user id, area, location). By merging these locations of posts at the city level, we can obtain the total number of posts in two urban agglomerations in these years, which can reflect the social attitude towards pollution. Figure 3 shows the numbers of the Weibo posts with the above keywords, which reflects residents’ social attitude change towards pollution issues in two urban agglomerations from 2010 to 2014. We can see that residents in two urban agglomerations pay more and more concern toward the impact of environmental pollution on their own lives, and this growing concern also indicates that the pollution problem has become a major livelihood issue in local governments’ work.
Using the location data from Sina Weibo, we can construct the linkage of cities in the two urban agglomerations, from January 2014 to December 2014. Following Liu et al. [37], we employ a gravity model to construct the Weibo network, which reflects the mutual concern about pollution issues between cities. The linkage of the Weibo network can be constructed by the following equation:
where indicates the sum linkage between city and city in the Weibo network, and are the location numbers that we get from the Weibo posts with related keywords, denotes the distance between two cities.
Secondly, to construct the enterprise network, we collect the geo-information of the top 100 companies (The company list can be seen at http://www.fortunechina.com/fortune500/c/2016-07/13/content_266415.htm (In Chinese)) and their subsidiary companies in the cities of two urban agglomerations. Following the interlocking network model proposed by Taylor [38], we use the collected geo-information to calculate the linkages in the enterprise network. The detailed method can be divided in three steps: (1) the importance of cities to each enterprise can be scored between 3 (headquarter location) and 0 (no office in the city) using a variety of indicators of office importance; (2) add up the scores that city get from all the enterprises; and (3) the linkage of two cities can be calculated by multiplying two cities’ total scores.
3. Methodology
3.1. Empirical Models
Our empirical investigation of the relationship between environmental regulation and industrial structure is based on the following equation, and we use it as our benchmark model:
where , and reflect the individual fixed effect, the time fixed effect and the residual error, respectively. is the dependent variable: industrial structure. In this paper, we focus on the differentiated effect of environmental regulation on manufacturing and service sectors and use the ratio of the output of the service sector and the manufacturing sector as a proxy for the industrial structure [39], namely , where and represent the output of the service sector and manufacturing sector in city at time .
is our explanatory variable: environmental regulation. Local governments’ Pollution Abatement and Control Expenditures (PACE) are used to represent the environmental regulation stringency [40]. PACE can reflect local governments’ activities aimed directly at pollution abatement, which arise as the consequence of government environmental policies and include the flow of investment and current expenditures [41]. We use PACE per capita as a proxy for environmental regulation, and a higher value of PACE per capita indicates that local government has a more stringent environmental policy. Consistent with the previous study [42], environmental regulation variables are lagged by one year to control the potential endogeneity issue.
Following the previous studies [43,44,45], , , and are included in the model as control variables, representing the fixed asset investment per capita, wage level, R&D and the GDP per capita, respectively.
Spatial econometrics have been widely used in empirical researches to identify network spillover effect [46]. To analyze the spillover effects caused by environmental regulation, especially the direction and extent of the spillovers, we employ the spatial lag of X (SLX) model to estimate the spillover effect [47]. Specifically, we introduce the spatial lag term of explanatory variable to the above equation and use spatial econometric method to regress it:
where in the equation means the environmental regulation of other cities connected through network and indicates the corresponding spillover effect. In spatial econometrics, the weight matrix reflects the method of interactions between cities, and different weight matrices can be used to identify “where and to what extent spillovers are occurring”, namely the spillover channels [48].
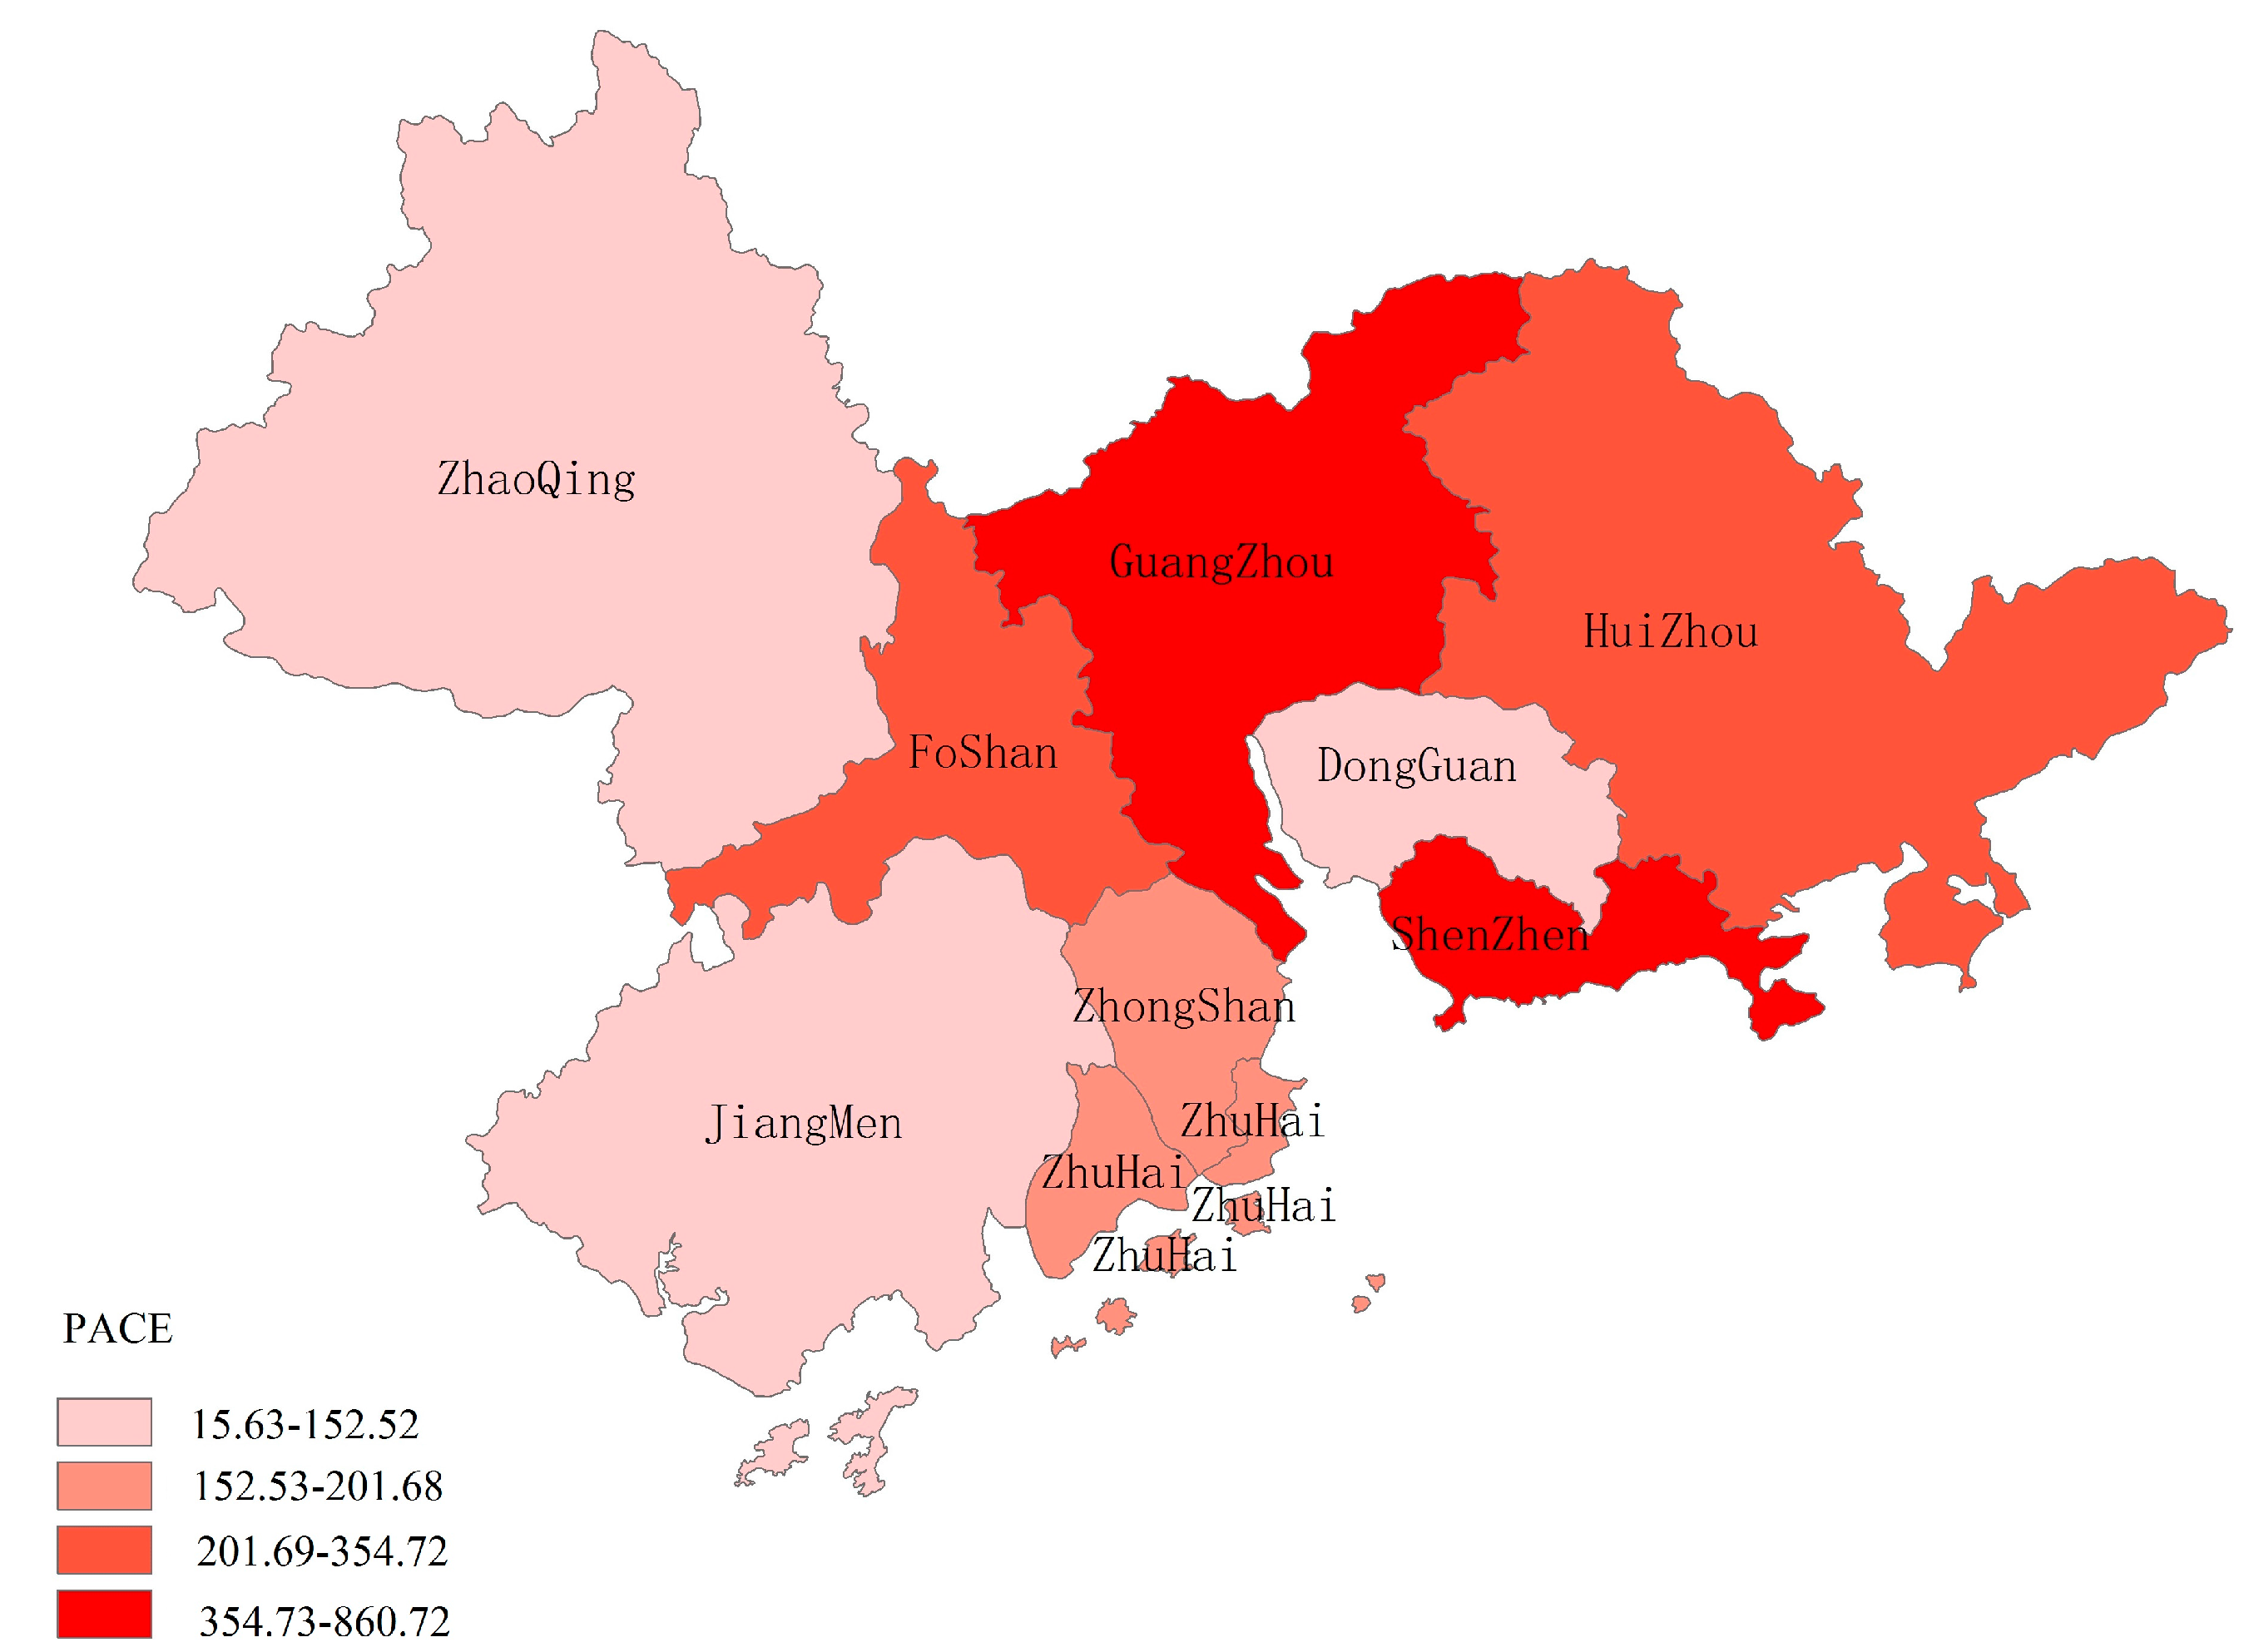
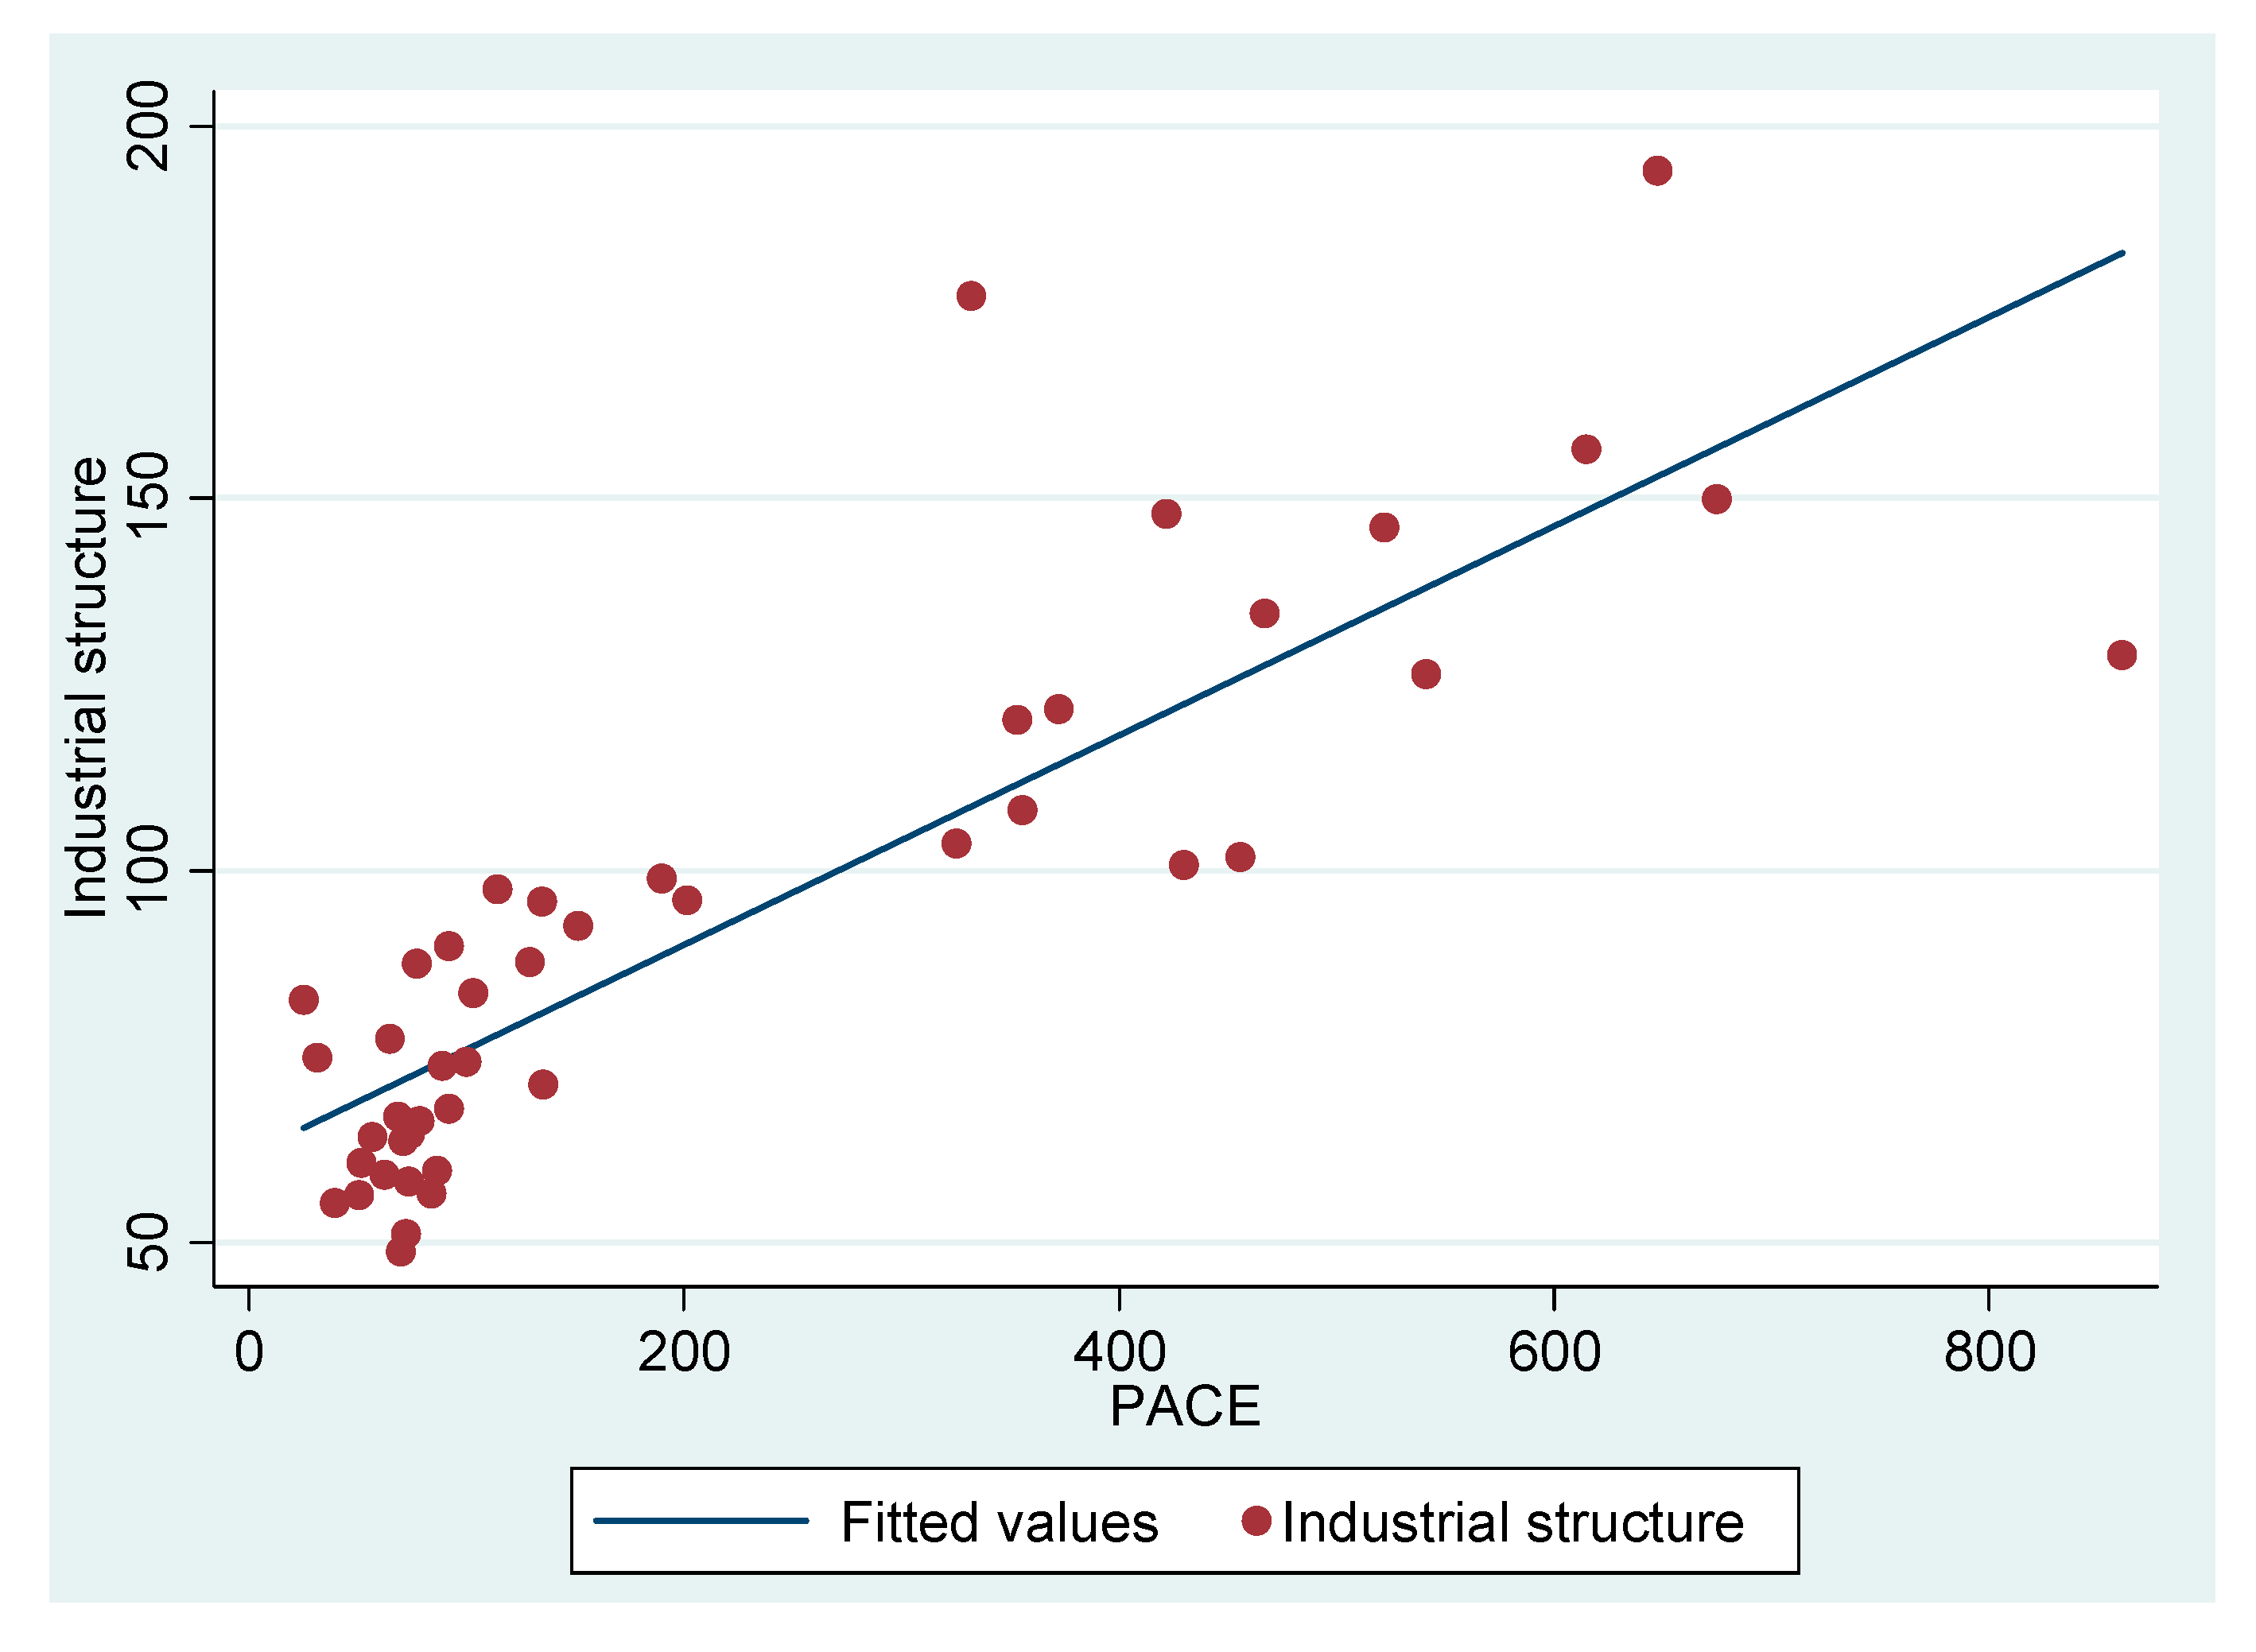
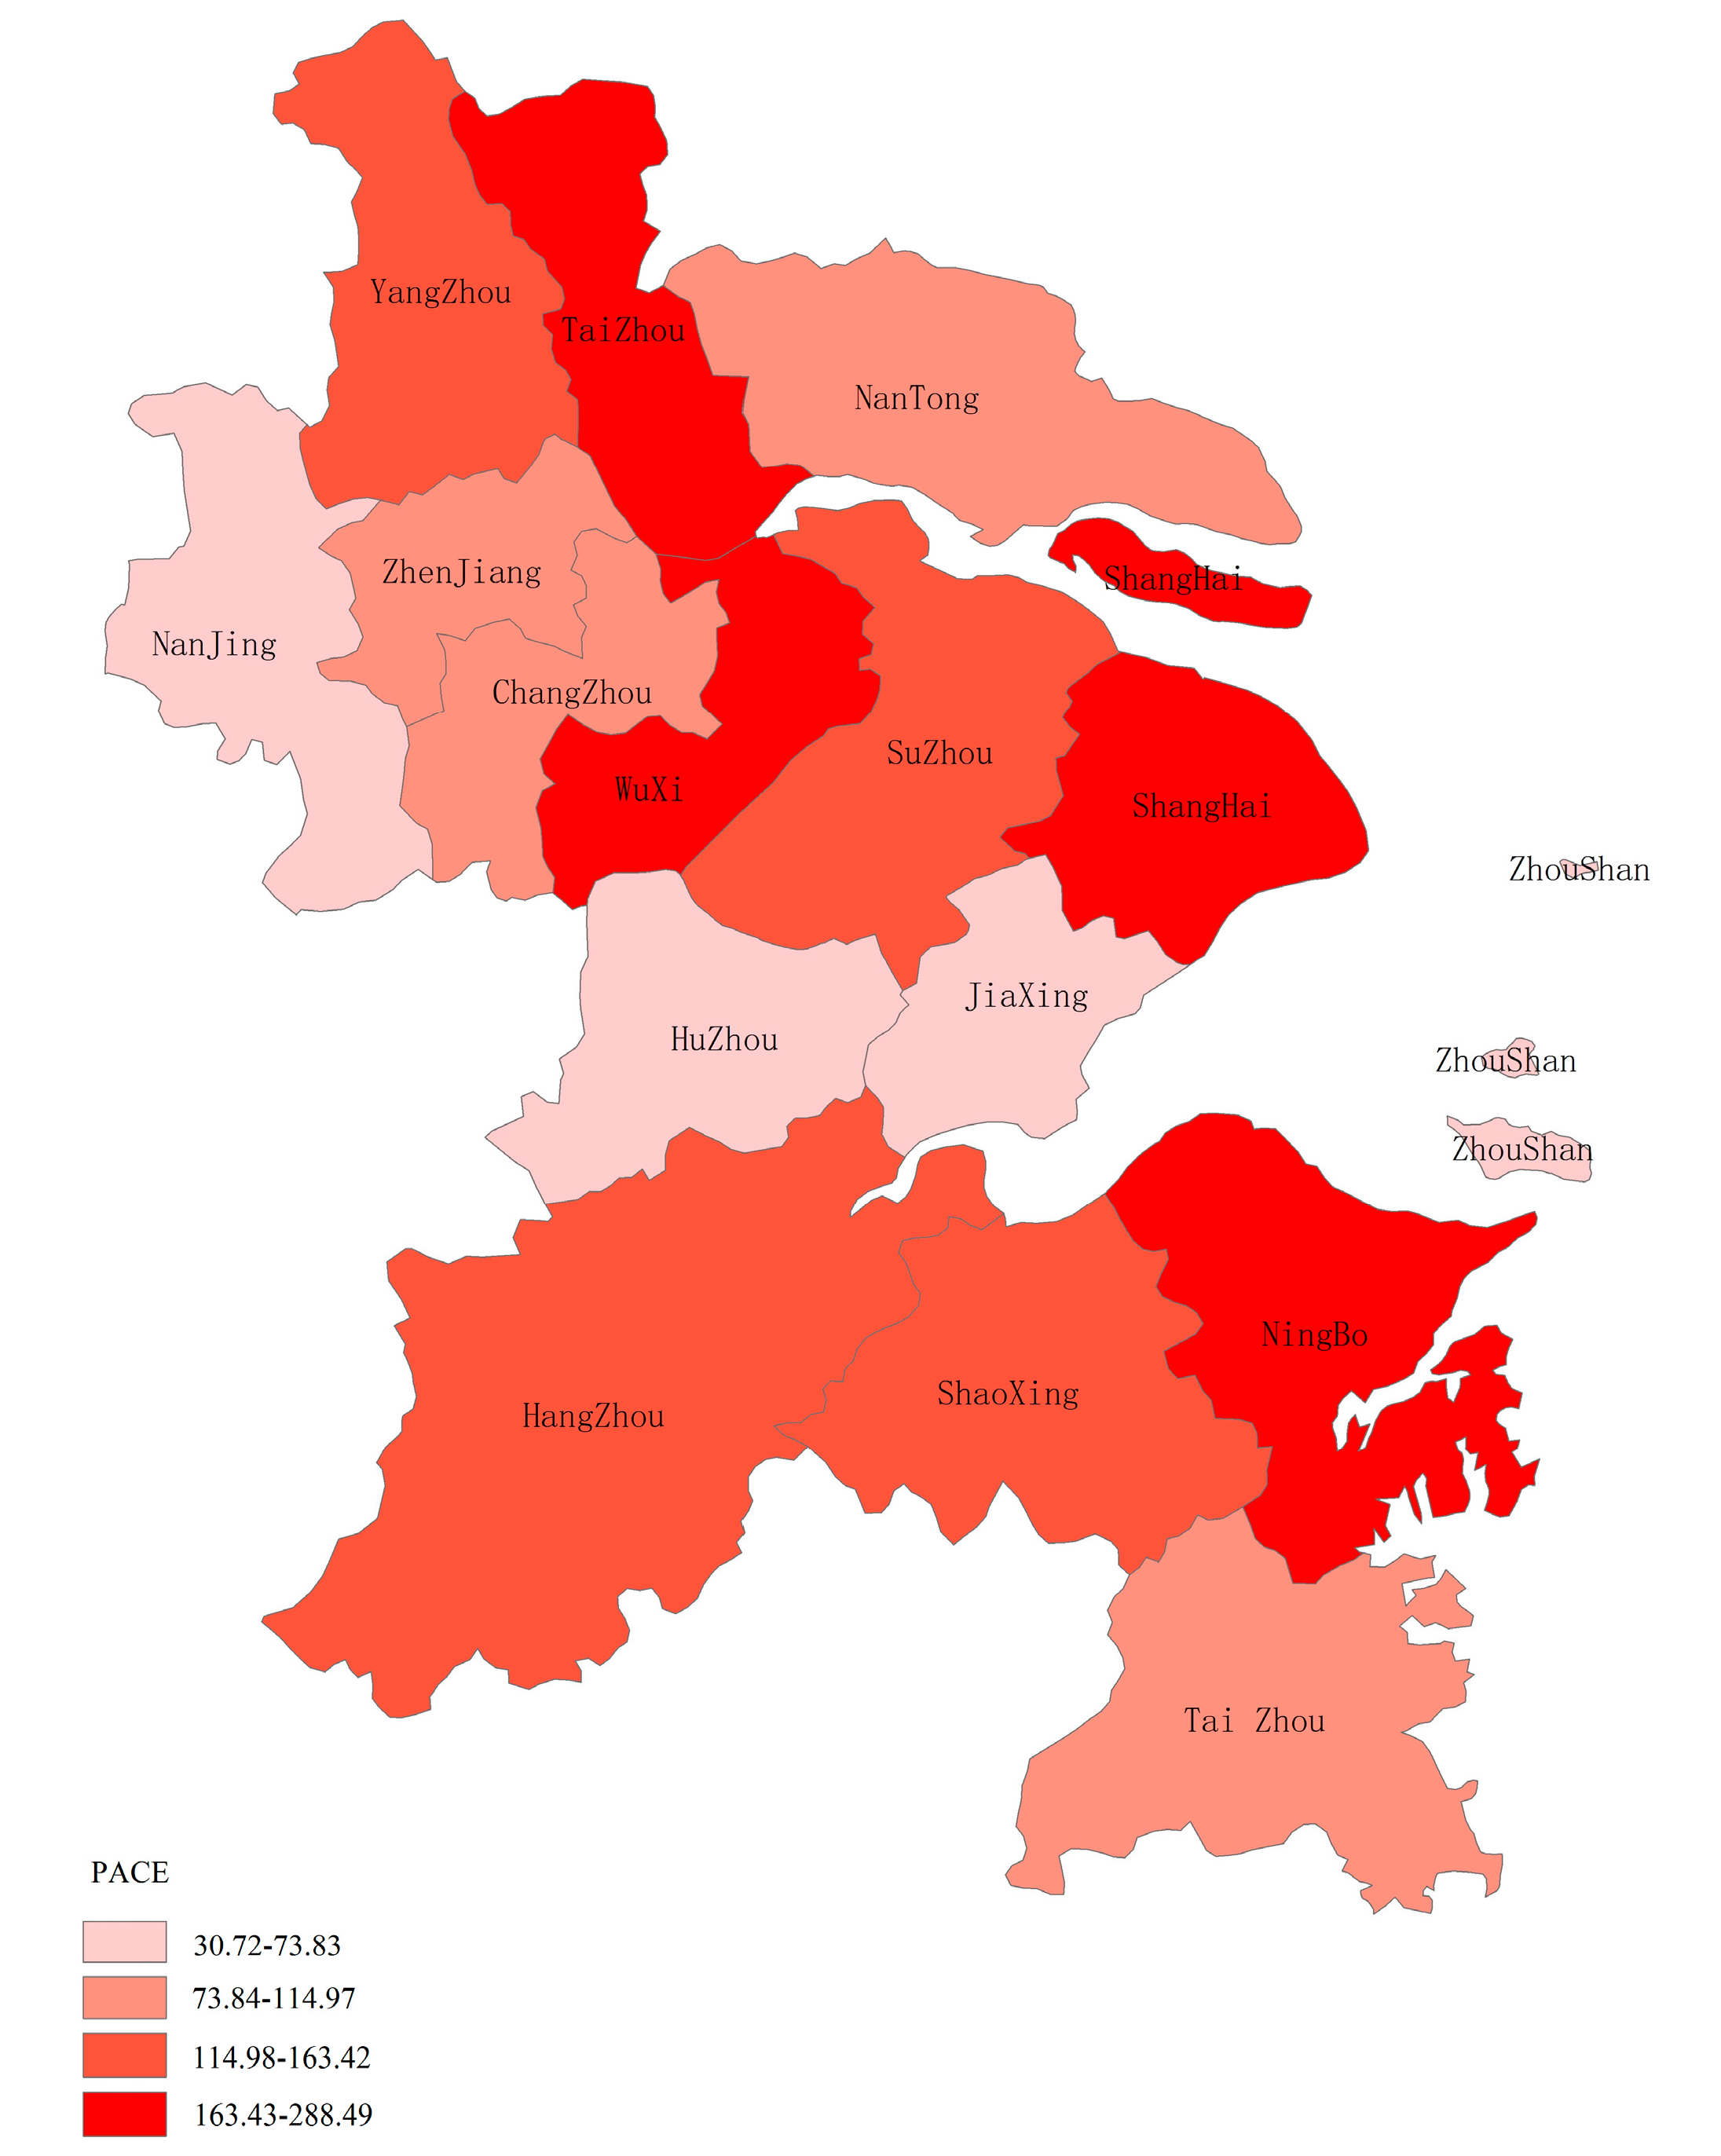
Our study period is from 2010 to 2014, data for the industrial structure, the fixed asset investment per capita, population, wage level, R&D, and the GDP per capita at the city level are available from the China City Statistical Yearbook (Data can be found at http://data.cnki.net/Yearbook/Single/%20N2016030128 (In Chinese)) [49] and cities’ statistical yearbook. The data of PACE are available from the local governments’ annual expenditure budgets. The scatterplot diagram for PACE and industrial structure can be seen in Figure A1 and Figure A2. The spatial distribution of PACE in the two urban agglomerations can be seen in Figure A3 and Figure A4.
3.2. Specification of Weight Matrix
Typically, in the case of environment regulation spillover effect, there are various networks in the urban agglomeration and each network type provides one aspect of information about our research question. Based on the above Weibo data and geo-information, our main attention has been put toward the network spillover effects of the Weibo network and the enterprise network. To compare these two networks, we construct four types of weight matrices are constructed to examine the network spillover effects, which reflect the above four kinds of relations, respectively. The four types of weight matrices are constructed as the following equations, and all row elements in the four matrices are standardized as a convention method.
(1) The Weibo Network Matrix
To illustrate the impact of social media on spillover effect, we use the Weibo network to represent the social media interaction between cities; the weight matrix form is set as Equation (4):
where indicates the sum linkage between city and city in the Weibo network.
(2) The Enterprise Network Matrix
In the enterprise network, the more closely linked city and city are, the more likely that commercial cooperation occurs between them which, in turn, leads to a spillover effect on industrial structure. The enterprise network matrix is set as Equation (5):
where indicates the sum linkage between city and city in the enterprise network.
(3) The Environmental Regulation Disparity Matrix
To express the environmental regulation disparity between cities, we set the weight matrix form as Equation (6):
where and represent the average environmental regulation stringency of city and city , respectively.
(4) The Adjacency Matrix
The adjacency matrix specifies the “neighborhood set” for each city, which is the standard method in spatial econometrics [50]. This specification means that the spillover effect only occurs between cities that share a common border. The specification of can be seen from Equation (7):
4. Results
4.1. Network Characters
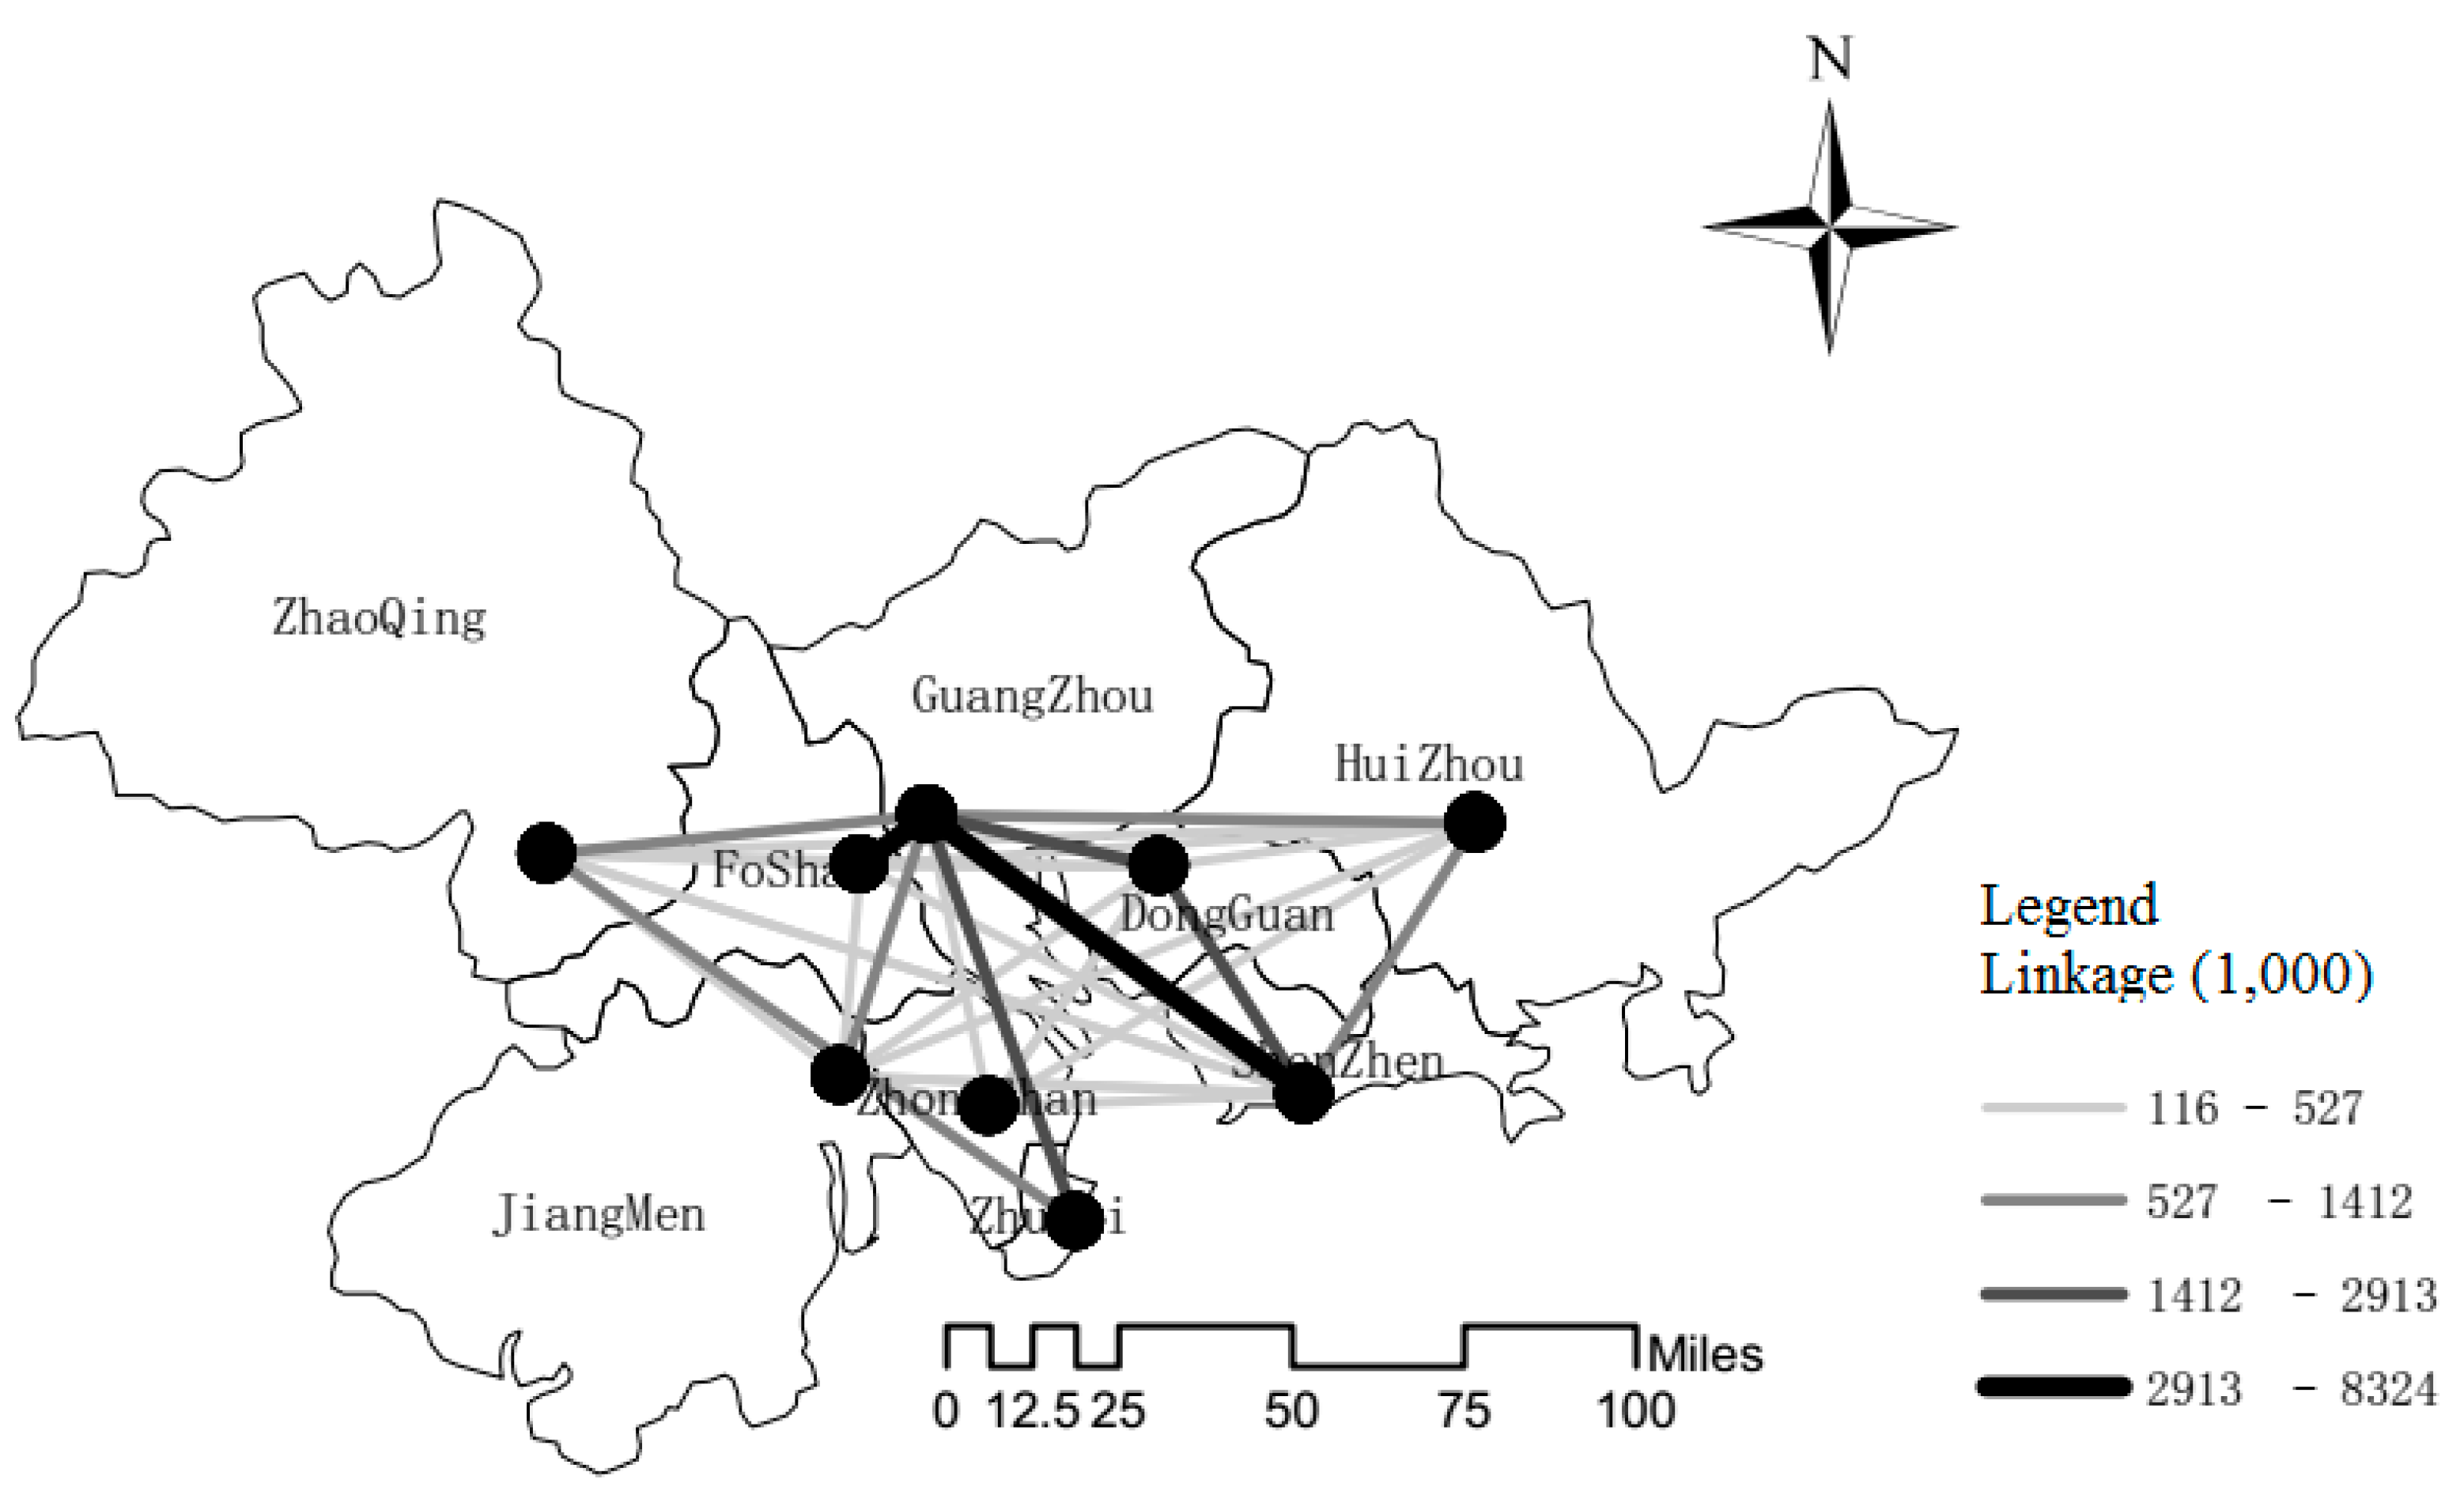
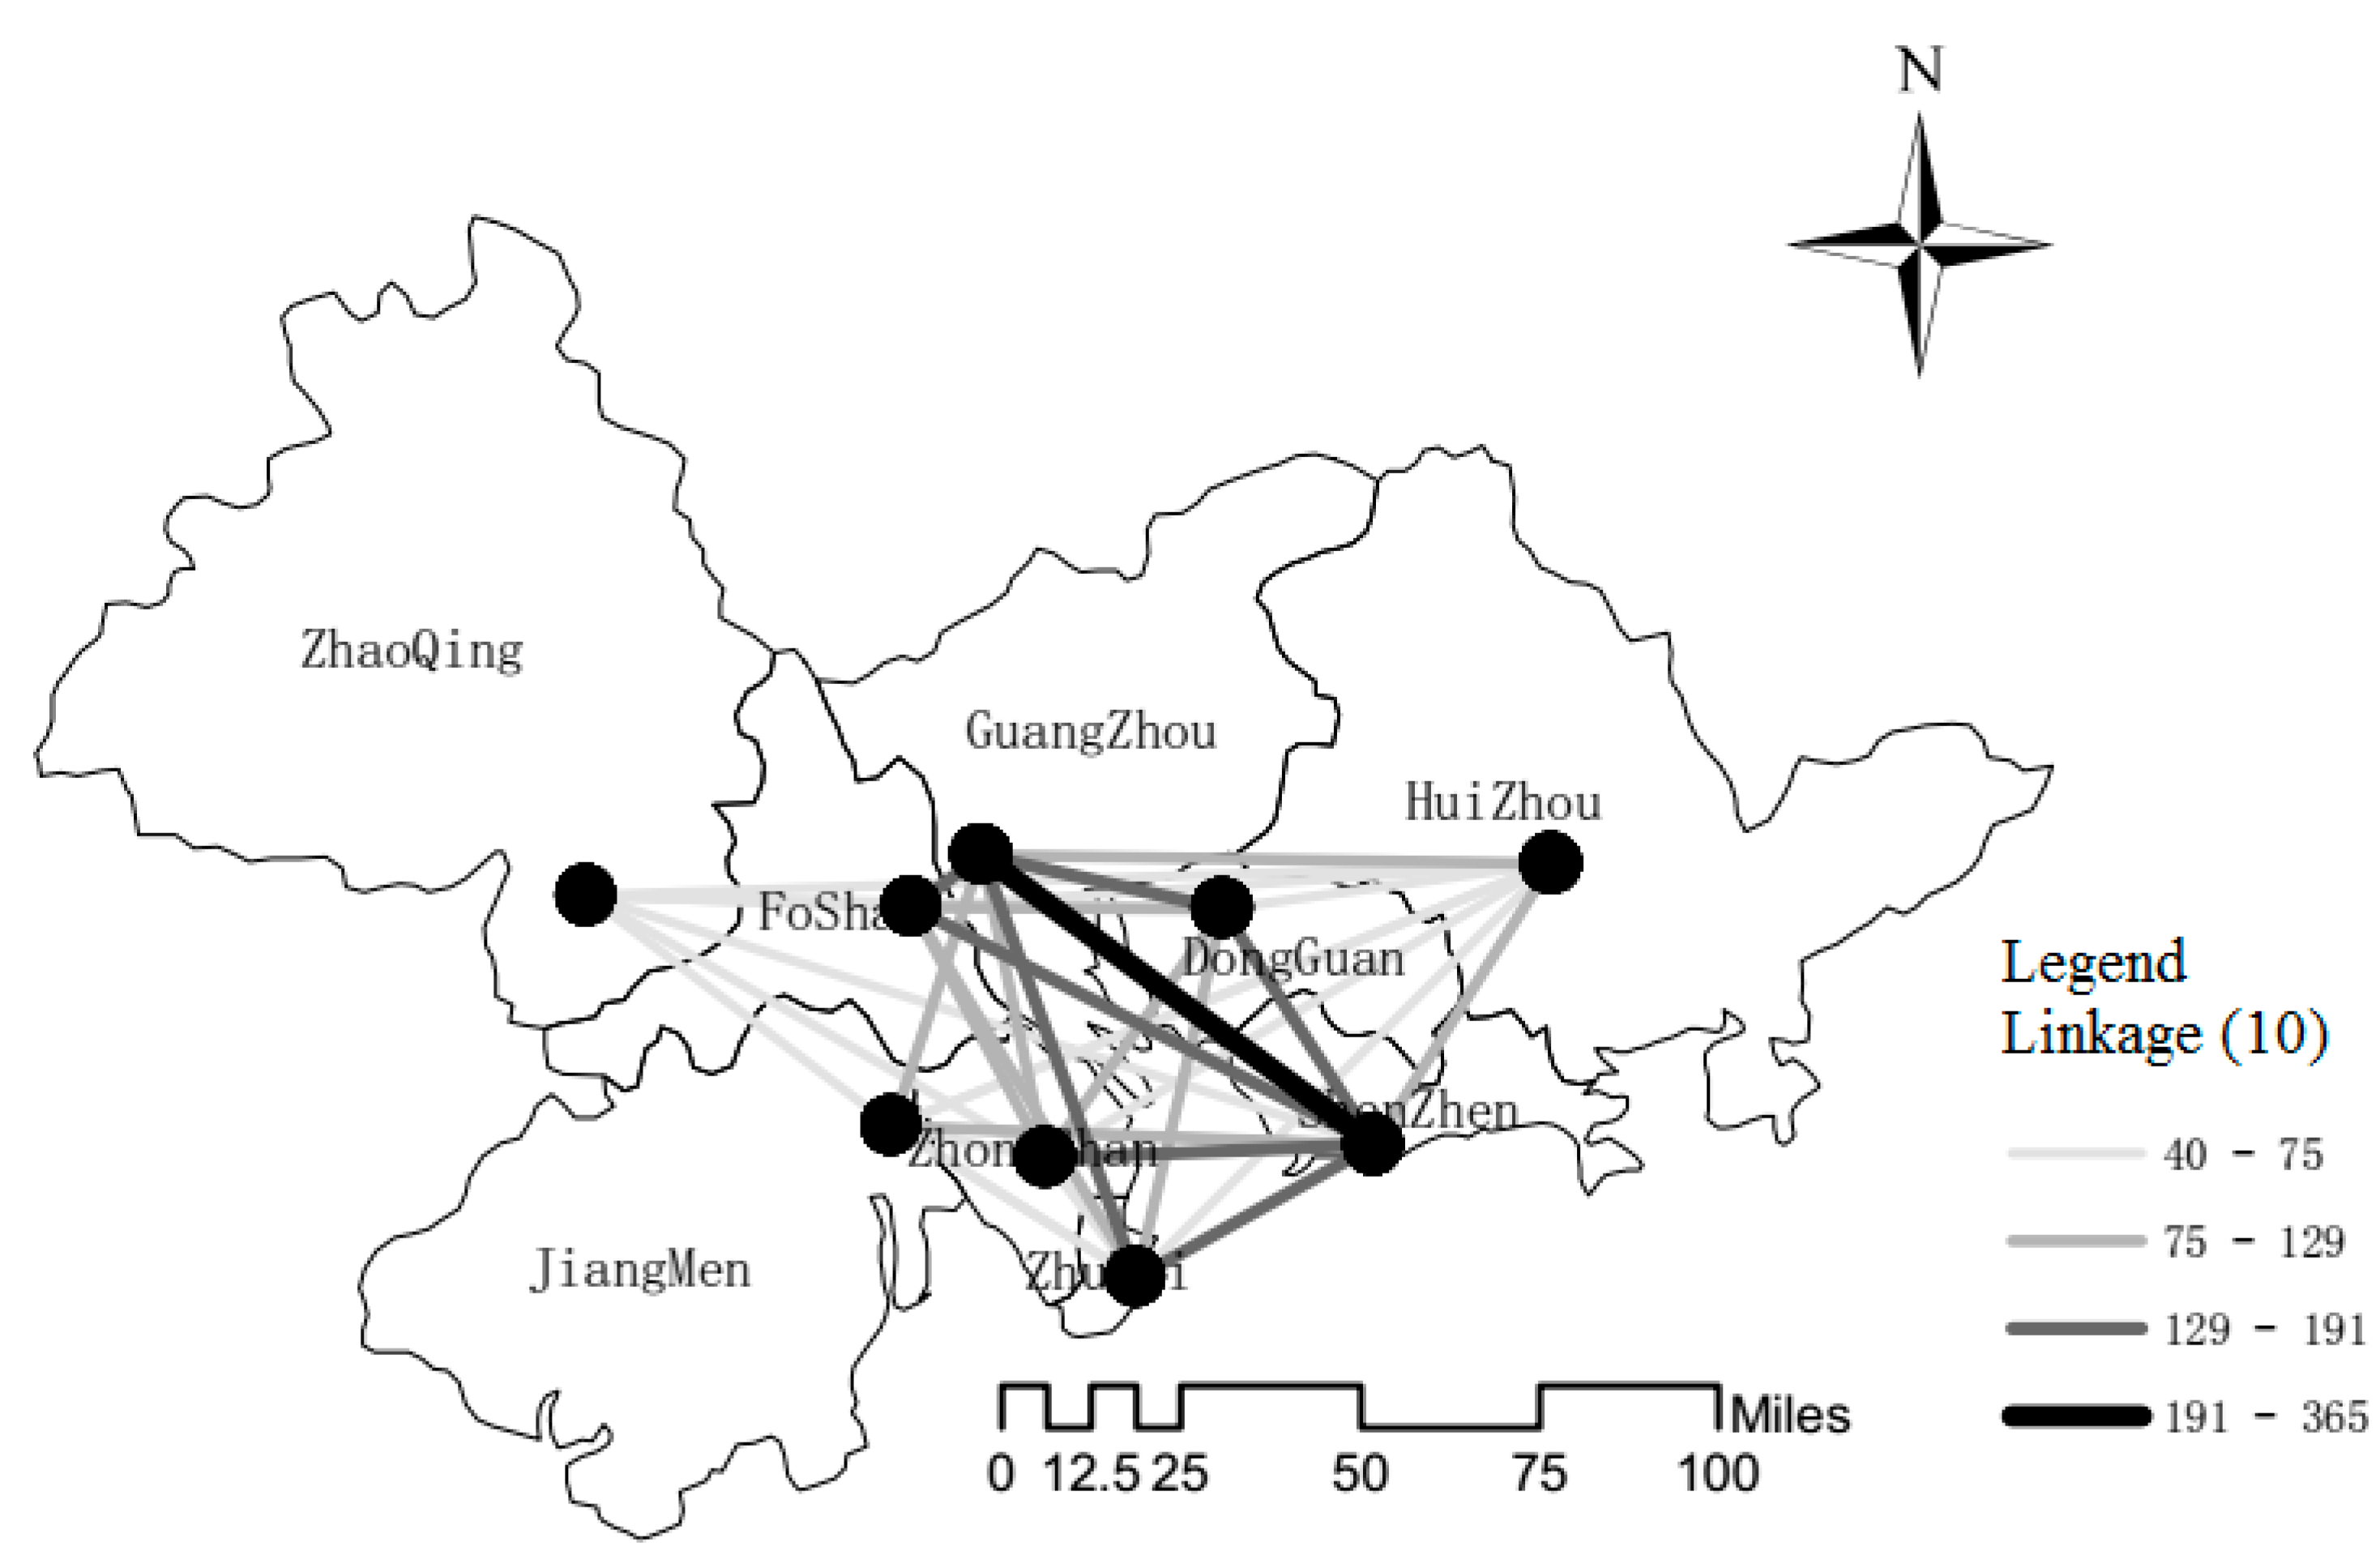
Although all cities interact with each other in networks, there are hierarchical tendencies within the relationship between cities. Using the linkage data of the Weibo network and the enterprise network, we visualize the linkages of cities in the GIS environment. Figure 4, Figure 5, Figure 6 and Figure 7 clearly reveal the structural characters of the Weibo network and the enterprise network in two urban agglomerations. The thickness of lines characterizes the strength of the linkages, and the numbers in the legend mean the magnitude of links in the network. Obviously, the linkages in the Weibo network and the enterprise network are different from their geographic spatial locations. For the Yangtze River Delta, the cities linked with the thickest line in the Weibo network are Shanghai, Wuxi, and Tai-zhou (in Zhejiang province), which shows the most concern on environmental issues in social media. The cities linked with the thickest line in the enterprise network are Shanghai, Hangzhou, Wuxi, and Tai-zhou. For the Pearl River Delta, the Weibo network and the enterprise network have the similar structure with the core cities of Guangzhou and Shenzhen, which are the two most important cities in South China.
4.2. Empirical Results
4.2.1. The Results of the Benchmark Model
An OLS (ordinary least square) estimation is performed to estimate Equation (2) and column 1 of Table 1 and Table 2 show the results of our benchmark model, corresponding to the Yangtze River Delta and the Pearl River Delta, respectively. All the variables are log-linearized, and the regression coefficients represent the elasticity of independent variables.
From the estimation results of the benchmark model, we find that the coefficients of environmental regulation are always positive and consistently significant at the 1% level, indicating that more stringent environmental regulations increase the ratio of the output of the service sector and manufacturing sector in the two urban agglomerations. The coefficient of environmental regulation in the Yangtze River Delta is 0.148, which indicates that an increase of environmental regulation stringency by one level is estimated to increase the ratio of the service sector and manufacturing sector by 0.148%. In the Pearl River Delta, the elasticity value is 0.201, which means that as the environmental regulation stringency increases by 1%, the ratio of the service sector and manufacturing sector will increase by 0.201%. Comparing the two results, we find that environmental regulation has a greater impact on industrial structure in the Pearl River Delta, which may be due to the features of its manufacturing industry. In the Pearl River Delta, the manufacturing industries of peripheral cities mainly rely on the form of OEM (original equipment manufacturer), which produce more pollution and are more sensitive to environmental regulation. In summary, the results of our benchmark show that environmental regulation has a significant influence on industrial structure change between the service sector and the manufacturing sector in both of the urban agglomerations.
Turning to control variables, estimation results reveal that the fixed asset investment per capita, R&D, and the GDP per capita have a positive impact on industrial structure, which echoes the findings for the European Regions [51] and China [52]. Wage is only marginally significant in the Yangtze River Delta, perhaps because high wages have become a crucial factor restricting the development of the manufacturing industry in the Yangtze River Delta.
4.2.2. Spillover Effects and Its Channels
Columns 2–5 of Table 1 and Table 2 show the regression results of the SLX model under the above four weight matrices, respectively. Compared with the results of benchmark model, the results of the SLX model recognize the impact of environmental regulation on industrial structure again, whose coefficients are statistically significant in all results. The SLX model captures the network spillover effects of environmental regulation through different matrices. For spillover channels, as we have stated before, there may be several spillover channels that exist at the same time. Using the four weight matrices we constructed in the former part, we test whether these networks influence the spillover effects and identify the spillover channels through which spillover can occur. The coefficient of spatial lag variables can reflect the spillover effect and spillover channel by its significance and magnitude.
According to the estimation results presented in Table 1, the values (0.102 under the Weibo network ; 0.094 under the enterprise network ) are significantly positive, which suggests that environmental regulation has a positive effect on other cities’ industrial structure through the two networks, meaning that spillover occurs among the cities closely connected within the two networks. In contrast, the value under the adjacency matrix is significantly negative (−0.139), meaning that local environmental regulations lead to negative effects on neighborhood cities’ industrial structure. Comparing the coefficients of determination under the above weight matrices, the Weibo network fits the data in the best way.
It is worth noting that the spillover effects under and are different from the spillover effect under , which indicates that the network structures play a crucial rule in the spillover effect. The spillover effect under the adjacency matrix seems more reasonable and consistent with previous studies: manufacturing firms may relocate to neighboring cities when facing a more stringent environmental regulation, thus resulting a positive relation between its environmental regulation and its neighbors’ manufacturing output and a negative spillover effects for neighbors’ industrial structure. For the results of and , due to their different network structures, two possible reasons can explain these positive spillover effects. Firstly, the cities connected within two networks tend to make similar environmental regulation policies, which leads to a positive correlation between them; secondly, the relocation effects for manufacturing firms, mostly occur to its neighbors. Due to the network structure difference, the relocation effects of the manufacturing sector are not that important under the Weibo network and the enterprise network.
To justify the two explanations, we conduct robustness tests by using the growth rate of the manufacturing sector as the independent variable and estimate Equation (3) with the Weibo network and the enterprise network , The estimation results are reported in columns 6 and 7 in Table 1. The coefficients of WER, namely the values under the two networks, are significantly negative (−0.059 and −0.084), meaning that local environmental regulation has a negative effect on the growth rate of the manufacturing sector of network-connected cities. Concerning that industrial structure is measured by the ratio of the output of service sector and manufacturing sectors, these results support our explanation of why environmental regulation has a positive effect on network-connected cities’ industrial structures, and indicate that the cities connected with the two networks tend to make similar environmental regulation policies and have similar industrial structures.
For the Pearl River Delta, the estimation results in Table 2 show that the values are significant under all four matrices. Consistent with the above results of the Yangtze River Delta, the values under the weight matrices , and are also significant in the Pearl River Delta, which confirms the reliability of our results. The values (0.071 under the Weibo network ; 0.039 under the enterprise network ) verify the positive spillover effects of environmental regulation among network connected cities. The results of robustness tests in columns 6 and 7 in Table 2, which use the growth rate of the manufacturing sector as the independent variable, are consistent with the results of the Yangtze River Delta, indicating that the positive spillover effects under and are robust in the two urban agglomerations. Different from the Yangtze River Delta, the value under the environmental regulation disparity matrix is significantly negative in the Pearl River Delta, which means that environmental regulation disparity plays a vital role in the spillover effect and spillover occurs in the cities with the loosest environment regulation. Comparing the coefficients of determination under the above weight matrix, we find that the environmental regulation disparity matrix fits the data in the best way. To explore the reason for this difference, we can draw some insights from the industrial policies advocated by the Guangdong provincial government, which moves the most serious polluting enterprises from the core cities to surrounding cities and supports the development of high-technology enterprises in the core cities in the meantime. The industrial transfer led by the provincial government is from the cities with more stringent environmental regulation to the cities with laxer policies. Through this process, the core cities achieve the goal of updating their development patterns to be more sustainable. For the cities with relatively lenient environmental regulation, manufacturing firms move in and bring demand for employment, which gives peripheral cities a chance to achieve a faster economic growth rate.
From the above results, we find that the spillover effects of environmental regulation are significant in the two urban agglomerations, and both the Weibo network and the enterprise network are important spillover channels. Meanwhile, how substantively strong is the spillover effect compared with the impact of local environmental regulation? Comparing the values under different matrices and the corresponding coefficients of environmental regulation, we can find that there is a difference in the magnitude of spillover effects between the two urban agglomerations. For the Yangtze River Delta, local environmental regulation has the effect that is almost one and a half times stronger than the network spillover effects under the Weibo network and the enterprise network . For the Pearl River Delta, local environmental regulation has the effect that is at least two times stronger than the spillover effects under the Weibo network and the enterprise network . In consideration of the quantitative comparison between the two urban agglomerations, the spillover effect in the Pearl River Delta has a relatively weaker influence on the industrial structure than that of the Yangtze River Delta.
5. Conclusions
Big data provides us with vast amounts of information and affords innovative solutions to a large number of topics in social science research. These datasets describe intricate city network systems from brand new viewpoints, with cities being modeled as nodes and their connections as linkages. With the keywords on pollution issues, we get the social media data from the Weibo API with a crawler and use it to represent residents’ social attitudes towards environmental protection. Based on this social media data and the geo-information of enterprises, we mainly focus on the spillover effect of environmental regulation on the industrial structure and whether the Weibo network and the enterprise network act as spillover channels. The use of big data to construct networks highlights the limitations of previous studies, which mostly relied on traditional data and rarely account for the influence of social media, but also suggest that, despite these limitations, their conclusions about the spillover effects are not entirely off the mark.
GIS methods are employed to visualize the network linkages between cities. The network graphs show that the “core-periphery” structure occurs in two urban agglomerations intuitively. By using PACE to express the stringency of environmental regulation, our empirical results show that environmental regulation has a consistently significant positive effect on industrial structure in the two urban agglomerations. To identify the channels through which the spillover effect occurs in the urban agglomerations, we employ four weight matrices to illustrate the network linkages, and demonstrate that the spillover effects under different weight matrices vary in the significance and magnitude. Specifically, we find that the spillover effects (0.102 under the Weibo network and 0.094 under the enterprise network in the Yangtze River Delta; 0.071 under the Weibo network and 0.039 under the enterprise network in the Pearl River Delta) are significant in the two urban agglomerations. From the perspective of quantitative comparison, the network spillover effects have a stronger influence in the Yangtze River Delta than that of the Pearl River Delta.
Two types of future studies are possible: the theoretical mechanism that social media influences spillover effects; and the additive effects of different networks that emphasize the importance of network diversity in an economy. Only with such evidence can we have a more comprehensive understanding of how social networks influence spillover effects in urban agglomerations. In the meantime, the results presented here provide some enlightenment that social media designed to make people communicate with each other will, conveniently, have an impact on regional economic activities. Most particularly, it appears that an increase in social media linkage may lead to an increase in the spillover effect. According to the outcome of this study, the importance of environmental regulation on regional industrial structure is confirmed, and the spillover effects support the idea that the effects of environmental regulation are not confined to its location. Our results provide evidence that positive spillover effects occur among network-connected cities, which supports the notion of coordinated environmental regulation policies in the urban agglomerations. For policy-makers, local governments should improve the connections of two networks and share the positive effects of environmental regulation, which will lead to a win-win situation considering that China’s urban agglomerations have a demand for change in the industrial structure.
Acknowledgments
This work was supported by National Social Science Foundation of China under Grant No. 11&ZD159; by National Natural Science Foundation of China under Grants No. 11&ZD15941430637, 41329001; and by the National Science Foundation of the USA under Grant No. 1416509.
Author Contributions
Zhaohui Chong and Chenglin Qin co-designed and wrote the paper, and Xinyue Ye provided data and modified the draft. All authors read and approved the final manuscript.
Conflicts of Interest
The authors declare no conflict of interest.
Appendix A
Figure A1.
Scatterplot diagram of PACE and industrial structure (the Yangtze River Delta).

Figure A2.
Scatterplot diagram of PACE and industrial structure (the Pearl River Delta).

Figure A3.
Spatial distribution of average PACE (2010–2014) in the Yangtze River Delta.

Figure A4.
Spatial distribution of average PACE (2010–2014) in the Pearl River Delta.
References
- Burton, D.M.; Gomez, I.A.; Love, H.A. Environmental regulation cost and industry structure changes. Land Econ. 2011, 3, 545–557. [Google Scholar] [CrossRef]
- Chong, Z.; Qin, C.; Ye, X. Environmental regulation, economic network and sustainable growth of urban agglomerations in China. Sustainability 2016, 8, 467. [Google Scholar] [CrossRef]
- Levinson, A. Environmental regulations and manufacturers’ location choices: Evidence from the Census of Manufactures. J. Public Econ. 1996, 1, 5–29. [Google Scholar] [CrossRef]
- Li, X.; Ikeda, S. An economic–environmental input–output model and its application to regional economic–environmental impact analysis. Environ. Plan. B 2001, 28, 581–594. [Google Scholar] [CrossRef]
- Wu, Z.; Tang, J.; Wang, D. Low carbon urban transitioning in Shenzhen: A multi-level environmental governance perspective. Sustainability 2016, 8, 720. [Google Scholar] [CrossRef]
- Bushnell, J.B.; Mansur, E.T. Vertical targeting and leakage in carbon policy. Am. Econ. Rev. 2011, 3, 263–267. [Google Scholar] [CrossRef]
- He, C.; Huang, Z.; Ye, X. Spatial heterogeneity of economic development and industrial pollution in urban China. Stoch. Environ. Res. Risk A 2014, 28, 767–781. [Google Scholar] [CrossRef]
- Ryan, S.P. The costs of environmental regulation in a concentrated industry. Econometrica 2012, 3, 1019–1061. [Google Scholar]
- Zhu, J.; Ruth, M. Relocation or reallocation: Impacts of differentiated energy saving regulation on manufacturing industries in china. Ecol. Econ. 2015, 110, 119–133. [Google Scholar] [CrossRef]
- Batten, D.F. Network cities: Creative urban agglomerations for the 21st century. Urban Stud. 1995, 32, 313–327. [Google Scholar] [CrossRef]
- De Goei, B.; Burger, M.J.; van Oort, F.G.; Kitson, M. Functional polycentrism and urban network development in the Greater South East, United Kingdom: Evidence from commuting patterns, 1981–2001. Reg. Stud. 2010, 44, 1149–1170. [Google Scholar] [CrossRef]
- Eagle, N.; Macy, M.; Claxton, R. Network diversity and economic development. Science 2010, 328, 1029–1031. [Google Scholar] [CrossRef] [PubMed]
- Batty, M.; Cheshire, J. Cities as flows. Environ. Plan. B 2011, 38, 195–196. [Google Scholar] [CrossRef]
- Cole, M.A.; Elliott, R.J.; Shimamoto, K. Why the grass is not always greener: The competing effects of environmental regulations and factor intensities on US specialization. Ecol. Econ. 2005, 1, 95–109. [Google Scholar] [CrossRef]
- Huggins, R.; Thompson, P. A Network-based view of regional growth. J. Econ. Geogr. 2014, 14, 511–545. [Google Scholar] [CrossRef]
- Kay, S.; Zhao, B.; Sui, D. Can social media clear the air? A case study of the air pollution problem in Chinese cities. Prof. Geogr. 2015, 67, 351–363. [Google Scholar] [CrossRef]
- Li, Q.; Wei, W.; Xiong, N.; Feng, D.; Ye, X.; Jiang, Y. Social media research, human behavior, and sustainable society. Sustainability 2017, 9, 242. [Google Scholar] [CrossRef]
- Goodchild, M.F. GIS in the Era of Big Data. 2016. Available online: https://cybergeo.revues.org/27647 (accessed on 20 April 2017).
- Ye, X.; Huang, Q.; Li, W. Integrating big social data, computing, and modeling for spatial social science. Cartogr. Geogr. Inf. Sci. 2016. [Google Scholar] [CrossRef]
- Watkins, B.A. Experimenting with dialogue on twitter: An examination of the influence of the dialogic principles on engagement, interaction, and attitude. Public Relat. Rev. 2016, 43, 163–171. [Google Scholar] [CrossRef]
- Batty, M. Smart cities, big data. Environ. Plan. B 2012, 39, 191. [Google Scholar] [CrossRef]
- Gao, S.; Liu, Y.; Wang, Y.; Ma, X. Discovering spatial interaction communities from mobile phone data. T GIS 2013, 17, 463–481. [Google Scholar] [CrossRef]
- Batty, M. Big data, smart cities and city planning. Dialog. Hum. Geogr. 2013, 3, 274–279. [Google Scholar] [CrossRef]
- Ruths, D.; Pfeffer, J. Social media for large studies of behavior. Science 2014, 346, 1063–1064. [Google Scholar] [CrossRef] [PubMed]
- Shaw, S.; Tsou, M.; Ye, X. Human dynamics in the mobile and Big Data Era. Int. J. Geogr. Inf. Sci. 2016, 30, 1687–1693. [Google Scholar] [CrossRef]
- Pijanowski, B.C.; Tayyebi, A.; Doucette, J.; Pekin, B.K.; Braun, D.; Plourde, J. A big data urban growth simulation at a national scale: Configuring the GIS and neural network based land transformation model to run in a high performance computing (HPC) environment. Environ. Model. Softw. 2014, 51, 250–268. [Google Scholar] [CrossRef]
- Artige, L. Will big data deliver its promised productivity growth? In Proceedings of the IAES Conference, Lisbon, Portugal, 16–19 March 2016. [Google Scholar]
- Jarmin, R.S.; O’Hara, A.B. Big data and the transformation of public policy analysis. J. Policy Anal. Manag. 2016, 35, 715–721. [Google Scholar] [CrossRef]
- Wang, Z.; Ye, X.; Tsou, M. Spatial, temporal, and content analysis of Twitter for wildfire hazards. Nat. Hazards 2016, 83, 523–540. [Google Scholar] [CrossRef]
- Dong, L.; Chen, S.; Cheng, Y.; Wu, Z.; Li, C.; Wu, H. Measuring Economic Activities of China with Mobile Big Data. arXiv, 2016; arXiv:1607.04451. [Google Scholar]
- Wei, Y.; Ye, X. Urbanization, Urban Land Expansion and Environmental Change in China. Stoch. Environ. Res. Risk A 2014, 28, 757–765. [Google Scholar] [CrossRef]
- Cheng, J.; Dai, S.; Ye, X. Spatiotemporal heterogeneity of industrial pollution in China. China Econ. Rev. 2016, 40, 179–191. [Google Scholar] [CrossRef]
- Wang, Z.; Ye, X. Reexamining Environmental Kuznets Curve for China’s City-level Carbon Dioxide (CO2) Emissions. Spat. Stat. 2016, in press. [Google Scholar] [CrossRef]
- Li, S.; Ye, X.; Lee, J.; Gong, J.; Qin, C. Spatiotemporal analysis of housing prices in China: A big data perspective. Appl. Spat. Anal. Policy 2017, 10, 421–433. [Google Scholar] [CrossRef]
- Wu, C.; Ye, X.; Ren, F.; Wan, Y.; Ning, P.; Du, Q. Spatial and social media data analytics of housing prices in Shenzhen, China. PLoS ONE 2016, 11, e0164553. [Google Scholar] [CrossRef] [PubMed]
- Ye, X.; He, C. The new data landscape for regional and urban analysis. GeoJournal 2016, 81, 1–5. [Google Scholar] [CrossRef]
- Liu, Y.; Sui, Z.; Kang, C.; Gao, Y. Uncovering patterns of inter-urban trip and spatial interaction from social media check-in data. PLoS ONE 2014, 9, e86026. [Google Scholar] [CrossRef] [PubMed]
- Taylor, P.J. Leading world cities: Empirical evaluations of urban nodes in multiple networks. Urban Stud. 2005, 42, 1593–1608. [Google Scholar] [CrossRef]
- Jin, K. Industrial structure and capital flows. Am. Econ. Rev. 2012, 102, 2111–2146. [Google Scholar] [CrossRef]
- Rubashkina, Y.; Galeotti, M.; Verdolini, E. Environmental regulation and competitiveness: Empirical evidence on the Porter Hypothesis from European manufacturing sectors. Energy Policy 2015, 83, 288–300. [Google Scholar] [CrossRef]
- Organisation for Economic Co-operation and Development (OECD). Pollution Control and Abatement Expenditure in OECD Countries. In Environment Monograph; OECD/GD(96)50; OECD: Paris, France, 1996. [Google Scholar]
- Kheder, S.B.; Zugravu, N. Environmental regulation and French firms location abroad: An economic geography model in an international comparative study. Ecol. Econ. 2012, 77, 48–61. [Google Scholar] [CrossRef]
- Panzar, J.C. Technological determinants of firm and industry structure. Handb. Ind. Organ. 1989, 1, 3–59. [Google Scholar]
- Utterback, J.M.; Suarez, F.F. Innovation, competition, and industry structure. Res. Policy 1993, 22, 1–21. [Google Scholar] [CrossRef]
- Dunne, T.; Klimek, S.D.; Roberts, M.J.; Xu, Y. Entry, exit, and the determinants of market structure. Rand J. Econ. 2013, 44, 462–487. [Google Scholar] [CrossRef]
- Topa, G.; Zenou, Y. Neighborhood versus network effects. In Handbook of Regional and Urban Economics; Duranton, G., Henderson, V., Strange, W., Eds.; Elsevier Publisher: Amsterdam, The Netherlands, 2015; Volume 5. [Google Scholar]
- Halleck, V.S.; Elhorst, J.P. The SLX model. J. Reg. Sci. 2015, 3, 339–363. [Google Scholar] [CrossRef]
- Corrado, L.; Fingleton, B. Where is the economics in spatial econometrics? J. Reg. Sci. 2012, 52, 210–239. [Google Scholar] [CrossRef]
- National Bureau of Statistics of China (NBSC). China City Statistical Yearbook; China Statistics Press: Beijing, China, 2011–2015. (In Chinese) [Google Scholar]
- Anselin, L. Spatial Econometrics: Methods and Models; Springer Science & Business Media: Heidelberg, Germany, 2013; pp. 97–99. [Google Scholar]
- Fagerberg, J.; Verspagen, B.; Caniels, M. Technology, growth and unemployment across European regions. Reg. Stud. 1997, 31, 457–466. [Google Scholar] [CrossRef]
- Wang, Y.; Ning, L.; Li, J.; Prevezer, M. Foreign direct investment spillovers and the geography of innovation in Chinese regions: The role of regional industrial specialization and diversity. Reg. Stud. 2016, 50, 805–822. [Google Scholar] [CrossRef]
Figure 1.
Map of China.
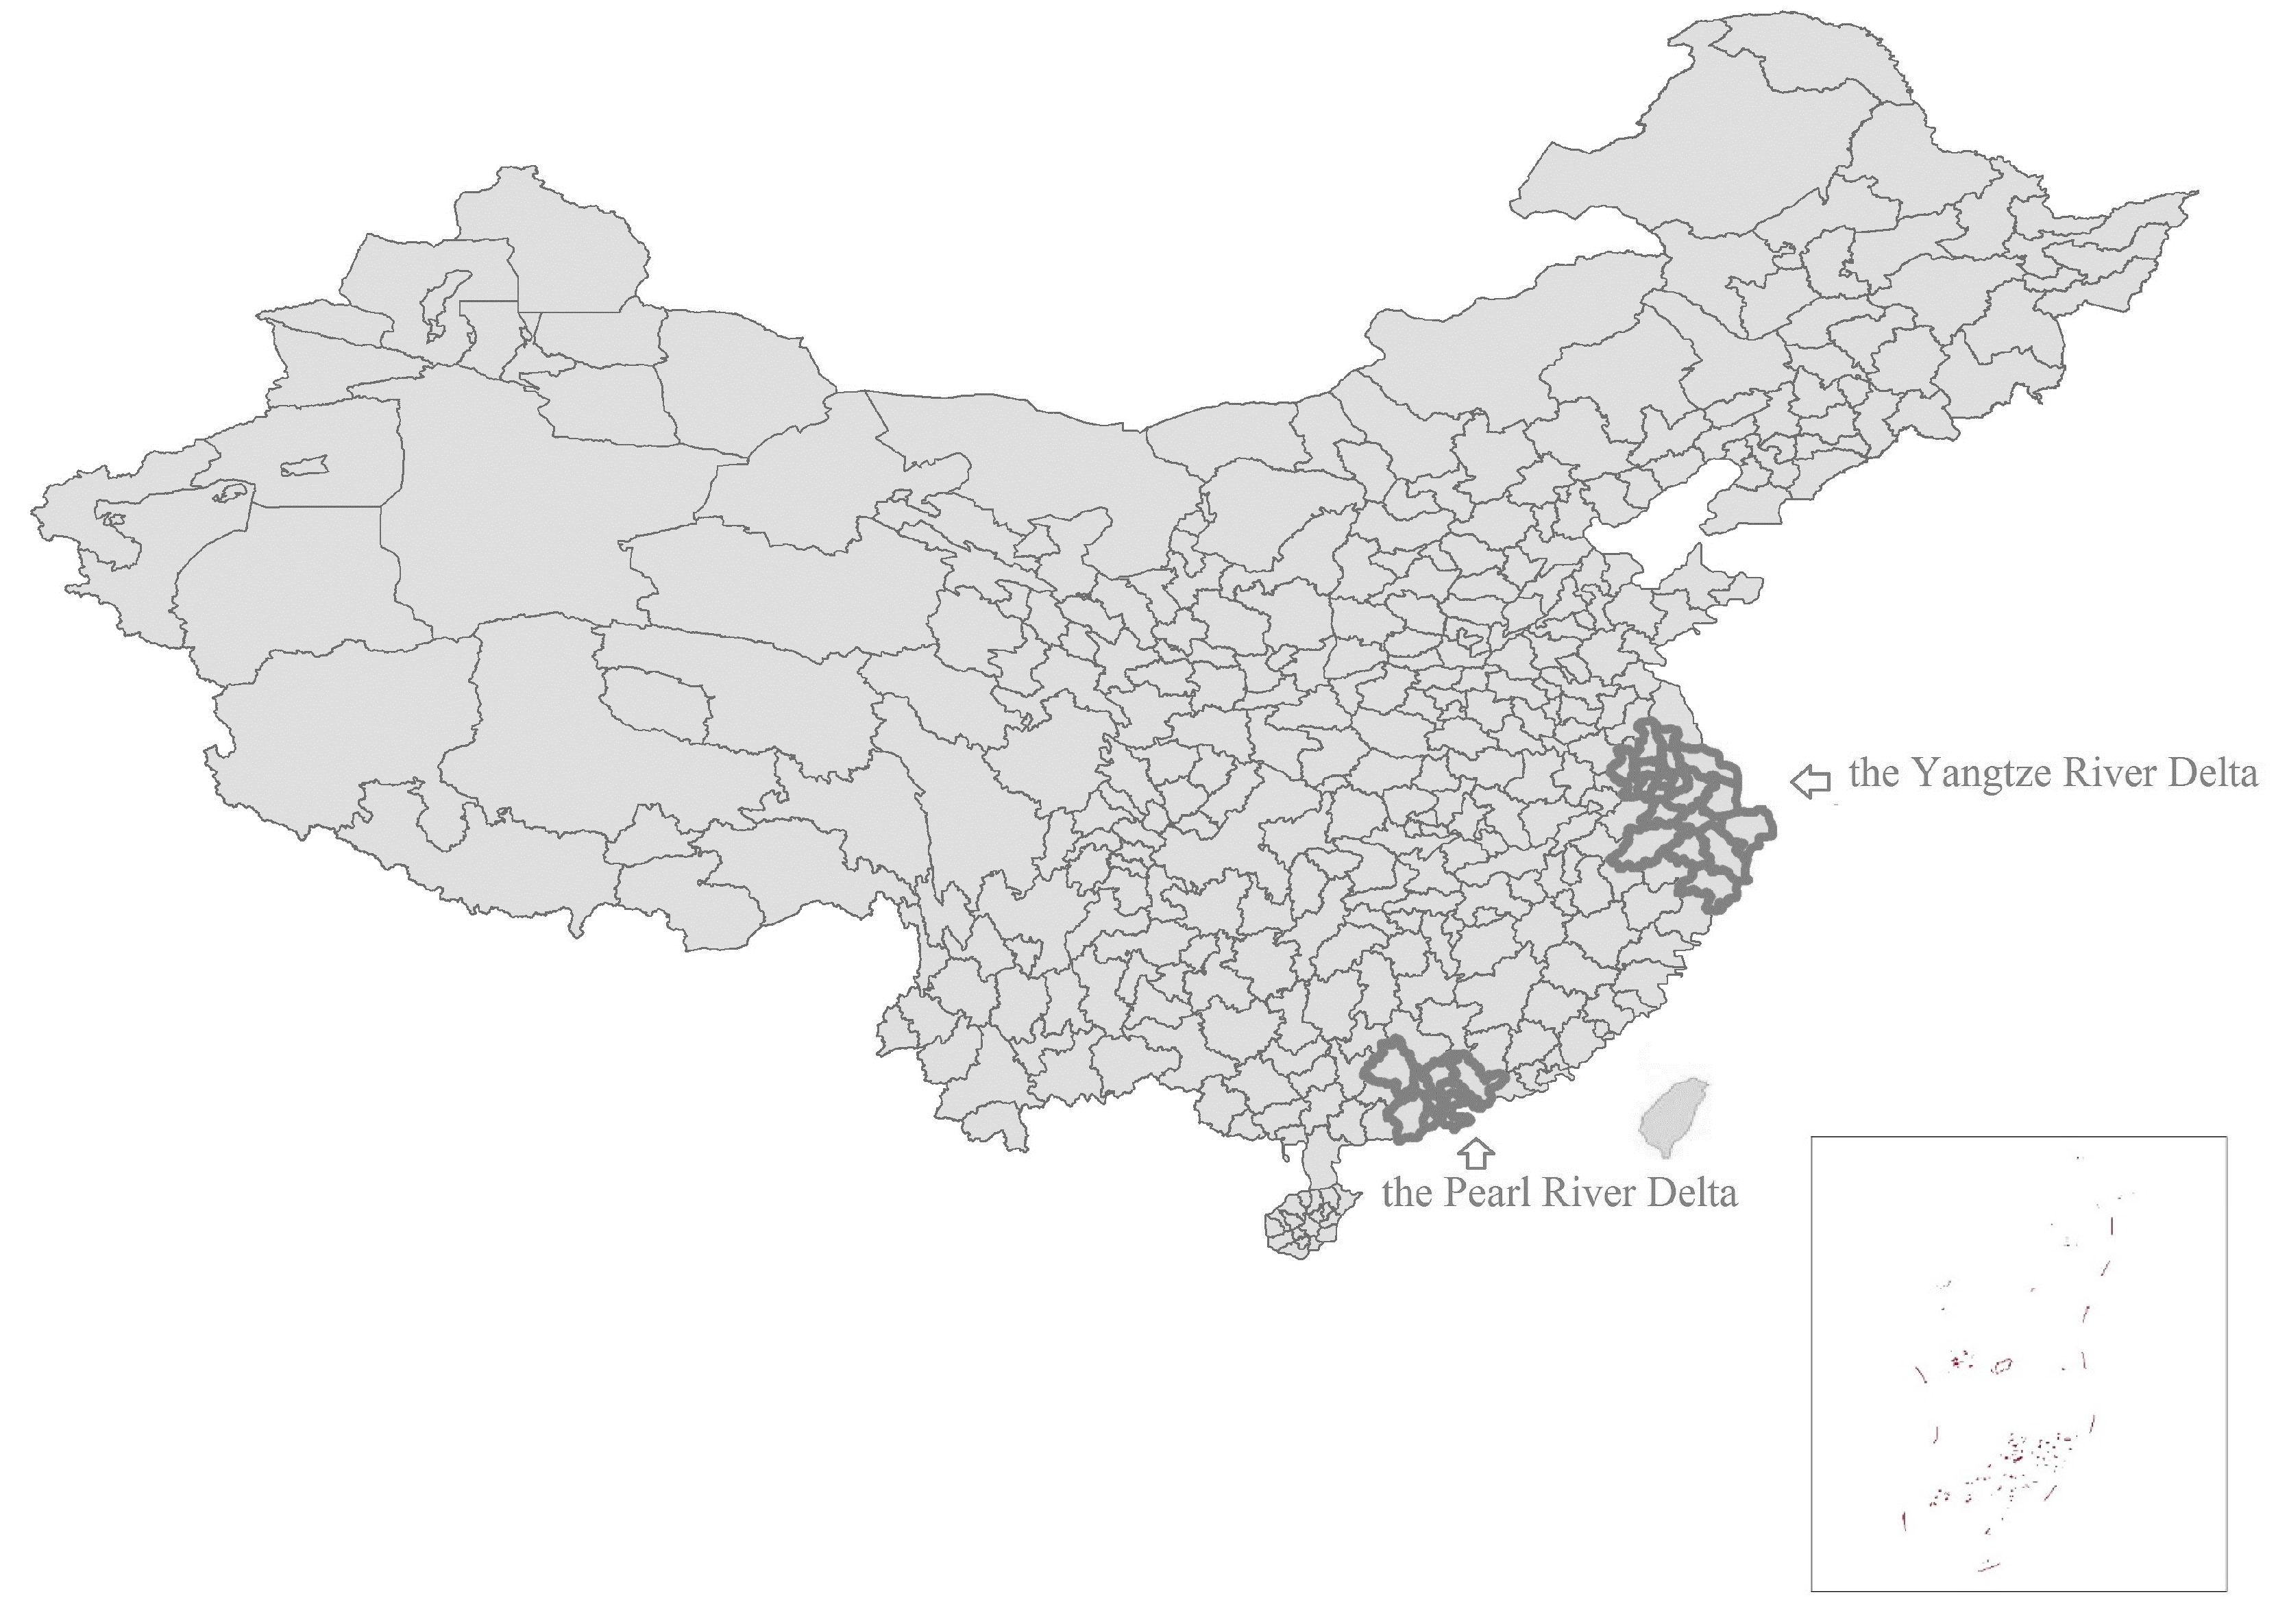
Figure 2.
Data collecting process.

Figure 3.
Weibo posts containing keywords: smog, water pollution, air pollution, and pollution emission.
Figure 3.
Weibo posts containing keywords: smog, water pollution, air pollution, and pollution emission.

Figure 4.
Weibo network in the Yangtze River Delta.

Figure 5.
Weibo network in the Pearl River Delta.

Figure 6.
Enterprise network in the Yangtze River Delta.
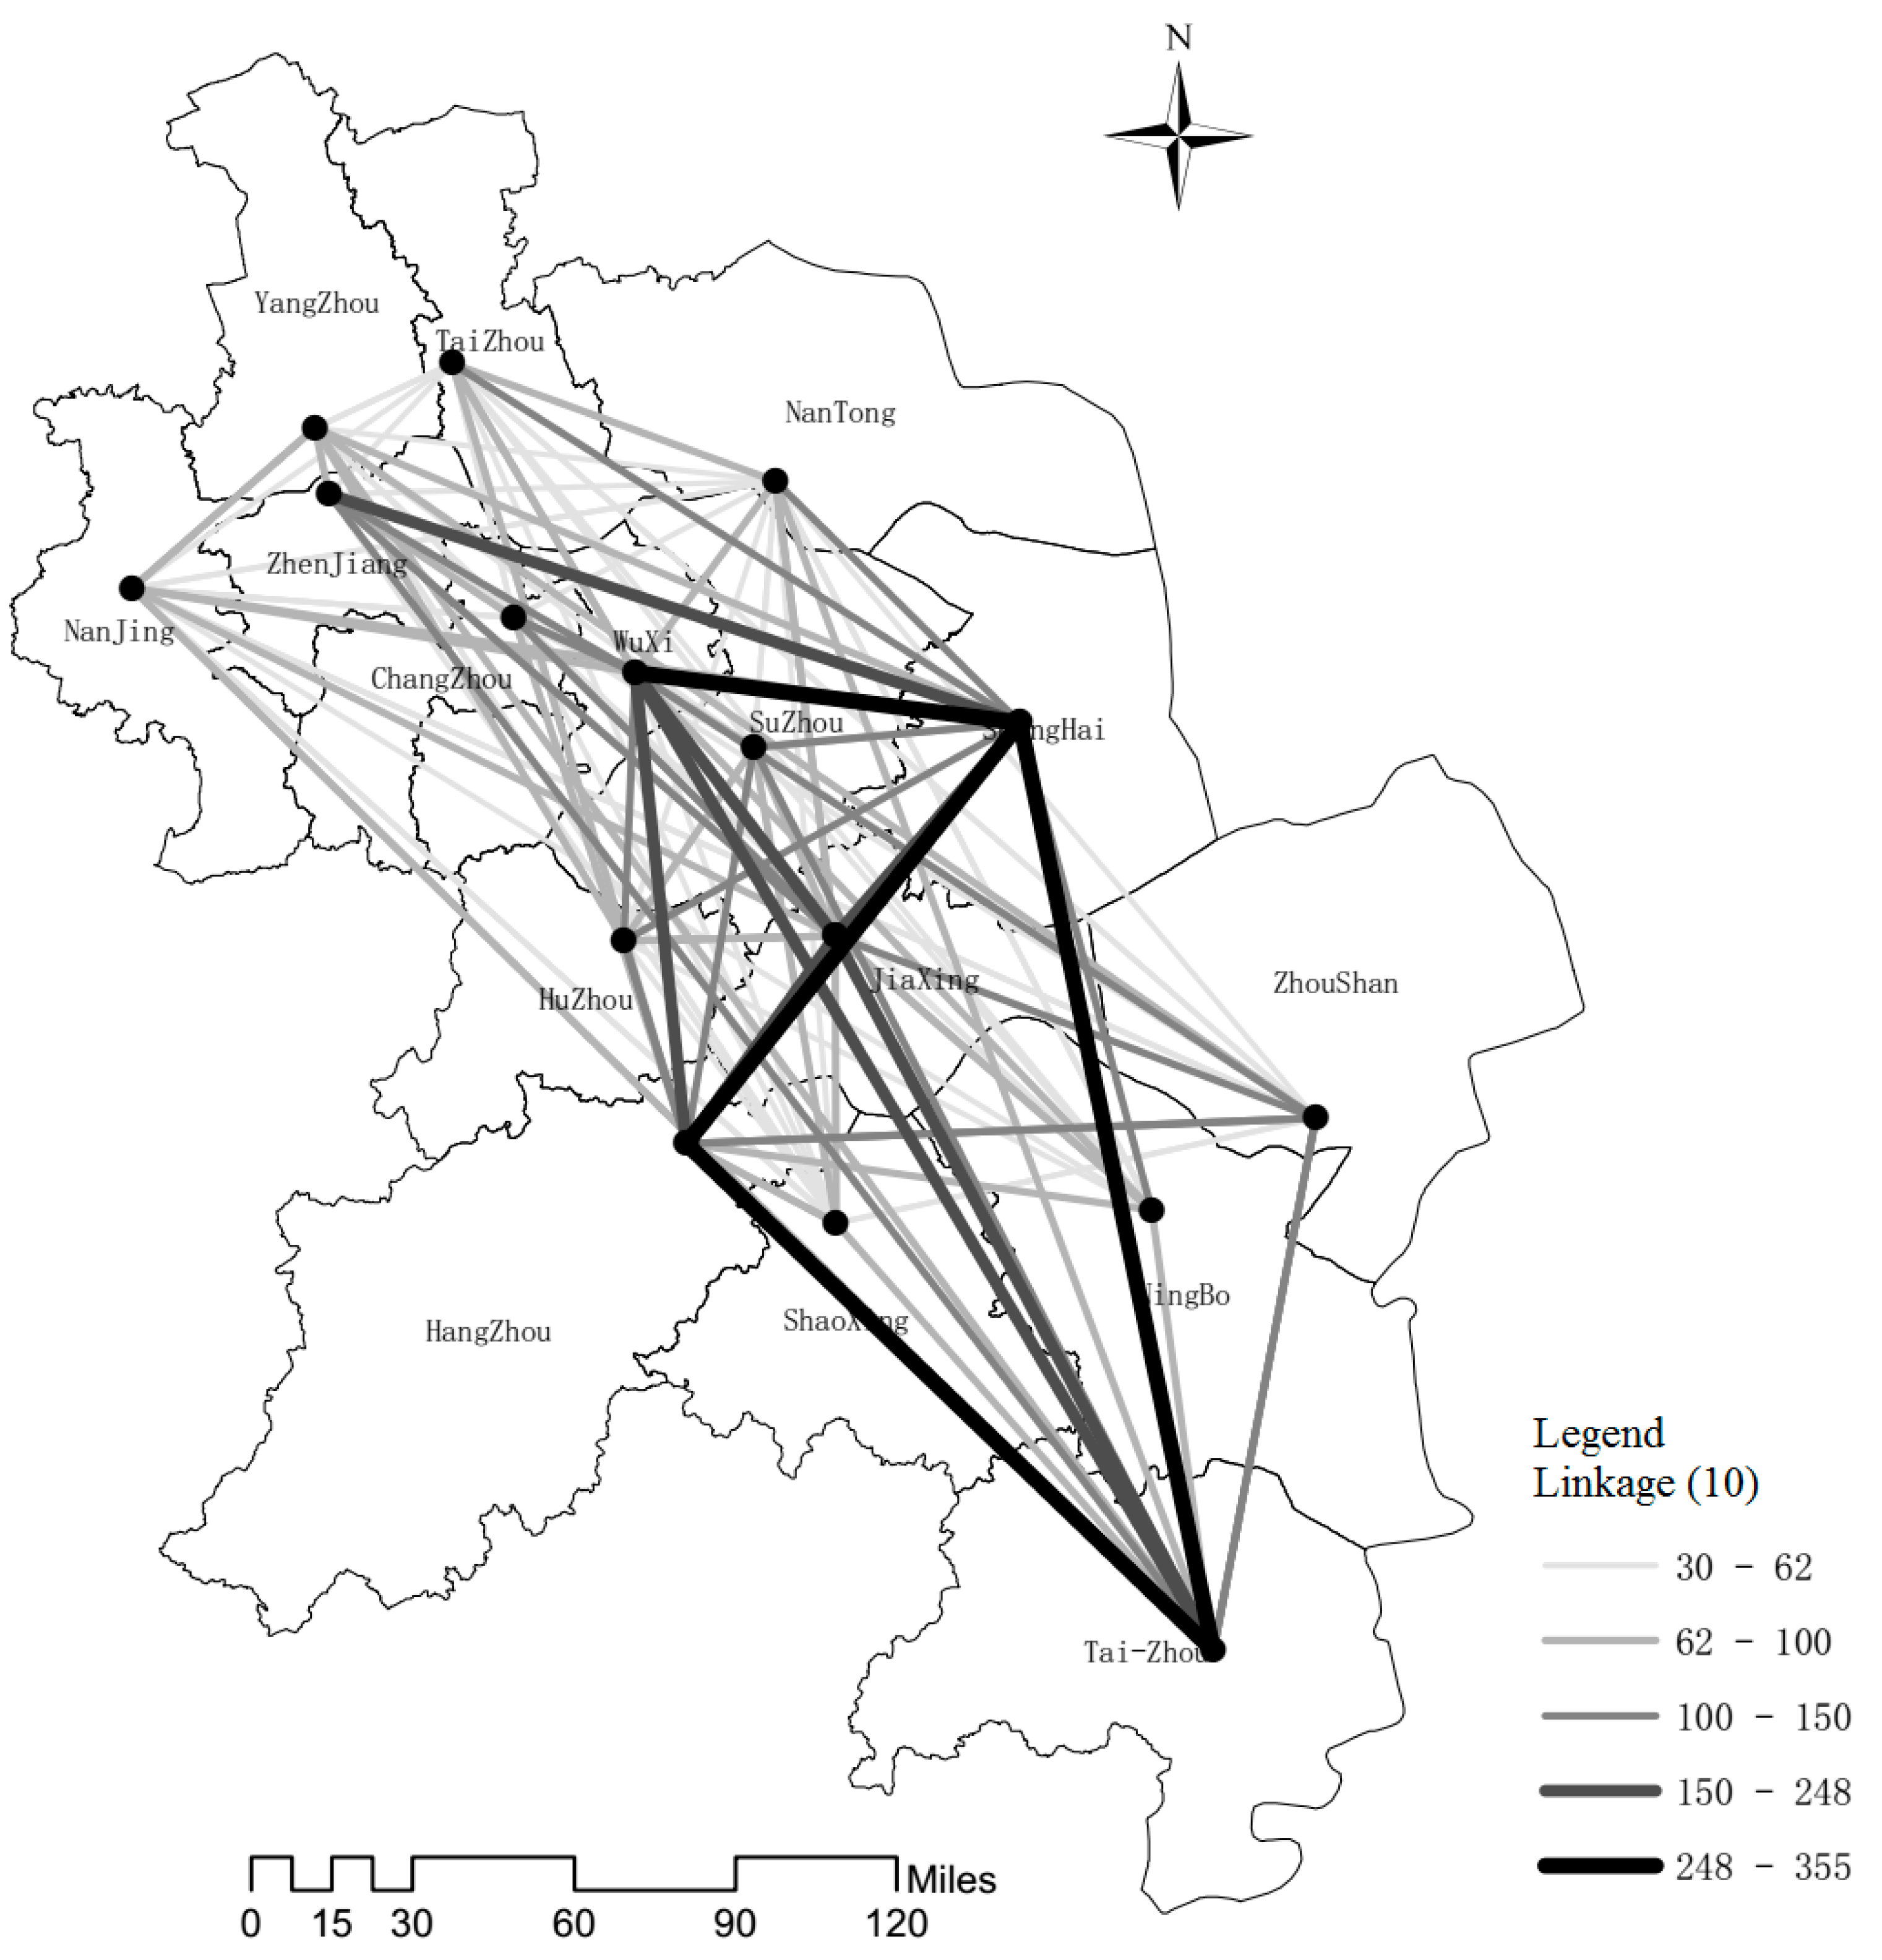
Figure 7.
Enterprise network in the Pearl River Delta.


Table 1.
Model estimate results (the Yangtze River Delta).
| Variables | (1) | (2) | (3) | (4) | (5) | (6) | (7) |
|---|---|---|---|---|---|---|---|
| Benchmark Model | |||||||
| Environmental regulation | 0.148 *** | 0.152 *** | 0.144 *** | 0.140 *** | 0.137 *** | −0.093 ** | −0.081 * |
| (3.63) | (3.77) | (3.62) | (2.99) | (3.55) | (−2.04) | (−1.81) | |
| Fixed asset investment per capita | 0.173 *** | 0.196 *** | 0.172 ** | 0.107 | 0.142 ** | 0.214 *** | 0.239 *** |
| (3.26) | (4.17) | (2.59) | (1.57) | (2.47) | (3.92) | (3.77) | |
| Wage | 0.129 *** | 0.074 *** | 0.081 * | 0.083 *** | 0.102 ** | −0.073 | −0.082 * |
| (3.99) | (2.88) | (1.72) | (2.87) | (2.52) | (−1.53) | (−1.73) | |
| R&D | 0.107 ** | 0.073 *** | 0.071 *** | 0.102 * | 0.094 | 0.067 | 0.062 |
| (2.55) | (3.02) | (3.52) | (1.82) | (1.35) | (1.32) | (1.05) | |
| GDP per capita | 0.112 *** | 0.124 * | 0.113 ** | 0.137 ** | 0.072 *** | −0.103 * | −0.139 ** |
| (2.94) | (1.75) | (2.61) | (2.56) | (3.29) | (−1.83) | (−2.01) | |
| 3.836 *** | 3.927 *** | 4.011 *** | 3.829 *** | 4.269 *** | 3.723 *** | 3.847 *** | |
| (6.77) | (5.92) | (6.28) | (7.33) | (5.36) | (6.24) | (7.03) | |
| 0.102 *** | 0.094 *** | −0.045 | −0.139 *** | −0.059 * | −0.084 ** | ||
| (4.66) | (3.27) | (−1.07) | (−4.27) | (−1.79) | (−2.13) | ||
| R2 | 0.6728 | 0.7632 | 0.7724 | 0.7263 | 0.6289 | 0.7213 | 0.7139 |
| N. of obs. | 80 | 80 | 80 | 80 | 80 | 80 | 80 |
Notes: A full set of city-specific and period-specific effects are included for columns 1–7, t-statistics are reported in parentheses. *** p < 0.01; ** p < 0.05; * p < 0.1.
Table 2.
Model estimate results (the Pearl River Delta).
| Variables | (1) | (2) | (3) | (4) | (5) | (6) | (7) |
|---|---|---|---|---|---|---|---|
| Benchmark Model | |||||||
| Environmental regulation | 0.201 *** | 0.196 *** | 0.182 *** | 0.177 * | 0.193 *** | −0.237 ** | −0.209 * |
| (3.72) | (3.44) | (3.77) | (1.98) | (3.05) | (−2.00) | (−1.84) | |
| Fixed asset investment per capita | 0.134 *** | 0.098 * | 0.084 ** | 0.093 | 0.127 ** | 0.328 *** | 0.309 *** |
| (3.41) | (1.80) | (2.59) | (1.54) | (2.16) | (3.47) | (4.02) | |
| Wage | 0.093 | 0.104 * | 0.106 * | 0.093 ** | 0.131 *** | −0.093 *** | −0.085 ** |
| (1.40) | (1.72) | (1.73) | (2.02) | (2.85) | (−2.74) | (−2.08) | |
| R&D | 0.103 *** | 0.091 *** | 0.113 ** | 0.125 ** | 0.152 * | 0.038 | 0.086 |
| (4.01) | (3.09) | (2.38) | (2.53) | (1.79) | (1.32) | (1.29) | |
| GDP per capita | 0.092 *** | 0.083 ** | 0.042 | 0.093 *** | 0.065 ** | −0.104 | −0.093 * |
| (3.17) | (2.32) | (0.93) | (2.73) | (2.03) | (−1.56) | (−1.82) | |
| 3.727 *** | 3.022 *** | 3.283 *** | 2.938 *** | 2.848 *** | 4.932 *** | 4.730 *** | |
| (4.28) | (3.92) | (3.28) | (3.55) | (3.92) | (3.85) | (3.73) | |
| 0.071 *** | 0.039 ** | −0.083 * | −0.002 *** | −0.085 ** | −0.056 * | ||
| (3.93) | (2.04) | (−1.89) | −(2.82) | (−2.15) | (−1.89) | ||
| R2 | 0.5392 | 0.6163 | 0.6748 | 0.6923 | 0.6225 | 0.7038 | 0.7216 |
| N. of obs. | 45 | 45 | 45 | 45 | 45 | 45 | 45 |
Notes: A full set of city-specific and period-specific effects are included for columns 1–7, t-statistics are reported in parentheses. *** p < 0.01; ** p < 0.05; * p < 0.1.
© 2017 by the authors. Licensee MDPI, Basel, Switzerland. This article is an open access article distributed under the terms and conditions of the Creative Commons Attribution (CC BY) license (http://creativecommons.org/licenses/by/4.0/).
Share and Cite
MDPI and ACS Style
Chong, Z.; Qin, C.; Ye, X. Environmental Regulation and Industrial Structure Change in China: Integrating Spatial and Social Network Analysis. Sustainability 2017, 9, 1465. https://doi.org/10.3390/su9081465
AMA Style
Chong Z, Qin C, Ye X. Environmental Regulation and Industrial Structure Change in China: Integrating Spatial and Social Network Analysis. Sustainability. 2017; 9(8):1465. https://doi.org/10.3390/su9081465
Chicago/Turabian StyleChong, Zhaohui, Chenglin Qin, and Xinyue Ye. 2017. "Environmental Regulation and Industrial Structure Change in China: Integrating Spatial and Social Network Analysis" Sustainability 9, no. 8: 1465. https://doi.org/10.3390/su9081465
Note that from the first issue of 2016, this journal uses article numbers instead of page numbers. See further details here.