Article

Smart Thermostats: An Experimental Facility to Test Their Capabilities and Savings Potential

School of Industrial Engineering, University of Cantabria, Av. Los Castros s/n, 39005 Cantabria, Spain
*
Author to whom correspondence should be addressed.
Sustainability 2017, 9(8), 1462; https://doi.org/10.3390/su9081462
Submission received: 15 July 2017 / Revised: 9 August 2017 / Accepted: 15 August 2017 / Published: 17 August 2017
(This article belongs to the Special Issue The Advent of Smart Homes)

Abstract

:
The European Commission has explained how heating and cooling in buildings and industry account for half of the energy consumption of the EU. Several studies explain how to achieve an energy saving at home, and the use of smart thermostats will help to reduce energy consumption while increasing the efficiency of households. In this article, a comparative evaluation was carried out between four smart thermostats that are now on the market, whose characteristics vary in terms of price, precision of measurements and set temperature, algorithms, etc. A thermal test chamber was designed and constructed from a refrigerator, a thermal blanket, a Raspberry Pi and the necessary electronic components for its control and data collection. From the tests carried out in the thermal chamber, data on the operation of the four thermostats such as the maintenance and the anticipation of the setpoint temperature, were obtained. It was necessary to run the system enough times for each thermostat to memorize the housing characteristics, such as its inertia and its thermal insulation. This would also allow for the generation of a better algorithm to regulate the temperature, which would create a lower oscillation with respect to the setpoint temperature. The learning of the thermostats was not demonstrated and for the anticipation mode it was seen that the thermostats failed to improve or learn in this aspect, as they did not improve the start-up times of the heating system, with the consequent increase in energy consumption.

1. Introduction

The European Commission [1,2] has explained how heating and cooling in buildings and industry account for half of the energy consumption of the EU. Heating and hot water in households alone account for 79% of the total energy use (192.5 Mtoe: million tonnes of oil equivalent). Cooling represents a fairly small share of the total energy use. A total of 84% of heating and cooling is still generated from fossil fuels while only 16% is generated from renewable energy.
New opportunities for bigger and smarter control of the main building parameters, such as ventilation or temperature, are emerging which lead to more comfortable and efficient environments both in workplaces and homes [3].
Consumers may decide to install a smart thermostat in their homes to achieve savings in the electric or gas bill [4], but the choice is not always the right one. As will be shown in this article, not all smart thermostats have a similar operation. In addition, in different smart thermostats, neither the same comfort or energy savings are obtained.
In this article, a comparative evaluation was carried out between four smart thermostats that are now on the market, whose characteristics vary in terms of price, precision of measurements and set temperature, algorithms, etc. These smart thermostats, according to their websites, produce savings of between 30 and 37% in the energy bill.
In order to carry out the evaluation of smart thermostats, it was deemed appropriate to start from scratch, since neither a study dealing with the behaviour or learning of smart thermostats, nor a study evaluating the accuracy of the thermostats had previously been done. It was necessary to carry out the tests in the most real conditions possible in order to assess their functionalities, their learning curves, and even their efficiency. To generate these “real” conditions, a thermal test chamber was designed and constructed from a refrigerator, a thermal blanket, a Raspberry Pi [5] and the necessary electronic components for its control and data collection. The chamber was managed by the thermostats, so a system similar to a home was generated, in which its characteristics could be varied, such as its thermal inertia.
The thermal chamber system was designed in a modular way, so that the elements of both cooling and heating could be changed, and thus, making small changes in the programming of the electronic components would create a new thermal chamber with other basic characteristics, such as higher power or dimensions.
The setpoint temperatures for the tests were obtained from [6,7] and the recommendations of the manufacturers of the smart thermostats. The periods of the setpoint temperatures were established for a weekday operation, with some increase in the time of one of them to better observe the operation of the thermostat. Geolocation features were deactivated because their functionality is already known and it was not necessary for this evaluation.

2. State-Of-The-Art

A good review of the challenges and opportunities of the new smart home technologies is by G. Lobaccaro et al. [8], focusing on the wide and flexible ways of adding smart technologies to the daily routine of households.
One of the most critical points in maintaining comfort and increasing efficiency is the temperature control. Many efforts in research and industrial development move towards the design and manufacturing of cheap, friendly and easy-to-use smart thermostats. P. Rau et al. presented a study of the needs of these thermostats obtained from interviews and surveys of the consumers [9], noticing that there are still unsolved problems in the hardware and technology on this type of devices and advising the researchers and designers to focus on the user’s needs. Some other reviews and detailed studies of modern thermostats can be specified [10,11] which indicate that a lot of work still has to be done in order to clearly see the benefits of this smart management of temperature.
Several studies [6,12] carried out tests and simulations in which the setpoint temperatures were varied to explain how to achieve energy savings at home, even integrating algorithms that took into account the variation of the daily price of electricity. Therefore, the use of smart thermostats will help to reduce energy consumption while increasing the efficiency of households.
There are also several Smart Thermostat Pilot Programs [13,14,15,16,17,18,19] in which a thermostat was installed in a specific number of homes with a specific heating or cooling system and at the end of the study the savings achieved by the users were observed. On the one hand, neither the behaviour nor the learning ability of the thermostats can be obtained from these studies. On the other hand, it cannot be 100% assured that users have properly used the thermostats during the study, so the results, both savings and comfort, may not be completely correct.
There is a lack of laboratory-controlled tests, apart from those made by the manufacturers. Also, the general perception from the user’s answers in the surveys and interviews shows the difficulty of knowing the real savings coming from the use of smart thermostats [9,11]. These were the original motivations of this new research.
With this study, the authors try to clarify, to some extent, the capacities and limitations of several smart thermostats, which are now on the market, quantifying their accuracy and their learning capability in a controlled facility built for this purpose.

3. Materials and Method for the Experimental Setting

3.1. Thermostat Specifications

A smart thermostat is based on the same principle of operation as a conventional thermostat, but also has a series of sensors and functionalities that allow the thermostat to make decisions on its own to provide greater comfort at home and save on heating costs.
Table 1 shows the temperature specifications of the thermostats evaluated in this article. Some of the data is empty because manufacturers do not provide this information. The data are the temperature measurement ranges of each one of the thermostats, their accuracy, their resolution, their adjustment ranges, their geolocation availability, their ethernet or Wi-Fi connectivity and their price.
The geolocation function allows the smart thermostat to turn heating on/off depending on the distance of users to their home. Although it is a functionality to be taken into account, in this article this functionality was not used because it was desired that the thermostats worked according to a daily program and because not all the thermostats possessed it.

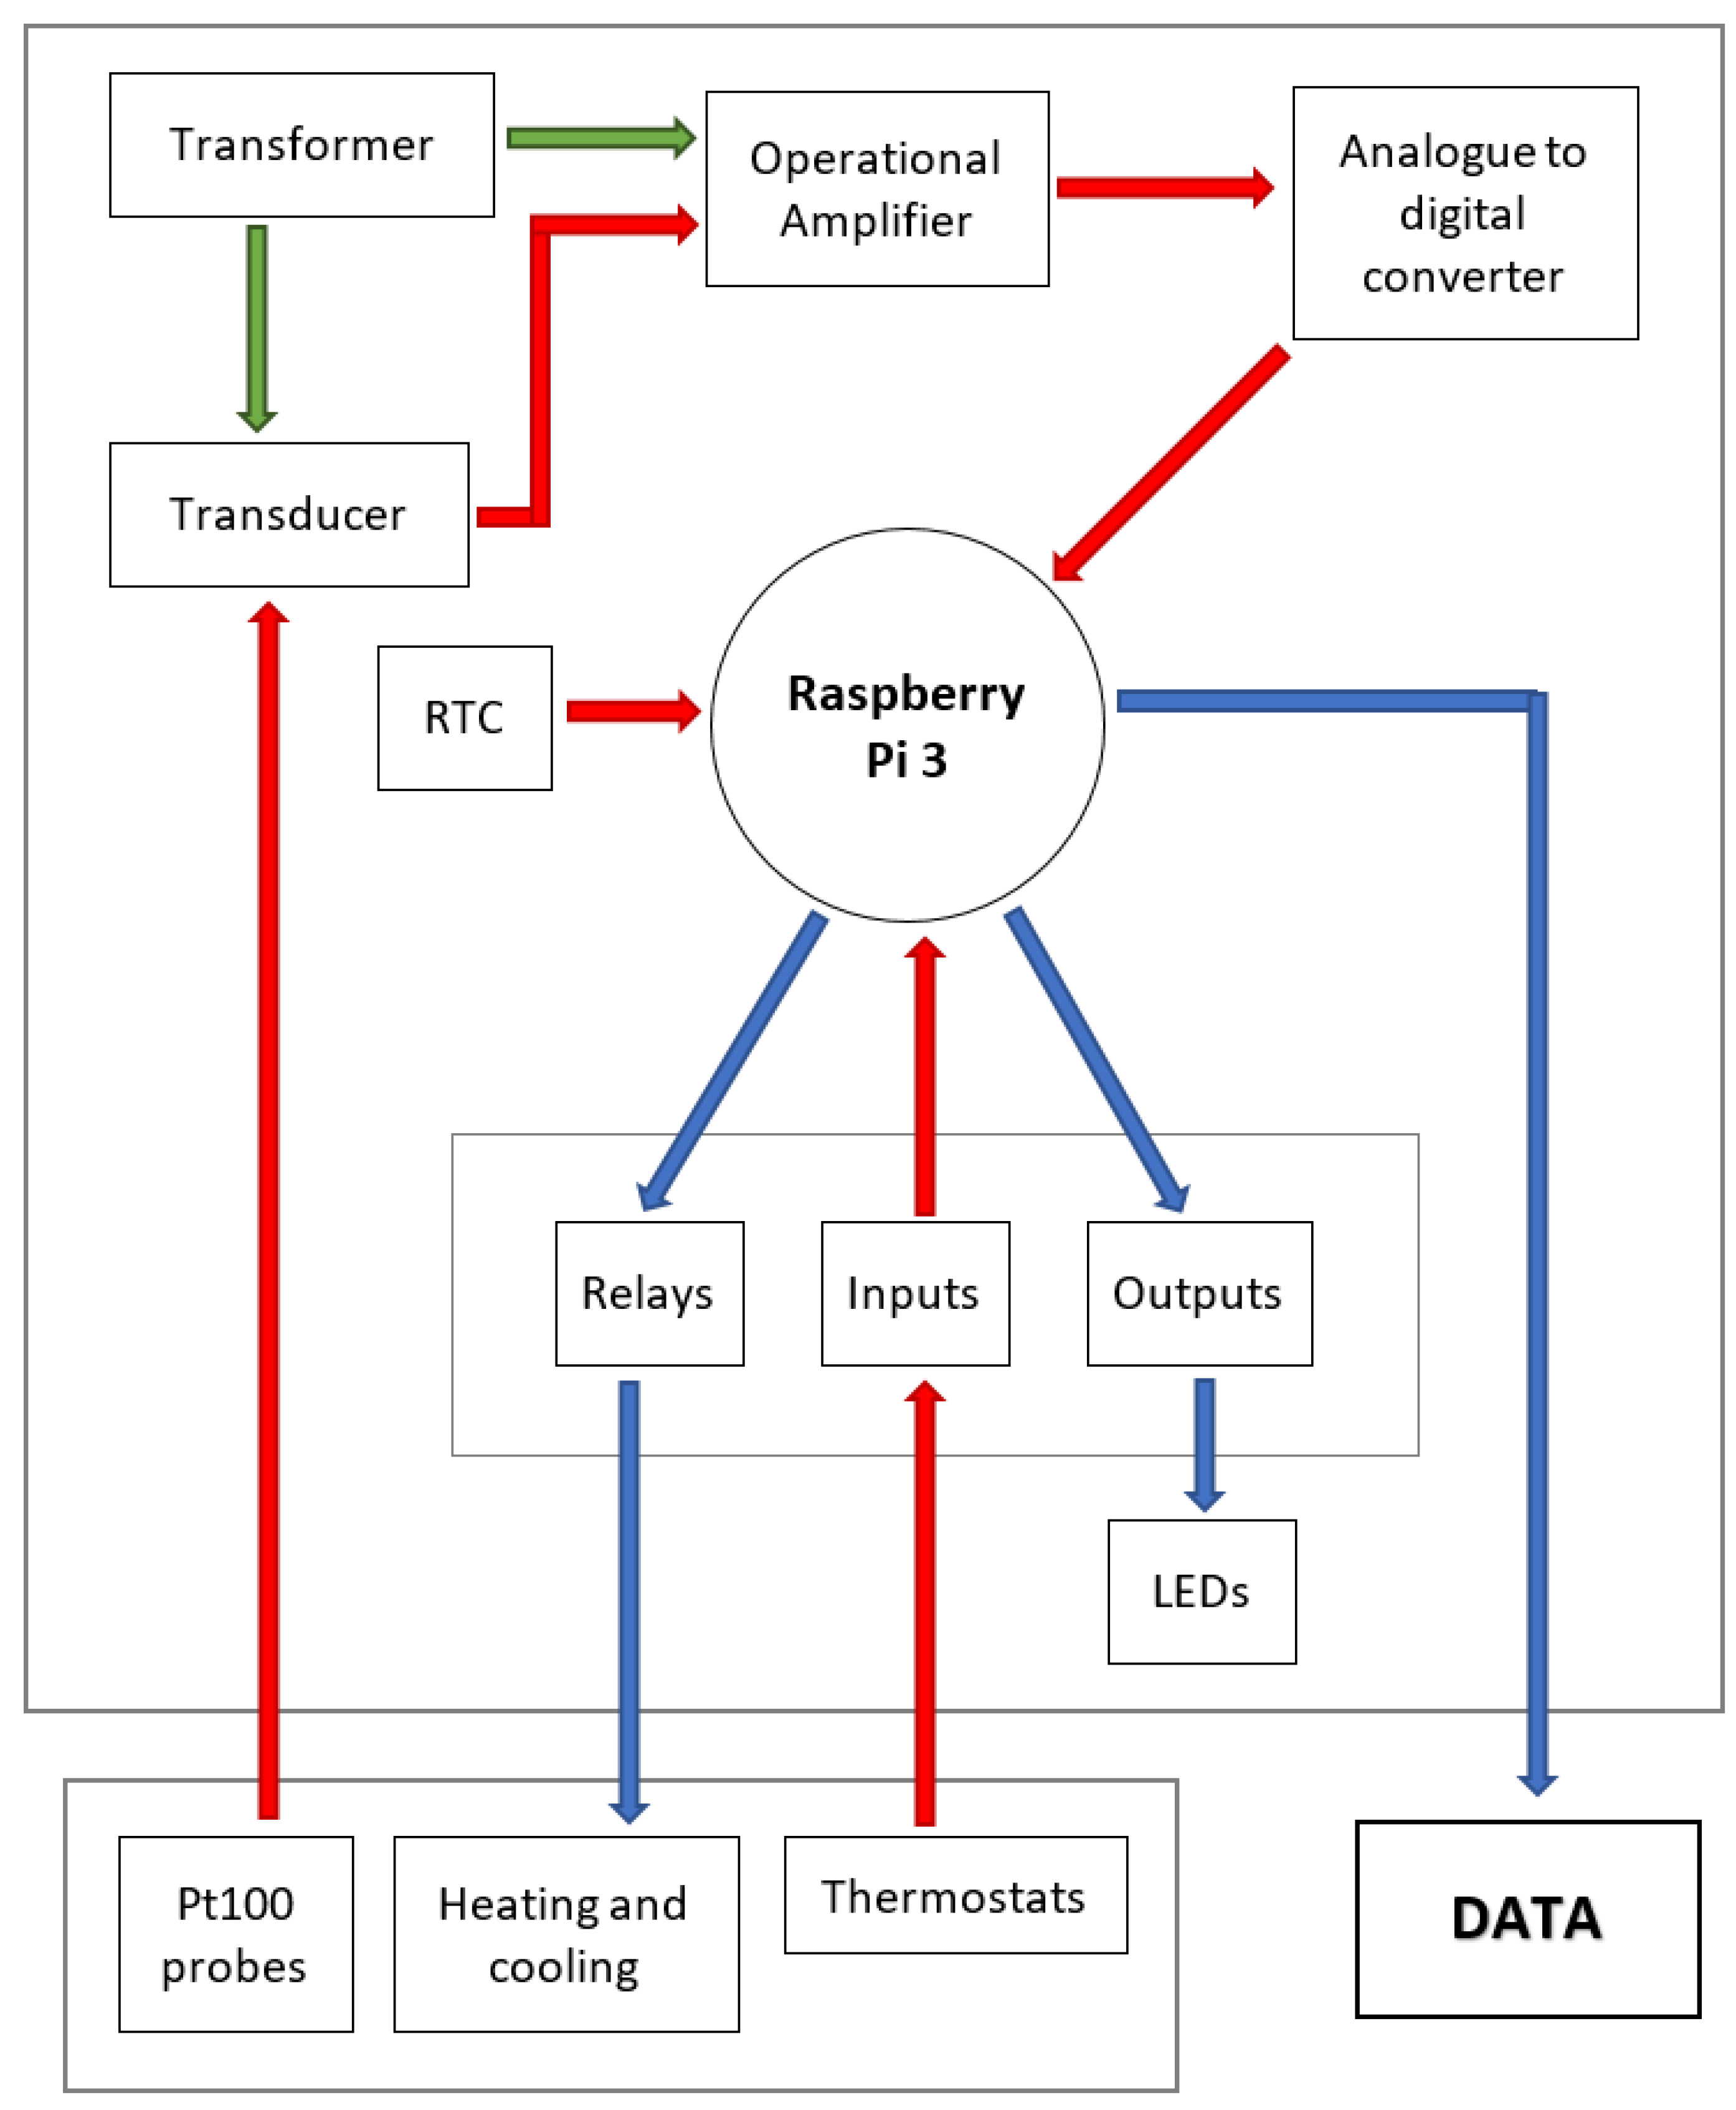
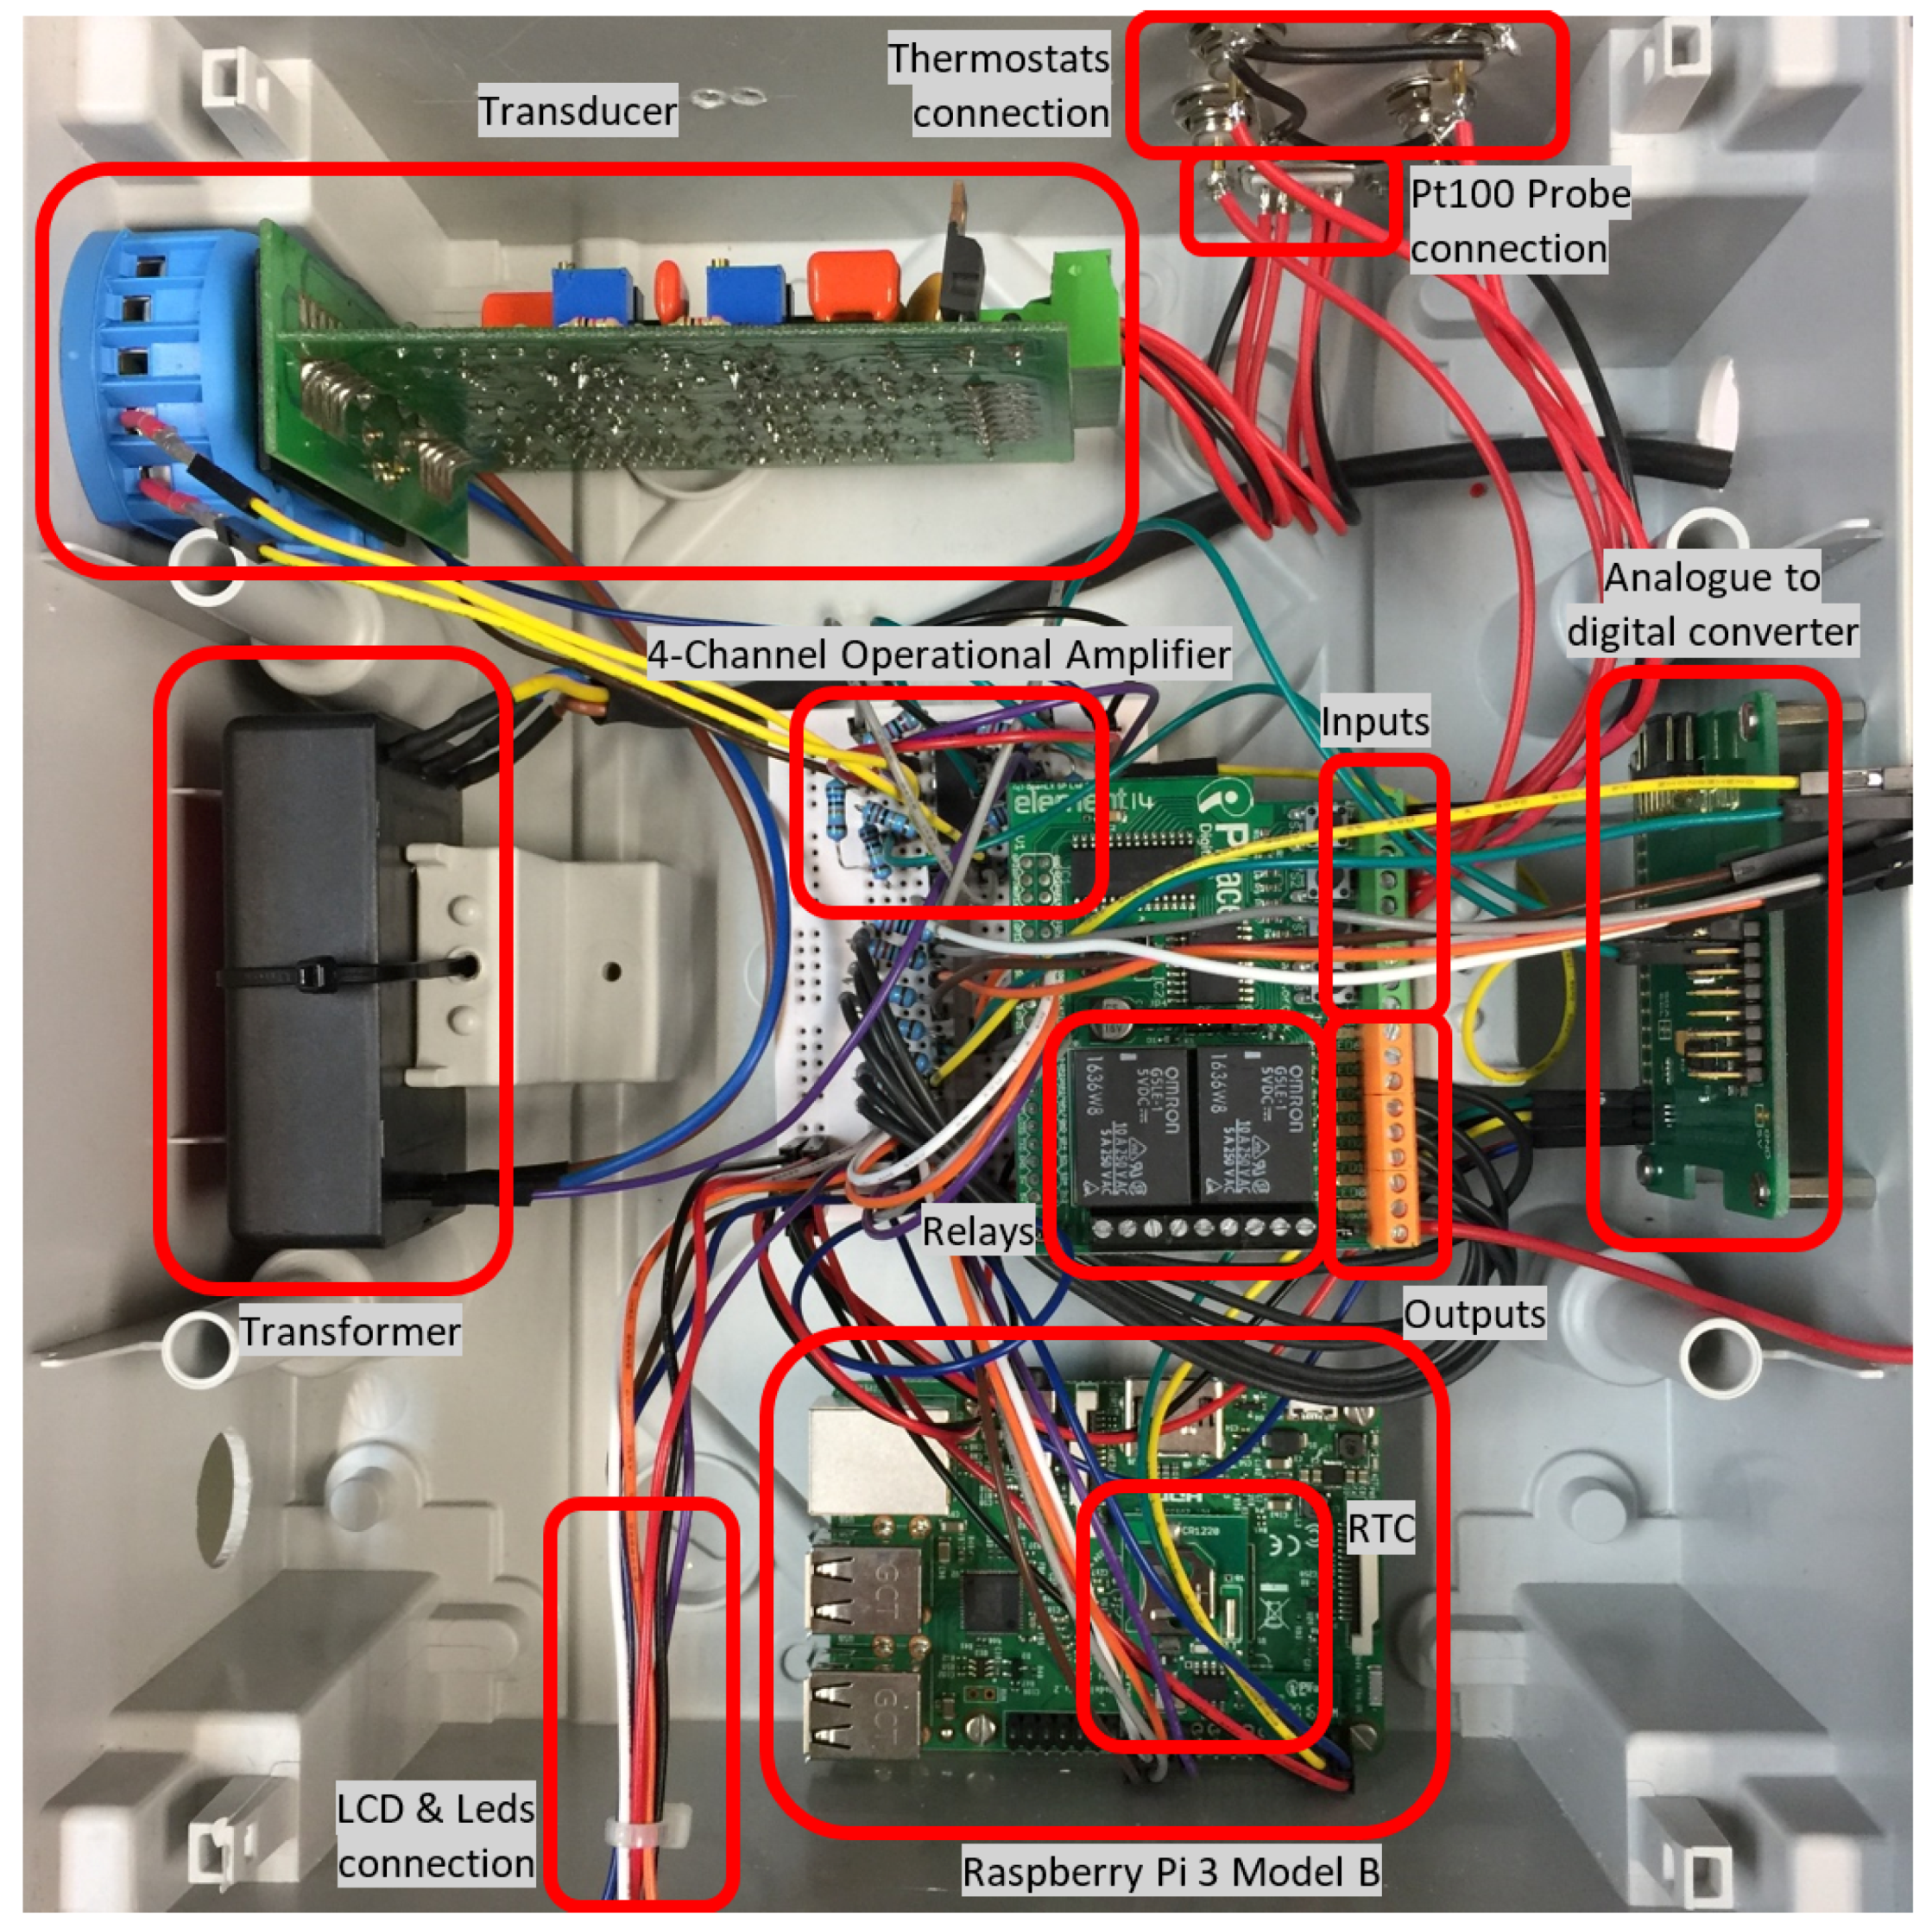
3.2. Design and Construction of the Thermal Test Chamber

When using a laboratory device to test the thermostats, even the most realistic environment as possible will lack of the thermal inertia of the real building, which is always different depending on the building and weather conditions. The only solution to get an idea of the real thermal inertia is to test the thermostats in-situ, but this was not the aim of this research. This paper is focused on performing a relative comparison between different thermostats working under the same controlled environment and obtaining conclusions about their different behavior. Absolute conclusions about their performance in real conditions is beyond the scope of this research.
The thermal test chamber designed is composed of the following elements:
  • 70 W refrigerator with thermoelectric cooling system (Peltier)
  • 15 W Thermal Blanket
  • Raspberry Pi 3 Model B
  • PiFace™ Digital 2: Relays, Inputs and Outputs
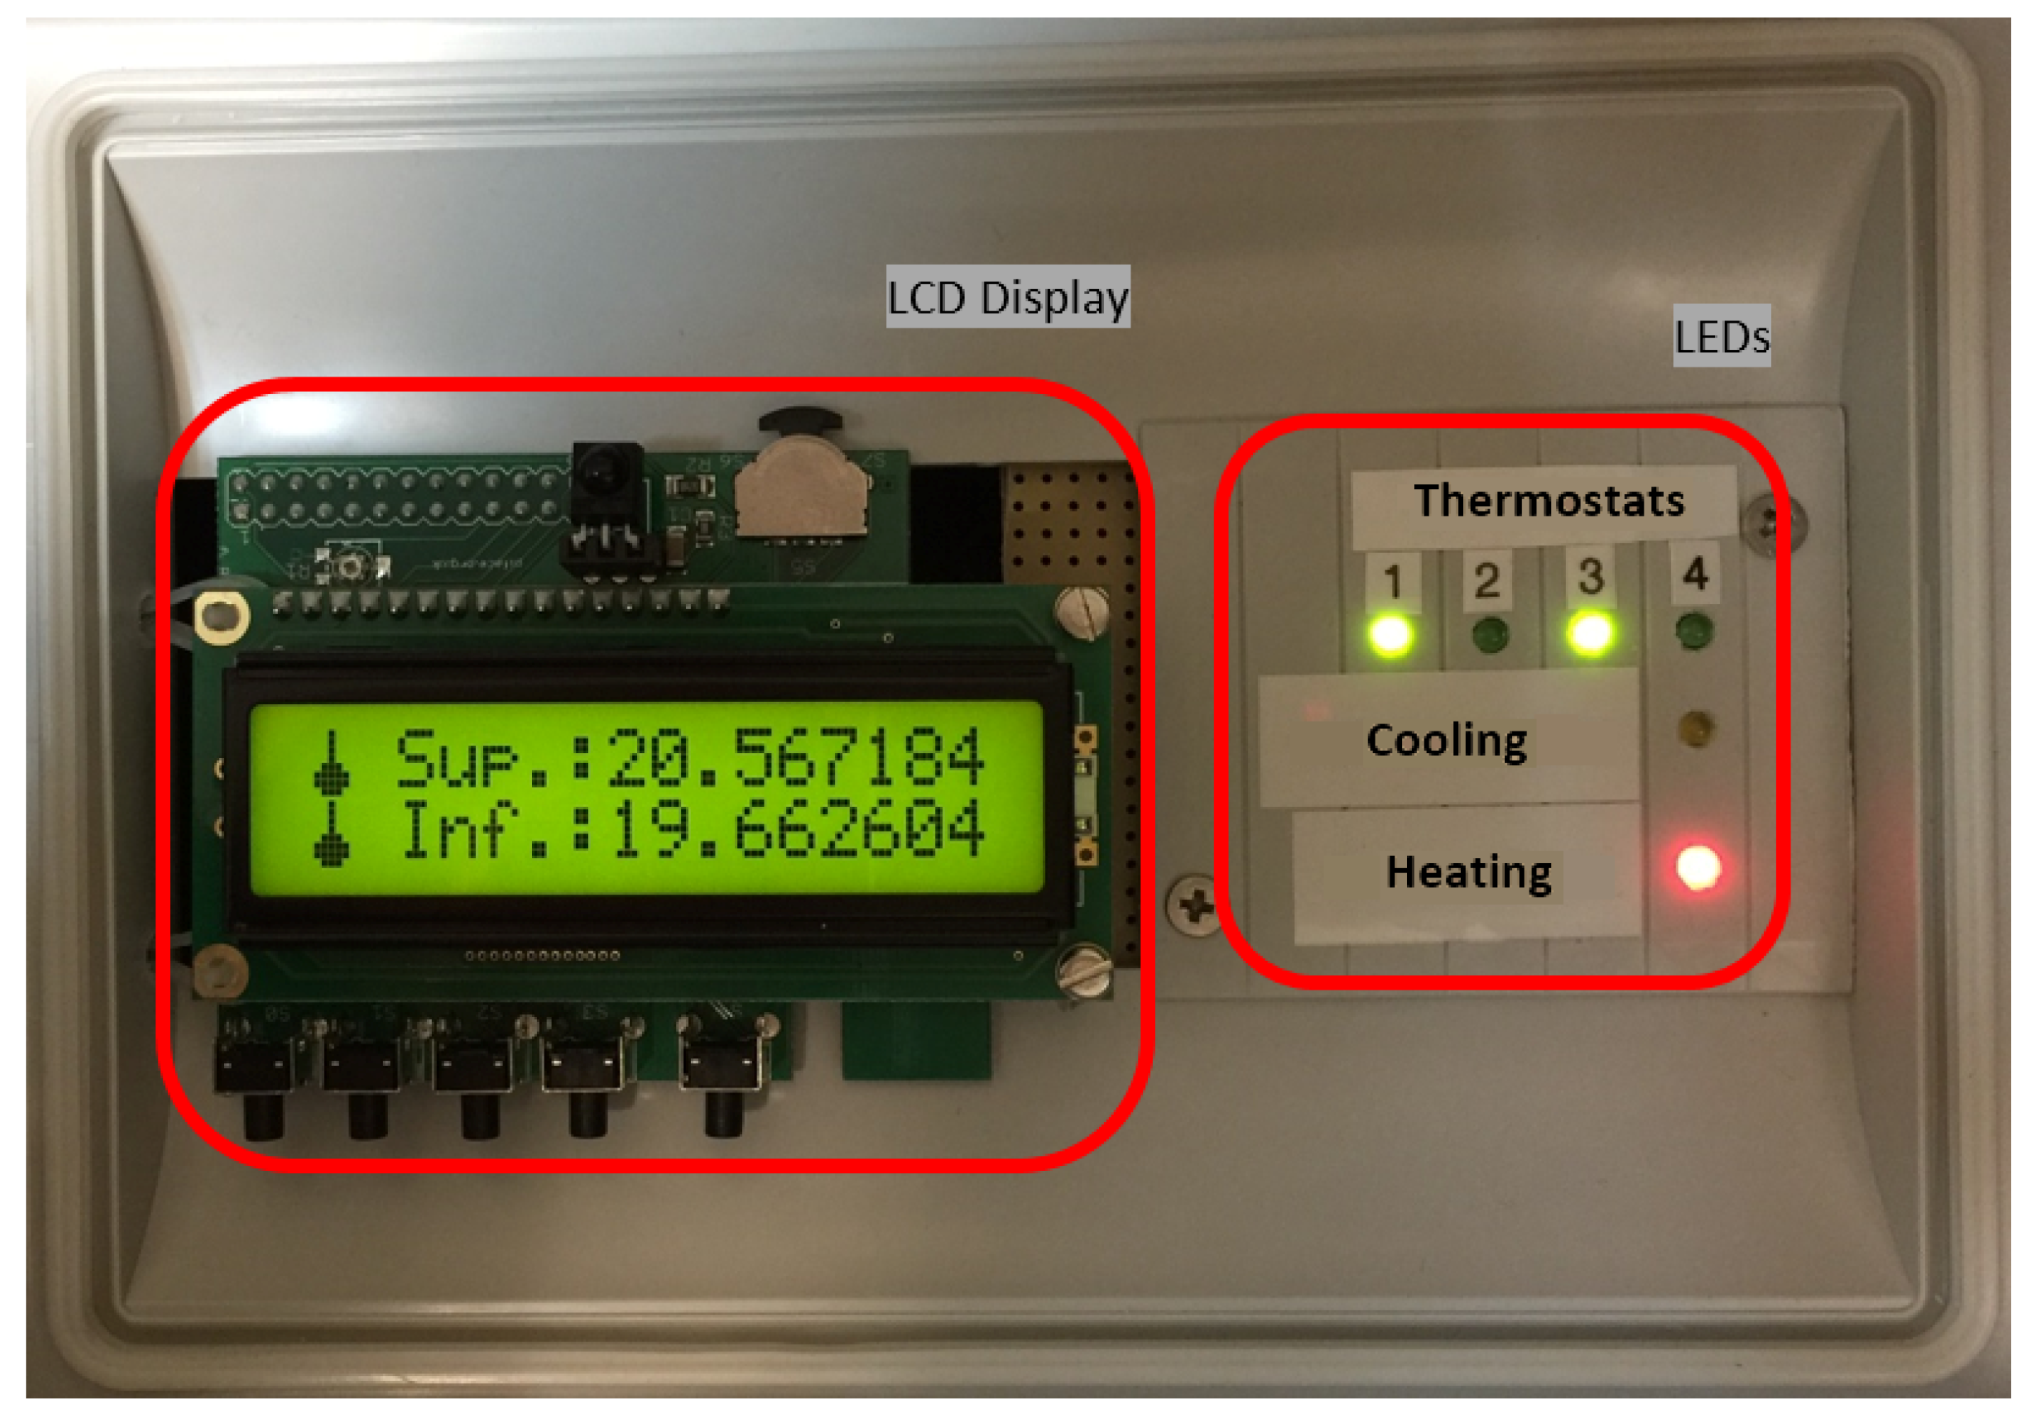
  • PiFace™ Control and Display 2: LCD Display
  • PiFace™ Shim RTC: Real Time Clock
  • ADC Pi Plus: Analogue to Digital Converter
  • Pt100 Probes Transducer and 2 x Pt100 Probe
  • TL084CN (4–Channel Operational Amplifier)
  • Resistors: 2 × 160 k Ω , 2 × 82 k Ω , 4 × 120 k Ω and 6 × 220 Ω
  • LEDs: 4 × Green, 1 × Yellow and 1 × Red
  • Transformer:
    Input: 100–240 VAC, 47–63 Hz, 0.375 A max.
    Output: ±12 VDC, ±650 mA
  • Connectors: 4 × BNC (F/M) and 1 × RS232 (F/M)
  • Fuse box IP65: 250 × 232 × 154 mm (W × L × D)
Once the components were connected, the operation of the thermal chamber managed by the Raspberry Pi 3 was divided into three sections. The first one corresponds to the measurements of the inside temperature by the Pt100 probes. The second one is responsible for turning on/off the heating and cooling systems of the chamber, and finally, the third section is responsible for obtaining the working data of the previous sections. The sections listed above are shown in the operating diagram of Figure 1.
At the top of the operating diagram (as seen in Figure 1), the temperature measurement inside the chamber is controlled. The transformer supplies the transducer (12 VDC) and the operational amplifier (±12 VDC). The transducer is responsible for measuring the resistance of the probes depending on the temperature and transforms it to voltage values between 0 and 10 V at their outputs. The transducer was calibrated using a Pt100 platinum resistance simulator with resistance values of 108.57, 107.79 and 107.02 Ω which belongs to and was calibrated by the Spanish Metrology Center (CEM). As the analog to digital converter can only read voltages between 0 and 5 V, it has been necessary to incorporate the 4-channel operational amplifier, in order to divide the output voltage of the transducer by half. The digital values obtained by the converter are sent to the Raspberry Pi.
At the bottom of the operating diagram (as seen in Figure 1), the elements that manage the heating and cooling system of the chamber are located. The thermostat evaluated in each case is the one that measures the temperature inside the chamber and, depending on what it measures and the established setpoint temperature, it closes or opens its internal relay causing a variation in the reading of one of the inputs (0–1). This variation is registered in the Raspberry Pi which, depending on its value, turns on the cooling or the heating system through the system relays.
At the same time as the previous action, the Raspberry Pi is responsible for turning on/off the LED indicators of the window, as well as showing the temperature values inside the chamber through the LCD.
The other thermostats can also work and be compared, with the difference that they do not tell the Raspberry Pi what to do with the thermal systems. At the same time, the Raspberry Pi records and stores the variations of its relays in a file, generates the data and manages the LED indicators corresponding to each thermostat.
The final location of the components of the thermal test chamber inside a fuse box is shown in Figure 2. It was done in this way so that the electronic part of the chamber was more protected and at the same time accessible.
Figure 3 shows the elements designed to observe in real time some of the data that the system can obtain. They were located in the window of the fuse box cover so that its visualization was more accessible, simple and fast, without needing to access the data files.
The software developed for the operation of the thermal chamber consisted of several scripts programmed in Python, one of the programming languages used by Raspberry Pi.
The main script was responsible for managing the thermal chamber as a function of the main thermostat and obtaining the temperature inside. This script was composed of a while loop, in which each loop read the voltage data pertaining to the Pt100 probes and through the programmed calibration curves obtained the corrected temperature values. As for the management of the camera, the loop took into account the states of the thermostats (open/closed), and depending on the state of the main thermostat, turned on/off the cooling or the heating system. The LEDs located in the window of the fuse box cover also showed these states through on/off. Finally, this script created a file in which it wrote in each loop all the data and the states of the thermostats and the systems of refrigeration and heating that were obtained.
The second most important script was responsible for displaying the temperature data through the display in the window of the fuse box cover. This script was composed of a while loop, which read the file generated in the script described above, and extracted the temperature data from the Pt100 probes and displayed them. The rest of the scripts fulfilled secondary functions and were called by the main scripts.
This software was specifically programmed for this test facility using open sources which makes it easy to re-adapt to new research interests or thermal environments. Moreover, all the hardware was built in a modular way with cheap electronic components.

3.3. Output Data

Table 2 corresponds to an example of the data obtained from the system. The most important data are time, calibrated temperatures of the Pt100 probes, state of the thermostats (t1, t2, t3 and t4) (open-0 or closed-1) and the mode of operation of the chamber (cooling or heating).
Temperature data of the thermostats was obtained in two different ways depending on the characteristics of each thermostat. One of the thermostats allows downloading the data through its website but the other thermostats do not have this possibility, so the data collection must be manual; observing the temperature variation in the thermostat display, on their websites or in their Smartphone applications.
From the data obtained by the thermal chamber, as seen in the Table 2, and the temperature data of the thermostats, the graphs of temperature and state of the thermostats versus time were generated (as seen in Figure 4). The terms “Upper Probe” and “Lower Probe” refer to the two Pt100 probes installed inside the thermal test chamber. These probes are located above and below the thermostats.

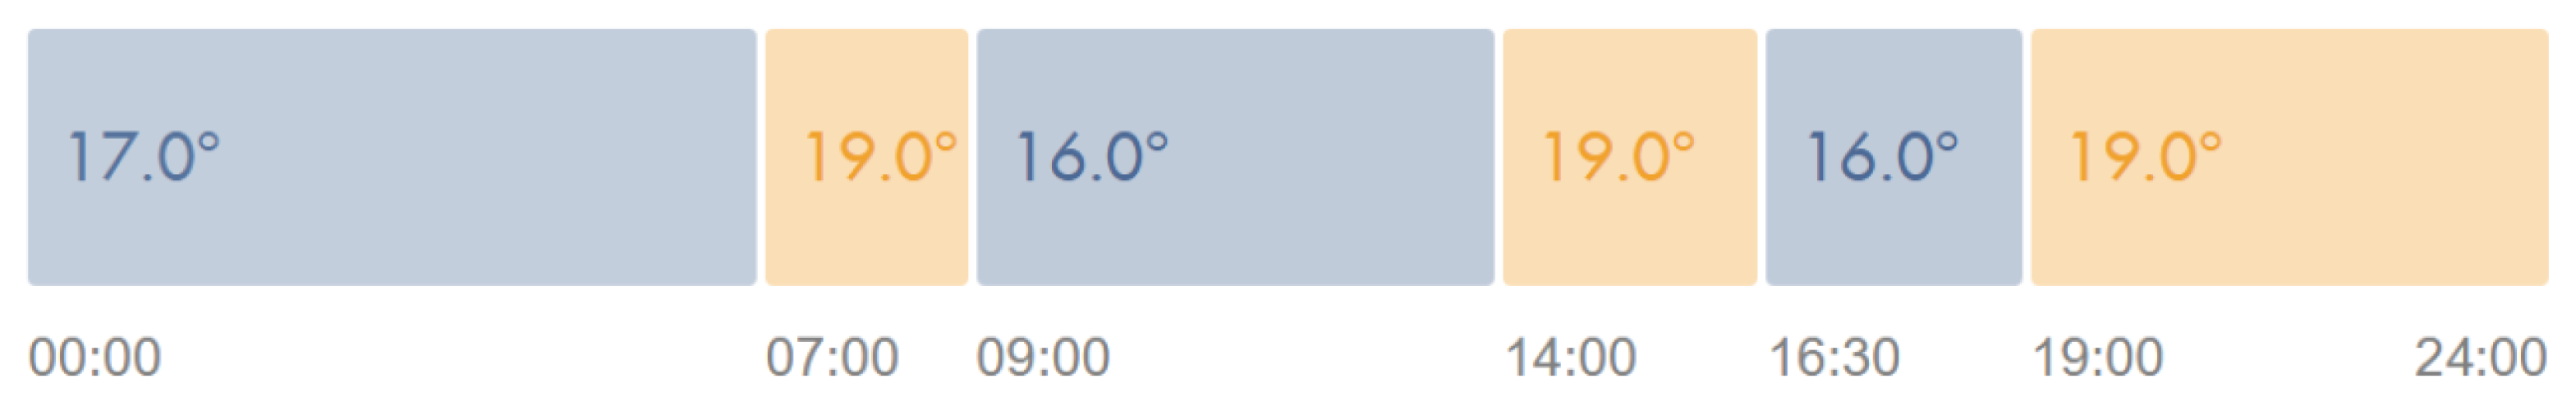
3.4. Tests Performed

Two tests were set up to maintain the setpoint temperature and to obtain the daily behaviour.
In the first test performed, the behaviour of the thermostats, maintained at a constant temperature for a certain time, was studied. The setpoint temperatures [3,15] used for each period of the day are:
  • Comfortable: 19 C.
  • Night: 17 C.
  • Eco: 16 C.
In the second test performed, the behaviour of the thermostats during a whole day was studied. The maximum and minimum temperatures obtained during the day were evaluated and a comfort evaluation was carried out.
The heating time was also measured during the tests and a comparison of each thermostat heating time was made.
The setpoint temperatures used are the same as those of the previous test, and the time periods that have been established throughout the day are shown in Figure 5. These established periods were introduced manually, as it was desired that all thermostats should start from an initial daily schedule.

4. Results and Discussion

The results from the two tests performed were presented, focusing on the following main indicators:
  • Deviation of the thermostats temperatures from the Pt100 probe temperatures.
  • Time (% of the day) with overheated or undercooled temperatures.
  • Time used by the heating system.
  • Time used by the anticipation mode.

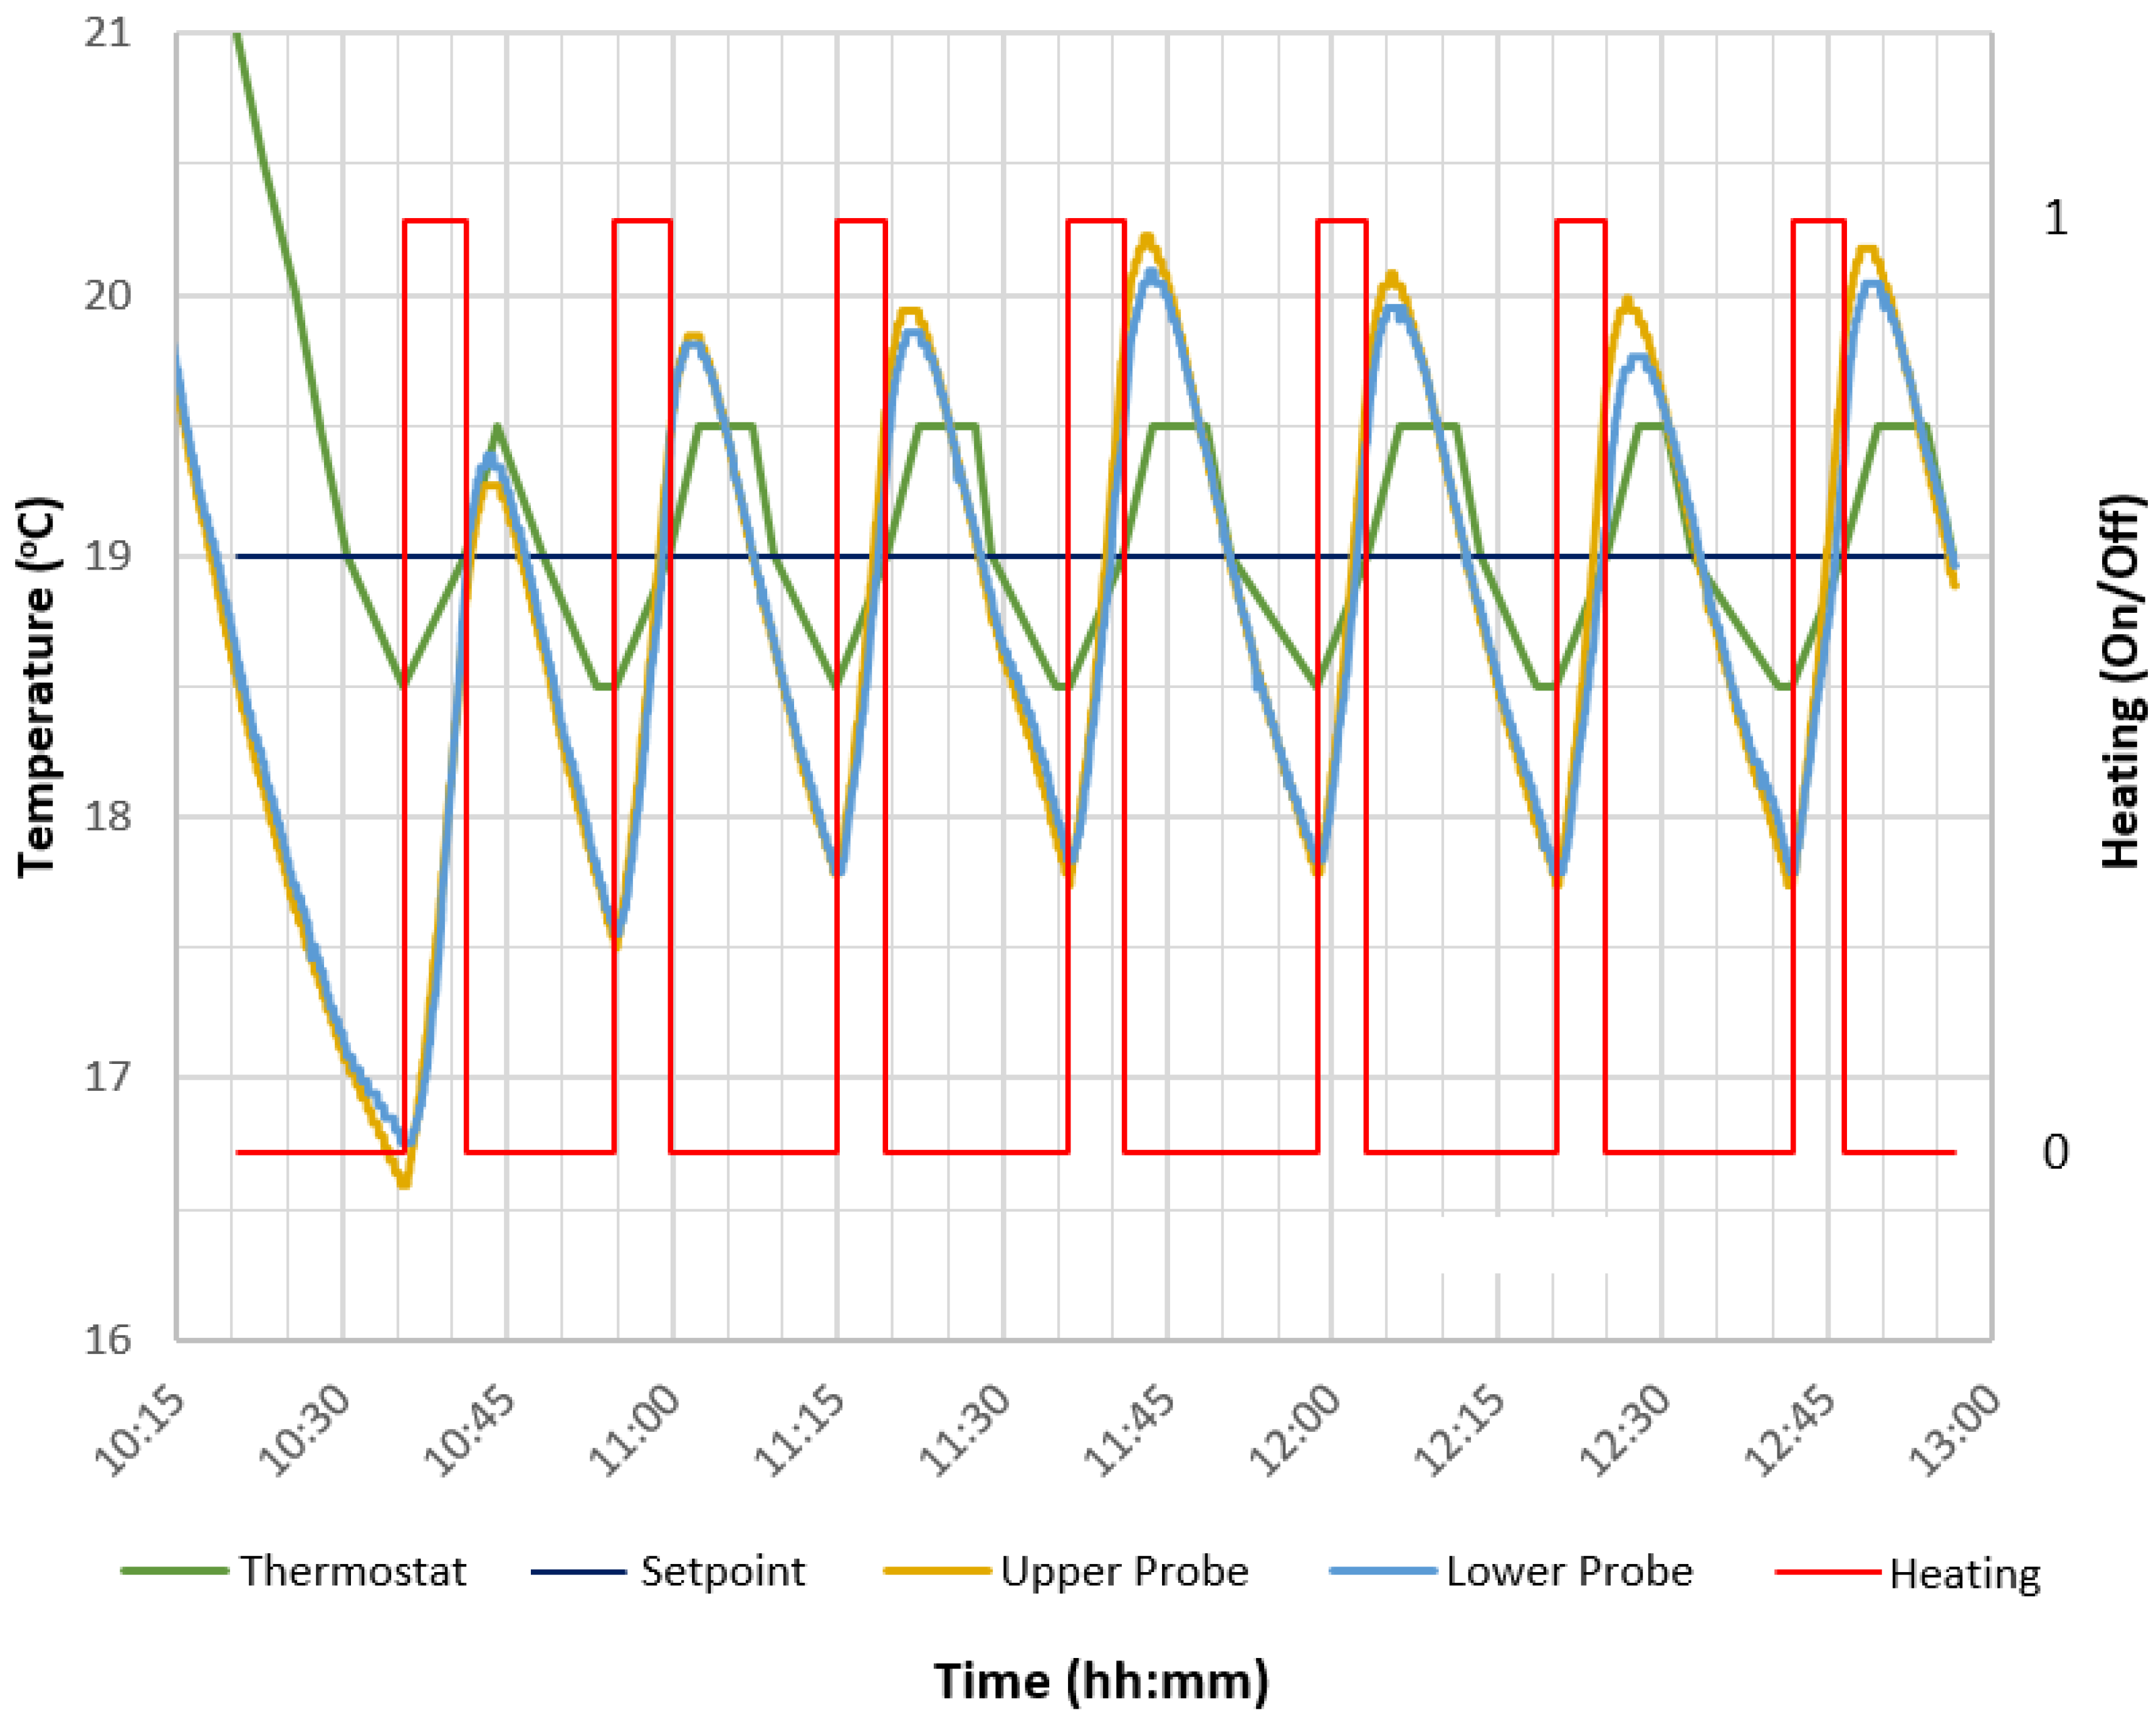
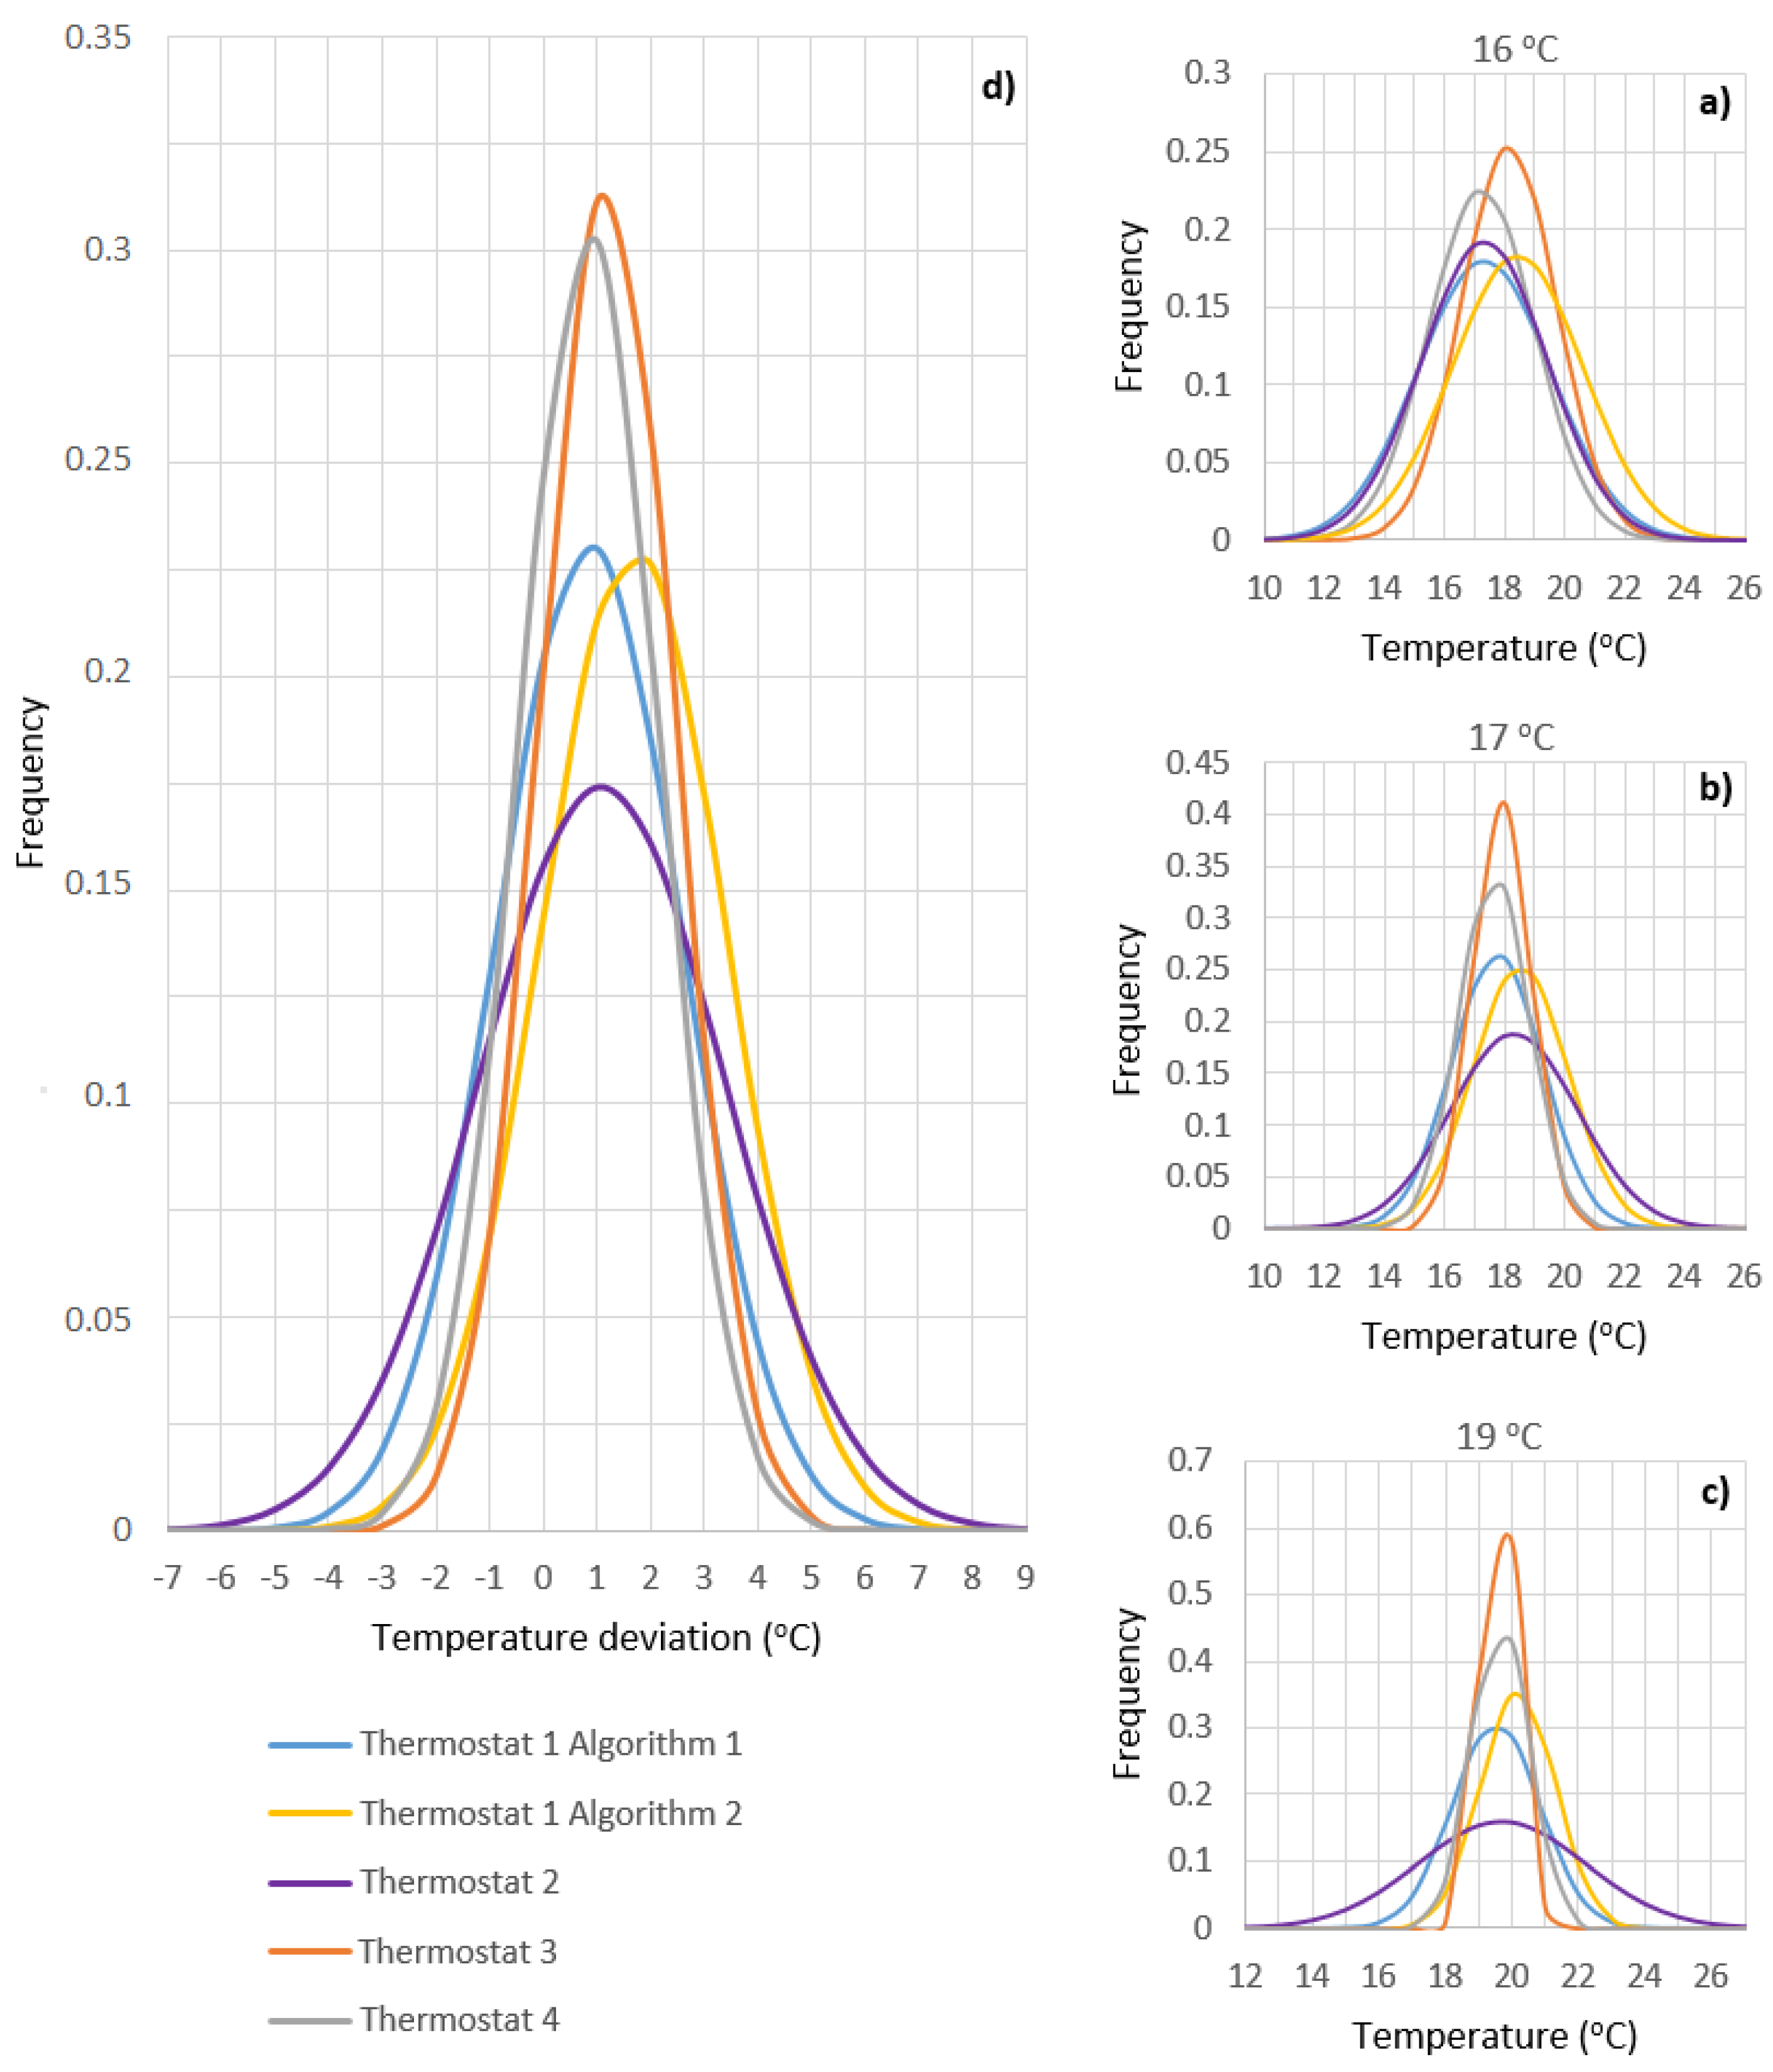
4.1. Test to Maintain the Setpoint Temperature

The behaviour of each thermostat to maintain the setpoint temperature was very similar at the three setpoint temperatures.
Thermostat 1 had two operating algorithms; the first one was active during the first week of operation, the second one came into operation when the thermostat had been on enough time to memorize the characteristics of the housing, such as thermal inertia or thermal insulation. In this case, the second algorithm was learned by the thermostat after 8 days of operation.
In Figure 6, an example of one of the graphs created from the tests can be observed. In this case, it is Thermostat 4 keeping the setpoint temperature at 19 C. It can be observed how the temperature shown by the thermostat is very close to the setpoint, while the actual temperature measured by the Pt100 probes presents higher oscillations.
Table 3 shows the data obtained from the test performed. The maximum and minimum temperatures detected by the sensors of each of the thermostats and the maximum and minimum temperatures of the Pt100 probes of each case tested are shown.
The last four columns show the difference between the maximum and minimum temperatures of the Pt100 probes and the thermostats and the difference between the maximum and minimum temperatures of the Pt100 probes and the setpoint temperature set for each case.
The thermostat with the most accurate temperature sensor was Thermostat 3, which had a maximum difference between the actual temperature and the temperature measured by its sensor of 0.33 C above the setpoint temperature, and 0.96 C below it. Closely following it was Thermostat 4, where the temperature difference was 1.05 C in the first case, and 1.15 C in the second.
The other two thermostats gave higher differences. Thermostat 1 obtained a maximum difference of 2.08 C above the setpoint and 1.65 C below, while Thermostat 2 obtained 3.92 C above and 0.83 C below the setpoint.
The thermostat that best set the setpoint temperature was Thermostat 3, followed closely by Thermostat 4. Thermostat 3 maintained the maximum actual temperature of 1.22 C above and 0.67 C below the setpoint. The results for the Thermostat 4 were very similar when the temperature was above the setpoint, 1.55 C, but higher differences were observed when below, with 1.65 C of temperature difference.
Thermostats 1 and 2, as in the previous case, move away from thermostats 3 and 4, sometimes reaching a difference of 3.08 C in the case of thermostat 1, and of 6.56 C in the case of Thermostat 2.

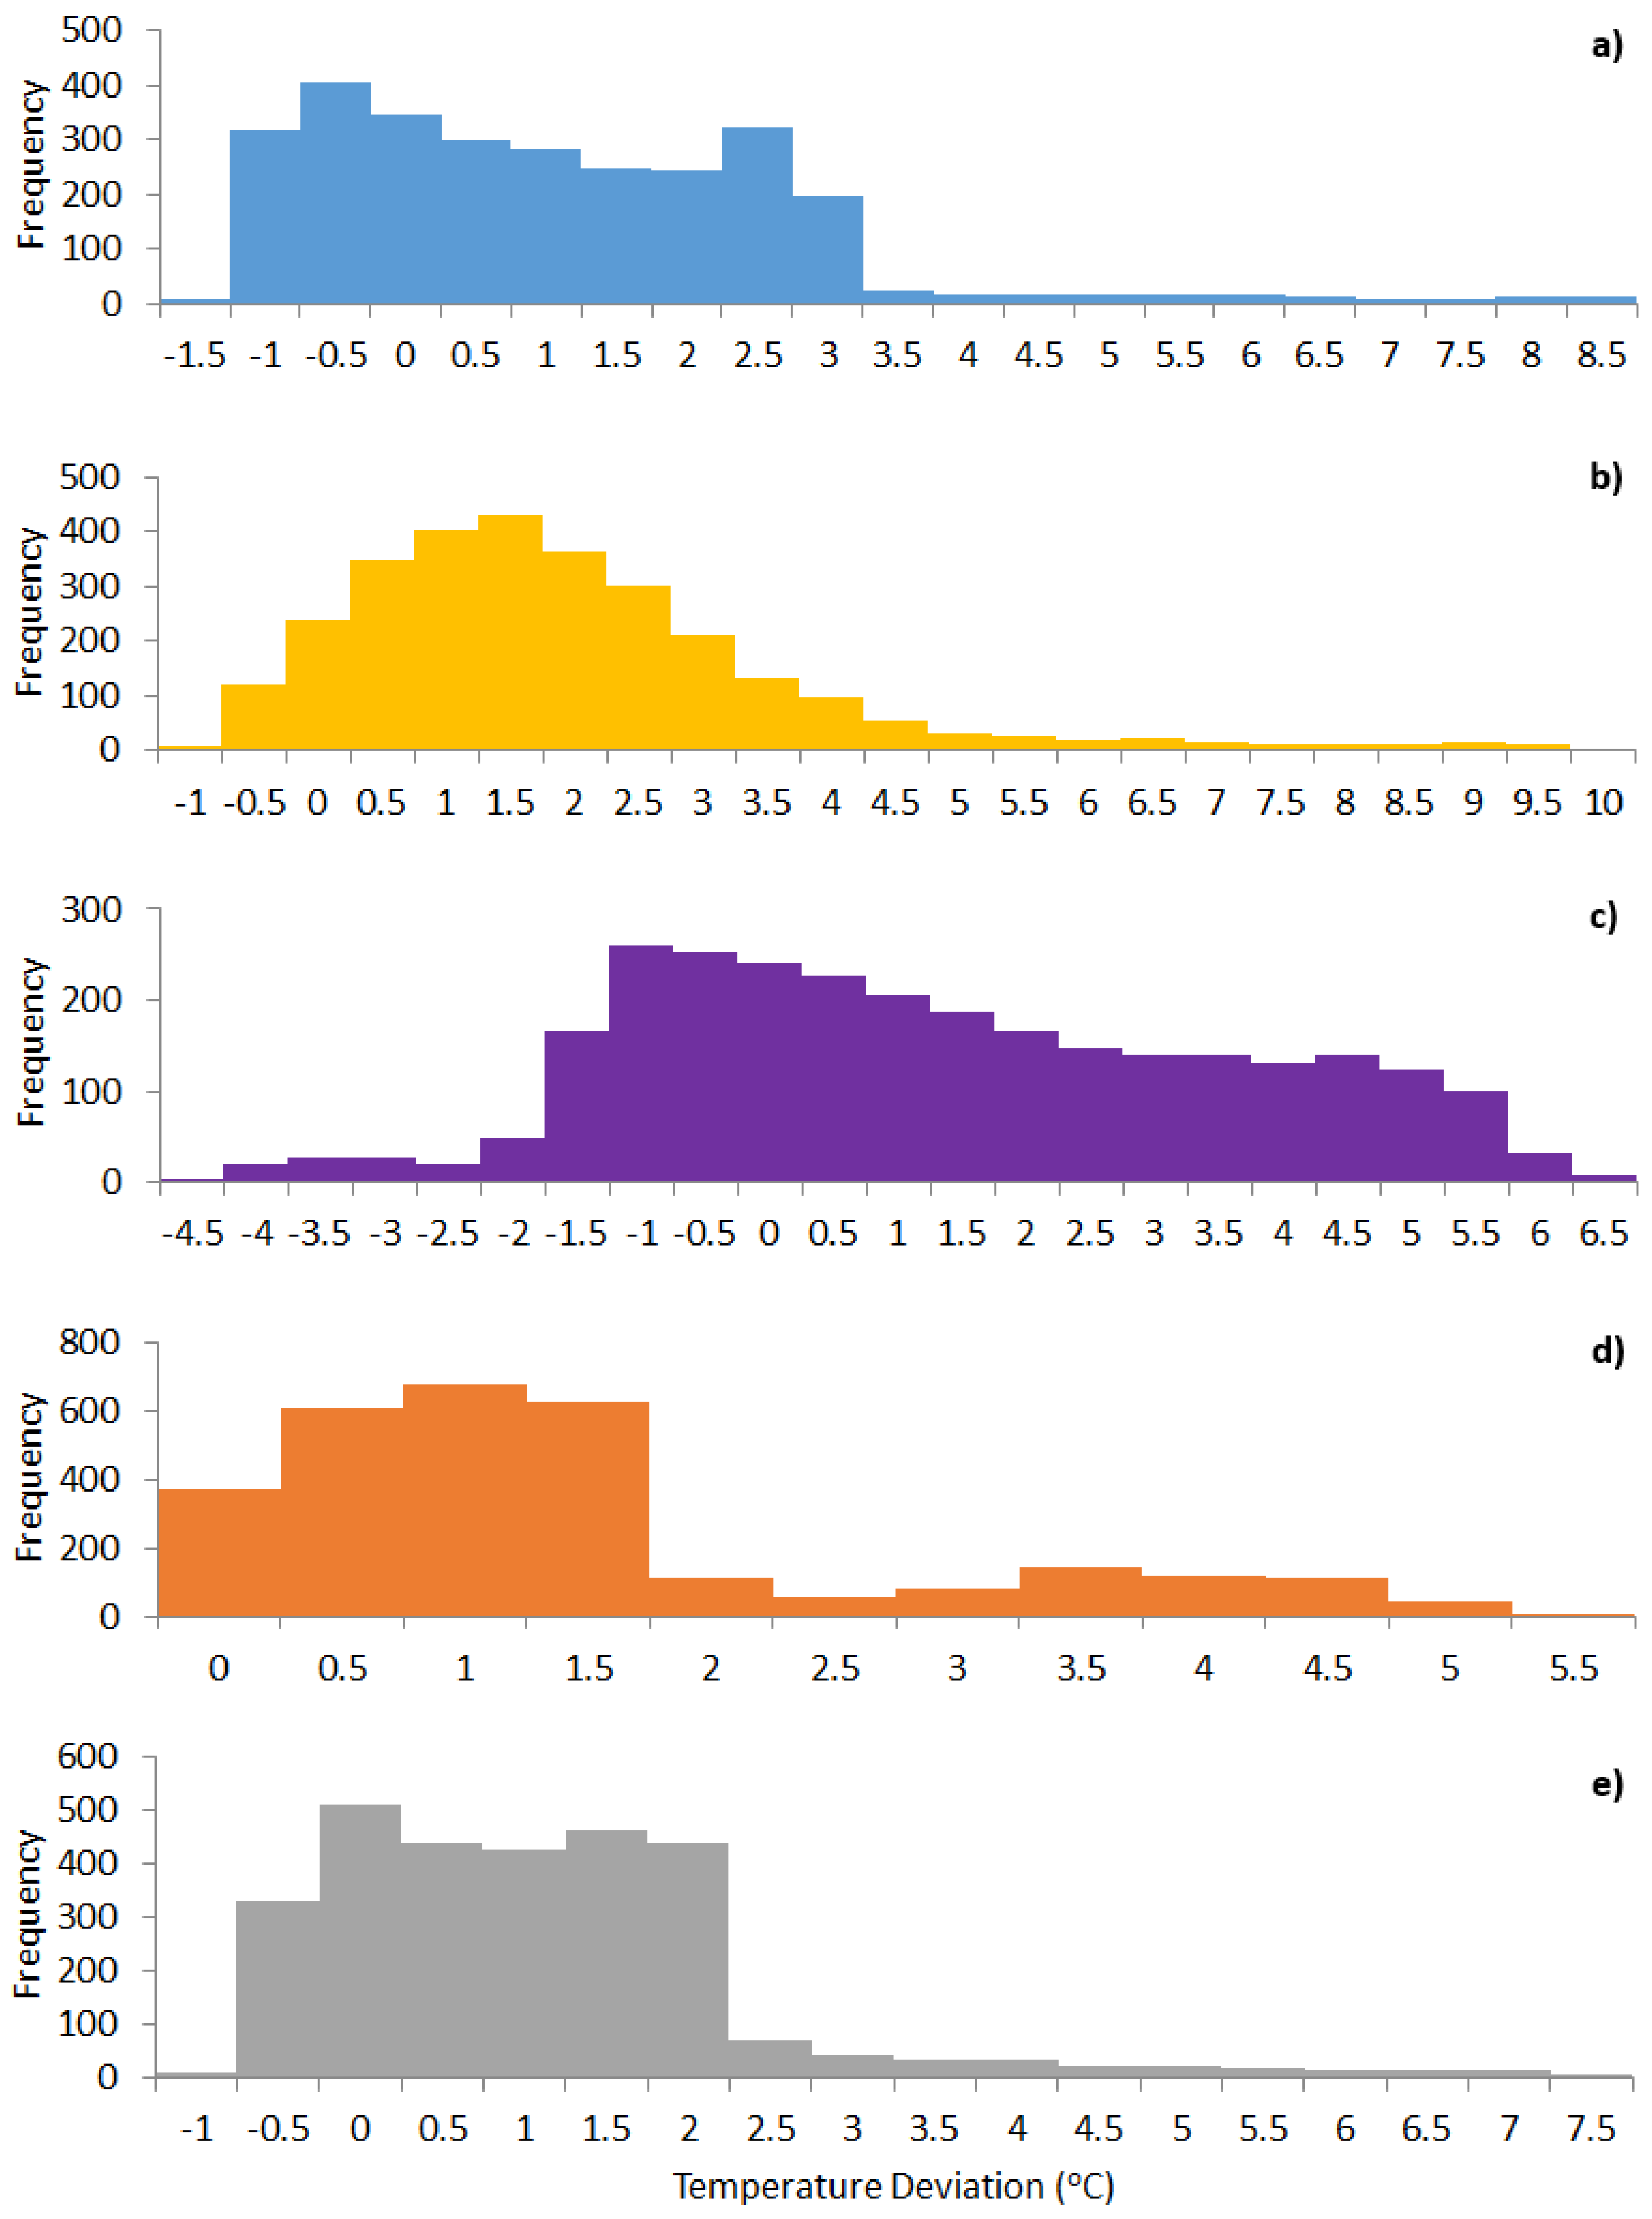
4.2. Test during a Full Day Operation

Figure 7 shows the graphs obtained from the full day operating test with each of the thermostats. The behaviour of the thermostats, once the temperature was stabilized in the different periods, is the same as in the previous section. The behaviour varied in the change of period in which the thermostat had to increase the temperature in the chamber until it reached 19 C, since an anticipation of the heating system ignition was realized so that the temperature at the beginning of the period was the suitable one. This action is called anticipation mode.
The mode of anticipation consists of the activation of the heating system in the moments prior to entering the hottest temperature period programmed in the thermostats (19 C), so that at the beginning of this period, the house (in this case, the thermal chamber) has the desired temperature. The turn-on time of the anticipation mode should be reduced as the thermostats learn the characteristics of the home, according to their manufacturers.
From Figure 7, several conclusions can be drawn. The thermostats that best fit the setpoint temperature were Thermostats 3 and 4. All the thermostats performed a time of anticipation of the temperature prior to the period of 19 C, except Thermostat 2. This anticipation caused the temperature in the periods of 16 and 17 C to be higher than necessary. Only one temperature of the Pt100 probes is shown in Figure 7, which was the average of the temperatures of the two Pt100 probes used in the experiment.
In Table 4, data of maximum, minimum and average temperatures measured by the Pt100 probes during the tests of a day of operation were gathered. The maximum temperatures shown in the periods of 16 and 17 C were due to the mode of anticipation of the temperature, except in the case of Thermostat 2 which did not have it. By comparing them, it was observed that Thermostats 3 and 4 had the temperatures that deviated the least from the setpoint in all the periods.
Table 5 shows the total and partial operating times of the heating system. It can be observed how the operating times obtained by Thermostats 1 (Algorithm 2), 3 and 4, were very similar, the first being Thermostat 1, with a total time of 5h18min, compared to 5h37min and 5h30min obtained by the other two.
Table 6 shows the total time and percentage of the day in which the temperature was higher and lower than the setpoint. Thermostats 1 (Algorithm 2) and 3 were the ones with longer times over the setpoint temperature.
Table 7 divides the times and percentages of Table 6 into two to indicate how much time and what percentage of the day the temperature was found in deviations greater or less than 1 C both above and below the setpoint temperature. Observing the partial percentage of the deviation greater than 1 C below setpoint temperature, it is noted that Thermostat 3 had 0% in this section, meaning that it always maintained the temperature with a deviation less than 1 C. Thermostats 4 and 1 (Algorithm 2) were very close, having 0.29% and 0.22% respectively.
This is a good indicator, but, as Table 8 will later show, it is not the best indicator to establish which thermostat is the best in terms of comfort. Taking into account the time in which the temperature was found below the setpoint, obviously Thermostats 1 (Algorithm 2) and 3, followed by the Thermostat 4, were the ones with the best times.
In Table 8, the central columns of Table 7 were joined in a single column, showing the time and percentage of time in which the temperature deviated less than 1 C both above and below the setpoint temperature (comfort range).
In this case, the best thermostat was Thermostat 4, which remained in the comfort range 14 h and 13 min, or 59.29% of the day. The next thermostat was Thermostat 3, with 13h17min (55.35%). Thermostat 1, with its two algorithms, was in the comfort range less than 50% of the time in both cases. Algorithm 1 was superior to algorithm 2, with a time of 11h32min versus 9h13min. Thermostat 2, meanwhile, kept the temperature in this range 33.46% of the day, which made it the worst of the four thermostats in terms of comfort.
In Figure 8, the Gaussian bells created from the temperature data of the periods with the same setpoint temperature are observed (a, b, c). Figure 8 also shows the temperature deviations obtained over a day of operation of each thermostat (d).
The Gaussian bells of Thermostats 3 and 4 are narrower and higher, indicating that the greatest percentage of their deviation is in a very small range. In the other three tests, the Gaussian bells of Thermostats 1 (Algorithm 1 and 2) and 2 are lower and wider, so the temperature range of their deviations is much greater.
In Figure 9, the temperature deviation data is shown as histograms of each of the thermostats tested. Thermostats 1 (Algorithm 2), 3 and 4 had the highest frequencies in the deviations closest to 0 C, as expected. In the histogram of Thermostat 3, the frequencies of the deviation between 3 and 5 C increase, due to the anticipation of the ignition of the heating system, as mentioned above.

4.3. Anticipation Mode: Comfort vs. Efficiency

As seen above, three of the four thermostats have the anticipation mode. On the one hand, this mode achieves a setpoint temperature of 19 C at the beginning of the period, which provides better comfort for the user. On the other hand, the anticipation mode turned on the heating system well before reaching the period of 19 C, increasing the energy consumption.
Table 9 shows the heating time due to the anticipation mode in the periods prior to 19 C, which were the periods in which this mode was activated. As shown, the thermostats with shorter heating times due to the anticipation mode were Thermostat 1 with its two algorithms and Thermostat 4. Thermostat 3, as it entered this mode before the others, maintained the heating system for more time, which led to lower energy efficiency. Thermostat 2, as it does not have this mode, decreased the comfort of the house.
From Figure 7, Thermostats 1 and 4 started the anticipation mode between 30 and 45 min before the 19 C period, while Thermostat 3 started between 1h and 1h45min before. This time did not decrease during the test which would have improved their efficiency, possibly because it is fixed or it is the minimum to activate the anticipation mode.
Thus, taking into account energy efficiency, the three thermostats that have the anticipation mode failed, and it is a point that should be improved by the manufacturers of thermostats. For now, the activation of the anticipation mode belongs to the end users, who will choose comfort or efficiency depending on their needs.

5. Conclusions

In this study, four smart thermostats were tested to check their main characteristics. A thermal test chamber was built to recreate the housing heating and cooling and to plot and record the main output data.
From the tests carried out in the thermal chamber, data on the operation of the four thermostats, such as the maintenance and the anticipation of the setpoint temperature, were obtained. It was necessary to run the system enough times for each thermostat to memorize the housing characteristics, such as its inertia and its thermal insulation. This would also allow for the generation of a better algorithm to regulate the temperature, which would create a lower oscillation with respect to the setpoint temperature.
From the comparative evaluation done, it was clearly seen that Thermostats 3 and 4 were the ones that obtained the best results in the tests performed. Each of them was slightly better than the other in some respect, i.e., Thermostat 3 was more accurate when it came to displaying the actual temperature, while Thermostat 4 kept the temperature in a range much closer to the setpoint temperature.
Thermostat 1, once it learned the characteristics of the housing (in this case, the thermal test chamber) and started using algorithm 2, obtained very similar results to those of Thermostats 3 and 4.
In last place was Thermostat 2, whose results have always been very far from the ideal ones. The lack of temperature anticipation and the large recording time intervals (5 min), had seriously penalized it in the tests performed.
The learning of the thermostats was not demonstrated due to the minimal interaction with the user since they always worked with established guidelines. As for the anticipation mode, it was demonstrated that the thermostats failed to improve or learn in this aspect, as they did not improve the start-up times of the heating system, with the consequent increase in energy consumption.

Acknowledgments

This work was supported by the Spanish Government under the R+D initiative INNPACTO with reference IPT-2011-1447-920000, Spanish R+D initiative with reference ENE-2013-42720-R and RETOS RTC-2015-3795-3. The authors also acknowledge Viesgo for its support.

Author Contributions

All authors contributed equally to this work.

Conflicts of Interest

The authors declare no conflict of interest.

Abbreviations

The following abbreviations are used in this manuscript:
MtoeMillion tonnes of oil equivalent
CEMSpanish Metrology Center
T S e t p o i n t Setpoint temperature
T T h e r m o s t a t Temperature measured by the thermostat
T P t 100 Temperature measured by the Pt100 probe

References

  1. European Comission. An EU Strategy on Heating and Cooling, 51 Final. Available online: https://ec.europa.eu/energy/sites/ener/files/documents/1._EN._ACT._part1._v14.pdf (accessed on 9 August 2017).
  2. European Comission. EU Reference Scenario 2016—Energy, Transport and GHG Emissions—Trends to 2050. Available online: http://pure.iiasa.ac.at/13656/1/REF2016._report._FINAL-web.pdf (accessed on 9 August 2017).
  3. Shahzad, S.S.; Brennan, J.; Theodossopoulos, D.; Hughes, B.; Calautit, J.K. Building-Related Symptoms, Energy, and Thermal Control in the Workplace: Personal and Open Plan Offices. Sustainability 2016, 8, 331. [Google Scholar] [CrossRef]
  4. CLEAResult. Opportunities for Home Energy Management Systems (HEMS) in Advancing Residential Energy Efficiency Programs. Available online: http://www.neep.org/opportunities-home-energy-management-systems-hems-advancing-residential-energy-efficiency-programs (accessed on 9 August 2017).
  5. Raspberry Pi Foundation. Available online: https://www.raspberrypi.org/ (accessed on 22 November 2016).
  6. Manning, M.M.; Swinton, M.C.; Szadkowski, F.; Gusdorf, J.; Ruest, K. The effects of thermostat set-back and set-up on seasonal energy consumption, surface temperatures and recovery times at the CCHT Twin House Facility. ASHRAE Trans. 2007, 113 Pt 1, 1–12. [Google Scholar]
  7. Energy Star. A Guide to Energy-Efficient Heating and Cooling. Available online: www.energystar.gov/ia/partners/publications/pubdocs/HeatingCoolingGuide%20FINAL_9-4-09.pdf (accessed on 9 August 2017).
  8. Lobaccaro, G.; Carlucci, S.; Löfström, E. A Review of Systems and Technologies for Smart Homes and Smart Grids. Energies 2016, 9, 348. [Google Scholar] [CrossRef]
  9. Rau, P.-L.P.; Gong, Y.; Huang, H.-J.; Wen, J. A Systematic Study for Smart Residential Thermostats: User Needs for the Input, Output, and Intelligence Level. Buildings 2016, 6, 19. [Google Scholar] [CrossRef]
  10. Sönmez, D.; Dinçer, K. A Review of Modern Residential Thermostats for Home Automation to Provide Energy Efficiency. In Proceedings of the 2016 4th International Istanbul Smart Grid Congress and Fair (ICSG), Istanbul, Turkey, 20–21 April 2016; pp. 1–4. [Google Scholar] [CrossRef]
  11. Yang, R.; Newman, M.W. Learning from a learning thermostat: Lessons for intelligent systems for the home. In Proceedings of the 2013 ACM International Joint Conference on Pervasive and Ubiquitous Computing, Zurich, Switzerland, 8–12 September 2013. [Google Scholar] [CrossRef]
  12. Zhang, D.; Zeng, P.; Zhang, Y.; Li, S. An Integrative Study of Home Energy Management for Residential Energy Consumers. In Proceedings of the 5th Annual IEEE International Conference on Cyber Technology in Automation, Control and Intelligent Systems, Shenyang, China, 8–12 June 2015. [Google Scholar]
  13. Aarish, C.; Perussi, M.; Rietz, A.; Korn, D. Evaluation of the 2013–2014 Programmable and Smart Thermostat Program. Available online: http://www.cadmusgroup.com/wp-content/uploads/2015/06/Cadmus._Vectren._Nest._Report._Jan2015.pdf?submissionGuid=c8eda45b-2759-4a31-90e3-d2ecdb9001de (accessed on 9 August 2017).
  14. Aarish, C.; Rietz, A.; Perussi, M.; Higgins, K.; Horvath, Z.; Reynolds, A. Evaluation of 2013–2014 Smart Thermostat Pilots: Home Energy Monitoring, Automatic Temperature Control, Demand Response. Available online: http://www.cadmusgroup.com/wp-content/uploads/2016/05/Cadmus._ATC._HEM._Report._FINAL._revised._Sep._2015.pdf (accessed on 9 August 2017).
  15. Apex Analytics LLC. Nest Thermostat Heat Pump Control—Pilot Evaluation Findings. Available online: https://nest.com/downloads/press/documents/energy-trust-of-oregon-pilot-evaluation-whitepaper.pdf (accessed on 9 August 2017).
  16. Apex Analytics, LLC. Smart Thermostat Pilot Evaluation. Available online: http://assets.energytrust.org/api/assets/reports/Smart._Thermostat._Pilot._Evaluation-Final._wSR.pdf (accessed on 9 August 2017).
  17. Aarish, C.; Rietz, A.; Perussi, M.; Higgins, K.; Horvath, Z.; Reynolds, A. Wi-Fi Programmable Controllable Thermostat Pilot Program Evaluation. Available online: http://ma-eeac.org/wordpress/wp-content/uploads/Wi-Fi-Programmable-Controllable-Thermostat-Pilot-Program-Evaluation._Part-of-the-Massachusetts-2011-Residential-Retrofit-Low-Income-Program-Area-Study.pdf (accessed on 9 August 2017).
  18. Aarish, C.; Jones, C. Smart Thermostats and the Triple Bottom Line: People, Planet, and Profits. In Proceedings of the ACEEE Summer Study on Energy Efficiency in Buildings, Pacific Grove, CA, USA, 21–26 August 2016. [Google Scholar]
  19. CLEAResult. Smart thermostats, CLEAResult for Commonwealth Edison. Available online: http://ilsagfiles.org/SAG._files/Meeting._Materials/2015/6-23-15._Meeting/CLEAResult._Smart._Thermostat._WhitePaper._20150505.pdf (accessed on 9 August 2017).
Figure 1. Operating diagram of the Thermal Chamber.
Sustainability 09 01462 g001
Figure 2. Components installed inside the fuse box.
Sustainability 09 01462 g002
Figure 3. Components installed in the window of the fuse box cover.
Sustainability 09 01462 g003
Figure 4. Graph created from the data obtained from the thermal chamber and the data downloaded from thermostat 1.
Sustainability 09 01462 g004
Figure 5. Daily temperature programming used in the test.
Sustainability 09 01462 g005
Figure 6. Thermostat 4 keeping the setpoint temperature at 19 C.
Sustainability 09 01462 g006
Figure 7. Graphs of temperature and heating system operation during a full day testing. (a) Thermostat 1 Algorithm 1. (b) Thermostat 1 Algorithm 2. (c) Thermostat 2. (d) Thermostat 3. (e) Thermostat 4.
Sustainability 09 01462 g007
Figure 8. Gauss bell of the deviation of the temperature in each one of the cases of setpoint temperature (16, 17 and 19 C) (ac) and temperature deviation with respect to the setpoint temperatures during the tests of a day of operation (d).
Sustainability 09 01462 g008
Figure 9. Histograms of the temperature deviation during the tests performed. (a) Thermostat 1 Algorithm 1. (b) Thermostat 1 Algorithm 2. (c) Thermostat 2. (d) Thermostat 3. (e) Thermostat 4.
Sustainability 09 01462 g009
Table 1. Specifications of thermostats.
ThermostatTemperature (Measure)Temperature (Setpoint)GeolocationEthernet/Wi-FiPrice
(€)
Measurement
Range ( C)
Accuracy
( C)
Setpoint
Range ( C)
Increment
( C)
Thermostat 10–50±0.55–300.5nn/y179.00
Thermostat 20–50±0.34–350.1yy/n129.00
Thermostat 3 5–250.1yy/n249.00
Thermostat 4 ±0.54–320.5yn/y249.00
Table 2. Data collection generated from the excel file obtained from the thermal chamber.
DayHourUncalibrated
Upper Probe
Temp. ( C)
Uncalibrated
Lower Probe
Temp. ( C)
Upper
Probe
Temp.
( C)
Lower
Probe
Temp.
( C)
t1t2t3t4HeatCold
22 February 201711:07:0218.23017.55116.59416.380111010
22 February 201711:07:0718.27817.64716.64216.474111010
22 February 201711:07:1218.32617.69516.68916.521111010
22 February 201711:07:1718.37417.74416.73716.568111010
22 February 201711:07:2218.42217.84016.78516.662111010
22 February 201711:07:2818.47017.88816.83316.709111010
22 February 201711:07:3318.47017.93616.83316.756111010
22 February 201711:07:3818.51817.98516.88116.803111010
22 February 201711:07:4318.56618.08116.92916.897111010
22 February 201711:07:4818.61418.12916.97716.944111010
22 February 201711:07:4818.61418.12916.97716.944011001
22 February 201711:07:5318.66118.17717.02516.992011001
Table 3. Results of tests to maintain setpoint temperature.
ThermostatT Setpoint
( C)
T Thermostat ( C)T Pt 100 ( C)T Pt 100 -T Thermostat ( C)T Pt 100 -T Setpoint ( C)
max.min.max.min.max.min.max.min.
Thermostat 1
Algorithm 1
1919.9018.7021.7517.411.85−1.292.75−1.59
1718.0016.8019.5115.541.51−1.262.51−1.46
1617.2015.8018.7014.151.50−1.652.70−1.85
Thermostat 1
Algorithm 2
1919.6018.221.4216.551.82−1.652.42−2.45
1717.6016.4019.1315.201.53−1.202.13−1.80
1617.0015.3019.0814.202.08−1.103.08−1.80
Thermostat 21921.4018.2025.3217.373.92−0.836.32−1.63
1719.7016.2023.5615.393.86−0.816.56−1.61
1618.0015.2021.0415.013.04−0.195.04−0.99
Thermostat 31919.8019.2020.1318.840.33−0.361.13−0.16
1717.8017.2017.9316.330.13−0.870.93−0.67
1617.1016.4017.2215.440.12−0.961.22−0.56
Thermostat 41919.5018.5020.2317.740.73−0.761.23−1.26
1717.5016.5017.9815.590.48−0.910.98−1.41
1616.5015.5017.5514.351.05−1.151.55−1.65
Table 4. Results of actual maximum, minimum and average temperatures of the tests of a full-day testing of thermostats.
ThermostatMaximum, Minimum and Average Temperatures ( C)
Setpoint 16 CSetpoint 17 CSetpoint 19 C
max.min.Averagemax.min.Averagemax.min.Average
Thermostat 1 Algorithm 124.3314.4717.3423.0015.3517.7721.8517.4719.52
Thermostat 1 Algorithm 225.5615.7918.4423.5116.0318.5323.6017.9220.18
Thermostat 222.0314.3817.1622.3715.0918.3125.1514.4719.71
Thermostat 321.0715.818.1620.7816.6617.9320.9218.5819.63
Thermostat 423.2914.9017.4522.2715.8817.6721.3018.0819.65
Table 5. Results of partial and total heating system operating times of full-day testing of thermostats.
ThermostatHeating System Operation Time in the Different
Periods of the Day (hh:mm:ss)
Total Heating
System Operation
Time (hh:mm:ss)
00:00–
07:00
07:00–
09:00
09:00–
14:00
14:00–
16:30
16:30–
19:00
19:00–
00:00
Thermostat 1 Algorithm 11:47:360:35:211:07:360:43:400:39:001:27:226:20:35
Thermostat 1 Algorithm 21:28:230:30:400:54:050:31:110:34:191:19:325:18:10
Thermostat 21:45:310:41:030:55:380:55:370:29:381:33:336:21:00
Thermostat 31:33:340:31:500:55:360:40:000:36:281:20:135:37:41
Thermostat 41:34:430:31:120:50:040:37:540:30:471:25:205:30:00
Table 6. Results of times and total percentages in which the temperature was higher or lower than the setpoint temperature in the tests of a full day of operation of the thermostats.
ThermostatTime (hh: mm: ss)
Percentage (%)
Above
Setpoint
Temperature
Below
Setpoint
Temperature
Thermostat 1 Algorithm 114:58:369:01:24
62.40%37.6%
Thermostat 1 Algorithm 221:03:002:57:00
87.71%12.29%
Thermostat 215:23:038:36:57
62.34%37.66%
Thermostat 321:20:412:39:19
88.94%11.06%
Thermostat 417:05:166:54:44
71.20%28.80%
Table 7. Results of times and percentages in which the deviation temperature was above and below 1 C of the setpoint temperature in the tests of a full day of operation of the thermostats.
ThermostatTime (hh: mm: ss)
Percentage (%)
Above Setpoint TemperatureBelow Setpoint Temperature
Deviation
Greater
than 1 C
Deviation
Less
than 1 C
Deviation
Less
than 1 C
Deviation
Greater
B
Thermostat 1
Algorithm 1
9:55:145:03:226:29:362:31:48
41.34%21.07%27.06%10.54%
Thermostat 1
Algorithm 2
14:43:276:19:332:53:530:03:07
61.35%26.36%12.08%0.22%
Thermostat 211:12:163:45:264:16:234:45:55
46.69%15.66%17.80%19.86%
Thermostat 310:42:5610:37:452:39:190:00:00
44.65%44.29%11.06%0.00%
Thermostat 49:40:517:24:256:50:350:04:09
40.34%30.86%28.51%0.29%
Table 8. Time and percentage in which the temperature has been found within a range of ±1 C of setpoint temperature.
ThermostatTime (hh: mm: ss)Percentage (%)
Thermostat 1 Algorithm 111:32:5848.12%
Thermostat 1 Algorithm 29:13:2638.43%
Thermostat 28:01:4933.46%
Thermostat 313:17:0455.35%
Thermostat 414:15:0059.38%
Table 9. Heating system operating time due to the temperature anticipation mode in each of the periods prior to 19 C.
ThermostatHeating System Operating
Time Due to Anticipation
Mode (hh: mm: ss)
Total Heating
System Operating
Time Due to
Anticipation Mode
(hh: mm: ss)
Total Heating
System Operation
Time (hh: mm: ss)
00:00–
7:00
09:00–
14:00
16:30–
19:00
Thermostat 1 Algorithm 10:13:000:22:210:23:240:58:456:20:35
Thermostat 1 Algorithm 20:13:000:17:090:22:520:53:015:18:10
Thermostat 20:00:000:00:000:00:000:00:006:21:00
Thermostat 30:23:260:32:440:30:141:26:245:37:41
Thermostat 40:19:130:14:020:21:490:55:045:30:00

