Characterizing Factors Associated with Built-Up Land Expansion in Urban and Non-Urban Areas from a Morphological Perspective


Abstract
:1. Introduction
2. Study Area and Data Description
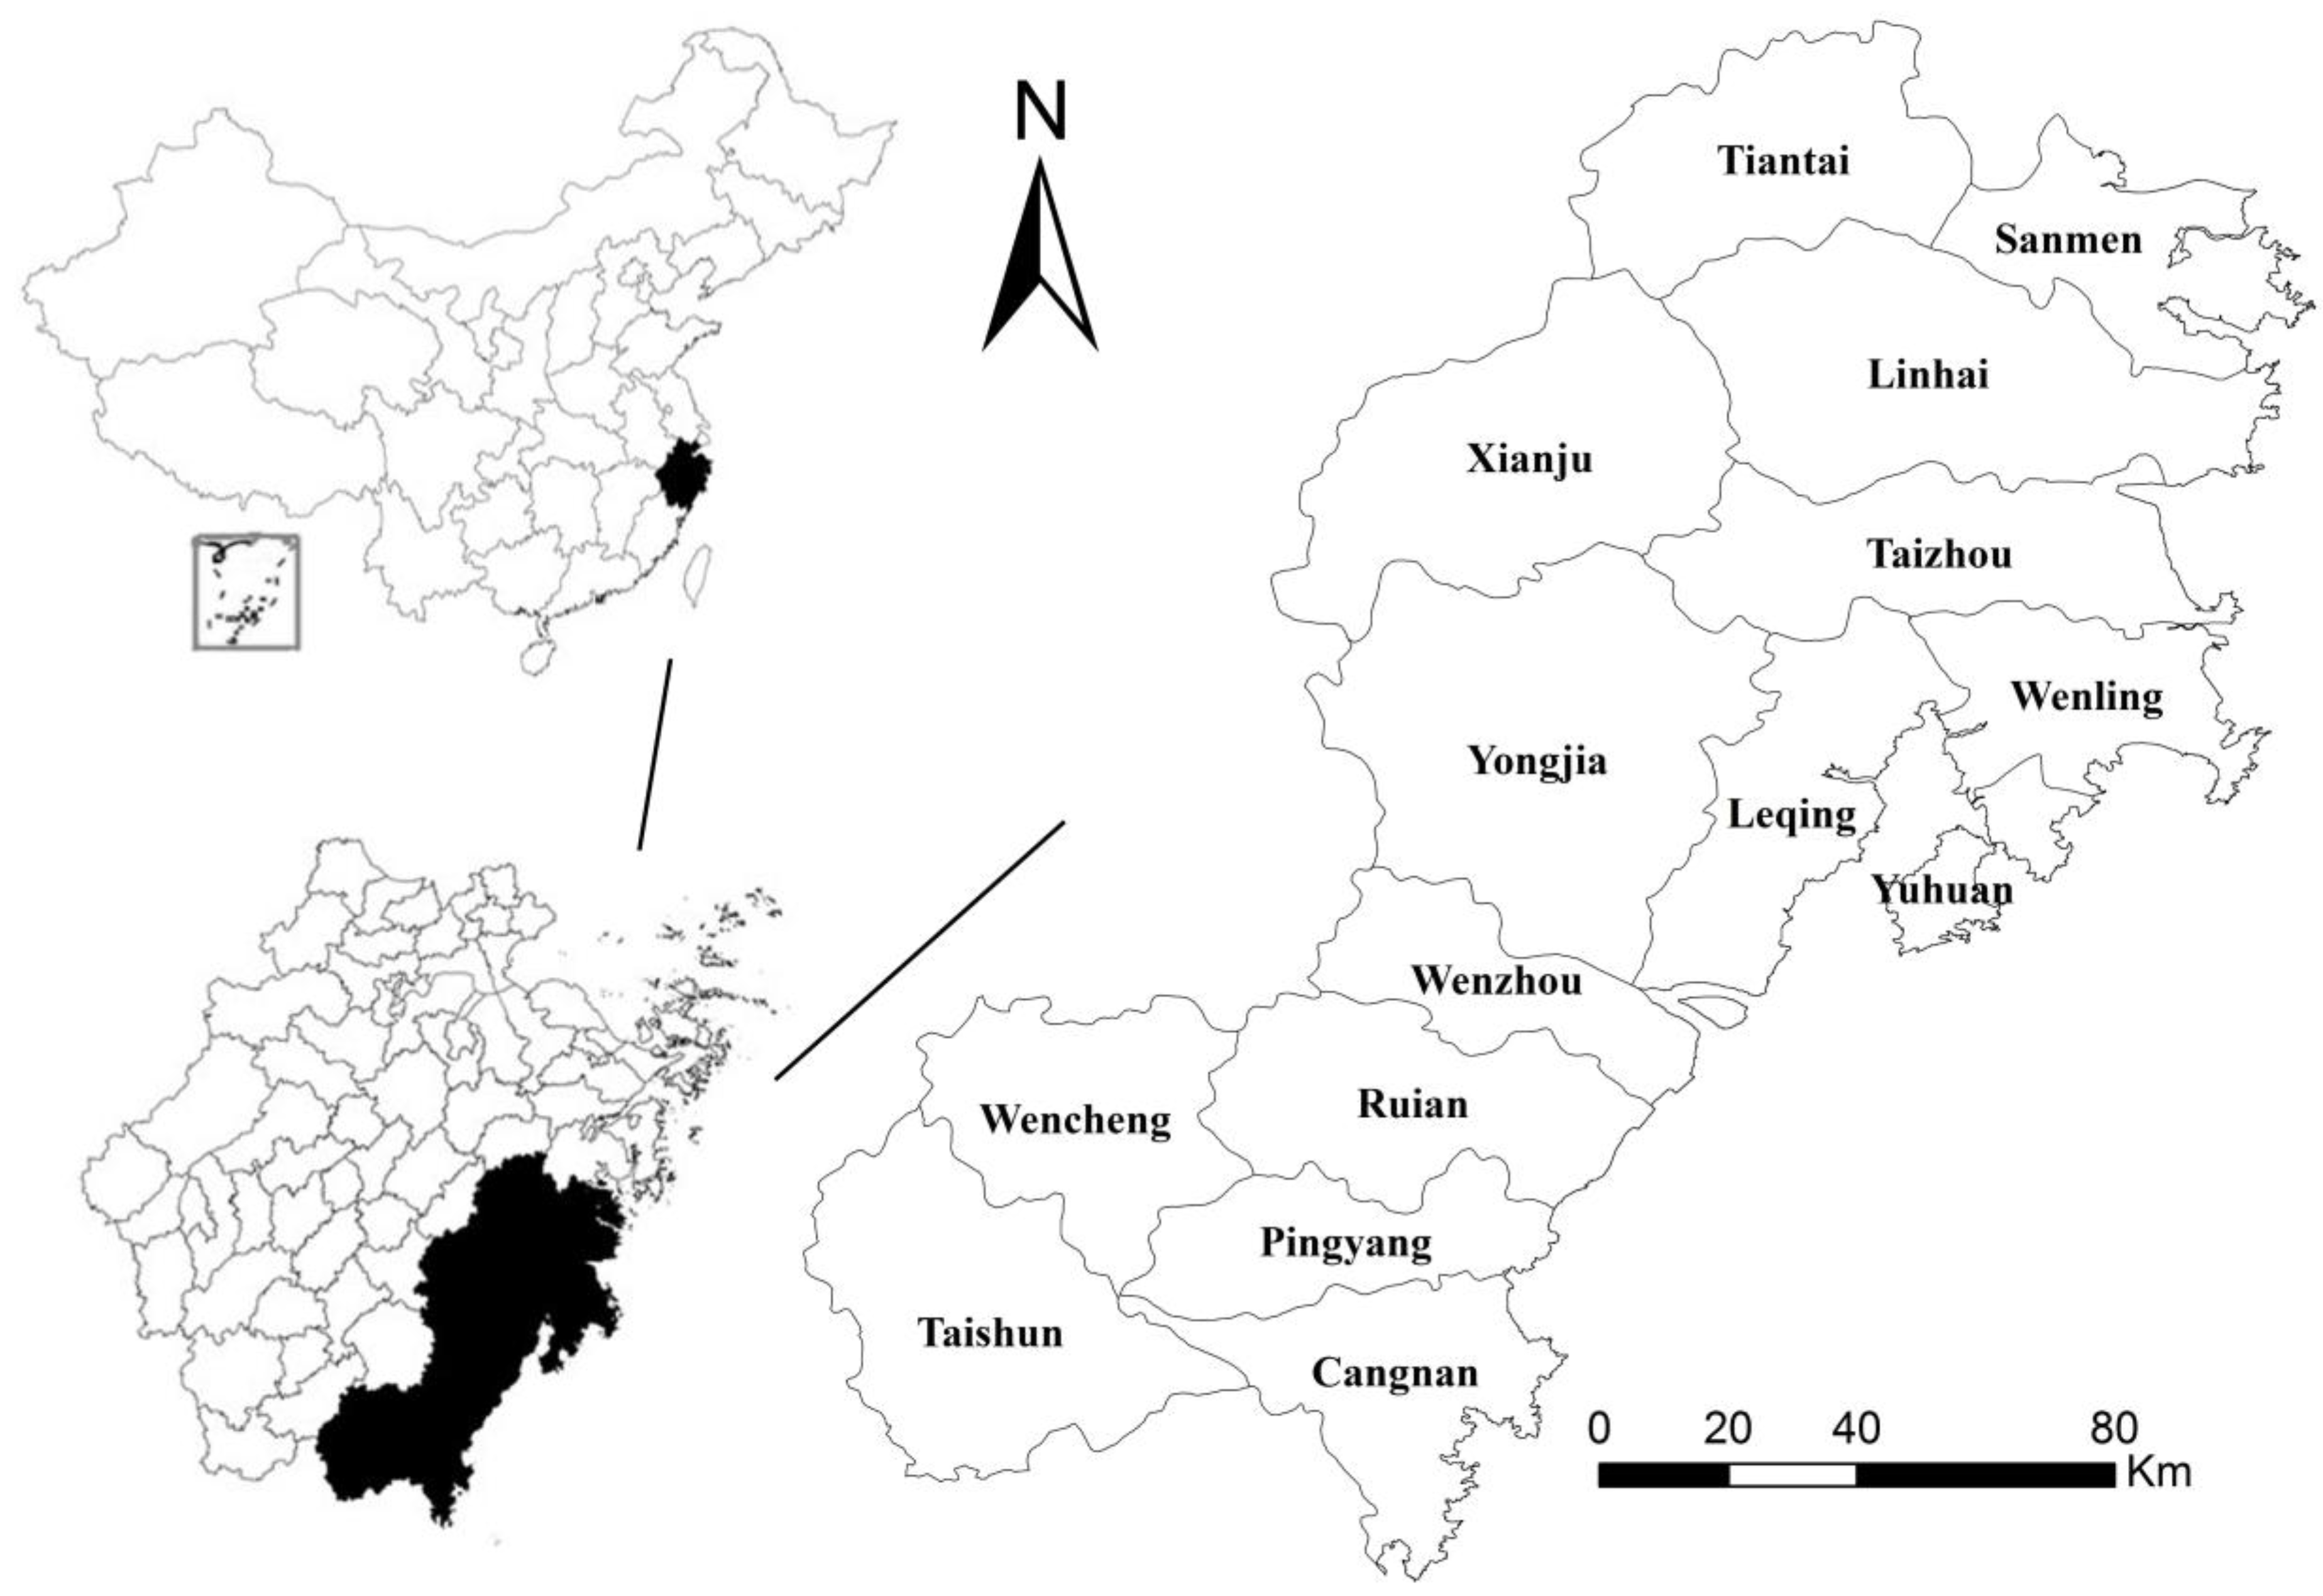
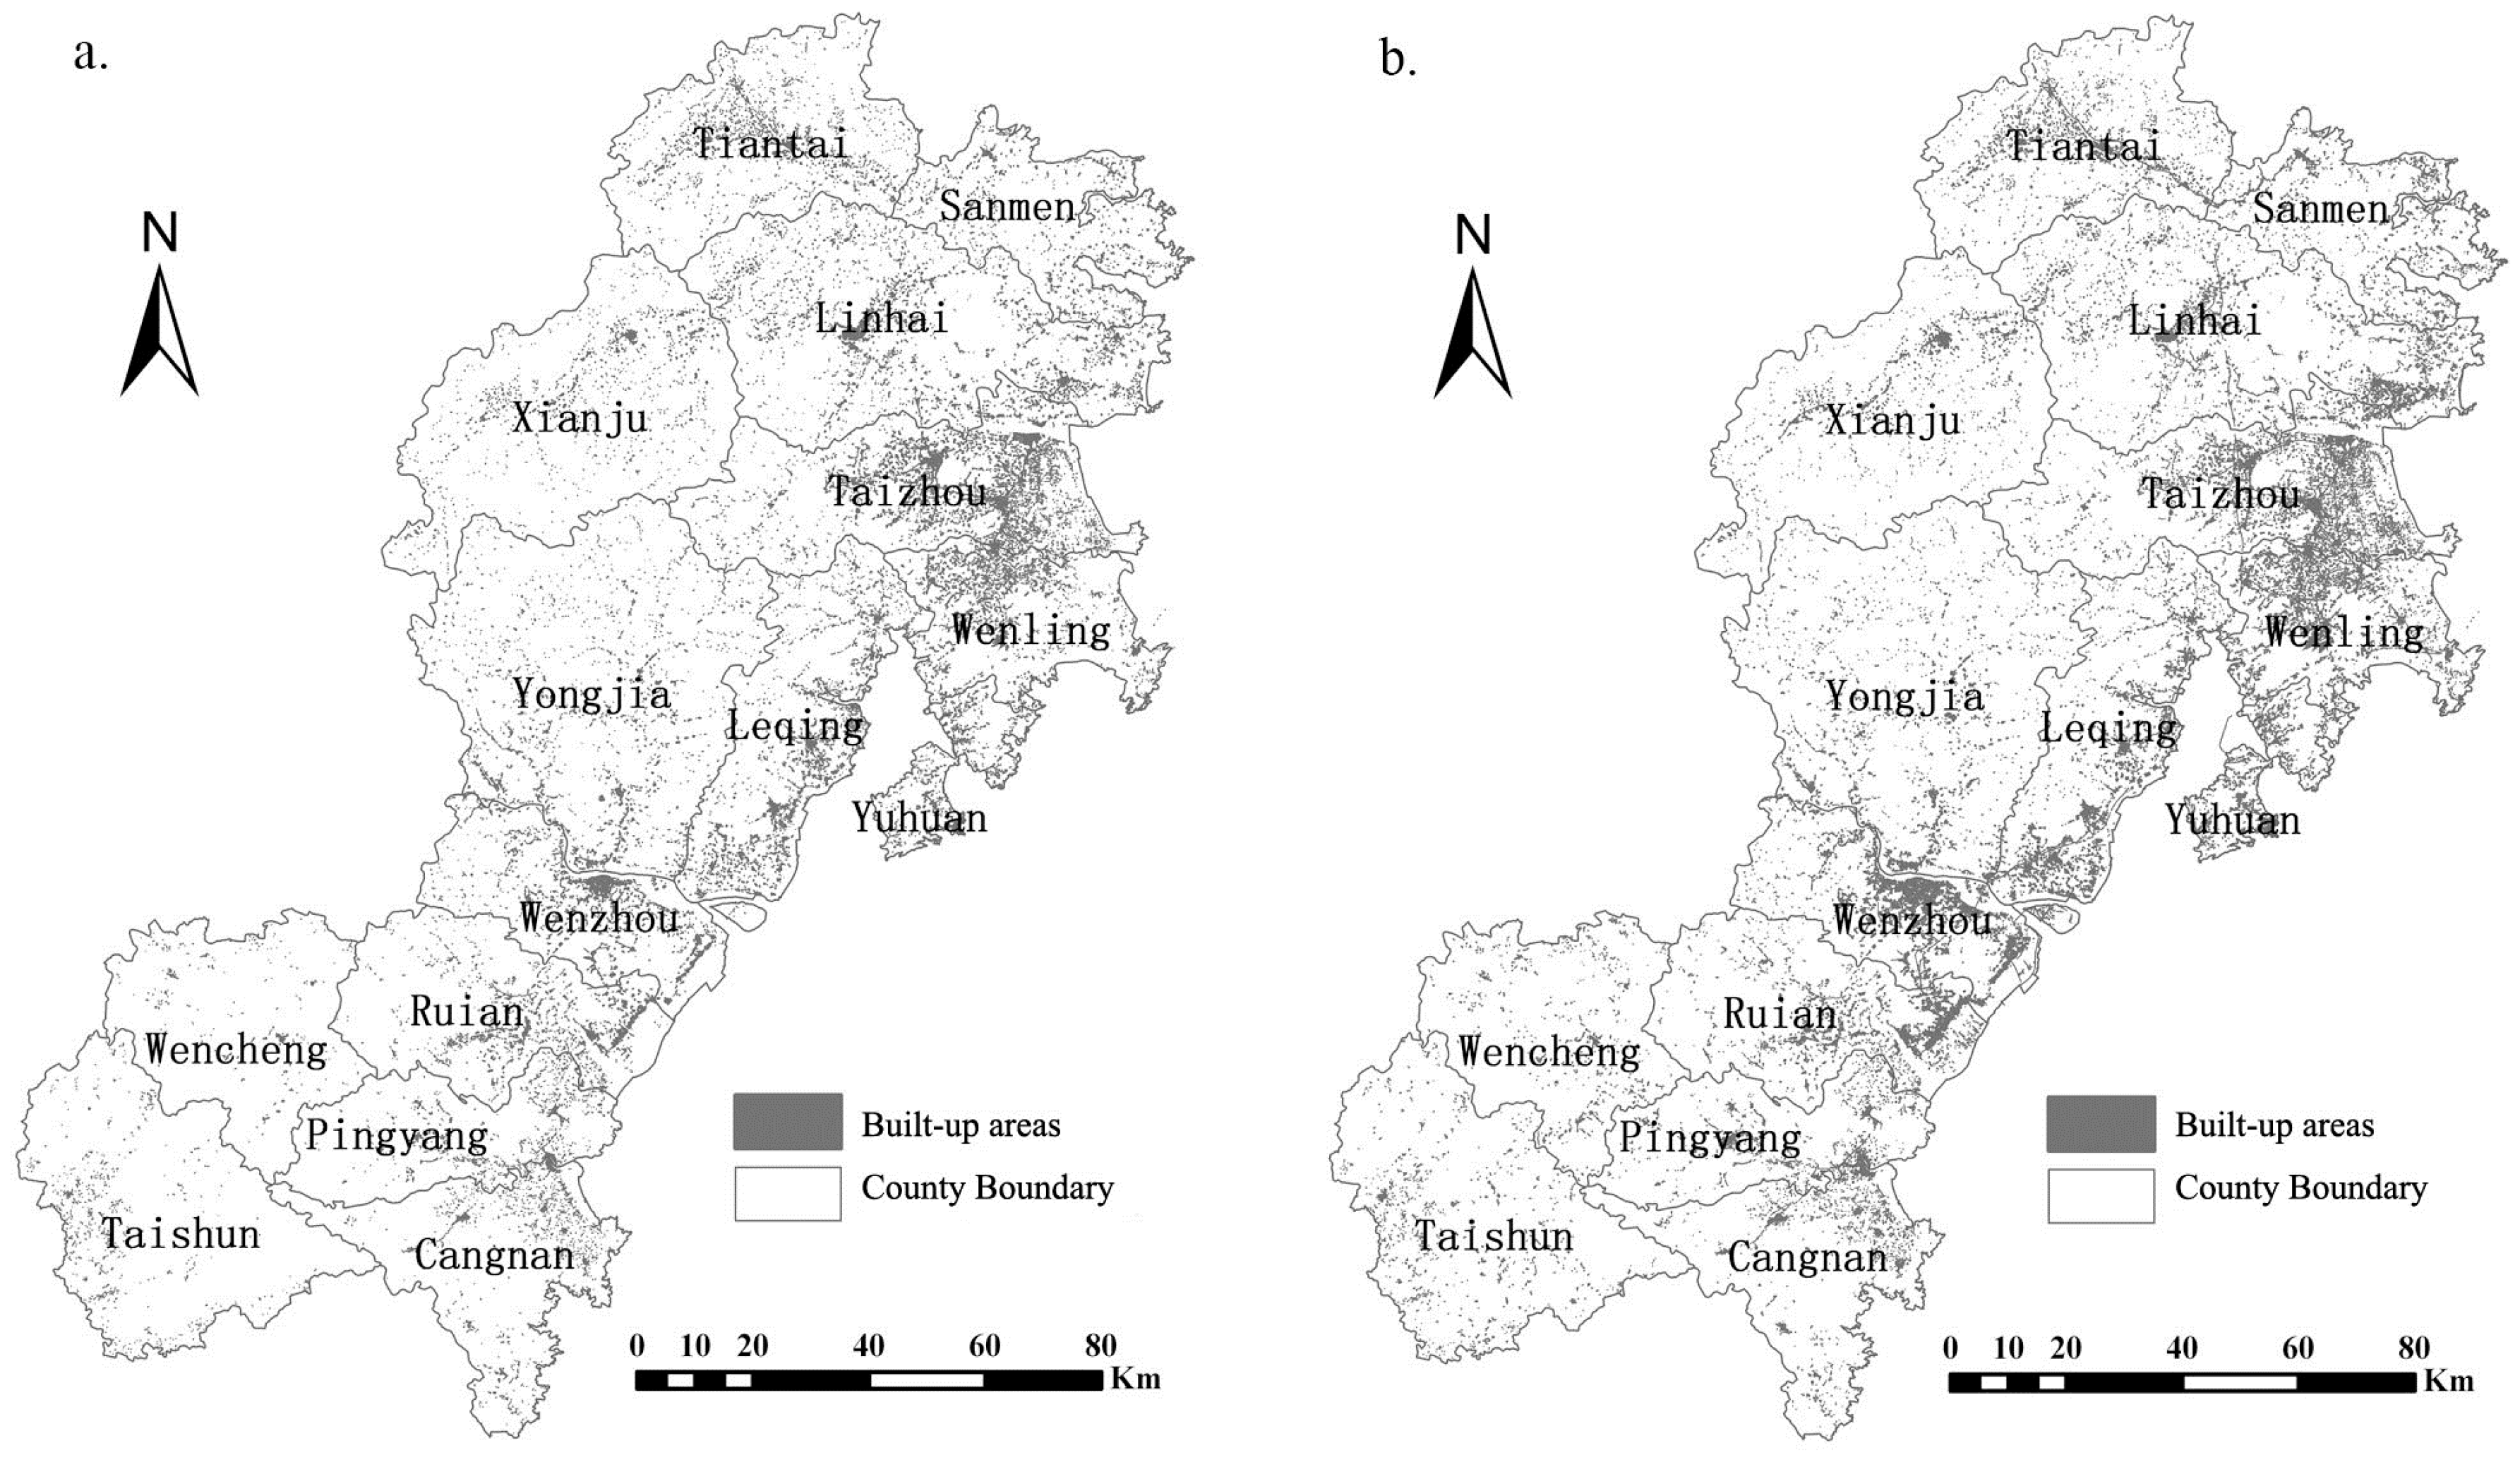
2.1. Study Area
2.2. Data Preparation and Accuracy Assessment
3. Methodology
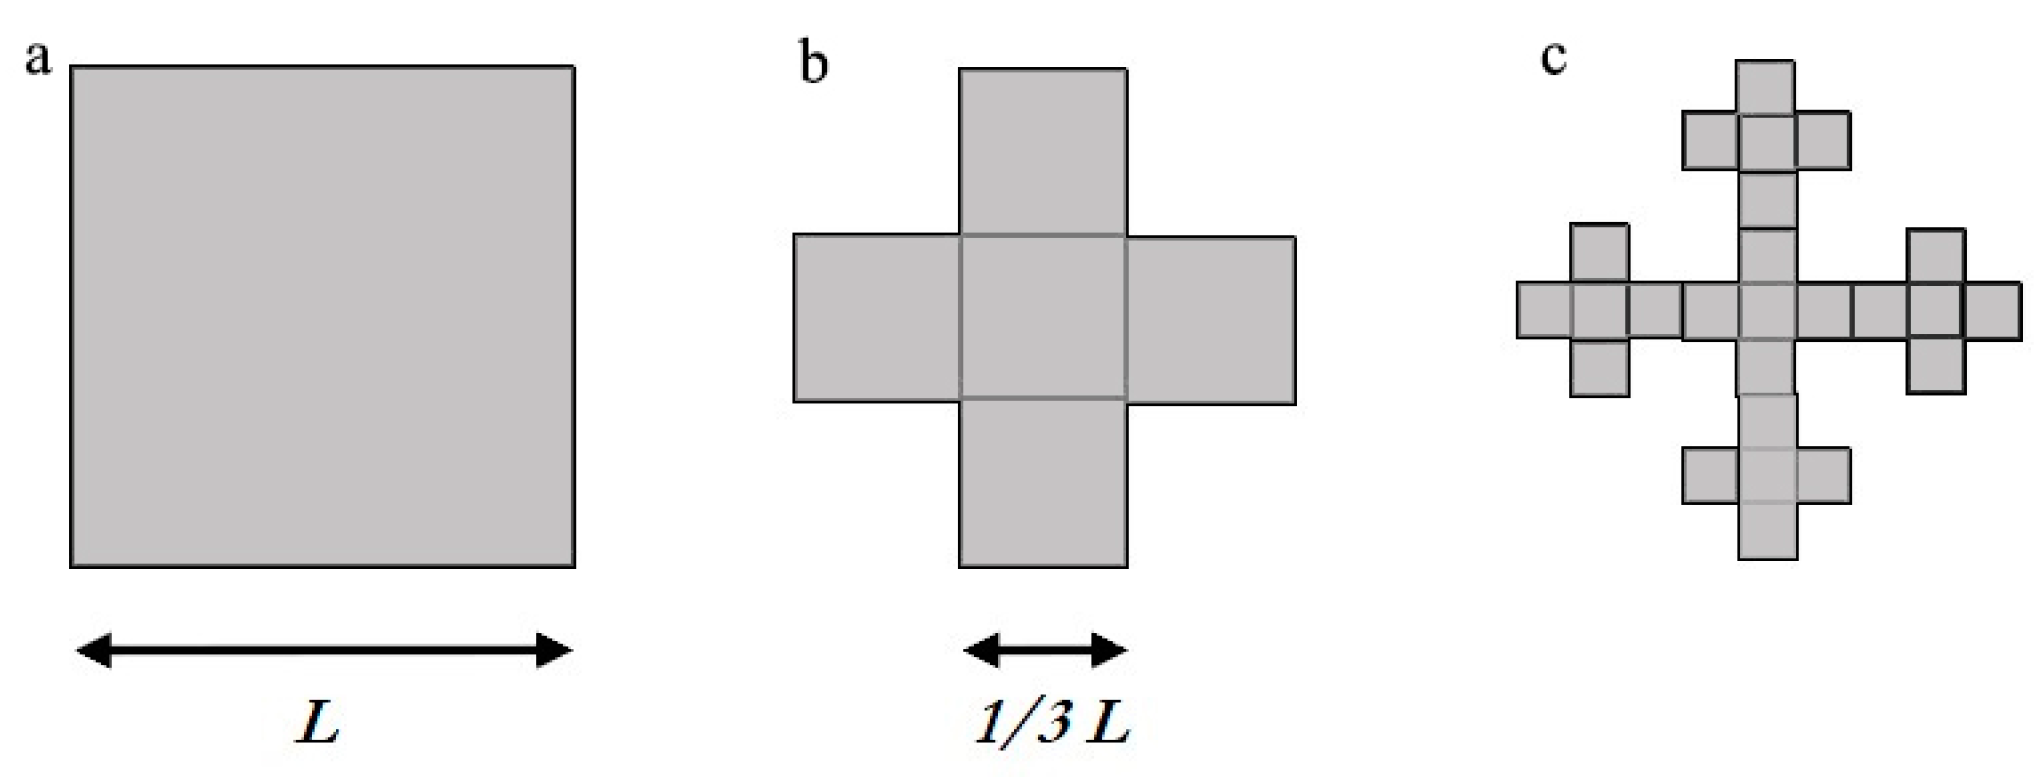
3.1. Fractals
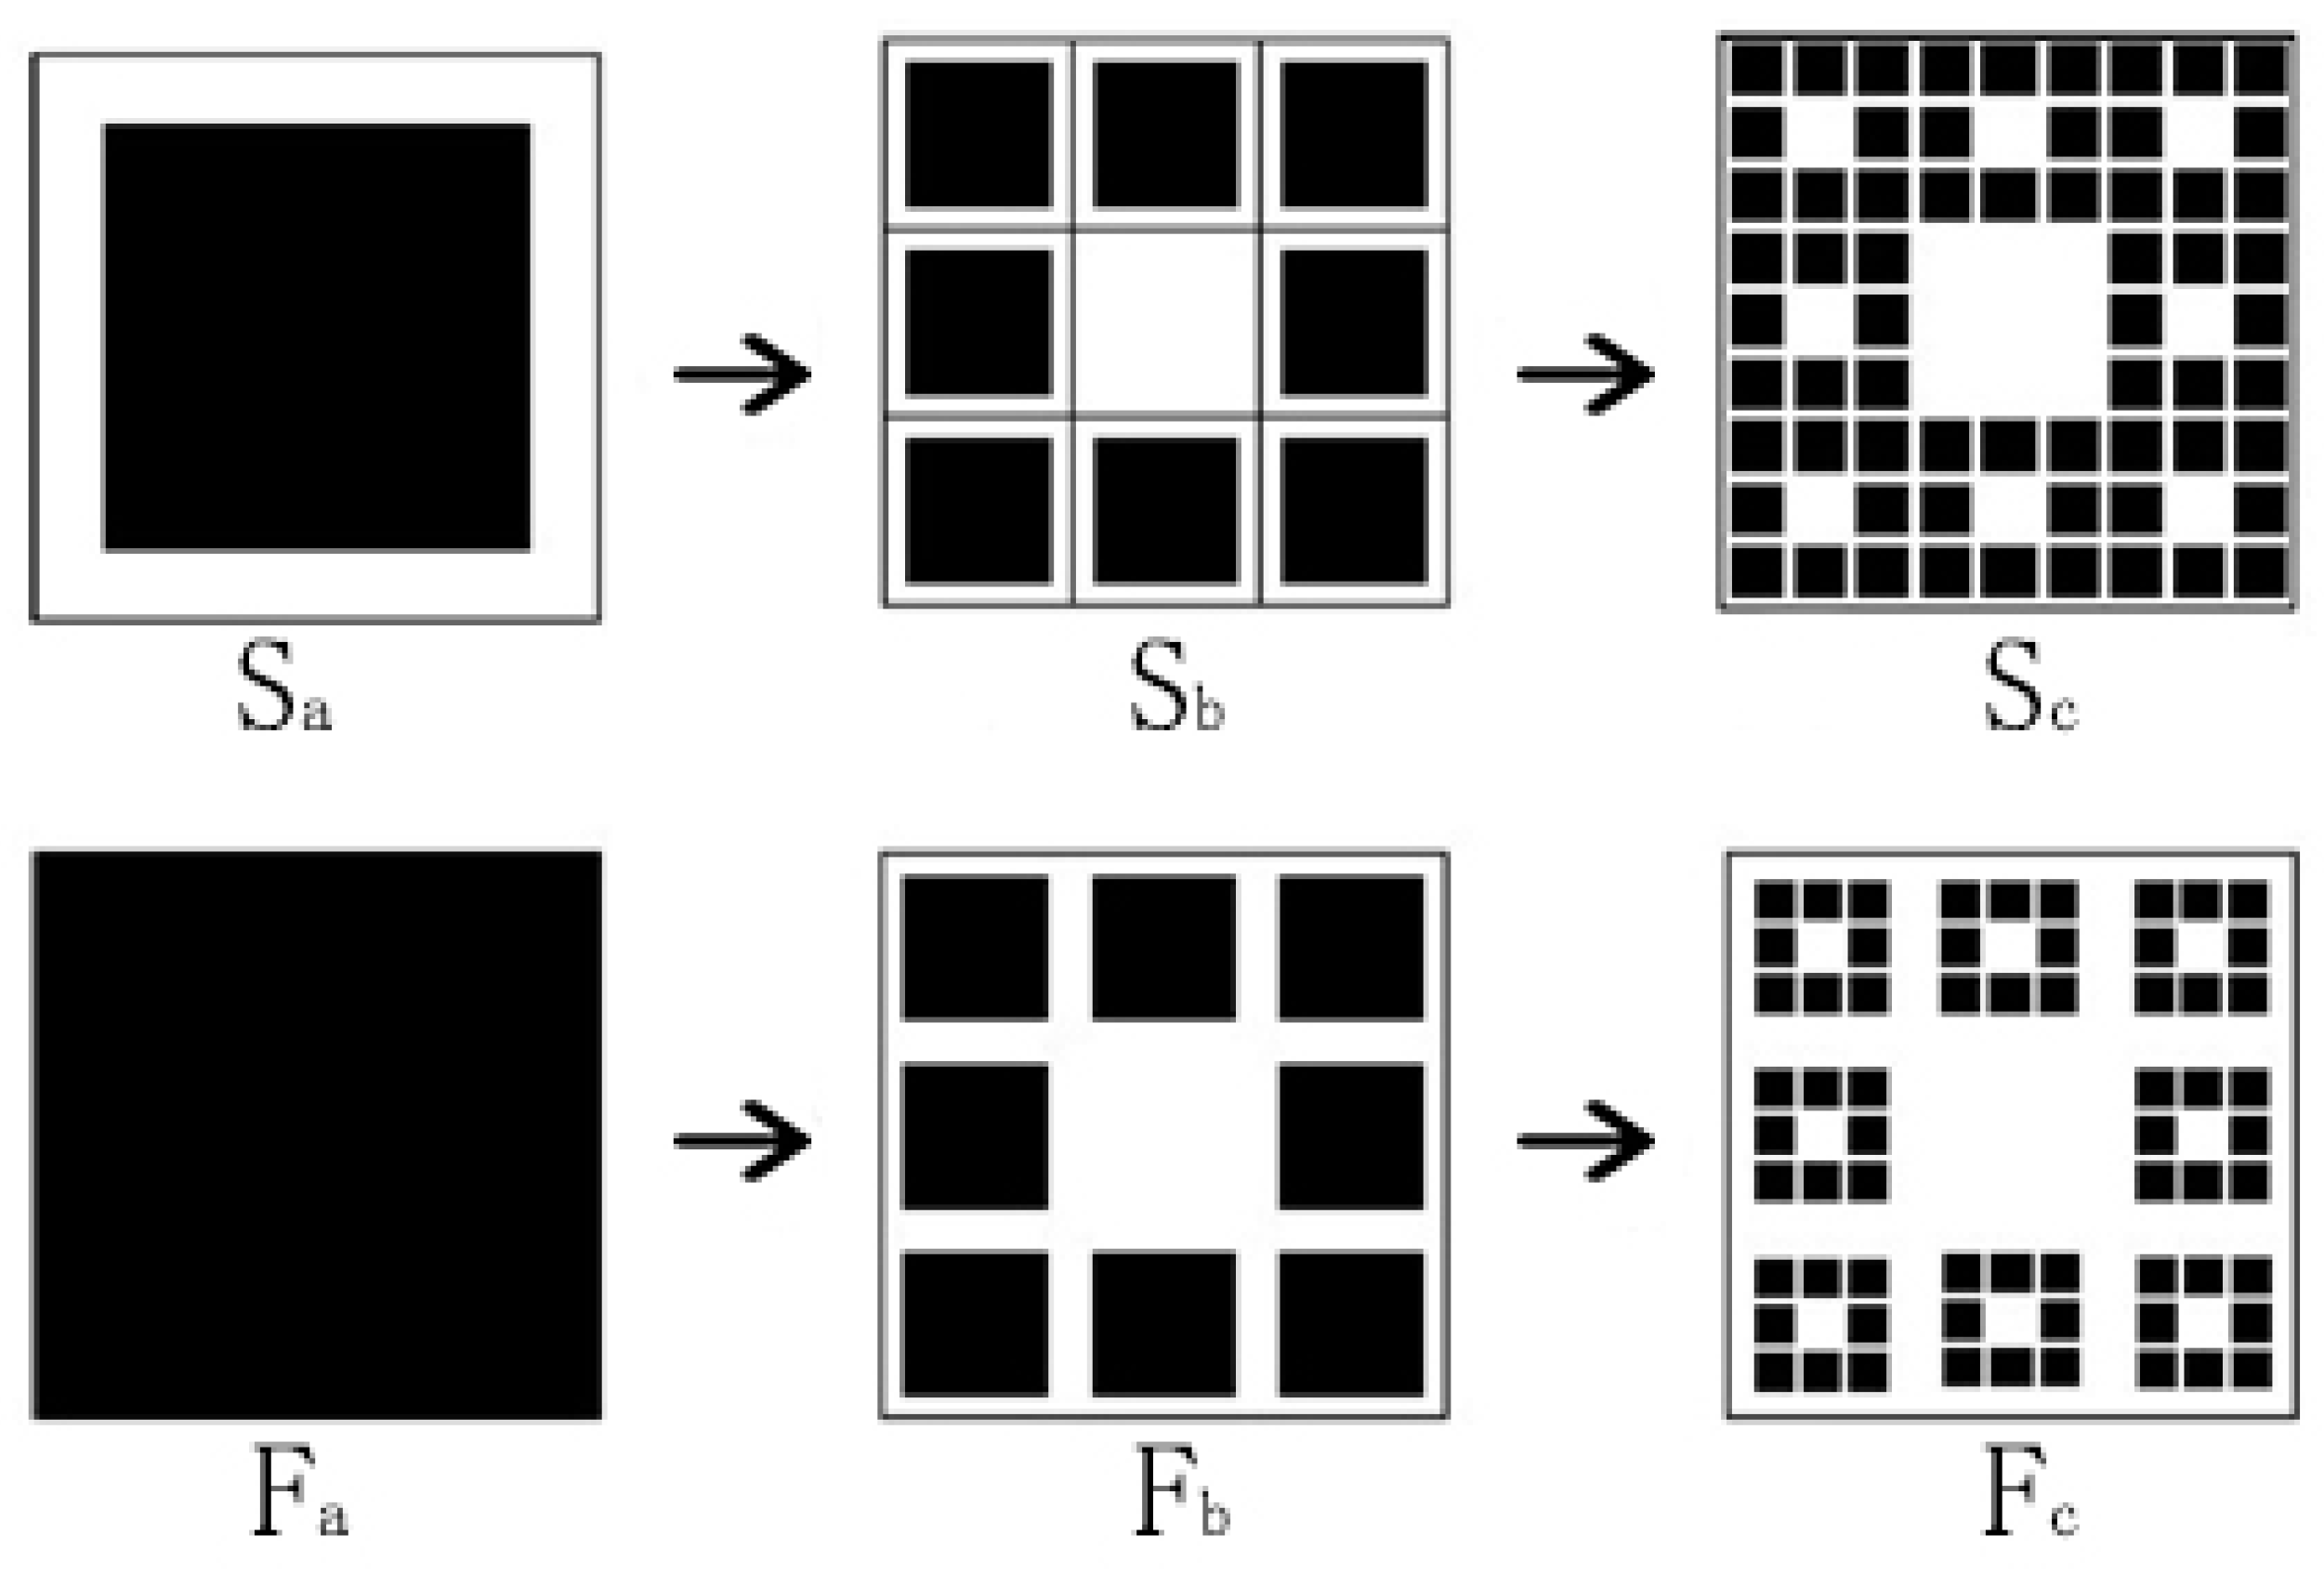
3.1.1. Fractal Models
3.1.2. Fractal Measurement
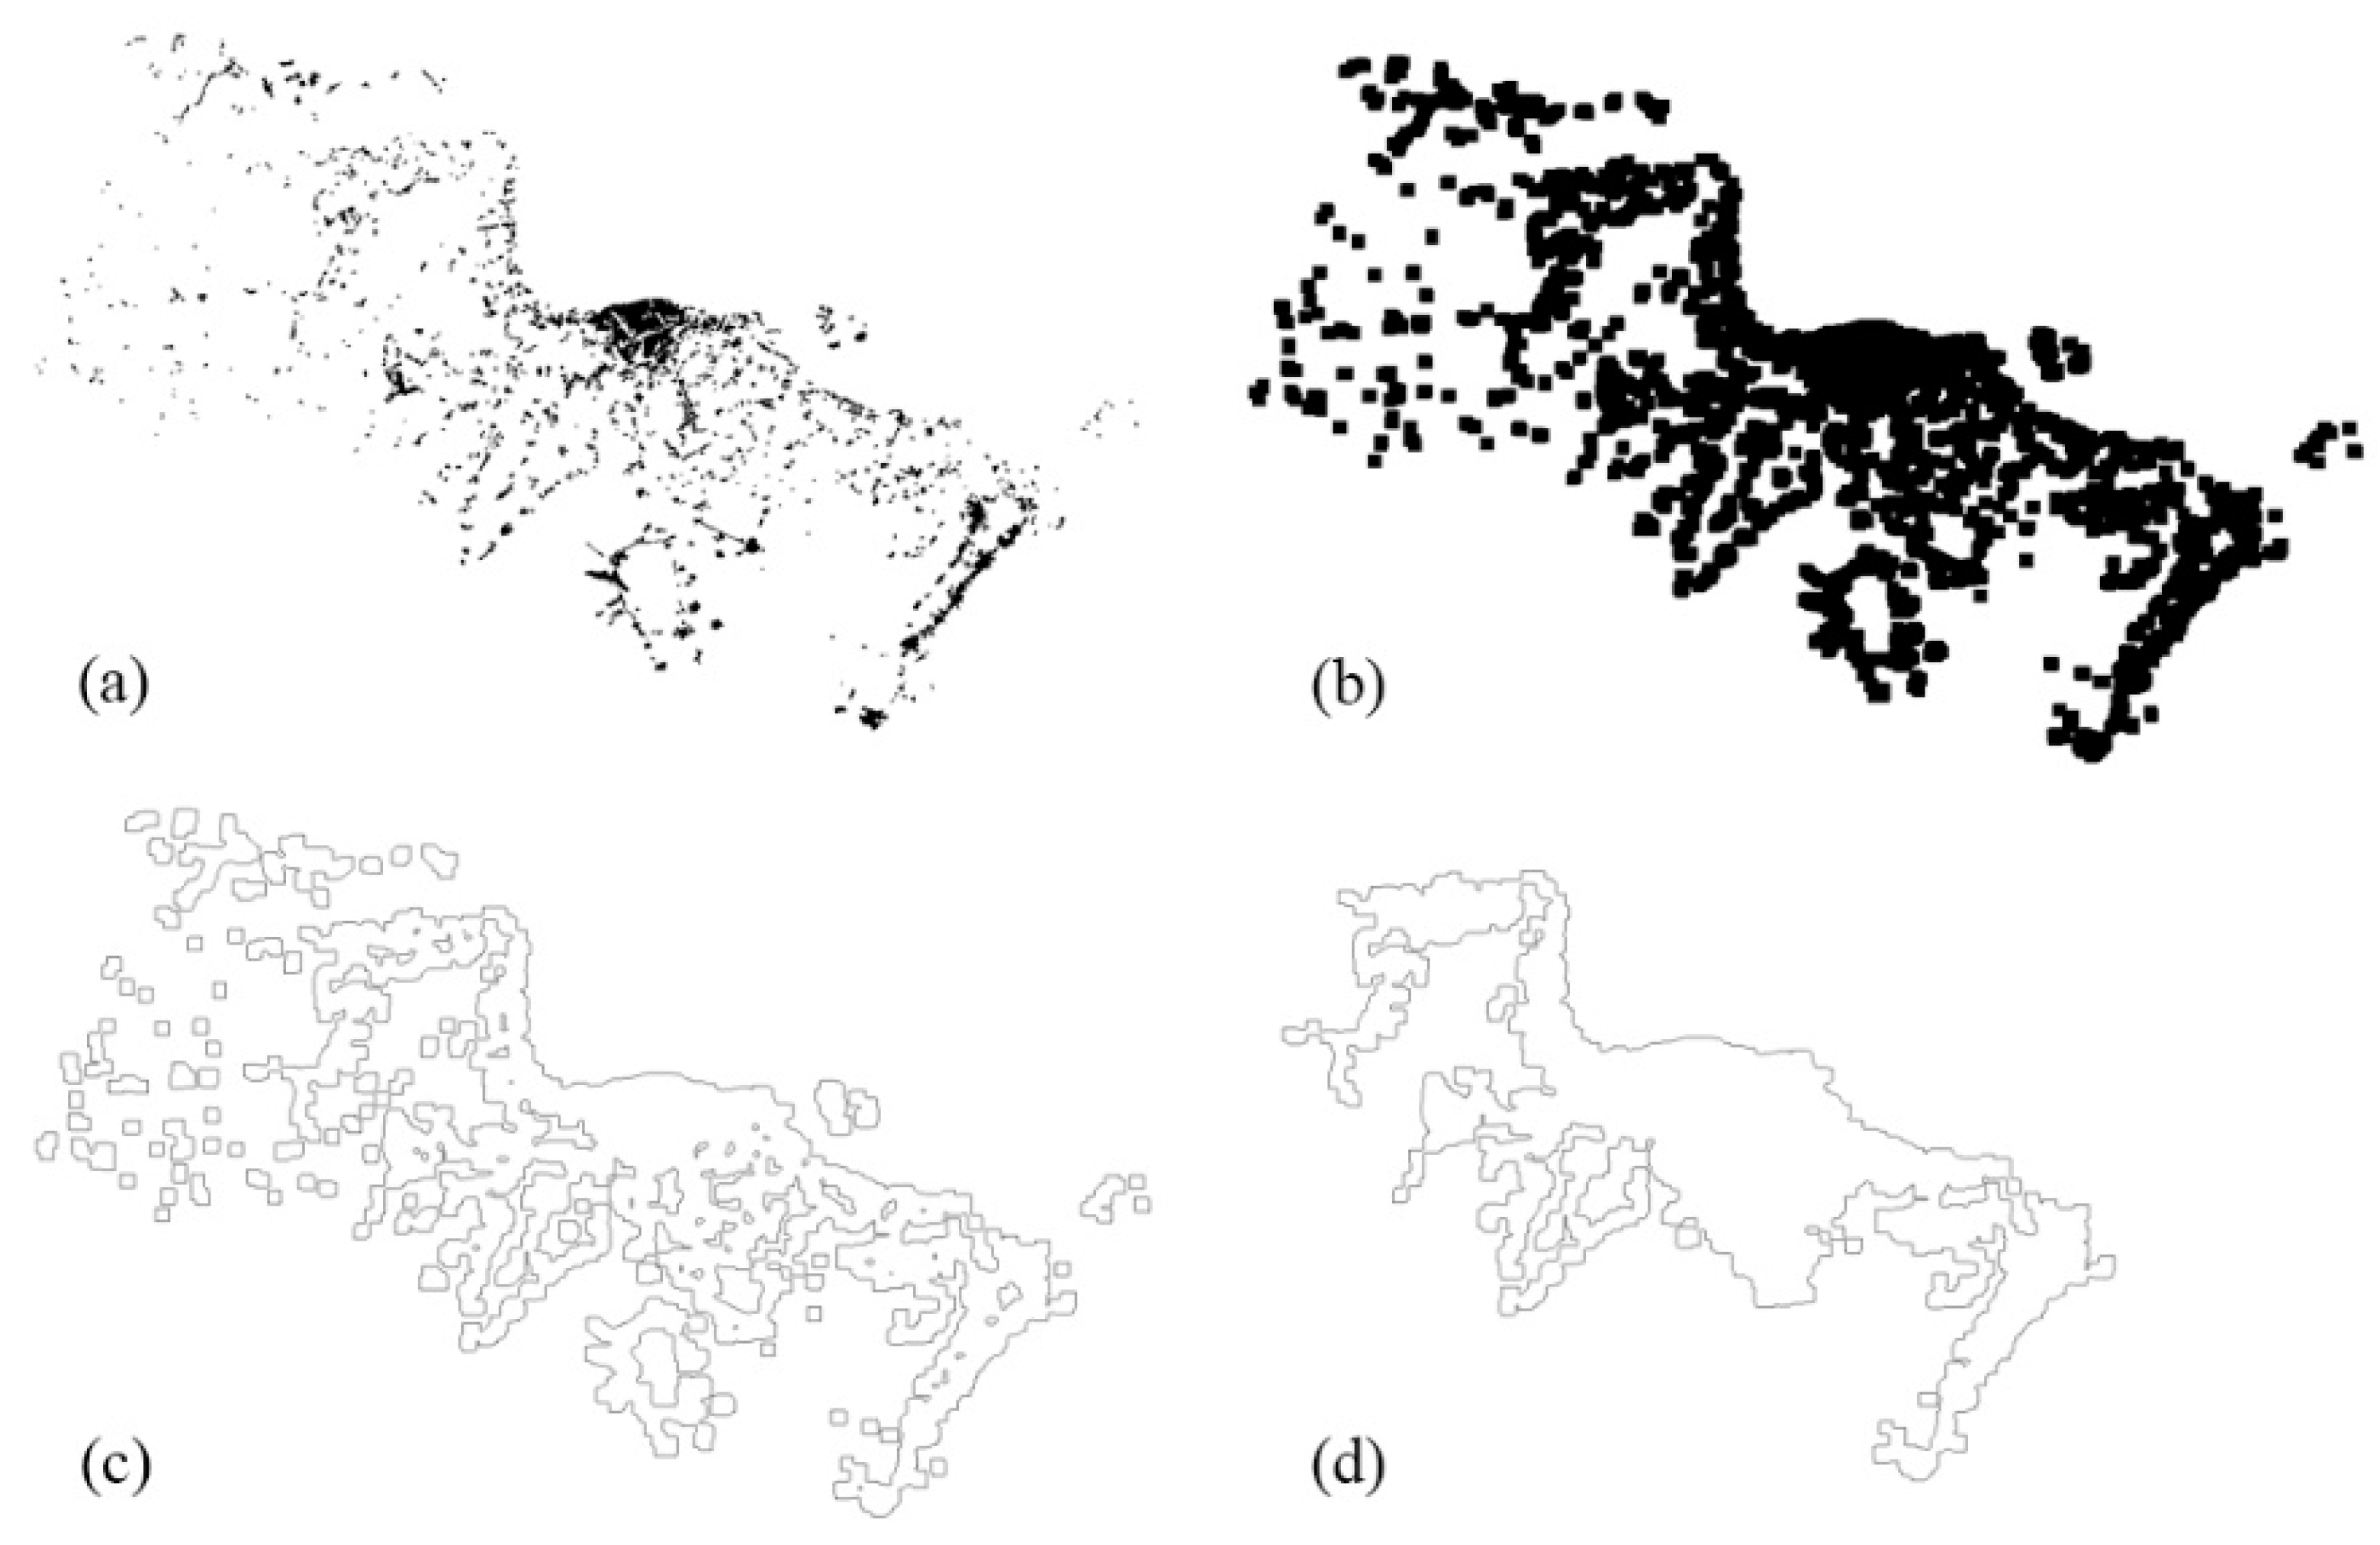
3.1.3. Surfaces and Borders
3.2. The Selected Indices
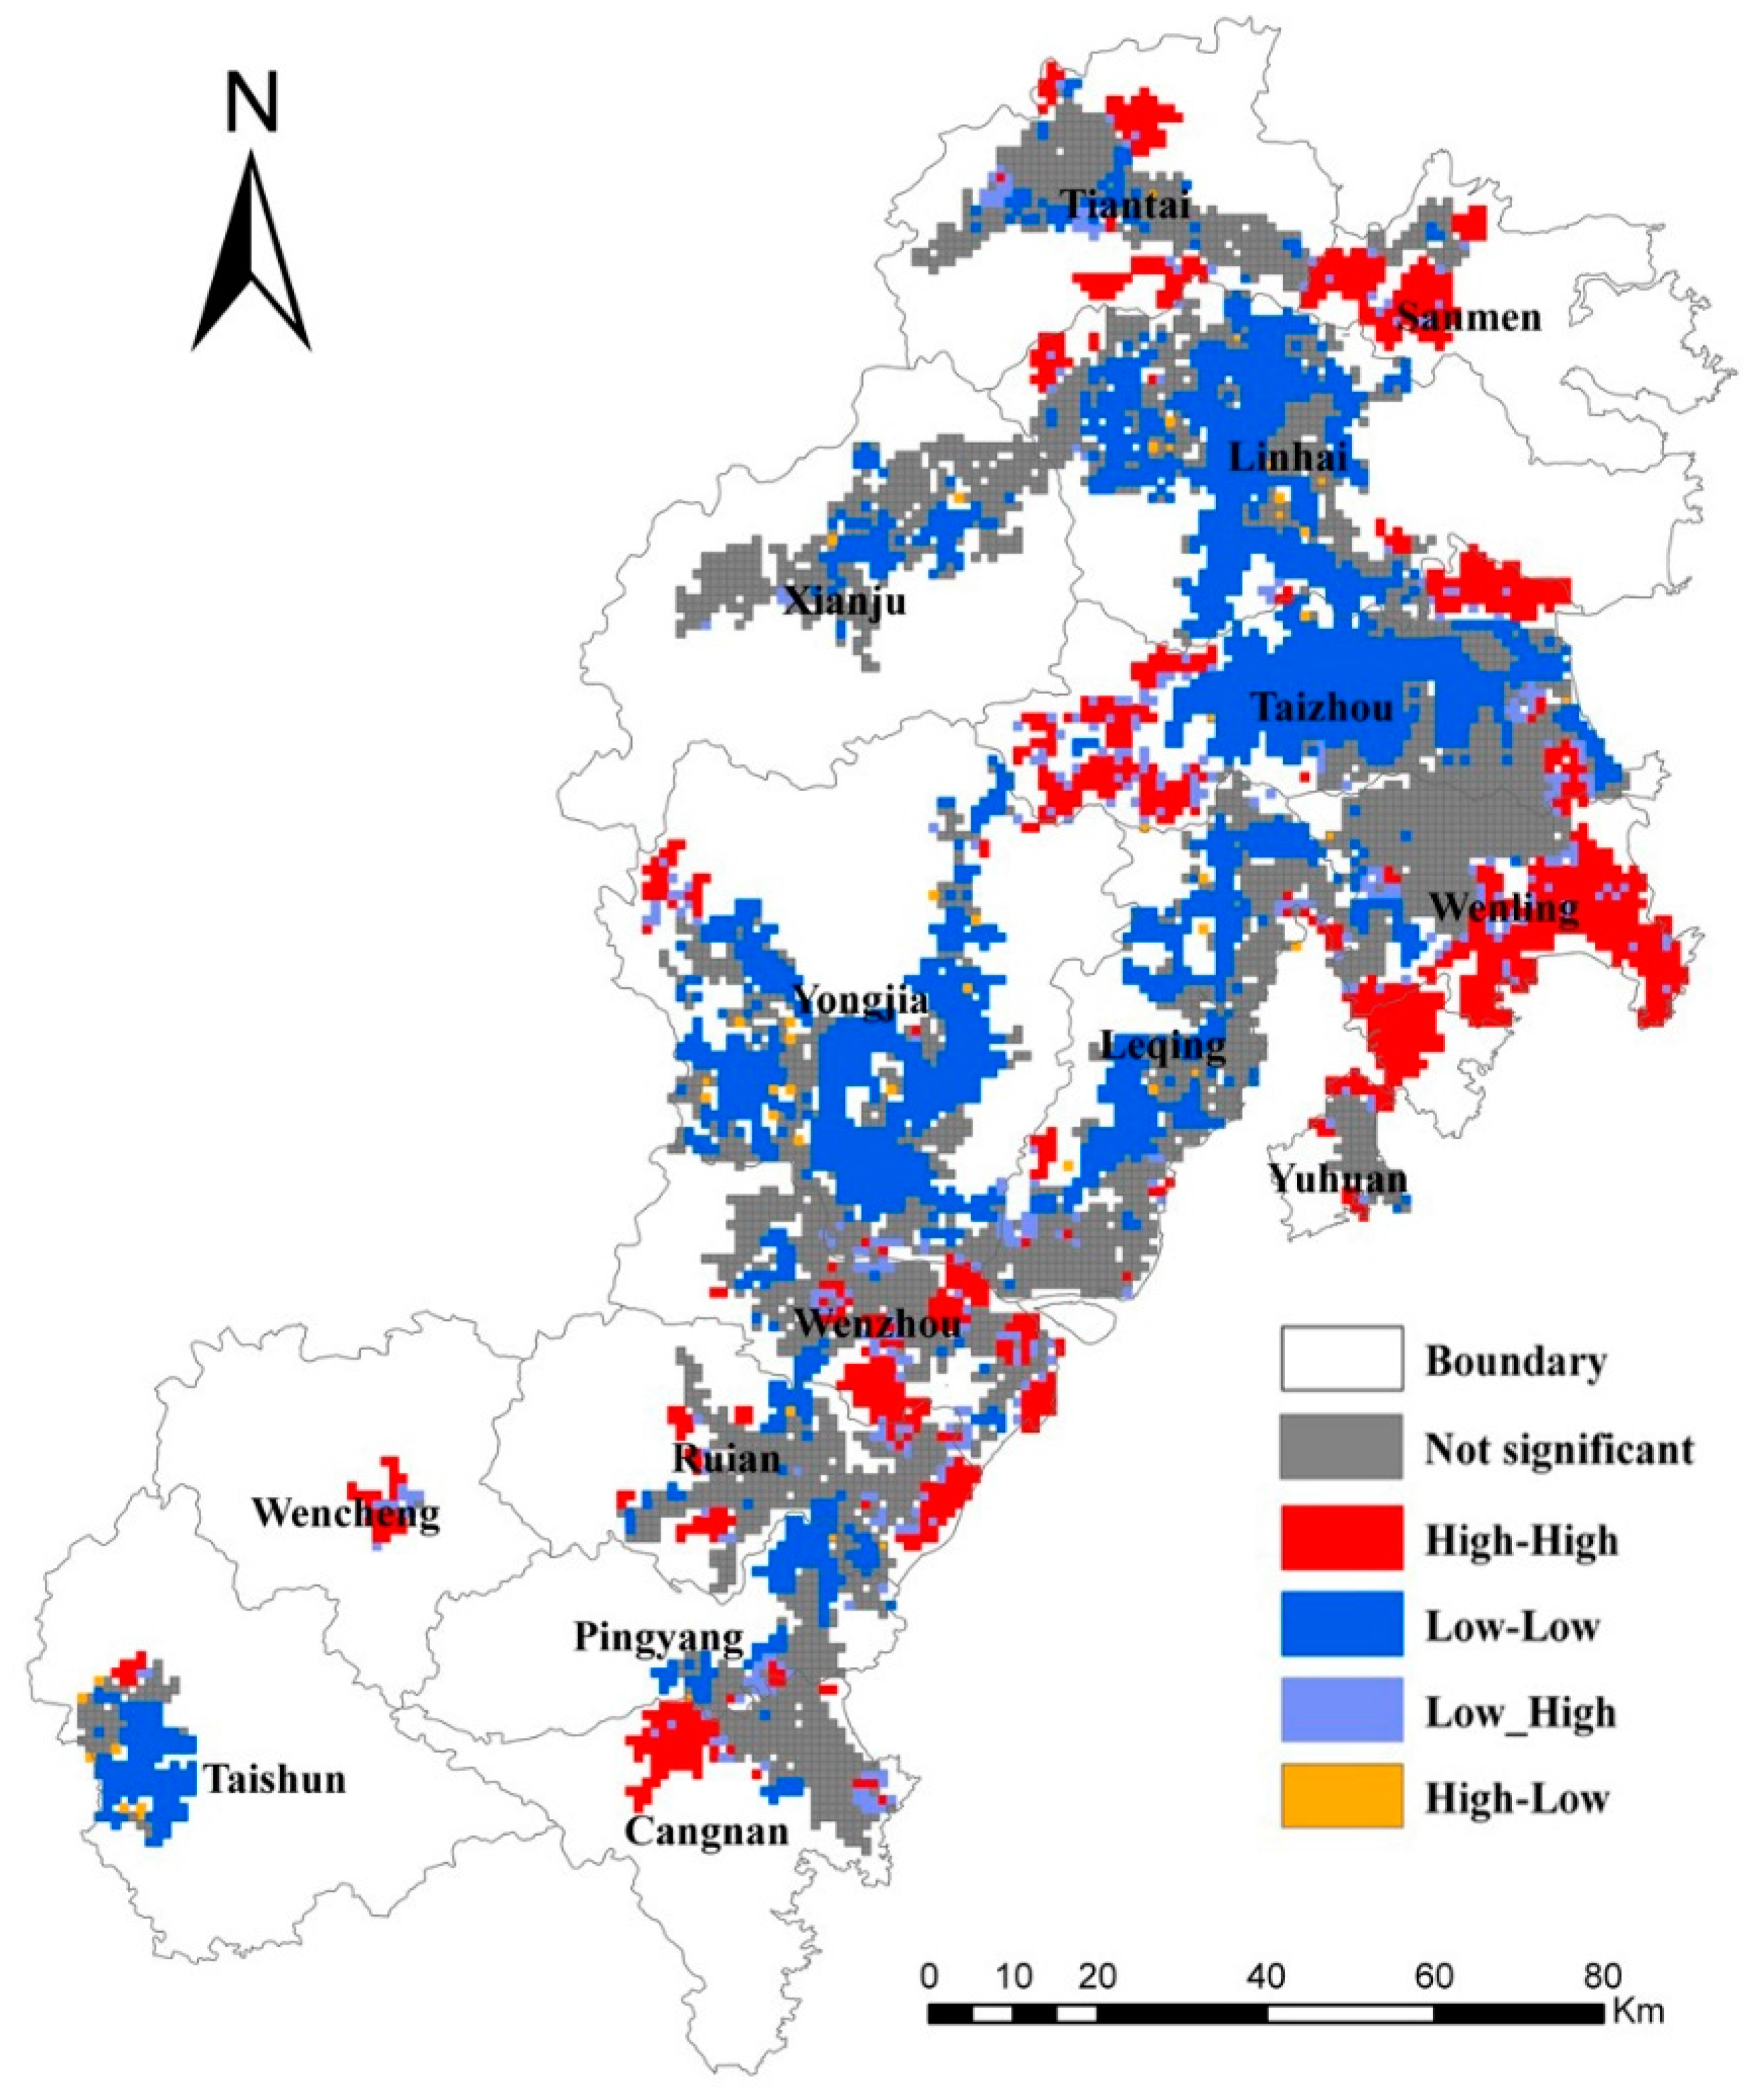
3.3. Spatial Analysis
4. Results
4.1. Spatiotemporal Patterns of Fractals
4.2. Fractal for Urban and Non-Urban Area
4.3. Impact of Built-Up Land Expansion on Fractal Dimension
5. Discussion
5.1. Characteristics of Fractal Dimension in Urban and Non-Urban Areas
5.2. Factors Associated with Built-Up Land Expansion Patterns
5.3. Management Implications
6. Conclusions
- (1)
- Fractal dimension values increased significantly during the ten years, which means that urban growth brought a more complex, scattered and disordered distribution of built-up land patches in Wen-Tai region. If this trend continues, complex and fragmented landscapes will increase rapidly with urbanization, which might lead to the inefficient usage of built-up land resources. Accordingly, the authors suggest that local government implement reasonable built-up land plans by balancing economic growth with the construction of settlements and industrial land in order to guide the city toward sustainable development.
- (2)
- Landscape shape index and GDP played a key role in determining the fractal dimension of urban area. There is a trend in China that governments pay much more attention on improving economics, but ignore the optimization of urban spatial patterns and land utilization structure. This study showed that the government should give more consideration to the reasonable planning of urban layouts during economic development rather than focusing only on the growth of GDP. In addition, the government should, in future urban planning, consider the impact of landscape shape index, which would play an important role in urban construction.
- (3)
- The application of spatial regression in analyzing the correlation between fractal dimension and its associated factors can also be used for other urban growth research on other spatial scales. Our study implies that long-term management should also be adopted by governments to control the development of urban growth.
- (4)
- This study also incorporates limitations. For one thing, the dataset covered a very limited temporal dimension. For another, the complex interactive relationships among land use and management were not considered. Further studies will be carried out regarding these points.
Acknowledgments
Author Contributions
Conflicts of Interest
References
- Huang, S.L.; Wang, S.H.; Budd, W.W. Sprawl in Taipei’s peri-urban zone: Responses to spatial planning and implications for adapting global environmental change. Landsc. Urban Plan. 2009, 90, 20–32. [Google Scholar] [CrossRef]
- Pickard, B.R.; Berkel, D.V.; Petrasova, A.; Meentemeyer, R.K. Forecasts of urbanization scenarios reveal trade-offs between landscape change and ecosystem services. Landsc. Ecol. 2017, 32, 617–634. [Google Scholar] [CrossRef]
- Guo, W.; Li, S.; Zhu, D. Modern geomorphological environment research during rapid urbanization in Shenzhen east coastal zone. J. Geogr. Sci. 2011, 21, 372–384. [Google Scholar] [CrossRef]
- Antrop, M. Changing patterns in the urbanized countryside of Western Europe. Landsc. Ecol. 2000, 15, 257–270. [Google Scholar] [CrossRef]
- Martinuzzi, S.; Gould, W.A.; González, O.M.R. Land development, land use, and urban sprawl in Puerto Rico integrating remote sensing and population census data. Landsc. Urban Plan. 2007, 79, 288–297. [Google Scholar] [CrossRef]
- Serres, A.; Delfour, F. Environmental changes and anthropogenic factors modulate social play in captive bottlenose dolphins (Tursiops truncatus). Zoo Biol. 2017, 36, 99–111. [Google Scholar] [CrossRef] [PubMed]
- Grimmond, S. Urbanization and global environmental change: Local effects of urban warming. Geogr. J. 2007, 173, 83–88. [Google Scholar] [CrossRef]
- Acácio, V.; Dias, F.S.; Catry, F.X.; Rocha, M.; Moreira, F. Landscape dynamics in Mediterranean oak forests under global change: Understanding the role of anthropogenic and environmental drivers across forest types. Glob. Chang. Biol. 2016, 23, 1199–1217. [Google Scholar] [CrossRef] [PubMed]
- Deng, J.S.; Wang, K.; Hong, Y.; Qi, J.G. Spatio-temporal dynamics and evolution of land use change and landscape pattern in response to rapid urbanization. Landsc. Urban Plan. 2009, 92, 187–198. [Google Scholar] [CrossRef]
- Yang, X.; Yue, W.; Xu, H.; Wu, J.; Yue, H. Environmental Consequences of Rapid Urbanization in Zhejiang Province, East China. Int. J. Environ. Res. Public Health 2014, 11, 7045–7059. [Google Scholar] [CrossRef] [PubMed]
- Zhang, Z.; Su, S.; Xiao, R.; Jiang, D.; Wu, J. Identifying determinants of urban growth from a multi-scale perspective: A case study of the urban agglomeration around Hangzhou Bay, China. Appl. Geogr. 2013, 45, 193–202. [Google Scholar] [CrossRef]
- Xiao, R.; Su, S.; Wang, J.; Zhang, Z.; Jiang, D.; Wu, J. Local spatial modeling of paddy soil landscape patterns in response to urbanization across the urban agglomeration around Hangzhou Bay, China. Appl. Geogr. 2013, 39, 158–171. [Google Scholar] [CrossRef]
- Ding, H.; Wang, R.C.; Wu, J.P.; Zhou, B.; Shi, Z.; Ding, L.X. Quantifying Land Use Change in Zhejiang Coastal Region, China Using Multi-Temporal Landsat TM/ETM + Images. Pedosphere 2007, 17, 712–720. [Google Scholar]
- Liu, Y.; Wang, L.; Long, H. Spatio-temporal analysis of land-use conversion in the eastern coastal China during 1996–2005. J. Geogr. Sci. 2008, 18, 274–282. [Google Scholar] [CrossRef]
- Hua, L.; Shao, G.; Zhao, J. A concise review of ecological risk assessment for urban ecosystem application associated with rapid urbanization processes. Int. J. Sustain. Dev. World Ecol. 2017, 24, 248–261. [Google Scholar] [CrossRef]
- Fan, F.; Wang, Y.; Qiu, M.; Wang, Z. Evaluating the Temporal and Spatial Urban Expansion Patterns of Guangzhou from 1979 to 2003 by Remote Sensing and GIS Methods. Int. J. Geogr. Inf. Sci. 2009, 23, 1371–1388. [Google Scholar] [CrossRef]
- Webster, C.J. Urban morphological fingerprints. Environ. Plan. B 1995, 23, 279–297. [Google Scholar] [CrossRef]
- Chen, Y.; Chang, K.T.; Han, F.; Karacsonyi, D.; Qian, Q. Investigating urbanization and its spatial determinants in the central districts of Guangzhou, China. Habitat Int. 2016, 51, 59–69. [Google Scholar] [CrossRef]
- Camagni, R.; Gibelli, M.C.; Rigamonti, P. Urban mobility and urban form: The social and environmental costs of different patterns of urban expansion. Ecol. Econ. 2002, 40, 199–216. [Google Scholar] [CrossRef]
- Batty, M.; Longley, P. Fractal Cities—A Geometry of Form and Function; Academic Press: New York, NY, USA, 1994. [Google Scholar]
- Harte, J.; Kinzig, A.; Green, J. Self-similarity in the distribution and abundance of species. Science 1999, 284, 334–336. [Google Scholar] [CrossRef] [PubMed]
- Batty, M.; Xie, Y. Preliminary evidence for a theory of the fractal city. Environ. Plan. A. 1996, 28, 1745–1762. [Google Scholar] [CrossRef]
- Ford, A.; Blenkinsop, T.G. Combining fractal analysis of mineral deposit clustering with weights of evidence to evaluate patterns of mineralization: Application to copper deposits of the Mount Isa Inlier, NW Queensland, Australia. Ore Geol. Rev. 2008, 33, 435–450. [Google Scholar] [CrossRef]
- Zhang, Z.; Xiao, R.; Shortridge, A.; Wu, J. Spatial Point Pattern Analysis of Human Settlements and Geographical Associations in Eastern Coastal China—A Case Study. Int. J. Environ. Res. Public Health 2014, 11, 2818–2833. [Google Scholar] [CrossRef] [PubMed]
- Zhang, Z.; Yang, X.; Xiao, R. Fractal Characterization of Settlement Patterns and Their Spatial Determinants in Coastal Zones. ISPRS Int. J. Geo-Inf. 2015, 4, 2728–2741. [Google Scholar] [CrossRef]
- Herold, M.; Goldstein, N.C.; Clarke, K.C. The spatiotemporal form of urban growth: Measurement, analysis and modeling. Remote Sens. Environ. 2003, 86, 286–302. [Google Scholar] [CrossRef]
- Zhou, X.; Wang, Y.C. Spatial-temporal dynamics of urban green space in response to rapid urbanization and greening policies. Landsc. Urban Plan. 2011, 100, 268–277. [Google Scholar] [CrossRef]
- Mandelbrot, B.B.; Wheeler, J.A. The Fractal Geometry of Nature; W.H. Freeman: New York, NY, USA, 1983; 468p. [Google Scholar]
- Emerson, C.W.; Lam, N.S.N.; Quattrochi, D.A. A comparison of local variance, fractal dimension, and Moran’s I as aids to multispectral image classification. Int. J. Remote Sens. 2005, 26, 1575–1588. [Google Scholar] [CrossRef]
- Frankhauser, P.; Tannier, C. A multi-scale morphological approach for delimiting urban areas. In Proceedings of the CUPUM 2005: 9th Computers in Urban Planning and Urban Management Conference, London, UK, 29 June–1 July 2005. [Google Scholar]
- Thomas, I.; Frankhauser, P.; Biernacki, C. The morphology of built-up landscapes in Wallonia (Belgium): A classification using fractal indices. Landsc. Urban Plan. 2008, 84, 99–115. [Google Scholar] [CrossRef]
- Keersmaecker, M.L.D.; Frankhauser, P.; Thomas, I. Using Fractal Dimensions for Characterizing Intra-urban Diversity: The Example of Brussels. Geogr. Anal. 2003, 35, 310–328. [Google Scholar] [CrossRef]
- Cai, B.; Zhang, Z.; Liu, B.; Zhou, Q. Spatial-temporal changes of Tianjin urban spatial morphology from 1978 to 2004. J. Geogr. Sci. 2007, 17, 500–510. [Google Scholar] [CrossRef]
- Shen, G. Fractal dimension and fractal growth of urbanized areas. Int. J. Geogr. Inf. Sci. 2002, 16, 419–437. [Google Scholar] [CrossRef]
- Zhao, Y.Z.; Zou, X.Y.; Cheng, H.; Jia, H.K.; Wu, Y.Q.; Wang, G.Y.; Zhang, C.L.; Gao, S.Y. Assessing the ecological security of the Tibetan plateau: Methodology and a case study for Lhaze County. J. Environ. Manag. 2006, 80, 120–131. [Google Scholar] [CrossRef] [PubMed]
- Dibari, J.N. Evaluation of five landscape-level metrics for measuring the effects of urbanization on landscape structure: The case of Tucson, Arizona, USA. Landsc. Urban Plan. 2007, 79, 308–313. [Google Scholar] [CrossRef]
- Dewan, A.M.; Yamaguchi, Y. Land use and land cover change in Greater Dhaka, Bangladesh: Using remote sensing to promote sustainable urbanization. Appl. Geogr. 2009, 29, 390–401. [Google Scholar] [CrossRef]
- Jiang, L.; Deng, X.; Seto, K.C. The impact of urban expansion on agricultural land use intensity in China. Land Use Policy 2013, 35, 33–39. [Google Scholar] [CrossRef]
- Braimoh, A.K.; Onishi, T. Spatial determinants of urban land use change in Lagos, Nigeria. Land Use Policy 2007, 24, 502–515. [Google Scholar] [CrossRef]
- Jenerette, G.D.; Harlan, S.L.; Brazel, A.; Jones, N.; Larsen, L.; Stefanov, W.L. Regional relationships between surface temperature, vegetation, and human settlement in a rapidly urbanizing ecosystem. Landsc. Ecol. 2007, 22, 353–365. [Google Scholar] [CrossRef]
- Li, X.; Zhou, W.; Ouyang, Z. Forty years of urban expansion in Beijing: What is the relative importance of physical, socioeconomic, and neighborhood factors? Appl. Geogr. 2013, 38, 1–10. [Google Scholar] [CrossRef]
- Gustafson, E.J.; Hammer, R.B.; Radeloff, V.C.; Potts, R.S. The Relationship between Environmental Amenities and Changing Human Settlement Patterns between 1980 and 2000 in the Midwestern USA. Landsc. Ecol. 2005, 20, 773–789. [Google Scholar] [CrossRef]
- Pijanowski, B.C.; Tayyebi, A.; Delavar, M.R.; Yazdanpanah, M.J. Urban Expansion Simulation Using Geospatial Information System and Artificial Neural Networks. Int. J. Environ. Res. 2010, 3, 493–502. [Google Scholar]
- Coste, J.; Bouée, S.; Ecosse, E.; Leplège, A.; Pouchot, J. Methodological issues in determining the dimensionality of composite health measures using principal component analysis: Case illustration and suggestions for practice. Qual. Life Res. 2005, 14, 641–654. [Google Scholar] [CrossRef] [PubMed]
- Li, J.J.; Wang, X.R.; Wang, X.J.; Ma, W.C.; Zhang, H. Remote sensing evaluation of urban heat island and its spatial pattern of the Shanghai metropolitan area, China. Ecol. Complex. 2009, 6, 413–420. [Google Scholar] [CrossRef]
- Anselin, L.; Syabri, I.; Kho, Y. GeoDa: An Introduction to Spatial Data Analysis. Geogr. Anal. 2006, 38, 5–22. [Google Scholar] [CrossRef]
- Anselin, L. Local Indicators of Spatial Association—LISA. Geogr. Anal. 1995, 27, 93–115. [Google Scholar] [CrossRef]
- Chen, Y. Fractal dimension evolution and spatial replacement dynamics of urban growth. Chaos Solitons Fractals 2012, 45, 115–124. [Google Scholar] [CrossRef]
- Seto, K.C.; Fragkias, M. Quantifying Spatiotemporal Patterns of Urban Land-use Change in Four Cities of China with Time Series Landscape Metrics. Landsc. Ecol. 2005, 20, 871–888. [Google Scholar] [CrossRef]
- Salvati, L. Assessing Polycentric Urban Growth through a Mathematic Morphology Approach. Int. J. Ecol. Econ. Stat. 2015, 36, 44–56. [Google Scholar]
- Feng, J.; Chen, Y. Spatiotemporal evolution of urban form and land-use structure in Hangzhou, China: Evidence from fractals. Environ. Plan. B 2010, 37, 838–856. [Google Scholar] [CrossRef]
- Chen, Y. Derivation of the functional relations between fractal dimension of and shape indices of urban form. Comput. Environ. Urban Syst. 2011, 35, 442–451. [Google Scholar] [CrossRef]
- Terzi, F.; Kaya, H.S. Dynamic spatial analysis of urban sprawl through fractal geometry: The case of Istanbul. Environ. Plan. B 2011, 38, 175–190. [Google Scholar] [CrossRef]
- Fang, C.; Song, J.; Song, D.; Fang, C.; Song, J. Stability of Spatial Structure of Urban Agglomeration in China Based on Central Place Theory. Chin. Geogr. Sci. 2007, 17, 193–202. [Google Scholar] [CrossRef]
- Ma, R.; Gu, C.; Pu, Y.; Ma, X. Mining the Urban Sprawl Pattern: A Case Study on Sunan, China. Sensors 2008, 8, 6371–6395. [Google Scholar] [CrossRef] [PubMed]


| Item | Category | Indices | Abbreviation |
|---|---|---|---|
| Landscape metrics | Area | Total Area | TA |
| Density and size | Patch Density | PD | |
| Largest Patch Index | LPI | ||
| Edge | Total Edge | TE | |
| Edge Density | ED | ||
| Shape | Landscape Shape Index | LSI | |
| Isolation | Connective Index | CI | |
| Diversity | Shannon’s Diversity Index | SDI | |
| Social-economics | Social | Total Population | TP |
| Non-agricultural Population | NAP | ||
| Economic | Gross Domestic Product | GDP | |
| Natural | Topographic | Elevation | Ele |
| Slope | Slp |
| Study Area | Urban | Non-Urban | ||||||
|---|---|---|---|---|---|---|---|---|
| DSurf | DBord | Ratio | DSurf | |||||
| 1994 | 2003 | 1994 | 2003 | 1994 | 2003 | 1994 | 2003 | |
| Wenzhou | 1.45 | 1.57 | 1.24 | 1.29 | 0.86 | 0.82 | 1.07 | 1.10 |
| Yongjia | 1.29 | 1.33 | 1.12 | 1.10 | 0.87 | 0.83 | 1.14 | 1.16 |
| Pingyang | 1.31 | 1.36 | 1.09 | 1.11 | 0.83 | 0.82 | 1.04 | 1.16 |
| Cangnan | 1.27 | 1.37 | 1.05 | 1.09 | 0.83 | 0.80 | 1.14 | 1.12 |
| Wencheng | 1.24 | 1.27 | 1.36 | 1.25 | 1.10 | 0.98 | 1.06 | 1.23 |
| Taishun | 1.22 | 1.26 | 1.1 | 1.09 | 0.90 | 0.87 | 1.04 | 1.18 |
| Ruian | 1.41 | 1.45 | 1.08 | 1.13 | 0.77 | 0.78 | 0.97 | 1.09 |
| Leqing | 1.37 | 1.42 | 1.1 | 1.14 | 0.80 | 0.80 | 0.91 | 0.92 |
| Taizhou | 1.44 | 1.47 | 1.25 | 1.12 | 0.87 | 0.76 | 1.10 | 0.67 |
| Yuhuan | 1.21 | 1.41 | 1.14 | 1.11 | 0.94 | 0.79 | 1.26 | 1.26 |
| Sanmen | 1.20 | 1.37 | 1.14 | 1.06 | 0.95 | 0.77 | 1.31 | 1.34 |
| Tiantai | 1.33 | 1.38 | 1.04 | 1.04 | 0.78 | 0.75 | 1.14 | 1.12 |
| Xianju | 1.27 | 1.33 | 1.06 | 1.11 | 0.83 | 0.83 | 1.08 | 1.10 |
| Wenling | 1.48 | 1.51 | 1.05 | 1.06 | 0.71 | 0.70 | 1.17 | 0.87 |
| Linhai | 1.40 | 1.44 | 1.19 | 1.08 | 0.85 | 0.75 | 1.18 | 1.24 |
| Year | Y | X | Spatial Regression Models | R2 |
|---|---|---|---|---|
| 1994 | Urban | LSI c | Y = 1.093 × X + 0.302 × WY − 0.196 | 0.64 ** |
| LPI c | Y = −0.366 × X + 0.841 × WY + 0.154 | 0.51 ** | ||
| ED c | Y = 0.104 × X + 0.909 × WY − 0.006 | 0.63 ** | ||
| GDP c | Y = 0.949 × X + 0.424 × WY − 0.042 | 0.72 ** | ||
| Non-urban | TE c | Y = 0.635 × X + 0.549 × WY + 0.009 | 0.65 ** | |
| ED c | Y = −0.271 × X + 0.855 × WY + 0.159 | 0.56 ** | ||
| Slp_std b | Y = −0.575 × X + 0.875 (lambda = 0.277) | 0.53 ** | ||
| 2003 | Urban | LSI c | Y = 0.891 × X + 0.284 × WY − 0.130 | 0.66 ** |
| PD c | Y = −0.480 × X + 0.835 × WY + 0.209 | 0.63 ** | ||
| GDP b | Y = 0.781 × X + 0.218 (lambda = 0.695) | 0.74 ** | ||
| Ele_mean c | Y = −0.676 × X + 0.645 × WY + 0.384 | 0.67 ** | ||
| Non-urban | TE c | Y = 0.650 × X + 0.590 × WY + 0.046 | 0.61 ** | |
| LSI c | Y = 0.724 × X + 0.570 × WY − 0.096 | 0.75 ** | ||
| CI c | Y = −0.811 × X + 0.229 × WY + 0.634 | 0.72 ** | ||
| AP b | Y = −0.451 × X + 0.858 (lambda = 0.501) | 0.51 ** |
© 2017 by the authors. Licensee MDPI, Basel, Switzerland. This article is an open access article distributed under the terms and conditions of the Creative Commons Attribution (CC BY) license (http://creativecommons.org/licenses/by/4.0/).
Share and Cite
Zhang, Z.; Xiao, R.; Yu, W.; Liu, Y.; Lin, M.; Wang, M. Characterizing Factors Associated with Built-Up Land Expansion in Urban and Non-Urban Areas from a Morphological Perspective. Sustainability 2017, 9, 1411. https://doi.org/10.3390/su9081411
Zhang Z, Xiao R, Yu W, Liu Y, Lin M, Wang M. Characterizing Factors Associated with Built-Up Land Expansion in Urban and Non-Urban Areas from a Morphological Perspective. Sustainability. 2017; 9(8):1411. https://doi.org/10.3390/su9081411
Chicago/Turabian StyleZhang, Zhonghao, Rui Xiao, Weixuan Yu, Yue Liu, Meng Lin, and Meng Wang. 2017. "Characterizing Factors Associated with Built-Up Land Expansion in Urban and Non-Urban Areas from a Morphological Perspective" Sustainability 9, no. 8: 1411. https://doi.org/10.3390/su9081411
APA StyleZhang, Z., Xiao, R., Yu, W., Liu, Y., Lin, M., & Wang, M. (2017). Characterizing Factors Associated with Built-Up Land Expansion in Urban and Non-Urban Areas from a Morphological Perspective. Sustainability, 9(8), 1411. https://doi.org/10.3390/su9081411