Analysis of Solar Radiation Shading Effects by Trees in the Open Space around Buildings


1
Department of Architecture, Kobe University, Rokkodai, Nada, Kobe 657-8501, Japan
2
Department of Facility Design, Nikken Sekkei Ltd., Koraibashi, Chuo, Osaka 541-8528, Japan
3
Construction Administration Section, Nikken Sekkei Ltd., Koraibashi, Chuo, Osaka 541-8528, Japan
*
Author to whom correspondence should be addressed.
Sustainability 2017, 9(8), 1398; https://doi.org/10.3390/su9081398
Submission received: 3 July 2017
/
Revised: 29 July 2017
/
Accepted: 3 August 2017
/
Published: 8 August 2017
(This article belongs to the Special Issue Vegetated Roofs and Walls)
Abstract
:Work and leisure in outdoor spaces influences people’s physiological and psychological, while it can also lead to a reduction of energy consumed via air conditioning and lighting. In this study, the effects of solar radiation shading by trees in the open space around buildings on microclimatic development and pedestrian radiation environment are evaluated through a case study on the redevelopment buildings in front of Central Osaka Station, based on both observation and calculation. In both open space and green garden, direct solar radiation is shielded mainly by the buildings located behind the trees rather than by the trees themselves. Solar radiation shielding by trees is necessary in the range of more than 10 m from the south side of the buildings and more than 6 m from the west or east sides of the buildings.
1. Introduction
In certain areas, global warming and the urban heat island effect can expose people living in cities to intense heat. While various mitigation measures of global warming and the urban heat island phenomenon have already been implemented, adaptation measures that improve the human thermal environment are noted since the effect of global warming is a concern in the future. However, people spend a lot of time in climate-controlled rooms and are not exposed to the outside environment. Therefore, adaptation measures do not need to be implemented in all spaces in the city. Takebayashi et al. [1] carried out a study on priority locations of countermeasures in urban spaces and prioritized the northern side of wider roads running east-west as well as the center of wider roads running north-south.
Several studies have been carried out with the aim of improving the thermal environment and air quality in urban canopy areas. The following four priorities were noted by Oke [2] regarding the planning and design of urban canopies: (1) to maximize shelter, to ensure the safety and comfort of pedestrians, (2) to maximize the dispersion of pollutants, to minimize negative impacts on receptors such as people or vegetation, (3) to maximize urban warmth, to reduce pedestrian discomfort and the need for space heating in the building, and (4) to maximize solar access, to make best use of solar energy. The importance of solar access was also studied by Arnfield [3]. Eliasson [4] pointed out that some surface temperature variations in urban canyons may be explained by the sky view factor. Outdoor thermal comfort in urban street canyons with various shapes and orientations has been studied by Ali-Toudert et al. [5,6], who found that shading is the key strategy for mitigating heat stress outdoors under hot summer conditions. The percentage and position of shaded areas in an open space which depend on sun position and urban morphology was analyzed by Martinelli et al. [7]. Shading of trees significantly influences human thermal comfort, expressed by Physiological Equivalent Temperature (PET), and has been studied by Abreu-Harbich et al. [8]. The spatial distribution of thermal conditions at street level depends strongly on aspect ratio and street orientation, as shown by Algeciras et al. [9]. The impact of trees on human thermal comfort has been quantified for a heat wave day by Lee et al. [10]. The impact of different vegetation species on the outdoor thermal environment has been evaluated using a numerical simulation by S. Zheng et al. [11]. In addition, the recently proposed UTCI (Universal thermal climate index) presents a more complex heat budget-based approach and has been increasingly used by bio-meteorological researchers [12,13]. From these previous studies, it has been shown that solar radiation shielding, reduction of surface temperature, and improvement of ventilation are effective for the improvement of thermal comfort in urban street canyons. In our previous study (Aoyama et al. [14]), we concluded that, based on our measurement results, the improvement of Mean Radiant Temperature (MRT) is the most significant factor for improving the daytime outdoor thermal environment.
Work and leisure in outdoor spaces influences people’s physiological and psychological health, while it can also lead to a reduction of energy consumed via air conditioning and lighting, by using outdoor spaces rather than indoor spaces. Several urban heat island measurement technologies such as green cover and water surface are applied to the redevelopment buildings in front of Central Osaka Station, in Osaka, Japan. Akagawa et al. [15] analyzed the outdoor thermal environment of a rooftop garden on a large commercial building. In subsequent research, they also compared Standard new Effective Temperature (SET*) at an area shielded by objects, trees, and semi-open spaces in a large, artificial green space. SET* was found to be lower in semi-open spaces in the morning and evening, and in spaces shielded by trees during the daytime. The purpose of this study is to evaluate the effects of solar radiation shading by trees in the open space around the building on microclimatic development and pedestrian radiation environment through a case study on the redevelopment buildings in front of Central Osaka Station, based on both observation and calculation. The possibility of practical environmental design is discussed by analyzing the actual environment in the outdoor space of the large redevelopment plan in the city center, based on the measurement and calculation of solar radiation shading effects by both trees and buildings.
2. Outline of Objective Site, Measurement and Calculation Method
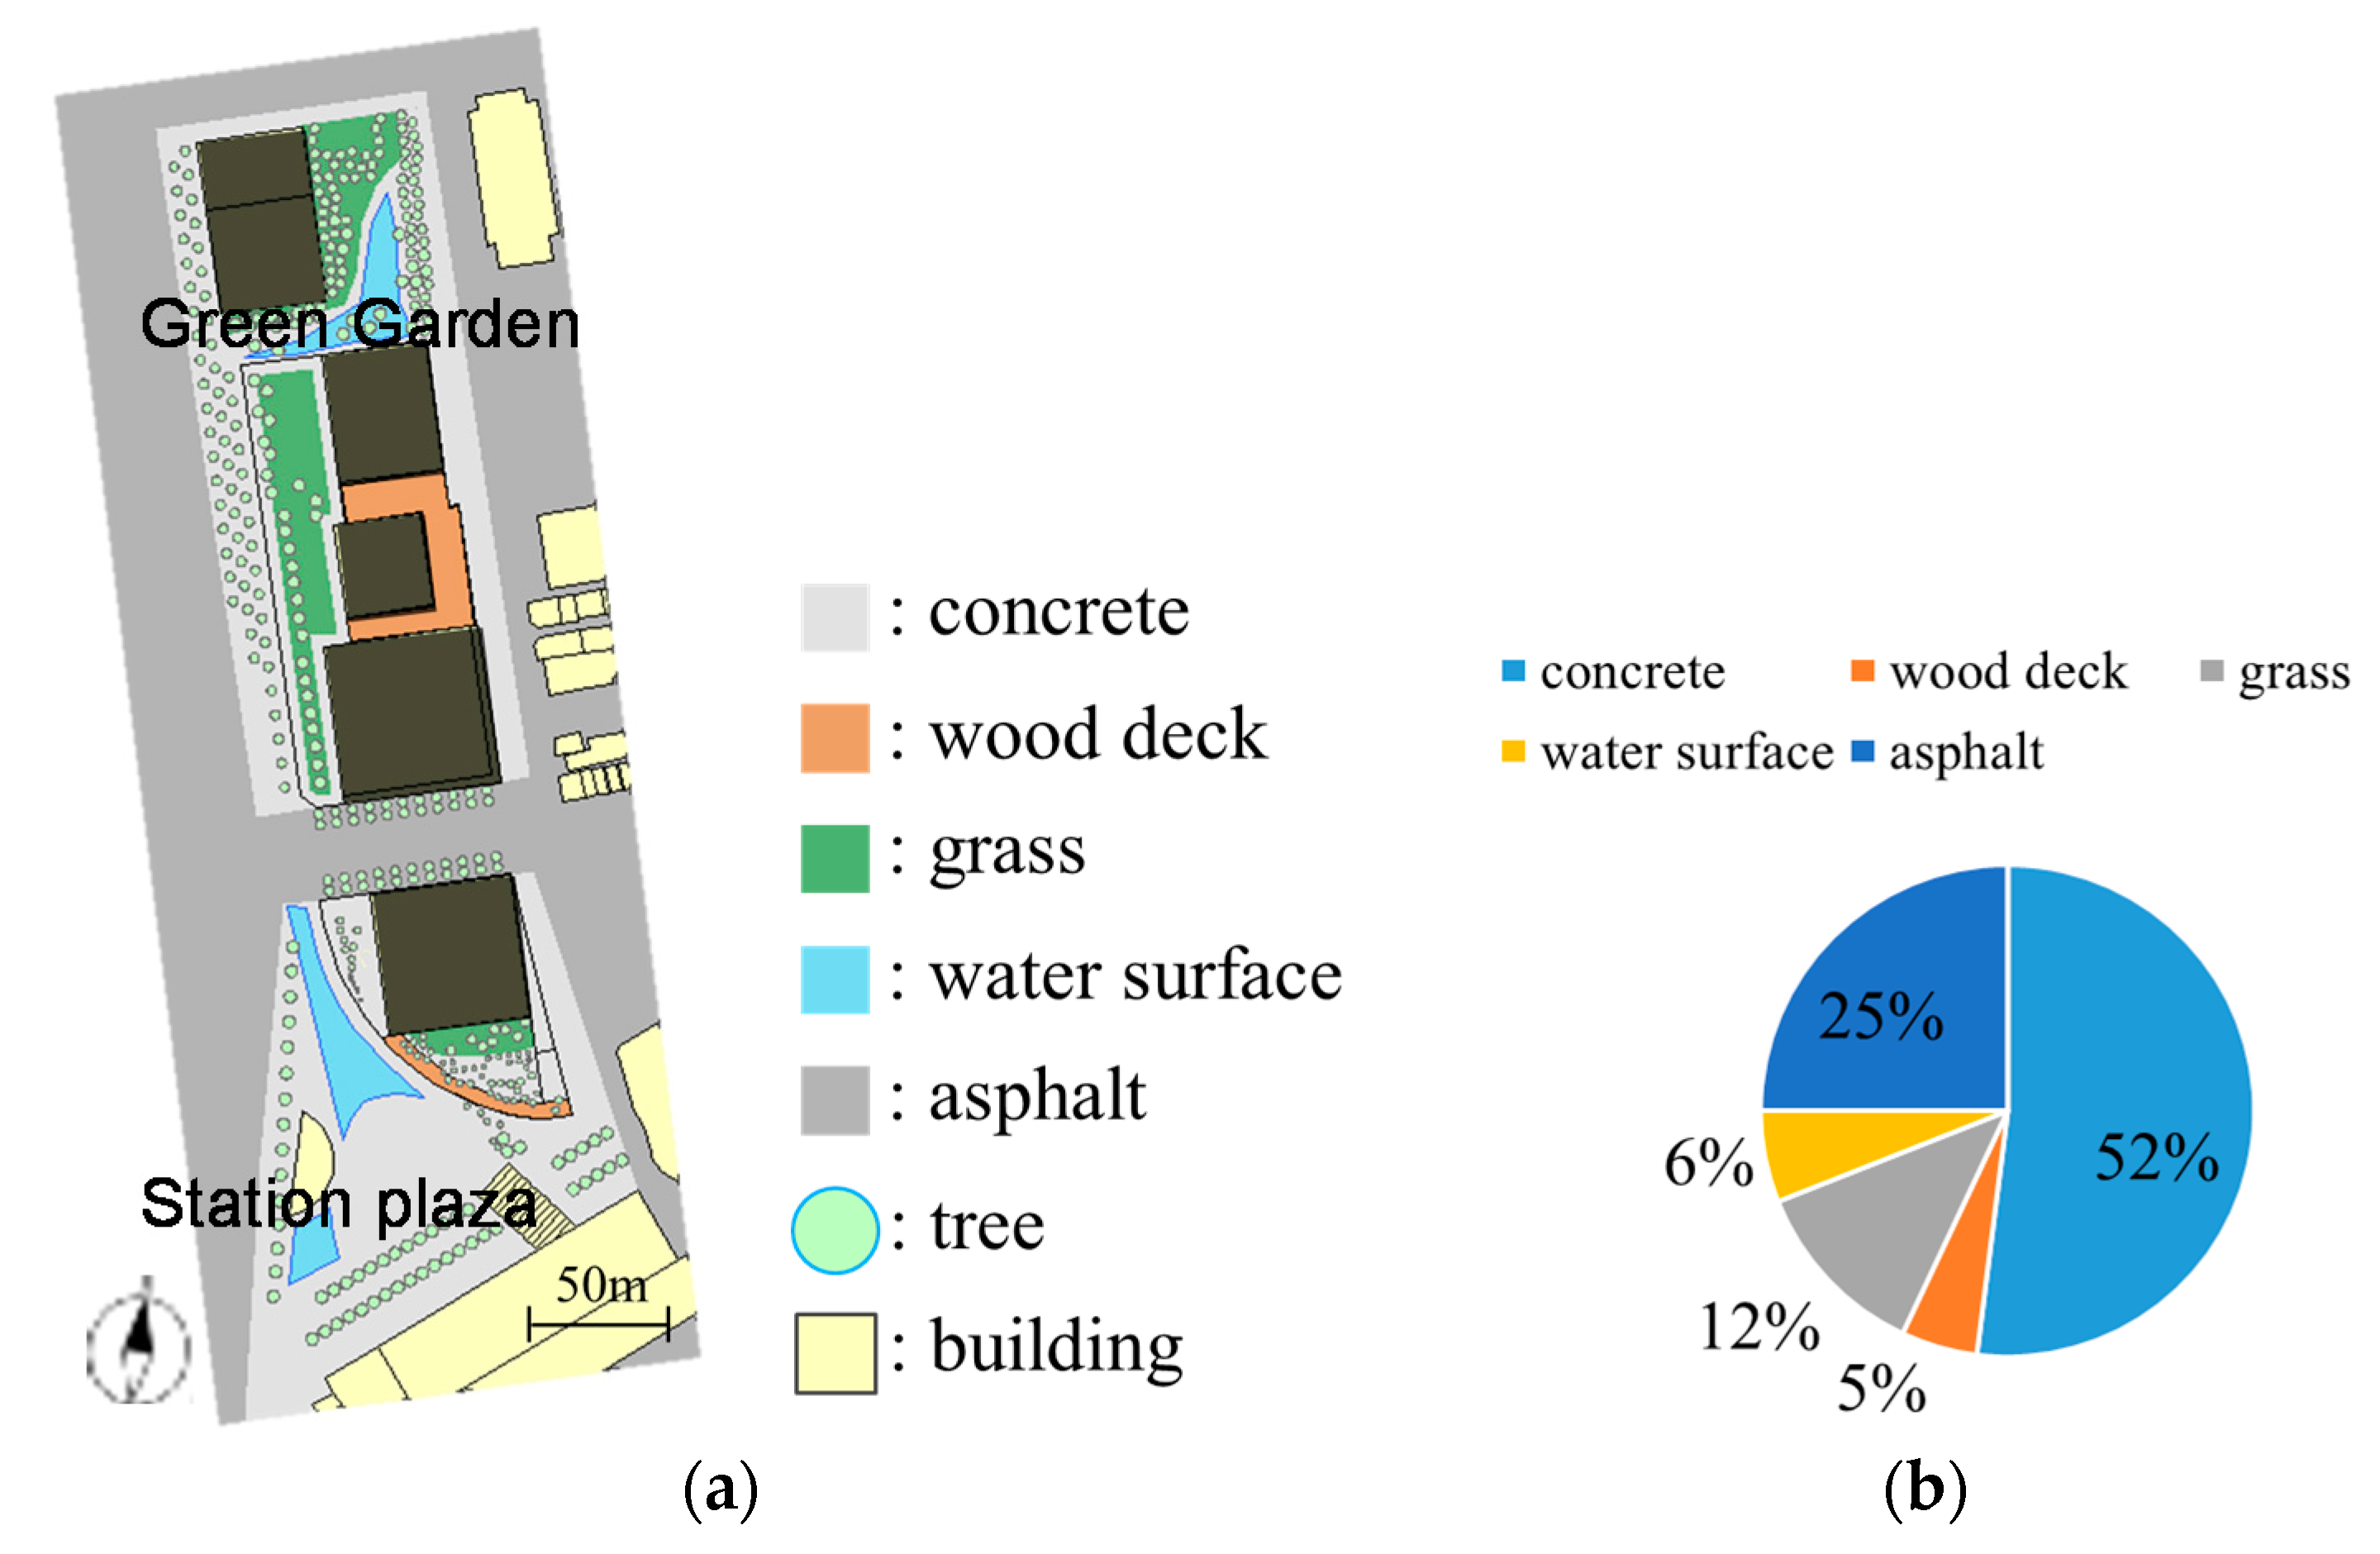
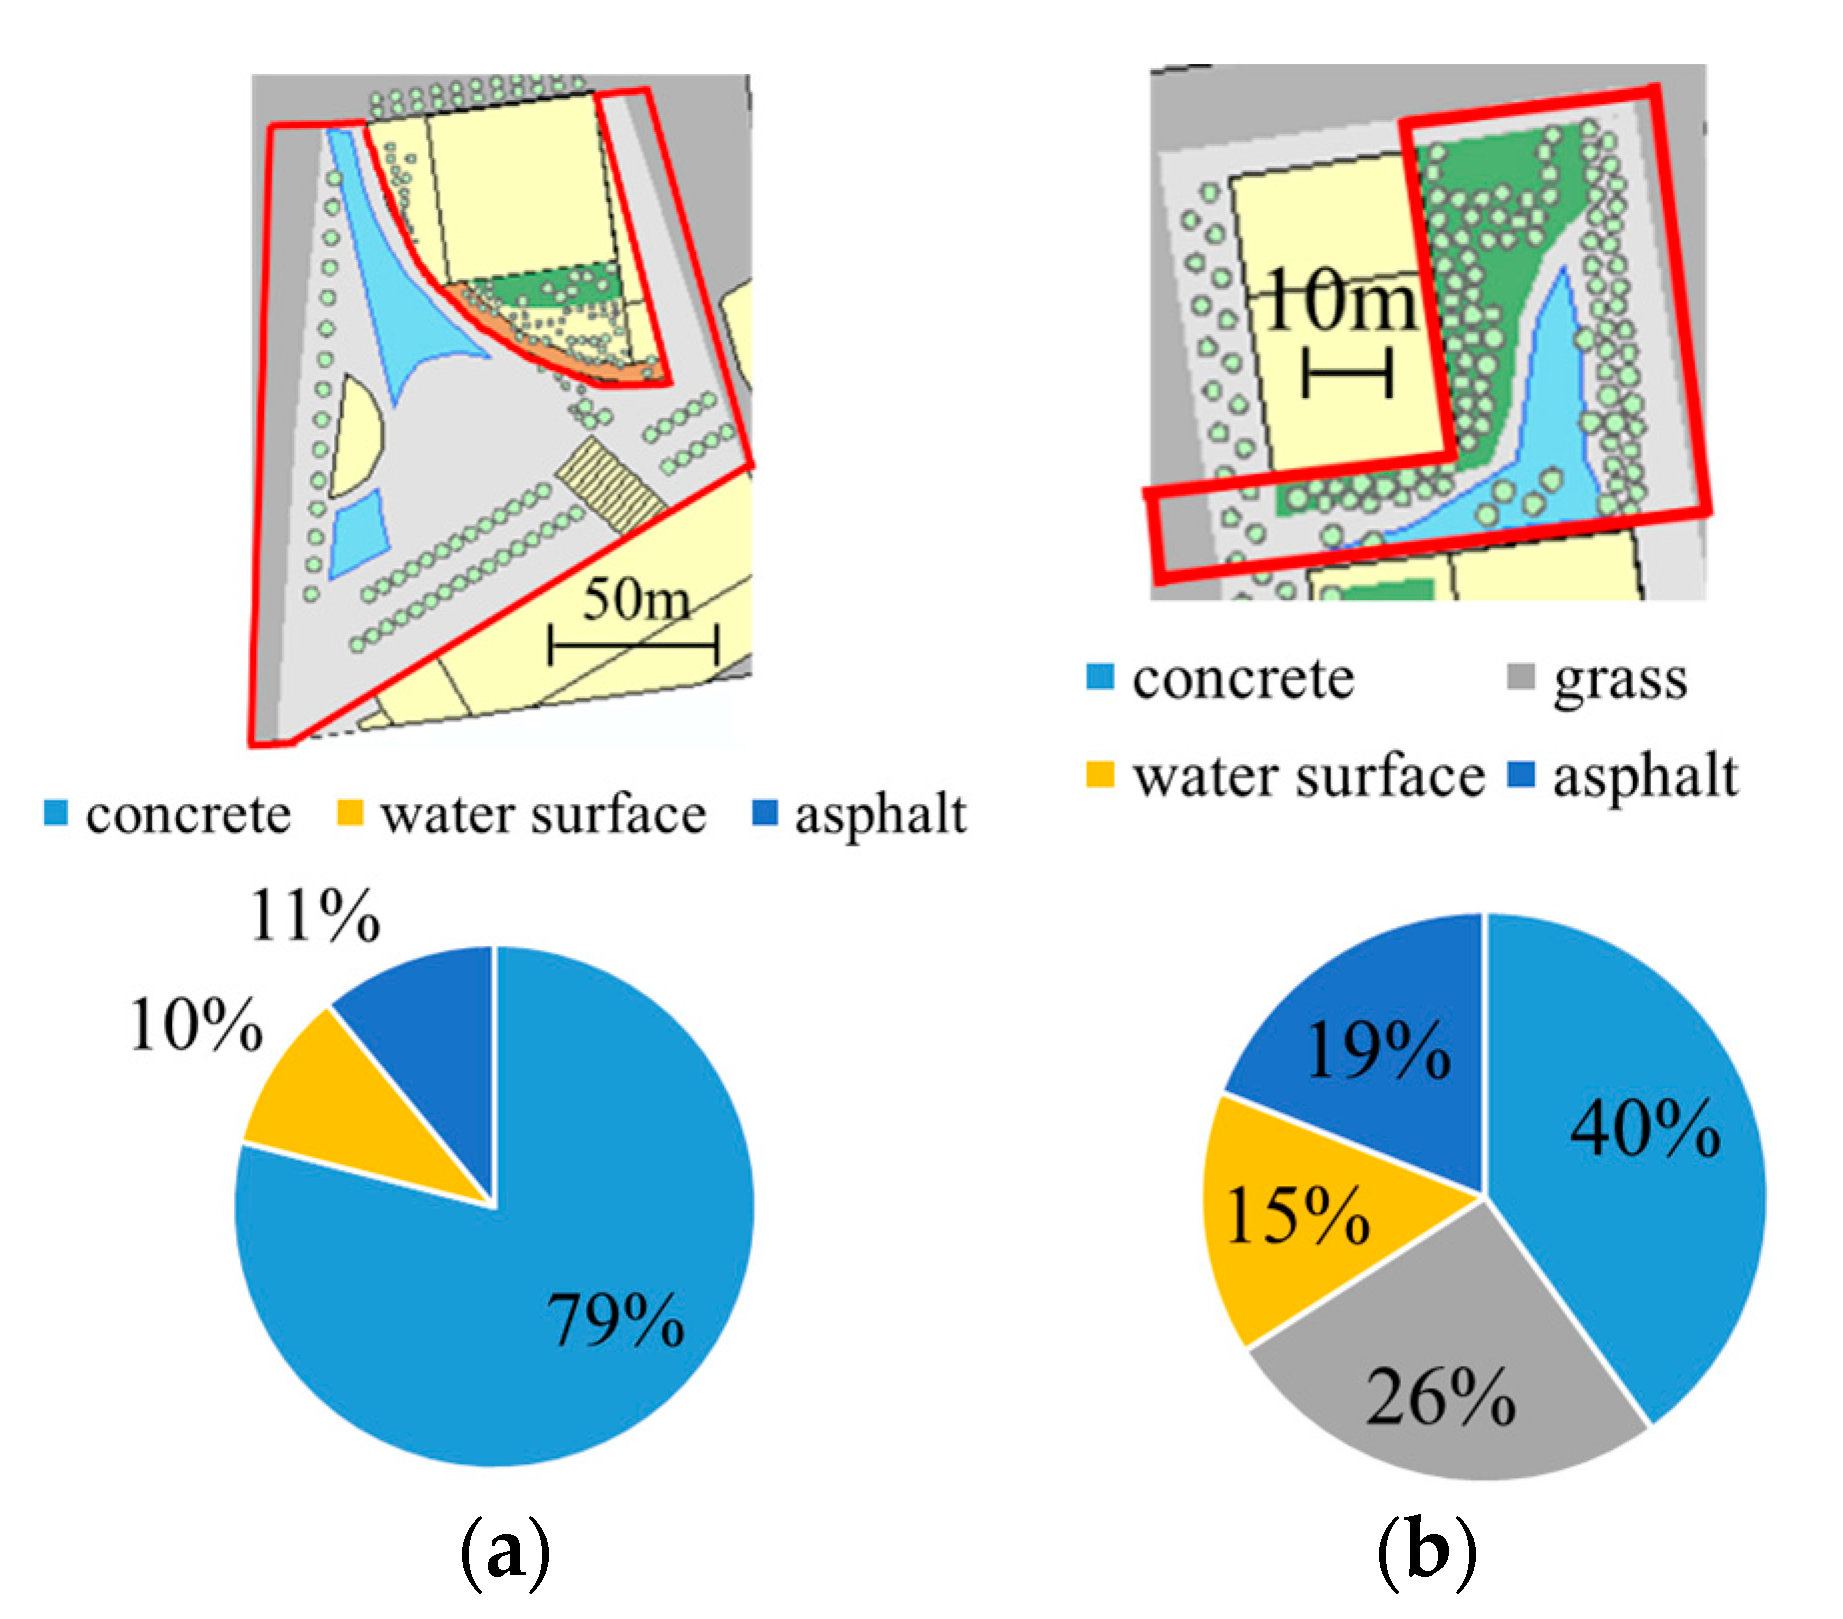
The study site layout and the distribution of each ground cover type are shown in Figure 1 (Grand Front Osaka [16]). Various cover types are present in the surrounding spaces and building rooftops for outdoor thermal environment mitigation. The distribution and ratio of each ground cover type for the Station Plaza and Green Garden are shown in Figure 2.
Station Plaza is located on the southern part of the redevelopment building complex. There are two tall buildings to the northeast (180 m high) and south (150 m high) of Station Plaza. There is little vegetation cover, and open spaces (concrete surfaces) and water surfaces dominate. When events are held in Station Plaza, attendees can be cooled by misters.
Green Garden is located between the northern (174 m high) and central (154 m high) high-rise buildings. The Green Garden site features green grassy areas, water surfaces, medium-height trees, and concrete walkways.
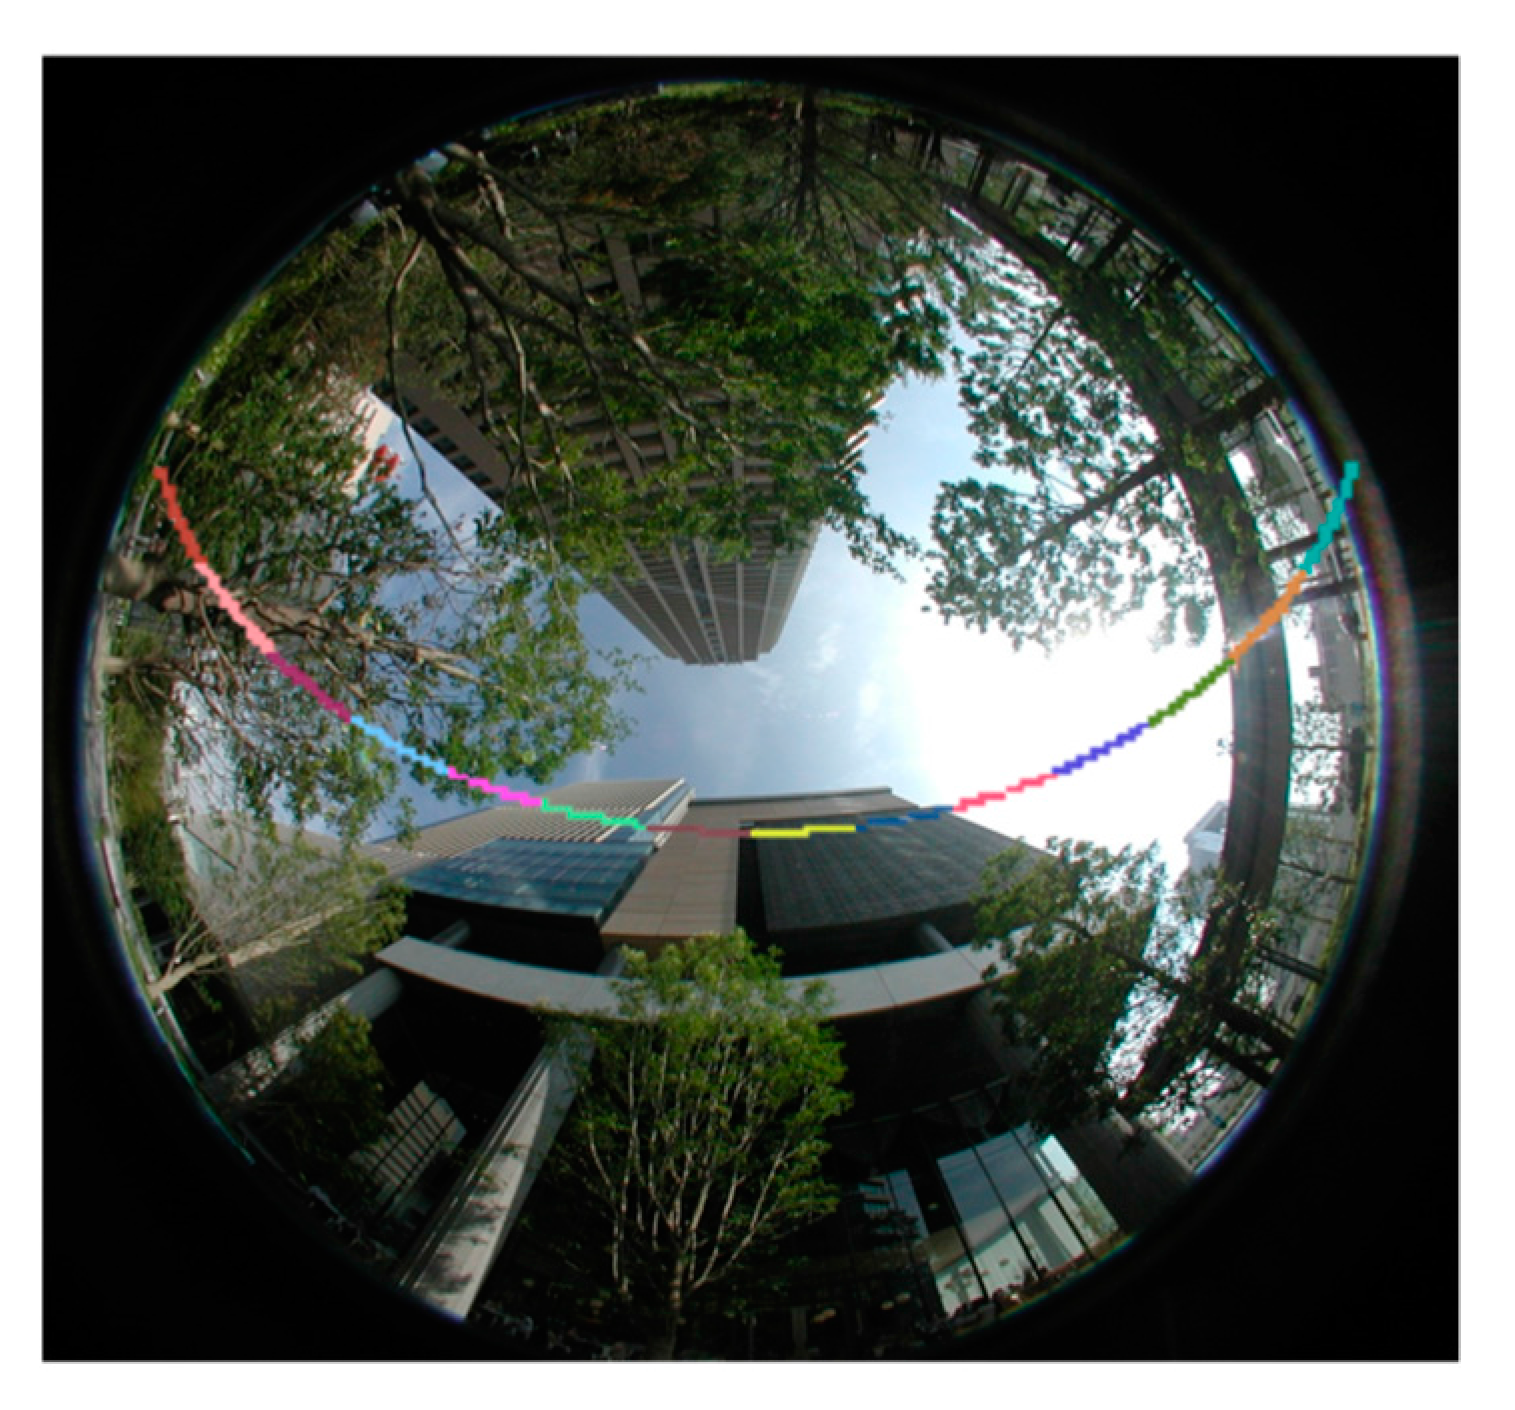
Upward and downward fisheye pictures were taken from a height of 1.5 m by a camera (Nikon COOLPIX990, Tokyo, Japan) with a fisheye lens (Nikon Fisheye Converter FC-E8, Tokyo, Japan) at 25 points in Station Plaza and 32 points in Green Garden during sunny days from 22 to 26 July 2013. A solar orbit diagram is superimposed on these pictures, and the solar radiation shading situation is analyzed at each point where a photo was taken. An example of a photo taken by the camera with a fisheye lens with the corresponding solar orbit diagram is shown in Figure 3.
The spatial distribution of solar radiation shading in Station Plaza and Green Garden was calculated using ArcGIS and building shape data, as per the method described by Takebayashi et al. [17]. The visible area of the upper hemisphere is calculated, taking into account the influence of the adjacent buildings. The visible area is then overlain with the sun-map and sky-map raster to calculate diffuse and direct solar radiation received from each direction. Examples of overlays of the visible area with the sun-map and sky-map are shown in Figure 4, which reprinted from Figure 2 in Reference [17]. In (a) sun-map, the color indicates the dividing element, which is divided at intervals of 30 min and one month. In (b) sky-map, the zenith angle is divided into eight regions and the azimuth angle is divided into 16 regions. The shadow distribution is calculated during sunny days from 22 to 26 July 2013.
3. Results
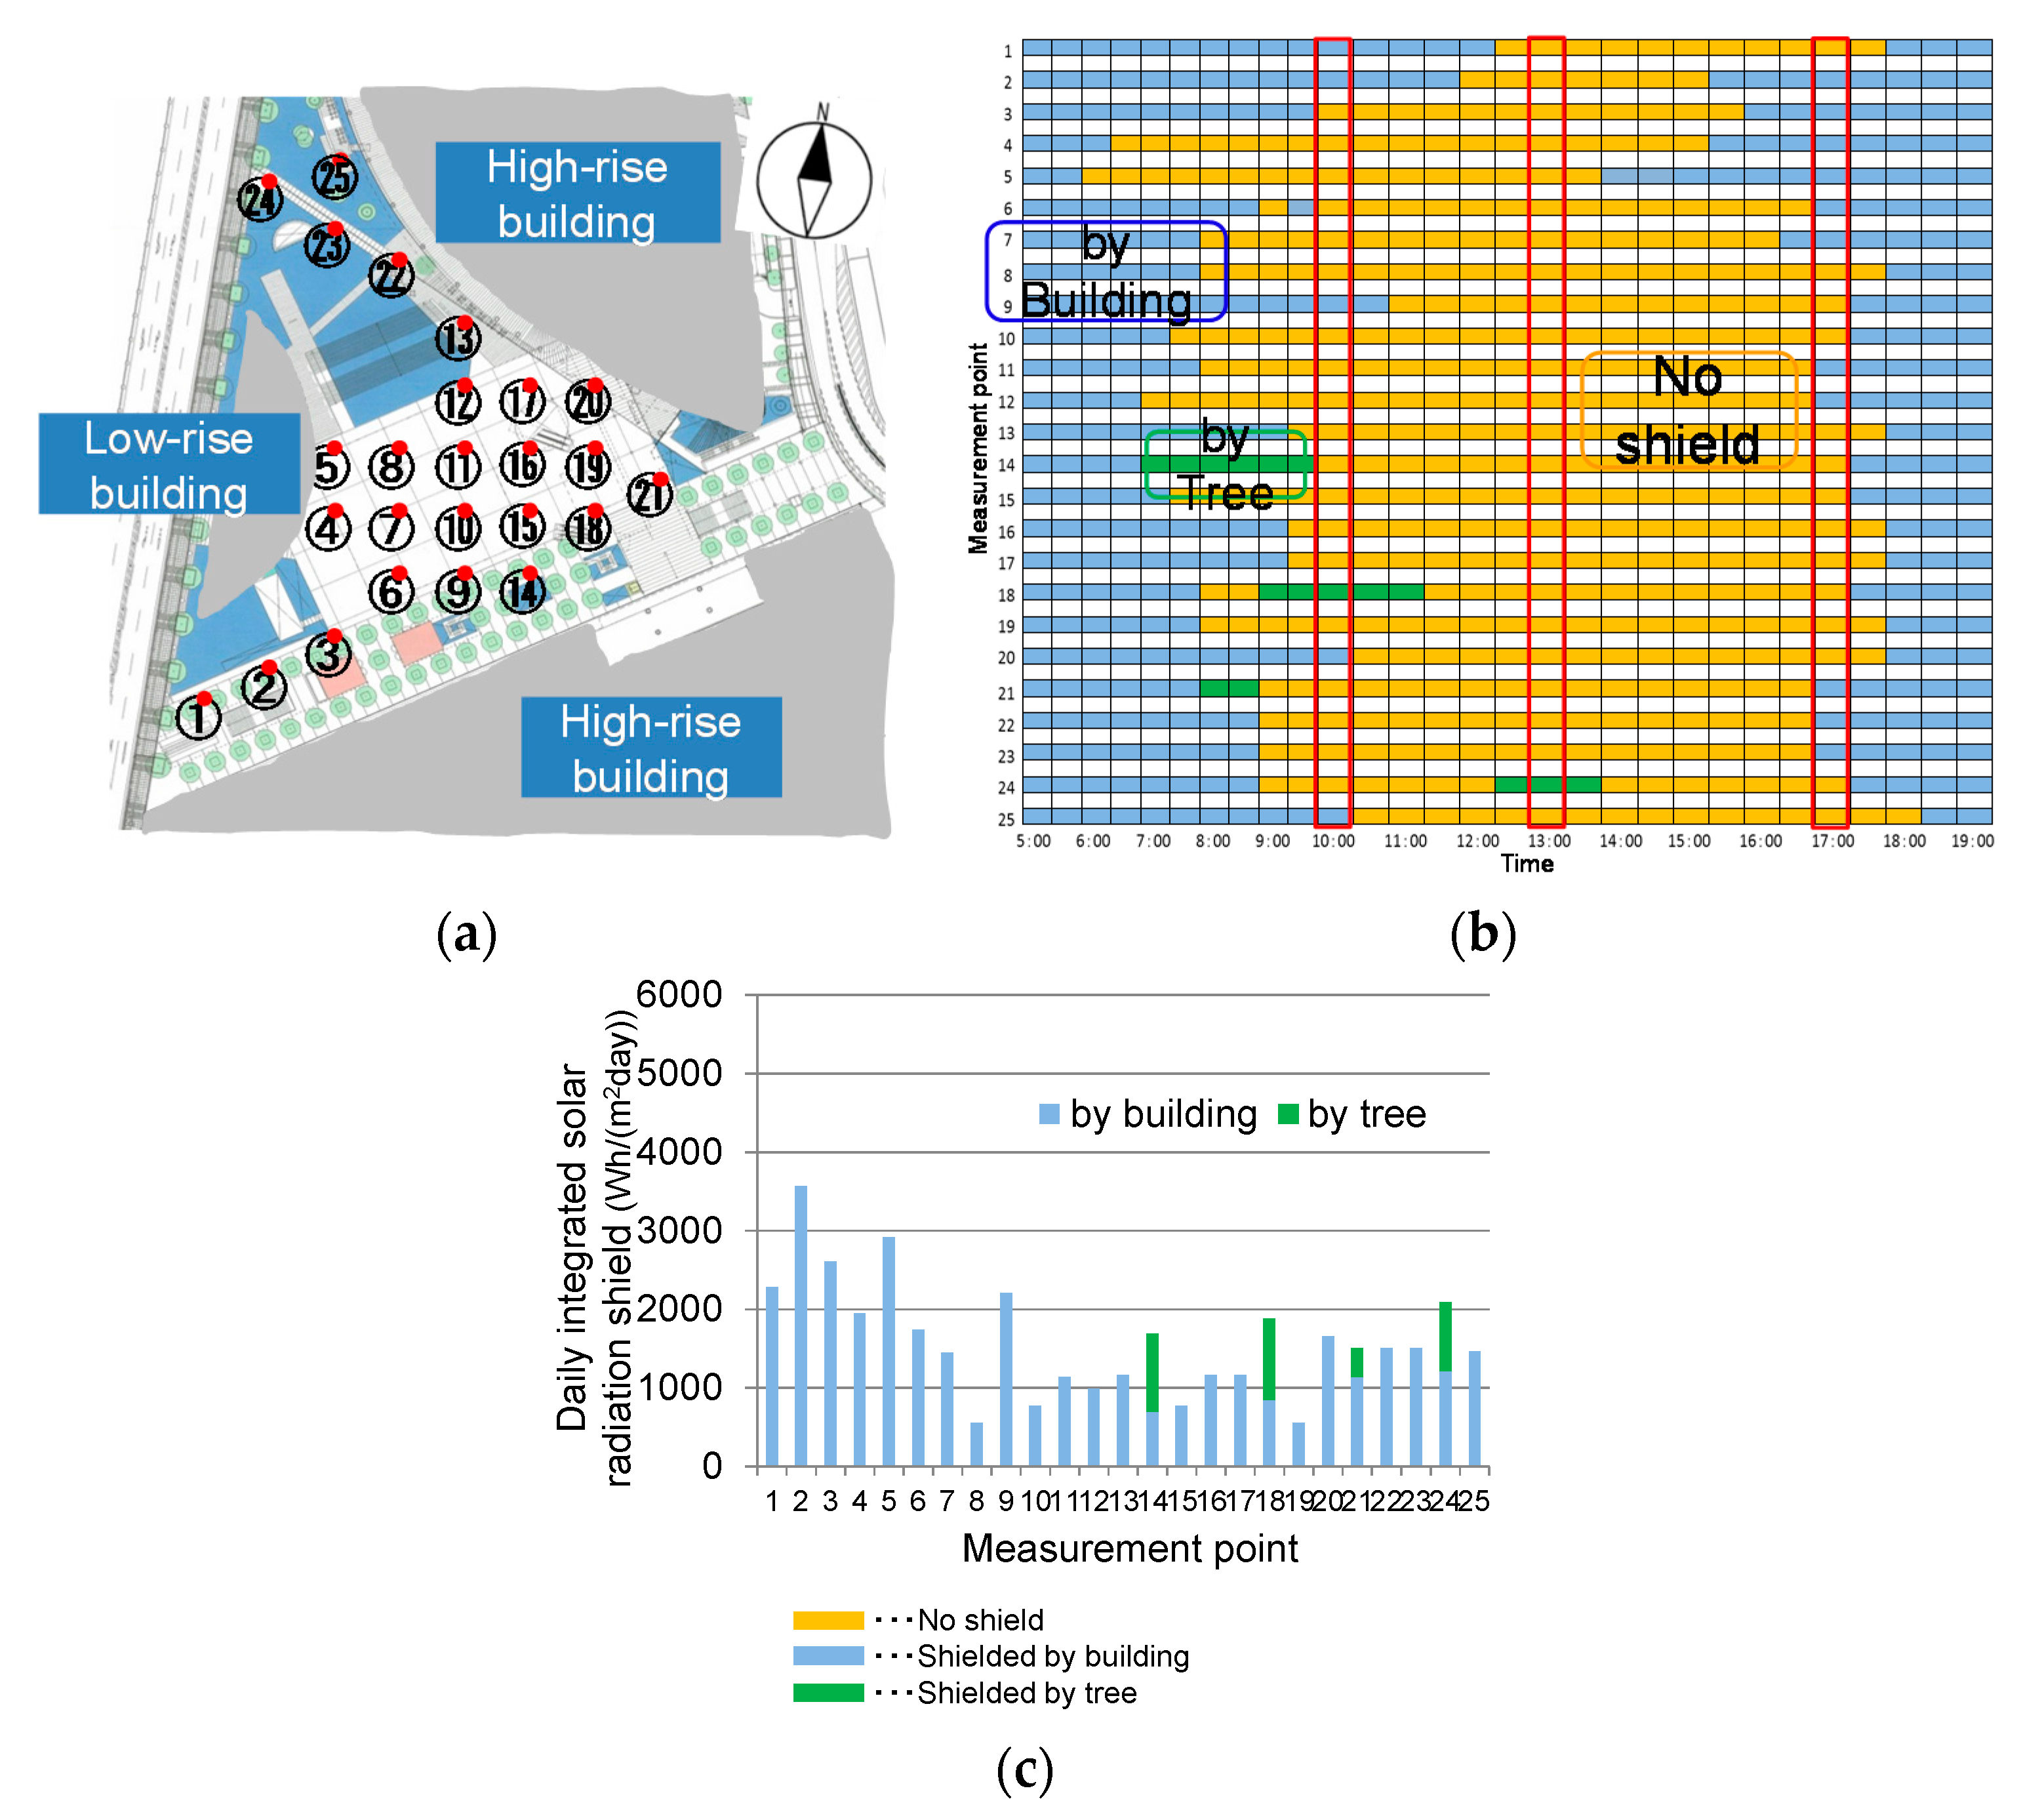
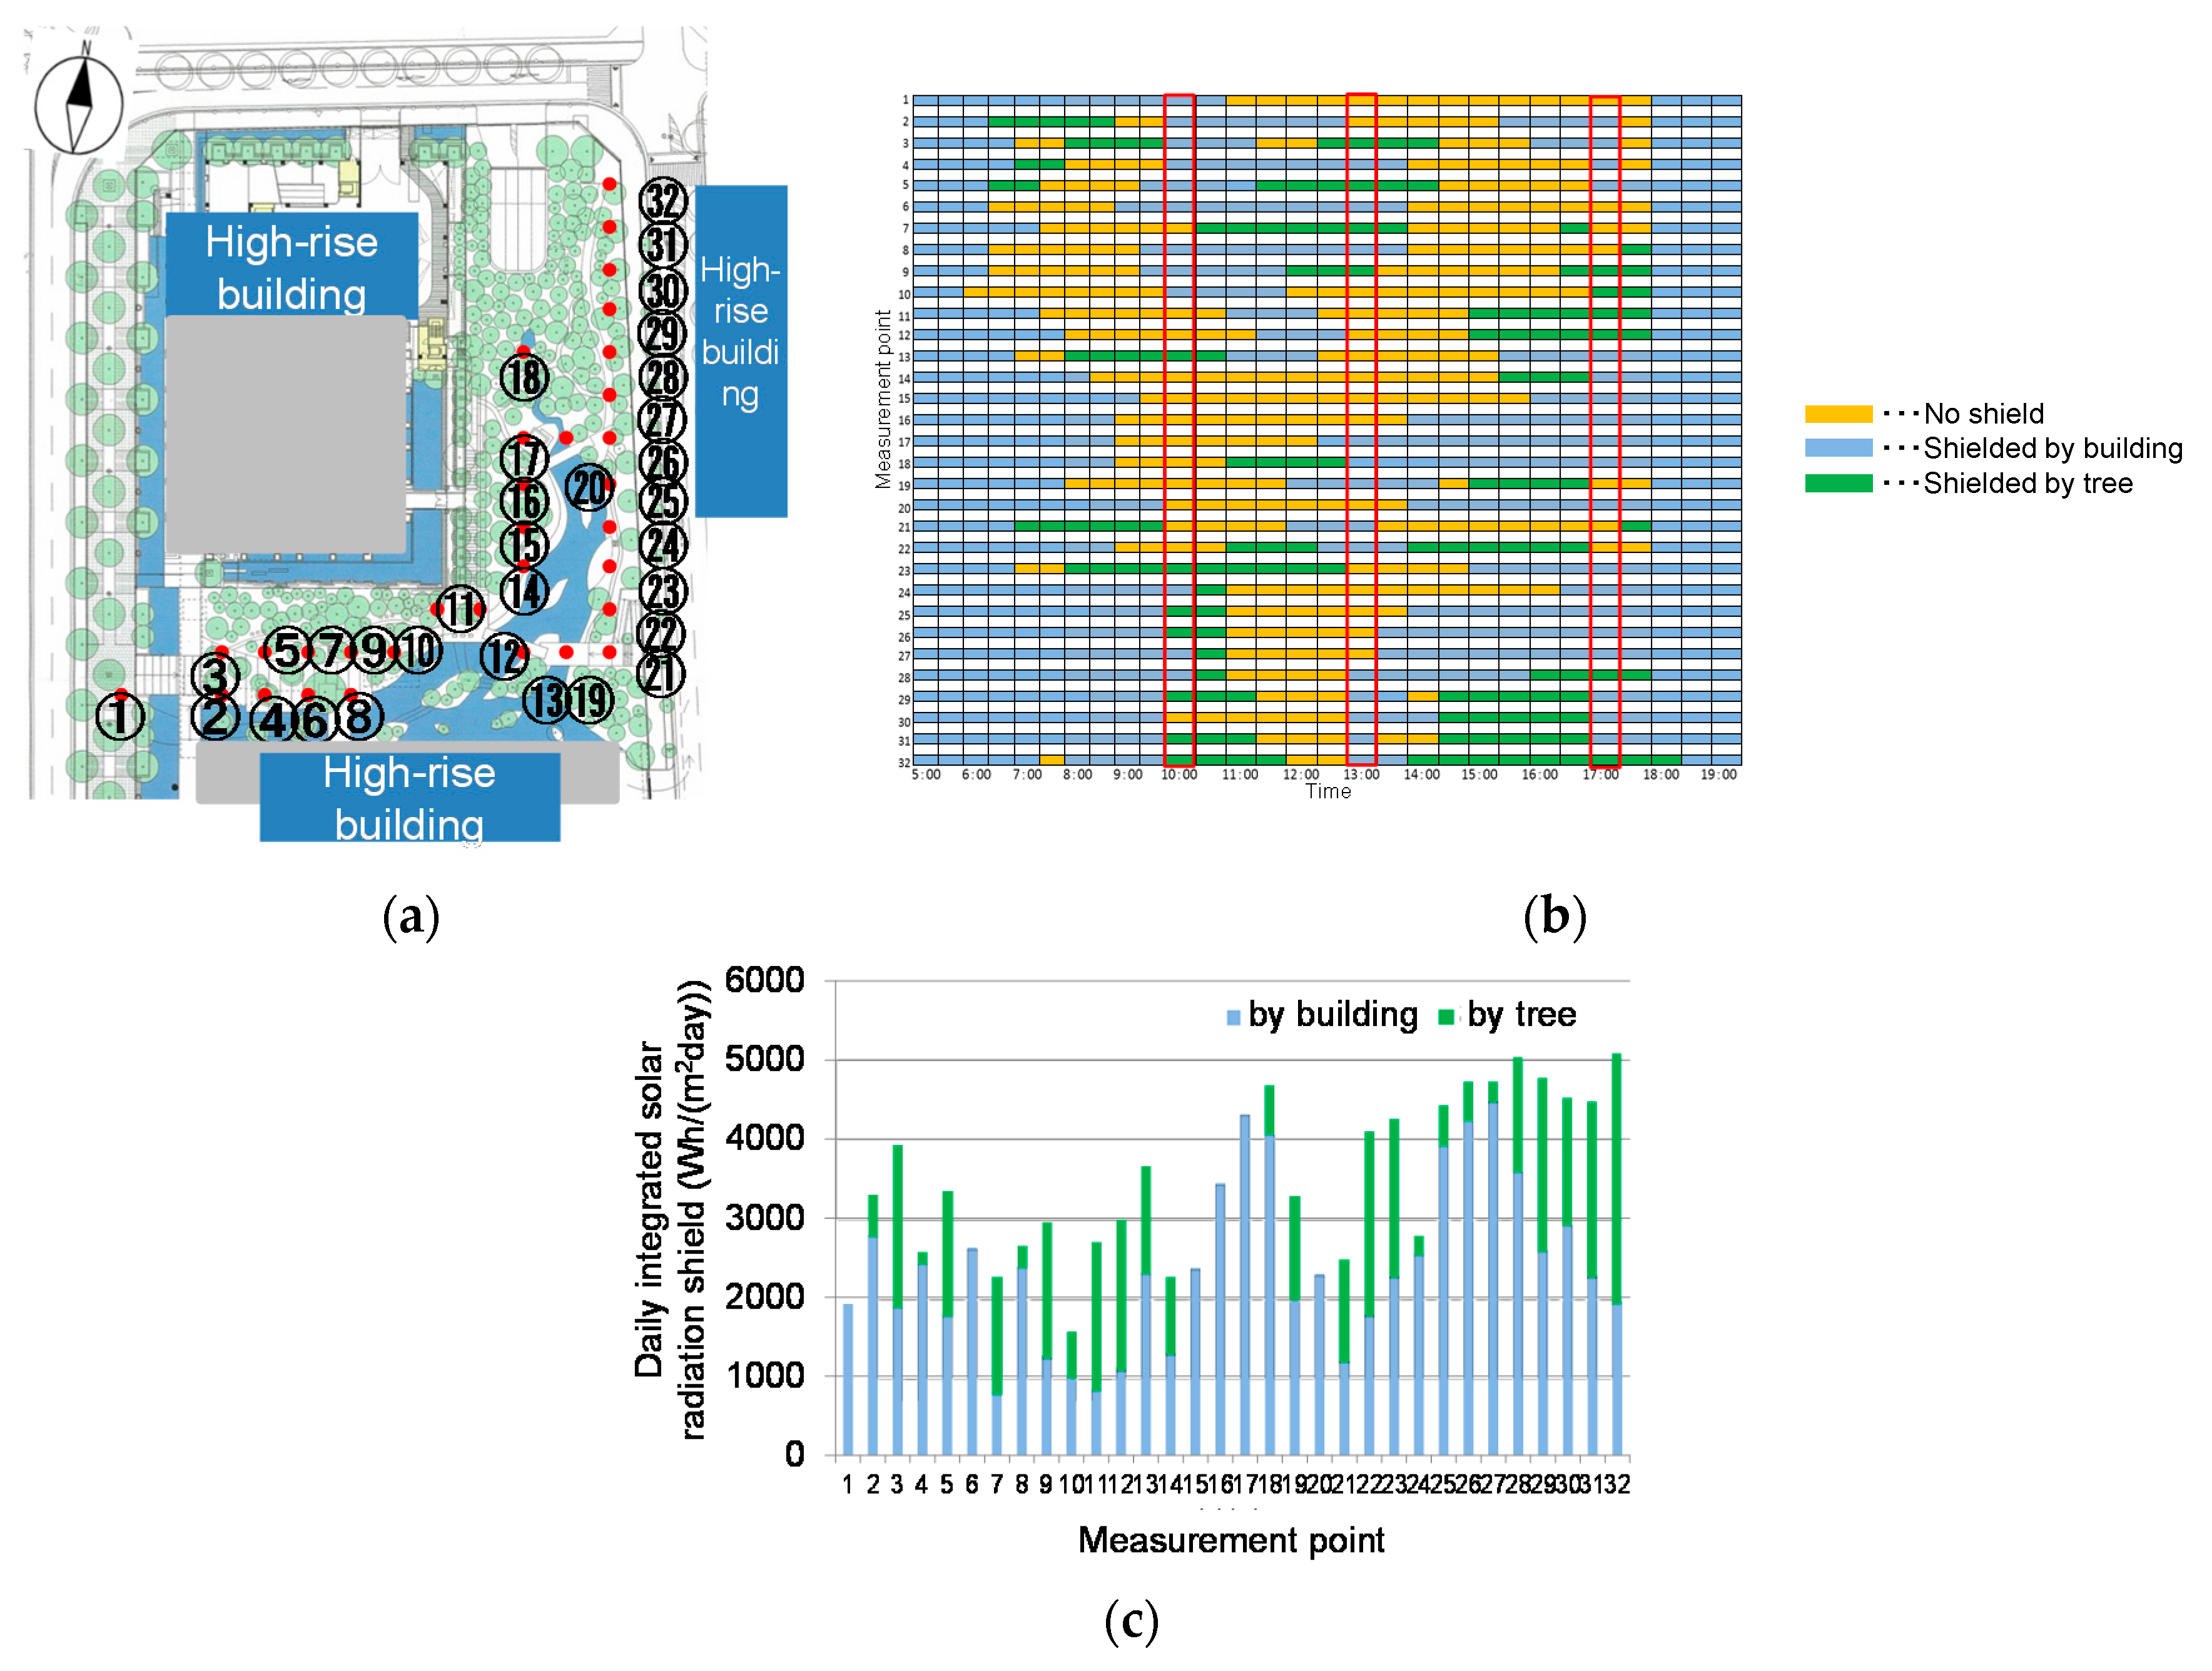
Evaluation results of hourly and daily integrated solar radiation shielding by buildings and trees in Station Plaza and Green Garden are shown in Figure 5 and Figure 6. Solar shading situations at each point where the photo was taken are shown in Table 1 and Table 2, corresponding to the red frame in (b) of Figure 5 and Figure 6.
In Station Plaza, the period obtaining direct solar radiation is long, and direct solar radiation is shielded by the building behind the trees. At the measurement point 5, direct solar radiation is shielded by the west side low-rise building in the afternoon. This is also confirmed slightly at the measurement points 4 and 7.
In Green Garden, direct solar radiation is shielded by the south side building, especially at the measurement points 2, 4, 6, and 8. However, direct solar radiation shielding is smaller at the measurement points 3, 5, 7, and 9, which are slightly more distant from the south side of the building; i.e. the shielding is limited to the immediate building proximity. Shielding was also observed at the measurement points 16 to 18 and slight shielding was observed at the measurement points 26 to 28 by the west side building in the afternoon. In Green Garden, however, direct solar radiation is shielded mainly by the buildings located behind the trees rather than by the trees themselves that are located nearby many of the measurement points.
4. Discussion
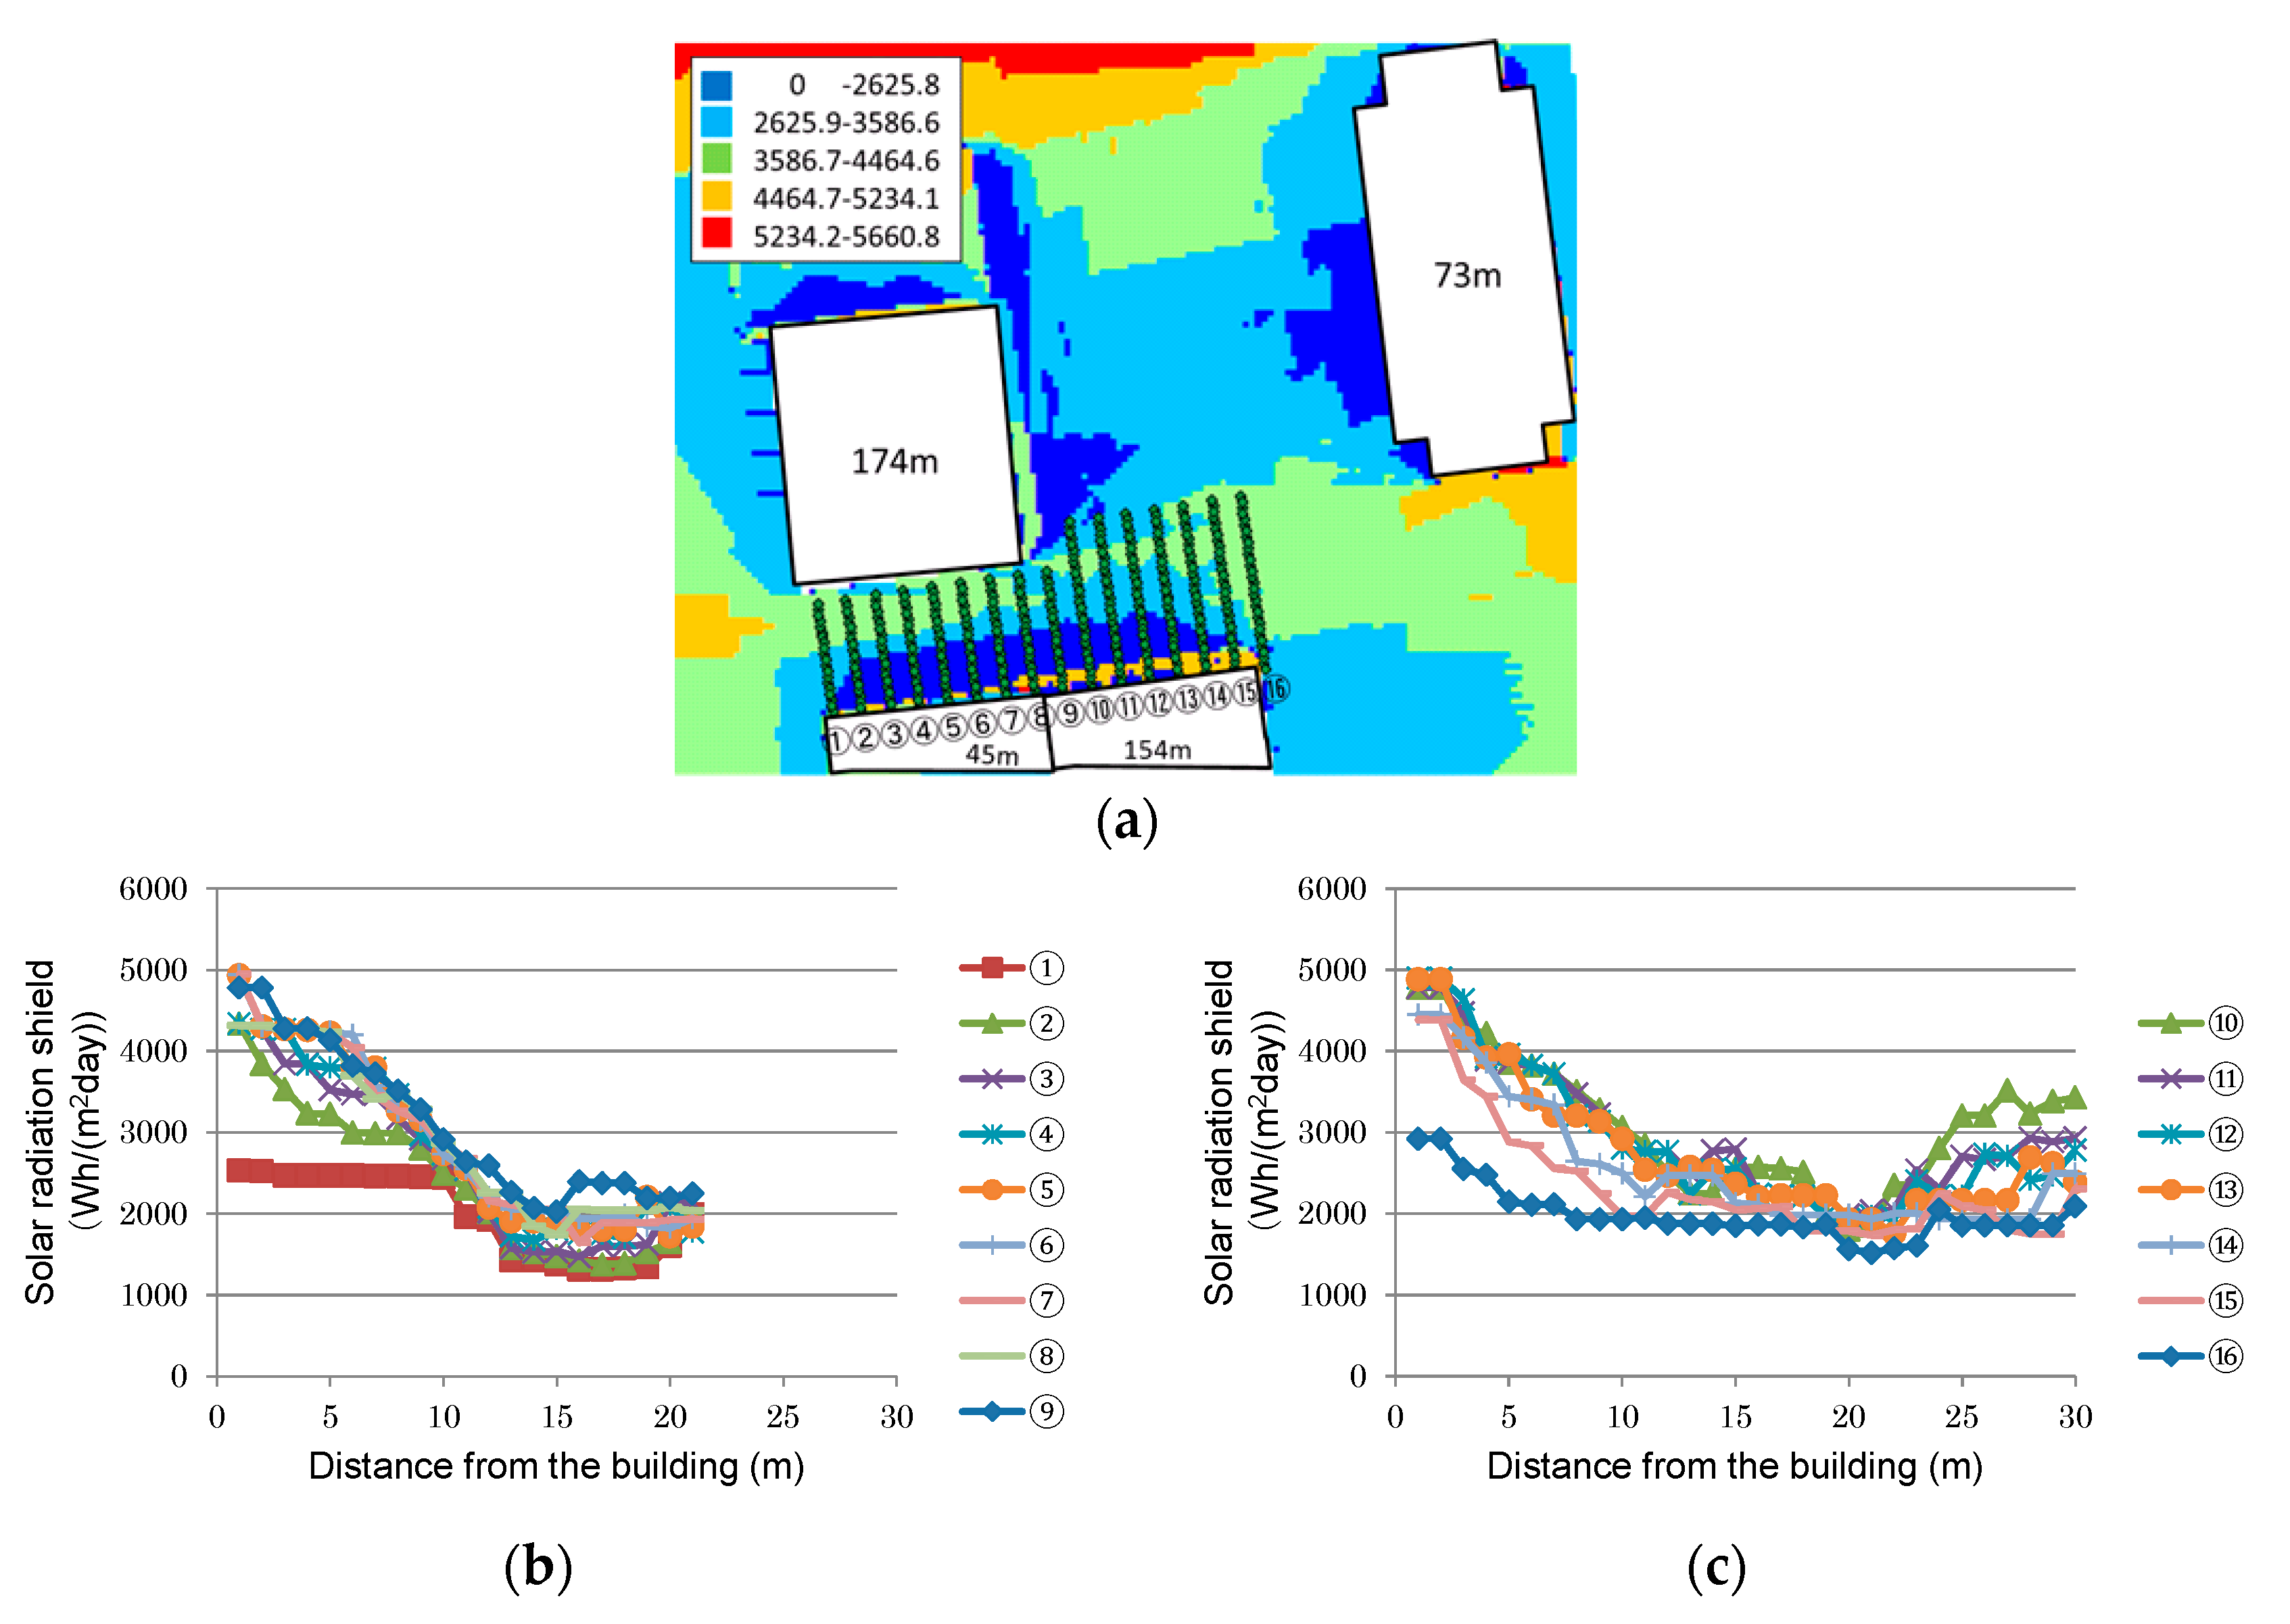
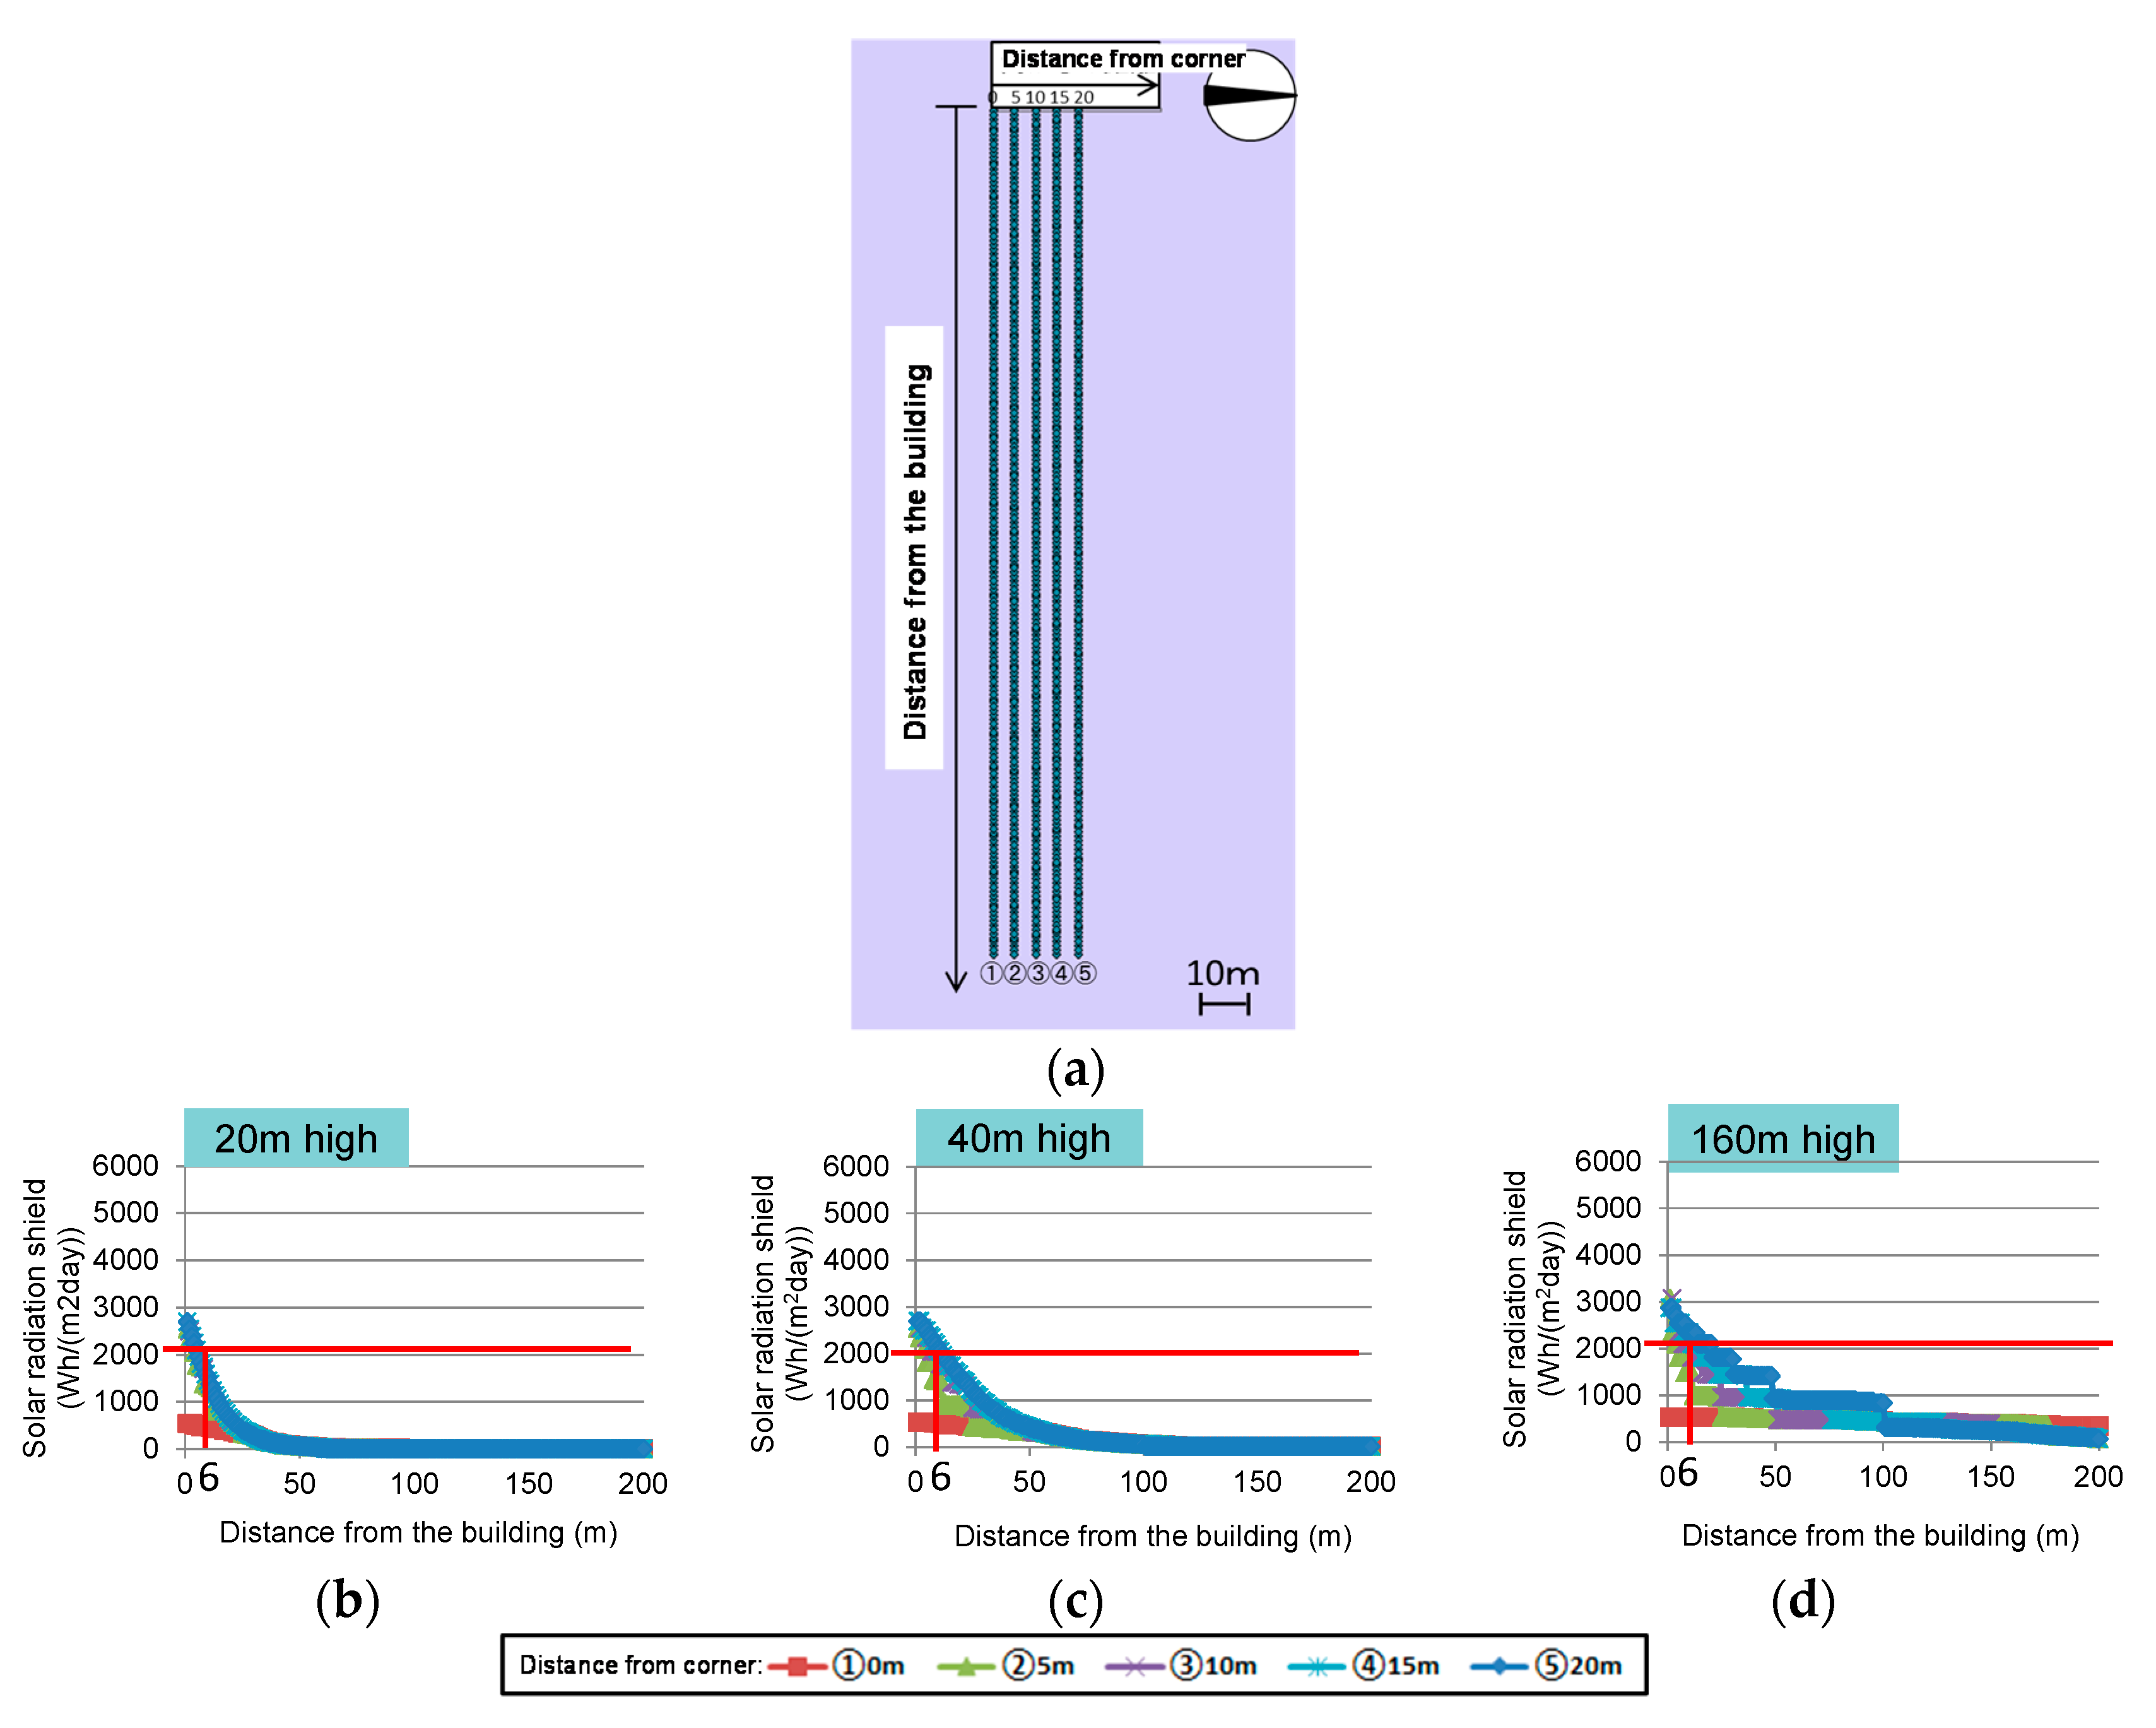
The relationship between the distance from the south side buildings (with the height of 45 m and 154 m) and the daily integrated solar radiation shielding is shown in Figure 7. The daily integrated solar radiation shielding and the distance from southern buildings (with several heights, as shown) are depicted in Figure 8. At the measurement points near building corners, the daily integrated solar radiation shielding is relatively small. Shielding is dominated by the distance from the south side of the building at more than 20 m from the corner, and the shielding effect becomes absent 6 m away from the south side of the 20-m tall building, 12 m away from the south side of the 40-m tall building, and 45 m away from the south side of the 160-m tall building.
Since the daily integrated solar radiation shielding is 2000 W/m2 or less (less than half of the daily integrated direct solar radiation in the absence of shielding) when the distance from the south side of the building is greater than 10 m, solar radiation shielding by trees is necessary for areas more than 10 m from the south side of the buildings.
The relationship between the distance from the west side of the 174-m tall building, the east side of the 73-m tall building, and the daily integrated solar radiation shielding is shown in Figure 9. The daily integrated solar radiation shielding and the distance from the western buildings with varying heights are shown in Figure 10. At the measurement points near the building corner, the daily integrated solar radiation shield is relatively small. Shielding is dominated by the distance from the west side of the building when more than 25 m from the corner, and the shielding effect becomes absent 40 m away from the west side of the 20-m tall building, 80 m away from the west side of the 40-m tall building, and more than 200 m away from the west side of the 160-m tall building.
Since the daily integrated solar radiation shielding is 2000 W/m2 or less when the distance from the west side of the building is larger than 6 m, solar radiation shielding by the trees is necessary for areas more than 6 m away from the building.
5. Conclusions
The effects of solar radiation shading by trees in the open space around buildings on microclimatic development and pedestrian radiation environment were evaluated through a case study on the redevelopment buildings in front of Central Osaka Station, based on observation and calculation. In both the open space (Station Plaza) and Green Garden, direct solar radiation is shielded mainly by buildings located behind the trees rather than by the trees themselves. Solar radiation shielding by the trees is required at more than 10 m from the south side of the buildings and at more than 6 m from the west and east sides of the buildings based on the relationship observed between the distance from south, west, and east sides of the buildings and the daily integrated solar radiation shielding. This was confirmed to be a necessity of environmental design of outdoor space, considering shade by buildings as well as trees.
Acknowledgments
We thank the administrators of Grand Front Osaka for their cooperation with respect to our measurements.
Author Contributions
Hideki Takebayashi and Makiko Kasahara conceived and carried out the experiments, calculations and analysis; Shingo Tanabe and Makoto Kouyama contributed the discussion of analysis results.
Conflicts of Interest
The authors declare no conflict of interest.
References
- Takebayashi, H.; Moriyama, M. Relationships between the properties of an urban street canyon and its radiant environment: Introduction of appropriate urban heat island mitigation technologies. Sol. Energy 2012, 86, 2255–2262. [Google Scholar] [CrossRef]
- Oke, T.R. Street design and urban canopy layer climate. Energy Build. 1988, 11, 103–113. [Google Scholar] [CrossRef]
- Arnfield, A.J. Street design and urban canyon solar access. Energy Build. 1990, 14, 117–131. [Google Scholar] [CrossRef]
- Eliasson, I. Urban Geometry, surface temperature and air temperature. Energy Build. 1990–1991, 15, 141–145. [Google Scholar] [CrossRef]
- Ali-Toudert, F.; Mayer, H. Numerical study on the effects of aspect ratio and orientation of an urban street canyon on outdoor thermal comfort in hot and dry climate. Build. Environ. 2006, 41, 94–108. [Google Scholar] [CrossRef]
- Ali-Toudert, F.; Mayer, H. Effects of asymmetry, galleries, overhanging façades and vegetation on thermal comfort in urban street canyons. Sol. Energy 2007, 81, 742–754. [Google Scholar] [CrossRef]
- Martinelli, L.; Lin, T.P.; Matzarakis, A. Assessment of the influence of daily shadings pattern on human thermal comfort and attendance in Rome during summer period. Build. Environ. 2015, 92, 30–38. [Google Scholar] [CrossRef]
- Abreu-Harbich, L.V.; Labaki, L.C.; Matzarakis, A. Effect of tree planting design and tree species on human thermal comfort in the tropics. Landsc. Urban Plan. 2015, 138, 99–109. [Google Scholar] [CrossRef]
- Algeciras, J.A.R.; Consuegra, L.G.; Matzarakis, A. Spatial-temporal study on the effects of urban street configurations on human thermal comfort in the world heritage city of Camagüey-Cuba. Build. Environ. 2016, 101, 85–101. [Google Scholar] [CrossRef]
- Lee, H.; Mayer, H.; Chen, L. Contribution of trees and grasslands to the mitigation of human heat stress in a residential district of Freiburg, Southwest Germany. Landsc. Urban Plan. 2016, 148, 37–50. [Google Scholar] [CrossRef]
- Zheng, S.; Zhao, L.; Li, Q. Numerical simulation of the impact of different vegetation species on the outdoor thermal environment. Urban For. Urban Green. 2016, 18, 138–150. [Google Scholar] [CrossRef]
- Blazejczyk, K.; Epstein, Y.; Jendritzky, G.; Staiger, H.; Tinz, B. Comparison of UTCI to selected thermal indices. Int. J. Biometeorol. 2012, 56, 515–535. [Google Scholar] [CrossRef] [PubMed]
- Jendritzky, G.; de Dear, R.; Havenith, G. UTCI—Why another thermal index? Int. J. Biometeorol. 2012, 56, 421–428. [Google Scholar] [CrossRef] [PubMed] [Green Version]
- Aoyama, K.; Kyogoku, S.; Nakayama, S.; Yagi, R.; Takebayashi, H.; Ishii, E.; Kasahara, M.; Tanabe, S.; Kouyama, M. Evaluation of the outdoor thermal environment in redevelopment buildings in front of Osaka Station based on observations. J. Heat Isl. Inst. Int. 2014, 9-2, 86–91. [Google Scholar]
- Akagawa, H.; Sugimoto, H. Environmental evaluation at large-scale greening area in urban canyon: Part 2 Investigation of thermal environment in the district. Summ. Tech. Pap. Annu. Meet. AIJ 2011, D-1, 793–794. [Google Scholar]
- GRAND FRONT OSAKA. Available online: http://umeda-connect.jp/special/vol10/part01.html (accessed on 27 June 2017).
- Takebayashi, H.; Ishii, E.; Moriyama, M.; Sakaki, A.; Nakajima, S.; Ueda, H. Study to examine the potential for solar energy utilization based on the relationship between urban morphology and solar radiation gain on building rooftops and wall surfaces. Sol. Energy 2015, 119, 362–369. [Google Scholar] [CrossRef]
Figure 1.
Study site layout. (a) Distribution and (b) ratio of each ground cover type.

Figure 2.
Distribution and ratio of each ground cover type. (a) In Station Plaza, (b) in Green Garden.
Figure 2.
Distribution and ratio of each ground cover type. (a) In Station Plaza, (b) in Green Garden.

Figure 3.
An example of a photo taken by the camera with a fisheye lens with the corresponding solar orbit diagram.
Figure 3.
An example of a photo taken by the camera with a fisheye lens with the corresponding solar orbit diagram.

Figure 4.
Examples of overlays of the visible area with (a) sun-map and (b) sky-map.
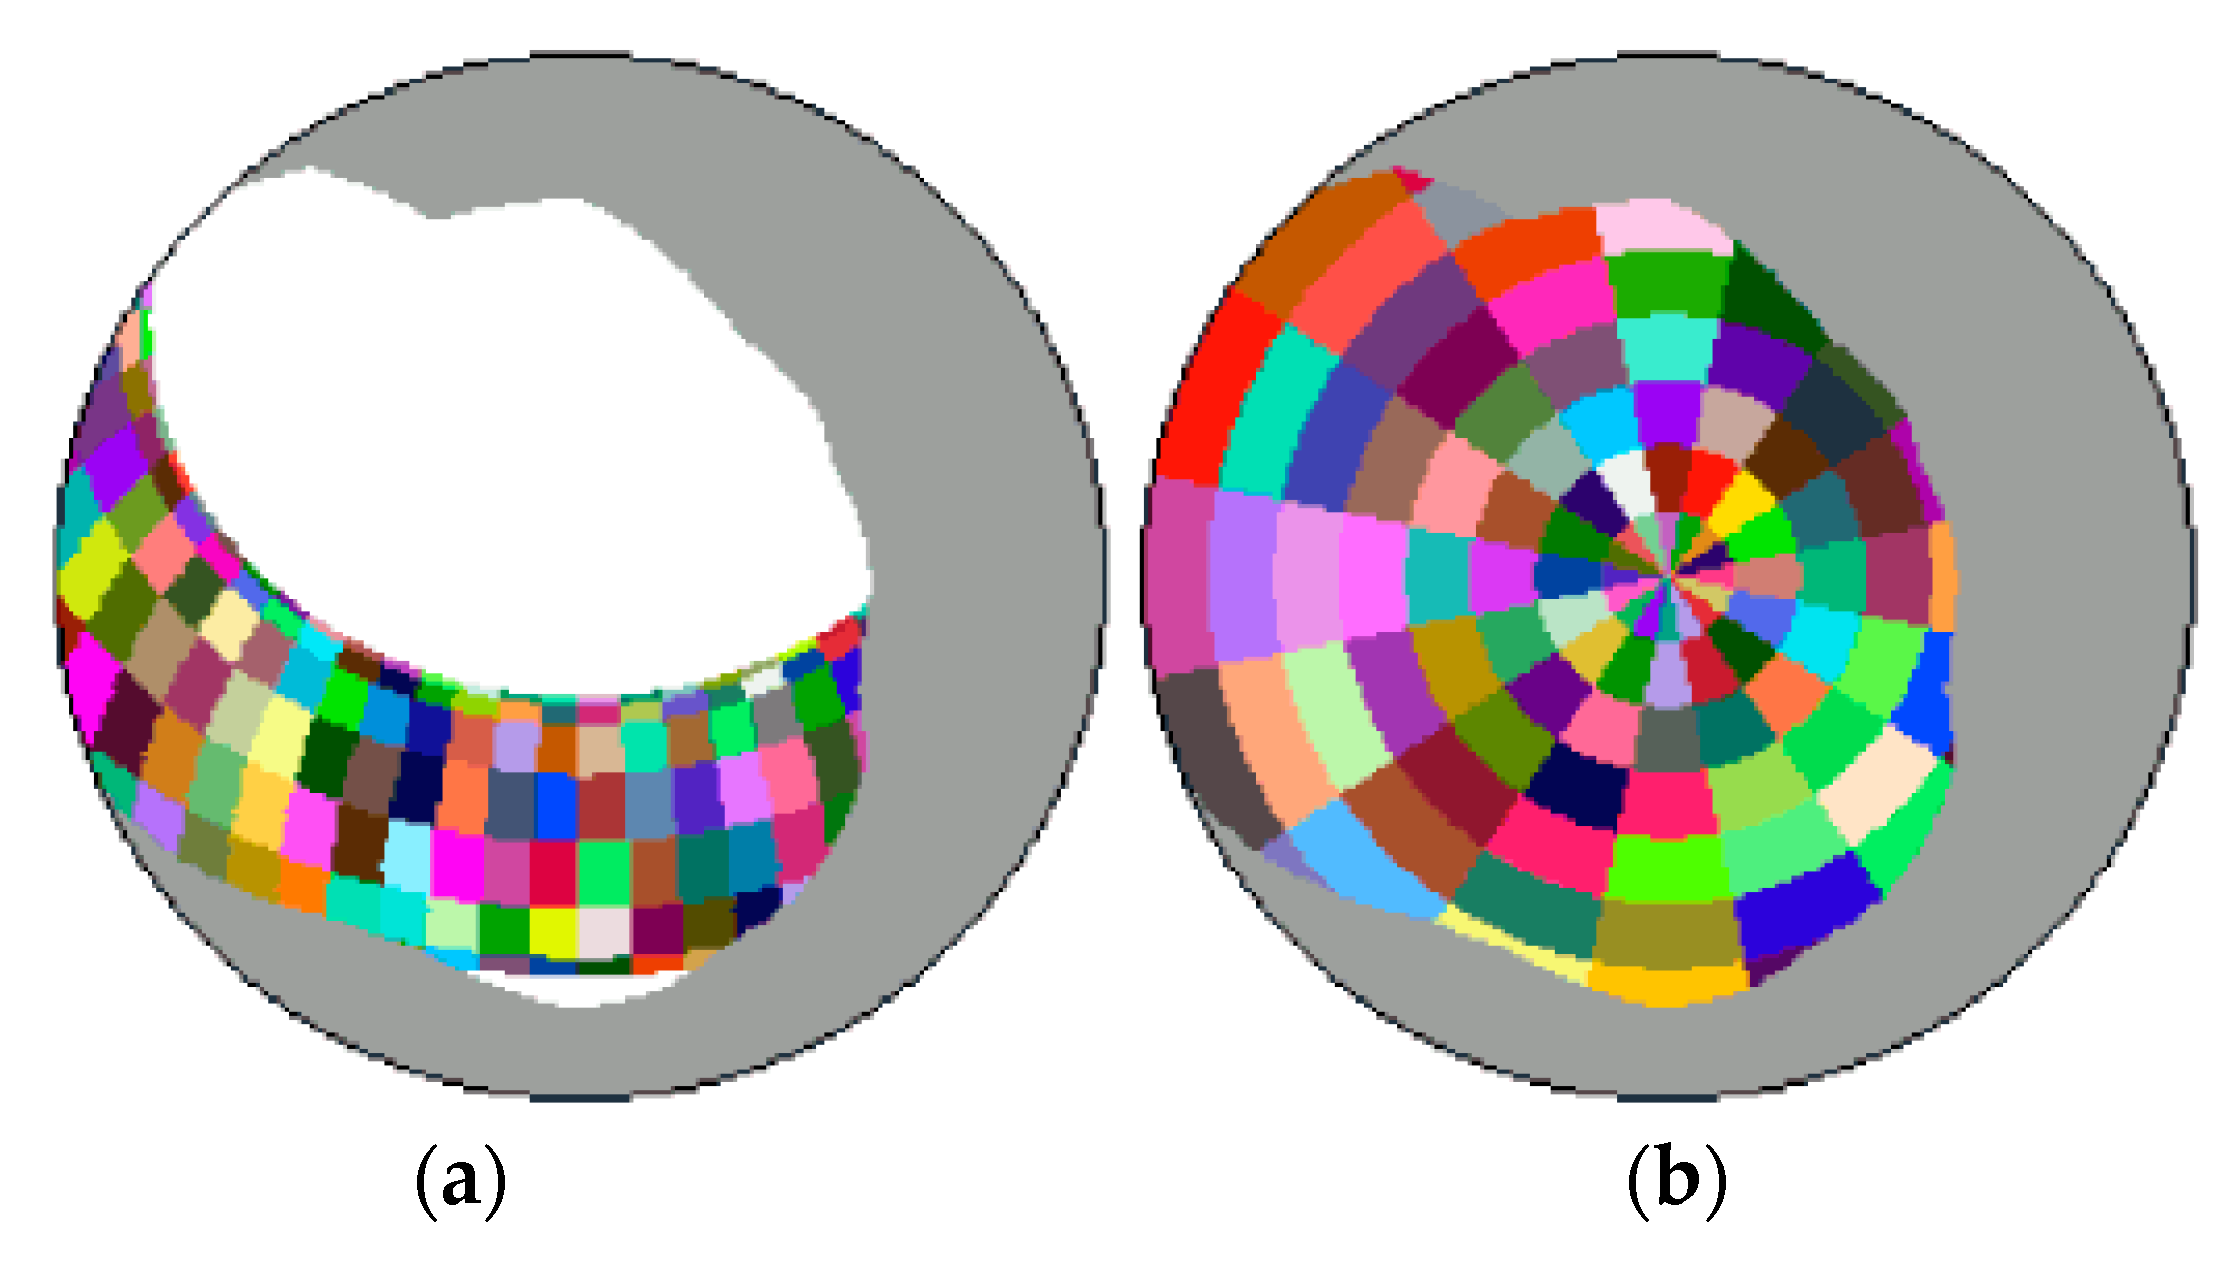
Figure 5.
(a) Station Plaza measurement points. Evaluation results of (b) hourly and (c) daily integrated solar radiation shielding by buildings and trees in Station Plaza.
Figure 5.
(a) Station Plaza measurement points. Evaluation results of (b) hourly and (c) daily integrated solar radiation shielding by buildings and trees in Station Plaza.

Figure 6.
(a) Green Garden measurement points. Evaluation results of (b) hourly and (c) daily integrated solar radiation shield by buildings and trees in Green Garden.
Figure 6.
(a) Green Garden measurement points. Evaluation results of (b) hourly and (c) daily integrated solar radiation shield by buildings and trees in Green Garden.

Figure 7.
(a) Evaluation points. The relationship between the distance from the south side buildings with the height of (b) 45 m and (c) 154 m, and the daily integrated solar radiation shielding.
Figure 7.
(a) Evaluation points. The relationship between the distance from the south side buildings with the height of (b) 45 m and (c) 154 m, and the daily integrated solar radiation shielding.

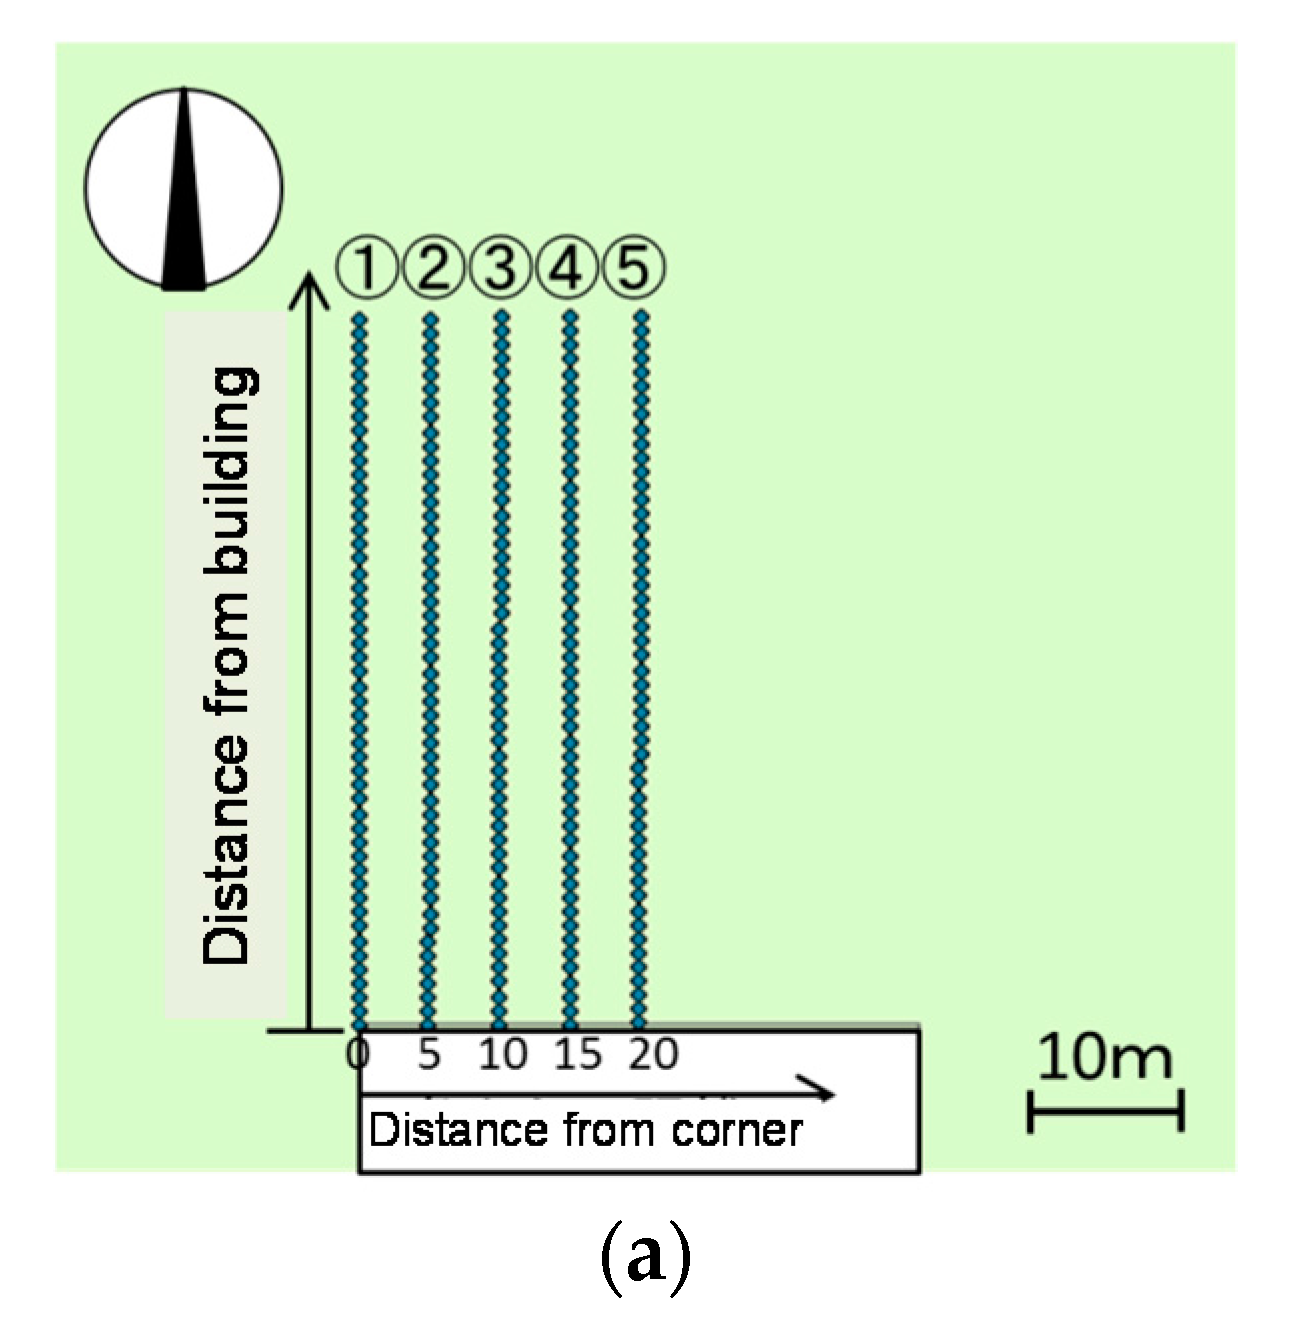
Figure 8.
(a) Evaluation points. Daily integrated solar radiation shield and the distance from the southern buildings with (b) 20 m height, (c) 40 m height, and (d) 160 m height.
Figure 8.
(a) Evaluation points. Daily integrated solar radiation shield and the distance from the southern buildings with (b) 20 m height, (c) 40 m height, and (d) 160 m height.

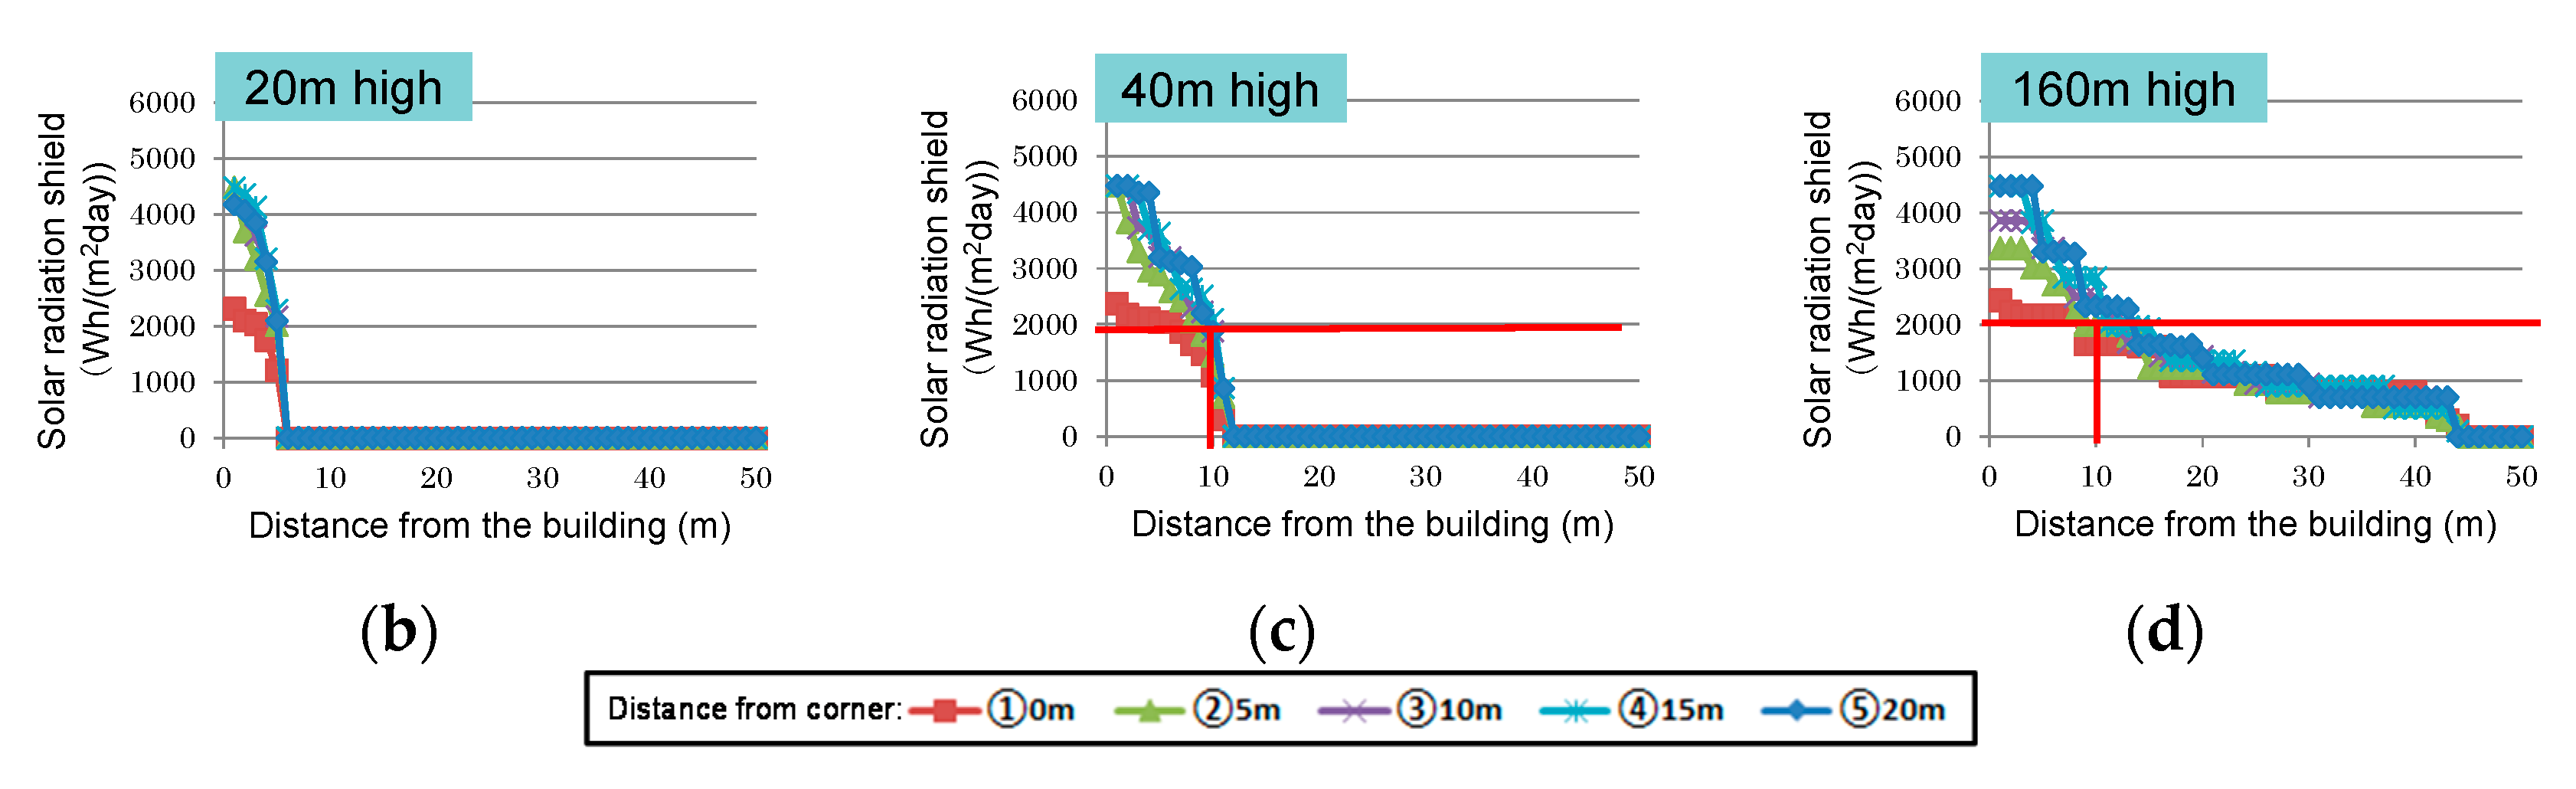
Figure 9.
(a) Evaluation points. Relationship between the distance from the west side of the building with the height of (b) 174 m, from the east side of the building with the height of (c) 73 m, and the daily integrated solar radiation shielding.
Figure 9.
(a) Evaluation points. Relationship between the distance from the west side of the building with the height of (b) 174 m, from the east side of the building with the height of (c) 73 m, and the daily integrated solar radiation shielding.
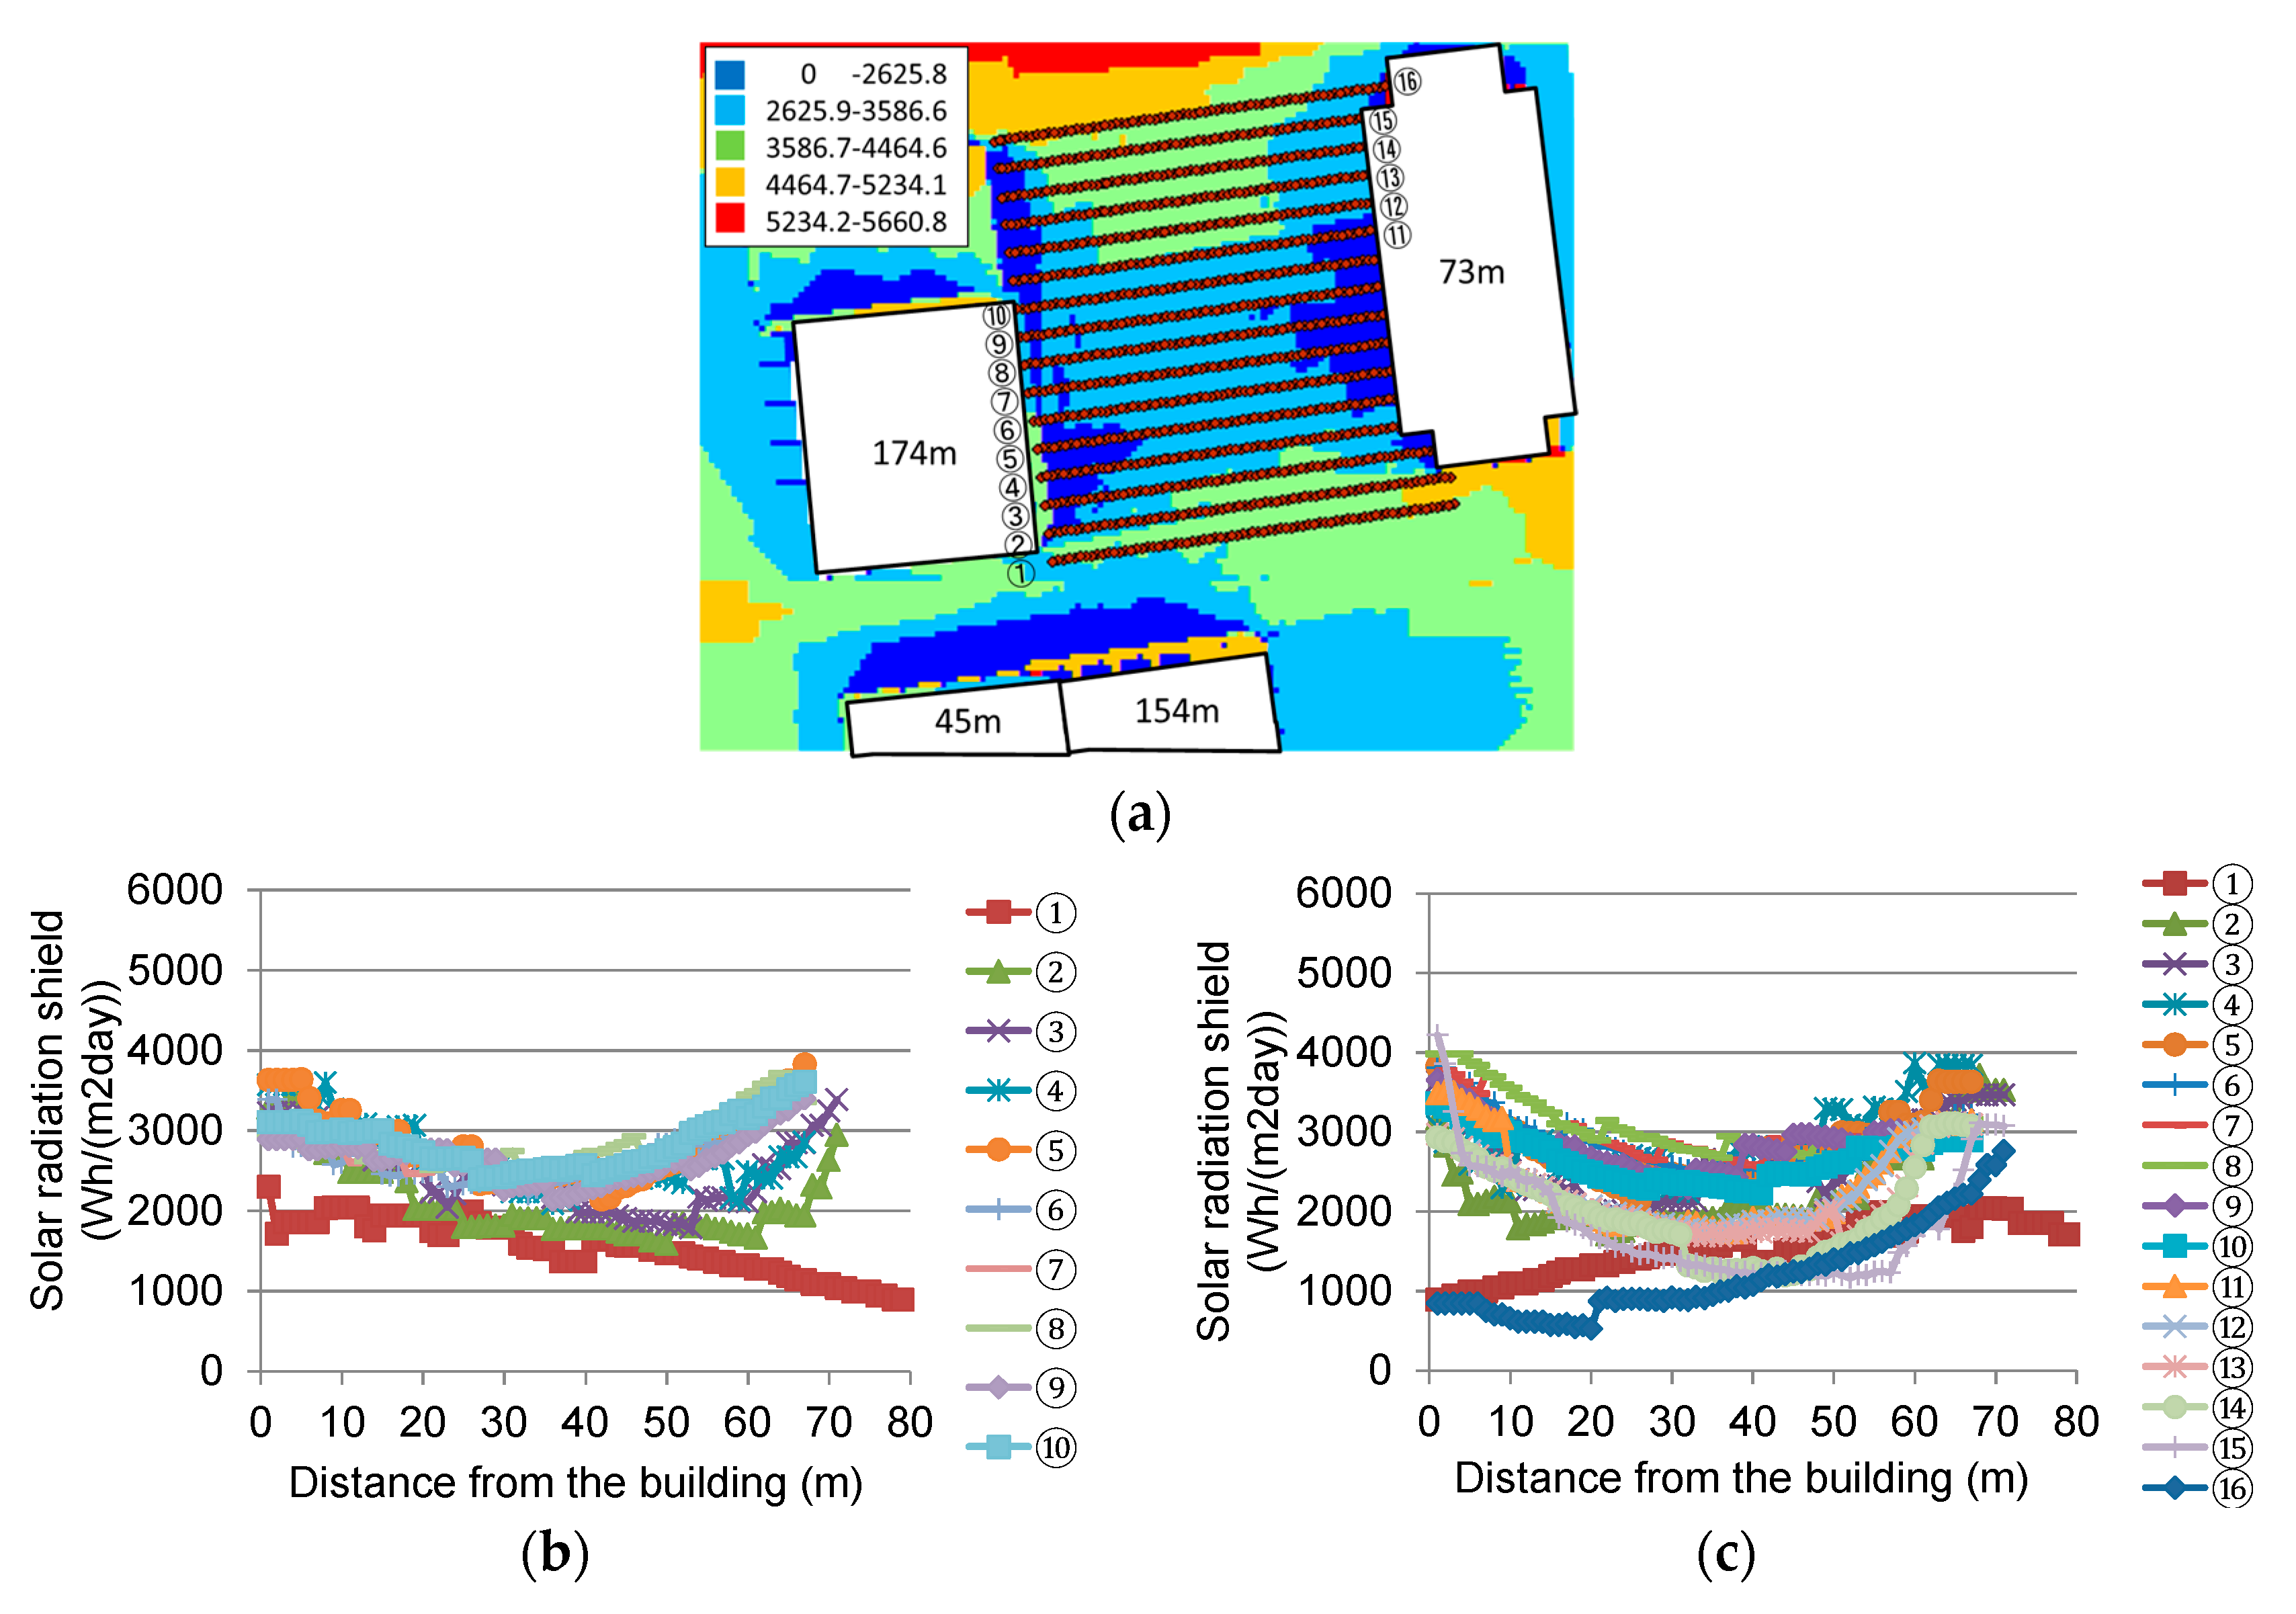
Figure 10.
(a) Evaluation points. Daily integrated solar radiation shielding and the distance from the western buildings with (b) 20 m height, (c) 40 m height, and (d) 160 m height.
Figure 10.
(a) Evaluation points. Daily integrated solar radiation shielding and the distance from the western buildings with (b) 20 m height, (c) 40 m height, and (d) 160 m height.


Table 1.
Solar shading situation at each point where photos were taken in Station Plaza.
| 10:00 | 13:00 | 17:00 | |
|---|---|---|---|
| Sunny | 19 | 24 | 14 |
| Shade | 6 | 1 | 11 |
| by buildings | 5 | 0 | 11 |
| by trees | 1 | 1 | 0 |
Table 2.
Solar shading situation at each point where photos were taken in Green Garden.
| 10:00 | 13:00 | 17:00 | |
|---|---|---|---|
| Sunny | 12 | 16 | 6 |
| Shade | 20 | 16 | 26 |
| by buildings | 13 | 12 | 20 |
| by trees | 7 | 4 | 6 |
© 2017 by the authors. Licensee MDPI, Basel, Switzerland. This article is an open access article distributed under the terms and conditions of the Creative Commons Attribution (CC BY) license (http://creativecommons.org/licenses/by/4.0/).
Share and Cite
MDPI and ACS Style
Takebayashi, H.; Kasahara, M.; Tanabe, S.; Kouyama, M. Analysis of Solar Radiation Shading Effects by Trees in the Open Space around Buildings. Sustainability 2017, 9, 1398. https://doi.org/10.3390/su9081398
AMA Style
Takebayashi H, Kasahara M, Tanabe S, Kouyama M. Analysis of Solar Radiation Shading Effects by Trees in the Open Space around Buildings. Sustainability. 2017; 9(8):1398. https://doi.org/10.3390/su9081398
Chicago/Turabian StyleTakebayashi, Hideki, Makiko Kasahara, Shingo Tanabe, and Makoto Kouyama. 2017. "Analysis of Solar Radiation Shading Effects by Trees in the Open Space around Buildings" Sustainability 9, no. 8: 1398. https://doi.org/10.3390/su9081398
Note that from the first issue of 2016, this journal uses article numbers instead of page numbers. See further details here.