Dynamic Technological Diversification and Its Impact on Firms’ Performance: An Empirical Analysis of Korean IT Firms


1
Graduate School of Management of Technology, Korea University, Seongbuk-gu, Seoul 02841, Korea
2
Graduate School of Industrial Management Engineering, Korea University, Seongbuk-gu, Seoul 02841, Korea
3
Division of Industrial Management Engineering, Korea University, Seongbuk-gu, Seoul 02841, Korea
*
Author to whom correspondence should be addressed.
Sustainability 2017, 9(7), 1239; https://doi.org/10.3390/su9071239
Submission received: 21 May 2017
/
Revised: 11 July 2017
/
Accepted: 13 July 2017
/
Published: 15 July 2017
(This article belongs to the Section Economic and Business Aspects of Sustainability)
Abstract
:This paper aims to analyze the influence of the technological diversification on a firm’s innovation capabilities and investigates the effect of various strategies on the firm’s financial performance in a technology-oriented environment. We employ the entropy measurement to calculate technological diversification with 2095 patents, which are applied from years 2009 to 2011 by 507 firms that have participated in Korean government Information Technology (IT) Research and Development (R&D) supporting programs. In our framework, a firm should not diversify among the related technology fields, but should concentrate on a specific technology to reinforce the competitive advantage. However, in the case of the firms with sufficient resources, increasing technological diversification among the unrelated technology fields plays a key role on the firms’ performance. Furthermore, the degree of the technological diversification should be adjusted dynamically in compliance with the change of a firm’s innovation capabilities. Therefore, these results suggest that a firm should develop differentiated competitiveness through specialization by prioritizing its capabilities, and then exploit unrelated technological diversification to search for new opportunities.
1. Introduction
Recently, as the impact of technology on society as a whole increases, a technology oriented firm has gradually recognized the needs of sustainable technologies, which are technologies that solve many arising problems to sustain human life [1]. Although the seizing of these technologies is an explicit and simple way to sustain a firm’s business activities, sustainable technologies alone are not enough, because technology has a finite life time, which can be seen through technology S-curve, disruptive innovation, and so on. In addition, many firms cannot develop sustainable technologies, due to their constrained resources. Thus, a firm is forced to explore other methods, one of which is to develop strategies to improve the performance of a firm by utilizing existing technologies and anticipating future technologies, and the performance in turn will act as a headstone for innovation that is sustainable [2]. Therefore, firms need to make prudent decisions regarding their technological diversification strategies because, in an environment characterized by rapid technological change, firm profitability depends on these strategies [3,4]. Many researchers in various fields such as strategic management, industrial organization, and financial management have investigated the relationship between diversification and performance. They explain that there are usually two broad perspectives for a firm to choose the diversification strategy. First of all, a firm anticipates to gain incentives such as reduction of the risk, creation of the synergy among resources, and more spill-over from an investment perspective [5,6,7,8,9]. Secondly, increasing technology license through technological diversification causes other firms’ technology dependency, in spite of raising value protection concerns in terms of an application view [10,11,12]. So, a firm establishes the optimal diversification strategy to maximize the benefit on the process of innovation activities including technology, product, and market.
Specifically, in technology-driven industries, a firm has been confronted with implementing breakthrough in new technologies, products, and processes to keep sustainable competitive advantages, as well as implementing converging technologies in combination of existing technologies to find new growth engines. So, as time goes on, a firm will prefer to evolve into multi-tech firm rather than hi-tech firm [13,14]. On the other hand, the continuous increase in Research and Development (R&D) costs, the shorter technology life cycle, and the portfolio of products and services to meet market demands further compel to expand the scope of technology, thereby increasing the burden on the management [15,16,17,18]. Ultimately, the prudent and rational strategy about the rate and degree of technological diversification is becoming increasingly important.
The theoretical framework for innovation in existing literatures can mainly be divided by the perspectives of classification and processing of resources for technological diversification [19]. In the resource-based view (RBV) framework, technological diversification develops synergy among the internal resources of a firm rather than risk-reduction [5,20]. Inbound open innovation (OI) exploits external resources to explore and obtain knowledge from external sources such as information, alliance and licensing. Inbound OI helps small and medium-sized enterprises (SMEs) with technological diversification [12,21,22,23]. This is a rational strategy considering SMEs are strictly constrained with limited internal resources. Bigliardi and Galati [24] show that IT firms are hesitant to employ OI due to knowledge barriers that may cause the loss of know-how and/or imitation by competitors, rather than financial and organizational problems in previous studies on the hinders of OI. The researchers also assert the importance of intellectual properties rights. It is also interesting to note that heterogeneity and immobility, which are prerequisites for resources that are important in RBV, can be maintained even in a recent networked environment where alliances are frequent. These results show that a firm needs to consider not only internal resources but also shared resources [25].
In contrast, given the importance of active coping with resources and a firm’s capabilities in a rapidly changing turbulent environment, the dynamic capabilities theory (DCT) may be considered as the most appropriate innovation framework to explain technological diversification. However, in contrast to RBV and OI that analyze the impacts of technological diversification on the acquisition and exploitation of internal or external resources, DCT seeks to integrate and reconfigure existing resources [26]. DCT differs from the above two innovation frameworks by employing a process view for technological diversification [19,27]. The research on technological diversification, in this end, needs to be analyzed in details, varying from internal resources of a firm based on RBV to external resources with OI. It is necessary to optimize the recombination of these resources in the view of DCT.
To achieve this, this study first investigates the internal corporative strength and resources on the effectiveness of technological diversification from a RBV perspective. Furthermore, we will further investigate different modes of resources (both internal and external) and different capabilities with the seized resources such as dynamic integration, learning and reconfiguration [19,26].
As mentioned above, a firm tends to prefer technological diversification as a strategy to maximize the availability of internal resources. From this point of view, most of the previous studies demonstrate that technological diversification is positively linked with a firm’s performance, as it leads to more innovation and creates synergy among technological resources such as know-how and intellectual properties [5,6,7,15,20,28]. There are also, notwithstanding, many reviews that argue a firm should focus on specific technology due to specialization and economy of scale [29,30,31,32,33]. On the other hand, researchers acknowledge that the relationship between technological diversification and performance is not linear as the technological diversification increases, but rather, curvilinear of inverted-U, because of the correlation between the synergy among resources and the management cost [16,34,35,36]. It is also found that a firm has the features of conditional opposition by the moderators such as the firm’s absorptive capacity, technological relatedness, technological capabilities, and firm’s size [5,37,38,39].
One of the possible explanations for why there is no clear consensus on this topic is that insufficient consideration has been given to two important factors. First, the innovation capabilities of a firm, which allow a firm to improve current products or create new products, are not static, but rather vary over time and with changes to the environment [4,40]. So, the effects of technological diversification on a firm must be interpreted individually upon the changes of the innovation capabilities of the firm.
Next, a firm’s resources cannot merely be regarded as a dependent variable on the performance. Even though a firm has enough capabilities and good performance, it may intentionally adjust the amount of resources to take advantage of the benefits like policies for SMEs, which are at the time of building the technology strategy [41]. For example, Peter Pan syndrome, where the firm prefers remaining small despite the eligibility to expand the scale, is a typical phenomenon resulting from external conditions surrounding a firm. It is, therefore, reasonable to analyze the effects of technological diversification by distinguishing firms’ groups with similar size and regime [42].
In this paper, we compare and analyze how the technological diversification strategy of each group ultimately affects a firm’s performance by classifying firms into 2 by 2 matrix according to the innovation capabilities and the amount of resources that the firm has, as shown in Figure 1. In addition, since a firm is like a living organism [43], it is desirable to take an active strategy to cope with changes in the firm’s innovation capabilities because the current technological diversification strategy cannot guarantee success in the future. We also deal with how to modify strategies dynamically.
2. Literature Review and Hypotheses
2.1. Related Technological Diversification (RTD) Versus Unrelated Technological Diversification (UTD)
We adopt the view that technological diversification can be divided into unrelated technological diversification (UTD), which indicates the extent of technological diversification among irrelevant technology fields, and related technological diversification (RTD), which refers to the extent of technological diversification on relevant technology fields, with the entropy measurement [29,34,44,45,46]. The entropy measurement has advantages in terms of simple measurement, repeatability, and objectivity compared to categories measurement like seven categories [3,47]. In addition, it is capable of more detailed and sensitive analysis compared to Herfindahl index due to a logarithm factor [47,48].
As the market becomes more competitive, mature, and unfriendly, a firm should research and develop new products resulting from technology convergence and interactions among different technology fields through various R&D projects based on plenty of resources in order to search for the new fields for value creation [44,49]. However, technological diversification requires the coordination and integration cost for the resources. In particular, the management costs for heterogeneous technologies can go beyond linear relationships and lead to exponential growth because the coordination and integration are more difficult [15,16,50].
Therefore, a large firm that is capable of carrying out innovation against the cost burden, as well as having more physical, financial, manpower, and technological resources to implement diverse projects, has to focus on UTD strategy to gain a dominant position in emerging markets, away from a competitive and unfriendly market environment [5,39,42]. On the contrary, a small firm that suffers from limited resources need to consider alternatively not only in-house R&D but also OI which is strategic networks such as cooperation between firms, alliances, outsourcing in order to advance into the new field in spite of the concerns about the leakage of knowledge due to inter-firm networking [24,25]. So, the following hypotheses are proposed:
Hypothesis 1A (H1A).
UTD is positively associated with a firm that has sufficient capabilities.
Hypothesis 1B (H1B).
UTD is positively associated with a firm that can possess a lot of resources.
If UTD is said to have an impact on a firm in creating new value, RTD is a strategy to consider in terms of how to capture value for a firm. A firm can strengthen the value by providing customers with a variety of customized products developed by related technologies [42], which is based on sharing accumulated technology stocks within common scientific principles or similar heuristics of search [51].
Furthermore, a firm may capture the value through the efficient use of internal resources and the benefits to invest more on R&D, since RTD gives the attenuation in the R&D project risk, receives more spill-over, and brings cost reduction from economy of scale [6,16]. Hence, this study postulates the following hypothesis:
Hypothesis 2 (H2).
RTD is positively affected with a firm’s performance monotonically.
2.2. Dynamic Technological Diversification Strategy Based on a Firm’s Innovation Capabilities
In a rapid technological change environment, a technology-based firm is always sensing and seizing the opportunities, managing threats, and executing reconfiguration to gain profitable growth. A firm prefers to follow innovation activities along its routine since heuristic path-dependent way gives more comfort to the firm and changing routines may increase cost. However, the strategy of recombination and reconfiguration of the assets should be modified as a firm either grows or declines [4].
A recent paper even suggests that the temporary competitive advantage is more appropriate model than sustainable competitive advantage to explain the capabilities that impacts a firm’s performance more than sustainable competitive advantage under extremely dynamic, uncertain, and unstable technology environment [18]. RBV also perceives that the differentiated resources may dissipate over changes in environment and time, and consider the importance of the dynamic resources management [51].
From a firm’s perspective, a firm should adjust the degree of the technological diversification persistently in accordance with its capabilities, as nothing is indefinitely sustainable [7]. Therefore, the following hypothesis is proposed:
Hypothesis 3 (H3).
Dynamic technology diversification strategy responding to changes in a firm’s innovation capabilities has positive effect on the firm’s performance.
3. Materials and Methods
3.1. Data
This paper investigates the relationship between technological diversification and a firm’s performance by primarily using the firm’s patent applications and financial data. Korean IT firms are leading the IT industry of the world, and the OECD analyzed that the United States, Japan and Korea led inventive activities in IT, Bio and Nano innovation from 2010 to 2012. This makes Korean IT firms to be appropriate samples for research on technology diversification and performance [52]. The information of firms participated in Korean government IT R&D supporting programs (K-IT R&D Programs) is obtained from the National Science & Technology Information Service (NTIS), which is managed by the Korean government (Ministry of Science, ICT & Future Planning).
The original dataset included all Korean firms participating in K-IT R&D Programs from 1999 to 2011, which require verification process for the level and capabilities of innovation by the third-party evaluation agency. From this data, we eliminated firms that neglected crucial information needed for analysis such as net income, return on sales, and the number of International Patent Classification (IPC) included in a patent. Of the remaining data, we carefully selected firms so that the selected set of firms will represent the demographics of diverse IT sectors of the Korean IT firms. The final selection of 507 Korean firms consist of different sizes and sectors, which are in concurrence with the distribution of the entire Korean IT firms.
The patent data were collected from the database maintained by the Korean Intellectual Property Office (KIPO) and the worldwide patent information service provider (WIPS). Patent is regarded as a good objective indicator to measure a firm’s innovation activities. Patents can be seen from two perspectives: one as the result of R&D activities, and another one as the extension of R&D investment. Depending on the two perspectives, patents can be seen either as an input or output index. Also, since only a part of firms’ innovations is reflected as patents, it is risky to determine firms’ innovation using solely patents [53]. However, firms participating in Korean Government R&D Program are required to file the results of technology innovation as patents, and the number and quality of patents are used as an important index to determine the successiveness of the project. In addition, patent application is used to evaluate the position of a firm’s technological competence in many literatures [16,17,39,54]. Moreover, some researchers have argued that a patent leads the degree of technological diversification of a firm, and it is positively associated with the firm’s performance [6,55]. Therefore, we adopt patents as the index that show the results of firms’ innovation activities, which are directly related to firms’ performances.
IPC, which consists of several hierarchical structures, is an index that classifies the technical attributes of a patent. The code is mainly used to distinguish technology fields related to a patent and to measure the degree of technology diversification. The class level of the IPC code usually represents unrelated technology fields [6,54,56]. Furthermore, the subclass level can describe various technologies in detail since it has more than 7400 codes for group categories [57,58]. Thus, total technological diversification is measured at subclass level of the IPC code to calculate RTD through Jacquemin–Berry entropy measure, and UTD is measured at class level [44,47].
Therefore, to measure the technological diversification at firm’s level, we adopt the IPC codes of the 2095 patent applications that are produced by the sample firms participated in K-IT R&D Programs from 2009 and 2011.
Financial data consisting of total asset, sales, and net income of the sample firms from 2002 to 2012 are obtained from the database maintained by National Information & Credit Evaluation Inc., which is a famous and reputable credit information and financial service agency in Korea.
3.2. Variables
Firm’s innovation capabilities (PCAP) and performance (FPER): A firm has an innovation system that not only improves its innovation capabilities through the interactive processes such as learning various precedents, adopting and diffusing of the knowledge, and creating new ideas, but also links innovation capabilities to the firm’s performance [59].
In the technology-driven industry, attention should be paid to the role of technological innovation capabilities to manage the innovation system successfully. However, it should be noted that technological innovation capabilities are not referring to patent-oriented technological assets, which may be often confused, but to the comprehensive set of characteristics including business factors such as manufacturing, production, marketing, organization, and strategy planning [37,60,61,62].
For example, even though a firm has outstanding technological patents, it may be obliged to require expensive resources like organization and financial assets for continuous development and production of products. In addition, although the innovation system affects a firm’s innovation capabilities positively in terms of mid- and long-term, it might act as a firm’s risk in short-term because of requiring the cost at that time. So, it is necessary to regard technological innovation capabilities as the overall capabilities of a firm instead of the narrow scope like the technological assets in order to analyze the relationship between performance and the technology strategy.
Therefore, we define a firm’s innovation capabilities (PCAP) as the firm’s growth rate for the period when the firm made its decision to engage in R&D planning and project participation. On the other hand, we also calculate a firm’s growth rate to evaluate the firm’s performance (FPER), as is calculated with PCAP (i.e., the benefits of technological diversification after the period during which their technology strategy is planned).
Time periods (TPCAP, TFPER): Occurrence of time lags is inevitable among strategy, R&D, and performance [53,63]. In order to investigate the influence of technological diversification on the FPER under PCAP, we divide time periods, as shown in Figure 2, into TPCAP and TFPER, which respectively are the prior stage in which a firm applies for patents (i.e., at the period when a firm chooses the strategy, 2005 to 2008), and the stage (i.e., 2009 to 2012) to have performance associated with technological diversification.
4 Groups (NN, PN, NP and PP): To compute a firm’s growth rate, return on sales (ROS) of each firm for each year during the period from 2002 to 2012 is measured, and then 4 year moving average ROS is calculated for each year from 2005 to 2012 to eliminate some of the noise in annual financial data [5,47,50]. Secondly, the linear regression analysis for relationship between ROS and year for each firm in both TPCAP stage and TFPER stage is implemented. The sign of coefficient in the result indicates the trend of either capabilities or performance. So, in order to investigate the influence of technological diversification in accordance with a firm’s innovation capabilities, firms are classified into 4 groups, which are negative PCAP-negative FPER (NN), positive PCAP-negative FPER (PN), negative PCAP-positive FPER (NP), and positive PCAP-positive FPER (PP), according to the sign of coefficient of the linear regression analysis.
Firm’s size (Small, Large): The previous literatures argue that innovation may be either increased or decreased as the linear increment of a firm’s size [64]. The reason for this is that the relationship between management efficiency and the amount of resources comes from the premise related with internal mechanism, where linear proportional properties exist. In other words, the wealth of resources of a large firm means that economies of scale can be achieved, and a small firm can respond swiftly and flexibly to rapid changes in the environment.
A firm’s size, moreover, is a trade-off between internal benefits and various external conditions like tax exemption, managerial transparency, government R&D policies, and employment benefits. Thus, as a firm grows, it often does not naturally increase the amount of resources, but deliberately limit them according to external conditions. These often occur in Korea [65] because various exclusive benefits such as government R&D budget to overcome the barriers of risky R&D projects or to stimulate internal R&D, tax exemption, and employment benefit are offered to small firms meeting the statutory requirements [66,67].
For this reason, we divide the sample firms into the following conditions in order to compare groups that have both similar amount of resources and external conditions [68]. Small is defined as less than 100 million dollars of sales per year and less than 500 million dollars of total assets, and Large is other firms by law that defines the small firm in the Korean government.
Technological diversification (TD, UTD, RTD): For the purpose of the research for technological diversification at TPCAP stage, we calculate total technological diversification (TD) of each group as below:
where Pi is the proportion of technology fields in Nth IPC code at subclass level (i.e., group level) of a patent S in each group. An attractive feature of the entropy measure is that it can split related and unrelated components [47,48]. As described above, UTD is technological diversification at class level, and UTD of each group is calculated as follows:
where Pk is the proportion of technological field in Mth IPC code at class level of a patent S in each group. Also, M is less than or equal to N. Lastly, the RTD of each group is given by the following equation.
4. Results
4.1. Time Lag between Technological Diversification Strategy and Performance
According to common innovation studies, time between patent application to subsequent sales takes about 3 years [54], and time between R&D activities and patent granted takes about 3 years [55]. If we consider the process period for patent registration, we can estimate that R&D activities to patent application takes less than 3 years [69]. Note that R&D pre-planning period is included. In other words, a firm spends time to sense, seize, and reconfigure for the opportunities [4]. For example, government is obliged to make a 0.5 to 1 year plan for the project in K-IT R&D Programs, and then the maximum project announcement period of 0.5 year is kept for the firms that want to participate in the project. Consequently, a time lag between the decision stage to participate in the project and patent applications is more than 3 years.
Therefore, with the patents applied in between 2009 and 2011, we can infer that the decision for a firm to undertake R&D activities is decided from 2005 to 2008 (i.e., TPCAP). We investigate whether or not technological diversification in compliance with firm’s innovation capabilities at this period affects FPER.
4.2. Statistical Analysis for both UTD and RTD
Table 1 and Table 2 present the descriptive statistics for the sample firms, patent applications, and the means and standard deviation for both UTD and RTD. In addition, t-tests with a significance level of 0.1 are employed to analyze whether the differences in the means of UTD and RTD among the 4 groups in Small and Large is significant [47].
The results of the t-tests (Table 3 and Table 4, Figure 3) demonstrate that both UTD and RTD affect FPER in terms of PCAP and both Small and Large differently. According to the results, the lower RTD group under the same condition of PCAP (NN versus NP or PN versus PP) has the better FPER for both Large and Small, in spite of the fact that the increase from NN to NP has significance within 0.1 significance levels. On the other hand, in case of UTD, there is no significant differences of the mean among the groups in Small, but it is found that in Large, the mean of NP and PP are much higher than that of NN and PN.
Interestingly, the lower RTD, the better FPER in Small. In Large, however, the higher UTD, the better FPER under the condition of RTD like Small. These imply that Small and Large should choose different technological diversification.
5. Discussion
5.1. Association of Technological Diversification with FPER
Hypothesis H1 assumes that UTD has positive influence on FPER of a firm, which has capabilities to implement innovation activities and manage its sufficient resources. As the result shows, because UTD is significant only in Large, hypothesis H1B is valid in that UTD affects FPER according to the amount of resources available to the firm and external conditions [5,39]. However, hypothesis H1A for the FPER according to PCAP is not significant in that FPER of the groups with higher UTD shows better results in common.
In conclusion, in order to create new value, firms over certain size, which can possess sufficient resources, need to exploit new markets through technology convergence.
Hypothesis H2 predicts that RTD contributes to FPER affirmatively. However, both Small and Large should reduce RTD to achieve the better FPER regardless of PCAP as shown in Table 3 and Table 4. These results can be interpreted as that it is more important to secure differentiated resources than to manage factors such as the amount of resources, the conditions of competency and the business environment. This also is in line with the most fundamental premise of sustainable competitive advantage presented in RBV [70].
The relationship between technological diversification and strategic concentration can be considered a trade-off. That is, although there is a positive aspect that provides efficient use of resources and various choices for customers, it also shows inevitable limitation in lower quality of resources as dispersing firm’s innovation capabilities [5,45].
The effect also is more significant to Small than Large. Hence, on the contrary, as previously stated in Hypothesis H2, a firm should not choose RTD strategy to gain the better FPER.
Just like the results of the IT firms, the value of RTD of PN group is higher than that of PP group in both small and large; the value of RTD of NN group is higher than that of PP group in small; the value of UTD of NN group in large is lower than that of NP group in large. These results are commonly observed in 183 firms engaged in bio-technology (BT) and in 130 firms engaged in nano-technology (NT). In other words, the higher UTD in large is better for FPER, and the lower RTD in both small and large is better for FPER. These results show the likelihood of applying the results to other industries. However, the number of patents surveyed from BT and NT firms, unfortunately, are just 462 and 448, which is not a convincing data considering the number of BT and NT firms. Thus, in this paper, we discuss only the results of IT firms.
5.2. How to Control Both UTD and RTD Dynamically in Order to Accomplish and Sustain Better FPER?
Hypothesis H3 supposes that technological diversification strategy should be revised dynamically as PCAP changes, because there is no single solution for sustainable competitive advantage in rapidly changing technology environment [18].
Therefore, we first implement the analysis for the relationship between technological diversification and PCAP with the results shown in Table 3 and Table 4, and Figure 3. First of all, the relationship between RTD and PCAP group in Small is analyzed. Assuming that the each mean of RTD in NN and NP is RTD1 and RTD2, the relationship between the two can be expressed as follows:
In the same way, if the mean of RTD in PP and PN is RTD3 and RTD4,
Also,
where αSR, βSR, and γSR are positive coefficients of each RTD. Considering the significance of the difference of the means between NP and PP:
Therefore, we can derive the following result in Small.
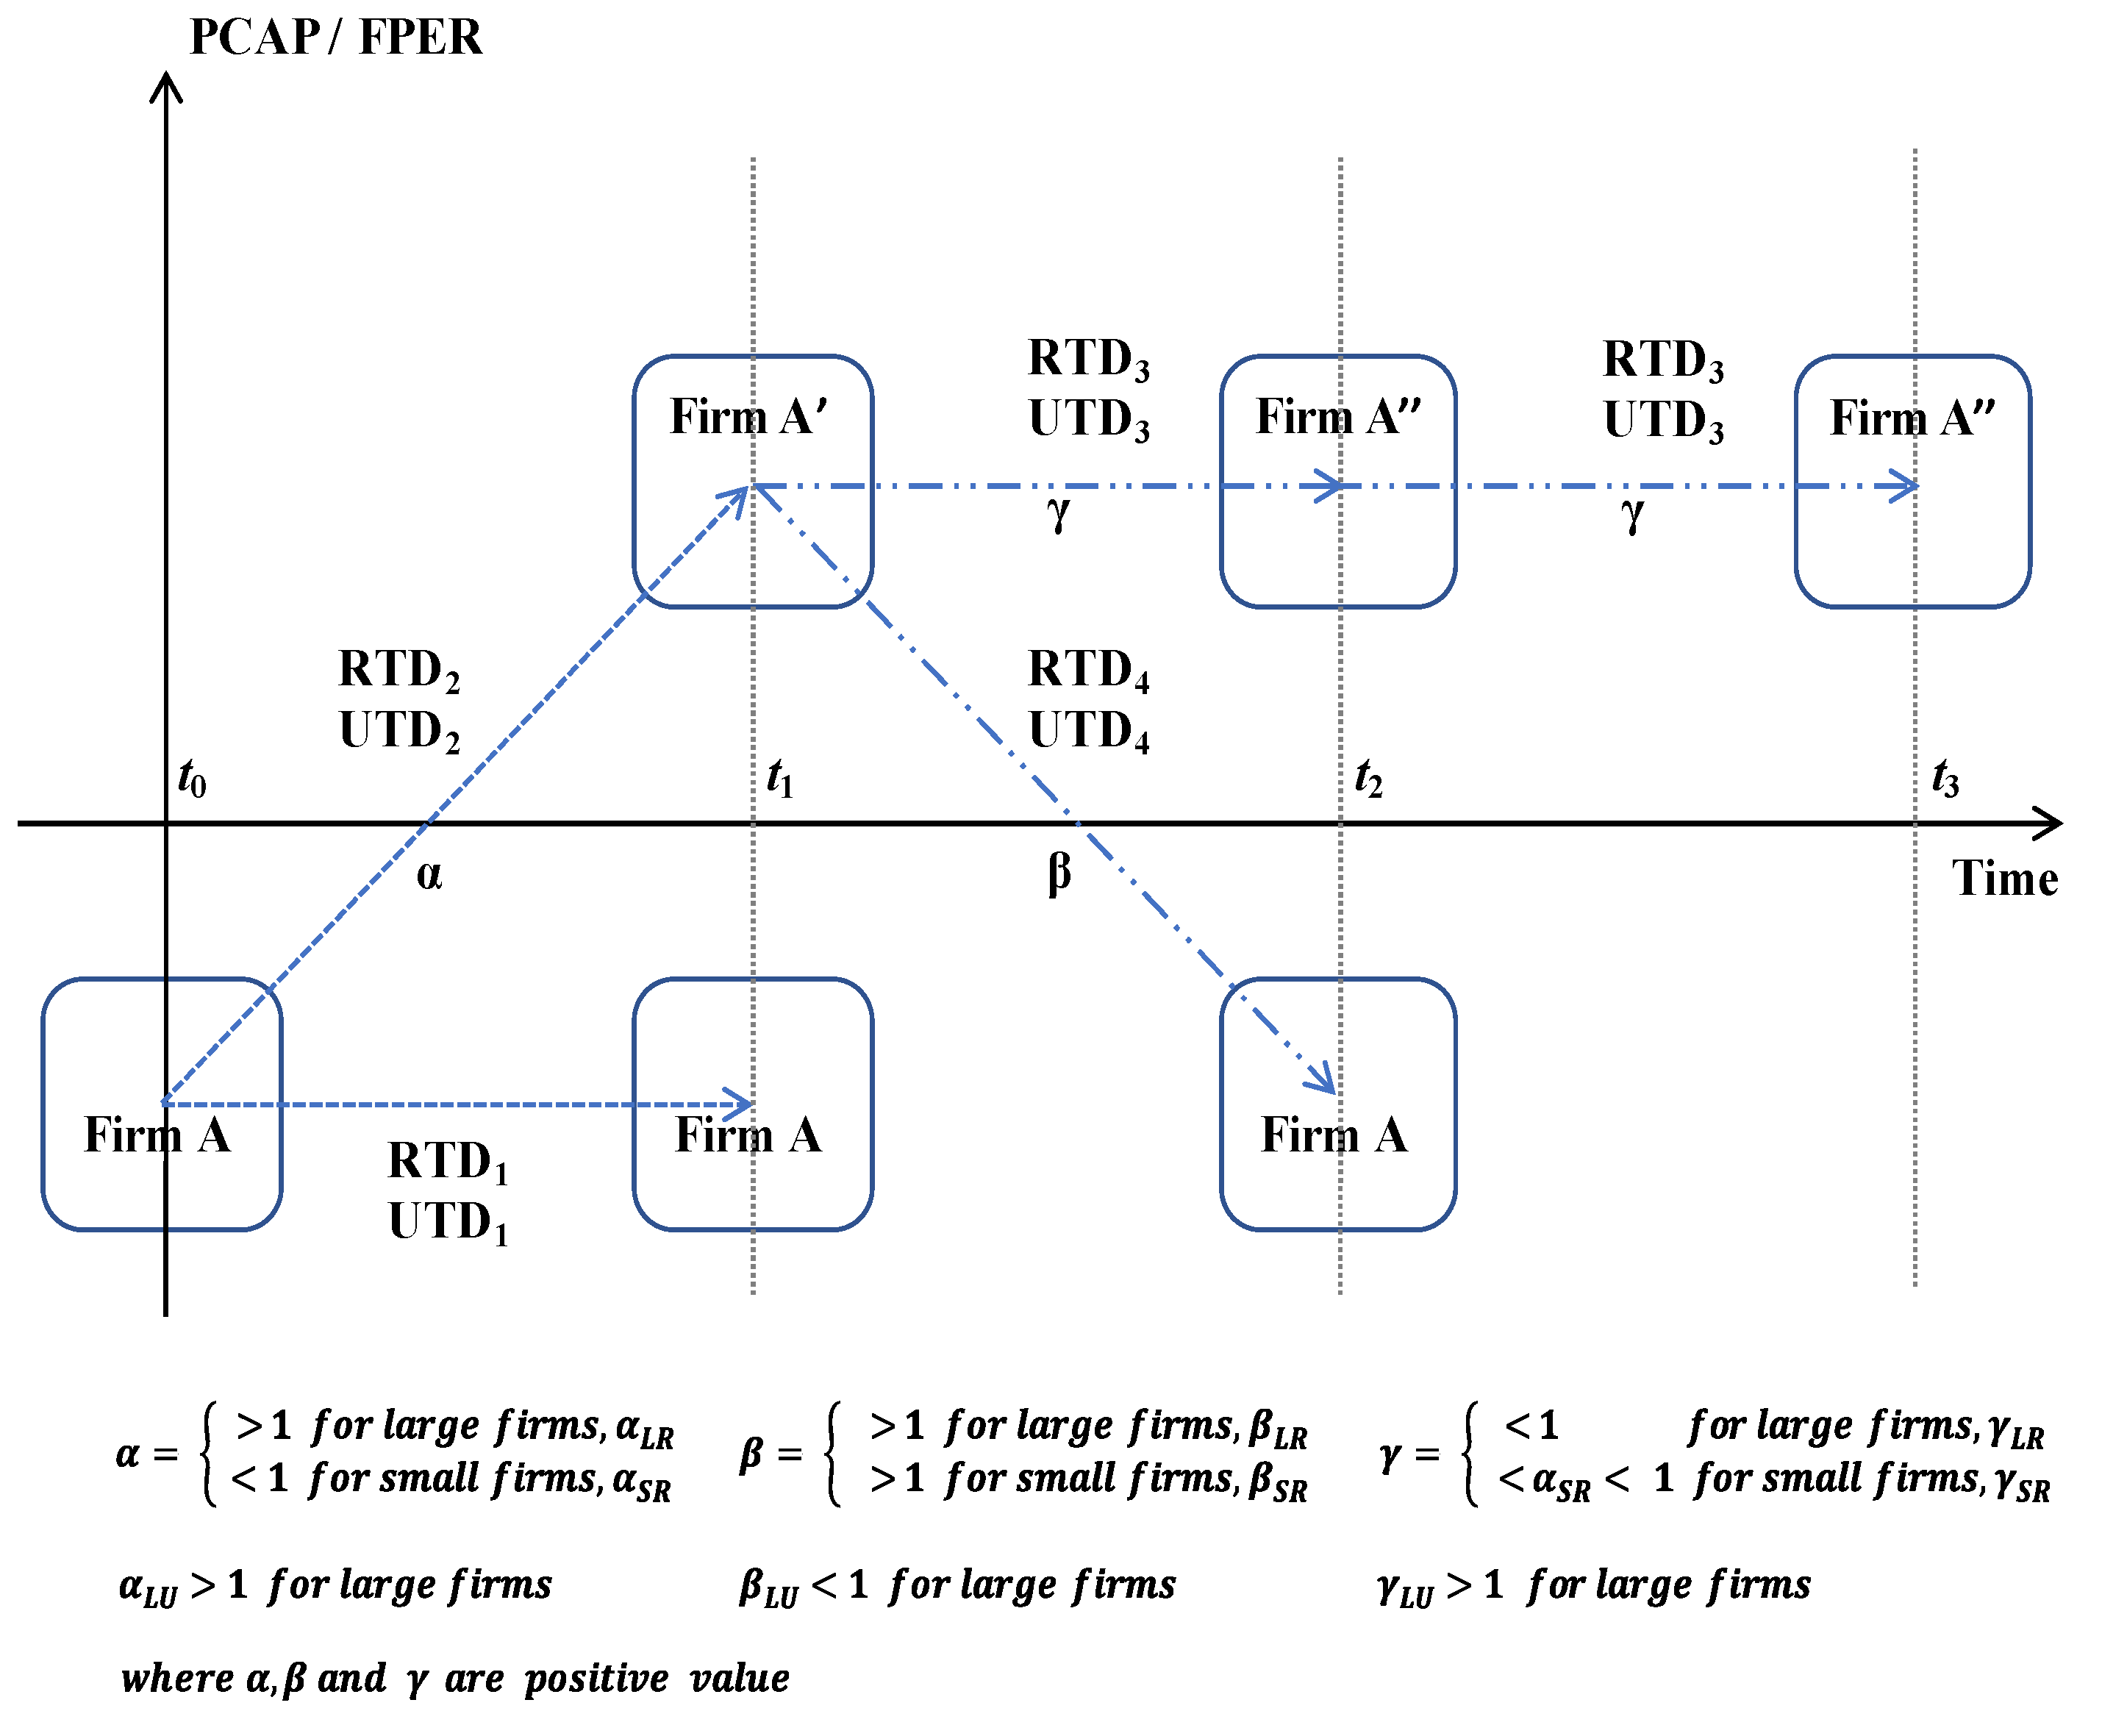
Figure 4 summarizes the resulting dynamic technological strategy model derived from this analysis. Based on this model, assuming that Firm A, which has negative PCAP, is trying to look for the opportunities to jump into positive FPER, it should not diversify into related technology, but should instead focus on specific technology since αSR < 1. If Firm A achieves positive FPER at t1 through technology focusing strategy from the standpoint of t0, it switches Firm A’, which has positive PCAP at t1. Then, the firm should focus on the core technology more intensively in order to sustain growth (Firm A”) since γSR < αSR. However, if Firm A’ chooses RTD strategy to create the synergy among related technologies, negative FPER is predicted because 1 < βSR, so it will fall back again at t2.
Eventually, building up capabilities dynamically through specialization in accordance with PCAP is more important for Small. Unfortunately, UTD was excluded from the analysis because it was not significant in Small, as described above.
Secondly, in the case of Large, both UTD and RTD are done likewise Small.
Also,
where αLR, βLR, and γLR are positive coefficients of each RTD, and αLU, βLU, and γLU are positive coefficients of each UTD for Large. Considering the significance of the difference of the means between NN-PN, and NP-PN in UTD and NP-PP in RTD,
And
Therefore, we can derive the following results in Large.
In contrast to Small, if Firm A that has negative PCAP wants to find the opportunities, it should diversify unrelated and related technologies in all sorts of ways as shown by and . This means that for a firm with a large number of resources that lacks capabilities, it should make the efforts both to explore new opportunities and to improve the inefficiencies of the resources it holds at the same time. Consequently, if Firm A moves to Firm A’ at t1, Firm A’ should keep the equivalent level of UTD, and it should downscale RTD and concentrate in a specific technology in order to go to Firm A” at t2 since and . If it is passive in leading the market through value creation or wants to create the synergy among technologies by constraint, it will be confronted by negative FPER again at t2.
6. Conclusions
The goal of this paper is to investigate how firms, in a long term, are likely to establish a technological diversification strategy as capabilities change while sustaining competitiveness and improving performance in order to remain economically and socially sustainable. Although the conclusions are mainly from IT firms, preliminary research from BT and NT firms shows similar trends, and thus it is possible to generalize the following interesting and meaning results regardless of technology fields.
First, UTD positively affects firm’s performance only when backed up with sufficient resources. For this reason, it should be noted that the majority of firms with limited resources constraints cannot achieve a significant effect on the performance with technological diversification into heterogeneous sectors. In other words, in order for these firms to escape a subordinate role in the market, it is necessary to take an alternative strategy such as OI that makes the optimized use of external resources as well. A firm with limited resources may also exploit additional opportunities externally with distinctive characteristics of new product development (NPD), i.e., radical, integrated, modularity, and incremental [71]. This also requires a careful review using a risk detection system in perspective of knowledge, organization, finance and strategy barrier [24].
Second, in order to solve the current capabilities deterioration, the firm should first decide the priority between the improvement of the efficiency of the resources possessed by the firm and the expansion of the differentiated resources. A large firm improves the efficiency of resource utilization and breaks through the current difficulties through active entry into new fields. It is noteworthy that a large firm continues to need to expand into UTD even after its capabilities have been improved ().
Third, once capabilities of the firm improve, it should endeavor technology focusing more intensively than ever, and in addition to this, the firm with sufficient resources should diversify among unrelated technologies steadily at the same time. It means that it should always exploit and explore technology fields to seize the opportunities, but should have differentiated capabilities for specialization.
Finally, especially for Korean firms, the optimal strategy is to secure differentiated competitiveness in their core technologies, and the firms with sufficient resources, simultaneously, have to establish a challenging strategy to create new value.
Based on these results, future research direction can be proposed. While the findings of the current study focus on the dynamic adjustments to the degree of technological diversification according to PCAP, we will extend the scope of resources that may be applied to technological diversification to include external resources, and investigate how to reconfigure these captured resources. This will improve a firm’s performance by the innovation frameworks such as OI and DCT.
Furthermore, for the more in-depth analysis, our research can expand in two ways. Internally, financial and non-financial capabilities, including growth potential of patents, can be considered to capture and improve weaknesses of a firm. Externally, condition of market environment, whether it is emerging or matured, can be considered to identify strategies that can cope with condition of markets, where a firm operates.
Acknowledgments
This work was supported under the framework of international cooperation program managed by National Research Foundation of Korea (NRF-2016K2A9A2A11938449).
Author Contributions
Sang Ho Kook and Chulung Lee conceived and designed the experiments; Ki Hong Kim analyzed the data; Sang Ho Kook and Ki Hong Kim wrote the paper, and Chulung Lee proofread and revised the manuscript. All authors have read and approved the final manuscript.
Conflicts of Interest
The authors declare no conflict of interest.
References
- Park, S.; Jun, S. Statistical Technology Analysis for Competitive Sustainability of Three Dimensional Printing. Sustainability 2017, 9, 1142. [Google Scholar] [CrossRef]
- Bos-Brouwers, H.E.J. Corporate Sustainability and Innovation in SMEs: Evidence of Themes and Activities in Practice. Bus. Strateg. Environ. 2010, 19, 417–435. [Google Scholar] [CrossRef]
- Rumelt, R.P. Diversification strategy and profitability. Strateg. Manag. J. 1982, 3, 359–369. [Google Scholar] [CrossRef]
- Teece, D.J. Explicating dynamic capabilities: The nature and microfoundations of (sustainable) enterprise performance. Strateg. Manag. J. 2007, 28, 1319–1350. [Google Scholar] [CrossRef]
- Lin, B.-W.; Chen, C.-J.; Wu, H.-L. Patent portfolio diversity, technology strategy, and firm value. IEEE Trans. Eng. Manag. 2006, 53, 17–26. [Google Scholar]
- Garcia-Vega, M. Does technological diversification promote innovation? An empirical analysis for European firms. Res. Policy 2006, 35, 230–246. [Google Scholar] [CrossRef]
- Miller, D.J. Technological diversity, related diversification, and firm performance. Strateg. Manag. J. 2006, 27, 601–619. [Google Scholar] [CrossRef]
- Sanjeev Dewan, F.R. Information Technology and Firm Boundaries: Impact on Firm Risk and Return Performance. Inf. Syst. Res. 2009, 22, 369–388. [Google Scholar] [CrossRef]
- Chang, H.-Y.; Lee, A.Y.-P. The relationship between business diversification and productivity: Considering the impact of process innovation at different corporate life cycles. Technol. Anal. Strateg. Manag. 2016, 28, 827–840. [Google Scholar] [CrossRef]
- Cesaroni, F. Technological diversification, technology strategies and licensing in the chemical processing industry. In The Economics and Management of Technological Diversification; Granstrand, O., Gambardella, A., Cantwell, J., Eds.; Routledge: Abingdon, UK, 2004. [Google Scholar]
- Srivastava, M.K.; Gnyawali, D.R. When do relational resources matter? Leveraging portfolio technological resources for breakthrough innovation. Acad. Manag. J. 2011, 54, 797–810. [Google Scholar] [CrossRef]
- Van de Vrande, V.; de Jong, J.P.J.; Vanhaverbeke, W.; de Rochemont, M. Open innovation in SMEs: Trends, motives and management challenges. Technovation 2009, 29, 423–437. [Google Scholar] [CrossRef]
- Cantwell, J.; Gambardella, A.; Granstrand, O. The Economics and Management of Technological Diversification; Routledge: Abingdon, UK, 2004; Volume 34. [Google Scholar]
- Torrisi, S.; Granstrand, O. Technological and business diversification. Econ. Manag. Technol. Diversif. 2004, 34, 21. [Google Scholar]
- Granstrand, O.; Oskarsson, C. Technology diversification in “MUL-TECH” corporations. IEEE Trans. Eng. Manag. 1994, 41, 355–364. [Google Scholar] [CrossRef]
- Leten, B.; Belderbos, R.; Van Looy, B. Technological Diversification, Coherence, and Performance of Firms. J. Prod. Innov. Manag. 2007, 24, 567–579. [Google Scholar] [CrossRef]
- Breschi, S.; Lissoni, F.; Malerba, F. Knowledge-relatedness in firm technological diversification. Res. Policy 2003, 32, 69–87. [Google Scholar] [CrossRef]
- D’Aveni, R.A.; Dagnino, G.B.; Smith, K.G. The age of temporary advantage. Strateg. Manag. J. 2010, 31, 1371–1385. [Google Scholar] [CrossRef]
- Lin, Y.; Wu, L.Y. Exploring the role of dynamic capabilities in firm performance under the resource-based view framework. J. Bus. Res. 2014, 67, 407–413. [Google Scholar] [CrossRef]
- Chiu, Y.-C.; Lai, H.-C.; Lee, T.-Y.; Liaw, Y.-C. Technological diversification, complementary assets, and performance. Technol. Forecast. Soc. Chang. 2008, 75, 875–892. [Google Scholar] [CrossRef]
- Brunswicker, S.; Vanhaverbeke, W. Open Innovation in Small and Medium-Sized Enterprises (SMEs): External Knowledge Sourcing Strategies and Internal Organizational Facilitators. J. Small Bus. Manag. 2015, 53, 1241–1263. [Google Scholar] [CrossRef]
- Hochleitner, F.P.; Arbussà, A.; Coenders, G. Inbound open innovation in SMEs: Indicators, non-financial outcomes and entry-timing. Technol. Anal. Strateg. Manag. 2017, 29, 204–218. [Google Scholar] [CrossRef]
- Galati, F.; Bigliardi, B.; Petroni, A. Open innovation in food firms: Implementation strategies, drivers and enabling factors. Int. J. Innov. Manag. 2015, 20, 1650042. [Google Scholar] [CrossRef]
- Bigliardi, B.; Galati, F. Which factors hinder the adoption of open innovation in SMEs? Technol. Anal. Strateg. Manag. 2016, 28, 869–885. [Google Scholar] [CrossRef]
- Lavie, D. The competitive advantage of interconnected firms: An extension of the resource-based view. Acad. Manag. Rev. 2006, 31, 638–658. [Google Scholar] [CrossRef]
- Teece, D.J.; Pisano, G.; Shuen, A. Dynamic capabilities and strategic management. Strateg. Manag. J. 1997, 18, 509–533. [Google Scholar] [CrossRef]
- Roberson, Q.; Holmes, O.; Perry, J. Transforming Research on Diversity and Firm Performance: A Dynamic Capabilities Perspective. Acad. Manag. Ann. 2016. [Google Scholar] [CrossRef]
- Gambardella, A.; Torrisi, S. Does technological convergence imply convergence in markets? Evidence from the electronics industry. Res. Policy 1998, 27, 445–463. [Google Scholar] [CrossRef]
- Chen, Y.-M.; Yang, D.-H.; Lin, F.-J. Does technological diversification matter to firm performance? The moderating role of organizational slack. J. Bus. Res. 2013, 66, 1970–1975. [Google Scholar] [CrossRef]
- Giuri, P.; Hagedoorn, J.; Mariani, M. Technological diversification and strategic alliances. In The Economics and Management of Technological Diversification; Granstrand, O., Gambardella, A., Cantwell, J., Eds.; Routledge: Abingdon, UK, 2004; pp. 116–151. [Google Scholar]
- Gemba, K.; Kodama, F. Diversification dynamics of the Japanese industry. Res. Policy 2001, 30, 1165–1184. [Google Scholar] [CrossRef]
- Hussinger, K. On the importance of technological relatedness: SMEs versus large acquisition targets. Technovation 2010, 30, 57–64. [Google Scholar] [CrossRef]
- Chiu, Y.-C.; Lai, H.-C.; Liaw, Y.-C.; Lee, T.-Y. Technological scope: Diversified or specialized. Scientometrics 2010, 82, 37–58. [Google Scholar] [CrossRef]
- Huang, Y.-F.; Chen, C.-J. The impact of technological diversity and organizational slack on innovation. Technovation 2010, 30, 420–428. [Google Scholar] [CrossRef]
- Lin, J.-Y. Effects on diversity of R&D sources and human capital on industrial performance. Technol. Forecast. Soc. Chang. 2014, 85, 168–184. [Google Scholar]
- Kim, B.; Kim, E.; Miller, D.J.; Mahoney, J.T. The impact of the timing of patents on innovation performance. Res. Policy 2016, 45, 914–928. [Google Scholar] [CrossRef]
- Lin, B.-W.; Chen, J.-S. Corporate technology portfolios and R&D performance measures: A study of technology intensive firms. R D Manag. 2005, 35, 157–170. [Google Scholar]
- Kim, H.; Lim, H.; Park, Y. How should firms carry out technological diversification to improve their performance? An analysis of patenting of Korean firms. Econ. Innov. New Technol. 2009, 18, 757–770. [Google Scholar] [CrossRef]
- Lin, C.; Chang, C.-C. The effect of technological diversification on organizational performance: An empirical study of S&P 500 manufacturing firms. Technol. Forecast. Soc. Chang. 2015, 90, 575–586. [Google Scholar]
- Wan, W.P. Country Resource Environments, Firm Capabilities, and Corporate Diversification Strategies. J. Manag. Stud. 2005, 42, 161–182. [Google Scholar] [CrossRef]
- Sudhir, K.; Talukdar, D. The “Peter Pan Syndrome” in Emerging Markets: The Productivity-Transparency Trade-off in IT Adoption. Mark. Sci. 2015, 34, 500–521. [Google Scholar] [CrossRef]
- Teece, D.J. Profiting from technological innovation: Implications for integration, collaboration, licensing and public policy. Res. Policy 1986, 15, 285–305. [Google Scholar] [CrossRef]
- Nonaka, I. The Knowledge-Creating Company. Available online: https://hbr.org/2007/07/the-knowledge-creating-company (accessed on 15 July 2017).
- Chen, Y.-S.; Chang, K.-C. Using the entropy-based patent measure to explore the influences of related and unrelated technological diversification upon technological competences and firm performance. Scientometrics 2012, 90, 825–841. [Google Scholar] [CrossRef]
- Kim, J.; Lee, C.-Y.; Cho, Y. Technological diversification, core-technology competence, and firm growth. Res. Policy 2016, 45, 113–124. [Google Scholar] [CrossRef]
- Wang, Y.; Pan, X.; Li, J.; Ning, L. Does technological diversification matter for regional innovation capability? Evidence from China. Technol. Anal. Strateg. Manag. 2016, 28, 323–334. [Google Scholar] [CrossRef]
- Palepu, K. Diversification strategy, profit performance and the entropy measure. Strateg. Manag. J. 1985, 6, 239–255. [Google Scholar] [CrossRef]
- Jacquemin, A.P.; Berry, C.H. Entropy Measure of Diversification and Corporate Growth. J. Ind. Econ. 1979, 27, 359–369. [Google Scholar] [CrossRef]
- Rhéaume, L.; Bhabra, H.S. Value creation in information-based industries through convergence: A study of U.S. mergers and acquisitions between 1993 and 2005. Inf. Manag. 2008, 45, 304–311. [Google Scholar] [CrossRef]
- Singh, M.; Nejadmalayeri, A.; Mathur, I. Performance impact of business group affiliation: An analysis of the diversification-performance link in a developing economy. J. Bus. Res. 2007, 60, 339–347. [Google Scholar] [CrossRef]
- Sirmon, D.G.; Hitt, M.A.; Ireland, R.D. Managing Firm Resources in Dynamic Environments to Create Value: Looking Inside the Black Box. Acad. Manag. Rev. 2007, 32, 273–292. [Google Scholar] [CrossRef]
- Organisation for Economic Co-operation and Development (OECD). OECD Science, Technology and Industry Scoreboard 2015: Innovation for Growth and Society; Organisation for Economic Co-operation and Development: Paris, France, 2015. [Google Scholar]
- Ernst, H. Patent applications and subsequent changes of performance: Evidence from time-series cross-section analyses on the firm level. Res. Policy 2001, 30, 143–157. [Google Scholar] [CrossRef]
- Ernst, H. Patent portfolios for strategic R&D planning. J. Eng. Technol. Manag. 1998, 15, 279–308. [Google Scholar]
- Hagedoorn, J.; Cloodt, M. Measuring innovative performance: Is there an advantage in using multiple indicators? Res. Policy 2003, 32, 1365–1379. [Google Scholar] [CrossRef]
- Fabry, B.; Ernst, H.; Langholz, J.; Köster, M. Patent portfolio analysis as a useful tool for identifying R&D and business opportunities—An empirical application in the nutrition and health industry. World Pat. Inf. 2006, 28, 215–225. [Google Scholar]
- Fleming, L. Recombinant uncertainty in technological search. Manage. Sci. 2001, 47, 117–132. [Google Scholar] [CrossRef]
- Fleming, L.; Sorenson, O. Science as a map in technological search. Strateg. Manag. J. 2004, 25, 909–928. [Google Scholar] [CrossRef]
- Yam, R.C.M.; Lo, W.; Tang, E.P.Y.; Lau, A.K.W. Analysis of sources of innovation, technological innovation capabilities, and performance: An empirical study of Hong Kong manufacturing industries. Res. Policy 2011, 40, 391–402. [Google Scholar] [CrossRef]
- Adler, P.S.; Shenhar, A. Adapting your technological base: The organizational challenge. MIT Sloan Manag. Rev. 1990, 32, 25. [Google Scholar]
- Yam, R.C.M.; Guan, J.C.; Pun, K.F.; Tang, E.P.Y. An audit of technological innovation capabilities in chinese firms: Some empirical findings in Beijing, China. Res. Policy 2004, 33, 1123–1140. [Google Scholar] [CrossRef]
- Lin, B.-W.; Lee, Y.; Hung, S.-C. R&D intensity and commercialization orientation effects on financial performance. J. Bus. Res. 2006, 59, 679–685. [Google Scholar]
- Artz, K.W.; Norman, P.M.; Hatfield, D.E.; Cardinal, L.B. A Longitudinal Study of the Impact of R&D, Patents, and Product Innovation on Firm Performance. J. Prod. Innov. Manag. 2010, 27, 725–740. [Google Scholar]
- Rogers, M. Networks, Firm Size and Innovation. Small Bus. Econ. 2004, 22, 141–153. [Google Scholar] [CrossRef]
- The Korea Chamber of Commerce and Industry. Survey on Management Status of Graduated SMEs; KCCI: Seoul,Korea, 2014. [Google Scholar]
- Kang, K.-N.; Park, H. Influence of government R&D support and inter-firm collaborations on innovation in Korean biotechnology SMEs. Technovation 2012, 32, 68–78. [Google Scholar]
- Lee, E.Y.; Cin, B.C. The effect of risk-sharing government subsidy on corporate R&D investment: Empirical evidence from Korea. Technol. Forecast. Soc. Chang. 2010, 77, 881–890. [Google Scholar]
- Acs, Z.J.; Audretsch, D.B.; Feldman, M.P. R&D Spillovers and Recipient Firm Size. Rev. Econ. Stat. 1994, 76, 336–340. [Google Scholar]
- Kim, Y. A Study on an Intrinsic Characteristics of Patent: The Inventor Surveys in Korea. Available online: http://www.ndsl.kr/ndsl/search/detail/report/reportSearchResultDetail.do?cn=TRKO201300031267 (accessed on 15 July 2017).
- Purkayastha, S.; Manolova, T.S.; Edelman, L.F. Diversification and Performance in Developed and Emerging Market Contexts: A Review of the Literature. Int. J. Manag. Rev. 2012, 14, 18–38. [Google Scholar] [CrossRef]
- Galati, F.; Bigliardi, B. Does different NPD project’s characteristics lead to the establishment of different NPD networks? A knowledge perspective. Technol. Anal. Strateg. Manag. 2017, 1–14. [Google Scholar] [CrossRef]
Figure 1.
The 2 by 2 matrix of relationship between resources and innovation capabilities of firms’ groups.
Figure 1.
The 2 by 2 matrix of relationship between resources and innovation capabilities of firms’ groups.
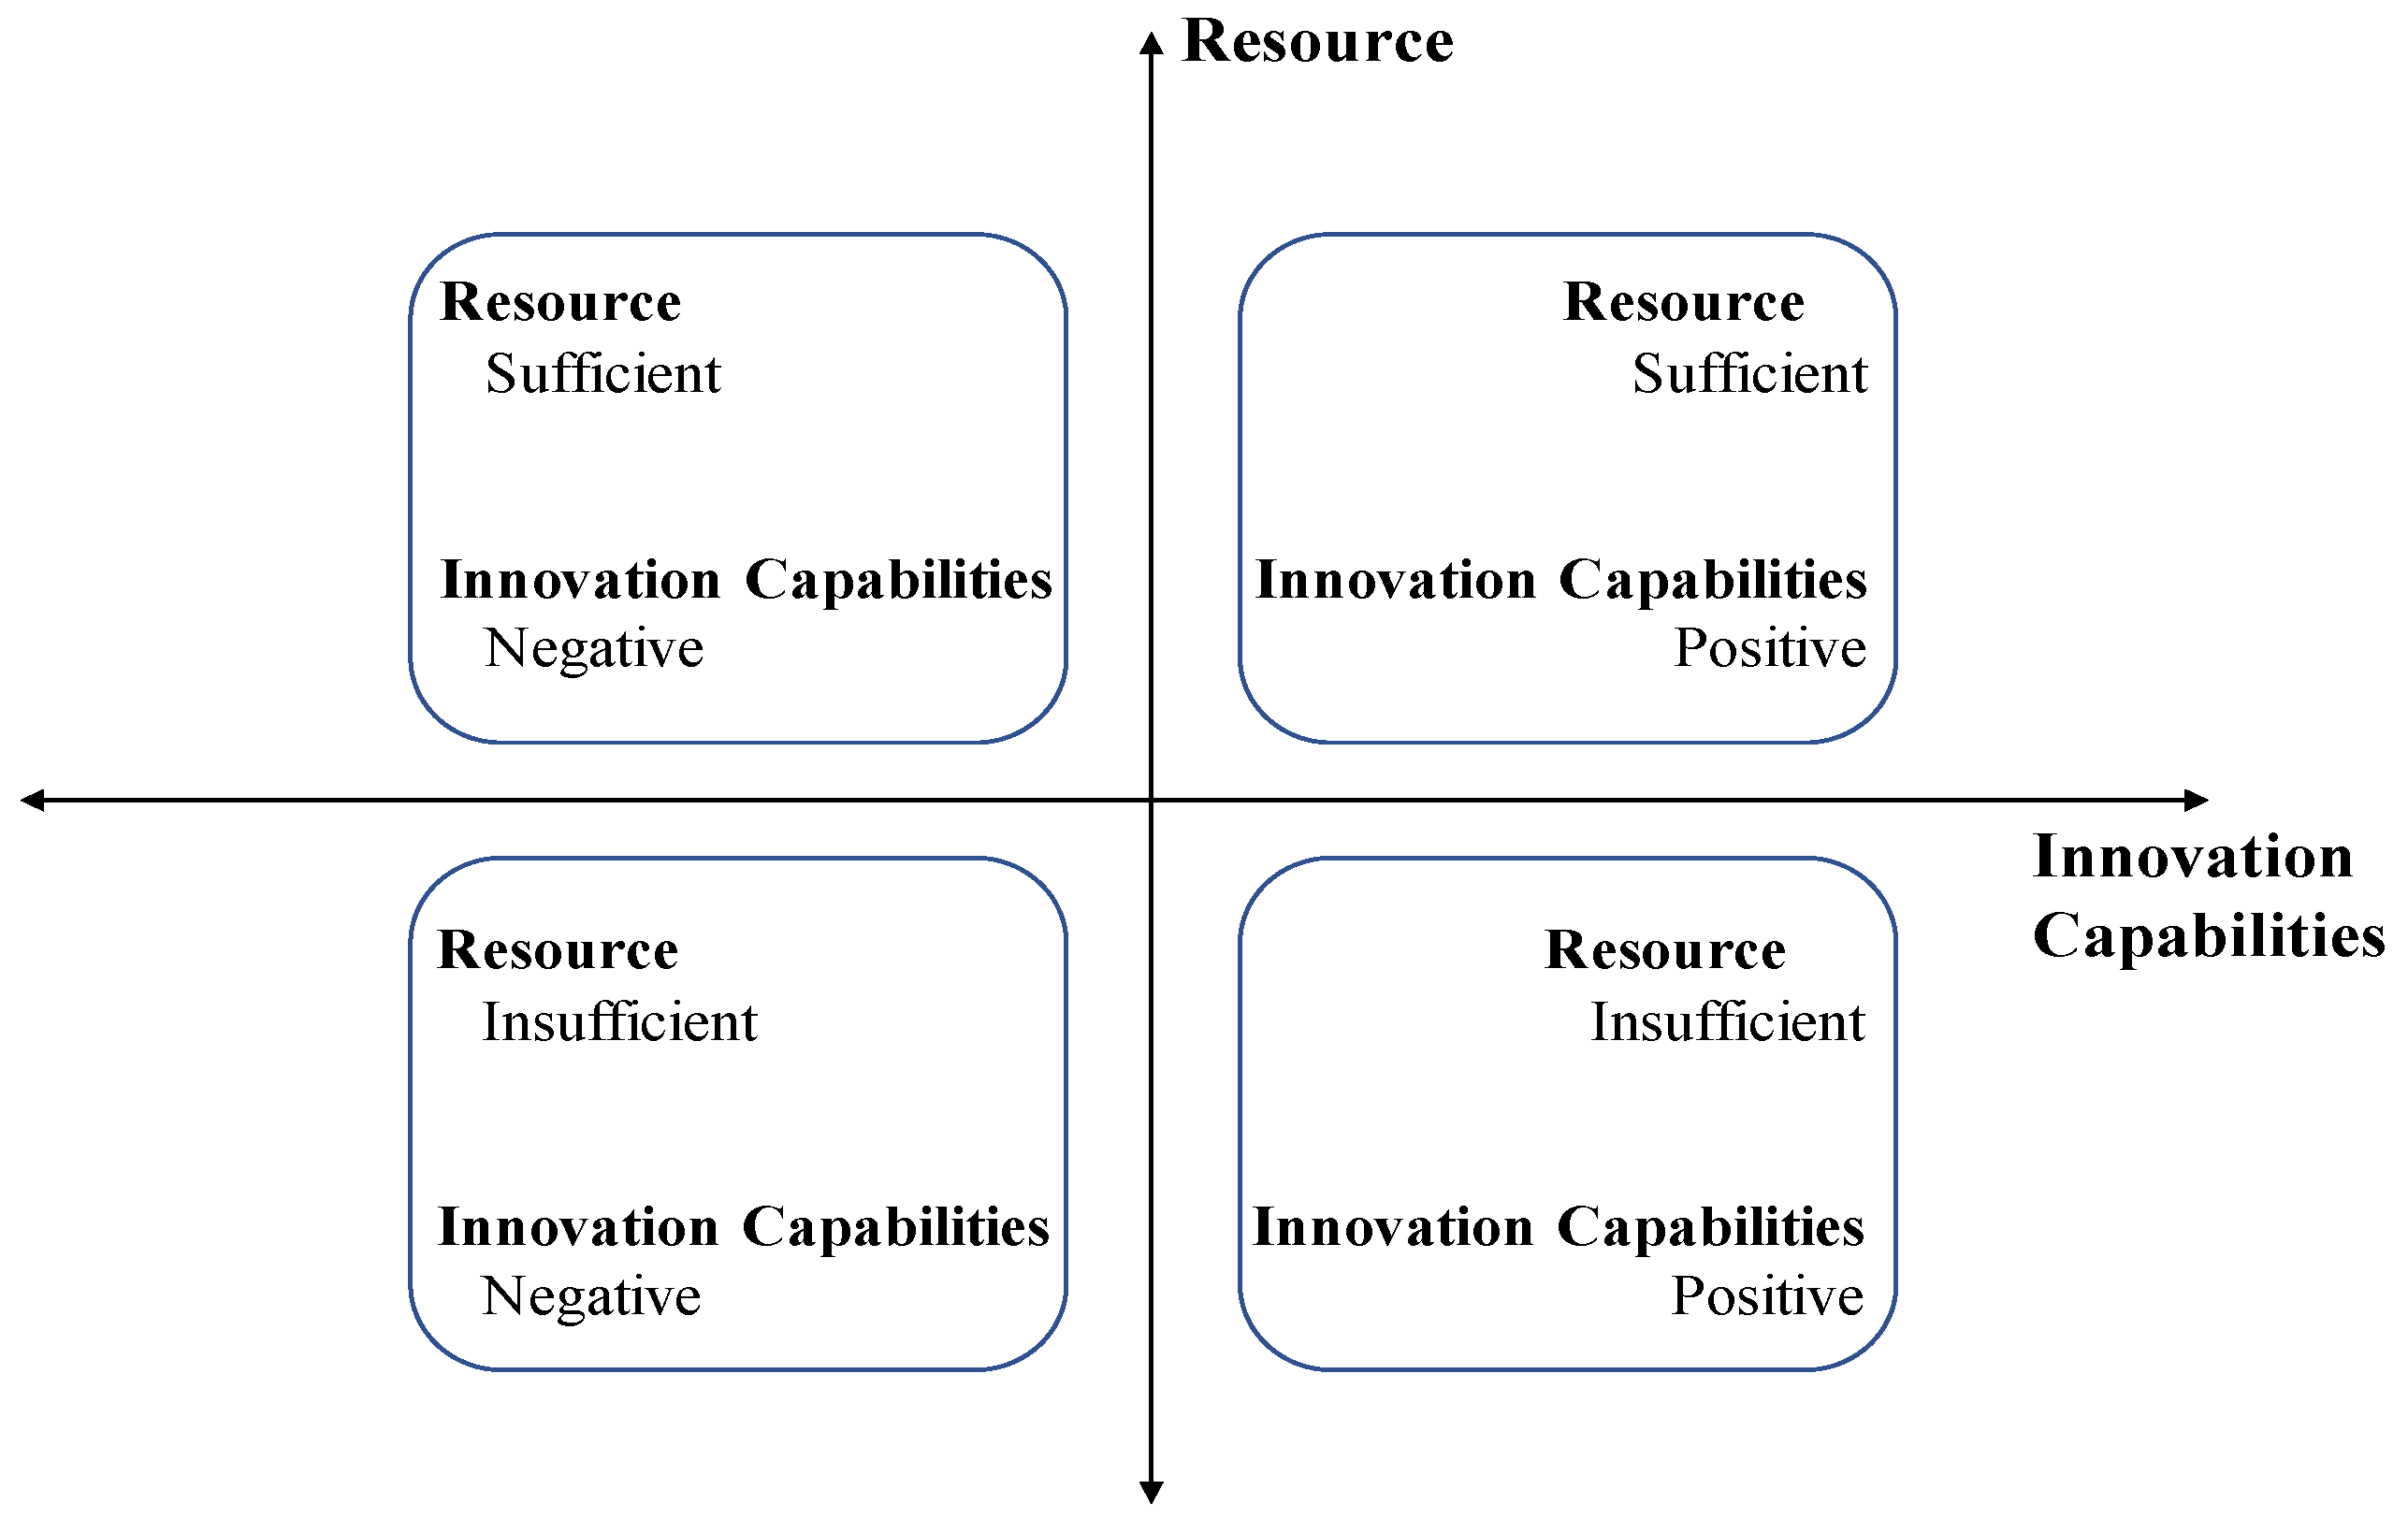
Figure 2.
Relationship among a firm’s innovation capabilities (PCAP), Innovation, and the firm’s performance (FPER) strategy over time.
Figure 2.
Relationship among a firm’s innovation capabilities (PCAP), Innovation, and the firm’s performance (FPER) strategy over time.
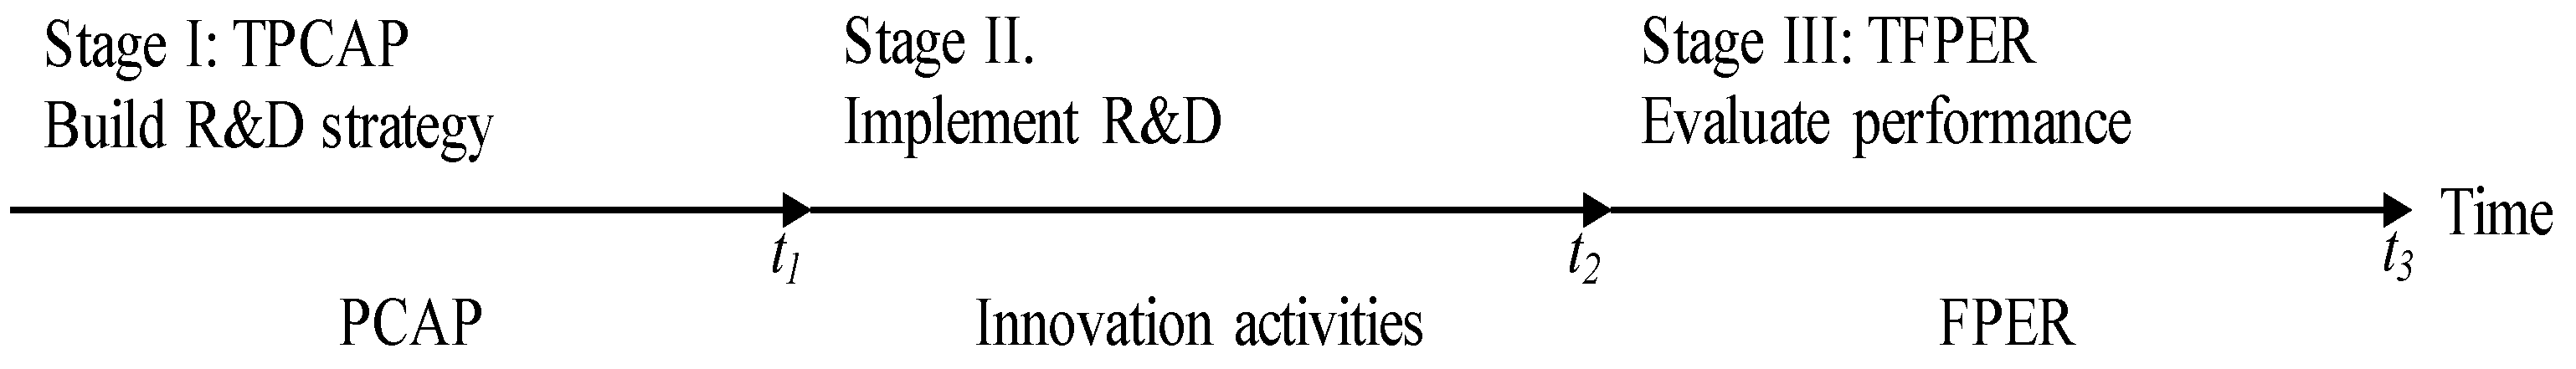
Figure 3.
The mean of UTD and RTD by groups, in both Small and Large.
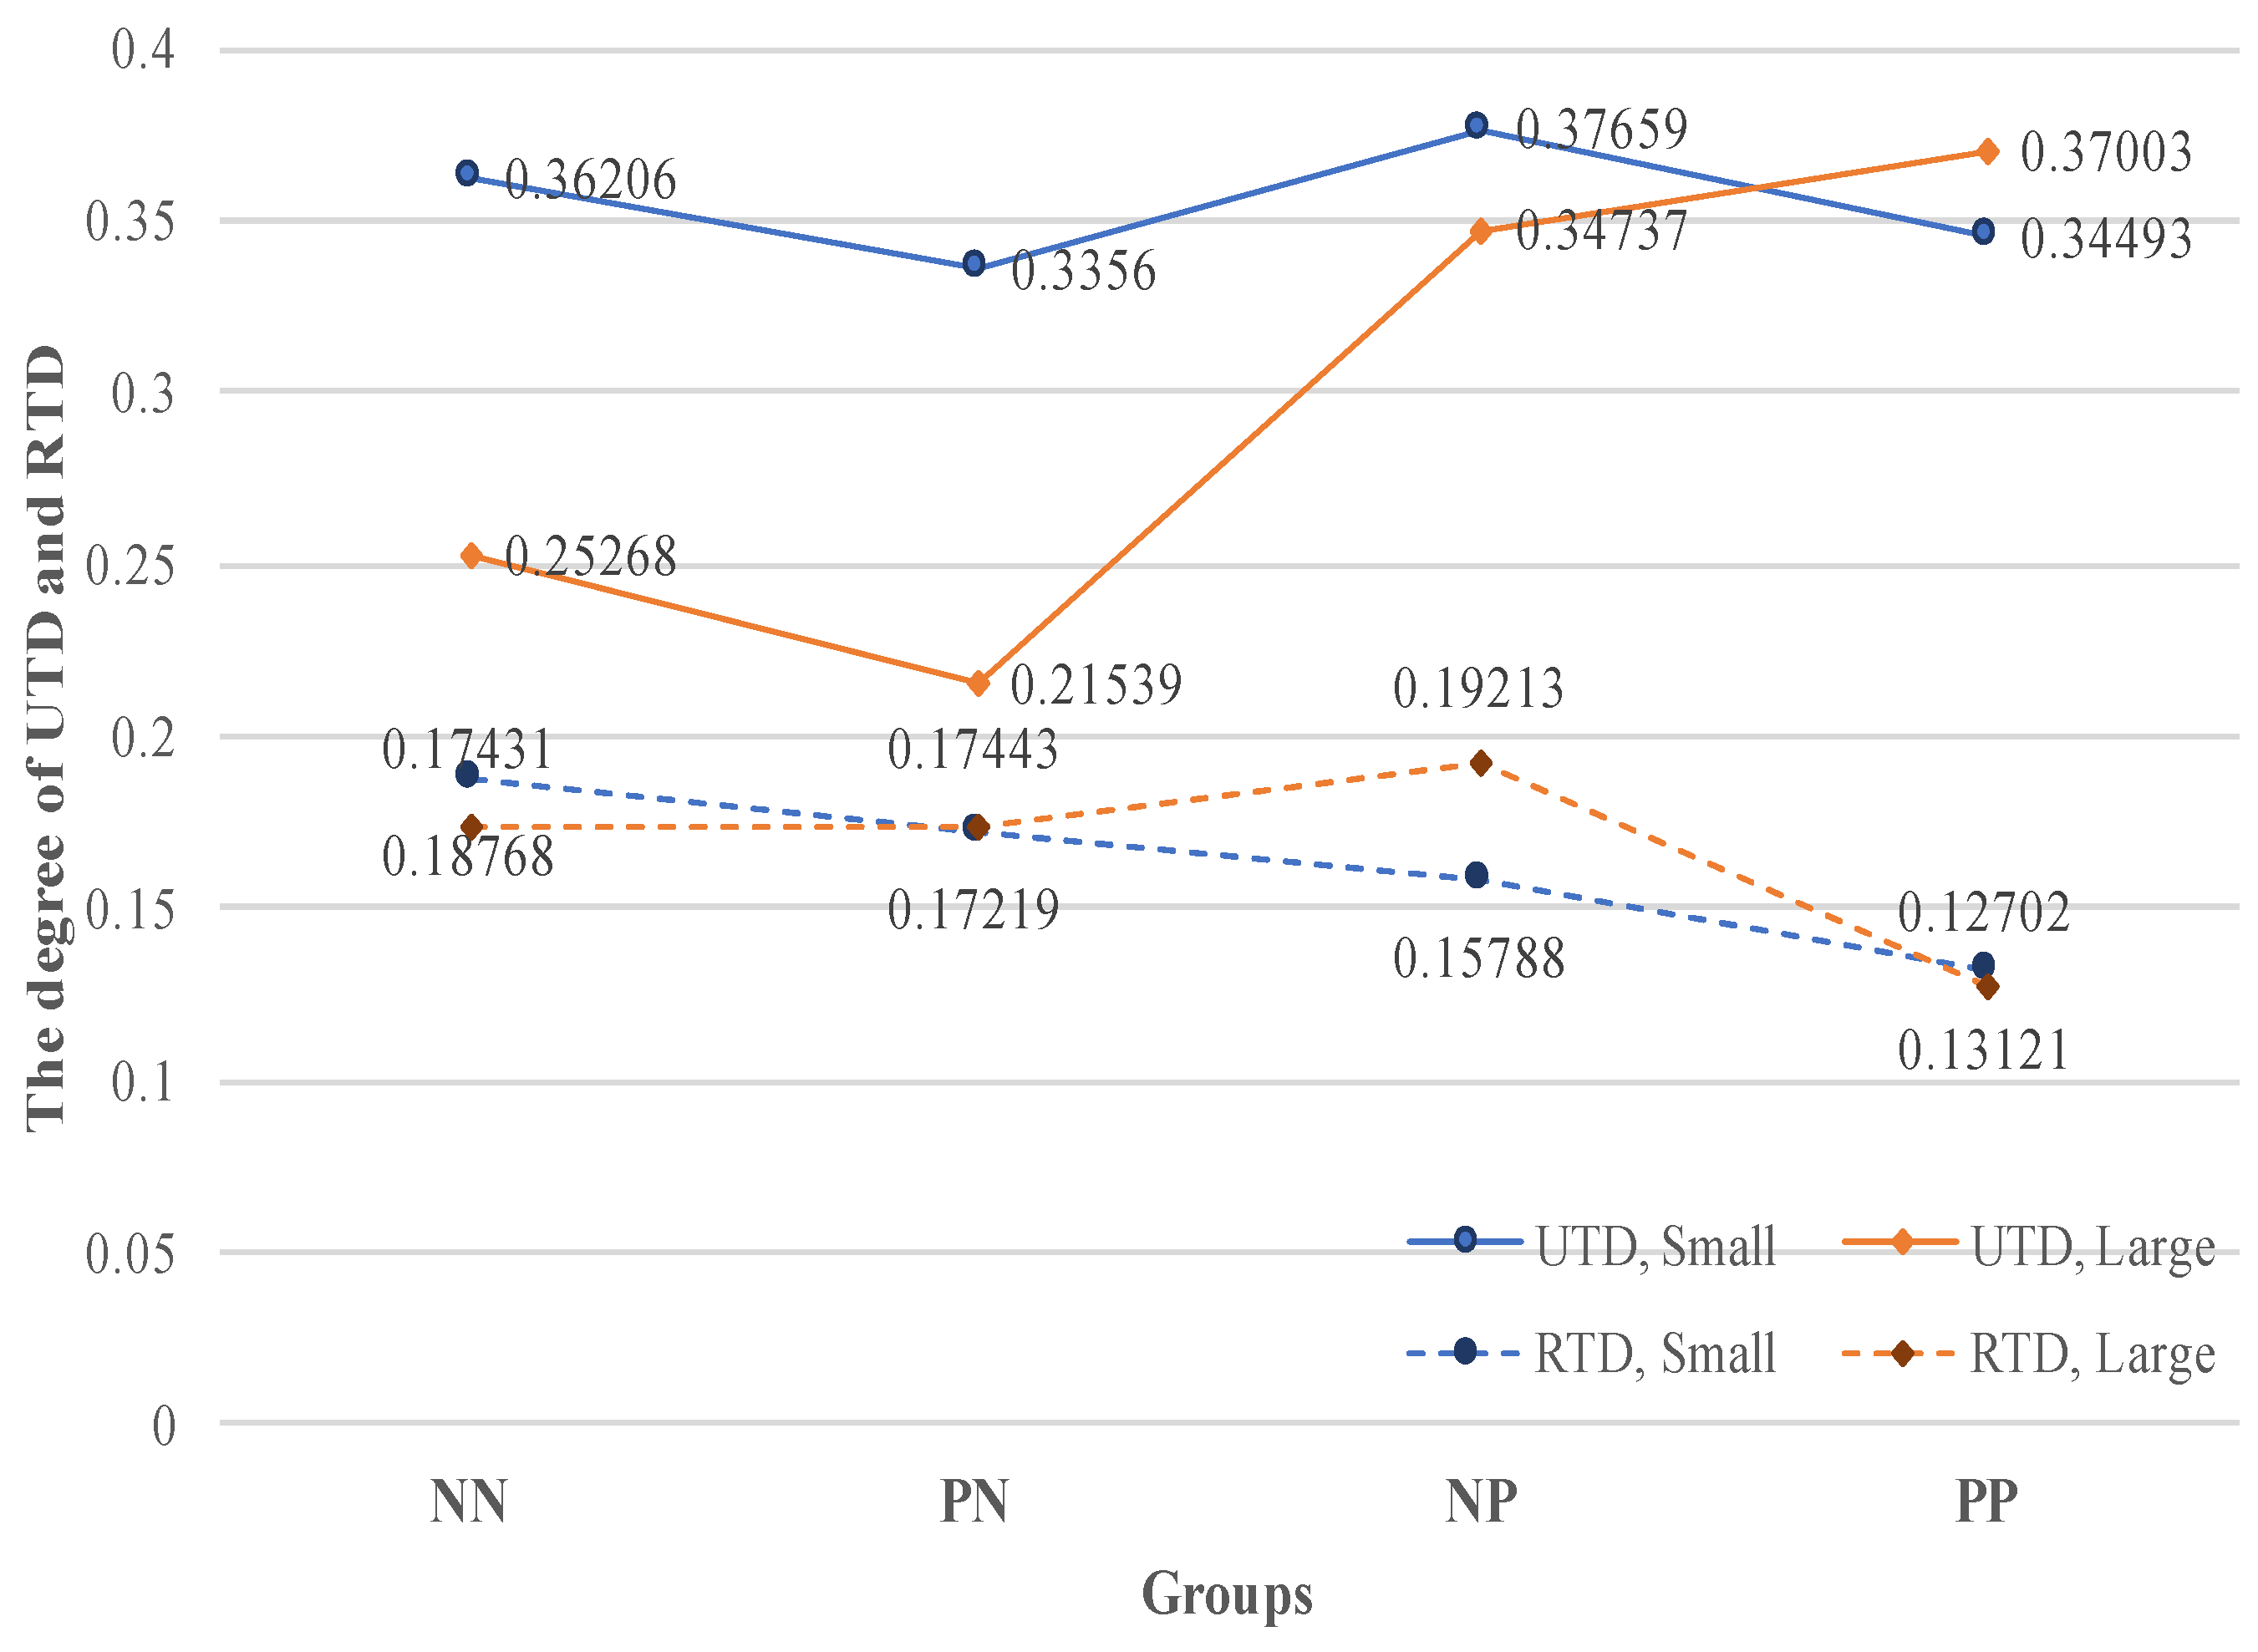
Figure 4.
Dynamic technological diversification strategy model between PCAP/FPER and time.

Table 1.
Descriptive statistics: Number of firms (NF) and patent applications (PA) in each group.
| 4 Groups | NN | PN | NP | PP | |||||
|---|---|---|---|---|---|---|---|---|---|
| Firm’s size | NF | PA | NF | PA | NF | PA | NF | PA | |
| Small | 62 | 237 | 175 | 424 | 102 | 279 | 94 | 249 | |
| Large | 19 | 200 | 20 | 344 | 23 | 179 | 12 | 183 | |
Table 2.
Descriptive statistics: Unrelated Technological Diversification (UTD) and Related Technological Diversification (RTD) in each group.
Table 2.
Descriptive statistics: Unrelated Technological Diversification (UTD) and Related Technological Diversification (RTD) in each group.
| 4 Groups | NN | PN | NP | PP | |||||
|---|---|---|---|---|---|---|---|---|---|
| Firm’s size | Mean | SD | Mean | SD | Mean | SD | Mean | SD | |
| Small | UTD | 0.36206 | 0.25481 | 0.3356 | 0.28608 | 0.37659 | 0.31997 | 0.34493 | 0.27713 |
| RTD | 0.18768 | 0.22851 | 0.17219 | 0.22545 | 0.15788 | 0.18806 | 0.13121 | 0.19917 | |
| Large | UTD | 0.25268 | 0.11083 | 0.21539 | 0.12255 | 0.34737 | 0.23935 | 0.37003 | 0.3349 |
| RTD | 0.17431 | 0.09600 | 0.17443 | 0.08017 | 0.19213 | 0.13620 | 0.12702 | 0.05372 | |
Table 3.
The t-test results for difference of UTD and RTD for each group in Small.
| NN | PN | NP | PP | ||
|---|---|---|---|---|---|
| UTD | NN | 0 | |||
| PN | 0.02646 (0.11855) | 0 | |||
| NP | 0.01453 (0.28705) | 0.04099 * (0.03859) | 0 | ||
| PP | 0.01713 (0.24004) | 0.00933 (0.33995) | 0.03165 (0.11421) | 0 | |
| RTD | NN | 0 | |||
| PN | 0.01549 (0.20013) | 0 | |||
| NP | 0.02980 † (0.05275) | 0.01431 (0.19044) | 0 | ||
| PP | 0.05647 ** (0.00194) | 0.04098 ** (0.009) | 0.02667 † (0.05749) | 0 |
Significance levels: *** p < 0.001, ** p < 0.01, * p < 0.05, † p < 0.1.
Table 4.
The t-test results for difference of UTD and RTD for each group in Large.
| NN | PN | NP | PP | ||
|---|---|---|---|---|---|
| UTD | NN | 0 | |||
| PN | 0.03729 *** (0.00022) | 0 | |||
| NP | 0.09469 *** (0.00000) | 0.13198 *** (0.00000) | 0 | ||
| PP | 0.11735 *** (0.00000) | 0.15464 *** (0.00000) | 0.02266 (0.23070) | 0 | |
| RTD | NN | 0 | |||
| PN | 0.000115 (0.49405) | 0 | |||
| NP | 0.017818 † (0.06989) | 0.017704 * (0.03142) | 0 | ||
| PP | 0.047294 *** (0.00000) | 0.047409 *** (0.00000) | 0.065112 *** (0.00000) | 0 |
Significance levels: *** p < 0.001, ** p < 0.01, * p < 0.05, † p < 0.1.
© 2017 by the authors. Licensee MDPI, Basel, Switzerland. This article is an open access article distributed under the terms and conditions of the Creative Commons Attribution (CC BY) license (http://creativecommons.org/licenses/by/4.0/).
Share and Cite
MDPI and ACS Style
Kook, S.H.; Kim, K.H.; Lee, C. Dynamic Technological Diversification and Its Impact on Firms’ Performance: An Empirical Analysis of Korean IT Firms. Sustainability 2017, 9, 1239. https://doi.org/10.3390/su9071239
AMA Style
Kook SH, Kim KH, Lee C. Dynamic Technological Diversification and Its Impact on Firms’ Performance: An Empirical Analysis of Korean IT Firms. Sustainability. 2017; 9(7):1239. https://doi.org/10.3390/su9071239
Chicago/Turabian StyleKook, Sang Ho, Ki Hong Kim, and Chulung Lee. 2017. "Dynamic Technological Diversification and Its Impact on Firms’ Performance: An Empirical Analysis of Korean IT Firms" Sustainability 9, no. 7: 1239. https://doi.org/10.3390/su9071239
Note that from the first issue of 2016, this journal uses article numbers instead of page numbers. See further details here.