Article

Innovation Capability and Innovation Talents: Evidence from China Based on a Quantile Regression Approach

1
School of Management, Hefei University of Technology, Hefei 230009, China
2
Department of Economics, Illinois State University, Normal, IL 61790-4200, USA
*
Author to whom correspondence should be addressed.
Sustainability 2017, 9(7), 1218; https://doi.org/10.3390/su9071218
Submission received: 18 May 2017 / Revised: 21 June 2017 / Accepted: 5 July 2017 / Published: 11 July 2017
(This article belongs to the Section Economic and Business Aspects of Sustainability)

Abstract

:
Innovation talents, as a most active and important resource in innovation activities, are receiving increasing attention in the enhancement of innovation capability. It seems that areas with strong innovation capability are more attractive to innovation talents. To explore the impact of innovation capability—measured by innovation environment input efficiency—on the distribution of innovation talent, and given the heavy-tailed distribution of talents, a quantile regression approach is adopted for Chinese data covering 2001–2015. The results show that: (a) at the country level, the innovation environment and innovation talents are surprisingly negatively related due to pre-reform special regional strategies and the immature innovation environment in China, while both innovation input and efficiency facilitates the agglomeration of innovation talent; and (b) at the regional level, some different influences on talents appear: the strongest negative impact of the innovation environment is in the areas with a low level of talents, moderate positive effects of innovation input and efficiency can be seen in areas with a medium level of talents, and significantly positive contributions from innovation input and efficiency can be seen in the areas that already have a high level of talents. The results offer some suggestions for managers and the government, which are beneficial for the guidance of the ordered flow of innovation talents and the enhancement of regional innovation capability and sustainability.

Graphical Abstract

1. Introduction

China has made remarkable progress in innovation over the past decades. However, the innovation development in China is unbalanced, and there is an increasing innovation capability gap between east and west, covering the differentiated scale of research and development (R&D) [1] and the unequal distribution of patents [1,2]. Innovation capability can reflect a region’s ability to effectively engage in innovation activities and generate creative outputs. Innovation resources, regarded as the input or supporting conditions of innovation activities, have also presented a similar unbalanced spatial pattern [3] as that of innovation capability, showing a heavy-tailed distribution. Those in the eastern provinces such as Guangdong and Jiangsu are far ahead of those in the western provinces [4]. Obviously, this imbalance is not conducive to comprehensive and sustainable innovation development.
Innovation resources consist of talents, capital, technology, environment, management, policy, mechanisms and so on [5]. Of all these, talents should be the most active and important [6,7], a reasonable regional distribution of which is beneficial to narrowing the innovation gap and promoting development sustainability [8]. An ordered flow of regional innovation talents is effective and adaptable to alleviate regional innovation and economic disparity [9]. Additionally, the strong mobility of talent makes it possible to guide them to flow in an ordered manner.
There exist various discussions about innovation talents. From the perspective of personality traits, Guilford held the view that talents are more sensitive, resourceful and ingenious, such as inventors and artists [10]. From the perspective of behaviors, Glover and Smethurst supported the idea that talents enjoy adventures, are occupied in creative work and endeavor to make their ideas come true [11]. Additionally, Van thought that innovation talents are of great significance to innovation performance in organizations, including R&D personnel, engineers, industry experts and so on [12]. In principle, talents appear to try challenging things, like experts in one field [13], and the technology elite with exemplary skills [14]. Thus, it can be concluded that innovation talents are persons who devote themselves to innovative work and prefer challenging, difficult tasks and who make significant contributions to organizations.
There are many reasons for the distribution of innovation talent. From a macroscopic view, both the industrial cluster and urban environment are key to the flow of talents [15]. Regional politics, economy and social culture all exert an impact on the flow of innovation talents [16,17]. From an organizational perspective, enterprise culture [15,18], extrinsic motivators including salaries and external recognition [19], and fairness in organizations and working conditions [20] are major factors causing the flow of innovation talents. Analyzing from the individual perspective, job satisfaction should mainly account for the flow [15].
There is an interesting fact that innovation talents appear to prefer places where the innovation capability is strong. For example, Silicon Valley in America, famous for its strong innovation capability, attracts world top talents who gather there [21]. Another example is Beijing, the capital and innovative highland of China, where R&D personnel were more than 110 for every ten thousand people at the end of 2014, ranking No. 1 of 31 provinces. It is known to all that innovation talents make significant contributions to the improvement of innovation capability, but not vice versa, that is, whether the improvement of innovation capability also has a positive impact on the agglomeration of talents. This is the problem that this paper will explore.
The aim of this paper is therefore to examine the impact of innovation capability on the distribution of innovation talents; we will then give some suggestions as to how to promote the ordered flow of innovation talents in order to mitigate the regional imbalance and promote sustainable innovation development. To this end, we apply quantile regression techniques, which appear well-suited to the study of the distribution of innovation talents because of the fundamental heterogeneity of their regional distribution.
The rest of this paper is organized as follows. In Section 2, we propose three research hypotheses, involving the relations between the innovation environment input efficiency and innovation talent. Section 3 sets out the research design, beginning with the index selection (Section 3.1), followed by the samples and data resources (Section 3.2), and ending with a brief introduction of the main methods applied in this paper, including the global spatial autocorrelation analysis and the quantile regression approach (Section 3.3). Section 4 contains the quantile regression analysis, starting with the sample description (Section 4.1), followed by the data test (Section 4.2). Then the estimation results are provided (Section 4.3), followed by the conditional density forecast of the distribution of innovation talents (Section 4.4). Section 5 provides concluding remarks.

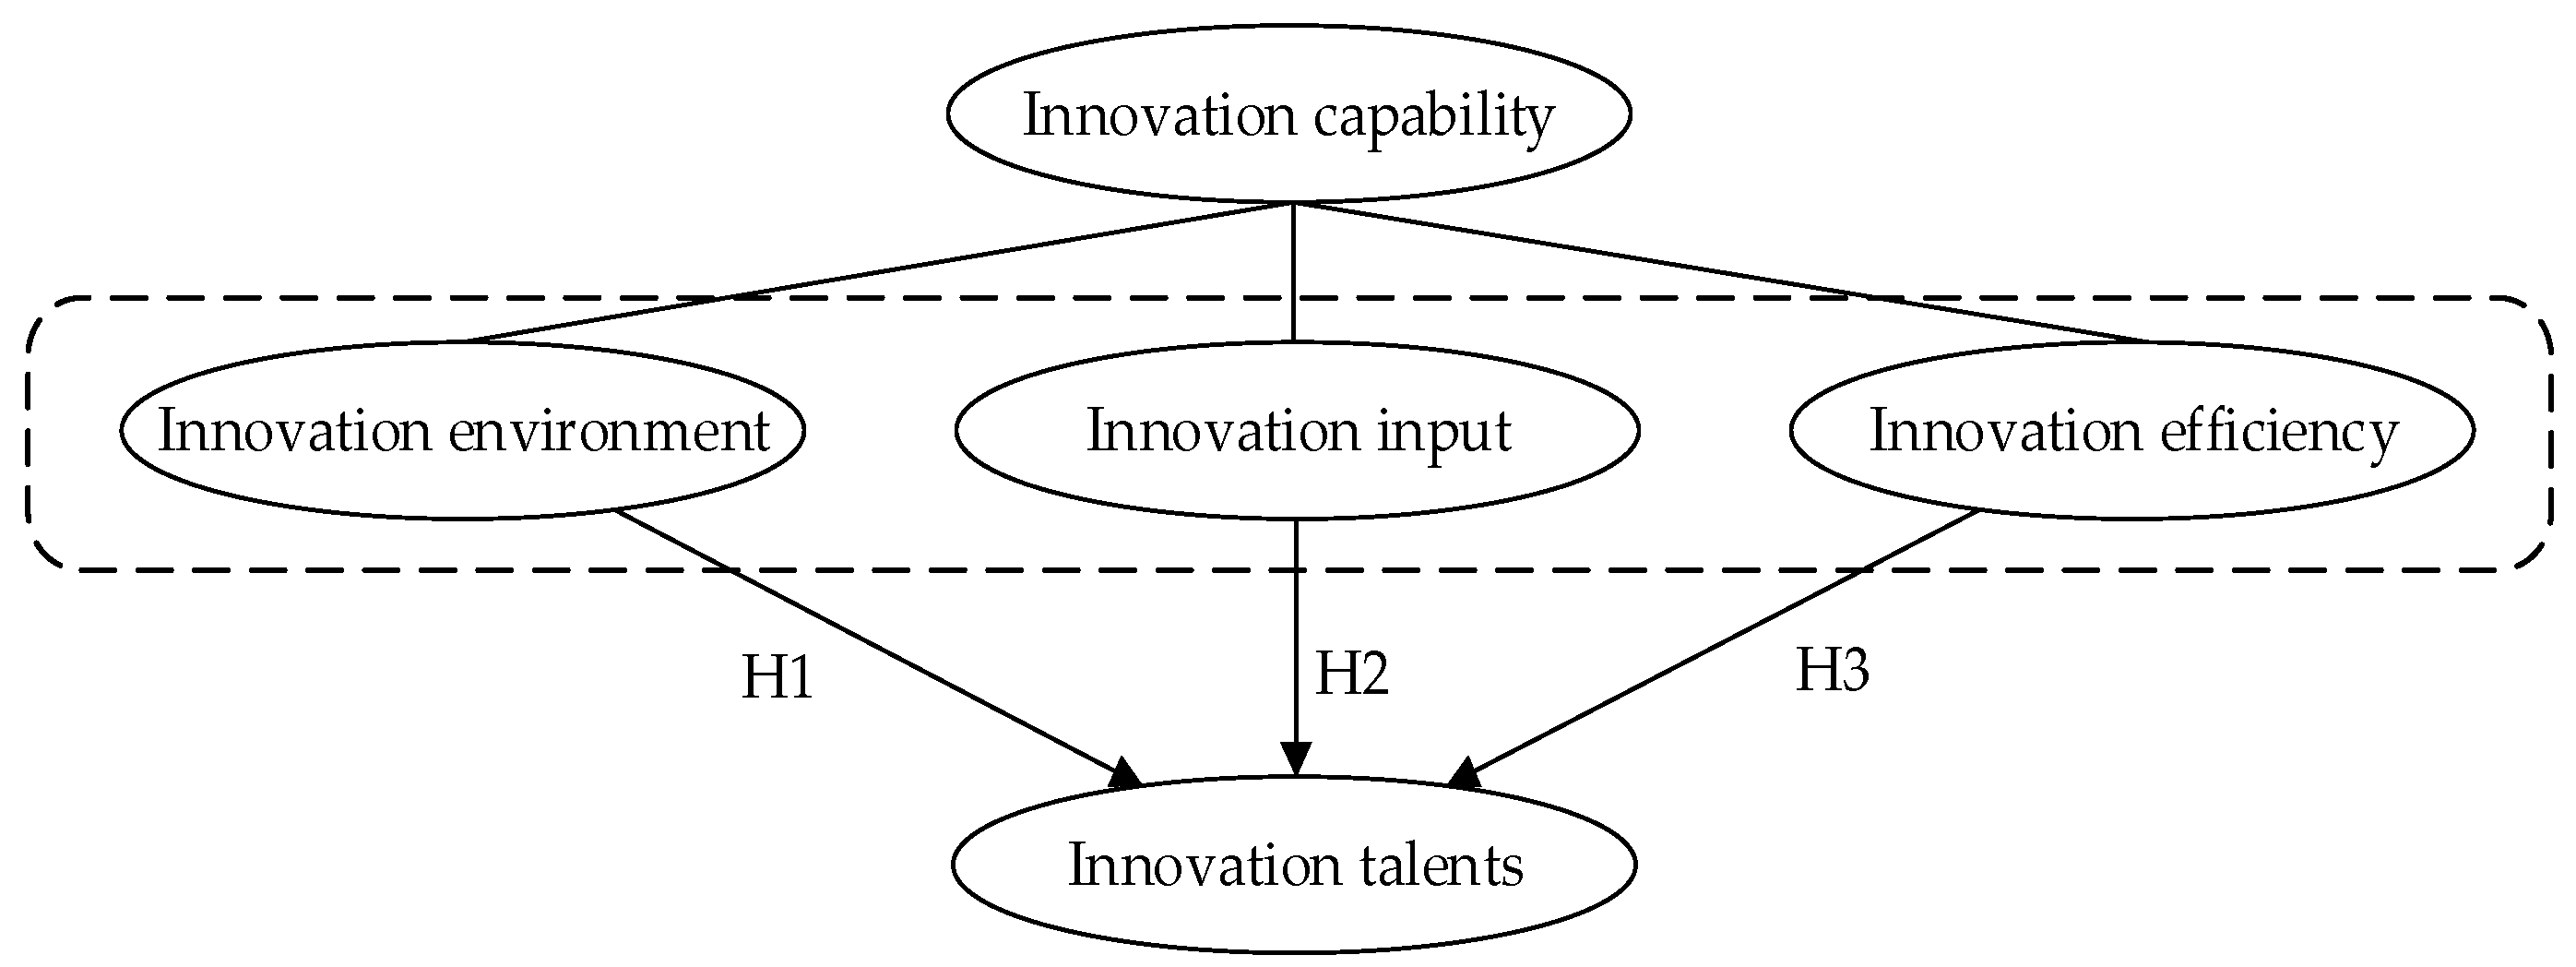
2. Theory Foundation and Research Hypotheses

Innovation is complex, and the measurement of innovation capability should focus on the whole process of innovation activities [22]. There are some evaluation programs of innovation capability from different perspectives. For example, the European Innovation Scoreboard (EIS) made by the EU Innovation Policy Research Center evaluates innovation from input and output [23]. The Global Competitiveness Report published by the World Economic Forum addresses the significance of the innovation environment to measurement [24]. Another example is the OECD (Organization for Economic Co-operation and Development) Science, Technology and Industry Scoreboard (STI) that takes science, technology, innovation, knowledge and industry into consideration when elaborating national innovation capability [25]. Especially given the reality in and characteristics of China, we refer to the “China Innovation Index Research (CII)” carried out by the Chinese National Bureau of Statistics, which includes four types of index to denote innovation capability [26]. However, we only adopted the first three of them since the fourth, named “innovation impact on economy and society” is not strongly related to the flow of talents and thus to in our research, as it includes indices of energy consumption per unit of GDP, productivity ratio and so on. The three selected indices are the innovation environment, input and efficiency.
The innovation environment mainly refers to the basic supporting conditions for innovation activities, including infrastructure, finance support, innovation-related policies and so on [26]. Regional economic and geographical factors, such as good infrastructure and income levels, should be beneficial for acquiring competitive advantages and improving the attractiveness for innovation talents [27,28]. Similarly, Gu and Bi found that both per capita GDP and research fund investment had an obvious effect on the distribution of scientific and technology talents [29]. Innovation talents and economic growth are positively related [30]. Therefore, the innovation environment seems to promote the agglomeration of talents and Hypothesis 1 (H1) is proposed.
Hypothesis 1 (H1):
The better the innovation environment is, the more innovation talents there are.
Innovation input supplies the material foundation for innovation activities, reflected through indicators of financial input and the development of innovation departments [26]. Due to a lack of relevant data and the importance of R&D in innovation, indicators related to R&D are widely adopted [31,32,33,34]. Early in the 1960s, the close relation between the distribution of technological talents and regional R&D expenditures was affirmed from a regional perspective [31]. Further, regional enterprises with powerful R&D expenditure input have advantages in the recruitment of innovation talents [32], and human capital investments in less-developed areas could make contributions to a decrease in regional inequalities [33]. Furthermore, Simon and Cao have pointed out that one country’s strategic investments in R&D can stimulate the activities of innovative talents, creating an innovation talent pool [34]. A theoretical analysis also involving the regional perspective supported that view that scientific and technological funding could expand the effects on the convergence of talent [35]. In summary, both R&D investment and scientific and technological funding play a vital role in innovation input, showing close relationships to innovation talent. As a result, Hypothesis 2 (H2) is raised.
Hypothesis 2 (H2):
The stronger the innovation input is, the more innovation talents there are.
Innovation efficiency can reflect the comprehensive effectiveness of regional innovation activities through innovation output, including patents, trademarks, papers and so on [26]. There is a positive relation between talents and the output of new products, and talents and the quantity of regional patents [36,37,38]. Additionally, Ernst et al. found that the quantity and quality of field patents have an influence on the performance of R&D talents [39]. Further, new technologies and the origin of innovation output could also promote the performance of talents [40]. Based on this, we propose Hypothesis 3 (H3).
Hypothesis 3 (H3):
The higher the innovation efficiency is, the more innovation talents there are.
According to the theory analysis above, a conceptual model was built, detailed in Figure 1.

3. Materials and Methods

3.1. Index Selection

The R&D system is deemed as the engine of innovation [22], and indices relevant to R&D have been widely applied in innovation analysis [41,42].
R&D personnel, engaged in studying and developing new technology, are typical representatives of innovation talent and play a core role in innovation activities [43,44,45,46]. Thus, in this paper, we chose the number of full-time R&D personnel calculated from the real working time for R&D to denote the level of innovation talent (INTL).
The innovation environment (INET) plays a basic support role in the distribution of innovation resources. Per capita GDP, which not only reflects the economic environment and economic strength, but also relates to the expected return of innovation resources, is accepted as denoting the economic environment as well as the macro-innovation environment [26,47,48]. Therefore, we take per capita GDP as representative of the innovation environment.
In all indices of innovation input (INIT), R&D expenditure is considered to be key, most direct and easily measured [49], and it has been adopted universally [50,51]. Taking these for reference and considering differences of regional economics, we adopted R&D expenditure per ten thousand GDP to denote innovation input in our study.
Innovation efficiency (INFY) is usually related to the number of published papers and patents as well as the value of new products. Especially the number of application patents has been accepted to judge the output and efficiency of regional R&D activities [51,52]. Thus, we chose application patents per ten thousand people as the indicator of innovation efficiency.

3.2. Samples and Data

Considering integrity and availability, the samples are China’s 31 provinces, and all relevant data used are from the “Science and Technology of China Statistical Yearbook” and the “China Statistical Yearbook”, both covering the period 2001–2015.

3.3. Method and Model

3.3.1. Global Spatial Autocorrelation

Global spatial autocorrelation analysis is one part of exploratory spatial data analysis (ESDA), widely used in regional spatial correlation and difference research about a certain element. Many researchers have taken Moran’s I to measure the overall correlation and difference in the spatial dimension. Moran’s I can be calculated as follows.
Moran’s I
M o r a n s   I = i = 1 n j = 1 n W i j ( Y i Y ¯ ) ( Y j Y ¯ ) S 2 i = 1 n j = 1 n W i j
S 2 = 1 n i = 1 n ( Y i Y ¯ ) 2
The variance of Y
Y ¯ = 1 n i = 1 n Y i
The spatial binary adjacency matrix
W i j = { 1 r e g i o n   i   i s   a d j a c e n t   t o   r e g i o n   j 0 r e g i o n   i   i s   n o t   a d j a c e n t   t o   r e g i o n   j
where n is the number of provinces in question; Yi is the observed value of a certain element; Y ¯ means the average of Yi when i is from 1 to n; and Wij represents the spatial binary adjacency matrix. When Moran’s I > 0, there exist high–high clusters or low–low clusters in space. When Moran’s I < 0, this indicates that the observed values vary significantly in adjacent regions or nearby areas.

3.3.2. Quantile Regression

Koenker and Bassett have put forward the quantile regression theory to precisely clarify the relation between independent variables and dependent variables [53], and Koenker first applied this theory to the panel data model [54]. Since then, many researchers have further promoted the application of the panel quantile [55,56,57,58]. When processing data with a heavy tail or non-normal distributions, the quantile regression is more efficient and sound, compared with the traditional linear regression. The panel quantile regression model is set as follows.
Y i t = X i t β i ( τ ) + α i t + u i t
where i stands for the individual ordered i, and t stands for a year; Yit is a dependent variable while Xit is an independent variable. τ is a quantile between 0 and 1. βi(τ) means the coefficient at quantile τ. Moreover, αit represents a latent variable of individual differences, while uit is representative of a random error.
When X is known, the conditional quantile of Y at τ can be found, Q τ ( Y i | X i ) = X i ' β τ + α τ and β ^ τ can be estimated by calculating the difference in values between Y and its estimated value Y ^ . In specific, β ^ τ could be estimated as follows.
β τ ^ = arg min β ( Y i X i ' β τ | Y i X i β | + Y i < X i β ( 1 τ ) | Y i X i β | )
Both innovation talents and innovation capability are in uneven distribution, and the innovation gap between west and east is increasingly widening, with an unoptimistic but significant long heavy tail. Although the ordinary least square method can estimate the influences of innovation capability on the distribution of innovation talents, it only sheds light on the influences according to the mean value rather than the different value levels of relevant data. However, quantile regression could make up this shortage well. Based on it, we can analyze the influences comprehensively and propose targeted suggestions for areas with different levels of innovation talent.

4. Quantile Analysis

4.1. Sample Description

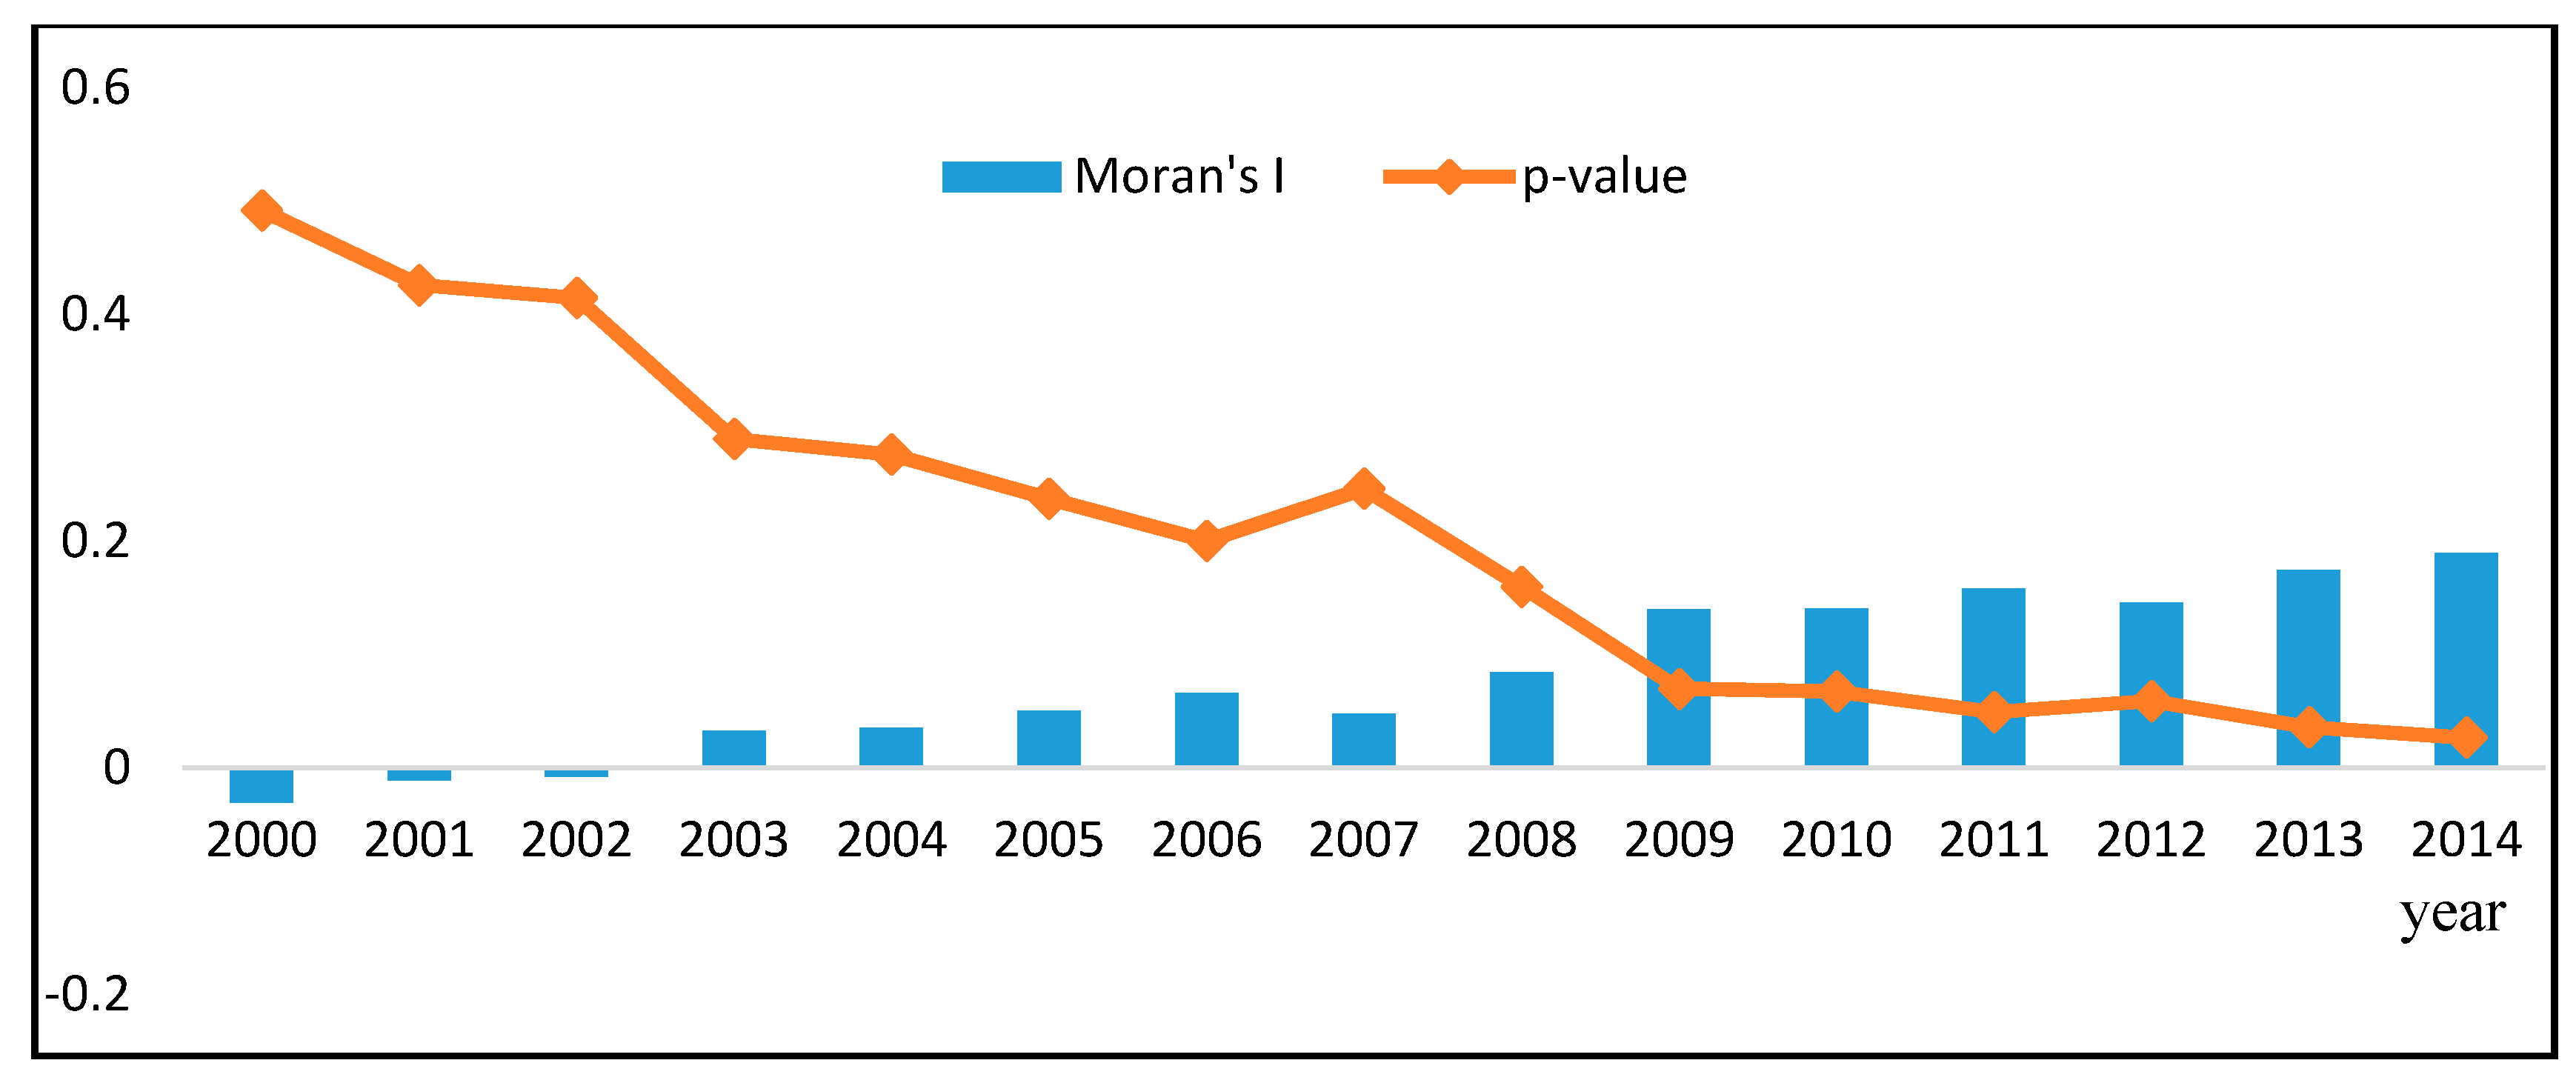
4.1.1. Global Spatial Autocorrelation Analysis

We made a global spatial autocorrelation analysis of innovation talents by virtue of Moran’s I, and the detailed result is in Figure 2.
According to Figure 2, it is not hard to conclude that there is an increasing tendency of Moran’s I accompanied by a decreasing p-value. Since 2003, Moran’s I has always been greater than zero, which means that the phenomenon of a high–high cluster or a low–low cluster exists. Besides, the p-value has been less than 0.1 since 2009, showing a significant difference among different regions.

4.1.2. Description of Distribution Characteristics

To explore the distribution characteristics of innovation talents and innovation capability, we drew histograms and kernel density curves, detailed in Figure 3.
From Figure 3, it can be seen that all series are in non-normal distribution, with asymmetric, unimodal and heavy-tailed forms, which reflects the priorities of quantile regression. Compared with an ordinary least squares estimation, the quantile regression should be more robust and effective.

4.2. Data Analysis and Test

4.2.1. Correlation Analysis

A correlation analysis has been conducted to explore the relation between innovation talents and innovation capability. The results are reported in Table 1.
It can be seen that three correlation coefficients are over 0.5. This indicates that innovation environment, input and efficiency all have a close relation with innovation talents.

4.2.2. Unit Root Test

To ensure the effectiveness of the regression, we carried out a unit root test. From the results in Table 2 it can be educed that all the original series both of innovation talents and innovation capability show stationary first-order difference (I(1) process). Hence, a regression analysis is possible.

4.3. Parameter Estimation and Model Test

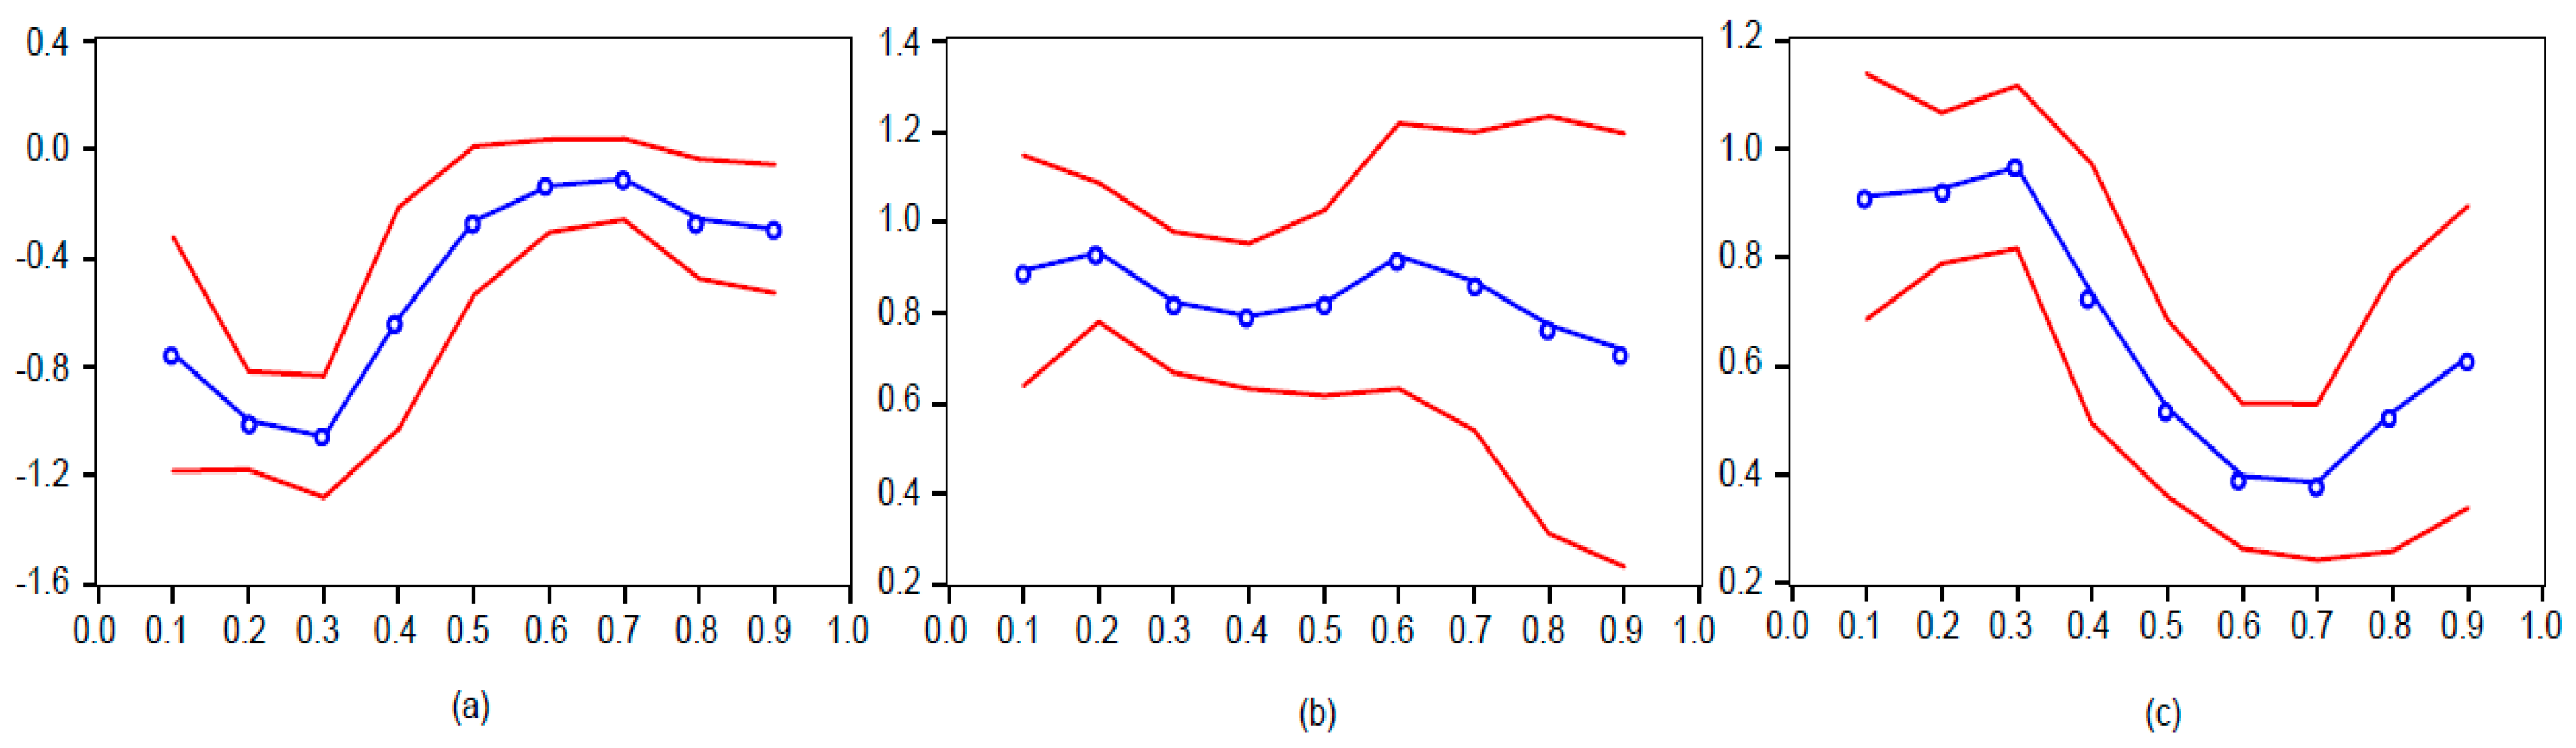
4.3.1. Parameter Estimation

Based on the panel quantile regression theory, we transformed the original series into a natural logarithm series. Taking the Griliches–Jaffe knowledge production function for reference, the model we set is as follows.
l n ( I N P L ) i t = β 1 ( τ ) l n ( I N E T ) i t + β 2 ( τ ) l n ( I N I T ) i t + β 3 ( τ ) l n ( I N E Y ) i t + α i + u i t
where INTL denotes innovation talents, INET is representative of per capita GDP, INIT stands for R&D expenditure in ten thousand GDP, and INEY is patents per ten thousand people. Besides this, τ (τ = 0.1, 0.2, …, 0.9) is a quantile while i (i = 1, 2, …, 31) is the province ordered i, and t (t = 2000, 2001, …, 2014) is a year.
The hypotheses H1, H2 and H3 were further tested by the quantile regression approach with a model (6), to judge whether the innovation environment, input and efficiency make contributions to the agglomeration of innovation talents. The parameter estimation results at different quantiles are showed in Table 3.
It can clearly be seen that all coefficients are significant (p < 0.1) except that for the innovation environment at quantile 0.6 and 0.7. The adjusted goodness of fit ( R 2 ¯ ) of all estimations should be acceptable for panel data, and the F examination shows that the regression equations are highly significant. The different values of coefficients at different quantiles show that innovation capability has different influences on the distribution of innovation talents in regions. Furthermore, the coefficient directions of individual independent variables remain consistent. Those for innovation input as well as innovation efficiency are positive, while those for the innovation environment are negative at all quantiles. The test results for the hypotheses are reported in Table 4, and Figure 4 demonstrates the changes of all coefficients at different quantiles.
As a result, we should reject H1 because the coefficients of the innovation environment are negative, which indicates that the innovation environment is not beneficial to the agglomeration of innovation talents. Nevertheless, we further observe that the coefficients have an increasing trend from quantiles 0.1 to 0.9, meaning that the inhibition degree decreases with the increase of innovation talents. This phenomenon may be closely related with the pre-reform special regional strategies in China. Especially during the period of the planned economy, the allocation of resources was under the control of the government rather than the market. For example, the distribution of universities or research institutions was decided absolutely by the central government. At the same time, China is still a developing country without a perfect social environment to encourage innovation [59,60]. Hence, the relation between innovation talents and the innovation environment presents as negative. However, with the development of a market economy in China, the market gradually matters more to the flow of talent. This can account for the results of different quantiles: the eastern provinces in China, with a higher economy and marketization level and more opportunities and wider development prospects [61,62], have the weakest inhibiting effect in all three areas; there is a weaker effect in the medium areas. We cannot easily comprehensively deny or downplay the importance of the innovation environment.
The estimation results show that H2 should be accepted since the coefficients of innovation input at all quantiles are positive, which remains relatively stable when the quantile is from 0.1 to 0.9. In other words, with improvement in the level of the agglomeration of talent, innovation input makes a stable contribution to the agglomeration. In principle, innovation input, especially R&D expenditure, increases when accompanied by an increase in R&D tasks. This needs more innovation talents to support. Moreover, R&D infrastructure could be improved when innovation input is increased. The efficiency and performance of talents are directly influenced by R&D infrastructure [39], which also would be taken into consideration when selecting a research laboratory As a consequence, innovation input and innovation talents present in positive correlation.
H3 should be accepted according to the estimation results, which means that innovation efficiency could promote the agglomeration of innovation talents. Meanwhile, the coefficients of innovation efficiency show a reducing trend when the quantile changes from 0.1 to 0.9, which indicates that the promotion effect is much lower in provinces with a high level of talent. Generally speaking, patents and new technologies should be involved in intensive knowledge, and the spillover effect of knowledge makes positive contributions to the agglomeration of talent [63,64]. As is known to all, the quantity of innovation talents in eastern areas is much larger than that in Western China. However, the excessive agglomeration of talents has a negative effect on innovation efficiency, because the scale does not match the efficiency well, which was verified by Rui in 2015 [65]. In Eastern China, innovation resources are probably excessively accumulated, causing resource waste or redundancy. These could weaken the promotion effect. Therefore, promotion effects at high quantiles are weaker.
Besides this, it is not difficult to see that the effects of the innovation environment and efficiency on innovation talent distribution show stark divergences according to Table 3. The scope of change of their coefficients is very large1, showing big differences at different quantiles.

4.3.2. Model Test

We adopt the Wald test to examine whether coefficients at all quantiles are equal, and the null hypothesis (H0) is the following. H0: H 0 e q u a l : β ( τ 1 ) β ( τ 2 ) = = β ( τ m ) β ( τ m + 1 ) = 0 and eight pairs of quantiles were selected. ( τ h , τ k ) = ( 0.1 , 0.2 ) , ( 0.2 , 0.3 ) , , ( 0.7 , 0.8 ) , ( 0.8 , 0.9 ) . The test results detailed in Table 5 show that P r o b ( χ 24 2 > 186.7004 ) = 0.000 which means H0 is rejected at the 10% significant level. As a result, we can hold the view that the coefficients are unequal.
We still took advantage of the Wald test to check whether the coefficients of the quantile regression are equal to that of the median regression, and the null hypothesis (H0) is as follows. H 0 s y m m e t r y : β ( τ 1 ) + β ( 1 τ 1 ) 2 β ( 0.5 ) = = β ( τ m ) + β ( 1 τ m ) 2 β ( 0.5 ) = 0 . We selected four pairs of quantiles, ( τ m , 1 τ m ) = ( 0.1 , 0.9 ) , ( 0.2 , 0.8 ) , ( 0.3 , 0.7 ) , ( 0.4 , 0.6 ) , and the results detailed in Table 5 show that P r o b ( χ 16 2 > 40.7394 ) = 0.007 , which means H0 is rejected at the 10% significant level. Thus, coefficients at different quantiles are asymmetrical, which could exert asymmetrical influences on the density curve of innovation talents.

4.4. Conditional Density Forecast

To further examine the influences that innovation capability exerts on the distribution of innovation talents in regions with different levels of talent, three situations are set to analyze the conditional density of talent distribution from the perspectives of the innovation environment, input, and efficiency, respectively.
Situation 1: We define that the quantiles 0.1, 0.5 and 0.9 of the innovation environment correspond to the levels of poor, medium and good, respectively, and the rest variables are set in median.
Situation 2: We define that the quantiles 0.1, 0.5 and 0.9 of the innovation input correspond to the levels of low, medium, and high, separately, and the rest variables are set in median.
Situation 3: We define that the quantiles 0.1, 0.5 and 0.9 of innovation correspond to the levels of low, medium and high, respectively, and the rest variables are set in median.
Conditional density forecast figures for the distribution of innovation talent, based on the innovation environment, input, and efficiency are drawn by virtue of R3.3.0, detailed in Figure 5, Figure 6 and Figure 7, separately. The “low” curve demonstrates the low level, similarly, the “med” curve represents the medium level, and the “high” curve is for the high level.
Figure 5 shows that with the improvement of the innovation environment, the conditional density curves for the distribution of innovation talents have a tendency to move to the left and the tops of the curves plummet down, indicating that the mean of innovation talents decreases. Meanwhile, the shapes of the three curves in Figure 5 are significantly different. We conclude that innovation talents would retain a negative relation to the innovation environment in the future, and that distribution uncertainty has increased when the innovation environment is improved.
In Figure 6, the curves significantly move to the right as innovation input increases, and the tops of the curves rise. There is no obvious change in the morphologies of the curves, which turns out to be because innovation input can accelerate the agglomeration of innovation talents and there is no significant difference in this effect in different regions.
Figure 7 demonstrates that the conditional density curves shift right with the improvement of innovation efficiency, and the tops of the curves rise notably with noticeable changes in their morphologies. The results show that innovation efficiency has a positive impact on the distribution of innovation talent, the uncertainty of which decreases with the improvement of innovation efficiency.

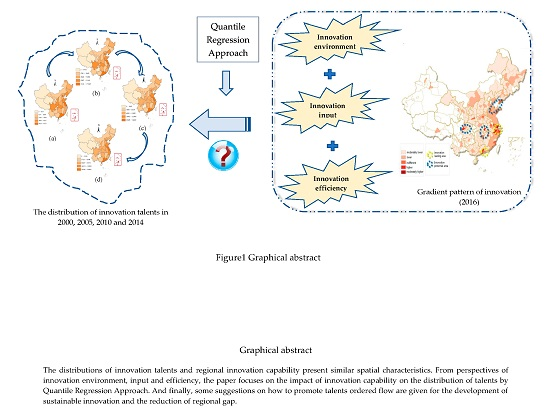
5. Concluding Remarks

Based on the interesting fact that innovation talents appear to prefer places where the innovation capability is quite strong, we examined the impact of innovation capability on innovation talents based on a quantile regression approach. We additionally forecast the conditional density of innovation talents based on the innovation environment, input and efficiency, separately. The results are as follows.
First, at the country level, the innovation environment and innovation talents are in negative relation due to pre-reform special regional strategies and the present immature innovation environment in China. Additionally, innovation input and innovation efficiency facilitate the agglomeration of innovation talents. The former is related to the tight positive relationship between them and the latter is due to the spillover effect of knowledge.
Second, at the regional level, even though the relationship between innovation talents and innovation capability is consistent with that at the country level, there are different stories to tell for different areas: (a) for areas with low levels of talent, the innovation environment is the most crucial factor; (b) for areas with a medium level of talent, the effects of innovation input and efficiency are moderate; and (c) for areas with a high level of talent, the positive effects of innovation input and efficiency are quite significant. Based on these results, some implications in practice can be recommended. For areas with a low level of innovation talent, the poor innovation environment has a great inhibiting effect on the agglomeration of innovation talent, and it is imperative to improve the innovation environment. For instance, the per capita GDP of Gansu province in 2015 was merely a quarter of that of Shanghai, and in order to attract innovation talents, Gansu should pay more attention to their infrastructure development and improve the treatment of innovation talents. Other similar provinces should also take actions to construct a favorable innovation environment. For the local government, it is urgent to develop the economy, making efforts towards building a better development platform and to ensure the effective implementation of policies, and attracting innovation talents by an excellent development platform [66]. For the country, in order to advocate for innovation talents transferring from east to west, the central government should make preferential policies about innovation and keep policies continuous.
For areas with median or high levels of innovation talent, where the economy has reached a certain level, the innovation environment is no longer the most crucial factor. Instead, both innovation input and innovation efficiency play quite important roles in the agglomeration of talent. Enterprises are regarded as a carrier of the increase in innovation input and the improvement of innovation efficiency, which determines the effective usage of innovation input and the absorption of new technologies [67,68]. Taking this into consideration, enterprises should be dominant in the process of talent and innovation development. Besides, under the guidance of the government, a market-oriented development strategy for innovation talents should be made, which takes the enterprises as the main part. Enhancing R&D investment and expanding the sources of R&D funds are acceptable for strengthening the attraction of innovation talents.
The impact of innovation capability on the distribution of innovation talents was examined in theory, and some suggestions for how to attract talents to different areas were given in practice. These suggestions could be beneficial to decision-making and contribute to alleviating regional disparity, as well as the realization of regional sustainable development.
There are a few directions for future research on the issue. First, we took the innovation environment, innovation input and innovation efficiency as denoting innovation capability, and we only chose the one most significant index for each of them and ignored the others, which could be improved in our future work. Second, we forecast the conditional density of the distribution of innovation talents based on three variables separately, which are perhaps interconnected, and the causal relationship are more complex than was pointed out in the analysis.

Acknowledgments

This work was supported by the National Natural Science Foundation of China under Grant number 71303073, Humanity and Social Science Foundation of Ministry of Education of China under Grant number 13YJC630030 and Key Projects of Philosophy and Social Sciences in Anhui under Grant number AHSKZ2015D17.

Author Contributions

Fenfen Wei and Nanping Feng conceived and designed the research; Fenfen Wei under took the primary research and analysis of data and was the main author of Section 2, Section 3 and Section 4; Nanping Feng was the main author of Section 1 and Section 5; During the progress of design and implementation, Kevin H. Zhang provided some guiding suggestions and revised this manuscript finally.

Conflicts of Interest

The authors declare no conflict of interest.

References

  1. Wei, S.H.; Gui-Sheng, W.U.; Xin-Lei, L.V. The determinants of regional innovation capability—Comment on the regional dap of innovation capability in China. China Soft Sci. 2010, 46, 76–85. [Google Scholar]
  2. Peilei, F.; Guanghua, W. China’s regional inequality in innovation capability, 1995–2006. China World Econ. 2012, 23, 16–36. [Google Scholar]
  3. Cao, Y. Measurable analysis on the difference changes of regional innovation capability based on the dynamic performance in China. China Popul. Res. Environ. 2012, 22, 164–169. [Google Scholar]
  4. China Technology Development Strategies Research Group. China Regional Innovation Evaluation Report; Scientific and Technical Documentation Press: Beijing, China, 2015. [Google Scholar]
  5. Xu, Q. Total Innovation Management: Theory and Practice, 1st ed.; Science Press: Beijing, China, 2007. [Google Scholar]
  6. Doloreux, D.; Dionne, S. Is regional innovation system development possible in peripheral regions? Some evidence from the case of la Pocatière, Canada. Entrep. Reg. Dev. 2008, 20, 259–283. [Google Scholar] [CrossRef]
  7. Balykhin, G.A.; Balykhin, M.G. Innovative person as a way and method of achieving global competitive educational advantage of Russia. Int. J. Exp. 2014, 11, 173–176. (In Russian) [Google Scholar]
  8. Zollo, G.; Autorino, G.; De Crescenzo, E.; Iandoli, L.; Imperiale, E.; Liguori, V.; Ponsiglione, C. A gap analysis of regional innovation systems (RIS) with medium-low innovative capabilities: The case of campania region (Italy). In 8th ESU Conference on Entrepreneurship (2011); Universidad de Sevilla: Sevilla, Spain, 2011; pp. 1–21. [Google Scholar]
  9. Woo, Y.; Kim, E.; Lim, J. The impact of education and R&D investment on regional economic growth. Sustainability 2017, 9, 1–18. [Google Scholar]
  10. Guilford, J.P. Traits of creativity. Creat. Cultiv. 1959, 10, 141–161. [Google Scholar]
  11. Glover, C.; Smethurst, S. Creative license. People Manag. 2003, 9, 30–37. [Google Scholar]
  12. Van Dam, N. Innovative talent management strategies. Chief Learn. Off. 2005, 4, 13–19. [Google Scholar]
  13. Franses, P.H. Merging models and experts. Int. J. Forecast. 2008, 24, 31–33. [Google Scholar] [CrossRef]
  14. Pruis, E. The five key principles for talent development. Ind. Commer. Train. 2011, 43, 206–217. [Google Scholar] [CrossRef]
  15. Jiang, D.K.; Liu, X.M.; Zhu, H.C. Factors influencing talent flow of open innovation. Technol. Innov. Manag. 2016, 37, 406–416. (In Chinese) [Google Scholar]
  16. Carr, S.C.; Inkson, K.; Thorn, K. From global careers to talent flow: Reinterpreting ‘brain drain’. J. World Bus. 2005, 40, 386–398. [Google Scholar] [CrossRef]
  17. Zhao, S.L.; Zhu, D.Y.; Peng, X.B.; Song, W. An empirical analysis of the regional competitiveness based on S&T talents flow. Hum. Syst. Manag. 2016, 35, 1–10. [Google Scholar]
  18. Baird, K.; Wang, H. Employee empowerment: Extent of adoption and influential factors. Pers. Rev. 2010, 39, 574–599. [Google Scholar] [CrossRef]
  19. Kong, D.Y.; Zhang, X.Q. Research on the organizational commitment and motivation of talented personality. Commer. Res. 2013, 102–107. [Google Scholar] [CrossRef]
  20. Lin, W.; Zhang, X. Factors affecting the flow of knowledge-based talents: An empirical analysis on Chinese enterprises. Inf. Technol. J. 2013, 12, 4262–4266. [Google Scholar] [CrossRef]
  21. Niu, C. The talent accumulation effect and environment in Silicon valley and Zhongguancun: A comparative study. Chin. J. Manag. 2008, 5, 396–400. [Google Scholar]
  22. Cai, Y.Z. Measurement of national innovative capacities in the perspective of national innovation system: Theories, methods, data and Chinese practice. Seeking Truth 2012, 39, 42–50. [Google Scholar]
  23. European Commission. European Innovation Scoreboard (EIS) 2007: Comparative Analysis of Innovation Performance; EU: Brussels, Belgium, 2008. [Google Scholar]
  24. Klaus, S.; Xavier, S. The Global Competitiveness Report 2011–2012; World Economic Forum: Geneva, Switzerland, 2010. [Google Scholar]
  25. OECD. Oecd Science, Technology and Industry Scoreboard 2015; OECD Publishing: Paris, Frence, 2015. [Google Scholar]
  26. Group, R. Research of China innovation index. Stat. Res. 2014, 31, 24–28. [Google Scholar]
  27. Furman, J.L.; Hayes, R. Catching up or standing still?: National innovative productivity among ‘follower’ countries, 1978–1999. Res. Policy 2004, 33, 1329–1354. [Google Scholar] [CrossRef]
  28. Wen, T.; Cai, J.; Xie, L. Research on the Relationship among Urban Amenities, Talents and Urban Income in China: Structural Equation Model in Practice; Springer: Berlin, Germany, 2015; pp. 5048–5060. [Google Scholar]
  29. Gu, F.; Bi, W. Influence factors analysis of the sustainable development of scientific and technological personnel in Tibet. In The International Conference on Mechatronics, Electronic, Industrial and Control Engineering; Atlantis Press: Amsterdam, The Netherland, 2014; pp. 1307–1310. [Google Scholar]
  30. Batabyal, A.A.; Nijkamp, P. A multi-region model of economic growth with human capital and negative externalities in innovation. J. Evol. Econ. 2013, 23, 909–924. [Google Scholar] [CrossRef]
  31. Horowitz, I. Some aspects of the effects of the regional distribution of scientific talent on regional economic activity. Manag. Sci. 1966, 13, 217–232. [Google Scholar] [CrossRef]
  32. Fornahl, D.; Zellner, C.; Audretsch, D.B. The Role of Labour Mobility and Informal Networks for Knowledge Transfer; Springer: New York, NY, USA, 2005. [Google Scholar]
  33. Fleisher, B.M.; Li, H.; Zhao, M.Q. Human capital, economic growth, and regional inequality in China. J. Dev. Econ. 2010, 92, 215–231. [Google Scholar] [CrossRef]
  34. Simon, D.F.; Cao, C. Creating an innovative talent pool. China Bus. Rev. 2009, 36, 34–42. [Google Scholar]
  35. Niu, C.H.; Wang, Y.N.; Yang, C.Y. Research of environment and effect of technological talent aggregation—Study on the impact’s of cultural environment upon the effect of technological talent aggregation. J. Taiyuan Univ. Technol. 2008, 26, 1–4. [Google Scholar]
  36. Zhou, H.; Dekker, R.; Kleinknecht, A. The impact of labour relations on innovative output: An exploration of firm-level data in The Netherlands. In The 5th International Symposium on Management of Technology, 2007; SSRN Electronic Journal: Rochester, NY, USA, 2007; pp. 433–436. [Google Scholar]
  37. Kirankabes, M.C.; Er Akar, M.E. Importance of relationship between R&D personnel and patent applications on economics growth: A panel data analysis. Int. Res. J. Financ. Econ. 2012, 92, 72–81. [Google Scholar]
  38. J.Hong, B.; Yue, W. Does the interregional flow of r&d elements promote the improvement of innovation efficiency. Forum Technol. Sci. China Forum Technol. Sci. China 2015, 27–32. [Google Scholar] [CrossRef]
  39. Ernst, H.; Leptien, C.; Vitt, J. Inventors are not alike: The distribution of patenting output among industrial R&D personnel. IEEE Trans. Eng. Manag. 2000, 47, 184–199. [Google Scholar]
  40. Louw, W.J.; Benade, S. The integration of talent management practices and computer aided engineering in new product development. Incose Int. Symp. 2015, 24, 177–190. [Google Scholar] [CrossRef]
  41. Chen, C.P.; Hu, J.L.; Yang, C.H. An international comparison of R&D efficiency of multiple innovative outputs: The role of the national innovation system. Innovation 2011, 13, 341–360. [Google Scholar]
  42. Asmild, M. Regional r&d efficiency in korea from static and dynamic perspectives. Reg. Stud. 2016, 50, 1–15. [Google Scholar]
  43. Hung, W.C. The determinants of national innovative capability-a cross-country innovation efficiency analysis. In 2009 Atlanta Conference on Science and Innovation Policy; IEEE: Atlanta, GA, USA, 2009; pp. 1–4. [Google Scholar]
  44. Li, X.; Wang, J.; Liu, X. Can locally-recruited R&D personnel significantly contribute to multinational subsidiary innovation in an emerging economy? Int. Bus. Rev. 2013, 22, 639–651. [Google Scholar]
  45. Lyu, Y.; Wu, Y.; Lin, Y. Granger causality test of science & technology innovation expense and new urbanization: a case ttudy of Hangzhou city. In Proceedings of the 20th International Symposium on Advancement of Construction Management and Real Estate; Springer: Singapore, 2017; pp. 1–10. [Google Scholar]
  46. Huang, S.; Bai, Y.; Tan, Q. How does the concentration of determinants affect industrial innovation performance?—An empirical analysis of 23 Chinese industrial sectors. PLoS ONE 2017, 12, 1–13. [Google Scholar] [CrossRef] [PubMed]
  47. Zhao, L.; Lei, Z.; Zhong, X.U. The measurement and evaluation of regional economic development disparities in Anshun experimental region from 2001 to 2008. World Reg. Stud. 2010, 19, 65–70. (In Chinese) [Google Scholar]
  48. Chen, Y.M.; Du, D.B.; Zhang, J.W. Study on causal association mechanism between regional innovation environment and Shanghai R&D industry. Soft Sci. 2011, 25, 124–130. [Google Scholar]
  49. Gunay, E.N.; Kazazoglu, G.N. National innovation efficiency during the global financial crisis period and afterwards. In National Innovation Efficiency During the Global Crisis: A Cross-Country Analysis; Palgrave Macmillan: New York, NY, USA, 2016; p. 198. [Google Scholar]
  50. Pandit, S.; Wasley, C.E.; Zach, T. The effect of R&D inputs and outputs on the relation between the uncertainty of future operating performance and R&D expenditures. Soc. Sci. Electron. Publ. 2009, 26, 121–144. [Google Scholar]
  51. Sougiannis, T. Discussion of “the effect of research and development (R&D) inputs and outputs on the relation between the uncertainty of future operating performance and R&D expenditures”. J. Account. Audit. Financ. 2011, 26, 145–149. [Google Scholar]
  52. Gao, W.; Chou, J. Innovation efficiency, global diversification, and firm value. J. Corp. Financ. 2015, 30, 278–298. [Google Scholar] [CrossRef]
  53. Koenker, R.; Bassett, G. Regression quantiles. Econometrica 1978, 46, 33–50. [Google Scholar] [CrossRef]
  54. Koenker, R. Quantile regression for longitudinal data. J. Multivar. Anal. 2004, 91, 74–89. [Google Scholar] [CrossRef]
  55. Chernozhukov, V.; Hansen, C. An iv model of quantile treatment effects. Econometrica 2005, 73, 245–261. [Google Scholar] [CrossRef]
  56. Chernozhukov, V.; Hansen, C. Instrumental quantile regression inference for structural and treatment effect models. J. Econ. 2006, 132, 491–525. [Google Scholar] [CrossRef]
  57. Chernozhukov, V.; Hansen, C. Instrumental variable quantile regression: A robust inference approach. J. Econ. 2008, 142, 379–398. [Google Scholar] [CrossRef]
  58. Harding, M.; Lamarche, C. A quantile regression approach for estimating panel data models using instrumental variables. Econ. Lett. 2009, 104, 133–135. [Google Scholar]
  59. Liu, K.; Yang, X.; Ling, Z. Evaluation on and optimization of science&technology innovation environment in liquor-making industry in Sichuan. Liquor-Mak. Sci. Technol. 2015, 127–131. [Google Scholar] [CrossRef]
  60. Xiao, Y.; Wang, W. Developing information economy to seize the commanding heights of global strategic competition. Bull. Chin. Acad. Sci. 2015, 16, 47–50. [Google Scholar]
  61. Zhang, T.Q.; Jiang, D.K. Research on regional high-level innovative talents competitiveness appraisal system. East China Econ. Manag. 2012, 26, 150–154. [Google Scholar]
  62. Zhu, L. Addressing extreme poverty and marginality: Experiences in rural China. Marginality 2014, 239–255. [Google Scholar] [CrossRef]
  63. Scott, A.J. New Industrial Spaces: Flexible Production Organization and Regional Development in North America and Western Europe; Pion: London, UK, 1988. [Google Scholar]
  64. Palivos, T.; Wang, P. Spatial agglomeration and endogenous growth. Reg. Sci. Urban Econ. 1996, 26, 645–669. [Google Scholar] [CrossRef]
  65. Rui, X.; Li, Y.; Niu, C. Influence of regional evolutionary trend of chinese technological talent accumulation to regional innovation efficiency. Forum Sci. Technol. China 2015, 126–131. (In Chinese) [Google Scholar] [CrossRef]
  66. Wu, R.Y. Hard to love you, dear west: Lost of scientific backtone, difficult in talent introduction. People’s Daily. 25 April 2014. Available online: http://news.163.com/14/0425/04/9QLBSVSQ00014Q4P.html (accessed on 21 April 2017). (In Chinese).
  67. Liu, X.; Buck, T. Innovation performance and channels for international technology spillovers: Evidence from chinese high-tech industries. Res. Policy 2007, 36, 355–366. [Google Scholar] [CrossRef]
  68. Chen, Q.; Yin, Z.; Ye, J. State-owned enterprises and regional innovation efficiency: From the externality perspective. Ind. Econ. Res. 2015, 10–20. (In Chinese) [Google Scholar] [CrossRef]
Figure 1. The conceptual model.
Sustainability 09 01218 g001
Figure 2. Moran’s I and p-value of innovation talents for China’s 31 provinces during 2000–2014.
Sustainability 09 01218 g002
Figure 3. Histograms and kernel density of innovation talents and capability during 2000–2014: (a) for innovation talents (the unit of x-axis: person); (b) for the innovation environment (the unit of x-axis: Chinese Yuan); (c) for innovation input (the unit of x-axis: Chinese Yuan); and (d) for innovation efficiency (the unit of x-axis: piece).
Sustainability 09 01218 g003
Figure 4. The coefficients at different quantiles, x-axis is for the quantile and y-axis is for the value of coefficient: (a) demonstrates the coefficients of the innovation environment; (b) is the description of the innovation input’s coefficients; and (c) displays the coefficients of innovation efficiency. The blue lines mean the parameter estimation results while the red lines mean the results of the parameter estimation with 95% significant level. The horizontal axis shows the different quantiles and the vertical axis shows the value of the coefficients.
Sustainability 09 01218 g004
Figure 5. Conditional density forecast based on the innovation environment.
Sustainability 09 01218 g005
Figure 6. Conditional density forecast based on innovation input.
Sustainability 09 01218 g006
Figure 7. Conditional density forecast based on innovation efficiency.
Sustainability 09 01218 g007
Table 1. The correlation results.
VariablesINETINITINEY
INTL0.62600.55600.7850
(0.0000)(0.0000)(0.0000)
Note: the value in () is p-value.
Table 2. The results of the unit root test.
MethodLevin, Lin & ChuIm, Pesaran and Shin W-StatADF-Fisher Chi-SquarePP-Fisher Chi-Square
INTL10.535514.03294.16484.7945
INET18.989521.73312.16551.3812
INIT2.04874,722043.684655.3185
INEY15.531016.876316.14844.2844
∆INTL−11.9212 *−9.1692 *196.4370 *237.9140 *
∆INET−7.1945 *−2.7080 *88.7372 *85.5951 *
∆INIT−17.3404 *−14.1380 *288.9580 *392.0390 *
∆INEY−8.8415 *−6.7246 *161.6330 *208.7330 *
Note: * means the value is significant at 5%.
Table 3. The estimation results of the quantile regression.
taucLn(INET)Ln(INIT)Ln(INEY) R 2 ¯ Prob(F-Statistic)
0.18.3325 *−0.7533 *0.8927 *0.9111 *0.53680.0000
0.210.8400 *−0.9973 *0.9331 *0.9263 *0.49470.0000
0.311.9607 *−1.0562 *0.8231 *0.9649 *0.45230.0000
0.49.3025 *−0.6217 *0.7911 *0.7322 *0.43680.0000
0.56.8714 *−0.2621 **0.8208 *0.5225 *0.44220.0000
0.65.9127 *−0.13470.9240 *0.3966 *0.44910.0000
0.76.0943 *−0.10980.8691 *0.3856 *0.45540.0000
0.87.5333 *−0.2554 *0.7718 *0.5144 *0.46580.0000
0.97.8521 *−0.2925 *0.7171 *0.6155 *0.49820.0000
Note: * and ** mean that the coefficient is significant at 5% and 10%, respectively.
Table 4. The test results for the hypotheses.
HypothesesH1H2H3
ResultRejectAcceptAccept
Table 5. Model test of the coefficient restraint.
Types of TestDegree of Freedom χ 2 ProbH0Conclusion
Equality24186.70040.0000RejectInequality
Symmetry1640.73940.0006RejectAsymmetry

